配置元数据(维护应用程序){ #maintenance_app }
注意
本页面介绍的是旧版的 维护应用。如果您使用的是 元数据管理应用,请参阅 在元数据管理应用中配置元数据,该文档可通过 DHIS2 应用中心,该应用自第 41 版起兼容。
关于维护应用
在**维护**应用项目中,您可以配置所需的所有元数据对象。 收集和分析数据所需的所有元数据对象:
-
Table: Dimensions and dimension items
-
startDate 和 endDate 参数允许获取链接的数据 到这些日期之间的任何时间段。这避免了定义所有 期间明确在 要求:
-
数据集和数据输入表格
-
指标
-
E7229
-
CATEGORY_OPTION
-
createdAtClient
-
常数
-
选项集
-
传说
-
预测变量
-
推送报告
-
外部地图图层
-
SQL 视图
-
区域设置
-
分析表挂钩
注意
您有权访问的功能取决于用户角色的访问权限 权限。
导航元数据对象
元数据对象以列表的形式显示,其中包含与每个对象相关的预定义列。 您可以自定义当前对象列表中显示的列。这些自定义是针对每个用户的,因此不会影响其他用户。请注意,这些更改不会编辑任何元数据,只会编辑列表的显示方式。
管理可见列

- 点击您要配置的对象列表右上角的“
 ”图标。
”图标。 - A dropdown-menu will appear, select Manage columns.
- 将出现一个对话框,并选择默认列。
- Click any column-name in the list of Available columns to add them to the list of selected columns.
- 您可以通过拖放“
 ”图标来重新排列所选列的顺序。
 - 您也可以通过单击名称旁边的X图标,从视图中删除任何列。
- 对所做的更改满意后,请点击**“保存”**。
You may easily reset to the default values by clicking the Reset to default button.
下载元数据
您可以下载当前正在查看的对象的元数据。元数据下载将遵守您对该列表有效的所有过滤器。
- 点击您要配置的对象列表右上角的 图标。
- 将会出现一个下拉菜单,选择**下载**。
- 将出现一个对话框,您可以在其中选择所需的格式和压缩率。
- 可以选择**具有共享**以包括元数据的共享数据。
管理类别
关于类别
类别通常是一个概念,例如“性别”,“年龄”或“ “疾病状态”。数据元素,例如“已确认病例数 疟疾”通常分为较小的组成部分,以便确定 例如,已确认的特定年龄组的疟疾病例数。
使用类别将数据元素分解为单个组件。 您还可以使用类别为所有数据分配元数据属性 记录在特定的数据集中,例如“实施伙伴”或 “资金代理机构。”
创建三个类别:“ 1岁以下”,“ 1-5”和“ 5岁以上”。将它们分配为 数据元素的类别。这将为创建三个单独的字段 此数据以数据输入形式:
-
确诊的疟疾病例数(1岁以下)
-
确诊的疟疾病例数(1-5)
-
确诊的疟疾病例数(5例以上)
没有类别,您将不得不创建每个数据 上面单独列出的元素。
在**维护**应用项目中,您可以管理以下对象和类别 对象:
表格:维护应用项目中的类别对象
| CSV元数据导入 { #webapi_csv_metadata_import } | 可用功能 |
|---|---|
Send PUT request to api/dataElements/{dataElementUID} with full object payload as below: | 创建、编辑、克隆、分享、删除、查看详情和翻译 |
The status code will be 204 No Content if the data value was successfully saved or updated, or 409 Conflict if there was a validation error (e.g. more than one SHORT_NAME for the same locale). | 创建、编辑、克隆、分享、删除、查看详细信息和翻译 |
| 不 | 创建、编辑、克隆、分享、删除、查看详情和翻译 |
| 类别选项组合 | 编辑并查看详情 |
| 类别选项组 | 创建、编辑、克隆、分享、删除、查看详情和翻译 |
| 类别选项组集 | 创建、编辑、克隆、分享、删除、查看详情和翻译 |
工作流程
-
创建所有类别选项。
-
创建由您拥有的多个类别选项组成的类别 创建。
-
创建由一个或多个组成的类别组合 类别。
-
创建数据元素并将其分配给类别组合。
创建或编辑类别选项
如果可能,请回收类别选项。例如,可能有 可能共享特定类别选项的两个类别(对于 例如 <1岁)。创建类别时,此类别 选项可以重复使用。如果特定类别选项很重要 (或类别选项组合)需要一起分析。
-
打开 Maintenance 应用项目,点击 Category (> Category 选项。
-
点击添加按钮。
-
填写表格:
-
名称
-
简称(可选)
-
代码(可选)
-
表单名称(可选) 分类选项可以指定表单名称。这些名称将显示在 数据录入应用项目的列标题,而不是显示名称。 相应的类别选项。
-
描述
-
开始日期(可选)
-
结束日期(可选)
-
-
选择组织单位并分配它们。
Tip
You can automatically select all organisation units that belong to an organisation unit level or organisation unit group, for example "Chiefdom" or "Urban". To do this:
Select an Organisation unit level or Organisation unit group and click Select.
-
点击**保存**。
创建或编辑类别
为特定类别创建所有类别选项后, 您可以创建该类别。
-
Open the Maintenance app and click Category > Category.
-
点击添加按钮。
-
填写表格:
-
名称
-
简称
-
码
-
描述
-
数据维度类型
一个类别可以是“分解”类型,也可以是“属性”类型。 要分解数据元素,请选择 分类。数据维度类型“属性”允许 用于将类别组合分配给的类别 通过数据集记录的数据。
-
数据尺寸
如果您选择**数据维度**,则该类别将可用 除了其他方面, “期间”和“组织单位”的标准尺寸。
-
-
选择类别选项并分配它们。
-
点击**保存**。
创建或编辑类别组合
类别组合可让您将多个类别组合成一个 相关集合。
您可以分解数据元素“新感染艾滋病毒的数量” 分为以下几类:
-
艾滋病毒服务:“其他”,“ PMTCT”,“结核病”
-
性别:“男”,“女”
在此示例中,共有两个细分级别,分别由 两个独立的数据元素类别组成。每个数据元素类别包含 若干数据元素类别选项。
在DHIS2中,根据 常见的一组类别。通过将这些不同的类别合并为一个 类别组合并将这些组合分配给数据元素, 您可以将适当的分类级别快速应用于大型 数据元素数。
-
打开 Maintenance 应用项目,点击 Category (> Category 组合。
-
点击添加按钮。
-
填写表格:
-
名称
-
码
-
数据维度类型
-
报告中的跳过类别总计
-
-
选择类别并分配它们。
-
点击**保存**。
创建或编辑类别选项组
您可以使用类别选项对类别选项进行分组和分类 组。类别选项组集的主要目的是添加更多 您捕获的数据的维数,以便在例如 **数据透视表**或**数据可视化器**应用。
假设有一个系统,其中数据按“项目”收集,且项目被建模 为类别选项。该系统必须能够根据 哪个捐赠者支持该项目来分析数据。在这种情况下,请创建一个名为 “捐赠者”的类别选项组集。 每个捐助方均可创建为一个类别 选项组,并将每个类别选项/项目归入 相应的组中。在数据分析应用中,“捐助方”组 将作为数据维度显示,而每个捐助方则作为 维度项显示,可直接纳入报表中。
要创建类别选项组:
-
打开 Maintenance 应用项目,点击 Category (> Category 选项组。
-
点击添加按钮。
-
填写表格:
-
名称
-
短名称:为数据元素定义一个短名称。
-
码
-
描述
-
数据维度类型
-
-
选择**类别选项**并分配它们。
-
点击**保存**。
创建或编辑类别选项组集
您可以将类别选项组分组在类别选项组集中。的 类别选项组集的主要目的是添加更多 您捕获的数据的维数,以便在例如 **数据透视表**或**数据可视化器**应用。
-
打开 Maintenance 应用项目,点击 Category (> Category 选项组集。
-
点击添加按钮。
-
填写表格:
-
名称
-
简称
-
描述
-
数据尺寸
-
数据维度类型
-
-
Select Category option groups and assign them.
-
点击**保存**。
对数据集使用类别组合
当类别和类别组合的数据维度类型为 “属性”时,它们可以将一组通用的属性应用到数据集中 所包含的相关数据值集合上。 当类别组合被 用作属性时,它们将作为另一个维度(类似于 “时间段”和“组织单位”),您可以在分析中使用该维度。
假设某非政府组织(NGO)在某医疗机构提供抗逆转录病毒治疗(ART)服务。该组织 需要每月填写“ART月度汇总表”,其中 将包含多项数据要素。 该非政府组织和项目 可能会随着时间推移而发生变化。为了将数据归属于某个特定时间点的特定非政府组织 和项目,您需要在录入数据时, 将这些信息与每个数据值一并记录下来。
-
使用数据维度类型“属性”创建两个类别: “实施伙伴”和“项目”。
-
创建具有数据维类型的类别组合 “属性”:“实施合作伙伴和项目”。
-
将您创建的类别分配给类别组合。
-
创建一个称为“ ART每月摘要”的数据集,然后选择 “实施合作伙伴和项目”类别组合。
在**数据录入**应用中录入数据时,您可以选择一个 “实施伙伴”和一个“项目”。每条记录的数据值都会 被分配一个由这些类别组成的特定组合作为属性。 这些属性(当指定为维度时)可在 分析应用程序中与其他维度(例如 期间和组织单位)一样使用。

将代码分配给类别选项组合
您可以将代码分配给类别选项组合。这使得数据 DHIS2与外部系统之间的交换更加容易。系统创建 类别选项组合自动。
-
打开 Maintenance 应用项目,点击 Category (> Category 选项组合。
-
在列表中,找到要修改的对象。
-
点击选项菜单,然后选择**编辑**。
-
输入验证码。
-
点击**保存**。
克隆元数据对象{ #clone_metadata_categories }
克隆数据元素或其他对象可以在创建时节省时间 许多相似的对象。
-
打开**维护**应用项目,找到元数据对象类型 你想克隆。
-
在对象列表中,单击选项菜单并选择**克隆**。
-
修改所需的选项。
-
点击**保存**。
更改元数据对象的共享设置
您可以为元数据对象分配不同的共享设置,例如 示例组织单位和跟踪的实体属性。这些分享 设置可控制哪些用户和用户组可以查看或编辑 元数据对象。
某些元数据对象还允许您更改该对象 数据条目的共享设置。这些附加设置用于控制哪些人可以 使用该元数据查看或向表单字段中输入数据。
注意
默认设置是所有人(公共访问权限)都可以找到, 查看和编辑元数据对象。
-
打开**维护**应用项目,找到元数据对象类型 您要修改。
-
在对象列表中,单击右键并选择 共享 设置**。
-
(可选)添加用户或用户组:搜索一个或多个用户 分组并选择它。用户或用户组已添加到列表中。
-
更改要修改的访问组的共享设置。
-
可以编辑和查看:访问组可以查看和编辑 目的。
-
只能查看:访问组可以查看对象。
-
禁止访问(仅适用于**公共访问**):公众 将无法访问该对象。
-
-
更改您要访问的访问组的数据共享设置 修改。
-
可以捕获数据:访问组可以查看和捕获数据 为对象。
-
可以查看数据:访问组可以查看以下数据: 目的。
-
无访问权限:访问组将无法访问以下数据: 物体。
-
-
点击**关闭**。
删除元数据对象
注意
您只能在以下情况下删除数据元素和其他数据元素对象: 没有数据与数据元素本身关联。
警告
从系统删除的所有数据集都将不可避免地丢失。所有 数据输入表格,以及可能已经制定的部分表格 也将被删除。确保您已经备份了您的 数据库,然后删除任何数据集,以防您需要还原它 在某个时间点。
-
打开**维护**应用项目,找到元数据对象类型 您要删除。
-
在对象列表中,单击选项菜单并选择**删除**。
-
点击**确认**。
显示元数据对象的详细信息
-
打开**维护**应用项目,找到元数据对象类型 您想查看。
-
在对象列表中,单击选项菜单,然后选择 显示 细节。
翻译元数据对象
DHIS2提供了用于翻译数据库内容的功能, 示例数据元素,数据元素组,指标,指标组 或组织单位。您可以将这些元素转换为任意数量的 语言环境。地区代表特定的地理,政治或 文化区。
提示
要激活翻译,请打开 System Settings 应用项目,单击 > **外观**并选择一种语言。
-
打开**维护**应用项目,找到元数据对象类型 您要翻译。
-
在对象列表中,单击选项菜单并选择**翻译**。
Tip
If you want to translate an organisation unit level, click directly on the Translate icon next to each list item.
-
选择一个语言环境。
-
输入**名称**、简称**和**说明。
-
点击**保存**。
管理数据元素
关于数据元素
数据元素是DHIS2的基础。数据元素定义什么 实际记录在系统中,例如免疫接种次数或 疟疾病例数。
诸如“确诊疟疾病例数”之类的数据元素通常 分解成较小的组成部分,例如确定 特定年龄段已确诊的疟疾病例数。
在**维护**应用项目中,您可以管理以下数据元素 对象:
表:维护应用项目中的数据元素对象
| CSV元数据导入 { #webapi_csv_metadata_import } | 可用功能 |
|---|---|
| 描述 | 创建、编辑、克隆、分享、删除、查看详情和翻译 |
| dx尺寸 { #webapi_analytics_dx_dimension } | 创建、编辑、克隆、分享、删除、查看详情和翻译 |
| Object short name | 创建、编辑、克隆、分享、删除、查看详情和翻译 |
工作流程
-
创建所有类别选项。
-
创建由您拥有的多个类别选项组成的类别 创建。
-
创建由一个或多个组成的类别组合 类别。
-
创建数据元素并将其分配给类别组合。
创建或编辑数据元素
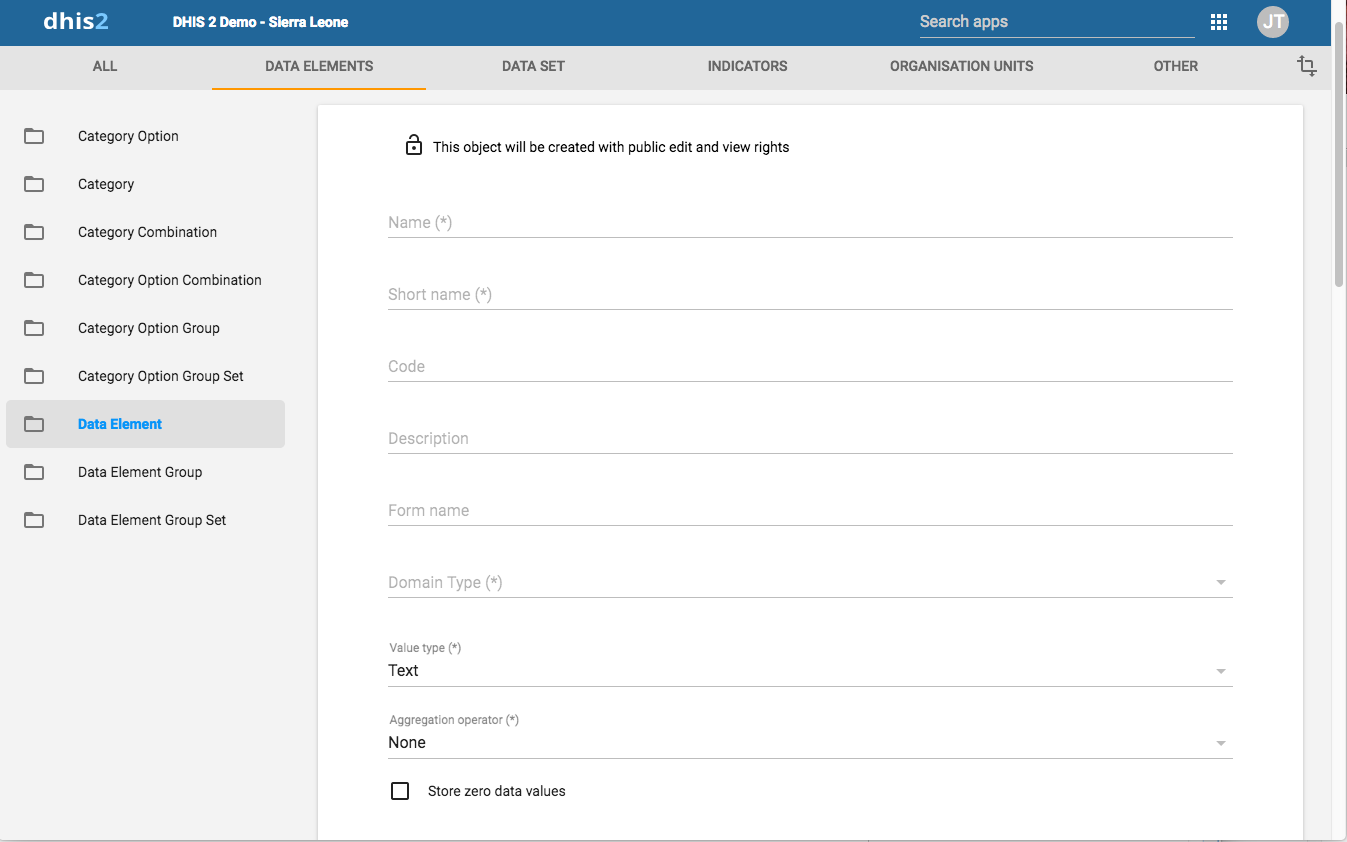
-
打开**维护**应用项目,点击**数据元素** > 数据 元件。
-
点击添加按钮。
-
In the Name field, define the precise name of the data element.
每个数据元素必须具有唯一的名称。
-
在“短名称”字段中,为数据定义一个短名称 元件。
通常,简称是完整数据的缩写 元素名称。此属性通常用于报表中以显示 数据元素的名称,其中空间有限。
-
(可选)在 Code 字段中,分配一个代码。
在许多国家/地区,为数据元素分配了代码。
-
(可选)在**颜色**字段中,指定要使用的颜色 数据捕获应用项目中的此数据元素。
-
(可选)在**图标**字段中,指定一个将要使用的图标 数据捕获应用项目中的此数据元素。
-
在**描述**字段中,输入数据的描述 元件。尽可能精确并包含完整的信息 关于如何测量数据元素以及其目的是什么。
-
(可选)在**字段掩码**字段中,您可以输入一个模板,该模板用于提供 提示数据元素的正确格式。
NOTE
So far this is only implemented in the DHIS2 Android Capture app; not in the Capture web app.
以下是可在遮罩中使用的特殊字符。特殊字符与给定类型的一个字符完全匹配。
| 性格匹配 | |
|---|---|
| \ d | 数字 |
| \ x | 小写字母 |
| \ X | 大写字母 |
| \ w | 任何字母数字字符 |
例如,该模式可用于在数据元素的输入字段中根据需要显示连字符。例如“ d d d- d d d- d d d, 每三位数显示一个连字符。
-
在“表单名称”字段中,输入该数据的别名 元件。此名称可以在部分或自动数据中使用 报名表。表单名称将自动应用。
-
在“域类型”字段中,选择该数据元素是 数据元素的聚合或跟踪器类型。
-
在“值类型”字段中,选择数据所属的数据类型 元素将记录。
表格:值类型
值类型 描述 年龄 以日历控件形式显示的日期,或通过输入年、月和/或天数,系统将根据当前日期计算出日期值。 日期将保存在后端。 坐标 以十进制度数形式指定的经纬度坐标。所有坐标应采用 [-19.23 , 56.42] 格式,使用方括号,并以逗号分隔经度和纬度。 日期 在数据输入中以日历控件形式显示的日期。 日期与时间 由 日期 和 时间 数据元素组合而成。 电子邮箱 电子邮箱。 文件 文件资源,可用于存储外部文件,例如文档和照片。 图片 文件资源,可用于存储照片。
与 FILE 数据元素不同,IMAGE 数据元素可在表单中直接显示上传的图片。整数 任何整数(正数和负数),包括零。 字母 单个字母。 长文本 文本值。在表单中以文本区域的形式呈现,无长度限制。 负整数 小于(但不包括)零的任何整数。 数字 任何带有单一小数点的实数。 不支持千位分隔符和科学记数法。 百分比 0 到 100 之间的整数(包含 0 和 100)。 电话号码 电话号码。 正整数 大于零(但不包含零)的任何整数。 正整数或零 任何正整数,包括零。 组织单位 以层次树控件形式呈现的组织单位。
如果用户已分配“搜索组织单位”,则将显示这些单位,而不是已分配的组织单位。单位间隔 任何大于或等于 0 且小于或等于 1 的实数。 文本 文本值。每个值允许的字符数上限为 50,000 个。 时间 时间以 HH:mm 格式存储。
HH 是 0 到 23 之间的数字
mm 是 00 到 59 之间的数字用户名 DHIS2 用户。以对话框形式呈现,包含用户列表和搜索字段。 用户需具备“查看用户”权限才能使用此数据类型 是/否 布尔值,在数据录入界面中以下拉列表形式显示。 仅是 真值,在数据录入界面中以复选框形式显示。 -
在 聚合类型 字段中,选择默认聚合 将在数据元素上使用的操作。
大多数数据元素应具有** Sum **运算符。这包括 所有应加在一起的数据元素。其他资料 人员等级别的元素应设置为使用 ** Average **运算符,当沿时间维度的值应 不加在一起,而是取平均值。
表:聚合运算符
聚合运算符 描述 平均值 对“时间段”和“组织单位”两个维度中的值计算平均值。 平均值(在组织单位层次结构中求和) 时间维度中数据值的平均值,在组织单位维度中求和。 计数 数据值的计数。 最小值 数据值的最小值。 最大值 数据值的最大值。 无 任何维度均不进行聚合。 求和 时间段和组织单位维度中数据值的总和。 标准差 数据值的标准差(基于总体)。 方差 数据值的方差(基于总体)。 -
如果您出于特定原因要保存零,请选择**存储 零数据值**。默认情况下,DHIS2不存储输入的零 在数据输入模块中。
-
在 URL 字段中,输入指向该内容详细说明的链接: 数据元素。
例如,指向元数据存储库或注册表的链接 包含有关定义的详细技术信息,以及 数据元素的测量。
-
在 类别组合 字段中,定义应选择哪个类别 数据元素应具有的组合。这也称为 “分类”。
-
选择一个**选项集**。
选项集是选项的预定义列表,可用于 数据输入。
-
Select an Option set for comments.
注释的选项集是预定义的选项列表,可以 用于指定数据中数据值的标准化注释 条目。
-
分配一个或多个**传奇**。
图例用于** Maps **应用中,以显示某些 带有某些图标的数据元素。
-
将**聚合级别**设置为允许该数据元素 汇总在一个或多个级别:
-
在左窗格中,选择要分配给 数据元素。
-
单击右箭头以指定聚合级别。
默认情况下,聚合将从分配的最低点开始 组织单位。例如,如果您选择“ Chiefdom”,则表示 “酋长”,“地区”和“国家”聚合使用 作为数据的“首要”(可用的最高聚合级别) 源,PHU数据将不包括在内。 PHU数据仍将是 可用于PHU级别,但不包括在 以上级别。
如果您同时选择“地区”和“首席”,则表示 “地区”和“国家”级别汇总使用地区数据作为 他们的来源是“酋长”将使用“酋长国”,“ PHU”将使用PHU。
-
-
如果适用,请输入自定义属性值,例如 分类**或**收集方法。
Note
You create custom attributes in the Maintenance app: Other > Attributes.
-
如果适用,请选择强制性数据元素组集,用于 例如**主数据元素组**或**基于跟踪器的数据**。
Note
You'll only see data element group sets in this form if you've created them and set them to Compulsory.
You create data element group sets in the Maintenance app: Data element > Date element group set.
-
点击**保存**。
创建或编辑数据元素组
数据元素组可让您将相关数据元素分类为 共同的主题。例如,两个数据元素“麻疹免疫”和 “ BCG免疫”可以分组为一个数据元素组 “儿童免疫”。
要创建数据元素组:
-
打开**维护**应用项目,点击**数据元素** > 数据 元素组。
-
点击添加按钮。
-
填写表格:
-
名称
-
简称
-
码
-
-
选择数据元素并分配它们。
-
点击**保存**。
创建或编辑数据元素组集
数据元素组集可让您对多个数据元素进行分类 组成一组。系统在以下过程中使用数据元素组集 分析和报告,以将相似的数据元素组合并为一个 共同的主题。一个数据元素组可以是多个数据元素的一部分 组集。
-
打开**维护**应用项目,点击**数据元素** > 数据 元素组集。
-
点击添加按钮。
-
填写表格:
- 名称
- 简称
- 码
- 描述
- 必修
- 数据尺寸
-
选择数据元素组并分配它们。
可用的数据元素组显示在左侧面板中。数据 当前是数据元素组成员的元素组 设置显示在右侧面板中。
-
点击**保存**。
克隆元数据对象{ #clone_metadata_data_elements }
克隆数据元素或其他对象可以在创建时节省时间 许多相似的对象。
-
打开**维护**应用项目,找到元数据对象类型 你想克隆。
-
在对象列表中,单击选项菜单并选择**克隆**。
-
修改所需的选项。
-
点击**保存**。
更改元数据对象的共享设置
您可以为元数据对象(例如 组织单位和受跟踪的实体属性)分配不同的共享设置。这些共享 设置用于控制哪些用户和用户组可以查看或编辑 元数据对象。
一些元数据对象还允许您更改共享设置 对象的数据输入。这些附加设置控制谁可以 使用元数据查看或在表单字段中输入数据。
注意
默认设置是所有人(公共访问权限)都可以找到, 查看和编辑元数据对象。
-
打开**维护**应用项目,找到元数据对象类型 您要修改。
-
在对象列表中,单击右键并选择**“共享”** 设置**。
-
(可选)添加用户或用户组:搜索一个或多个用户 分组并选择它。用户或用户组已添加到列表中。
-
更改要修改的访问组的共享设置。
-
可以编辑和查看:访问组可以查看和编辑 目的。
-
只能查看:访问组可以查看对象。
-
禁止访问(仅适用于**公共访问**):公众 将无法访问该对象。
-
-
更改您要访问的访问组的数据共享设置 修改。
-
可以捕获数据:访问组可以查看和捕获数据 为对象。
-
可以查看数据:访问组可以查看以下数据: 目的。
-
无访问权限:访问组将无法访问以下数据: 物体。
-
-
点击**关闭**。
删除元数据对象
注意
您只能在以下情况下删除数据元素和其他数据元素对象: 没有数据与数据元素本身关联。
警告
从系统删除的所有数据集都将不可避免地丢失。所有 数据输入表格,以及可能已经制定的部分表格 也将被删除。确保您已经备份了您的 数据库,然后删除任何数据集,以防您需要还原它 在某个时间点。
-
打开**维护**应用项目,找到元数据对象类型 您要删除。
-
在对象列表中,单击选项菜单并选择**删除**。
-
点击**确认**。
显示元数据对象的详细信息
-
打开**维护**应用项目,找到元数据对象类型 您想查看。
-
在对象列表中,单击选项菜单,然后选择 显示 细节。
翻译元数据对象
DHIS2提供了用于翻译数据库内容的功能, 示例数据元素,数据元素组,指标,指标组 或组织单位。您可以将这些元素转换为任意数量的 语言环境。地区代表特定的地理,政治或 文化区。
提示
要激活翻译,请打开 System Settings 应用项目,单击 > **外观**并选择一种语言。
-
打开**维护**应用项目,找到元数据对象类型 您要翻译。
-
在对象列表中,单击选项菜单并选择**翻译**。
Tip
If you want to translate an organisation unit level, click directly on the Translate icon next to each list item.
-
选择一个语言环境。
-
输入**名称**、简称**和**说明。
-
点击**保存**。
管理数据集和数据输入表单
关于数据集和数据输入表格
DHIS2 中的所有数据录入都以数据集为单位。数据集是 数据集是数据元素的集合,用于数据录入和 DHIS2 实例之间的数据导出。 DHIS2 实例之间的数据导出。要使用数据集为 要使用数据集收集特定组织单位的数据,您必须将该组织单位分配给 数据集。一旦您将数据集分配给一个组织单位 单位,该数据集就可在**数据录入**应用项目中使用。只有 数据集的组织单位才能使用该数据集进行数据录入。 数据集进行数据录入。
类别组合可以链接到数据元素和数据集。如果 您将类别组合用于数据集,类别组合 适用于整个表格。这意味着您可以使用类别 捕获整个表格共有的信息,例如 项目或拨款的名称。当数据集链接到 类别组合,这些类别将显示为下拉列表 **数据输入**应用中的框。表格中捕获的数据将被 链接到从这些下拉框中选择的类别选项。对于 有关如何创建类别和类别组合的信息, 请参阅“管理数据元素和类别”一节。确保你 将类别和类别组合的类型设置为“属性”。
分类在以下情况下会派上用场:当你需要为实施伙伴组织和某个项目创建一个 数据录入表单时。 在这种情况下:
-
为所有合作伙伴组织创建类别选项和类别 和项目,并将它们链接到新的类别组合中。
-
将类别组合分配给要为其的数据集(窗体) 需要捕获此信息。
在数据输入模块中打开此数据集时,伙伴 组织和项目类别将自动呈现 作为下拉框,允许您选择特定的实施 合作伙伴组织和项目,然后继续进行数据输入。
您可以在**维护**应用项目中创建和编辑数据集。在这里 例如,您要在数据集中定义哪些数据元素以及数据收集频率。 和数据收集频率。
您在 Data entry 应用项目中输入数据。 **数据输入**应用项目使用 数据输入表单以显示数据集。数据分为三种 报名表格:
表:数据录入表单类型
| 数据录入表类型 | Parameter name |
|---|---|
| 默认表单 | 将数据集分配给组织单位后,系统会自动生成一个默认表单。随后,该默认表单将在“数据录入”应用中,对您已分配该表单的组织单位显示可用。 默认表单由该数据集所属的数据元素列表以及用于输入值的列组成。 如果您的数据集包含非默认类别组合的数据元素(例如年龄组或性别),系统会根据不同的类别在默认表单中自动创建额外的列。 如果您使用多个类别组合,默认表单中将出现多列,各列的列标题对应不同的选项。 |
| 分节表单 | 如果默认表单不能满足你的需求,你可以修改它来创建一个分节表单。在使用表格表单时,分节表单会给你更大的灵活性。 例如,在分节表单中,你可以创建带有小标题的多个表格,也可以禁用表格中的单元格(使其变灰)。 在数据集中添加分节表单后,分节表单就可以在**数据录入**应用项目中使用。 |
| 自定义表单 | 如果要设计的表单过于复杂,无法使用默认表单或章节表单,您可以创建自定义表单。自定义表单的创建时间比章节表单更长,但您可以完全掌控其设计。 例如,您可以使用自定义表单模拟现有的纸质汇总表单。这不仅能简化数据录入,还能减少数据录入错误的数量。 当您将自定义表单添加到数据集后,该表单将在**数据录入**应用中可用。 |
注意
如果数据集同时具有部分表单和自定义表单,则系统 在数据输入期间显示自定义表格。输入数据的用户不能 选择他们要使用的表格。在基于Web的数据输入中的顺序 显示首选项:
1.自定义表单(如果存在)
2.部分表格(如果存在)
3.默认格式
移动设备不支持自定义表格。在基于移动的数据输入中 显示首选项的顺序为:
1.部分表格(如果存在)
2.默认格式
In the Maintenance app, you manage the following data set objects:
表格维护应用项目中的数据集对象
| CSV元数据导入 { #webapi_csv_metadata_import } | 可用功能 |
|---|---|
| <indicator-id> | 创建、分配给组织单位、编辑、共享、删除、显示详细信息和翻译 编辑强制性数据元素 一次向组织单位添加和删除多个数据集 |
| 分节表 | 创建、编辑和管理灰色字段 |
| 删除源指标,增加目标指标 | 更改显示顺序、删除和翻译 |
| 自定义表单 | 创建、编辑和编写脚本 |
工作流程
您需要具有数据元素和类别才能创建数据集和 数据输入表格。
-
创建一个数据集。
-
将数据集分配给组织单位。
默认形式是自动创建的。
-
创建节形式或自定义形式。
Now you can register data in the Data entry app.
创建或编辑数据集

-
打开 Maintenance 应用项目,然后单击 Data set (> Data set)。
-
点击添加按钮。
-
In the Name field, type the precise name of the data set.
-
In the Short name field, define a short name for the data set.
通常,简称是完整数据集的缩写 名称。此属性通常用于显示数据名称 设置空间有限的地方。
-
(可选)在 Code 字段中,分配一个代码。
-
In the Description field, type a description of the data set.
-
Enter the number of Expiry days.
到期天数控制应该持续多长时间 可以在**数据录入**应用项目中为该数据集输入数据。 到期天数指的是结束日期之后的天数 选定的数据输入期间,应打开数据输入表单 进入。天数到期后,数据集将 被锁定以进一步进入。
您可以使用锁定异常为此设置手动异常 **数据管理**应用项目中的功能。
Note
To allow data entry into all possible historical time periods, set the number of expiry days to zero.
-
如果希望将来可以输入数据,请键入 **开放将来的数据输入期间**中的期间数 领域。
该值是可用于 数据输入。
对于每月数据集,值2允许您输入2的数据 提前几个月。例如,这对于人口有用, 目标和计划数据。
-
在“符合及时提交条件的截止日期后的天数”字段中, 输入可以输入数据的天数 考虑及时报到。
要核对已提交的及时报告数量,请转至**报告** > 报告率摘要。
-
Select a Period type.
期间类型定义了报告的频率 特定的数据集。例如,频率可以是每天 每季度或每年。
-
Select a Category combination to assign it to the data set.
Tip
Click Add new to create category combinations that you're missing. In the form that opens, create the category combinations you need. When you're done, click Refresh values.
-
如果您选择的类别组合不是 无, 您可以在**开放时间之后输入零或正数 类别选项的结束日期**。这使您可以在此数据中输入数据 为类别选项设置最多指定的周期数 该类别选项的结束日期之后。
-
在“完整通知接收者”列表中,选择一位用户 数据集标记为时应接收消息的组 在**数据录入**应用项目中完成。
该消息是通过DHIS2消息传递系统传递的。
-
如果您希望输入数据的用户在以下情况下收到消息 在**数据录入**应用项目中将数据集标记为已完成,选择 发送通知给完成用户。
该消息是通过DHIS2消息传递系统传递的。
-
If applicable, select, a Data approval workflow.
-
如果您希望可以在Java中使用数据集 移动 DHIS2 应用项目时,选择 ** 启用 Java 移动客户端**。
-
如果您要强制填写数据元素的所有值 在数据输入中,如果已填写一个或多个值,请选择**全部 必填数据元素的字段**。
这意味着,如果您在 输入字段(用于类别选项组合),然后您 必须输入属于该数据元素的所有字段的数据(即 是所有类别选项组合)。
-
如果希望将数据输入表单标记为已完成 只有当该表单的验证成功时,才选择 完成 仅当验证通过时才允许**。
如果选择此选项,则无法将表单标记为已完成 验证失败。
-
如果您要强制要求所有缺失值都需要一个 评论以说明其缺席,请选择**缺少值要求 评论完成**。
-
(可选)分配一个或多个**传奇**。
-
If applicable, select Skip offline.
此选项控制是否应将此数据输入表单 下载并保存在用户的网络浏览器中。通常你 不应选择 “跳过脱机”。这是默认设置。如果 您有一些很少使用的大型表格,可以考虑选择 此选项可加快数据输入模块中的初始加载速度。
-
If applicable, select Data element decoration
如果选择此选项,则数据元素的描述将以 脱机模式下**数据中的已下载数据集中的标注 入门**应用。
-
If applicable, select Render sections as tabs.
此选项仅适用于部分表格。该选项允许 您可以将每个部分作为数据集上方的标签页显示。您可以选择将标签页水平排列还是垂直排列。 这对于较长的数据集很有用,因为它允许适当的部分 无需快速浏览整个表格即可快速选择。
-
如适用,请选择 添加自定义标题/副标题。
此选项允许您为数据集添加标题和/或副标题。您可以选择将标题和副标题显示在中间、行首或行尾。 出于安全考虑,仅允许使用基本的样式和 HTML 链接元素,具体包括以下标签:
a用于添加链接,u用于给文本加下划线,以及b、strong或em用于将文本设置为粗体。 -
If applicable, select Render vertically.
此选项仅适用于作为多组织单位表单的分部表单。
-
选择数据元素并分配它们。
您可以覆盖每个选定数据集的类别组合 通过点击所选数据列表上方的齿轮图标 元素。这使您可以利用特定的类别组合 (分解)在当前数据集中而不是类别中 直接与数据元素本身关联的组合。
-
选择指标并分配它们。
-
在组织单位树中,选择您要使用的组织单位 想要将数据集分配给。
Tip
-
Click Organisation unit level to select all organisation units that belong to a certain organisation level.
-
Click Organisation unit group to select all organisation units that belong to a certain organisation unit group.
-
-
点击**保存**。
现在,您可以在 数据录入 应用项目中将数据集用于 组织单位的数据集。 选择的频率(周期类型)。
创建或编辑数据集通知
-
打开**维护**应用项目,点击**数据集** > 数据集 通知。
-
点击添加按钮。
发送什么?
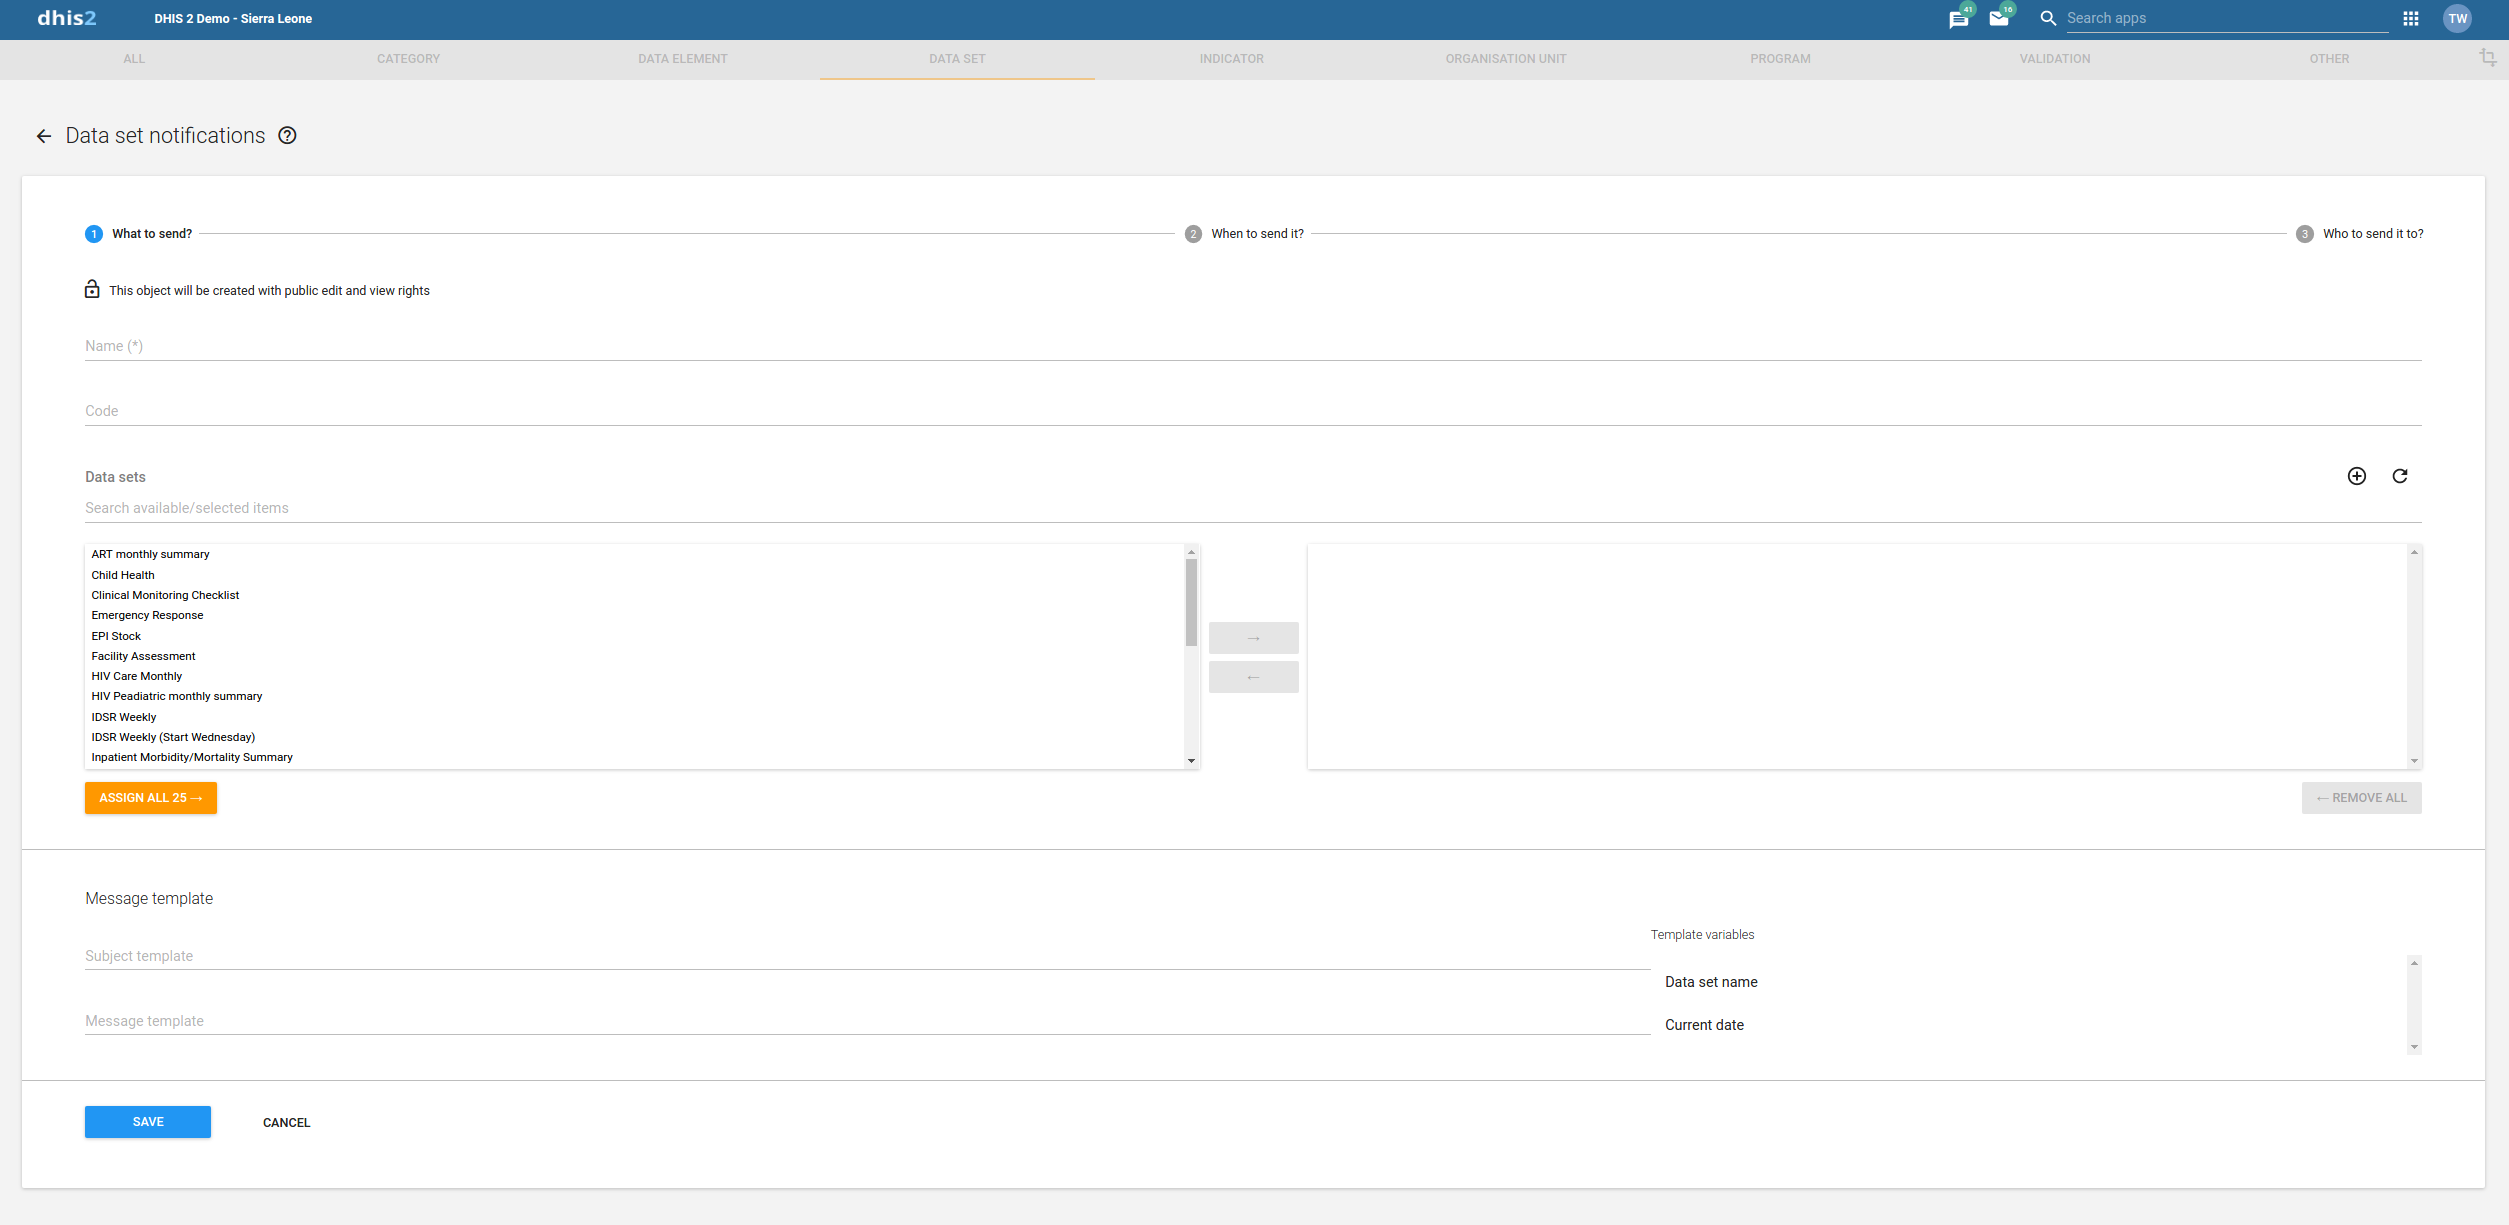
-
在 名称 字段中,输入数据集的确切名称 If either side is present, the other must not be
-
(可选)在 Code 字段中,分配一个代码。
-
输入**数据集**。
这些数据集将与此通知关联。如果有的话 他们完成了一定时期和组织单位, 通知将由系统生成。
Note
Nothing will happen if no data set is selected
-
In Message template section there are two parameters.
-
**主题模板**发送的通知主题 通知。它可以具有变量列表中的值 右侧可用。
-
**消息模板**通知中发送的实际消息。它可以 具有右侧可用变量列表中的值 侧。
Note
Subject is only relevant in case of Email and internal DHIS2 messages. It is ignored in case of SMS.
-
何时发送?

-
**数据集通知触发器**字段确定何时发送 If either side is present, the other must not be
-
**数据集完成**将立即触发通知 数据集完成。
-
**计划天数**将根据天数安排通知时间 相对于预定日期。预定日期将由 与数据集关联的期间。
-
**发送通知为**提供两种不同类型的 通知
-
**汇总摘要**以摘要心情发送通知
-
**单一通知**单一发送通知 心情
-
-
Note
Send notification as option is only available in case of scheduled notification. This option is set to default which is Single notification in case of completion notification
-
寄给谁?

-
**“通知收件人” **字段确定 If either side is present, the other must not be
-
**组织单位联系人**将向联系人发送通知 分配给已收集数据的组织单位 从。
-
** UserGroup **将向所有会员发送通知 选择的用户组。
Note
An internal DHIS2 message will be sent in case if recipient is UserGroup. Moreover user will also receive SMS/EMAIL if phone number and email address exist for that user and SMS/EMAIL notifications are enabled in SystemSettings
-
覆盖数据集中的数据元素的类别组合
您可以覆盖要用于数据元素的类别组合 在数据集范围内。这意味着数据元素可以使用 不同数据集内的不同类别组合。这是 当您想重复使用数据元素时很有用,因为您不必 复制数据元素以允许多个类别组合。
如果组织单位层次结构中的不同区域使用 不同的分类,或者如果分类随时间变化, 您可以通过创建不同的数据集来表示 适当的类别组合。
-
打开 Maintenance 应用项目,然后单击 Data set (> Data set)。
-
在列表中,找到要修改的数据集。
-
点击选项菜单,然后选择**编辑**。
-
转到数据元素部分,然后单击扳手图标。
-
选择新的类别组合,然后单击**关闭**。
-
点击**保存**。
编辑数据集中的强制数据元素
您可以添加或删除将被标记为强制性的数据元素 在数据输入期间。
-
打开 Maintenance 应用项目,然后单击 Data set (> Data set)。
-
在列表中,找到要编辑的数据集。
-
Click the options menu and select Edit compulsory data elements.
-
分配必填数据元素。
-
点击**保存**。
下载PDF格式的默认数据表格
您可以从PDF格式下载默认数据以获取离线数据 条目。
-
打开 Maintenance 应用项目,然后单击 Data set (> Data set)。
-
在列表中,找到要下载的对象。
-
Click the options menu and select Get PDF for data entry.
管理板块表格
创建部分表格
截面表单按数据元素类别自动分隔 组合,从而为每个表单生成电子表格,例如数据输入表单 部分。
-
打开 Maintenance 应用项目,然后单击 Data set (> Data set)。
-
在列表中,找到要创建节形式的数据集 为了。
-
Click the options menu and select Manage sections.
-
点击添加按钮。
-
(Optional) In the Name field, type the name of the section.
-
(可选)在**描述**字段中,输入对该 部分。
-
(可选)在以下期间显示节表中各行的总计 数据输入,选择**显示行总计**。
-
(可选)在显示期间在部分表格中显示列的总计 数据输入,选择**显示列总计**。
-
(可选)要防止具有相同类别下拉列表的数据元素的数据被自动分组, 选择 禁用数据元素的自动分组。如果您希望数据元素的顺序 无论类别组合如何不同,都应予以尊重。
-
将数据元素分配给该部分:
-
(Optional) Select a Category combination filter.
Note
You can only use one category combination per section.
选项 说明 无 显示所有未分配类别组合的数据元素。 <No filter> 显示所有数据元素。 -
选择数据元素并进行分配。
-
-
(可选)使用向上键对部分中的数据元素进行排序 分配的数据元素字段左侧的向下箭头和向下箭头。
-
点击**保存**。
-
对您要包含的每个部分重复添加部分步骤 部分表格。
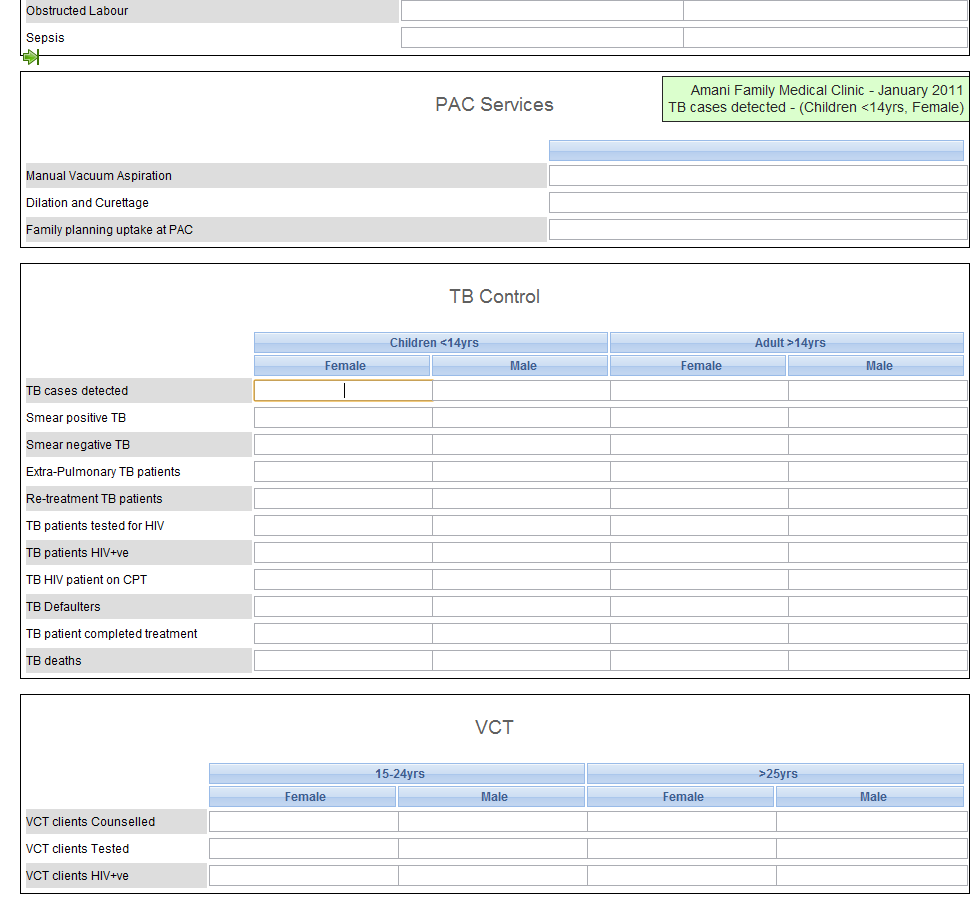
在**数据录入**应用项目中,您现在可以使用分栏表单。表格 当部分可用时,部分表格会自动出现 选定的数据集。具有部分表格的数据集将 自动显示剖面图。
注意如何将每个数据元素类别都分为一个单独的 部分,并且数据输入表已由 系统。将节形式与数据元素类别结合使用 可以大大减少创建所需的时间 数据集的数据输入表单。
编辑部分表格
-
打开 Maintenance 应用项目,然后单击 Data set (> Data set)。
-
在列表中,找到要编辑节形式的数据集 为了。
-
Click the options menu and select Manage sections.
-
在列表中,找到要编辑的部分。
-
点击选项菜单,然后选择**编辑**。
-
Edit the section and click Save.
-
对要编辑的每个节重复编辑节的步骤。
管理分区表单中的灰色字段
您可以禁用数据录入中的数据字段和类别选项。这意味着 在数据录入过程中,将无法在这些字段中 输入数据。

-
打开 Maintenance 应用项目,然后单击 Data set (> Data set)。
-
在列表中,找到要编辑节形式的数据集 为了。
-
Click the options menu and select Manage sections.
-
在列表中,找到要编辑的部分。
-
Click the options menu and select Manage grey fields.
-
选择要禁用的字段。
Note
If you've sections that contain data elements assigned to multiple category combinations, switch between the category combinations to view all fields.
-
点击**保存**。
在部分表格中更改部分显示顺序
您可以控制以节形式显示节的顺序。
-
打开 Maintenance 应用项目,然后单击 Data set (> Data set)。
-
在列表中,找到要编辑节形式的数据集 为了。
-
Click the options menu and select Manage sections.
-
在列表中,找到要移动的部分。
-
点击选项菜单,然后选择**上移**或**下移**。
如果您要移动的部分是菜单中的第一部分或最后部分 列表中,您只会看到其中一个移动选项。
删除部分表格中的部分
-
打开 Maintenance 应用项目,然后单击 Data set (> Data set)。
-
在列表中,找到要编辑节形式的数据集 为了。
-
Click the options menu and select Manage sections.
-
在列表中,找到要删除的部分。
-
Click the options menu and select Delete.
以节形式翻译节
-
打开 Maintenance 应用项目,然后单击 Data set (> Data set)。
-
在列表中,找到要编辑节形式的数据集 为了。
-
Click the options menu and select Translate.
-
选择一个语言环境。
-
输入所需的信息。
-
点击**关闭**。
表单配置选项{ #form-configuration-options }
在第 41 版中,我们添加了额外的表单配置选项,这些选项可更改部分表单在新的**数据录入应用项目(测试版)**中的显示方式。这些选项允许用户应用以前没有自定义表单无法实现的功能。我们将在今后的版本中添加更多选项。

v41 中提供的选项包括:
转置(旋转)功能{ #transpose-pivot-functionality }
在新的数据录入(测试版)应用项目中显示表单时,用户可以选择转置(透视)表单。用户既可以完全转置表单,即移动类别作为行显示,数据元素作为列显示,也可以移动某个类别作为行显示。默认显示模式是数据元素显示为行,类别显示为列。
{ #content-before-and-after-a-section } 部分前后显示的内容
用户可以在某个章节的前后显示自定义文本。例如,这有助于添加帮助文本。 出于安全考虑,仅允许使用基本样式和 HTML 链接元素,具体包括以下标签:a 用于添加链接,u 用于给文本加下划线,b 和 strong 用于将文本设置为粗体,em 用于将文本设置为斜体。
管理自定义表单
创建一个自定义表格
注意
在新版 数据录入 应用中,自定义表单对 JavaScript 的支持已发生变化。详情请参阅 自定义表单对 JavaScript 的支持 。
您可以在内置的WYSIWYG HTML编辑器中设计自定义表单。如果选择 来源,您可以直接将HTML代码粘贴到编辑区域中。为一个 有关如何使用编辑器的完整指南,请参阅 http://docs.ckeditor.com/。

创建自定义表单:
-
Open the Maintenance app and click Data set.
-
在列表中,找到要添加自定义表单的数据集。
-
Click the options menu and select Design data entry form.
-
在编辑区域中,创建自定义表单。
-
双击左侧列表中的对象以将其插入 表格。
-
如果您已经有了表单的HTML代码,请单击 **来源**并粘贴代码。
-
-
Select a Form display style.
-
点击**保存**。
自定义形式的脚本
在自定义数据输入表单中,您可以使用JavaScript创建动态 行为和自定义。例如,您可以隐藏表单部分 根据数据元素的特定用户输入,或显示特定 表单加载时的信息。
大事记
DHIS2数据输入模块提供了一系列事件,您可以 注册并用于在特定时间执行操作。这些事件是 注册在document元素上。 jQuery事件对象和数据 集标识符始终是提供给 回调函数。下表概述了事件 以及何时触发它们。
表:数据录入事件
| To send an email with an HTML body, you can simply provide the HTML content in the message parameter. The email client should interpret the HTML and render it accordingly. Note that the Content-Type header in the curl command should be application/x-www-form-urlencoded, as the data is sent as URL-encoded form data. The following example shows how to send an email with a simple HTML table: | Parameter name | size | |---|---|---| | dhis2.de.event.formLoaded | 在数据输入表单渲染完成后,但在输入字段中设置数据值之前触发。 | 事件 | 数据集 ID | | dhis2.de.event.dataValuesLoaded | 在输入字段中设置数据值后触发。 | 事件 | 数据集 ID | | dhis2.de.event.formReady | 当数据输入表单完全渲染并加载完所有元素时触发。 | 事件 | 数据集 ID | | dhis2.de.event.dataValueSaved | 当数据值成功保存时触发。 | 事件 | 数据集 ID | 数据值对象 | | dhis2.de.event.completed | 当数据集成功标记为已完成时触发。 | 事件 | 数据集 ID | 完整的注册对象 | | dhis2.de.event.validationSuccess | 在验证完成且未发现违规情况时触发。 | 事件 | 数据集 ID |
要注册活动:
 <script type="text/javascript">

dhis2.util.on('dhis2.de.event.formReady',function(event,ds){
  console.log('ID为'+ ds +'的表单已加载!');
});

dhis2.util.on('dhis2.de.event.dataValueSaved',function(event,ds,dv){
  console.log('数据值:'+ dv.value +'与数据元素:'+ dv.de一起保存);
});

dhis2.util.on('dhis2.de.event.completed',function(event,ds,cr){
  console.log('组织单位的表格已完成:'+ cr.ou);
});

 </script>
注意
请注意仅使用“命名空间”事件,例如 上面的示例,而不是一般的示例,例如dhis2.util.on中的“ click” 方法将首先注销事件。
如果您的功能仅适用于某些数据集,则可以使用 提供的数据集标识符和快捷方式,可避免不必要的功能 像这样的数据集 这个:
dhis2.de.on('dhis2.de.event.validationSuccess',function(event,ds){
  if($ .inArray(ds,['utXOiGbEj14','Re7qzHEThSC'])== -1){
    返回false;
  }
  console.log('ID为:'+ ds +'的表单已成功验证!');
});
数据输入表单中输入字段的标识符位于 格式如下所述。此格式可用于选择输入 脚本中的字段并对其执行操作:
<dataelementid>-<optioncomboid> -val
由于为所有事件提供了数据集标识符,因此可行 另一种方法是利用“文件” Web API资源并保留您的 回调函数在一个文件中,您可以在其中让JavaScript代码 根据当前加载的数据集采取措施。
职能
DHIS2数据输入模块包含JavaScript API函数,该函数可以 可从自定义数据输入表单访问。
** dhis2.de.api.getSelections **:此函数返回一个JavaScript 包含所有尺寸的属性以及相应属性的对象 所选选项的标识符的值。它包含 “ ds”(数据集),“ pe”(句号),“ ou”(组织单位)的属性 和所有数据集类别的标识符。
一个示例响应如下所示:
{
 + ds:“ lyLU2wR22tC”,
 + pe:“ 201605”,
 + ou:“ g8upMTyEZGZ”,
 + LFsZ8v5v7rq:“ CW81uF03hvV”,
 + yY2bQYqNt0o:“ yMj2MnmNI8L”
 +}
此功能的示例JavaScript用法:
var sel = dhis2.de.api.getSelections();
 + var orgUnit = sel [“ ou”];
 + var partner = sel [“ LFsZ8v5v7rq”];
更改元数据对象的共享设置
您可以为元数据对象分配不同的共享设置,例如 示例组织单位和跟踪的实体属性。这些分享 设置可控制哪些用户和用户组可以查看或编辑 元数据对象。
一些元数据对象还允许您更改共享设置 对象的数据输入。这些附加设置控制谁可以 使用元数据查看或在表单字段中输入数据。
注意
默认设置是所有人(公共访问权限)都可以找到, 查看和编辑元数据对象。
-
打开**维护**应用项目,找到元数据对象类型 您要修改。
-
在对象列表中,单击右键并选择 共享 设置**。
-
(可选)添加用户或用户组:搜索一个或多个用户 分组并选择它。用户或用户组已添加到列表中。
-
更改要修改的访问组的共享设置。
-
可以编辑和查看:访问组可以查看和编辑 目的。
-
只能查看:访问组可以查看对象。
-
禁止访问(仅适用于**公共访问**):公众 将无法访问该对象。
-
-
更改您要访问的访问组的数据共享设置 修改。
-
可以捕获数据:访问组可以查看和捕获数据 为对象。
-
可以查看数据:访问组可以查看以下数据: 目的。
-
无访问权限:访问组将无法访问以下数据: 物体。
-
-
点击**关闭**。
删除元数据对象
注意
您只能在以下情况下删除数据元素和其他数据元素对象: 没有数据与数据元素本身关联。
警告
从系统删除的所有数据集都将不可避免地丢失。所有 数据输入表格,以及可能已经制定的部分表格 也将被删除。确保您已经备份了您的 数据库,然后删除任何数据集,以防您需要还原它 在某个时间点。
-
打开**维护**应用项目,找到元数据对象类型 您要删除。
-
在对象列表中,单击选项菜单并选择**删除**。
-
点击**确认**。
显示元数据对象的详细信息
-
打开**维护**应用项目,找到元数据对象类型 您想查看。
-
在对象列表中,单击选项菜单,然后选择 显示 细节。
翻译元数据对象
DHIS2提供了用于翻译数据库内容的功能, 示例数据元素,数据元素组,指标,指标组 或组织单位。您可以将这些元素转换为任意数量的 语言环境。地区代表特定的地理,政治或 文化区。
提示
要激活翻译,请打开 System Settings 应用项目,单击 > **外观**并选择一种语言。
-
打开**维护**应用项目,找到元数据对象类型 您要翻译。
-
在对象列表中,单击选项菜单并选择**翻译**。
Tip
If you want to translate an organisation unit level, click directly on the Translate icon next to each list item.
-
选择一个语言环境。
-
输入**名称**、简称**和**说明。
-
点击**保存**。
管理指标
关于指标
指标是一个可以包含多个数据元素的公式, 常数,组织单位组数和数学运算符。 指标通常由分子和分母组成。你用 用于计算覆盖率,发生率和其他值的指标 是已输入到数据元素值的结果 系统。计算得出的总数没有分母。
注意
您永远不会直接在DHIS2中输入指标值,而是进行计算。
指标公式可以包含数学运算符,例如 加号和减号;功能(见下文);和以下元素:
表:指标要素
| 指示元件 | Potential duplicate status | Parameter name |
|---|---|---|
| N{<indicator-id>} | 零件 | 常量是在所有指标计算中均保持不变的数值。这有助于将可能随时间变化的值集中在一个地方进行修改。 常量是在数据元素值聚合之后应用的。 |
| startDate 和 endDate 参数允许获取链接的数据 | ||
| 到这些日期之间的任何时间段。这避免了定义所有 | ||
| 期间明确在 | ||
| 要求: | 零件 | 数据元素将被替换为该数据元素所捕获的数据值。 |
| 天数 | 所需值 | “Days”是一个特殊运算符,它总能为给定的指标计算提供天数。 例如:若要计算“疫苗冰箱无法正常工作的时间占比”,可将分子定义为: (“Days-疫苗冰箱可用天数”")/"Days" 如果该冰箱在 6 月份可用 25 天,则该指标的计算方式为: (30-25/25)*100 = 17% 若要计算第一季度的总计, 天数(“Days”)应为: 31+28+31 = 90 “Days”参数始终代表所关注时段内的天数。 |
| 组织单位数量 | 零件 | 您可以在公式中使用组织单位组。这些组将被替换为该组中组织单位的数量。 在聚合过程中,该组中的组织单位将与所请求的组织单位层级部分进行交集运算。 这使您能够在指标中使用特定行政区内的公共设施数量。例如,在创建设施基础设施调查和报告时,此功能非常有用。 |
| 程式 | 零件 | 点击 计划,选择一个计划,查看与特定计划相关的所有数据元素、属性和指标。 您在公式中包含的项目组件将有一个项目标签。 |
您可以在指标公式中使用以下功能:
表:指标函数
| 指标功能 | size | Parameter name |
|---|---|---|
| 包含 | (expr, sub1, ...) | 在表达式中搜索一个或多个子字符串。 如果表达式包含所有子字符串,则返回 true。例如,以下表达式均返回 true:contains("abcd", "abcd");contains("abcd", "b");以及 contains("abcd", "ab", "bc")。比较操作区分大小写。 |
| 包含项目 | (表达式, 项1, ...) | 在表达式中搜索一个或多个项目。该表达式由以逗号分隔的元素组成。如果每个项目都与表达式中的某个元素完全匹配,则 containsItems 返回 true。 例如,containsItems("abcd", "abcd") 和 containsItems("ab,cd", "ab", "cd") 的结果为 true,但 containsItems("abcd", "b") 和 containsItems("abcd", "ab", "bc") 则返回 false。比较操作区分大小写。containsItems 可用于多值数据元素,以检查某项是否包含在该数据元素的值中。 |
| 如果 | (布尔表达式, 真表达式, 假表达式) | 评估该布尔表达式,若为真则返回表达式的真值,若为假则返回表达式的假值。参数必须符合任何指标表达式的规则。 |
| 是 | (表达式 [, 表达式 ...] 中的 expr1) | 如果 expr1 与以下任一表达式相等,则返回 true;否则返回 false。 |
| 一片空白 | (元素) | 如果元素值为空(null),则返回 true;否则返回 false。 |
| isNotNull | (元素) | 如果元素值不为空(非 null),则返回 true;否则返回 false。 |
| firstNonNull | (元素 [, 元素 ...]) | 返回第一个不为空(非 null)的元素的值。可以提供任意数量的参数。任何参数也可以是数字或字符串字面量,如果所有前面的对象都有缺失值,则返回该参数。 |
| 最伟大的 | (表达式 [, 表达式 ...]) | 返回给定表达式中的最大(最高)值。可以提供任意数量的参数。 |
| 最小 | (表达式 [, 表达式 ...]) | 返回给定表达式中的最小(最低)值。可以提供任意数量的参数。 |
| 日志 | (表达式 [, 底数 ]) | 返回数值表达式的自然对数(底为 e)。如果将一个整数作为第二个参数传入,则返回以该底为底的对数。 |
| log10 | (表达式) | 返回数值表达式的常用对数(底为 10)。 |
| false | 不返回任何结果。例如,if( #{FH8ab5Rog83} <0, null, 1 ) 在数据元素的值小于 0 时不返回任何结果,否则返回 1。 | |
| removeZeros | (表达式) | 如果表达式的值为 0,则不返回任何值;否则返回该表达式的值。 |
| 子表达式 | (表达式) | 在进行聚合之前,先对表达式的一部分进行求值。请参阅下文的“指示子表达式”。 |
| [periodInYear] | 该期间在一年中的序号(1、2、3、……)。示例请参见下文的“指标年初至今”部分。 | |
| [yearlyPeriodCount] | 该年度内此类时期的数量。示例请参见下文的“指标年初至今”部分。 | |
| .aggregationType | (聚合类型) | 覆盖汇总数据(非项目数据)的默认数据元素汇总类型。 |
| .maxDate | (yyyy-mm-dd) | 对于数据元素(非项目数据),最大日期当日或之前结束的期间的值。 |
| .minDate | (yyyy-mm-dd) | 对于数据元素(非项目数据),最小日期当日或之后开始的期间的值。 |
| .periodOffset | (整数常量) | 置于数据值或表达式之后时,返回相对于报告期间偏移一个期间后的值。该操作可以嵌套使用。请注意,此操作仅对汇总数据进行偏移,不适用于跟踪器或事件数据。请参见下文示例。 |
| .yearToDate() | 汇总从年初至当前期间的所有期间的数值。请注意,如果任何一周在该年内有四天或以上,则该周被视为本年度的一部分。示例请参见下文的“指标年初至今”部分。 |
有效的聚合类型:
| 不 | Parameter name |
|---|---|
| 平均值 | 在时间段和组织单位层级中的平均值 |
| AVERAGE_SUM_ORG_UNIT | 组织单位层次结构中的平均值、总和 |
| COUNT | 值的个数 |
| FIRST | 组织单位层次结构中的第一个值、总和 |
| FIRST_AVERAGE_ORG_UNIT | 第一个值,组织单位层次结构中的平均值 |
| LAST | 组织单位层级中的最后一个值、总和 |
| LAST_AVERAGE_ORG_UNIT | 组织单位层级中的最后一个值、平均值 |
| 本期末值 | 期间内的最后一个值,组织单位层级中的总和 |
| 本期末平均组织单位 | 期间内的最后一个值,组织单位层级中的平均值 |
| MAX | min-max 数据元素资源允许您设置最小值和最大值 |
| 数据元素的值范围。它是独一无二的 | |
| 组织单位、数据元素和类别选项组合。 | |
| MIN | A sample JSON response looks like this: |
| Boolean | 任何维度均未进行聚合 |
| SUM | 在时间段和组织单位层级中的值之和 |
| STDEEV | 值的标准差(基于总体) |
| 方差 | 值的方差(基于总体) |
.aggregationType、.maxDate、.minDate 和 .periodOffset 函数的示例:
| 指标表达 | 手段 |
|---|---|
| #{FH8ab5Rog83}.aggregationType(COUNT) | 值的个数 |
| #{FH8ab5Rog83}.aggregationType(LAST) - #{FH8ab5Rog83}.aggregationType(FIRST) | 第一个值与最后一个值之间的差值 |
| #{FH8ab5Rog83}.maxDate(2021-6-30) | 截至2021年6月30日的数值 |
| #{FH8ab5Rog83}.minDate(2021-1-1) | 2021年1月1日及之后的数值 |
| #{FH8ab5Rog83}.minDate(2021-1-1) .maxDate(2021-6-30) | 2021年1月1日至2021年6月30日之间的数值 |
| # | 上一时期的数值 |
| # | 来自该期间之后的数值 |
| # | 来自该期间之后的值 |
| # | 报告期间的数据元素FH8ab5Rog83减去前一时期的项目数据元素IpHINAT79UW.uf3svrmp8Oj的两倍 |
| (#{FH8ab5Rog83}- #{QOlfIKgNJ3D2}).periodOffset(-2) | 前2个周期的数据元素FH8ab5Rog83减去前2个周期的数据元素QOlfIKgNJ3D2 |
| # | 前2个周期的数据元素FH8ab5Rog83加前1个周期的值 |
| (#{FH8ab5Rog83} .periodOffset(-1)+ #{FH8ab5Rog83}).periodOffset(-1) | 前2个周期的数据元素FH8ab5Rog83加上前1个周期的值(请注意,函数是嵌套的) |
| N{IndicatorID}.periodOffset(-1) | 上一期间的指标值(适用于该指标中的汇总数据) |
指标子表达式{ #indicator_subexpressions }
在为数据元素获取数据时,指标通常会在表达式中进行评估之前先对数据进行聚合。例如,考虑以下指标表达式:
if( #{nYahlae7fe6} > 10, 1, 0 )
如果该数据元素的聚合类型为 SUM,则会将相关期间内数据元素 nYahlae7fe6 的所有值相加,然后判断其和是否大于 10。如果所有数据元素值的总和大于 10,则返回 1;否则返回 0。
有时,您可能希望在对数据进行聚合之前,先在表达式中评估该数据值。例如,您可能希望在区一级显示该区内有多少个设施的数据值大于 10。可以通过如下方式使用 subExpression 函数来实现:
subExpression( if( #{nYahlae7fe6} > 10, 1, 0 ) )
这将测试每个数据元素的值是否大于10。如果大于10,_if_语句将返回1;否则返回0。 然后,假设数据元素 nYahlae7fe6 的聚合类型为 SUM,系统将对 1 和 0 进行求和,从而得出值大于 10 的数据元素数量。
子表达式说明:
-
仅当数据元素的聚合类型为 SUM 时,上述示例才会将 1 和 0 相加。如果数据元素具有不同的聚合类型,并且您希望将 1 和 0 相加,则可以使用
.aggregationType()函数覆盖子表达式内的聚合类型,如下所示:subExpression( if( #{nYahlae7fe6} > 10, 1, 0 ) ).aggregationType(SUM)
-
一个子表达式只能引用一个数据元素,但可以多次引用该元素。例如:
subExpression( if( #{nYahlae7fe6} > 10 && #{nYahlae7fe6} <= 20, 1, 0 ) )
-
子表达式可以引用一个带有类别选项组合和/或属性选项组合的数据元素,但每次引用的对象必须完全相同。例如:
subExpression( if( #{nYahlae7fe6.beec4Dewah8} > 10 && #{nYahlae7fe6.beec4Dewah8} <= 20, 1, 0 ) )
-
如果您希望在聚合前评估一个表达式,该表达式涉及其他类型的数据(如项目数据),或涉及多个数据元素、类别选项组合或属性选项组合,您可以使用预测器来进行评估,并将结果存储为不同的数据元素。然后,您就可以在指标或分析中直接引用预测的数据元素。
指标 年初至今{ #indicator_yeartodate }
指标可以使用表达式元素 yearToDate()、[periodInYear] 和 [yearlyPeriodCount] 来计算年初至今的值。
在下面的示例中,#{a} 可以是:#{dataElementUID},或任何返回数据值的有效指标表达式项,例如 #{dataElementUID.catOptionComboUid}、I{programIndicatorUID}、N{indicatorUID} 等。
| 指标表达 | 手段 |
|---|---|
| #{a} | 本期值 |
| #{a}.yearToDate() | 年初至今的数值总和。例如,如果时间段为3月,则显示1月+2月+3月的数值。 |
| #{a}.yearToDate() / [periodInYear] | 年初至今的平均值。例如,如果时间段为3月,则该值为1月+2月+3月 / 3 |
| #{a} - | 本期与年初至今平均值的差异 |
| #{b} * [periodInYear] / [yearlyPeriodCount] | 如果 #{b} 表示年度目标人群数量(例如,今年应接种疫苗的人数),那么该公式可以计算出截至当前时期应接种疫苗的人数。例如,在2月份,计算公式为 #{b} * 2 / 12。 |
关于 [yearlyPeriodCount] 的说明{ #notes-on-yearlyperiodcount }
对于按月划分的周期,[yearlyPeriodCount] 始终为 12;对于按季度划分的周期,则始终为 4,以此类推。使用 [yearlyPeriodCount] 而不是硬编码数字(如 12 或 4)有两个优点:
-
对于按周计算的周期,[yearlyPeriodCount] 根据年份的不同,将为 52 或 53。对于按双周计算的周期,该值将为 26 或 27。
-
如果用户在分析中选择了其他时间段类型,[periodInYear] 和 [yearlyPeriodCount] 将相应调整。 例如,如果收集的是月度数据,用户可以选择按月生成报表,此时 [periodInYear] 为 1:1 月、2:2 月、……,且 [yearlyPeriodCount] 为 12;或者用户可以选择按季度生成报表,此时 [periodInYear] 为 1:第一季度、 2:第二季度,……,而 [yearlyPeriodCount] 为 4。
关于缺失数据的说明{ #notes-on-missing-data }
.yearToDate() 会在该时间段之前或期间的年度内存在任何数据时返回一个值。 例如,如果 #{a} 的值为:
1月:(无数据)
2月:1
3月:2
4月:(无数据)
5月:3
6月:(无数据)
那么,#{a}.yearToDate() 的值是:
1月:(无数据)
2月:1
3月:3
4月:3
5月:6
6月:6
In the Maintenance app, you manage the following indicator objects:
表:维护应用项目中的指标对象
| CSV元数据导入 { #webapi_csv_metadata_import } | 可用功能 |
|---|---|
| 对于组织单位维度,您可以指定组织 | 创建、编辑、克隆、分享、删除、查看详情和翻译 |
| Class name | 创建、编辑、克隆、删除、查看详情和翻译 |
| Other translatable Properties | 创建、编辑、克隆、分享、删除、查看详情和翻译 |
| 类别选项 | 创建、编辑、克隆、分享、删除、查看详情和翻译 |
工作流程
-
创建指标类型。
-
创建指标。
-
创建指标组。
-
创建指标组集。
创建或编辑指标类型

指标类型定义了在聚合期间应用的因素。 在数据集市导出或报告期间计算的指标值 表生成过程将显示正确的格式,并且 因此不需要额外的乘法器(例如, 百分比),以使值显示正确的格式。
注意
从DHIS2版本2.4开始,“计算数据元素”对象具有 已弃用。相反,您可以通过以下方式创建计算所得的数据元素: 创建因子类型为“ 1”的指标类型,并通过设置 “数字”选项为“是”。将“数字”选项设置为的效果 “是”将表示该指标实际上没有 分母。因此,您将只能定义一个分子, ,它将用作计算的数据元素的公式。
-
打开** Maintenance 应用项目,然后单击 Indicator ** > ** Indicator 类型**。
-
点击添加按钮。
-
在“名称”字段中,输入指标类型的名称,例如 例如“百分比”,“每千”,“每万”。
-
输入一个 因子。
该系数是数值系数,将乘以 指标计算过程中的指标公式。
-
点击**保存**。
创建或编辑指标
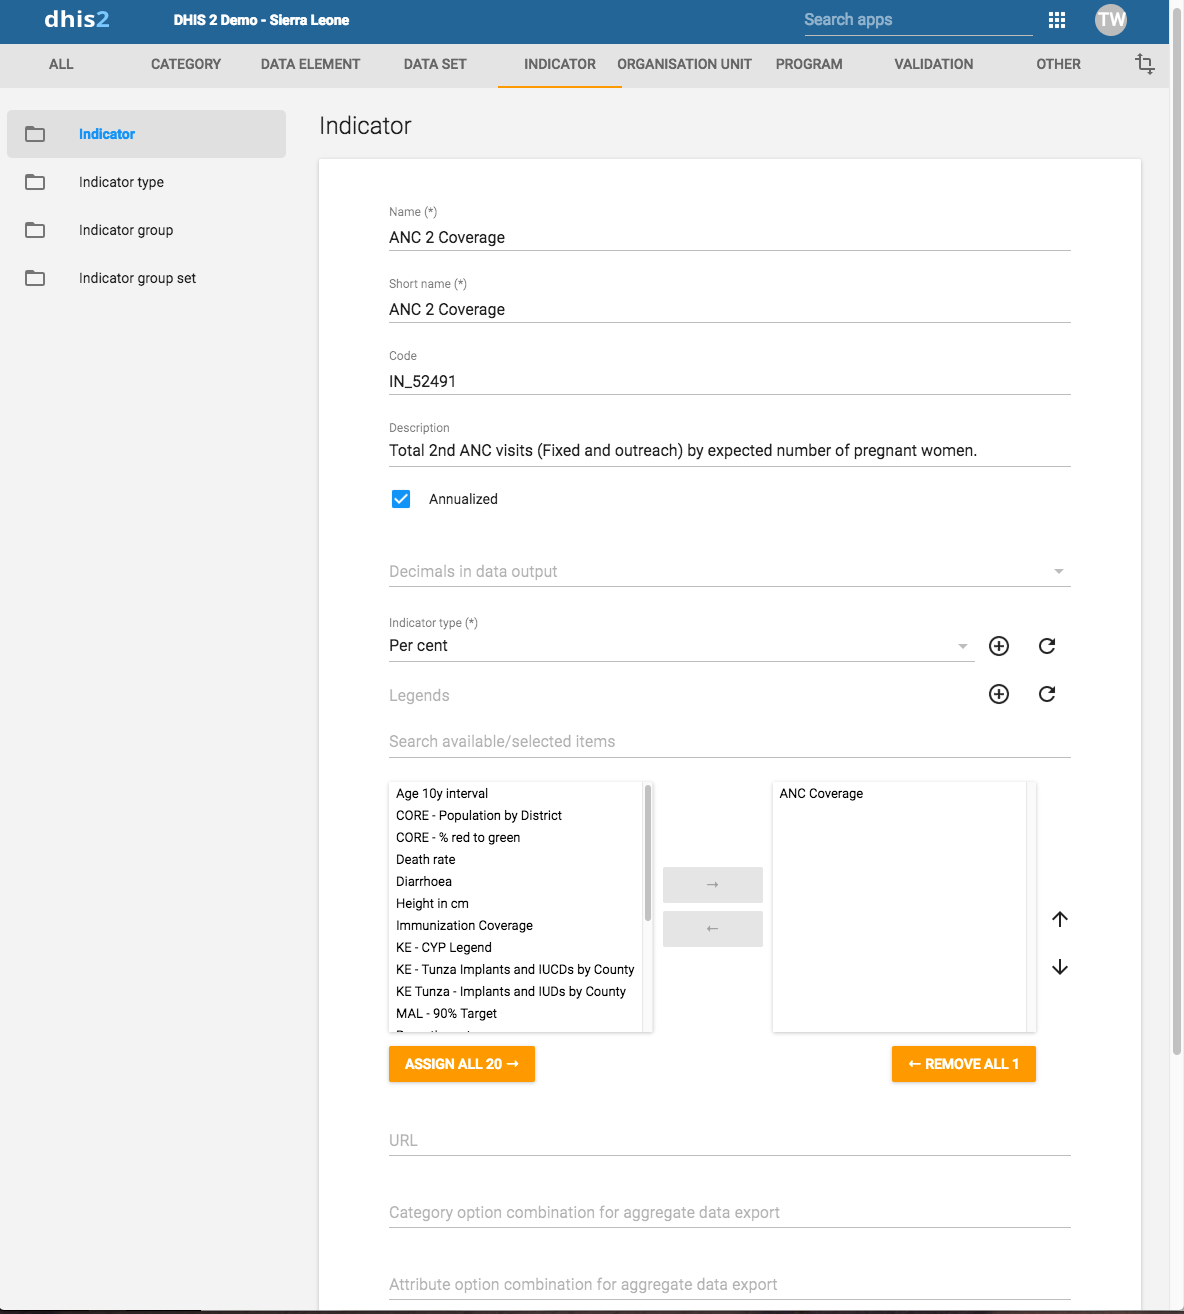
-
打开** Maintenance 应用项目,然后单击 Indicator ** > 指示符。
-
点击添加按钮。
-
在“名称”字段中,输入指标的全称,例如 例如:“每千人确诊的疟疾发病率”。
-
在“短名称”字段中,输入该的简写名称 指标,例如“每千次弹出记录的疟疾传播控制数”。
简称必须少于或等于25个字符, 包括空格。
-
(可选)在 Code 字段中,分配一个代码。
在许多国家/地区,指标均分配有代码。
-
(Optional) In the Color field, assign a color to reprersent the indicator.
-
(Optional) In the Icon field, assign an icon to illustrate the meaning of the indicator.
-
在**描述**字段中,输入简短且内容充实的描述 指标及其计算方式。
-
如果要在计算过程中应用年化系数 在该指标中,选择 年化。
通常,将年化指标的分子乘以 因数是12,而分母例如是每年 人口数字。这允许每月的覆盖值是 用年度人口数字计算。
-
Select the number of Decimals in data output.
-
选择**指标类型**。
该字段确定将自动应用的因子 在指标计算中。可能的选择是 由指标类型决定。例如,“百分比” 指标将自动乘以100, 导出到数据集市,以便将其显示为百分比。
-
(可选)分配一个或多个**传奇**。
-
在 URL 字段中,输入一个链接,例如指向一个 指标注册表,其中完整的元数据描述 指示器可用。
-
(可选)输入汇总数据的** Category选项组合 出口。**。
您可以使用此设置将作为原始数据导出的聚合数据映射到 另一台服务器。通常,您会进行这种类型的数据交换映射 当您想根据患者数据创建匿名汇总数据时 记录在项目中(事件数据)。
-
(可选)输入汇总的**属性选项组合 数据导出。**。
您可以使用此设置将作为原始数据导出的聚合数据映射到 另一台服务器。通常,您会进行这种类型的数据交换映射 当您想根据患者数据创建匿名汇总数据时 记录在项目中(事件数据)。
-
如果适用,请输入自定义属性值,例如 分类**或**收集方法。
Note
You create custom attributes in the Maintenance app: Other > Attributes.
-
点击**编辑分子**。
-
键入分子的清晰描述。
-
通过双击分子来定义分子 右侧字段。然后,这些组件将作为 左侧字段中的公式。通过添加数学运算符 双击左侧字段下方的图标。
您的公式必须在数学上有效。这包括正确的 必要时使用括号。
-
Click Done to save all changes to the numerator.
-
-
Click Edit denominator.
-
键入分母的清晰描述。
-
通过双击组件中的组件来定义分母 右侧字段。然后,这些组件将作为 左侧字段中的公式。通过添加数学运算符 双击左侧字段下方的图标。
您的公式必须在数学上有效。这包括正确的 必要时使用括号。
-
Click Done to save all changes to the denominator.
-
-
如果适用,请选择强制性指标组集,例如 人力资源。
Note
You'll only see indicator group sets in this form if you've created them and set them to Compulsory.
You create indicator group sets in the Maintenance app: Indicator > Indicator group set.
-
点击**保存**。
创建或编辑指标组

-
打开** Maintenance 应用项目,然后单击 Indicator ** > ** Indicator 组**。
-
点击添加按钮。
-
输入名称。
-
选择指标并分配它们。
-
点击**保存**。
创建或编辑指标组集

指标组集创建相似指标的组合组。对于 例如,您可能有一组称为“疟疾”的指标, “利什曼病”。这两个组可以合并为一组 称为“媒介传播疾病”。指标组集用于 数据分析以结合指标的相似主题。
-
打开** Maintenance 应用项目,然后单击 Indicators ** > ** Indicator 组**。
-
点击添加按钮。
-
填写表格:
- 名称
- 简称
- 码
- 描述
- 必修
-
选择指标组并分配它们。
可用的指示器组显示在左侧面板中。 当前是指标组成员的指标组 设置显示在右侧面板中。
-
点击**保存**。
克隆元数据对象{ #clone_metadata_indicators }
克隆数据元素或其他对象可以在创建时节省时间 许多相似的对象。
-
打开**维护**应用项目,找到元数据对象类型 你想克隆。
-
在对象列表中,单击选项菜单并选择**克隆**。
-
修改所需的选项。
-
点击**保存**。
更改元数据对象的共享设置
您可以为元数据对象分配不同的共享设置,例如 示例组织单位和跟踪的实体属性。这些分享 设置可控制哪些用户和用户组可以查看或编辑 元数据对象。
一些元数据对象还允许您更改共享设置 对象的数据输入。这些附加设置控制谁可以 使用元数据查看或在表单字段中输入数据。
注意
默认设置是所有人(公共访问权限)都可以找到, 查看和编辑元数据对象。
-
打开**维护**应用项目,找到元数据对象类型 您要修改。
-
在对象列表中,单击右键并选择 共享 设置**。
-
(可选)添加用户或用户组:搜索一个或多个用户 分组并选择它。用户或用户组已添加到列表中。
-
更改要修改的访问组的共享设置。
-
可以编辑和查看:访问组可以查看和编辑 目的。
-
只能查看:访问组可以查看对象。
-
禁止访问(仅适用于**公共访问**):公众 将无法访问该对象。
-
-
更改您要访问的访问组的数据共享设置 修改。
-
可以捕获数据:访问组可以查看和捕获数据 为对象。
-
可以查看数据:访问组可以查看以下数据: 目的。
-
无访问权限:访问组将无法访问以下数据: 物体。
-
-
点击**关闭**。
删除元数据对象
注意
您只能在以下情况下删除数据元素和其他数据元素对象: 没有数据与数据元素本身关联。
警告
从系统删除的所有数据集都将不可避免地丢失。所有 数据输入表格,以及可能已经制定的部分表格 也将被删除。确保您已经备份了您的 数据库,然后删除任何数据集,以防您需要还原它 在某个时间点。
-
打开**维护**应用项目,找到元数据对象类型 您要删除。
-
在对象列表中,单击选项菜单并选择**删除**。
-
点击**确认**。
显示元数据对象的详细信息
-
打开**维护**应用项目,找到元数据对象类型 您想查看。
-
在对象列表中,单击选项菜单,然后选择 显示 细节。
翻译元数据对象
DHIS2提供了用于翻译数据库内容的功能, 示例数据元素,数据元素组,指标,指标组 或组织单位。您可以将这些元素转换为任意数量的 语言环境。地区代表特定的地理,政治或 文化区。
提示
要激活翻译,请打开 System Settings 应用项目,单击 > **外观**并选择一种语言。
-
打开**维护**应用项目,找到元数据对象类型 您要翻译。
-
在对象列表中,单击选项菜单并选择**翻译**。
Tip
If you want to translate an organisation unit level, click directly on the Translate icon next to each list item.
-
选择一个语言环境。
-
输入**名称**、简称**和**说明。
-
点击**保存**。
管理组织单位
在本节中,您将学习如何:
-
创建一个新的组织单位并建立该组织单位 等级制
-
创建组织单位组,组集并分配组织 他们的单位
-
修改组织单位的层次结构
关于组织单位
组织单位层级定义了 DHIS2 的组织结构,例如医疗机构、行政区域和其他 地理区域之间是如何相互排列的。这是 DHIS2 的“地点”维度,类似于时间段所代表的“时间” 维度。
组织单位层次结构是通过父子关系建立的。 在DHIS2中,每个节点都是一个组织单位。一个国家可能 例如有八个省,每个省可能有一个 地区的儿童。通常,最低级别包括 收集数据的设施。数据收集设施也可以 位于较高的级别,例如国家或省级 医院。因此,您可以在DHIS2中创建倾斜的组织树。
-
您一次只能拥有一个组织层次结构。
-
层次结构中可以有任意多个级别。
通常,公共卫生中的国家组织层次结构具有 四到六个级别。
-
您可以通过使用组织来创建其他分类 组和组织组集。
例如,创建与 卫生保健部门。
-
建议使用组织单位组来创建 非地理层次结构。
-
组织单位只能是单个组织的成员 组织单位组集中的单位组。
-
一个组织单位组可以是多个组织单位的一部分 组集。
-
组织单位层次结构是数据的主要载体 地理维度上的汇总。
-
当您关闭组织单位时,您无法注册或编辑 Capture 应用中该组织单位的活动。
重要提示
创建组织单位后,您可以更改其 层级结构,即使是负责收集数据的组织单位也不例外。但是,DHIS2 始终 使用最新的层级结构进行数据汇总。因此,如果您更改了 层级结构,将无法保留该层级结构 随时间变化的历史记录。
A区被划分为B区和C区。原属 A区的机构被重新分配至B区和C区。任何 在划分发生前录入的历史数据,仍 会被登记为属于B区和C区,而非已废止的 A区。
在**维护**应用项目中,您可以管理以下组织单位 对象:
表:维护应用项目中的组织单位对象
| CSV元数据导入 { #webapi_csv_metadata_import } | 可用功能 |
|---|---|
| 类别 | 创建、编辑、克隆、删除、查看详情和翻译 |
| Category combination | 创建、编辑、克隆、分享、删除、查看详情和翻译 |
| 数据元素 | 创建、编辑、克隆、分享、删除、查看详情和翻译 |
| 组织单位级别 | 编辑和翻译 |
| 层次结构操作 | 移动组织单位 |
工作流程
推荐的工作流程是:
-
创建组织单位。
-
创建组织单位组。
-
创建组织单位组集。
创建或编辑组织单位

您可以将组织单位一个或一个地添加到层次结构中 单位或作为所选组织单位的子级。你只能有 一个根单元。
-
打开**维护**应用项目,点击**组织单位** (>)。 组织单位。
-
点击添加按钮。
-
选择您的新组织单位将使用的组织单位 属于:
-
点击**父组织单位**。
-
在组织单位树中,找到上级组织 单位并选择它。您的选择以黄色标记。
Tip
Click the arrows to expand the organisation unit tree.
-
点击**选择**。
-
-
Enter a Name of the organisation unit.
每个组织单位必须具有唯一的名称。
-
Enter a Short name for the organisation unit.
通常,简称是全称的缩写 组织单位名称。此属性通常用于报表中 显示单位单位的名称,该单位的空间有限。
-
(可选)分配**代码**。
在许多国家/地区,为组织单位分配了代码。
-
(可选)上传/删除**组织单位图片**
-
(Optional) Type a Description of the organisation unit.
-
Select an Opening date.
开幕日期控制着一个组织中存在的组织单位 时间点,例如在分析历史数据时。
-
If applicable, select a Closed date.
-
在**“评论”**字段中,输入您需要补充的任何信息 要添加。
-
(可选)在**URL**字段中,输入一个指向外部网站的链接 具有有关组织单位的其他信息的站点。
-
输入联系信息:
-
NONE | MULTI_POLYGON | POLYGON | POINT | SYMBOL
-
不
-
电子邮件
-
不
-
-
(Optional) Enter Latitude and Longitude.
您必须具有经度和纬度值才能在地图中创建地图 **地图**应用。然后,您的组织单位可以表示为 点在地图上,例如医疗机构。没有这个 信息,**地图**应用项目将无法使用。
以后批量导入坐标可能会更有效 使用**导入-导出**应用项目为所有组织单位执行任务。您 还可以使用 ** 导入-导出** 应用项目来创建多边形。多边形是 代表行政边界的组织单位。
-
If applicable, select Data sets and assign them.
Note
You control whether a user should be able to assign data sets to an organisation unit in the System Settings app:
Open the System Settings app, click Access and select Allow assigning object to related objects during add or update.
-
If applicable, select Programs and assign them.
Note
You control whether a user should be able to assign programs to an organisation unit in the System Settings app:
Open the System Settings app, click Access and select Allow assigning object to related objects during add or update.
-
如果适用,输入自定义属性值,例如** HR 标识符**。
Note
You configure the custom attributes in the Maintenance app:
Open the Maintenance app and click Other > Attribute.
-
点击**保存**。
创建或编辑组织单位组
组织单位组可让您将相关的组织 单位按共同主题进行分类。例如,您可以将所有 属于医院的组织单位归入**医院**组。
-
打开**维护**应用项目,点击**组织单位** (>)。 单位部门。
-
点击添加按钮。
-
填写表格:
-
名称:为以下内容提供准确,唯一和描述性的名称: 组织单位组。
-
简称:简称应小于25 字符。通常,简称是的缩写。 完整的单位部门名称。在某些情况下使用此属性 DHIS2中空间有限的地方。
-
码
-
符号:选择将用于显示符号的符号 显示图层时的组织单位(仅点) **地图**应用。
-
-
在组织树中,单击您想要的组织单位 添加到组织单位组。
您可以通过展开目录树来在树中找到组织单位 分支(单击箭头符号),或通过搜索 名称。
所选组织单位显示为橙色。
-
点击**保存**。
创建或编辑组织单位组集
组织单位组集允许您创建其他 组织单位的分类。组集创建新 尺寸,以便您可以进行更详细的数据分析。你一个 轻松按组集中的组过滤,组织或汇总数据。
-
您可以具有任意数量的组织单位组集。
-
默认的组织单位组集是**类型**和 所有权。
-
组织单位只能是单个组织的成员 组织单位组集中的单位组。
-
一个组织单位组可以是多个组织单位的一部分 组集。
-
您可以定义组织单位组集是否是强制性的 是否会影响数据的完整性。必修 表示所有组织单位必须是该组中的成员 组集。
注意
在**数据管理**应用项目的**数据完整性**部分,您 可以验证您是否不小心分配了同一个组织单位 到同一组集中的多个组。在这个应用项目中,您还 查找有关不属于某个组织成员的组织单位的信息 强制组织单位组设置。
-
打开**维护**应用项目,点击**组织单位** (>)。 组织单位组集。
-
点击添加按钮。
-
填写:
-
名称:为组织单位组提供准确的名称 组。
-
简称:为组织单位组提供一个简称 组。
-
码
-
说明:说明组织单位组设置了什么 测量或捕获。
-
-
如果您希望所有组织单位成为该组中的成员 在组设置中,选择“必选”。
-
(Optional) Select Data dimension.
如果您选择**数据维度**,该分组集将作为另一个维度供分析使用,除“时间段”和“组织单位”这两个标准维度之外。 -
(Optional) Select Include subhierarchy in analytics.
如果您选择此选项,则子单位部门将继承 最接近的“父级”的组织单位组属性 组织单位。子组织单位的任何财产将 覆盖继承值。
如果单位部门没有关联的单位部门组, 组织单位可以继承其最接近的上级组织 单位组。如果上级组织单位组都没有 给定组织单位组集的组织单位组,结果 仍然是“空白”,但如果至少有一个父母有 组织单位组,子组织单位将继承它。
在分析中包含子层次结构”已启用,这意味着组织 单位继承了最亲密的父母单位 为白色(没有与之关联的单位部门组)。
-
选择组织单位组并分配它们。
在左侧列表中,找到可用的组织单位 组。使用箭头在两个组之间移动选定的组 列表。
如果左侧列表中没有组织单位组, 点击**添加新**。在打开的表单中,创建组织 所需的单位组。完成后,点击**刷新数值**。
Note
An organisation unit can only be a member of a single organisation unit group within an organisation unit group set.
-
请点击 保存。

您希望根据设施的所有权来分析数据。所有 设施都有所有者,因此您需要确保所有组织 单位都具备这一分类。为此,您可以使用 强制 选项:
-
为每种所有权类型创建一个组,例如“ MoH”,“私有” 和“基于信仰”。
-
将数据库中的所有设施分配给这些组之一。
-
创建一个名为“所有权”的组织单位组集,然后选择 必修。
-
分配组织单位组“ MoH”,“私人”和 从“基于信仰”到“所有权”组织组 组。
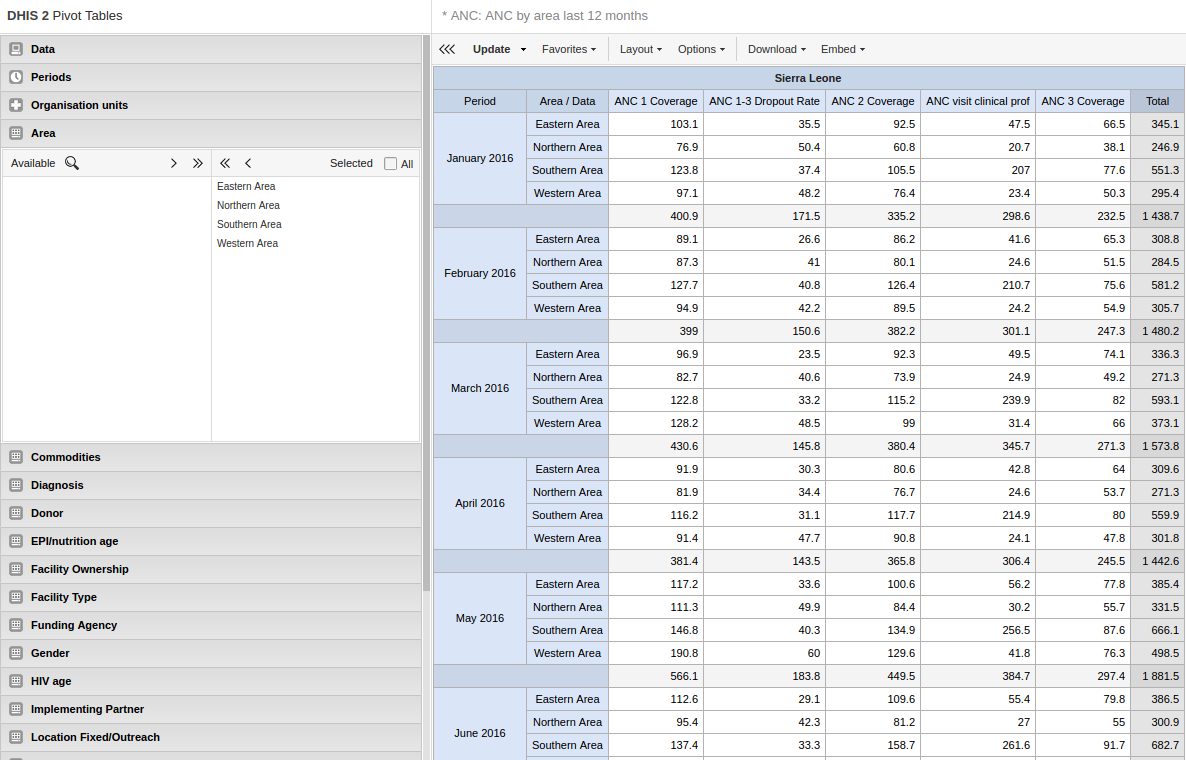

通过两种方式对组织单位进行分组,并汇总这两种数据 并行层次结构
用于汇总数据(仅在分析应用项目中)
组织单位组设置的附加设置将创建一个 动态“成员资格”到组织单位组的集合。
您无需更改组织单位的层次结构
可扩展和动态
动态包含层次
动态附加分类
为组织单位级别分配名称
当您将子女添加到一个组织单位时,DHIS2 会自动 会自动创建一个新的组织单位级别(如有必要)。系统还会 为该级别指定一个通用名称,如 "第 5 级"。您可以 用上下文名称代替通用名称,如 "国家"、"省"、"区 "或 "县"、 省"、"区 "或 "卫生机构"。DHIS2 使用上下文名称 名称,例如在**地图**应用项目中。
-
打开**维护**应用项目,点击**组织单位** (>)。 组织单位级别。
列表的加载时间取决于列表的深度 组织单位层次结构树。
-
对于要修改的组织单位级别,输入名称。
-
选择离线级别的数量。
Note
You configure the default value in the System Settings app:
Open the System Settings app, click General and select a level in the Max offline organisation unit levels list.
-
点击**保存**。
在层次结构中移动组织单位
您可以通过以下方式在层次结构中移动组织单位: 所选组织单位的父级。
-
打开**维护**应用项目,点击**组织单位** (>)。 等级操作。
-
在左侧的层次结构树中,选择您要使用的组织单位 想搬家。
Note
If the selected organisation unit is has sub-organisation units, all of them move to the new parent organisation unit.
-
在右侧的层次结构树中,选择您要使用的组织单位 想要将选定的组织单位移动到。
-
点击“移动 x 个组织单位”,其中 x 代表数量 您选择的组织单位数。
您的更改将立即反映在左侧 层次树。
关闭组织单位
关闭某个组织单位后,您将无法在**Capture**应用中 为该组织单位注册或编辑活动。
-
打开**维护**应用项目,点击**组织单位** (>)。 组织单位。
-
In the object list, click the options menu and select Edit.
-
Select a Closed date.
-
点击**保存**。
克隆元数据对象{ #clone_metadata_orgunit }
克隆数据元素或其他对象可以在创建时节省时间 许多相似的对象。
-
打开**维护**应用项目,找到元数据对象类型 你想克隆。
-
在对象列表中,单击选项菜单并选择**克隆**。
-
修改所需的选项。
-
点击**保存**。
更改元数据对象的共享设置
您可以为元数据对象分配不同的共享设置,例如 示例组织单位和跟踪的实体属性。这些分享 设置可控制哪些用户和用户组可以查看或编辑 元数据对象。
一些元数据对象还允许您更改共享设置 对象的数据输入。这些附加设置控制谁可以 使用元数据查看或在表单字段中输入数据。
注意
默认设置是所有人(公共访问权限)都可以找到, 查看和编辑元数据对象。
-
打开**维护**应用项目,找到元数据对象类型 您要修改。
-
在对象列表中,单击右键并选择 共享 设置**。
-
(可选)添加用户或用户组:搜索一个或多个用户 分组并选择它。用户或用户组已添加到列表中。
-
更改要修改的访问组的共享设置。
-
可以编辑和查看:访问组可以查看和编辑 目的。
-
只能查看:访问组可以查看对象。
-
禁止访问(仅适用于**公共访问**):公众 将无法访问该对象。
-
-
更改您要访问的访问组的数据共享设置 修改。
-
可以捕获数据:访问组可以查看和捕获数据 为对象。
-
可以查看数据:访问组可以查看以下数据: 目的。
-
无访问权限:访问组将无法访问以下数据: 物体。
-
-
点击**关闭**。
删除元数据对象
注意
您只能在以下情况下删除数据元素和其他数据元素对象: 没有数据与数据元素本身关联。
警告
从系统删除的所有数据集都将不可避免地丢失。所有 数据输入表格,以及可能已经制定的部分表格 也将被删除。确保您已经备份了您的 数据库,然后删除任何数据集,以防您需要还原它 在某个时间点。
-
打开**维护**应用项目,找到元数据对象类型 您要删除。
-
在对象列表中,单击选项菜单并选择**删除**。
-
点击**确认**。
显示元数据对象的详细信息
-
打开**维护**应用项目,找到元数据对象类型 您想查看。
-
在对象列表中,单击选项菜单,然后选择**显示 细节**。
翻译元数据对象
DHIS2提供了用于翻译数据库内容的功能, 示例数据元素,数据元素组,指标,指标组 或组织单位。您可以将这些元素转换为任意数量的 语言环境。地区代表特定的地理,政治或 文化区。
提示
要激活翻译,请打开 System Settings 应用项目,单击 > **外观**并选择一种语言。
-
打开**维护**应用项目,找到元数据对象类型 您要翻译。
-
在对象列表中,单击选项菜单并选择**翻译**。
Tip
If you want to translate an organisation unit level, click directly on the Translate icon next to each list item.
-
选择一个语言环境。
-
输入**名称**、简称**和**说明。
-
点击**保存**。
管理验证规则{ #manage_validation_rule }
关于验证规则
验证规则基于表达式。该表达式定义了一个 数据元素值之间的关系。该表达式形成一个 条件符合某些逻辑条件。
该表达式包括:
-
左侧
-
右边
-
操作员
验证规则断言所接种的疫苗总数 婴儿小于或等于婴儿总数。
左侧和右侧必须返回数字值。
在**维护**应用项目中,您需要管理以下验证规则 对象:
| CSV元数据导入 { #webapi_csv_metadata_import } | 你可以做些什么 |
|---|---|
| 指示符 | 创建、编辑、克隆、删除、查看详细信息和翻译 |
| Indicator type | 创建、编辑、克隆、删除、分享、查看详情和翻译 |
| 验证通知 | 创建、编辑、克隆、删除、查看详情和翻译 |
关于推拉窗
您可以使用滑动窗口将数据按*多个时间段*进行分组, 而不是仅选择*单个时间段*的数据。滑动窗口具有 一个大小,即涵盖的天数,以及一个起始点和 一个终点。下面的示例展示了疾病监测数据:。
-
橙色部分中的数据,根据当前数据选择数据 期。有一个阈值,每周计算一次 或期间,并显示在“结果”部分中。
-
蓝色部分中的数据是滑动窗口。它选择数据 从过去7天开始。 “结果”显示了总数 确诊病例。
-
验证规则可确保在总数达到 案例数超出了该时间段的阈值。

表:验证规则的不同行为
| 带推拉窗 | 没有推拉窗 |
|---|---|
| 仅用于事件数据。 | 用于事件数据和汇总数据。 |
| 数据选择基于固定的天数(periodType)。 | 数据选择总是基于某个时间段。 |
| 滑动窗口的位置始终是*相对于*正在比较的周期而言的。 | 数据始终是与被比较期间*相同的期间*内的数据。 |
另请参阅:[创建或编辑广告时,如何使用滑动窗口 验证 规则](https://docs.dhis2.org/master/en/user/html/manage_validation_rule.html#create_validation_rule)。
关于验证规则组
验证规则组使您可以对相关的验证规则进行分组。 当您运行* [验证规则 分析](https://docs.dhis2.org/master/zh/user/html/validation_rule_analysis.html)*, 您可以选择运行系统中的所有验证规则,或者 只是一组验证规则。
关于验证通知
您可以配置验证规则分析,以便自动向 选定的用户组发送有关验证错误的通知。这些 消息称为*验证通知*。它们通过 DHIS2内部消息系统发送。
您可以将验证规则通知作为单独的消息或作为 消息摘要。这很有用,例如,如果您要发送 有关高优先级疾病暴发的个别消息和摘要 用于低优先级常规数据验证错误。
关于验证规则函数{ #about-validation-rule-functions }
您可以在验证规则的左侧 或右侧使用以下函数:
表:验证规则函数
| 验证规则函数 | size | Parameter name |
|---|---|---|
| 包含 | (表达式, 子表达式1, ...) | 在表达式中搜索一个或多个子字符串。 如果表达式包含所有子字符串,则返回 true。例如,以下表达式均返回 true:contains("abcd", "abcd");contains("abcd", "b");以及 contains("abcd", "ab", "bc")。比较操作区分大小写。 |
| 包含项目 | (表达式, 项1, ...) | 在表达式中搜索一个或多个项目。该表达式由以逗号分隔的元素组成。如果每个项目都与表达式中的某个元素完全匹配,则 containsItems 返回 true。 例如,containsItems("abcd", "abcd") 和 containsItems("ab,cd", "ab", "cd") 的结果为 true,但 containsItems("abcd", "b") 和 containsItems("abcd", "ab", "bc") 返回 false。比较操作区分大小写。containsItems 可用于多值数据元素,以检查某项是否包含在数据元素的值中。 |
| 如果 | (布尔表达式, 真表达式, 假表达式) | 评估该布尔表达式,若为真则返回表达式的真值,若为假则返回表达式的假值。参数必须符合任何指标表达式的规则。 |
| 是 | (表达式中的表达式1 [, 表达式 ...]) | 如果 expr1 与以下任一表达式相等,则返回 true;否则返回 false。 |
| 一片空白 | (元素) | 如果元素值为空(null),则返回 true;否则返回 false。 |
| isNotNull | (元素) | 如果元素值不为空(非 null),则返回 true;否则返回 false。 |
| firstNonNull | (元素 [, 元素 ...]) | 返回第一个不为空(非 null)的元素的值。可以提供任意数量的参数。任何参数也可以是数字或字符串字面量,如果之前的所有对象都有缺失值,则将返回该参数。 |
| 最伟大的 | (表达式 [, 表达式 ...]) | 返回给定表达式中的最大(最高)值。可以提供任意数量的参数。 |
| 最小 | (表达式 [, 表达式 ...]) | 返回给定表达式中的最小(最低)值。可以提供任意数量的参数。 |
| 日志 | (表达式 [, 底数 ]) | 返回数值表达式的自然对数(底为 e)。如果将一个整数作为第二个参数传入,则返回以该底为底的对数。 |
| log10 | (表达式) | 返回数值表达式的常用对数(底为 10)。 |
| false | 不返回任何结果。例如,if( #{FH8ab5Rog83} <0, null, 1 ) 在数据元素的值小于 0 时不返回任何结果,否则返回 1。 | |
| orgUnit.ancestor | (orgUnitUid [, orgUnitUid ...]) | 如果该组织单位是任意一个(一个或多个)组织单位的子单位,则返回 true;否则返回 false。 |
| orgUnit.dataSet | (dataSetUid [, dataSetUid ...]) | 如果该组织单位被分配给了任意一个(一个或多个)数据集,则返回 true;否则返回 false。 |
| orgUnit.group | (ouGroupUid [, ouGroupUid ...]) | 如果该组织单位属于任何一个(一个或多个)组织单位组,则返回 true;否则返回 false。 |
| orgUnit.program | (programUid [, programUid ...]) | 如果组织单位被分配给任何(1 个或多个)项目,则返回 true,否则返回 false。 |
| removeZeros | (表达式) | 如果表达式的值为 0,则不返回任何结果;否则返回该表达式的值。 |
创建或编辑验证规则
-
打开**维护**应用项目,点击**验证** (>)。 验证规则。
-
点击添加按钮。
-
Type a Name.
在验证规则中,名称必须唯一。
-
(可选)在 Code 字段中,分配一个代码。
-
(可选)输入**说明**。
-
选择**重要性**:高,中**或**低。
-
Select a Period type.
-
选择一个**操作员**:必填项,等于, 独家配对,大于,大于或等于 或**不等于**。
**必填对**运算符允许要求该数据值 必须为表格的左侧和右侧输入表格 表情,还是双方都没有。这意味着您可以要求 如果填写表单中的一个字段,则一个或多个其他字段 还必须填写。
**独占对**可以断言是否存在任何值 左侧,则右侧应没有值(或 反之亦然)。这意味着构成规则的数据元素 任何一方都应相互排斥,因为 给定的时间段/组织单位/属性选项组合。
-
创建表达式的左侧:
-
Click Left side.
-
如果要查看相对于**滑动窗口**的数据,请选择该选项 您比较的时期。另请参见[关于验证 规则](https://docs.dhis2.org/master/zh/user/html/manage_validation_rule.html#about_validation_rule)。
-
选择一种 缺失值处理策略。此选择将决定如何 如果数据丢失,系统将评估验证规则。
选项 说明 如果缺少任何值,则跳过验证规则。这是默认选项。
在使用**独占配对**或**强制配对**操作符时,请务必选择此选项。如果所有值都缺失则跳过 只有当组成表达式的所有操作数都缺失时,才跳过验证规则。 从不跳过 在数据缺失的情况下不会跳过验证规则,所有缺失的操作数都将被视为 0。 -
输入**描述**。
-
根据可用的数据元素建立表达式、
- 根据可用的数据元素、项目对象、组织单位、计数和常量建立表达式。
在右窗格中,双击要包含在表达式中的数据对象。 双击要包含在表达式中的数据对象。与左窗格下方的数学 运算符。
-
点击**保存**。
-
-
创建表达式的右侧:
-
Click Right side.
-
选择一种 缺失值处理策略。此选择将决定如何 如果数据丢失,系统将评估验证规则。
选项 说明 若有任何值缺失则跳过 如果组成表达式的任何值缺失,则将跳过该验证规则。 这是默认选项。
使用 排他配对 或 强制配对 运算符时,请务必选择此选项。若所有值均缺失则跳过 仅当构成该验证规则的所有操作数均缺失时,才会跳过该验证规则。 绝不跳过 即使存在数据缺失,该验证规则也绝不会被跳过,所有缺失的操作数将被视为零。 -
若需查看相对于 当前比较时段的数据,请选择 滑动窗口。 另请参阅 关于验证 规则。
-
输入 描述。
-
基于可用数据元素、 程序对象、组织单位、计数和常量构建表达式。
在右侧窗格中,双击您希望 包含在表达式中的数据对象。将其与位于左侧窗格下方的 数学运算符组合使用。
-
单击 保存。
-
-
(可选)选择该规则适用的**组织单位层级** 应该进行评估。将此留空将导致 要在所有级别上评估的验证规则。
-
(可选)点击 在表单验证时跳过此规则 以避免 进行数据输入时触发此规则
-
点击**保存**。
创建或编辑验证规则组
-
打开**维护**应用项目,点击**验证** (>)。 验证规则组。
-
点击添加按钮。
-
Type a Name.
-
(可选)在 Code 字段中,分配一个代码。
-
(可选)输入**说明**。
-
双击您要分配给该的**验证规则** 组。
-
点击**保存**。
创建或编辑验证通知
-
打开**维护**应用项目,点击**验证** (>)。 验证通知。
-
点击添加按钮。
-
Type a Name.
-
(可选)在 Code 字段中,分配一个代码。
-
Select Validation rules.
-
Select Recipient user groups.
-
(Optional) Select Notify users in hierarchy only.
如果选择此选项,系统将过滤收件人 用户。 (系统从收件人那里获取收件人用户 用户组。)过滤器基于 收件人用户所属。链接到组织单位的用户 是违规组织单位的祖先 发生后将收到验证通知。系统将 忽略其他用户,这些用户将不会收到验证 通知。
-
创建消息模板:
-
创建**主题模板**。
双击**模板变量**字段中的参数 将它们添加到您的主题。
-
创建**消息模板**。
双击**模板变量**中的参数名称 字段以将其添加到您的消息中。
-
-
点击**保存**。
克隆元数据对象{ #clone_metadata_validation }
克隆数据元素或其他对象可以在创建时节省时间 许多相似的对象。
-
打开**维护**应用项目,找到元数据对象类型 你想克隆。
-
在对象列表中,单击选项菜单并选择**克隆**。
-
修改所需的选项。
-
点击**保存**。
更改元数据对象的共享设置
您可以为元数据对象分配不同的共享设置,例如 示例组织单位和跟踪的实体属性。这些分享 设置可控制哪些用户和用户组可以查看或编辑 元数据对象。
一些元数据对象还允许您更改共享设置 对象的数据输入。这些附加设置控制谁可以 使用元数据查看或在表单字段中输入数据。
注意
默认设置是所有人(公共访问权限)都可以找到, 查看和编辑元数据对象。
-
打开**维护**应用项目,找到元数据对象类型 您要修改。
-
在对象列表中,单击右键并选择 共享 设置**。
-
(可选)添加用户或用户组:搜索一个或多个用户 分组并选择它。用户或用户组已添加到列表中。
-
更改要修改的访问组的共享设置。
-
可以编辑和查看:访问组可以查看和编辑 目的。
-
只能查看:访问组可以查看对象。
-
禁止访问(仅适用于**公共访问**):公众 将无法访问该对象。
-
-
更改您要访问的访问组的数据共享设置 修改。
-
可以捕获数据:访问组可以查看和捕获数据 为对象。
-
可以查看数据:访问组可以查看以下数据: 目的。
-
无访问权限:访问组将无法访问以下数据: 物体。
-
-
点击**关闭**。
删除元数据对象
注意
您只能在以下情况下删除数据元素和其他数据元素对象: 没有数据与数据元素本身关联。
警告
从系统删除的所有数据集都将不可避免地丢失。所有 数据输入表格,以及可能已经制定的部分表格 也将被删除。确保您已经备份了您的 数据库,然后删除任何数据集,以防您需要还原它 在某个时间点。
-
打开**维护**应用项目,找到元数据对象类型 您要删除。
-
在对象列表中,单击选项菜单并选择**删除**。
-
点击**确认**。
显示元数据对象的详细信息
-
打开**维护**应用项目,找到元数据对象类型 您想查看。
-
在对象列表中,单击选项菜单,然后选择 显示 细节。
翻译元数据对象
DHIS2提供了用于翻译数据库内容的功能, 示例数据元素,数据元素组,指标,指标组 或组织单位。您可以将这些元素转换为任意数量的 语言环境。地区代表特定的地理,政治或 文化区。
提示
要激活翻译,请打开 System Settings 应用项目,单击 > **外观**并选择一种语言。
-
打开**维护**应用项目,找到元数据对象类型 您要翻译。
-
在对象列表中,单击选项菜单并选择**翻译**。
Tip
If you want to translate an organisation unit level, click directly on the Translate icon next to each list item.
-
选择一个语言环境。
-
输入**名称**、简称**和**说明。
-
点击**保存**。
管理属性
关于属性
您可以使用元数据属性将其他信息添加到 元数据对象。除了每个标准属性 这些对象可能有助于存储其他信息 属性,例如数据元素的收集方法。
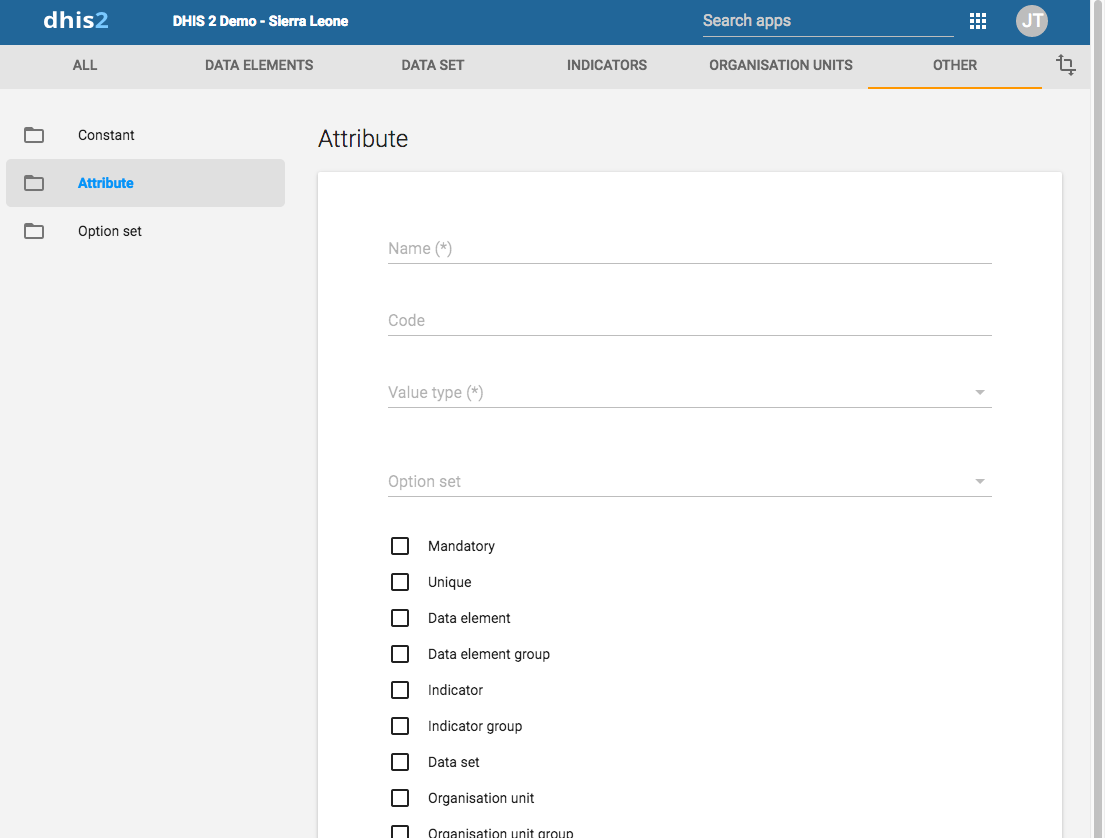
In the Maintenance app, you manage the following attribute objects:
表格:维护应用项目中的属性对象
| CSV元数据导入 { #webapi_csv_metadata_import } | 可用功能 |
|---|---|
| ValidationRuleGroup | 创建、编辑、克隆、删除、查看详情和翻译 |
创建或编辑属性
-
打开**维护**应用项目并点击**属性**。
-
点击添加按钮。
-
在 名称 字段中,输入属性的名称。
每个属性必须具有唯一的名称
-
(可选)在 Code 字段中,分配一个代码。
-
选择**值类型**。
如果为属性提供的值与该值不匹配 键入您将收到警告。
-
选择一个**选项集**。
-
选择所需的选项,例如:
-
选择**强制**如果希望对象始终具有 动态属性。
-
如果希望系统强制要求值必须是**唯一的**,请选择此选项 对于特定的对象类型是唯一的。
-
-
点击**保存**。
动态属性现在可用于您分配的对象 它来。
克隆元数据对象{ #clone_metadata_attributes }
克隆数据元素或其他对象可以在创建时节省时间 许多相似的对象。
-
打开**维护**应用项目,找到元数据对象类型 你想克隆。
-
在对象列表中,单击选项菜单并选择**克隆**。
-
修改所需的选项。
-
点击**保存**。
删除元数据对象
注意
您只能在以下情况下删除数据元素和其他数据元素对象: 没有数据与数据元素本身关联。
警告
从系统删除的所有数据集都将不可避免地丢失。所有 数据输入表格,以及可能已经制定的部分表格 也将被删除。确保您已经备份了您的 数据库,然后删除任何数据集,以防您需要还原它 在某个时间点。
-
打开**维护**应用项目,找到元数据对象类型 您要删除。
-
在对象列表中,单击选项菜单并选择**删除**。
-
点击**确认**。
显示元数据对象的详细信息
-
打开**维护**应用项目,找到元数据对象类型 您想查看。
-
在对象列表中,单击选项菜单,然后选择 显示 细节。
翻译元数据对象
DHIS2提供了用于翻译数据库内容的功能, 示例数据元素,数据元素组,指标,指标组 或组织单位。您可以将这些元素转换为任意数量的 语言环境。地区代表特定的地理,政治或 文化区。
提示
要激活翻译,请打开 System Settings 应用项目,单击 > **外观**并选择一种语言。
-
打开**维护**应用项目,找到元数据对象类型 您要翻译。
-
在对象列表中,单击选项菜单并选择**翻译**。
Tip
If you want to translate an organisation unit level, click directly on the Translate icon next to each list item.
-
选择一个语言环境。
-
输入**名称**、简称**和**说明。
-
点击**保存**。
管理常数
关于常数
常量是可以供用户使用的静态值 在数据元素和指标中。一些指标,例如“夫妇年 保护率”取决于通常不会转换的常数 时间。
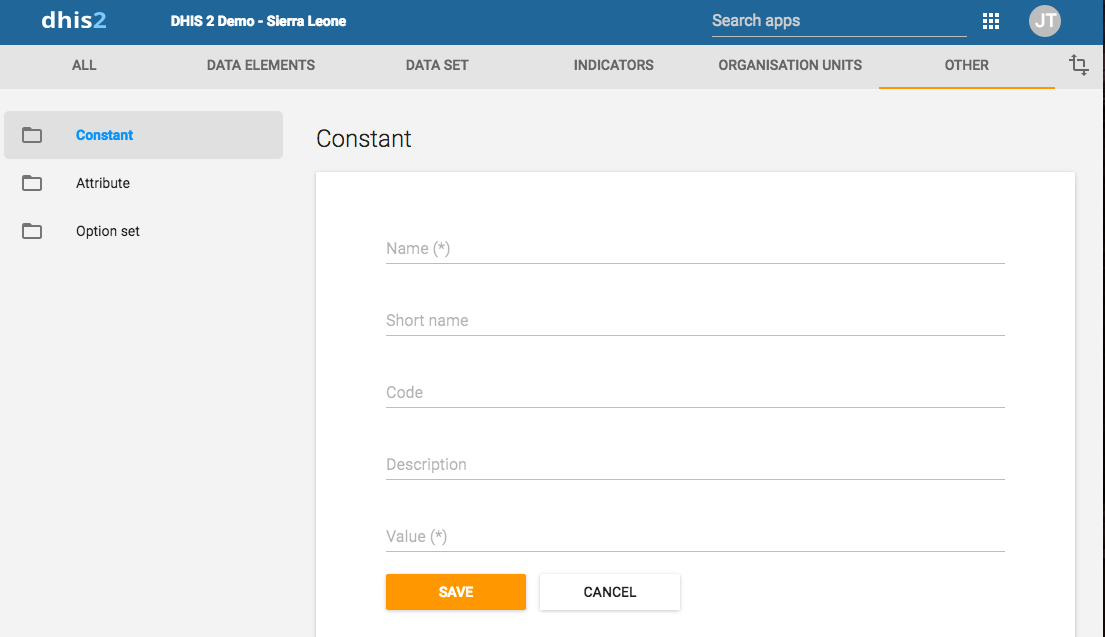
在 维护 应用项目中,您管理以下常量对象:
表格:维护应用项目中的常量对象
| CSV元数据导入 { #webapi_csv_metadata_import } | 可用功能 |
|---|---|
| N{<indicator-id>} | 创建、编辑、克隆、分享、删除、查看详情和翻译 |
创建或编辑常量
-
打开 Maintenance 应用项目,然后单击 Other (> Constant )。
-
点击添加按钮。
-
在 名称 字段中,输入常量的名称。
-
(可选)在**“短名称”**字段中,输入的简写名称为 常数。
-
(可选)在 Code 字段中,分配一个代码。
-
在**描述**字段中,输入简短且内容充实的描述 常数。
-
在 值 字段中,定义常量的值。
-
点击**保存**。
现在可以使用该常数。
克隆元数据对象{ #clone_metadata_constants }
克隆数据元素或其他对象可以在创建时节省时间 许多相似的对象。
-
打开**维护**应用项目,找到元数据对象类型 你想克隆。
-
在对象列表中,单击选项菜单并选择**克隆**。
-
修改所需的选项。
-
点击**保存**。
更改元数据对象的共享设置
您可以为元数据对象分配不同的共享设置,例如 示例组织单位和跟踪的实体属性。这些分享 设置可控制哪些用户和用户组可以查看或编辑 元数据对象。
一些元数据对象还允许您更改共享设置 对象的数据输入。这些附加设置控制谁可以 使用元数据查看或在表单字段中输入数据。
注意
默认设置是所有人(公共访问权限)都可以找到, 查看和编辑元数据对象。
-
打开**维护**应用项目,找到元数据对象类型 您要修改。
-
在对象列表中,单击右键并选择 共享 设置**。
-
(可选)添加用户或用户组:搜索一个或多个用户 分组并选择它。用户或用户组已添加到列表中。
-
更改要修改的访问组的共享设置。
-
可以编辑和查看:访问组可以查看和编辑 目的。
-
只能查看:访问组可以查看对象。
-
禁止访问(仅适用于**公共访问**):公众 将无法访问该对象。
-
-
更改您要访问的访问组的数据共享设置 修改。
-
可以捕获数据:访问组可以查看和捕获数据 为对象。
-
可以查看数据:访问组可以查看以下数据: 目的。
-
无访问权限:访问组将无法访问以下数据: 物体。
-
-
点击**关闭**。
删除元数据对象
注意
您只能在以下情况下删除数据元素和其他数据元素对象: 没有数据与数据元素本身关联。
警告
从系统删除的所有数据集都将不可避免地丢失。所有 数据输入表格,以及可能已经制定的部分表格 也将被删除。确保您已经备份了您的 数据库,然后删除任何数据集,以防您需要还原它 在某个时间点。
-
打开**维护**应用项目,找到元数据对象类型 您要删除。
-
在对象列表中,单击选项菜单并选择**删除**。
-
点击**确认**。
显示元数据对象的详细信息
-
打开**维护**应用项目,找到元数据对象类型 您想查看。
-
在对象列表中,单击选项菜单,然后选择**显示 细节**。
翻译元数据对象
DHIS2提供了用于翻译数据库内容的功能, 示例数据元素,数据元素组,指标,指标组 或组织单位。您可以将这些元素转换为任意数量的 语言环境。地区代表特定的地理,政治或 文化区。
提示
要激活翻译,请打开 System Settings 应用项目,单击 > **外观**并选择一种语言。
-
打开**维护**应用项目,找到元数据对象类型 您要翻译。
-
在对象列表中,单击选项菜单并选择**翻译**。
Tip
If you want to translate an organisation unit level, click directly on the Translate icon next to each list item.
-
选择一个语言环境。
-
输入**名称**、简称**和**说明。
-
点击**保存**。
管理选项集
关于选项集
选项集提供了一个预定义的下拉列表(枚举),用于 DHIS2。您可以定义任何类型的选项。
一个名为“投放类型”的选项集将具有以下选项:“普通”, “违反”,“剖腹产”和“协助”。
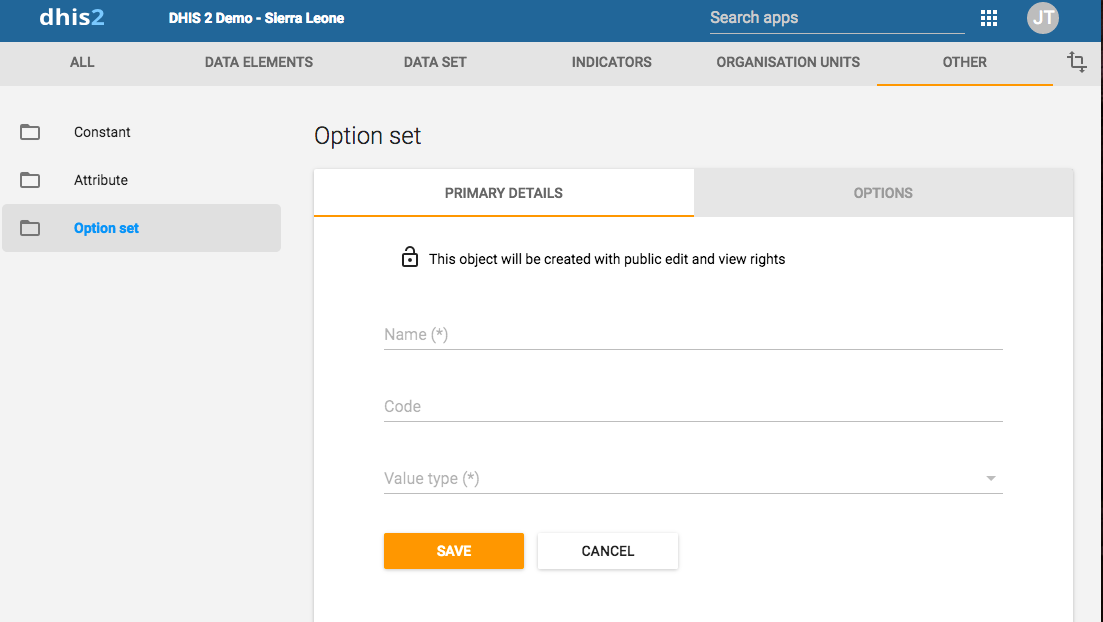
表格维护应用项目中的选项集对象
| CSV元数据导入 { #webapi_csv_metadata_import } | 可用功能 |
|---|---|
| 网址 | 创建、编辑、克隆、分享、删除、查看详情和翻译 |
| 选项组 | 创建、编辑、克隆、分享、删除、查看详情和翻译 |
| 选项组集 | 创建、编辑、克隆、分享、删除、查看详情和翻译 |
创建或编辑选项集
重要
选项集必须具有代码和名称。您可以更改 名称,但是您无法更改代码。所有的名称和代码 选项即使在不同的选项集之间也必须是唯一的。
-
打开**维护**应用项目,点击**其他** (> 选项集)。
-
点击添加按钮。
-
In the Primary details tab, define the option set:
-
在 名称 字段中,输入常量的名称。
-
In the Code field, assign a code.
-
选择**值类型**。
-
点击**保存**。
-
-
对于您需要的每个选项,执行以下任务:
-
Click the Options tab.
-
点击添加按钮。
-
请输入**名称**和**代码**。此外,您还可以选择一个 **颜色**和**图标**将用于此选项 数据捕获应用项目。
-
按名称,代码/值或手动对选项进行排序。
-
点击**保存**。
-
创建或编辑选项组
您可以使用 选项组 来对 选项集 中的 选项 进行分组和分类。 这样,您就可以在选项集中创建一个选项子集。此功能的主要目的是将庞大的选项集过滤为较小且相关的部分。
在**Capture**应用中,通过程序规则可以同时隐藏或显示分组后的选项。
Note
You cannot change the Option set selected in an Option group once it has been created.
-
打开**维护**应用项目,点击**其他** (> 选项组。
-
点击添加按钮。
-
填写表格:
- 名称
- 简称
- 码
- 选项集
-
选择**选项集**后,您可以分配要分组的**选项**。
-
点击**保存**。
创建或编辑选项组集
**选项组集**允许您将多个**选项组**归为一组。 选项组集的主要目的是为捕获的数据添加更多维度以进行分析。
Note
You cannot change the Option set selected in an Option group set once it has been created.
-
打开** Maintenance 应用项目,然后单击 Other ** > ** Option group set **。
-
点击添加按钮。
-
填写表格:
- 名称
- 码
- 描述
- 选项集
-
数据尺寸
如果您选择**数据维度**,该分组集将作为另一个维度供分析使用,除“时间段”和“组织单位”这两个标准维度之外。
-
选择选项组并分配它们。
可用选项组显示在左面板中。当前为选项组集成员的选项组显示在右侧面板中。
- 点击**保存**。
克隆元数据对象{ #clone_metadata_option_sets }
克隆数据元素或其他对象可以在创建时节省时间 许多相似的对象。
-
打开**维护**应用项目,找到元数据对象类型 你想克隆。
-
在对象列表中,单击选项菜单并选择**克隆**。
-
修改所需的选项。
-
点击**保存**。
更改元数据对象的共享设置
您可以为元数据对象分配不同的共享设置,例如 示例组织单位和跟踪的实体属性。这些分享 设置可控制哪些用户和用户组可以查看或编辑 元数据对象。
一些元数据对象还允许您更改共享设置 对象的数据输入。这些附加设置控制谁可以 使用元数据查看或在表单字段中输入数据。
注意
默认设置是所有人(公共访问权限)都可以找到, 查看和编辑元数据对象。
-
打开**维护**应用项目,找到元数据对象类型 您要修改。
-
在对象列表中,单击右键并选择 共享 设置**。
-
(可选)添加用户或用户组:搜索一个或多个用户 分组并选择它。用户或用户组已添加到列表中。
-
更改要修改的访问组的共享设置。
-
可以编辑和查看:访问组可以查看和编辑 目的。
-
只能查看:访问组可以查看对象。
-
禁止访问(仅适用于**公共访问**):公众 将无法访问该对象。
-
-
更改您要访问的访问组的数据共享设置 修改。
-
可以捕获数据:访问组可以查看和捕获数据 为对象。
-
可以查看数据:访问组可以查看以下数据: 目的。
-
无访问权限:访问组将无法访问以下数据: 物体。
-
-
点击**关闭**。
删除元数据对象
注意
您只能在以下情况下删除数据元素和其他数据元素对象: 没有数据与数据元素本身关联。
警告
从系统删除的所有数据集都将不可避免地丢失。所有 数据输入表格,以及可能已经制定的部分表格 也将被删除。确保您已经备份了您的 数据库,然后删除任何数据集,以防您需要还原它 在某个时间点。
-
打开**维护**应用项目,找到元数据对象类型 您要删除。
-
在对象列表中,单击选项菜单并选择**删除**。
-
点击**确认**。
显示元数据对象的详细信息
-
打开**维护**应用项目,找到元数据对象类型 您想查看。
-
在对象列表中,单击选项菜单,然后选择 显示 细节。
翻译元数据对象
DHIS2提供了用于翻译数据库内容的功能, 示例数据元素,数据元素组,指标,指标组 或组织单位。您可以将这些元素转换为任意数量的 语言环境。地区代表特定的地理,政治或 文化区。
提示
要激活翻译,请打开 System Settings 应用项目,单击 > **外观**并选择一种语言。
-
打开**维护**应用项目,找到元数据对象类型 您要翻译。
-
在对象列表中,单击选项菜单并选择**翻译**。
Tip
If you want to translate an organisation unit level, click directly on the Translate icon next to each list item.
-
选择一个语言环境。
-
输入**名称**、简称**和**说明。
-
点击**保存**。
管理图例
关于传说
您可以创建,编辑,克隆,删除,显示详细信息和翻译图例 使您为用户设置的地图有意义。您创建 **地图**应用中的地图。
注意
连续图例必须包含结束和开始的图例项 具有相同值,例如:0-50和50-80。不设置图例 像这样的项目:0-50和51-80。这将在您的图例中造成空白。
创建或编辑图例
注意
不允许在图例中留有空白。
不允许有重复的图例项。
-
打开** Maintenance 应用项目,然后单击 Other ** > ** Legend **。
-
点击添加按钮。
-
In the Name field, type the legend name.
-
(可选)在 Code 字段中,分配一个代码。
-
创建您想在图例中包含的图例项:
-
选择**起始值**和**结束值**。
-
Select Number of legend items.
-
选择一种配色方案。
-
点击**创建图例项**。
Tip
Click the options menu to edit or delete a legend item.
-
-
(可选)添加更多图例项:
-
点击添加按钮。
-
输入名称,然后选择一个开始值,一个结束值和一种颜色。
-
点击**确定**。
-
-
(可选)更改色阶。
-
单击色阶以查看色阶选项列表, 并选择一个色标。
-
要自定义色标,请单击添加按钮。在**编辑 图例项**对话框,单击色阶按钮并手动选择 颜色,或输入您的颜色值。
-
-
点击**保存**。
| 图例项 | 初始值 | 终值 |
|---|---|---|
| 低 差 | 0 | 50 |
| 中 | 50 | 80 |
| 非常好 | 80 | 100 |
| 太高了 | 100 | 1000 |
克隆元数据对象{ #clone_metadata_legends }
克隆数据元素或其他对象可以在创建时节省时间 许多相似的对象。
-
打开**维护**应用项目,找到元数据对象类型 你想克隆。
-
在对象列表中,单击选项菜单并选择**克隆**。
-
修改所需的选项。
-
点击**保存**。
更改元数据对象的共享设置
您可以为元数据对象分配不同的共享设置,例如 示例组织单位和跟踪的实体属性。这些分享 设置可控制哪些用户和用户组可以查看或编辑 元数据对象。
一些元数据对象还允许您更改共享设置 对象的数据输入。这些附加设置控制谁可以 使用元数据查看或在表单字段中输入数据。
注意
默认设置是所有人(公共访问权限)都可以找到, 查看和编辑元数据对象。
-
打开**维护**应用项目,找到元数据对象类型 您要修改。
-
在对象列表中,单击右键并选择 共享 设置**。
-
(可选)添加用户或用户组:搜索一个或多个用户 分组并选择它。用户或用户组已添加到列表中。
-
更改要修改的访问组的共享设置。
-
可以编辑和查看:访问组可以查看和编辑 目的。
-
只能查看:访问组可以查看对象。
-
禁止访问(仅适用于**公共访问**):公众 将无法访问该对象。
-
-
更改您要访问的访问组的数据共享设置 修改。
-
可以捕获数据:访问组可以查看和捕获数据 为对象。
-
可以查看数据:访问组可以查看以下数据: 目的。
-
无访问权限:访问组将无法访问以下数据: 物体。
-
-
点击**关闭**。
删除元数据对象
注意
您只能在以下情况下删除数据元素和其他数据元素对象: 没有数据与数据元素本身关联。
警告
从系统删除的所有数据集都将不可避免地丢失。所有 数据输入表格,以及可能已经制定的部分表格 也将被删除。确保您已经备份了您的 数据库,然后删除任何数据集,以防您需要还原它 在某个时间点。
-
打开**维护**应用项目,找到元数据对象类型 您要删除。
-
在对象列表中,单击选项菜单并选择**删除**。
-
点击**确认**。
显示元数据对象的详细信息
-
打开**维护**应用项目,找到元数据对象类型 您想查看。
-
在对象列表中,单击选项菜单,然后选择 显示 细节。
翻译元数据对象
DHIS2提供了用于翻译数据库内容的功能, 示例数据元素,数据元素组,指标,指标组 或组织单位。您可以将这些元素转换为任意数量的 语言环境。地区代表特定的地理,政治或 文化区。
提示
要激活翻译,请打开 System Settings 应用项目,单击 > **外观**并选择一种语言。
-
打开**维护**应用项目,找到元数据对象类型 您要翻译。
-
在对象列表中,单击选项菜单并选择**翻译**。
Tip
If you want to translate an organisation unit level, click directly on the Translate icon next to each list item.
-
选择一个语言环境。
-
输入**名称**、简称**和**说明。
-
点击**保存**。
将图例分配给指标或数据元素
您可以将图例分配给指标或数据元素 维护**应用项目,在您创建对象或编辑它时。什么时候 然后,您在 **Maps 应用项目中选择指标或数据元素, 系统自动选择指定的图例。
也可以看看
管理预测变量
关于预测变量
预测变量定义如何从表达式生成聚合数据值 包含汇总和/或事件数据。预测值可以基于:
-
来自与预测值相同时期的数据,和/或
-
来自预测值之前期间的数据
同期数据
预测器可以使用与预测值相同周期的数据。 例如,您可以计算具有 通过使用预测器表达式,例如:数据元素的非零值:
if(#{ji7o0ILHuU2}!= 0,1,0) 当您在数据收集所在的组织单位级别运行此预测器时, 如果该数据元素在该组织单位下的值为 非零,则会将 1 存储为预测值;否则存储 0。 (如果用于预测的数据元素不存储零值,则 为节省空间,数据库中将不会存储零值。) 随后,您可以在更高层级的 组织单位中,通过分析功能对该预测值进行求和,以统计报告中 每个组织单位下具有非零值的组织单位数量。
前期数据
当您指定汇总时,预测变量将使用以前期间的数据 函数,例如sum()或avg()。例如,以下生成器表达式 标识一个值,该值是平均值加上标准偏差的两倍 前期数据:
avg(#{ji7o0ILHuU2})+ 2 * stddev(#{ji7o0ILHuU2}) 上一时期的数据
预测变量表达式可以访问与 通过访问两个 汇总函数(针对先前期间),以及任何汇总函数之外 (同一时期)。例如,如下所示的表达式可以是 用来平衡上一时期(#{KOh02hHko7C}) 加上此期间的净变化(#{ji7o0ILHuU2}), 得出此期间的余额:
sum(#{KOh02hHko7C})+#{ji7o0ILHuU2} 第一个数据值在聚合表达式(总和)内,以指示 它正在采样前一时期的数据(即使只有一个前一时期), 而第二个数据值不在聚合函数中以表明它 正在引用同一时期的数据。
如果需要,可以在同一引用中引用预测变量的输出数据元素 预测变量的表达。例如,此示例中的表达式可以 用于预测一段时间内的余额,然后将该值与 下一个期间的变化以计算下一个期间的余额。 当预测变量跨多个期间运行时,将在以下期间处理这些期间 按时间顺序排列,可以使用较早时期的结果 作为以后的输入。
预测器组织单位级别
您需要为预测变量的输出选择一个或多个组织单位级别。 预测变量生成的所有值都存储在组织单位的 您选择的级别。预测变量表达式中的每个项目都是值的总和 为该组织单位存储的信息(如果有的话)以及组织中存储的所有值 低于该单位(如果有)的单位。
注意
在配置预测变量时,必须选择一个或多个组织单位级别 将输出预测数据。如果未选择任何级别,则不会预测 将生成值。
警告
如果您想在分析报告中使用预测值或 其他预测,请勿选择多个组织单位级别。 当您选择多个级别时,较高级别的预测将 还包括在较低级别的预测中使用的任何数据。如果预测 随后从多个级别将其用于分析或表达式中 其他预测变量,这可能会导致重复计算,因为 较高级别的值包括较低级别的预测值。
如果使用预测的组织单位级别,则可以选择多个组织单位级别 值仅在验证规则中。例如在疾病监测中,您 如果实际值高于 根据上一期间数据得出的该期间的期望值范围。 为此,您可以创建一个预测变量以计算平均值加上两倍的 前期数据的标准偏差。您可以使用验证 将该最高期望值与实际值进行比较的规则。 您可以在多个级别上运行预测变量和验证规则 以检测不同的爆发情况。在一种情况下,可能会有 一个设施的显着增加超出了预期范围,但是 包含该设施的地区可能不会超出其预期范围 因为地区价值与许多其他设施结合在一起。 但在另一种情况下, 设施不超出每个设施的预期范围(因为 每个设施的标准偏差可能很高),但确实超过了 该地区的预期范围(因为 整个地区的标准偏差可能会更低)。
如果要生成多个级别的预测,则还可以 在不同级别使用不同的预测变量。例如,您可能想要 如果某一级别的值超过平均值再加上标准的两倍,则会收到警报 偏差,但如果超出平均值加1.8倍,则会在另一个级别发出警报 标准偏差。如果需要,可以配置不同的预测变量 具有相同的输出数据元素。如果您使用相同的输出数据元素, 这仍然适用于不同组织单位级别的有效规则, 但您也必须注意不要在分析或其他结果中使用结果 预测器计算以避免重复计算。
In the Maintenance app, you manage the following predictor objects:
表格维护应用项目中的预测对象
| CSV元数据导入 { #webapi_csv_metadata_import } | 可用功能 |
|---|---|
| 选项 | 创建、编辑、克隆、删除、查看详情和翻译 |
抽样前期
预测变量可以生成过去一段时间的数据值, 现在或将来。这些值基于预测期间的数据, 和/或来自预测时期之前的时期的采样数据。
如果您只需要进行预测的同一时期的数据, 那么您无需阅读本节。本节介绍如何 从预测周期之前的周期中采样数据。
顺序样本计数
预测变量的*顺序样本计数*指定了需要采样的 紧邻先前周期的数量。例如,如果预测变量的周期类型为 每周,且*顺序采样计数*为4,则表示需采样 预测值所在周之前紧邻的四个星期。因此, 第9周的预测值将使用第5、6、7和8周的样本:

如果预测变量的周期类型是* Monthly 和 Sequential sample count *为4,这意味着立即采样前四个月 在预测值月份之前。所以五月的预测值 将使用一月,二月,三月和四月的样本:

“连续采样次数”可以大于一年中的周期数。 例如,如果您想对预测值所在月份之前的 24个月进行采样,请将“连续采样次数” 设置为24:

顺序跳过计数
预测变量的*顺序跳过计数*指在 *顺序样本数*范围内,应跳过多少个时间段。例如,在疫情 监测中,这可用于跳过一个或多个紧邻预测值之前的时间段,因为这些时间段 实际上可能包含您 正试图检测的疫情起始阶段的数值。
例如,如果*连续采样计数*为4,但*连续 跳过计数*为2,那么在 预测周期之前的两个采样点将被跳过,结果只有两个周期被 采样:

年度样本数
预测变量的*年度样本数量*指应从过去多少个年份中 采集样本,且采集时间需与当前年份的同一时间点一致。例如, 当某种疾病的预期发病率在一年中有所波动,且最适宜 与往年同期进行比较时,该指标 可用于疾病监测。 例如, 如果*年度样本计数*为2(且*顺序样本计数*为 零),则将从紧接在前 两年的同期采集样本。

顺序和年度样本计数一起
您可以将序列采样和年度采样结合使用,以收集 过去数年间多个连续时段的样本。 这样做时,系统将在过去几年中,于与预测值期间 相同的时间点采集样本,同时 还会根据*顺序样本计数*的数值, 在该时间点之前和之后的过去几年中采集样本。
例如,如果*顺序样本数*为4,而*年度 样本数*为2,则将从预测值时段之前的4个时段 中采集样本。此外,还将 从前2年对应时段以及 该时段前后各4个时段中采集样本:

顺序,年度和跳过样本计数一起
您可以将*顺序跳过计数*与顺序和 年度样本计数结合使用。此时,顺序跳过计数 表示在与预测值 所属期间同一年度内应跳过多少个期间。 例如,如果 顺序抽样计数 为 4,且 顺序跳过计数 为 2,则预测值时段 之前的两个期间将被跳过,但那两个期间 之前的两个期间将被抽样:

如果 顺序跳过计数 等于或大于 顺序采样计数,则不会对包含预测值时段的 该年进行采样;仅对过去各年的 时段进行采样:

样品跳过测试
您可以使用* Sample skip test *(样本跳过测试)来跳过某些时段的样本 根据测试结果, 在那些时期内表达。例如,可以在 疾病暴发检测,样本跳过测试可以识别 以前的疾病暴发,将那些样本从预测中排除 非爆发基准期望值。
- Sample skip test *是一个应返回值的表达式 是或否,表示是否应跳过该时间段。 它可以是一个测试上一时期中任何数据值的表达式。 例如,它可以测试是否有明确输入的数据值 表示应跳过上一个期间。或者可以 将一段时间内的先前预测值与实际值进行比较 记录该时间段,以确定是否应跳过该时间段。
*样本跳过测试*为*真*的任何时期都不会 采样。例如:

预测变量与类别选项组合(细分){ #predictors-and-category-option-combinations-disaggregations }
预测变量输出数据的类别选项组合(分解) 可通过以下三种方式之一进行选择:
- 默认的类别选项组合。
如果预测变量的输出数据元素没有细分(类别组合为“无”, (也称为默认类别组合),那么所有预测变量的输出数据都将以 默认的类别选项组合。在这种情况下,预测变量的输出数据不会被细分。
- 修复了分类选项的组合问题
如果预测变量的输出数据元素的类别组合不是“无”,则可以 为预测变量“输出类别下拉菜单”选择一个固定的分解方式。如果这样做, 该预测模型生成的所有输出都将包含这一类别选项组合。
例如,如果输出数据元素的类别组合为“性别和年龄”,则可以 决定将所有预测变量的输出映射到一个类别选项组合,例如“5岁以下女性”, “5–10号公螺”,或其他任何规格。
- 使用“输入类别”下拉菜单(v40.1及后续版本中提供)
如果预测变量的输出数据元素的类别组合不是“无”,您可以选择 将“根据输入类别选项下拉列表进行预测”设为“输出类别选项下拉列表”的值。 如果这样做,输出数据元素中的每个类别选项组合都会得到不同的预测结果。 类别组合(即,一个预测为“5岁以下女性”,另一个预测为“5岁以下男性”, “5至10岁女性”占三分之一,以此类推)。
(在 v40.1 版本中,通过在“输出类别选项下拉菜单”中选择“\<no value> ”即可启用此功能。)
> **Tip**
>
> In some installations, the options in a category may have changed over time.
For example, a category "Age" may have had three options "1-5", "6-10", and "over 10",
but then was changed to only have two options "10 and under" and "over 10".
Historical data may have values with any of these options.
To use a predictor with such data, you can define another category
such as "Reporting Age" with all the options ever used, such as "1-5", "6-10",
"10 and under", and "over 10". Use this category in the category combination
for the predictor's output data element. This means that all the input category
options will be reflected in the output.
>
> If you then want a single report for the output data that covers
all the disaggregations, you can use category option groups
in a category option group set. For example use a category option group
"10 and under" that contains category options "1-5", "6-10", and "10 and under".
预测变量与属性选项的组合{ #predictors-and-attribute-option-combinations }
如果预测的输入数据包含属性选项组合,则对于每个存在数据的属性选项组合, 系统都会生成不同的预测结果。
例如,您可以使用属性选项组合来表示系统中的不同项目。 当预测器找到项目 A 的输入数据时,它会生成一个采用项目 A 属性选项组合的值; 当它找到项目 B 的输入数据时,则会生成一个采用项目 B 属性选项组合的值; 以此类推。
对于任何未包含属性选项组合的输入数据(换言之,采用 默认属性选项组合的数据),将使用默认 属性选项组合生成预测结果。如果您在数据中未使用属性选项组合, 则预测输出数据中也不会使用这些组合。
如果您同时使用了属性选项组合和“根据输入类别选项组合进行预测”功能, 则每个细分方式与属性选项组合的组合都将生成一个独立的预测结果。 例如,可能会针对项目 A 的“5 岁以下女性”数据生成一个预测结果,针对 项目 A 的“5 岁以下男性”数据生成一个预测结果,针对项目 B 的“5 岁以下女性”数据生成一个预测结果,以此类推。
创建或编辑预测变量
-
打开** Maintenance 应用项目,然后单击 Other ** > ** Predictor **。
-
点击添加按钮。
-
In the Name field, type the predictor name.
-
(可选)在 Code 字段中,分配一个代码。
-
(可选)输入**说明**。
-
选择一个 输出数据元素。由该元素生成的值 预测变量存储为与此数据关联的聚合数据 元素和预测周期。
该值根据数据的值类型四舍五入 元素:如果值类型是整数类型,则预测值 舍入到最接近的整数。对于所有其他值类型, 数字四舍五入到四位有效数字。 (但是,如果有 小数点左边多于四位数,它们不是 替换为零。)
-
(可选)选择一个**“输出类别”下拉菜单**。此下拉菜单仅会显示 如果所选数据元素的类别组合不是“无”。 如果是这样,您可以选择希望输出到哪个细分类别选项下拉列表中, 或者,您可以选择“根据输入类别下拉菜单进行预测”选项(参见上文讨论)。
-
Select a Period type.
-
指定一个或多个**组织单位级别**。输出值将为 分配给此级别(或这些级别)的组织单位。 对于**汇总**数据,输入值取决于下方的选择;即**提供数据的组织单位**。 对于基于**跟踪器**的数据,输入值将来自该数据所属的组织单位, 分配了输出,或从输出下方的任何较低级别进行分配 组织单位。
-
**提供数据的组织单位**控制着**汇总**数据的输入值来源。如果选择“仅限所选级别”,则仅包含所选级别的组织单位。 如果选择“在所选层级及以下所有层级”,则不仅包括所选层级的组织单位,还包括其下属的所有组织单位。
-
创建一个**生成器**。生成器是用于计算预测值的表达式。
-
Type a Description of the generator expression.
-
Select a Missing value strategy. This selection sets how the system evaluates a validation rule if data is missing.
选项 说明 若有任何值缺失则跳过 如果构成该表达式的任何值缺失,则将跳过该验证规则。这是默认选项。
如果您使用 排他配对 或 强制配对 运算符,请始终选择此选项。如果所有值均缺失,则跳过 仅当组成该值的所有值均缺失时,才跳过验证规则。 永不跳过 如果缺少数据,将永远不会跳过验证规则,并且所有缺失值都将被有效地视为零。 -
输入生成器表达式。您可以通过选择聚合数据的数据元素或项目数据元素,属性或指标来构建表达式。尚不支持组织单位计数。
要使用过去的采样数据,应将选择的所有项目包含在以下聚合函数之一中(请注意,这些函数名区分大小写):
聚合函数 均值 avg(x) x 的平均值(均值) count(x) x 的取值个数 max(x) x 的最大值 median(x) x 的中位数 min(x) x 的最小值 percentileCont(p, x) x 的连续分位数,其中 p 是介于 0 和 1 之间的浮点数,表示分位数。 例如,p = 0 将返回最小值,p = 0.5 将返回中位数,p = 0.75 将返回第 75 百分位数,p = 1 将返回最大值,以此类推。连续意味着在必要时会对该值进行插值。 例如,如果数据元素 FTRrcoaog83 的采样值为 1、2、3 和 4,则 percentileCont( 0.5, #{FTRrcoaog83} ) 将返回 2.5。 stddev(x) x 的标准差。该函数与 stddevSamp 功能相同。为使代码更清晰,建议改用 stddevSamp 函数。 stddevPop(x) x 的总体标准差:sqrt( sum( (x - avg(x))^2 ) / n ) stddevSamp(x) x 的样本标准差:sqrt( sum( (x - avg(x))^2 ) / ( n - 1 ) )。请注意,当只有一个样本时不会计算此值。 sum(x) x 的各值之和 Note
Any items inside an aggregate function will be evaluated for all sampled past periods, and then combined according to the formula inside the aggregate function. Any items outside an aggregate function will be evaluated for the period in which the prediction is being made.
您可以通过单击(或 输入)表达式字段下方的任何元素: () * / +-天数。 可以通过键入常数来添加常数。那些日子 选项将 [days ]插入到解析为 数据来源期间的天数。
您还可以在您的计算机中使用以下非聚合函数 表达式,在聚合函数内部或包含 聚合函数,或独立于聚合函数:
函数 含义 contains(expr, sub1, ...) 在表达式中搜索一个或多个子字符串。 如果表达式包含所有子字符串,则返回 true。例如,以下表达式均返回 true:contains("abcd", "abcd");contains("abcd", "b");以及 contains("abcd", "ab", "bc")。 比较操作区分大小写。 containsItems(expr, item1, ...) 在表达式中搜索一个或多个项目。该表达式由逗号分隔的元素组成。如果每个项目都与表达式中的某个元素完全匹配,则 containsItems 返回 true。 例如,containsItems("abcd", "abcd") 和 containsItems("ab,cd", "ab", "cd") 返回 true,但 containsItems("abcd", "b") 和 containsItems("abcd", "ab", "bc") 则返回 false。比较操作区分大小写。containsItems 也可用于多值数据元素,以检查某项是否包含在该数据元素的值中。 if(test, valueIfTrue, valueIfFalse) 求值 test,该表达式应返回布尔值——请参阅下方的 布尔表达式说明。如果测试结果为 true,则返回 valueIfTrue 表达式。 如果 test 为 false,则返回 valueIfFalse 表达式。 is(expr1 in expression [, expression ...]) 如果 expr1 等于以下任一表达式,则返回 true;否则返回 false。 isNull(item) 如果 item 为空(缺失),则返回布尔值 true;否则返回 false。item 可以是右侧选定的任何项目(数据元素、程序数据元素等)。 isNotNull(item) 如果 item 的值不缺失(不为空),则返回 true,否则返回 false。 firstNonNull(item [, item ...]) 返回第一个不缺失(不为空)的 item 的值。 可提供任意数量的参数。任何参数也可以是数值或字符串字面量,如果所有前面的项都有缺失值,则返回该参数的值。 greatest(expression [, expression ...]) 返回给定表达式中的最大(最高)值。可提供任意数量的参数。 least(表达式 [, 表达式 ...]) 返回给定表达式中的最小(最低)值。可提供任意数量的参数。 log(表达式 [, 底数 ]) 返回数值表达式的自然对数(底数为 e)。 如果将一个整数作为第二个参数,则返回以该底数计算的对数。 log10(表达式) 返回数值表达式的常用对数(底数为 10)。 normDistCum(x [,均值 [,标准差]]) 根据由均值和标准差描述的归一化分布,返回 x 的累积分布函数 (CDF) 值。等同于 Excel 的 NORM.DIST(x,mean,stddev,TRUE) 或 LibreOffice 的 NORMDIST(x,mean,stddev,1)。 如果未指定 stddev,则根据 x 的历史采样值计算。如果既未指定 mean 也未指定 stddev,则根据 x 的历史采样值计算。参见示例。 normDistDen(x [,mean [,stddev]]) 返回给定均值和标准差所描述的归一化分布下,x 的概率密度函数 (PDF) 值。等同于 Excel 的 NORM.DIST(x,mean,stddev,FALSE) 或 LibreOffice 的 NORMDIST(x,mean,stddev,0)。 如果未提供标准差,则根据 x 的先前采样值计算。如果既未提供均值也未提供标准差,则根据 x 的先前采样值计算。参见示例。 null 不返回结果。 例如,if( #{FH8ab5Rog83}<0, null, 1 ) 若数据元素值小于 0 则返回空值,否则返回 1。 orgUnit.ancestor(orgUnitUid [, orgUnitUid ...]) 如果该组织单位是(一个或多个)组织单位的后代,则返回 true;否则返回 false。 orgUnit.dataSet(dataSetUid [, dataSetUid ...]) 如果该组织单位被分配给(1 个或多个)数据集中的任意一个,则返回 true;否则返回 false。 orgUnit.group(ouGroupUid [, ouGroupUid ...]) 如果该组织单位是(1 个或多个)组织单位组中的任何一个的成员,则返回 true,否则返回 false。 orgUnit.program(programUid [, programUid ...]) 如果该组织单位被分配给任意一个(一个或多个)项目,则返回 true;否则返回 false。 removeZeros(expression) 如果表达式值为 0,则不返回任何结果;否则返回表达式值。 .maxDate(yyyy-mm-dd) 对于数据元素(非项目数据),返回结束日期在最大日期或之前的时间段内的值。 .minDate(yyyy-mm-dd) 对于数据元素(非项目数据),返回开始日期在最小日期或之后的时间段内的值。 布尔表达式说明: 布尔表达式必须计算结果为 true 或 false。可使用以下运算符 比较两个值以生成布尔表达式:\<, >, !=, ==, >= 和 \<=。 可使用以下运算符 组合两个布尔表达式:&& 或关键字 and(逻辑与),以及 || 或关键字 or (逻辑或)。 可以使用一元运算符 ! 或关键字 not 来取反一个 布尔表达式。
生成器表达式示例:
生成器表达式 含义 sum(#{FTRrcoaog83.tMwM3ZBd7BN}) 数据元素 FTRrcoaog83 与类别选项组合(细分)tMwM3ZBd7BN 的采样值之和 avg(I{GSae40Fyppf}) + 2 * stddevSamp(I{GSae40Fyppf}) 项目指标 GSae40Fyppf 的抽样值平均值加上其抽样标准差的两倍 sum(D{IpHINAT79UW.eMyVanycQSC}) / sum([days]) 程序 IpHINAT79UW 中数据元素 eMyVanycQSC 的所有采样值之和除以所有采样时段的天数(得出总体日均值) sum(#{FTRrcoaog83}) + #{T7OyqQpUpNd} 数据元素 FTRrcoaog83 的所有采样值之和,加上在被预测期间内数据元素 T7OyqQpUpNd 的值 (包含所有细分) 1.2 * A{IpHINAT79UW.RKLKz1H20EE} 程序 IpHINAT79UW 在所预测期间内属性 RKLKz1H20EE 值的 1.2 倍 if(isNull(#{T7OyqQpUpNd}), 0, 1) 若数据元素 T7OyqQpUpNd 在预测期间为空,则为 0,否则为 1 if(is(#{jeiTh8ahyae} in 'NEGATIVE','UNKNOWN'), 0, 1) 如果数据元素 jeiTh8ahyae 的值为 'NEGATIVE' 或 'UNKNOWN',则为 0,否则为 1 percentileCont(0.5, #{T7OyqQpUpNd}) 数据元素 T7OyqQpUpNd 的采样值的连续第 50 百分位数。请注意,这与 median(#{T7OyqQpUpNd}) 相同 if(count(#{T7OyqQpUpNd}) == 1, 0, stddevSamp(#{T7OyqQpUpNd})) 若数据元素 T7OyqQpUpNd 仅有一个样本值,则返回 0;否则返回这些样本值的样本标准差。(请注意,如果没有样本,则 stddevSamp 不返回任何值,因此不会进行预测。) normDistCum(#{T7OyqQpUpNd}) 基于数据元素 T7OyqQpUpNd 过去采样期间的均值和标准差所定义的归一化分布,计算该数据元素当前期间值的累积分布函数 normDistCum( #{T7OyqQpUpNd}, median(#{T7OyqQpUpNd}) ) 基于数据元素 T7OyqQpUpNd 过去采样期间的中位数(而非均值)和标准差所定义的分布,计算该数据元素当前期间值的累积分布函数 normDistCum( #{T7OyqQpUpNd}, median(#{T7OyqQpUpNd}) ) 基于数据元素 T7OyqQpUpNd 过去抽样期间的中位数(而非均值)和标准差所定义的分布,计算该数据元素当前期间值的累积分布函数 normDistCum( #{T7OyqQpUpNd}, avg(#{T7OyqQpUpNd}), stddev(#{T7OyqQpUpNd}) ) 与 normDistCum( #{T7OyqQpUpNd} ) 相同 normDistDen( #{T7OyqQpUpNd}, avg(#{IKahz1Quie3}), stddev(#{IKahz1Quie3}) ) 基于数据元素 IKahz1Quie3 过去采样期间的均值和标准差所定义的分布,计算数据元素 T7OyqQpUpNd 当前期间值的概率密度函数 normDistDen( median(#{T7OyqQpUpNd}), avg(#{IKahz1Quie3}), stddev(#{IKahz1Quie3}) ) 基于数据元素 IKahz1Quie3 过去采样时段的均值和标准差所定义的分布,数据元素 T7OyqQpUpNd 过去采样值的中位数的概率密度函数 #{T7OyqQpUpNd}.minDate(2022-10-1) 2022年10月1日或之后的值 #{T7OyqQpUpNd}.maxDate(2022-12-31) 2022年12月31日或之前的值 #{T7OyqQpUpNd}.minDate(2022-10-1).maxDate(2022-12-31) 2022年10月1日至2022年12月31日之间的值
-
-
(可选)创建一个**示例跳过测试**。该示例跳过测试说明 从样本中排除哪个先前时段(如果有)。
-
Type a Description of the skip test.
-
输入样本跳过测试表达式。您可以建立 通过选择用于聚合数据的数据元素来表达,或 项目数据元素,属性或指标。组织 尚不支持单位计数。与发电机一样 功能,您可以单击(或键入)以下任何元素 表达式字段:() * / +-天。
上述针对生成器表达式的非聚合函数也可以使用 在跳过测试中。
该表达式的计算结果必须为布尔值** true 或 **false。参见上文的**布尔表达式说明**。
跳过测试表达式示例:
跳过测试表达式 均值 #{FTRrcoaog83} > #{M62VHgYT2n0} 数据元素 FTRrcoaog83 的值(所有细分项之和)大于数据元素 M62VHgYT2n0 的值(所有细分项之和) #{uF1DLnZNlWe} > 0 数据元素 uF1DLnZNlWe(所有细分项之和)的值大于零 # > 0 数据元素 uF1DLnZNlWe(所有细分项之和)的值大于零
-
-
Enter a Sequential sample count value.
这是计算应该进行多少个连续周期 及时返回样本数据进行计算。
-
Enter an Annual sample count value.
这是计算应该追溯到多少年 用于计算的样本数据。
-
(Optional) Enter a Sequential skip count value.
这是紧接在 采样值之前,应跳过预测值周期。
-
点击**保存**。
Data Element Group 的预测{ #predictions_by_data_element_group }
您可以使用一个预测因子来处理组中的所有数据元素,而无需为每个数据元素分别使用不同的预测因子。例如,在物流管理中,当每个商品对应一个数据元素,且与该商品相关的每个计数都采用一种类别选项组合时,即可采用这种方法。
语法如下:
forEach ?de in :DEG:degUid --> 主表达式
其中:
| 部分 | 自定义查询。 |
|---|---|
| forEach | 表达式开头必须包含该关键字 |
| ?de | 任何以“?”开头、随后跟一个字母、之后可选跟任意数量的其他字母或数字(区分大小写)的变量名。示例:?de、?X、?dataElement 等。 |
| 描述 | 必填关键词 |
| :DEG:degUid | 符号 :DEG:,后跟包含待处理数据元素的数据元素组的 UID |
| -> | 在主表达式之前必须出现 |
| 主要表达式 | 用于对组中每个数据元素进行运算的表达式。在此表达式中,请使用变量名(例如 ?de)作为每个数据元素的占位符 |
对于数据元素组中的每个数据元素,预测器都会执行一次。 对于每个数据元素,主表达式中该变量的实例将被该数据元素替换。该数据元素也将用作预测器的输出数据元素。 预测值将使用配置的输出类别选项组合写入该数据元素。
预测器必须配置一个输出数据元素,但在运行预测器时,该数据元素实际上会被忽略。 建议您使用预测器将要使用的数据元素组中的某个数据元素来配置该预测器。 这样,您就可以为该数据元素选择一个有效的输出类别选项组合。
在创建预测器时,数据元素组中必须至少包含一个您将要使用的类型的数据元素。(在对预测器进行语法检查时,会用到该数据元素的数据类型。)
示例 1{ #example-1 }
您有一些代表各种商品的数据元素,它们都属于一个数据元素组,该组的UID为aIMu0nieph7 。
您拥有以下 UID 的分类选项组合:
| 类别选项下拉菜单 | 自定义查询。 |
|---|---|
Gvoecom5muL | 期初库存余额 |
CWa6eew5uco | 期间内补货 |
nthohhie8Ba | 经期使用 |
Faey8Iphooy | 在该期间内丢失、损坏、过期或被盗 |
以下预测器生成器表达式将按以下公式计算下一期间初的库存余额:(期初余额 + 补货量 - 消耗量 - 损耗量):
forEach ?de in :DEG:aIMu0nieph7 -->
sum( #{?de.Gvoecom5muL} + #{?de.CWa6eew5uco} - #{?de.nthohhie8Ba} - #{?de.Faey8Iphooy} )
预测模型的配置包括:
| MCC | 日期时间 |
|---|---|
| 输出数据元素 | 该组中的一个数据元素 |
| 输出类别下拉菜单 | 期初库存余额(Gvoecom5muL ) |
| 提供数据的组织单位 | 仅限特定级别 |
| 顺序样本计数 | 1 |
| 年度样本数 | 0 |
预测器将针对数据元素组中的每个数据元素执行一次。由于预测器生成表达式中使用了聚合函数sum() ,因此表达式中的所有值都将从上一期间获取(因为顺序样本计数为 1)。 该预测器将为所选层级的组织单位,在预测器运行起止日期范围内的各期间,写出每个数据元素的期初余额。
预测总是面向未来进行的。某一期间预测的期初余额可作为输入,用于计算下一期间的期初余额。
示例 2{ #example-2 }
如果你想对与输入数据相同的期间进行预测,只需省略聚合函数,例如:sum() 。在之前的示例基础上,假设你还有另一组类别选项组合,用于计算该期间内的净库存变动:
| 类别下拉菜单 | 自定义查询。 |
|---|---|
Hpiek8IefoS | 期内库存变动 |
您可以使用以下表达式计算库存变动量,即(补货 - 消耗 - 损耗):
forEach ?de in :DEG:aIMu0nieph7 -->
#{?de.CWa6eew5uco} - #{?de.nthohhie8Ba} - #{?de.Faey8Iphooy}
输出类别下拉列表选项如下:
| MCC | 日期时间 |
|---|---|
| 输出类别下拉菜单 | 期内库存变动情况(Hpiek8IefoS ) |
由于表达式中的各项周围没有诸如sum() 之类的聚合函数,因此输入数据取自与预测变量输出相同的期间。
创建或编辑预测变量组
-
打开** Maintenance 应用项目,然后单击 Other ** > ** Predictor 组**。
-
点击添加按钮。
-
Type a Name. This field needs to be unique.
-
(可选)在**代码**字段中,分配一个代码。该字段需要 独一无二。
-
(可选)输入**说明**。
-
Double-click the Predictors you want to assign to the group.
-
点击**保存**。
克隆元数据对象{ #clone_metadata_groups }
克隆数据元素或其他对象可以在创建时节省时间 许多相似的对象。
-
打开**维护**应用项目,找到元数据对象类型 你想克隆。
-
在对象列表中,单击选项菜单并选择**克隆**。
-
修改所需的选项。
-
点击**保存**。
删除元数据对象
注意
您只能在以下情况下删除数据元素和其他数据元素对象: 没有数据与数据元素本身关联。
警告
从系统删除的所有数据集都将不可避免地丢失。所有 数据输入表格,以及可能已经制定的部分表格 也将被删除。确保您已经备份了您的 数据库,然后删除任何数据集,以防您需要还原它 在某个时间点。
-
打开**维护**应用项目,找到元数据对象类型 您要删除。
-
在对象列表中,单击选项菜单并选择**删除**。
-
点击**确认**。
显示元数据对象的详细信息
-
打开**维护**应用项目,找到元数据对象类型 您想查看。
-
在对象列表中,单击选项菜单,然后选择 显示 细节。
翻译元数据对象
DHIS2提供了用于翻译数据库内容的功能, 示例数据元素,数据元素组,指标,指标组 或组织单位。您可以将这些元素转换为任意数量的 语言环境。地区代表特定的地理,政治或 文化区。
提示
要激活翻译,请打开 System Settings 应用项目,单击 > **外观**并选择一种语言。
-
打开**维护**应用项目,找到元数据对象类型 您要翻译。
-
在对象列表中,单击选项菜单并选择**翻译**。
Tip
If you want to translate an organisation unit level, click directly on the Translate icon next to each list item.
-
选择一个语言环境。
-
输入**名称**、简称**和**说明。
-
点击**保存**。
管理推送报告
关于推送报告
推送报告使您可以提高对数据分析的认识和使用 通过将带有图表,表格和地图的报告直接发送到用户电子邮件 地址。
-
推送报告从现有仪表板获取其内容。
-
推送报告以与 仪表板。
-
推送报告只能包含带有图表,地图或 表。
-
您可以在**维护**中创建推送报告及其计划 应用项目。
-
您在上设置的**标题**和**消息**参数 每个报告中都包含** Maintenance **应用项目。 **名字**你 给出报告不包括在报告中。取而代之的是 用于识别系统中的推送分析对象。这样一来 报告可以命名为一件事,报告的标题可以为 另一个。
-
当您运行推送报告作业时,系统会编译以下列表: 您选择的用户组中的收件人。然后系统 为所选用户组的每个成员生成报告。每 仪表板项目中的一个是专门为每个用户生成的。 这意味着报告中包含的数据反映了该数据 用户有权访问。因此,所有用户都可以得到相同的 报告(如果所有数据均为“静态”)或自定义报告(如果所有 数据是“动态的”),或两者结合。
-
推送报告通过电子邮件而不是通过电子邮件发送给收件人 内部DHIS2消息传递系统。如果用户没有有效的 电子邮件,或者如果作业失败,则不会发送电子邮件。在这种情况下, 问题记录在服务器上。
注意
推送报告中生成的数据是公开的,因此请确认您 不要包含任何敏感数据。

在**维护**应用项目中,您可以管理以下推送报告 对象:
表格维护应用项目中的推送报告对象
| CSV元数据导入 { #webapi_csv_metadata_import } | 可用功能 |
|---|---|
| 推送分析 | 创建、编辑、克隆、删除、查看详情、翻译、预览和运行 |
创建或编辑推送报告
-
打开** Maintenance 应用项目,然后单击 Other ** > ** Push 分析**。
-
点击添加按钮。
-
在**名称** 字段中,输入计划报告的名称。
此名称不包括在报告电子邮件中。取而代之的是 用于识别系统中的推送分析对象。
-
(可选)在 Code 字段中,分配一个代码。
-
添加报告**标题**。
该标题包含在报告电子邮件中。
-
(可选)添加**消息**。
此消息包含在报告电子邮件中。
-
选择一个 仪表板 作为报告的基础。
-
选择并分配您要向其发送报告的用户组。
-
选择**计划频率**:每天、每周**或 **每月。
Note
If you schedule a push report to "Monthly" and "31", the scheduled report job will not run if the month has less than 31 days.
-
(可选)选择**启用**以激活推送报告作业。
作业只有激活后才能运行。
-
点击**保存**。
预览推送报告
-
打开** Maintenance 应用项目,然后单击 Other ** > ** Push 分析**。
-
在推送报告列表中,找到要预览的推送报告。
-
单击选项菜单并选择**预览**。
推送报告的预览在新窗口中打开。
运行推送报告作业
-
打开** Maintenance 应用项目,然后单击 Other ** > ** Push 分析**。
-
在推送报告列表中,找到要运行的推送报告。
-
单击选项菜单并选择 立即运行。
推送报告作业立即运行。
克隆元数据对象{ #clone_metadata_push_reports }
克隆数据元素或其他对象可以在创建时节省时间 许多相似的对象。
-
打开**维护**应用项目,找到元数据对象类型 你想克隆。
-
在对象列表中,单击选项菜单并选择**克隆**。
-
修改所需的选项。
-
点击**保存**。
删除元数据对象
注意
您只能在以下情况下删除数据元素和其他数据元素对象: 没有数据与数据元素本身关联。
警告
从系统删除的所有数据集都将不可避免地丢失。所有 数据输入表格,以及可能已经制定的部分表格 也将被删除。确保您已经备份了您的 数据库,然后删除任何数据集,以防您需要还原它 在某个时间点。
-
打开**维护**应用项目,找到元数据对象类型 您要删除。
-
在对象列表中,单击选项菜单并选择**删除**。
-
点击**确认**。
显示元数据对象的详细信息
-
打开**维护**应用项目,找到元数据对象类型 您想查看。
-
在对象列表中,单击选项菜单,然后选择 显示 细节。
翻译元数据对象
DHIS2提供了用于翻译数据库内容的功能, 示例数据元素,数据元素组,指标,指标组 或组织单位。您可以将这些元素转换为任意数量的 语言环境。地区代表特定的地理,政治或 文化区。
提示
要激活翻译,请打开 System Settings 应用项目,单击 > **外观**并选择一种语言。
-
打开**维护**应用项目,找到元数据对象类型 您要翻译。
-
在对象列表中,单击选项菜单并选择**翻译**。
Tip
If you want to translate an organisation unit level, click directly on the Translate icon next to each list item.
-
选择一个语言环境。
-
输入**名称**、简称**和**说明。
-
点击**保存**。
管理外部地图图层
关于外部地图图层
您可以通过引入来自各种来源的地图图层,并将 它们与DHIS2中的自有数据相结合,来定制GIS。DHIS2支持以下常见的地图 服务格式:网络地图服务(WMS)、图块地图服务(TMS)、XYZ图块和矢量图块(矢量样式)。
创建或编辑外部地图图层
注意
DHIS2仅支持Web Mercator投影 ([[EPSG:3857](https://epsg.io/3857)),因此请确保 服务支持此预测。
表:维护应用项目中的外部地图图层对象
| CSV元数据导入 { #webapi_csv_metadata_import } | 可用功能 |
|---|---|
| 外部地图图层 | 创建、编辑、克隆、删除、查看详情和翻译 |
-
打开** Maintenance 应用项目,然后单击 Other ** > 外部地图 层。
-
点击添加按钮。
-
在“名称”字段中,输入一个能描述该内容名称的名称 外部地图图层。
这是您将在 Maps 应用项目中看到的名称。
-
(可选)在 Code 字段中,分配一个代码。
-
选择 地图服务 格式。
DHIS2 支持四种常见的地图服务格式:
-
网络地图服务(WMS)
图片格式:PNG格式允许图层透明, JPG格式可提供更好的压缩效果,并且通常更快 加载。
图层:WMS可以包含多个单独的图层,您可以 可以指定要包含的内容(以逗号分隔)。参考 WMS GetCapabilities文档以查看可用图层。
-
平铺地图服务(TMS)
-
XYZ磁贴(也可用于WMTS)
-
矢量瓦片(矢量样式)
选择“矢量样式”后,您可以为“前置图层 ID”添加一个值。该值表示在矢量图块(图层)堆栈中,用户图层(如“主题”、“事件”)将被插入的图层 ID。 如果未设置此值,则用户的图层将被放置在“矢量样式”中图层的最上方。 地图服务 URL 应指向一个符合 Mapbox GL 样式规范 的 JSON 文档。
-
-
输入地图服务的**URL**。
Note
XYZ and TMS URLs must contain placeholders {}, for example: http://{s}.tile.osm.org/{z}/{x}/{y}.png.
-
(可选)输入地图图层的**来源**。该字段可以包含 HTML标记(如果要链接到源)。
使用外部地图服务时,突出显示 数据来自哪里。
-
选择一个**放置**:
-
底部-底图:对于“地图”应用,这将使外部地图图层 可选作底图(即作为 DHIS2 的替代方案) 底图)。
-
顶部-重叠:对于“地图”应用,这允许外部地图 从“添加图层”选择中添加并放置在上方的任何位置 底图。
请注意,矢量样式图层只能作为底图添加。
-
-
(可选)添加图例。
您可以通过两种方式添加图例:
-
选择预定义的**图例**以描述地图的颜色 层。
Tip
Click Add new to create legends that you're missing. In the form that opens, create the legends you need. When you're done, click Refresh values.
-
在**传奇图像中输入指向外部图像图例的链接 网址**。
这些通常是为WMS提供的。请参阅WMS中的LegendURL下 GetCapabilites文档。
-
-
点击**保存**。
克隆元数据对象{ #clone_metadata_map_layers }
克隆数据元素或其他对象可以在创建时节省时间 许多相似的对象。
-
打开**维护**应用项目,找到元数据对象类型 你想克隆。
-
在对象列表中,单击选项菜单并选择**克隆**。
-
修改所需的选项。
-
点击**保存**。
删除元数据对象
注意
您只能在以下情况下删除数据元素和其他数据元素对象: 没有数据与数据元素本身关联。
警告
从系统删除的所有数据集都将不可避免地丢失。所有 数据输入表格,以及可能已经制定的部分表格 也将被删除。确保您已经备份了您的 数据库,然后删除任何数据集,以防您需要还原它 在某个时间点。
-
打开**维护**应用项目,找到元数据对象类型 您要删除。
-
在对象列表中,单击选项菜单并选择**删除**。
-
点击**确认**。
显示元数据对象的详细信息
-
打开**维护**应用项目,找到元数据对象类型 您想查看。
-
在对象列表中,单击选项菜单,然后选择 显示 细节。
翻译元数据对象
DHIS2提供了用于翻译数据库内容的功能, 示例数据元素,数据元素组,指标,指标组 或组织单位。您可以将这些元素转换为任意数量的 语言环境。地区代表特定的地理,政治或 文化区。
提示
要激活翻译,请打开 System Settings 应用项目,单击 > **外观**并选择一种语言。
-
打开**维护**应用项目,找到元数据对象类型 您要翻译。
-
在对象列表中,单击选项菜单并选择**翻译**。
Tip
If you want to translate an organisation unit level, click directly on the Translate icon next to each list item.
-
选择一个语言环境。
-
输入**名称**、简称**和**说明。
-
点击**保存**。
管理 SQL 视图{ #maintenance_sql_view }
DHIS2的SQL View功能将存储SQL视图定义 内部,然后在需要时实例化视图。
数据库管理员在创建数据库视图时必须小心 直接在DHIS2数据库中。例如,当资源表 生成,所有这些都将首先被删除然后重新创建。如果 任何SQL视图都依赖于这些表,完整性违规异常 将被抛出并且该过程将被中止。
SQL视图基于它们的反向字母顺序删除 DHIS2中的名称,并按常规字母顺序创建。这允许 您要在SQL视图之间具有依赖关系,因为视图仅取决于 其他按字母顺序排列的观点。对于 例如,“ ViewB”可以安全地依赖于“ ViewA”。否则,有意见 取决于其他视图会导致完整性违规错误。
创建一个新的SQL视图
要创建新的SQL视图,请点击** Apps ** > ** Maintenance ** > 其他 > ** SQL View ,然后单击添加 + **按钮。
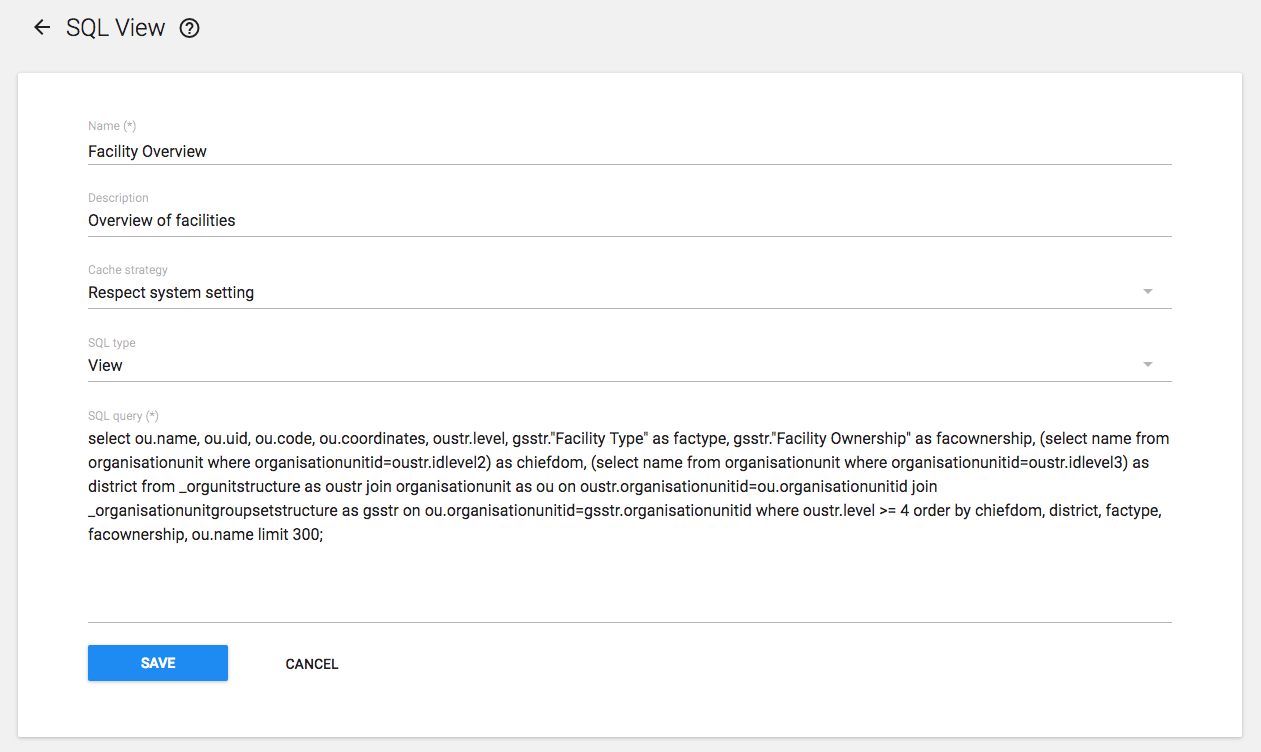
SQL 视图的“名称”属性将用于确定 当用户将该视图 materialized 时,DHIS2 将创建的 表的名称。“描述”属性允许用户提供一些描述性 文本,说明该 SQL 视图的实际功能。
“SQL 类型”属性允许创建三种视图: - “视图”存储在数据库中,并在查询时重新生成 - “物化视图”存储在数据库中,其查询结果 已缓存到数据库中 - “查询”不会存储在数据库中
最后,“SQL 查询”中应包含该 SQL 视图的定义。
仅允许使用 SQL “SELECT” 语句,且某些敏感表 (例如用户信息)不可访问。
点击“保存”以保存 SQL 视图定义。如果您创建的是“视图” 或“物化视图”,还必须“执行查询”才能完成 SQL 视图的创建。
请注意,所用 SELECT 语句返回的列 将成为表的列,这意味着它们必须是有效的表列 类型。使用函数时,可能需要通过在函数后添加 ::{TYPE} 来显式地将 结果强制转换为某种类型。
例如,与其使用 jsonb_each(该函数会返回一种记录类型, 而该类型无法作为列类型),不如使用 jsonb_each_text,并将结果 强制转换为 text 类型,如下例所示:
select jsonb_each_text(eventdatavalues)::text from ...
调用其他 SQL 视图的 SQL 视图{ #sql-views-that-call-other-sql-views }
如果您希望创建一个可被其他 SQL 视图调用的 SQL 视图, 则其 SQL 类型 必须为“视图”或“物化视图” (而非“查询”)。此外,在调用该视图之前, 必须先对其执行 执行查询 操作。
例如,如果你创建了一个名为 数据元素计数 的视图,其 SQL 类型为“视图”,且 SQL 语句如下:
select count(*) as count from dataelement;
...然后,您可以从右键菜单中选择 执行查询,并 使用以下 SQL 语句创建一个名为 超过 100 个数据元素 的第二个 SQL 视图:
select case when count > 100 then 1 else 0 end as result from _view_data_element_count;
SQL视图管理
为了利用SQL视图,只需点击视图,然后从 在上下文菜单中,选择“执行查询”。该过程完成后,您将 系统将通知您已创建一个表。表格名称 将由“描述”属性提供 在SQL视图定义中提供。生成视图后, 您可以通过再次单击视图并选择“显示SQL 视图”。
提示
如果您有一个依赖于其他视图的视图,则应 注意视图的命名方式。当在 DHIS2服务器,必须删除所有视图,然后重新创建。什么时候 分析开始,按字母顺序删除视图,然后 然后以相反的字母顺序重新创建。因此,如果视图A取决于 在视图B上,它必须按字母顺序显示在视图B之前。如果它 会按字母顺序在视图B之后出现,分析可能会失败,因为 带有依存关系的视图将不会以正确的顺序删除。
管理分析表挂钩{ #maintenance_analytics_table_hooks }
DHIS2 的“分析表挂钩”功能用于存储在 分析表生成过程的不同阶段执行的 SQL 代码。
另请参阅开发者文档中的 /api/analyticsTableHooks 。
创建一个新的分析表挂钩{ #creating-a-new-analytics-table-hook }
要创建新的分析表钩子,请单击 Apps (应用项目)> Maintenance (维护 > Other > Analytics table hooks,然后单击 Add + 按钮。
点击“保存”以存储分析表挂钩。
管理语言环境
可以在DHIS2中创建自定义语言环境。除了 系统提供的语言环境,您可能需要添加自定义 系统的语言环境(例如“英语”和“赞比亚”)。这将允许 您可以将元数据对象翻译成本地语言,或解决 使用共同元数据的国家之间的细微差异 定义。

语言环境由语言和国家/地区组成。选择 所需的值,然后按“添加”。此自定义语言环境现已可用 作为系统中的翻译语言环境之一。
一次编辑多个对象组
**维护**应用项目中的**元数据组编辑器**可让您 同时编辑多个对象组。您可以编辑以下内容 对象类型:
表:元数据组编辑器中的对象类型
| CSV元数据导入 { #webapi_csv_metadata_import } | 可用功能 |
|---|---|
Send PUT request to api/dataElements/{dataElementUID} with full object payload as below: | |
| 类别选项组 | |
| 描述 | 将一个数据元素添加到多个数据元素组中 从多个数据元素组中删除一个数据元素 |
| dx尺寸 { #webapi_analytics_dx_dimension } | 将多个数据元素添加到一个数据元素组中 从一个数据元素组中删除多个数据元素 |
| 对于组织单位维度,您可以指定组织 | 将一个指标添加到多个指标组中 将一个指标从多个指标组中移除 |
| Other translatable Properties | 将多个指标添加到一个指标组中 从一个指标组中移除多个指标 |
编辑对象组中的多个对象
-
打开 维护 应用项目并单击 元数据组编辑器。
-
单击**管理组中的项目**。
-
选择一个对象组类型,例如 指标组。
-
选择一个对象组,例如** HIV **。
-
在左侧列表中,选择要添加到对象中的对象。 对象组,然后单击向右箭头。
-
在右侧列表中,选择要从中删除的对象 对象组,然后单击左箭头。
编辑多个对象组中的一个对象
-
打开 维护 应用项目并单击 元数据组编辑器。
-
单击**管理组条目**。
-
选择一个对象类型,例如**指标**。
-
选择一个对象,例如 ANC LLITN 覆盖范围。
-
在左侧列表中,选择要添加的对象组 对象,然后单击向右箭头。
-
在右侧列表中,选择您想要的对象组 从中删除对象,然后单击左箭头。