使用数据透视表应用创建记分卡{ #creating-scorecards-using-the-pivot-table-app }
在卫生部等公共卫生机构中,记分卡提供了一种有用且标准化的方法,可将相关指标合并到一个表中。记分卡提供了健康计划(例如疫苗接种计划)绩效的总体视图,突出了成功、弱点和需要改进的领域。
本教程说明了如何在DHIS2数据透视表应用程序中创建记分卡。使用数据透视表创建记分卡有几个优点,例如:
- 您可以将计分卡保存在仪表板上并离线使用。
- 您可以与其他DHIS2用户共享计分卡。
记分卡如下所示:
让我们开始吧!
- 为记分卡创建图例
首先,我们将为记分卡创建一个三色的“交通灯”图例。记分卡具有三种基本颜色,易于扫描且易于理解。

- In the Legend Management page, scroll to the bottom of the page and create a new legend by clicking the blue + button.

- 在字段中输入图例的名称,例如“ Traffic light”,开始值和结束值。您在此处输入的值取决于您希望为记分卡设置的性能等级。
- Change Number of legend items to 3 to display three colors in the scorecard. To change the legend item colors, click the blue + button and then edit the colors.

- 在数据透视表应用中创建记分卡
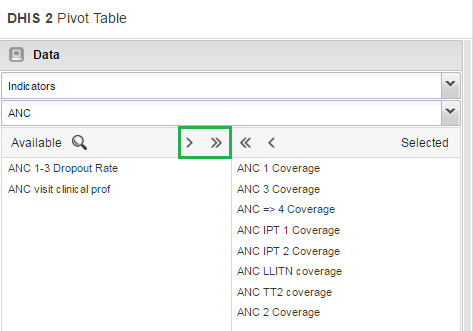
- 单击**更新**。该按钮位于工作区顶部的菜单中。
- 转至 期间 并选择要显示数据的期间。在这个“红绿灯”示例中,我们将使用相对周期部分。在**季度**中,选择**本季度**和**上季度**。清除任何其他复选框并单击“更新”。

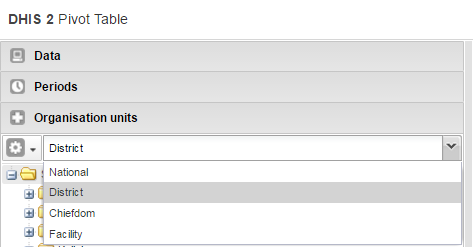
- Go to Organisation Units in the same left side pane, and click the arrow next to the gear button.
- 选择**选择级别**。

- Select District from the list (next to the gear button). Click Update.
 如您所见,记分卡已开始在工作区中成形。现在是时候微调外观和感觉了。
- 整理记分卡的布局和显示
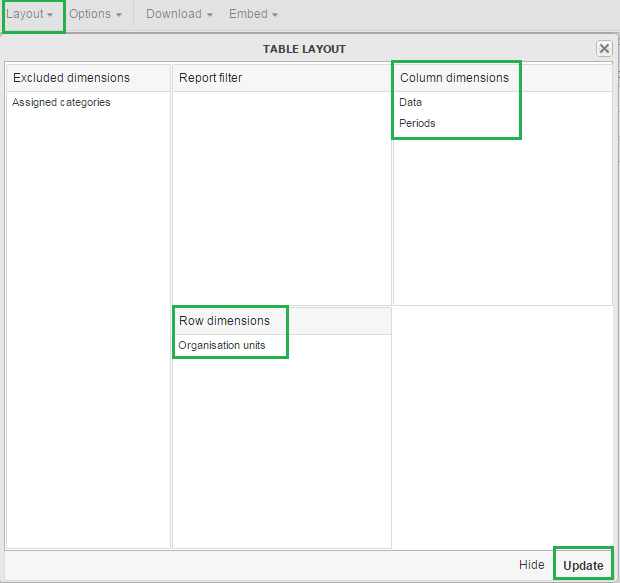
- In Table layout, drag Organisation units down to the Row dimensions section.
- Drag Data to the Column dimensions section.
- In the Column dimensions pane, drag Periods below Data, and click Update.
- 在工作区中,单击“选项”

- Go to Data and clear all the checkboxes.
- 转到 样式 > 图例集,然后从列表中选择您在维护应用程序中创建的图例。在此示例中,我们将其称为交通灯。
- 转到 样式 > 图例显示样式 并选择 背景颜色。
- 点击**更新**。
记分卡已准备好!
-
保存并分享您的计分卡
-
In the workspace, go to the Favorites menu.
- 点击**另存为**。输入您的记分卡名称。
- To share your Scorecard, select Favorites.
- 输入用户组名称,然后单击**保存**。
与您共享仪表板的人员可以查看您的记分卡。