Using the Maps app
About the Maps app
The Maps app was introduced in v29 as a replacement for the original GIS app, offering a more intuitive and user-friendly interface. Since v34, the mapping engine is based on WebGL technology, capable of showing thousands of features on a map simultaneously.
Note
The Maps app requires WebGL. Visit get.webgl.org to verify that WebGL is working in your browser or to troubleshoot display issues.
With the Maps app, you can overlay multiple layers and choose from different basemaps. Supported layer types include thematic maps, events, tracked entities, facilities, organisation unit boundaries, and Earth Engine data such as population, elevation, or climate indicators. You can label features, search and filter data, and save or share maps with other users, or download them as an image. Saved maps can be added to dashboards in the Dashboard app. Thematic layers also integrate with the Data Visualizer app, letting you open the same data as a chart.
Note
To use predefined legends in the Maps app, you need to create them first in the Metadata Management app.

Layers panel
The layer panel on the left side of the workspace shows an overview of the layers for the current map:
-
As layers are added, using the (+) Add layer button, they are arranged and managed in this panel.
-
The basemap card is always shown at the bottom of the panel. See Basemaps for available options.
-
The small arrow button to the right of the layer panel, at the top, allows the panel to be hidden or shown.
Each layer is represented by a card in the panel. Along the top of the card are a grab handle for reordering layers with the mouse, the layer title, and an arrow to collapse or expand the card. The middle of the card shows the layer legend where applicable. Along the bottom of the card from left to right are:
-
An edit (pencil) button opens the layer configuration dialog.
-
An eye symbol toggles the visibility of the layer.
-
A slider modifies the layer transparency.
-
A more actions (three dots) button provides additional options, including showing or hiding the data table, downloading the layer data, duplicating the layer, and removing the layer.
Map controls
-
The + and - buttons on the map allow you to zoom in and out of the map respectively. The mouse scroll wheel zoom is continuous, allowing you to fit the map perfectly to your content.
-
The rotate map button (triangle arrows) allows you to rotate and tilt the map to enhance the view of your data. Press and hold the button (or hold the Control key on your keyboard) while moving your mouse to change the map view. Click the button again to reset the view.
-
Fullscreen (four arrows) allows you to view the map in fullscreen. To exit fullscreen, click the button again or press the escape key on your keyboard.
-
Zoom to content (bounded magnifying glass symbol) automatically adjusts the zoom level and map center position to put the data on your map in focus.
-
Search (magnifying glass symbol) allows searching for and jumping to a location on the map.
-
The ruler button allows you to measure distances and areas on the map.
-
Right-click on the map to show the longitude and latitude of that location.
File menu
-
The File button near the top left allows you to open and save maps. See using the maps file menu for more detailed information.
-
The Download button next to the File button allows you to download the current map as a PNG image.
-
The Interpretations button at top right opens an interpretations panel on the right side of the workspace. See viewing interpretations for more information.
Create a new map
When you open the Maps app, you start with an empty map canvas and the default basemap selected. If a map is already open, start a new one using File > New. You can change the basemap at any time from the basemap card in the layer panel (see Basemaps).
To add a layer, click the (+) Add layer button in the top left. The layer selection dialog opens:

Available layer types are:
- Thematic: Visualize data values (indicators or data elements) aggregated by organisation unit.
- Events: Show individual events from event or tracker programs.
- Tracked entities: Show tracked entities and their relationships on the map.
- Facilities: Show facilities as icons based on their coordinates.
- Org units: Show organisation unit boundaries.
In addition, several layers can come from Google Earth Engine (such as population, elevation, or climate indicators) and other external services. Various Google Earth Engine layer sources are available if the Google Earth Engine API key has been set up (see documentation).
Note
The Maps app administrator can:
- Choose the sources for Google Earth Engine layers available to other users using the Manage available layer sources button.
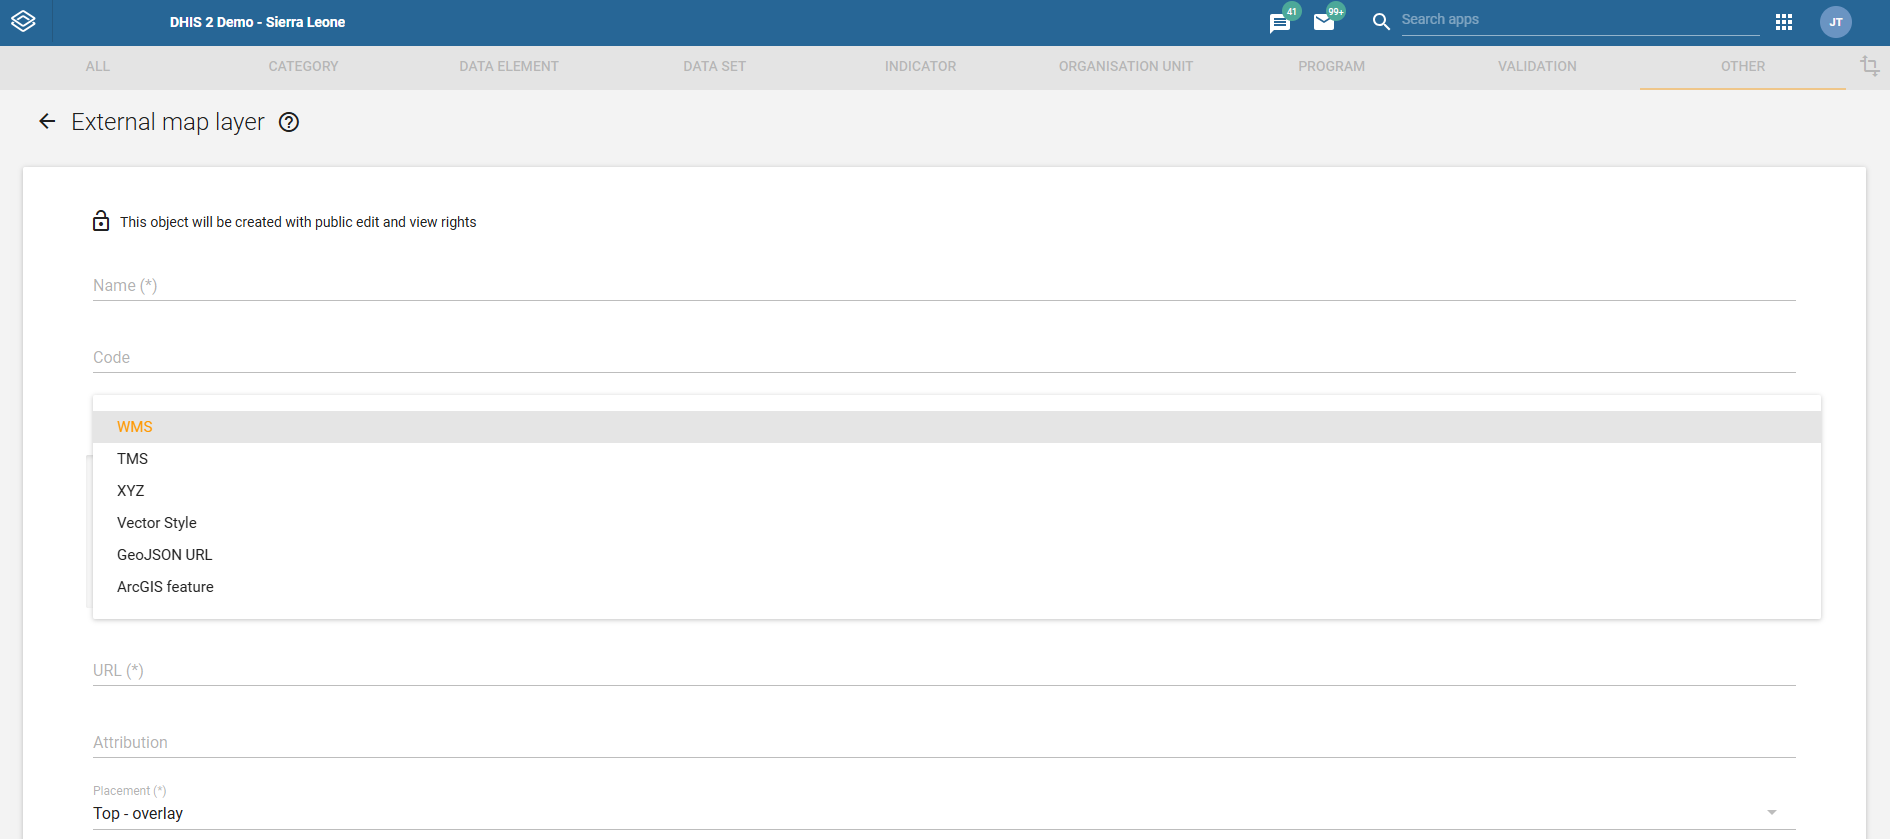
- Add external layer sources in the Maintenance app. The Metadata Management app does not manage external map layers.
Basemaps
A basemap provides the background map on which your data layers are shown. You can choose and configure the basemap from the basemap card at the bottom of the layer panel.
The following basemaps are available by default:
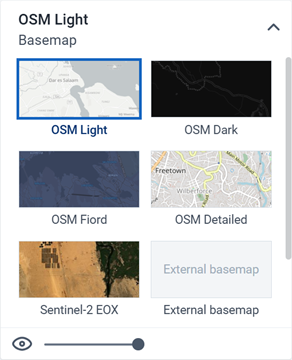
- OSM Light: A minimal, light-colored map based on OpenStreetMap data. This is the default basemap, unless a system administrator sets a different Default basemap in the System Settings app.
- OSM Dark: A dark-themed map based on OpenStreetMap data. Useful when the colors on your data layers are bright.
- OSM Fiord: A muted, blue-toned map based on OpenStreetMap data.
- OSM Detailed: Contains more map features and place names.
- Sentinel-2 EOX: Cloud-free satellite imagery showing natural-color views of the Earth's surface at 10m resolution.
If a Bing Maps or Azure Maps API key has been configured by a system administrator, four additional basemaps become available from each provider. Both providers offer the same four styles, prefixed with the provider name, for example Bing Road and Azure Road:
- Road: Shows roads, borders and places.
- Dark: A dark-themed road map. Useful when the colors on your data layers are bright.
- Aerial: Satellite and detailed aerial imagery.
- Aerial Labels: Aerial imagery with place name labels.
A Maps app administrator can also add external basemaps in the Maintenance app. These appear in the basemap card alongside the default basemaps.
Basemap layers are represented by a card in the layer panel. The card shows the list of available basemaps with the current one highlighted. Controls at the bottom allow you to toggle the basemap visibility and adjust its transparency.
Note
Bing Maps is being retired. See the Bing Maps Blog for the retirement announcement. For migration to Azure Maps, consult the Bing Maps Migration Overview.
Manage thematic layers
Thematic maps represent spatial variation of geographic distributions. They show aggregated data values for a selected data item (such as an indicator or data element), period and organisation unit level. Organisation units with coordinates and matching data values will appear on the map.
Note
You must generate the DHIS2 analytics tables to have aggregated data values available.
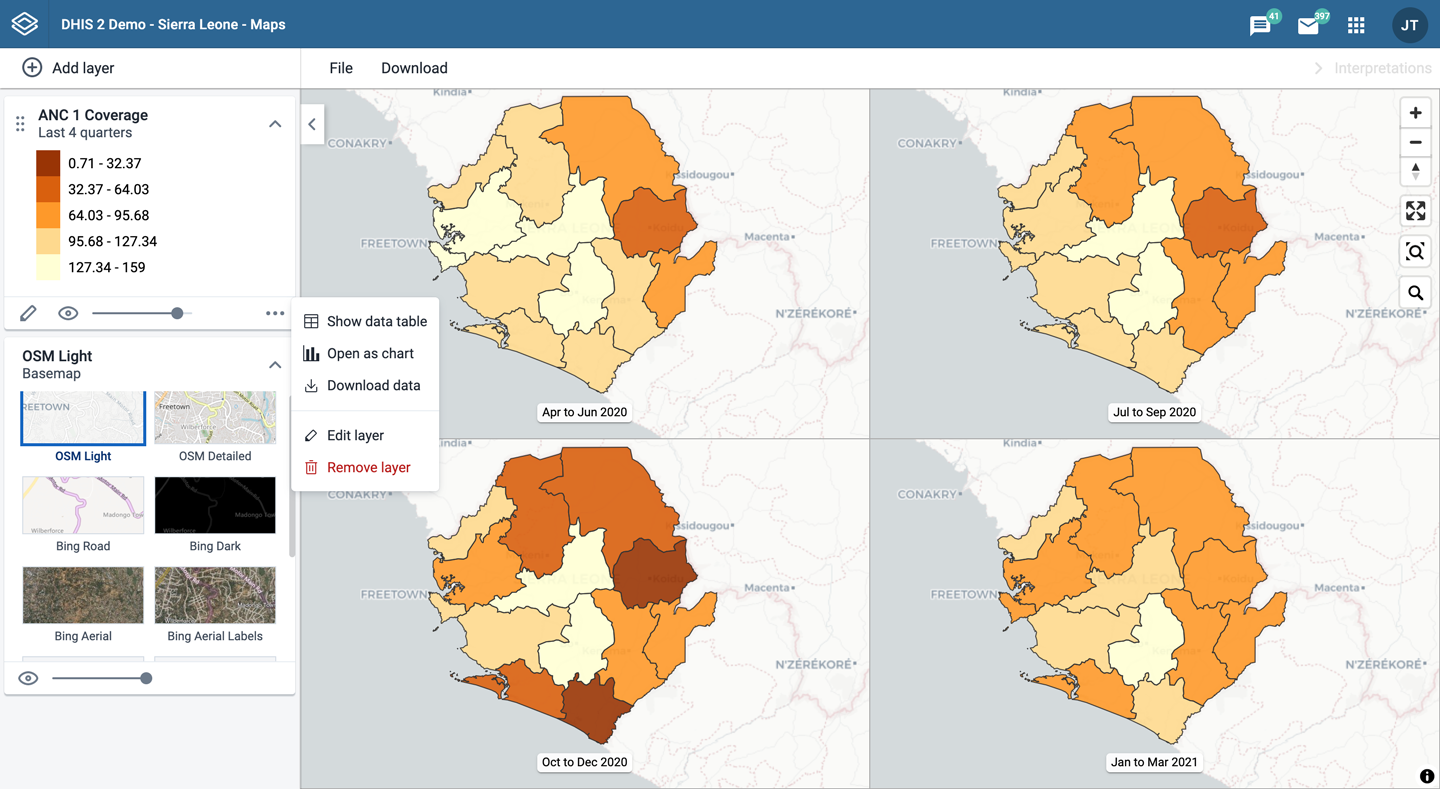
Thematic layers are represented by layer cards in the layer panel. The middle of the card shows a legend indicating the value ranges shown on the layer. The more actions (three dots) button includes options to show or hide the data table, download the data, and open the data as a chart in the Data Visualizer app using Open in Data Visualizer app.
Create a thematic layer
To create a thematic layer, choose Thematic on the Add layer selection. This opens the Thematic layer configuration dialog.
1. Data

-
Choose a data item.
-
Choose a value from the Aggregation type field for the data values to be shown on the map. By default, "By data element" is selected. Alternative values are: Count, Average, Sum, Standard deviation, Variance, Min, Max. See also Aggregation operators.
-
Only show completed events: Includes only completed events in the aggregation process. This is useful when you want to exclude partial events in indicator calculations. Available for indicators, program indicators and event data items.
2. Period
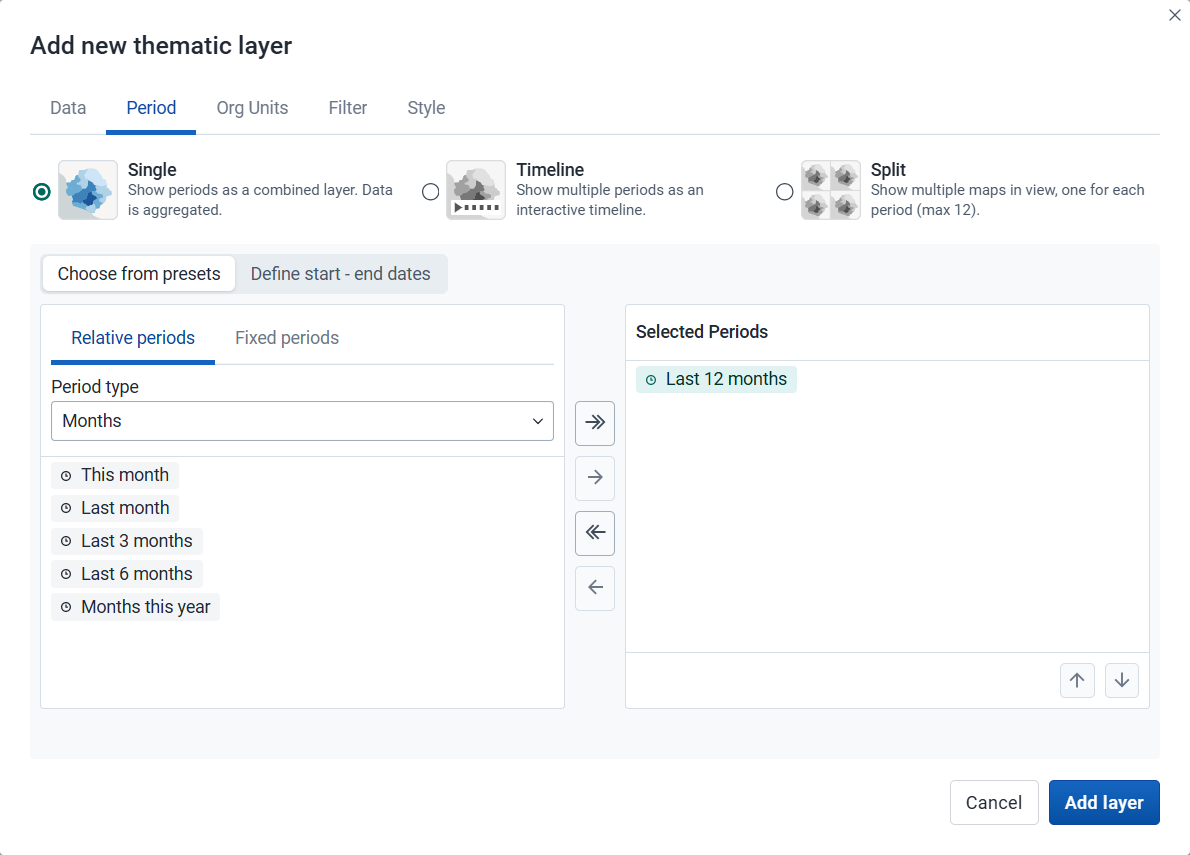
Choose the time span over which the thematic data is mapped.
-
Choose how to show the selected periods on the map:
-
Single (default): Shows all selected periods as a single combined layer with aggregated data. Required when only one period is selected or when using start–end dates.
-
Timeline: Shows multiple periods as an interactive timeline ordered chronologically. Multiple timeline layers can be added to a map (they will all share the same periods).
-
Split: Shows multiple periods side by side for comparison. Supports up to 12 periods (including multi-period presets) and can only be combined with other split layers (they will all share the same periods).
-
-
After you choose a display mode, choose how to define the periods:
-
Choose from presets: Available for all display modes. You can combine one or more relative and fixed periods.
-
Relative period: Choose Relative periods, then the Period type (for example Years or Months) and choose one or more relative periods, such as This year and Last year or Last 12 months. A default relative period for analysis can be set in the System Settings app.
-
Fixed period: Choose Fixed periods, then choose the Period type (for example Yearly or Monthly) and choose one or more fixed periods, such as 2024 or January 2025 and February 2025.
-
-
Define start–end dates: Available only when the Single display mode is selected. Specify exact start and end dates. Both dates are inclusive and will be reflected in the outputs.
-
3. Org units

-
Choose the organisation units you want to include in the layer. You can freely combine specific org units, organisation unit levels, organisation unit groups, and relative user organisation units (User organisation unit, User sub-units, User sub-x2-units). When user organisation units are selected, the map data will appear according to the assigned organisation units for each user in the organisation unit hierarchy.
Tip: Levels and groups act as filters within the organisation units you choose - combining them will show only organisation units at those levels or in those groups that are descendants of your selected organisation units.
-
Use associated geometry: This field is shown only if there are additional geometries available for your organisation units. This is typically used to show facility catchment areas.
4. Filter
-
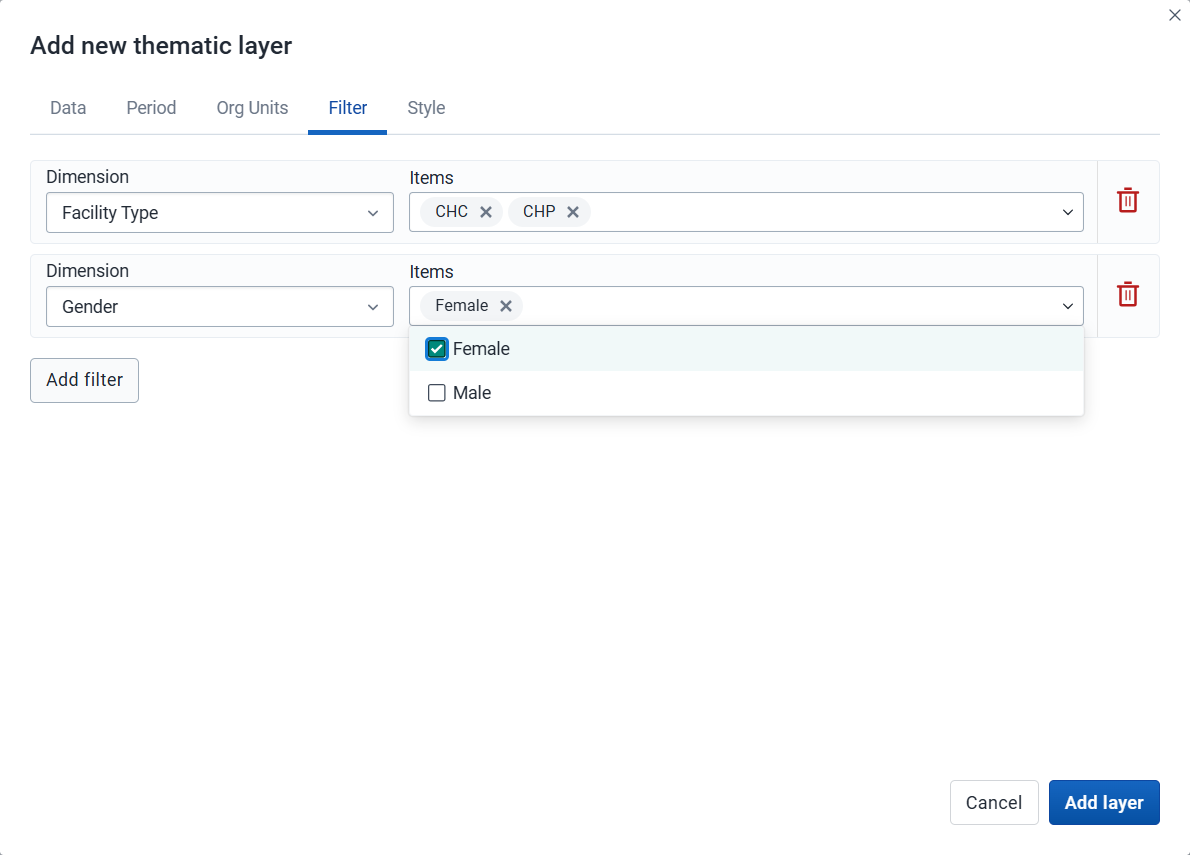
Click Add filter and choose an available data item to add a new filter to the data set.
-
Choose a data dimension from the menu. You can reduce the number of dimensions shown by using the search field. Click the name to choose a dimension.
-
When a dimension is selected you get a second menu with dimension items. Check the items you want to include in the filter.
You can add multiple filters. Click the trash button on the right of the filter to remove it.
-
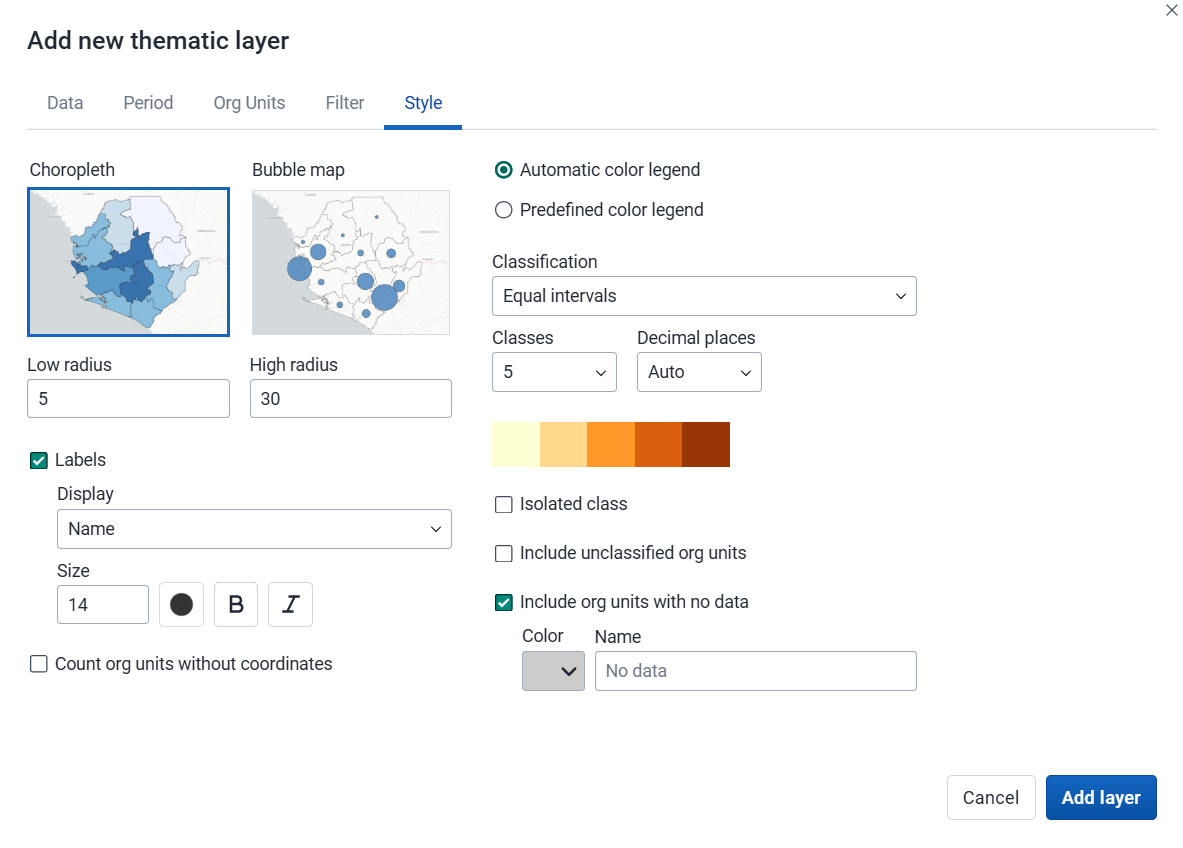
5. Style
-
Choose either Choropleth or Bubble map.
-
A choropleth map assigns a color to each organisation unit shape according to the data value. This is the recommended technique if the data is normalized (per capita).
-
A bubble map shows data values as proportional circles. Use this technique if the data is not normalized (absolute numbers). The circles are placed in the center of each organisation unit. Set the Low radius and High radius for the proportional circles. The circles will be scaled between low and high radius according to the data value. The radius must be between 0 and 50 pixels.
-
-
Labels: Show organisation unit names and/or values on the layer. Choose Name, Name and value, or Value. Font size, weight, style and color can also be modified.
-
Count org units without coordinates: Organisation units without map coordinates are counted and shown in a Data quality section of the legend. They also appear in the data table. These organisation units might or might not have data.
-
Choose the legend type:
-
Automatic color legend: A legend is automatically created based on the classification method, number of classes and color scale you choose. Set Classification to one of:
- Equal intervals: Divides the value range into equally-sized intervals, each spanning (highest value − lowest value) ÷ number of classes.
- Equal counts: Organisation units are distributed as evenly as possible across classes (also known as quantile classification). Some datasets cannot be evenly partitioned, particularly when values are heavily repeated or the number of distinct values is small.
- Natural breaks (intervals) and Natural breaks (clusters): Class boundaries are placed at the largest gaps in the data distribution, based on the ckmeans algorithm. Both methods group values similarly; Natural breaks (intervals) produces contiguous class ranges, while Natural breaks (clusters) can leave gaps between classes where no values fall.
- Pretty breaks: Break points are rounded to clean, human-readable numbers. Based on R's pretty algorithm.
- Logarithmic scale: Uses a logarithmic scale. Values must be positive; zero or negative values are left unclassified.
- Standard deviation: Classes are defined as multiples of standard deviations from the mean. The number of standard deviations per class depends on the number of classes chosen; values further from the mean are left unclassified.
Decimal places: Number of decimal places shown in legend labels. Auto lets the app decide based on the data range, or choose a fixed value from 0 to 6 (also available for single color legends).
Isolated class: Define a value range (min–max) with a fixed color and optional label. Organisation units in that range are shown separately and excluded from automatic classification.
-
Predefined color legend: Choose from the predefined legends.
-
Single color legend: Choose the color of the bubbles or circles. Only available for bubble maps.
-
-
Include unclassified org units: Organisation units whose values fall outside all classification ranges are shown with a configurable color and label (default: "Unclassified").
-
Include org units with no data: Organisation units with no data value are shown with a configurable color and label (default: "No data").
Note: All legend items and their counts - including No data and Unclassified - only include organisation units with coordinates.
Note
Most classes use half-open intervals (
startValue ≤ value < endValue): a value sitting exactly on a boundary belongs to the upper class, not the one whose label ends there. The exceptions - where the upper bound is inclusive - are the last class, isolated classes, single-value classes, and clusters (natural breaks).If the exact class a boundary value belongs to matters for your analysis, use Labels to overlay values directly on each feature. If it still matters after that, consider whether a different legend, maybe with more classes or higher decimal precision, is the right tool for the decision you are trying to make.
Click Add layer.
Modify a thematic layer
-
In the layer panel, click the edit (pencil) icon on the thematic layer card.
-
Modify the settings on any of the tabs as desired.
-
Click Update layer.
Filter values in a thematic layer
Thematic layers have a Show data table option in the more actions (three dots) menu of the layer card. When the table is open, the option changes to Hide data table.

The data table shows the data associated with the thematic layer. Click the arrow buttons in a column header to sort by that column. Type in the filter fields below each column header to filter the rows shown.
The name filter field is an effective way to search for individual organisation units.
For numeric columns, you can filter using comparison operators: >, <, >=, and <=. Use , for OR logic and & for AND logic. For example: 2,>3&<8 matches the value 2 or any value greater than 3 and less than 8.
Note
Data table filters are temporary and are not saved with the map.
Open organisation unit profile
You can open the organisation unit profile in three ways:
-
Click an organisation unit on the map, then click the View profile button in the popup.
-
Right-click one of the organisation units on the map, and choose View profile from the menu.
-
Click an organisation unit row in the data table.
Navigate between organisation unit hierarchies
When there are visible organisation units on the map, you can navigate up and down in the hierarchy without changing the organisation unit selection.
-
Right-click one of the organisation units.
-
Choose Drill up one level or Drill down one level.
The drill down option is disabled if you are on the lowest level or if there are no coordinates available on the level below. Likewise, the drill up option is disabled from the highest level.
Remove a thematic layer
To remove a thematic layer from the map, in the layer card to the left, click the more actions (three dots) icon and then click Remove layer.
Manage event layers
The event layer shows the geographical location of events recorded in DHIS2 programs. While in thematic layers you can visualize event data aggregated to organisation unit level, with event layers you can show the individual events or cases when they have their own point or polygon coordinates. Alternative coordinate fields also let you plot events using locations other than the event itself, such as the organisation unit or enrollment location.
To show aggregated event statistics at the organisation unit level, use a thematic layer with event data items instead.

Event layers are represented by layer cards in the layer panel. The middle of the card shows a legend indicating the styling of the layer. The more actions (three dots) button includes options to show or hide the data table and to download the data in GeoJSON format.
Create an event layer
To create an event layer, choose Events on the Add layer selection. This opens the Events layer configuration dialog.
1. Data

-
Choose a program and then choose a program stage. The Stage field is shown only after you choose a program.
If there is only one stage available for the selected program, the stage is automatically selected.
-
Choose a value from the Coordinate field to determine which positions are shown on the map. By default, Event location is selected. You can also choose Organisation unit location. Depending on the selected program, additional options can include Tracked entity location, Enrollment location, and coordinate or organisation unit type data elements or attributes, such as "Household location" or "Referral facility". The number of events shown on the map can vary depending on the selected option and the availability of coordinates. When organisation unit location is used, polygons are represented by their centroids.
-
By default, all events with coordinates are shown on the map. Use the Event status field to only show events having one status: Active or Completed.
2. Period

Choose the time span for when the events took place.
-
Choose from presets: You can combine one or more relative and fixed periods.
-
Relative period: Choose Relative periods, then the Period type (for example Years or Months) and choose one or more relative periods, such as This year and Last year or Last 12 months. A default relative period for analysis can be set in the System Settings app.
-
Fixed period: Choose Fixed periods, then choose the Period type (for example Yearly or Monthly) and choose one or more fixed periods, such as 2024 or January 2025 and February 2025.
-
-
Define start–end dates: Specify exact start and end dates. Both dates are inclusive and will be reflected in the outputs.
3. Org units
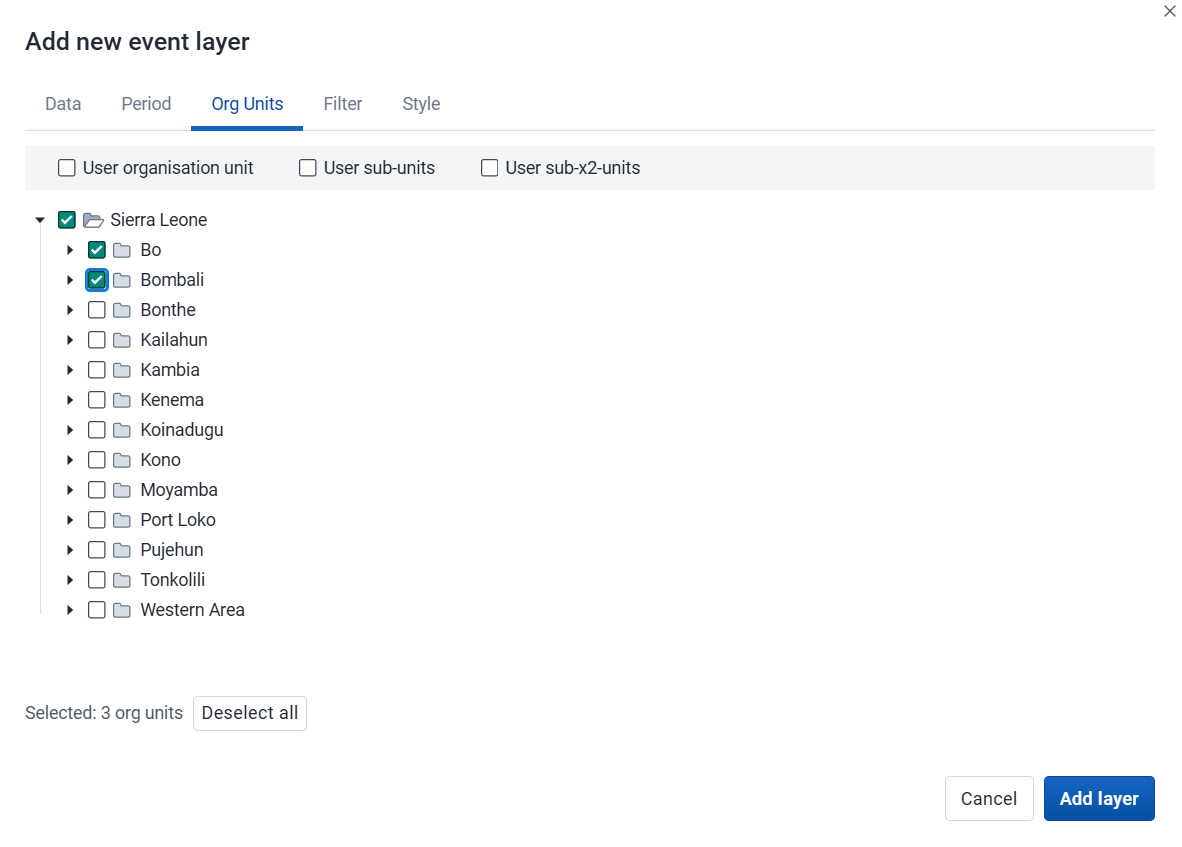
- Choose the organisation units you want to include in the layer. You can combine specific organisation units and relative user organisation units (User organisation unit, User sub-units, User sub-x2-units). When user organisation units are selected, the map data will appear according to the assigned organisation units for each user in the organisation unit hierarchy. Data from all organisation units within and below the selected organisation units is included (Selected and all below).
4. Filter
-
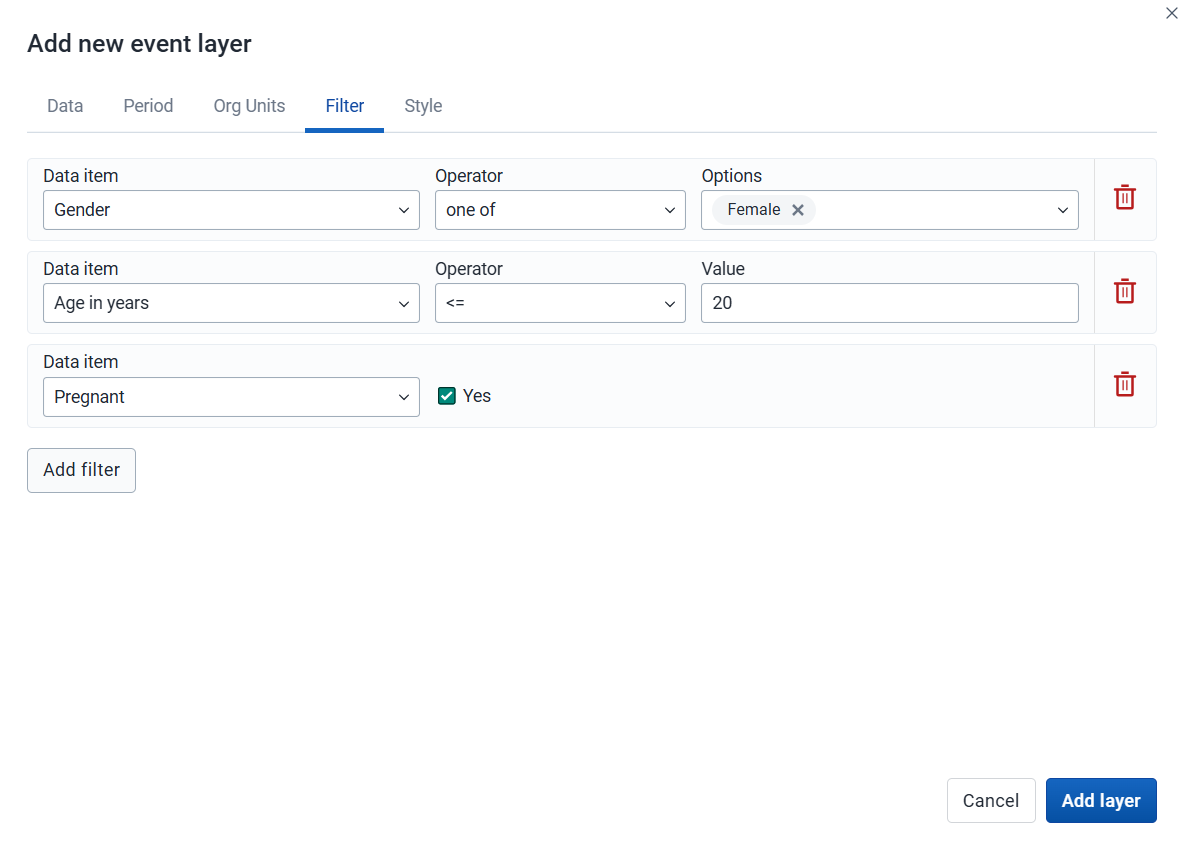
Click Add filter and choose an available data item to add a new filter to the data set.
-
For data item of type option set, you can choose any of the options from the menu, or type to filter.
-
For data item of type number, you can choose operators like equal, not equal, greater than or less than.
-
For data item of type boolean (yes/no), you can check the box if the condition should be true.
-
For data item of type text, choose Contains (matches any value containing the search text) or Is exact (matches only identical values).
You can add multiple filters. Click the trash button on the right of the filter to remove it.
-
5. Style
-
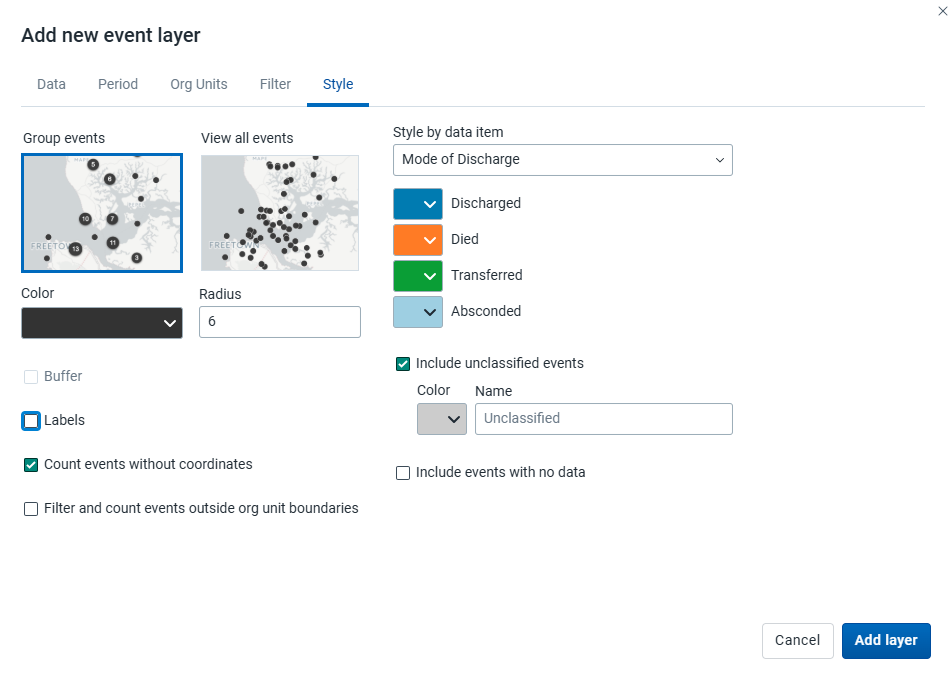
Choose Group events to group nearby events (cluster), or View all events to show events individually.
-
Choose a color and radius for the event or cluster points.
-
Choose Buffer to show a visual buffer around each event. The radius of the buffer can be modified here. Only available when View all events is selected.
-
-
Count events without coordinates: Events without coordinates are counted and shown in a Data quality section of the legend. They also appear in the data table. These events might or might not have data.
-
Filter and count events outside org unit boundaries: Events falling outside the boundaries of the selected organisation units are excluded from the map, and counted in the Data quality section of the legend, which also flags when some or all of the selected organisation units lack boundary data. These events remain in the data table, but can be identified by their empty Organisation unit boundary column value. Events inside a boundary are tagged with the name of their containing organisation unit in that same column.
-
Label: Choose a data element or attribute to show on the layer. Font size, weight, style and color can also be modified.
-
Choose Style by data item (data element or attribute) to colorize the events according to a data value. If events are grouped, clusters are shown as small donut charts showing the distribution of the data values. The available options vary for different data types:
-
Option sets: Choose a color for each option in an option set. You can set default colors for an option in the Metadata Management app.
-
Numbers: You can style a numeric data item in the same way as thematic layers using automatic or predefined legends.
-
Booleans: Choose a color for true/yes and another for false/no.
Include unclassified events: Events whose values fall outside all classification ranges are shown with a configurable color and label (default: "Unclassified").
Include events with no data: Events with no data value are shown with a configurable color and label (default: "No data").
-
Note: All legend items and their counts - including No data and Unclassified - only include events with coordinates.
Click Add layer.
Modify an event layer
-
In the layer panel, click the edit (pencil) icon on the event layer card.
-
Modify the settings on the Data, Period, Filter, Org units and Style tabs as desired.
-
Click Update layer.
Filter events
Event layers have a Show data table option in the more actions (three dots) menu of the layer card. When the table is open, the option changes to Hide data table.

The data table shows the data associated with the event layer. Click the arrow buttons in a column header to sort by that column. Type in the filter fields below each column header to filter the rows shown.
Additional columns appear for data elements that have Display in reports selected, and for any data item used to style the events. You can filter both the data value and the color in those columns. Numeric columns support comparison operators: >, <, >=, and <=, with , for OR and & for AND logic. For example: 2,>3&<8.
Note
Data table filters are temporary and are not saved with the map.
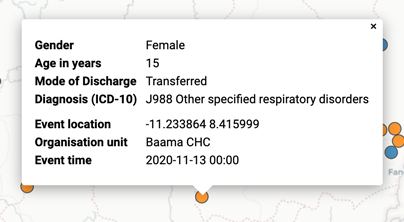
Modify information in event data table and popups
If you have access to the selected program in the Metadata Management app, you can modify the information shown in the event popup window.
-
Open the Metadata Management app.
-
Choose Programs.
-
Click the program you want to modify and choose Data or the stage first then Data in the case of a Tracker program.
-
For every data element you want to show in the popup window, choose the corresponding Display in reports.
-
Click Save.
Download raw event layer data
The raw data for event layers can be downloaded in GeoJSON format for more advanced geo-analytics and processing in desktop GIS software such as QGIS. The downloaded data includes all individual events as GeoJSON features, including attributes for each data element selected for Display in reports.

-
In the layer card to the left, click the more actions (three dots) icon and then click Download data.
-
Choose the ID Format to use as the key for data element values in the downloaded GeoJSON file:
- ID: Use the unique ID of the data element.
- Name: Use the human-friendly name of the data element (translated).
- Code: Use the code of the data element.
-
Choose whether or not to Use human-readable keys for other event attributes, such as Program Stage, Latitude, Longitude, Event Data, and Org Unit ID, Name, and Code. When this option is not selected, these values will be computer-friendly IDs instead of human-readable (translated) names.
-
Click the Download button to generate and download a GeoJSON file. The data will be requested from the DHIS2 server and processed by the maps application. This operation can take several minutes to complete.
-
After you download the GeoJSON file, you can import it into most standard GIS software.
Note
The downloaded data does not include style information as it is not natively supported by the GeoJSON format. Styles can optionally be recreated in external GIS applications using the attributes of each feature.
Remove an event layer
To remove an event layer from the map, in the layer card to the left, click the more actions (three dots) icon and then click Remove layer.
Manage tracked entity layers
The tracked entity layer shows the geographical location of tracked entities registered in DHIS2. Tracked entities with associated point or polygon coordinates appear on the map.

Tracked entity layers are represented by layer cards in the layer panel. The middle of the card shows a legend indicating the styling of the layer.
Create a tracked entity layer
To create a tracked entity layer, choose Tracked entities on the Add layer selection. This opens the Tracked entity layer configuration dialog.
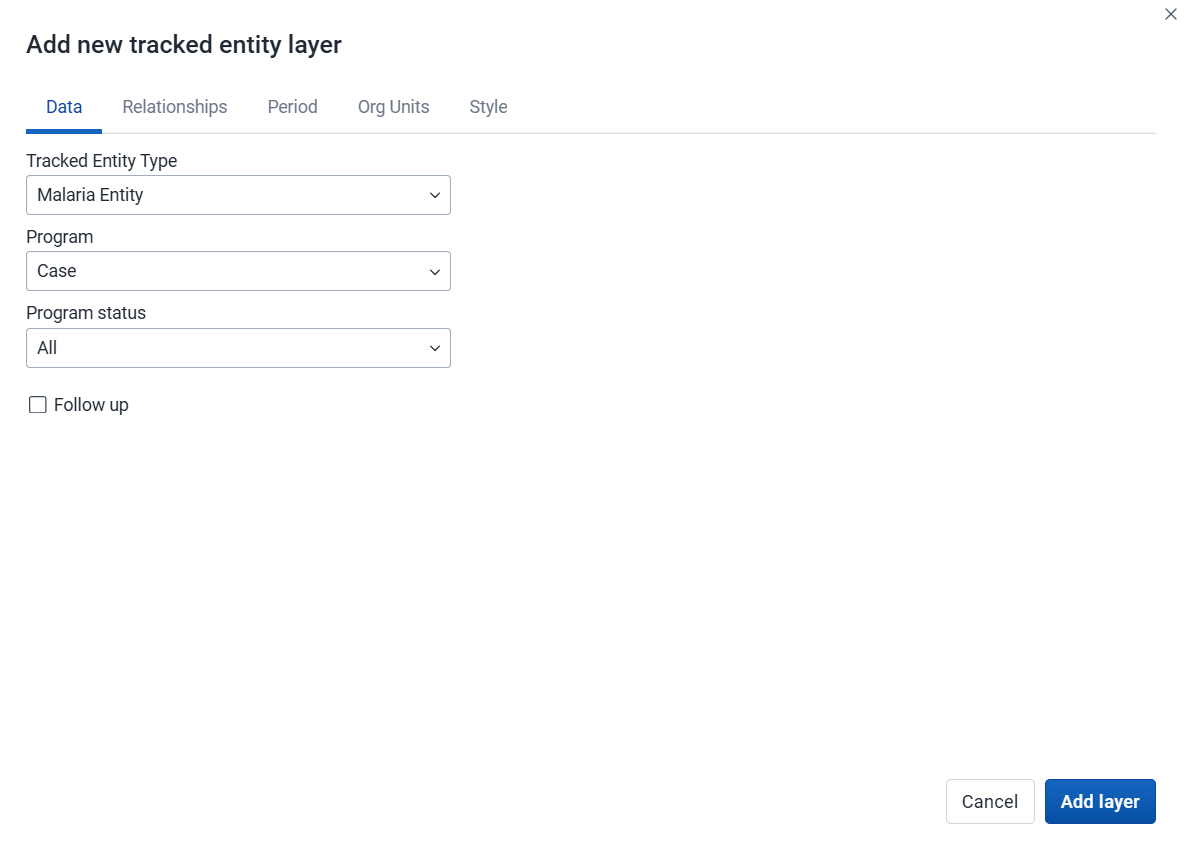
1. Data
-
Choose the Tracked entity type you want to show on the map.
-
Choose a Program to filter tracked entities by enrollment.
-
Use the Program status field to choose the enrollment status of tracked entities to include: All, Active, Completed, or Cancelled.
-
Filter by the Follow up flag to include only tracked entities marked for follow-up.
2. Relationships

Caution
Displaying tracked entity relationships in Maps is an experimental feature.
-
Choose the Display Tracked Entity relationships checkbox to show relationships on the map.
-
Choose the Relationship type to show from the list. Only relationships from the selected tracked entity type to tracked entities are available. Relationships to events or enrollments are not shown.
-
Relationships are drawn from the tracked entities shown by the layer. The related tracked entities at the other end are filtered as follows:
- Org units: the same organisation units and selection mode as the layer.
- Period: the same dates as the layer. If the layer uses the enrollment date, the dates apply to the enrollment date of the related tracked entities when the relationship type sets a program for them, and to their last updated date otherwise.
- Program, program status and follow-up: not applied. The related tracked entities are shown whatever program they are in, unless the relationship type sets one.
3. Period

-
If no program is selected, you can set start and end dates for when the tracked entities were last updated.
-
If a program is selected, you can set the period when tracked entities were last updated or when they were enrolled in the program.
4. Org units
-
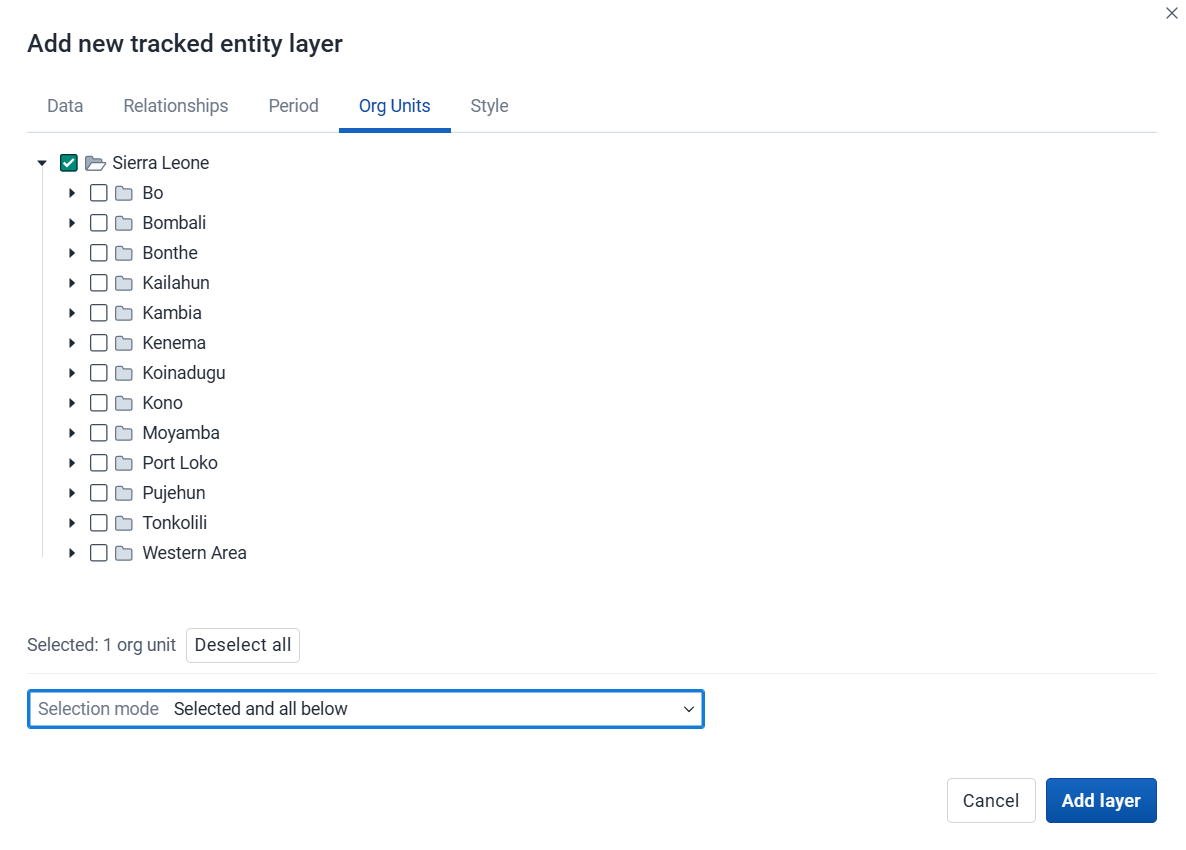
Choose the organisation units you want to include in the layer. Only specific organisation units can be selected. A selection mode determines how the organisation unit tree is traversed:
-
Selected only: Include tracked entities belonging to selected organisation units only.
-
Immediate children: Include tracked entities in the organisation units right below selected org units, not in the selected organisation units themselves.
-
Selected and all below: Include tracked entities in and all below selected organisation units.
In v40, the default selection mode of a tracked entity layer in the Maps app is Selected only.
From v41, the default selection mode of a tracked entity layer in the Maps app is Selected and all below.
-
5. Style
-
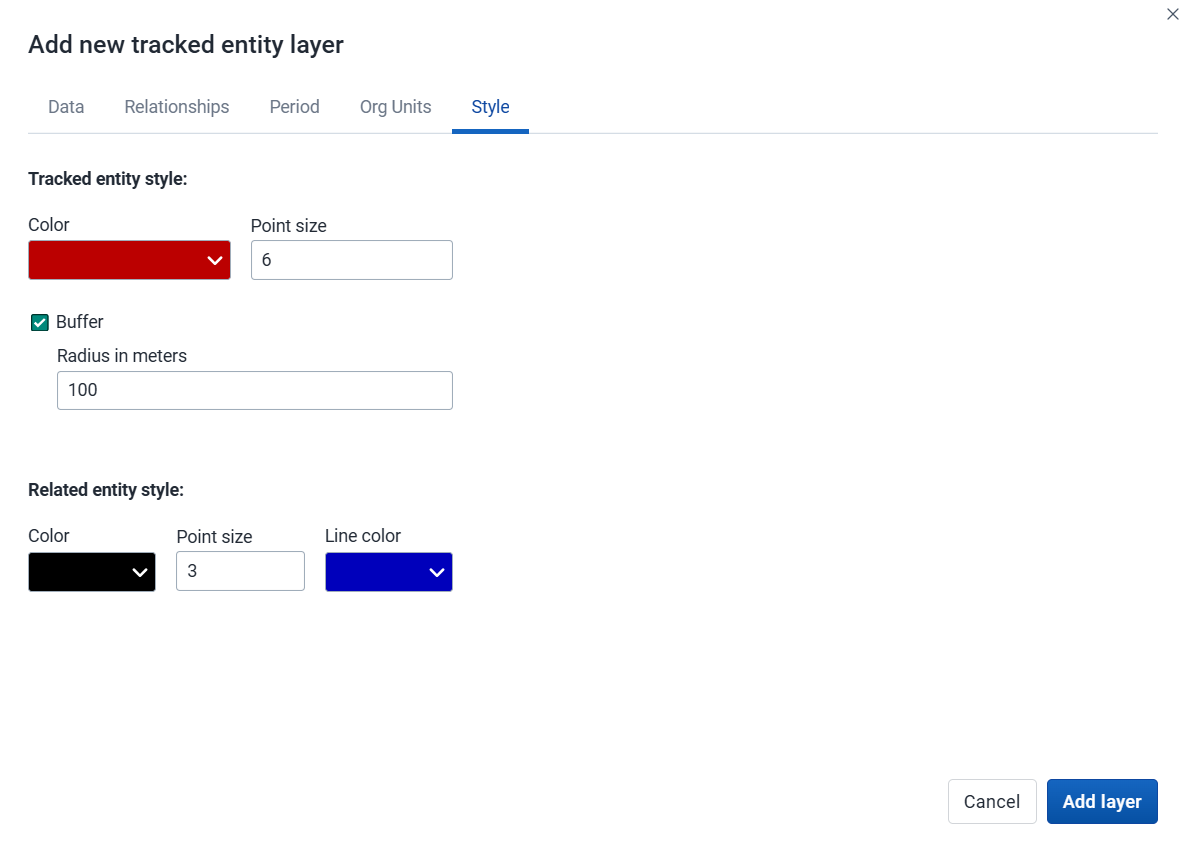
Choose a Color for tracked entity points and polygons.
-
Choose the Point size for the points.
-
Choose Buffer to show a visual buffer around each tracked entity. The buffer distance in meters can be modified here.
-
If a relationship type has been selected on the Relationships tab, you can choose a Color and Point size for related tracked entities and a Line color for the relationship lines.
Click Add layer.
Modify a tracked entity layer
-
In the layer panel, click the edit (pencil) icon on the tracked entity layer card.
-
Modify the settings on the Data, Relationships, Period, Org units and Style tabs as desired.
-
Click Update layer.
Modify information in tracked entity popups
If you have access to the selected program in the Metadata Management app, you can modify the information shown in the tracked entity popup window.
-
Open the Metadata Management app.
-
Choose Programs.
-
Click the program you want to modify and choose Enrollment: Data.
-
For every attribute you want to show in the popup window, enable Display in list.
-
Click Save.
Remove a tracked entity layer
To remove a tracked entity layer from the map, in the layer card to the left, click the more actions (three dots) icon and then click Remove layer.
Manage facility layers
The facility layer shows icons representing types of facilities. Only point-type organisation units are shown - polygon organisation units such as districts or regions are not shown.

Facility layers are represented by layer cards in the layer panel. The middle of the card shows a legend indicating the group set representation. The more actions (three dots) button includes options to show or hide the data table and to download the data in GeoJSON format.
Create a facility layer
To create a facility layer, choose Facilities on the Add layer selection. This opens the Facility layer configuration dialog.
1. Org units

-
Choose the organisation units you want to include in the layer. You can freely combine specific org units, organisation unit levels, organisation unit groups, and relative user organisation units (User organisation unit, User sub-units, User sub-x2-units). When user organisation units are selected, the map data will appear according to the assigned organisation units for each user in the organisation unit hierarchy. Only organisation units with a point location are shown.
Tip: Levels and groups act as filters within the organisation units you choose - combining them will show only organisation units at those levels or in those groups that are descendants of your selected organisation units.
-
The system administrator can set the default organisation unit level containing facilities in the System Settings app.
-
Use associated geometry: This field is shown only if there are additional geometries available for your organisation units. This is typically used to show facility catchment areas.
2. Style

-
Labels: Allows labels to be shown on the layer. Font size, weight and color can be modified here.
-
Buffer: Shows a visual buffer around each facility. The radius of the buffer can be modified here. Not available if associated geometry is used.
-
Count org units without a point location: Organisation units without point coordinates are counted and shown in a Data quality section of the legend. They also appear in the data table.
-
Facilities with a point location can be styled with an organisation unit group set using different icons. Choose a group set from the list of organisation unit group sets defined for your DHIS2 instance. The system administrator can set the default organisation unit group set in the System Settings app.
Include unclassified org units: Organisation units not belonging to any group in the selected group set are shown with a configurable color and label (default: "Unclassified").
-
If no group set is selected, the facilities will be shown as filled circles. The color and radius can be changed.
Click Add layer.
Modify a facility layer
-
In the layer panel, click the edit (pencil) icon on the facility layer card.
-
Modify the settings on the Org units and Style tabs as desired.
-
Click Update layer.
Filter values in a facility layer
Facility layers have a Show data table option in the more actions (three dots) menu of the layer card. When the table is open, the option changes to Hide data table.

The data table shows the data associated with the facility layer. Click the arrow buttons in a column header to sort by that column. Type in the filter fields below each column header to filter the rows shown. The name filter field is an effective way to search for individual facilities.
Note
Data table filters are temporary and are not saved with the map.
Open organisation unit profile
You can open the organisation unit profile in three ways:
-
Click an organisation unit on the map, then click the View profile button in the popup.
-
Right-click one of the organisation units on the map, and choose View profile from the menu.
-
Click an organisation unit row in the data table.
Remove a facility layer
To remove a facility layer from the map, in the layer card to the left, click the more actions (three dots) icon and then click Remove layer.
Manage organisation unit layers
The organisation unit layer shows the borders and locations of your organisation units. This layer is particularly useful if you are offline and do not have access to background maps.

Organisation unit layers are represented by layer cards in the layer panel. The more actions (three dots) button includes options to show or hide the data table and to download the data in GeoJSON format.
Create an organisation unit layer
To create an organisation unit layer, choose Org units on the Add layer selection. This opens the Org unit layer configuration dialog.
1. Org units

-
Choose the organisation units you want to include in the layer. You can freely combine specific org units, organisation unit levels, organisation unit groups, and relative user organisation units (User organisation unit, User sub-units, User sub-x2-units). When user organisation units are selected, the map data will appear according to the assigned organisation units for each user in the organisation unit hierarchy.
Tip: Levels and groups act as filters within the organisation units you choose - combining them will show only organisation units at those levels or in those groups that are descendants of your selected organisation units.
-
Use associated geometry: This field is shown only if there are additional geometries available for your organisation units. This is typically used to show facility catchment areas.
2. Style

-
Labels: Allows labels to be shown on the layer. Font style can be modified here.
-
Boundary color: Allows the boundary or outline color of the organisation units to be changed.
-
Point radius: Sets the base radius when point type elements, such as facilities, are presented on the organisation unit layer.
-
Count org units without coordinates: Organisation units without coordinates are counted and shown in a Data quality section of the legend. They also appear in the data table.
-
Organisation units with coordinates can be styled with an organisation unit group set using different colors. Choose a group set from the list of organisation unit group sets defined for your DHIS2 instance.
Include unclassified org units: Organisation units not belonging to any group in the selected group set are shown with a configurable color and label (default: "Unclassified").
Click Add layer.
Modify an organisation unit layer
-
In the layer panel, click the edit (pencil) icon on the organisation unit layer card.
-
Modify the settings on the Org units and Style tabs as desired.
-
Click Update layer.
Filter values in an organisation unit layer
Organisation unit layers have a Show data table option in the more actions (three dots) menu of the layer card. When the table is open, the option changes to Hide data table.

The data table shows the data associated with the organisation unit layer. Click the arrow buttons in a column header to sort by that column. Type in the filter fields below each column header to filter the rows shown. The name filter field is an effective way to search for individual organisation units.
The level column supports numeric filtering using comparison operators: >, <, >=, and <=, with , for OR and & for AND logic. For example: 2,>3&<8.
Note
Data table filters are temporary and are not saved with the map.
Open organisation unit profile
You can open the organisation unit profile in three ways:
-
Click an organisation unit on the map, then click the View profile button in the popup.
-
Right-click one of the organisation units on the map, and choose View profile from the menu.
-
Click an organisation unit row in the data table.
Navigate between organisation unit hierarchies
When there are visible organisation units on the map, you can navigate up and down in the hierarchy without changing the organisation unit selection.
-
Right-click one of the organisation units.
-
Choose Drill up one level or Drill down one level.
The drill down option is disabled if you are on the lowest level. Likewise, the drill up option is disabled from the highest level.
Remove an organisation unit layer
To remove an organisation unit layer from the map, in the layer card to the left, click the more actions (three dots) icon and then click Remove layer.
Manage Earth Engine layers

Google Earth Engine layers are enabled if a Google Earth Engine API key has been configured for your system. Contact your system administrator if you need access to these layers.
The layers from Google Earth Engine let you show and aggregate external data for your organisation units. Aggregated values can be viewed either in popups or in the data table.
Earth Engine layers are represented by layer cards in the layer panel. The more actions (three dots) button includes options to show or hide the data table and to download the data.

Note
The Maps app administrator can configure available layer sources.
The following layer sources are supported (sources marked with an asterisk "*" are available by default):
-
Population (group): Detailed population data from WorldPop. Estimates are provided annually and include current, historical, and projected population values. Available between 2015 and 2030.
- Population *: Total population count.
- Population age groups *: Population broken down by age and gender.
-
Building footprints *: The outlines of buildings derived from high-resolution satellite imagery. Only for sub-Saharan Africa, South and Southeast Asia, Latin America and the Caribbean.
-
Elevation *: Elevation above sea level.
-
Heat stress (group): Universal Thermal Climate Index (UTCI), a measure of the thermal stress experienced by a person in a given environment. Available from 1950.
- Heat stress daily.
- Heat stress weekly (derived from daily dataset).
- Heat stress monthly (derived from daily dataset).
-
Relative humidity (group): Relative humidity is the amount of water vapour present in air. Available from 1950.
- Relative humidity daily.
- Relative humidity weekly (derived from daily dataset).
- Relative humidity monthly.
-
Precipitation (group): Accumulated water that falls to the surface. Combines model data with observations from across the world. Two sources are available:
- ERA5-Land. Available from 1950.
- Precipitation daily.
- Precipitation weekly (derived from daily dataset).
- Precipitation monthly *.
- CHIRPS. Available from 1981.
- Precipitation daily.
- Precipitation weekly (derived from daily dataset).
- Precipitation monthly (derived from daily dataset).
- ERA5-Land. Available from 1950.
-
Temperature (group): Temperature at 2m above the surface. Combines model data with observations from across the world. Available from 1950.
- Temperature daily.
- Temperature weekly (derived from daily dataset).
- Temperature monthly *.
-
Landcover *: 17 distinct landcover types collected from satellites by NASA. Available yearly since 2001.
-
Vegetation: Normalized difference vegetation index (NDVI) and Enhanced Vegetation Index (EVI), used to quantify vegetation greenness. Collected from satellites by NASA. Available at 16-day intervals, from 2000.
- Vegetation 16-day
- Vegetation weekly (derived from 16-day dataset).
- Vegetation monthly (derived from 16-day dataset).
Create an Earth Engine layer
To create an Earth Engine layer, choose the desired layer from the Add layer selection. This opens the layer configuration dialog.
1. Data

-
Dataset (if within a data group):
- For Population you can choose either the Population or the Population age group dataset.
-
Data subset:
- For Population age groups you can choose the age/gender groups you would like to include when aggregating the data.
- For Temperature or Heat stress you can choose the temporal aggregation method you want to use (Mean, Min, Max).
- For Vegetation you can choose the index you want to use (NDVI or EVI).
-
Choose the spatial aggregation methods to use when calculating values for the selected org units. This only affects results in popups and the data table (some options might not be available depending on the layer source).
-
Sum: Calculates the total number within each organisation unit. Recommended to use for the population layers.
-
Min: Returns the minimum value in the layer unit shown below the selection. For population layers it will be the minimum people per hectare. For the elevation layer it will return the lowest elevation (meters above sea level).
-
Max: Returns the maximum value in the layer unit. For population layers it will be the maximum people per hectare. For the elevation layer it will return the highest elevation for each organisation unit.
-
Mean: Returns the mean value in the layer unit. For population layers it will be the mean people per hectare. For the precipitation layer it will be the mean rainfall in millimeters across the organisation unit.
-
Median: Returns the median value in the layer unit. For population layers it will be the median people per hectare. For the temperature layer it will be the median °C across the organisation unit.
-
Standard deviation: Returns the standard deviation value in the layer unit.
-
Variance: Returns the variance value in the layer unit.
-
Special cases:
- For "building footprints": Count: Returns the number of buildings within each org unit. Note that building counts are only available for smaller organisation unit areas.
- For "landcover": Percentage, Hectares, Acres: Return the area covered by each landcover category within each organisation unit in different units.
-
2. Period

-
Choose the period type (if multiple sources are enabled for Heat stress, Precipitation, Temperature, or Vegetation).
-
Choose the period for the data source. The available periods are set by the layer source. Some sources are only available at a single point in time.
3. Org units
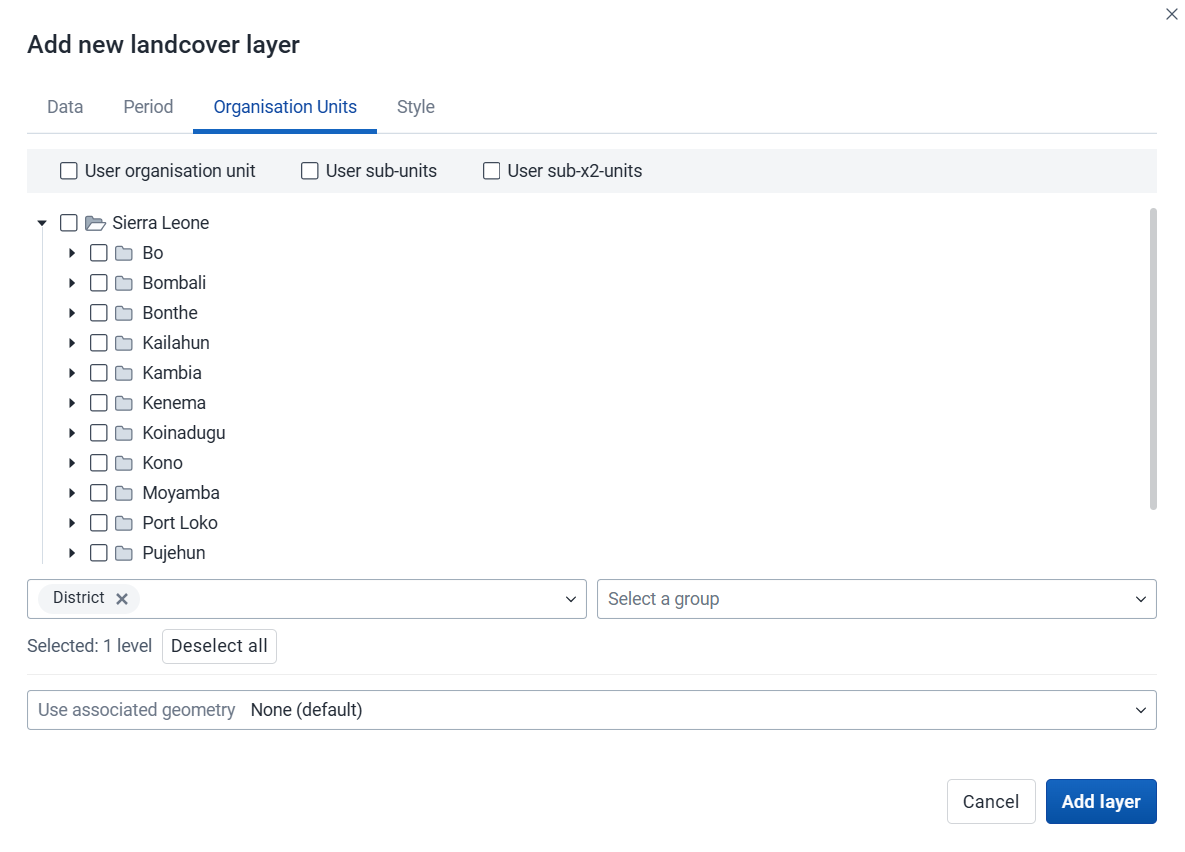
-
Choose the organisation units where you want to see aggregated data values. You can freely combine specific organisation units, organisation unit levels, organisation unit groups, and relative user organisation units (User organisation unit, User sub-units, User sub-x2-units). When user organisation units are selected, the map data will appear according to the assigned organisation units for each user in the org unit hierarchy.
Tip: Levels and groups act as filters within the organisation units you choose - combining them will show only organisation units at those levels or in those groups that are descendants of your selected organisation units.
-
Use associated geometry: This field is shown only if there are additional geometries available for your organisation units. This is typically used to calculate values for facility catchment areas.
4. Style

-
Adjust the legend Min, Max, number of Classes, and color map, as desired.
-
Buffer: If you choose organisation units with a single point coordinate (facilities), you can set a radius buffer to calculate the data value within. A radius of 5000 meters will aggregate all values available within a 5 km distance from a facility. Buffer option is not available if associated geometry is used.
-
Count org units without coordinates: Organisation units without coordinates are counted and shown in a Data quality section of the legend. They also appear in the data table.
Click Add layer.
Click an organisation unit or facility on the map to see the aggregation result.
Modify an Earth Engine layer
-
In the layer panel, click the edit (pencil) icon on the Earth Engine layer card.
-
Modify the settings on the Data, Period, Org units, and Style tabs as desired.
-
Click Update layer.
Filter values in an Earth Engine layer
Earth Engine layers have a Show data table option in the more actions (three dots) menu of the layer card. When the table is open, the option changes to Hide data table.

The data table shows all the aggregated values for the selected organisation units. Click the arrow buttons in a column header to sort by that column. Type in the filter fields below each column header to filter the rows shown.
There is one column for each selected aggregation type. These numeric columns support comparison operators: >, <, >=, and <=, with , for OR and & for AND logic. For example: 2,>3&<8.
Note
Data table filters are temporary and are not saved with the map.
Open organisation unit profile
You can open the organisation unit profile in three ways:
-
Click an organisation unit on the map, then click the View profile button in the popup.
-
Right-click one of the organisation units on the map, and choose View profile from the menu.
-
Click an organisation unit row in the data table.
Remove an Earth Engine layer
To remove an Earth Engine layer from the map, in the layer card to the left, click the more actions (three dots) icon and then click Remove layer.
Add external map layers

External map layers are represented as either basemaps or overlays.
Note
The Maps app administrator can add external map layers.
-
Basemaps
These are available in the basemap card in the layers panel and are selected as any other basemap.
-
Overlays
These are available in the Add layer selection. Unlike basemaps, overlays can be placed above or below any other overlay layers.
Overlay layers are represented by additional layer cards in the layer panel.
Along the top of the overlay card from left to right are:
-
A grab field to allow dragging and re-ordering layers with the mouse
-
The title of the external map layer
-
An arrow symbol to collapse or expand the overlay card
In the middle of the card is a legend if the layer has one.
Along the bottom of the overlay card from left to right are:
-
An eye symbol to toggle the visibility of the layer
-
A slider for modifying the layer transparency
-
A more actions (three dots) button with options to duplicate the layer and to remove it from the current map
GeoJSON external layers
If you add a GeoJSON external layer to your map, you will have a few style choices:

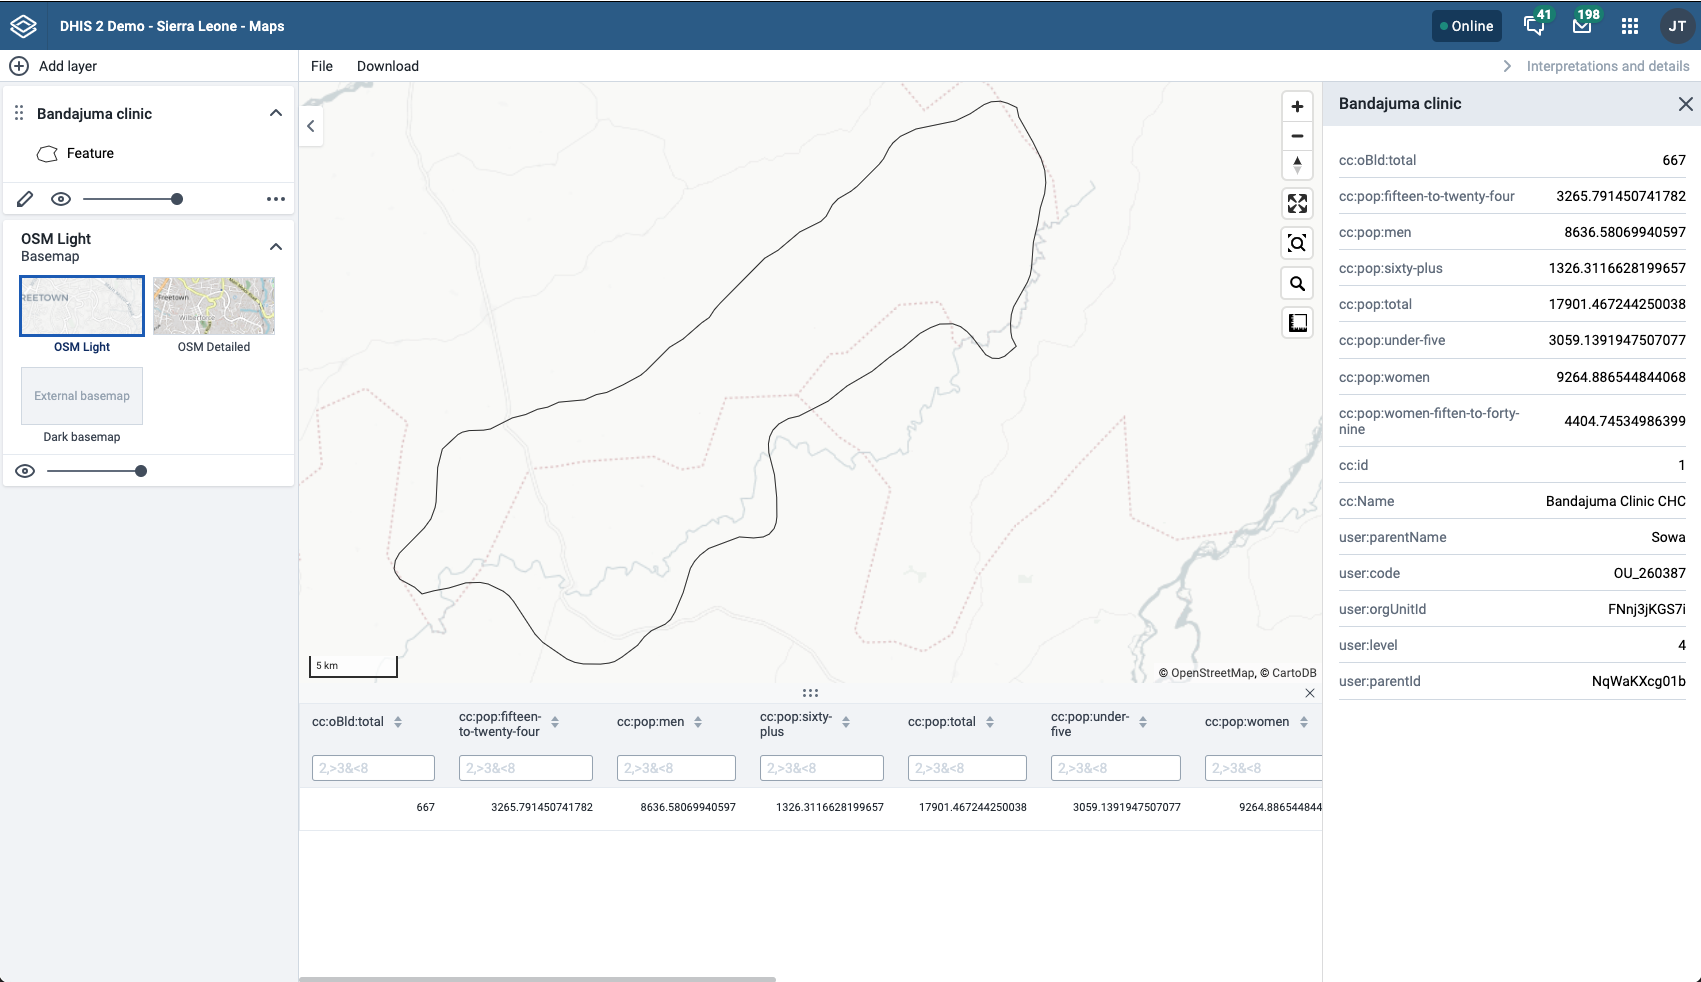
After the GeoJSON layer appears, you can open its data table with Show data table in the more actions (three dots) menu. The menu also has an option to download the data.

As with other layers, you can sort and filter the data. If you want to view the data for one row, click the row to open the Feature Profile:
Organisation unit profile
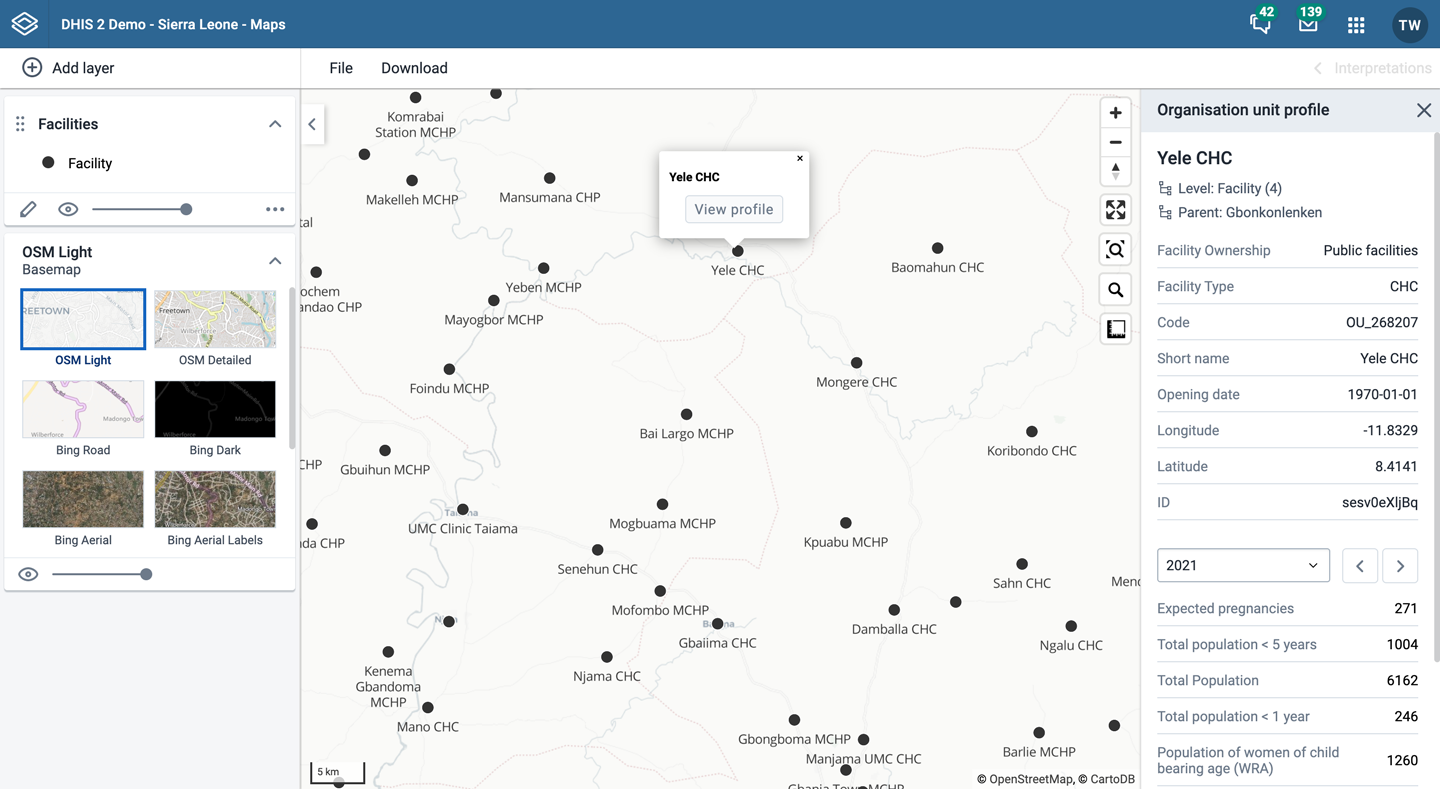
The organisation unit profile shows detailed information about each organisation unit. You can open the profile from organisation unit layers, facility layers, thematic layers, and Earth Engine layers.
You can open the organisation unit profile in three ways:
-
Click an organisation unit on the map, then click the View profile button in the popup.
-
Right-click one of the organisation units on the map, and choose View profile from the menu.
-
Click an organisation unit row in the data table.
The profile will show on the right side of the map. The profile content is set by the system administrator.
File menu

Use the File menu to manage your maps. Several menu items will be disabled until you open or save a map.
Saving your maps makes it easy to restore them later. It also gives you the opportunity to share them with other users as an interpretation or add them to a dashboard. You can save all types of layer configurations as a saved map.
Create a new map
Click File > New.
Note
This will discard the current map without saving.
Open a map
-
Click File > Open. A dialog box opens with a list of maps.
-
Find the saved map you want to open. You can either use \< and > or the search field to find a saved map. The list is filtered on every character that you enter. You can filter the list by choosing Show all, Created by me or Created by others.
-
Click the name of the map you want to open.
Save a map
When you have created a map it is convenient to save it for later use:
-
Click File > Save.
-
Enter a Name (required) and a Description (optional) the first time you save a map.
-
Click Save.
Save a copy of a map
-
Click File > Save as...
-
Enter a Name (required) and a Description (optional) for the map.
-
Click Save.
Rename a map
-
Click File > Rename.
-
Enter a new Name and/or Description for your map.
-
Click Rename. The map is updated.
Translate a map
-
Click File > Translate.
-
Choose the Locale (language) for your translation.
-
Enter a translated Name and Description. The original text will show below the field.
-
Click Save.
Modify sharing settings for a map
After you have created a map and saved it, you can share the map with everyone or a user group. To modify the sharing settings:
-
Click File > Share. The sharing settings dialog opens.
-
Give access to a user or group: In the field, search for the name of the user or group you want to share your saved map with and choose it.
Choose the access level and click Give access.
Repeat the step to add more users or groups.
-
Users and groups that currently have access: For each user or group, choose the access level. The options are:
-
No access: The public will not have access to the map. This setting is only applicable to All users.
-
View only: Users can view but not edit the map.
-
View and edit: Users can view and edit the map.
-
Remove access: Remove the access for groups or individuals.
-
-
Click Close to close the dialog.
Get the link to a map
-
Click File > Get link. A link dialog opens.
-
Copy the link.
Delete a map
-
Click File > Delete. A confirmation dialog is shown.
-
Click Delete to confirm that you want to delete the saved map. Your map is deleted and the layers are cleared from the view.
Map interpretations and details
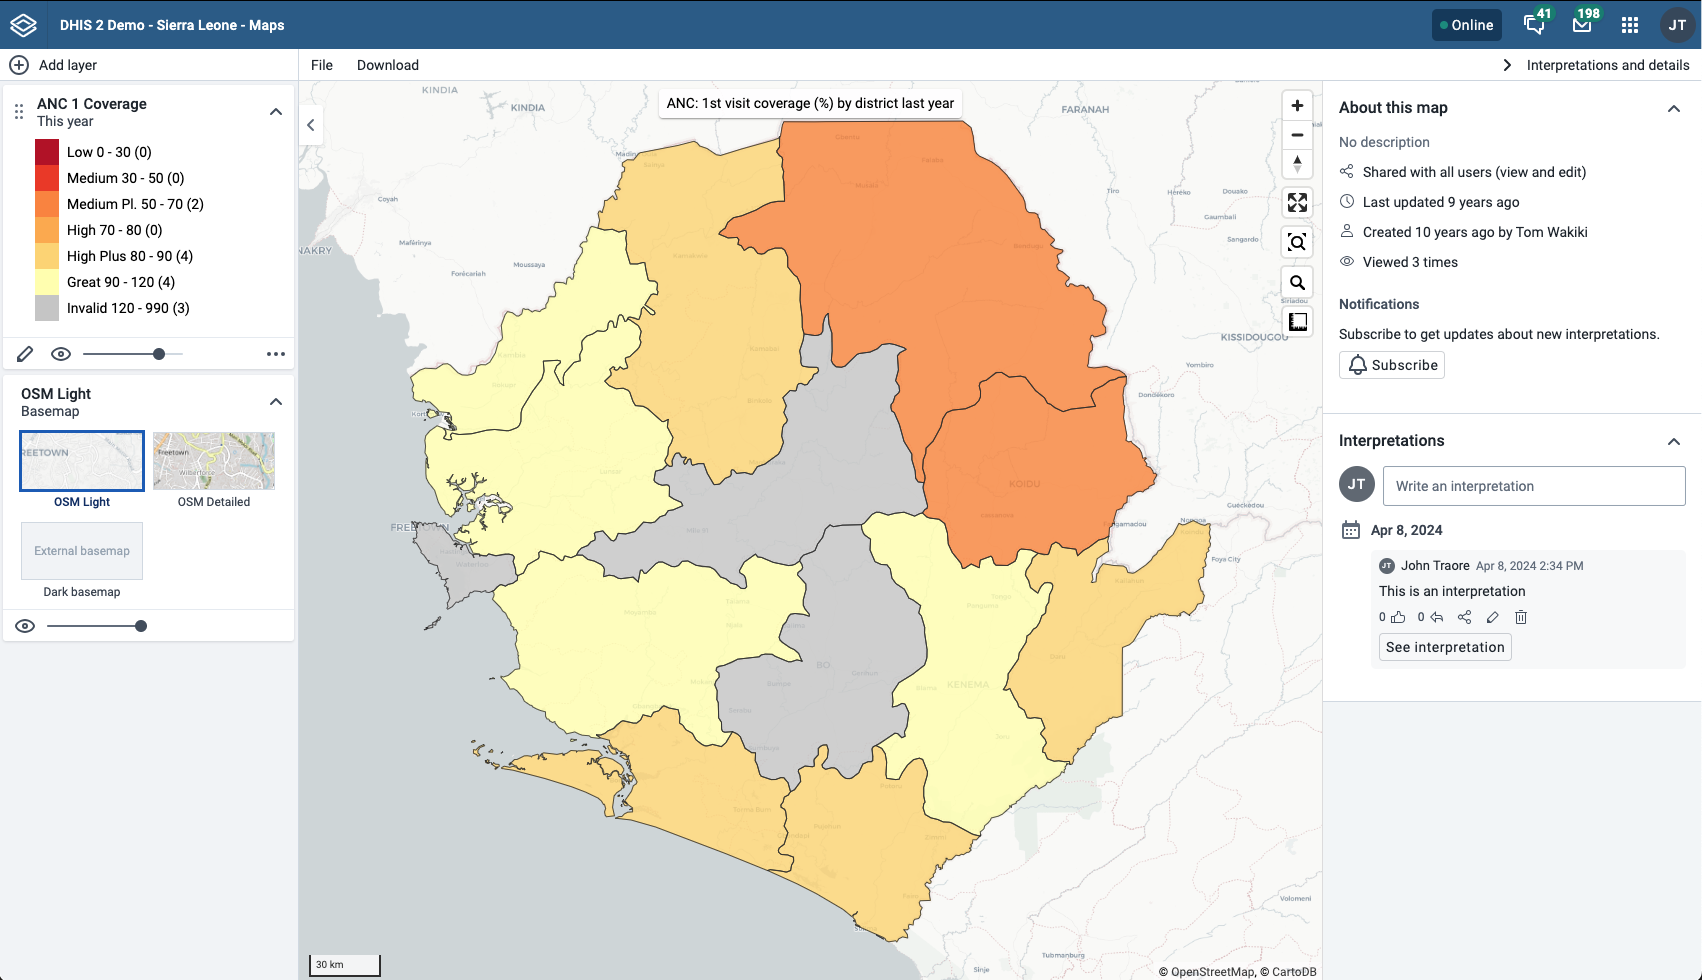
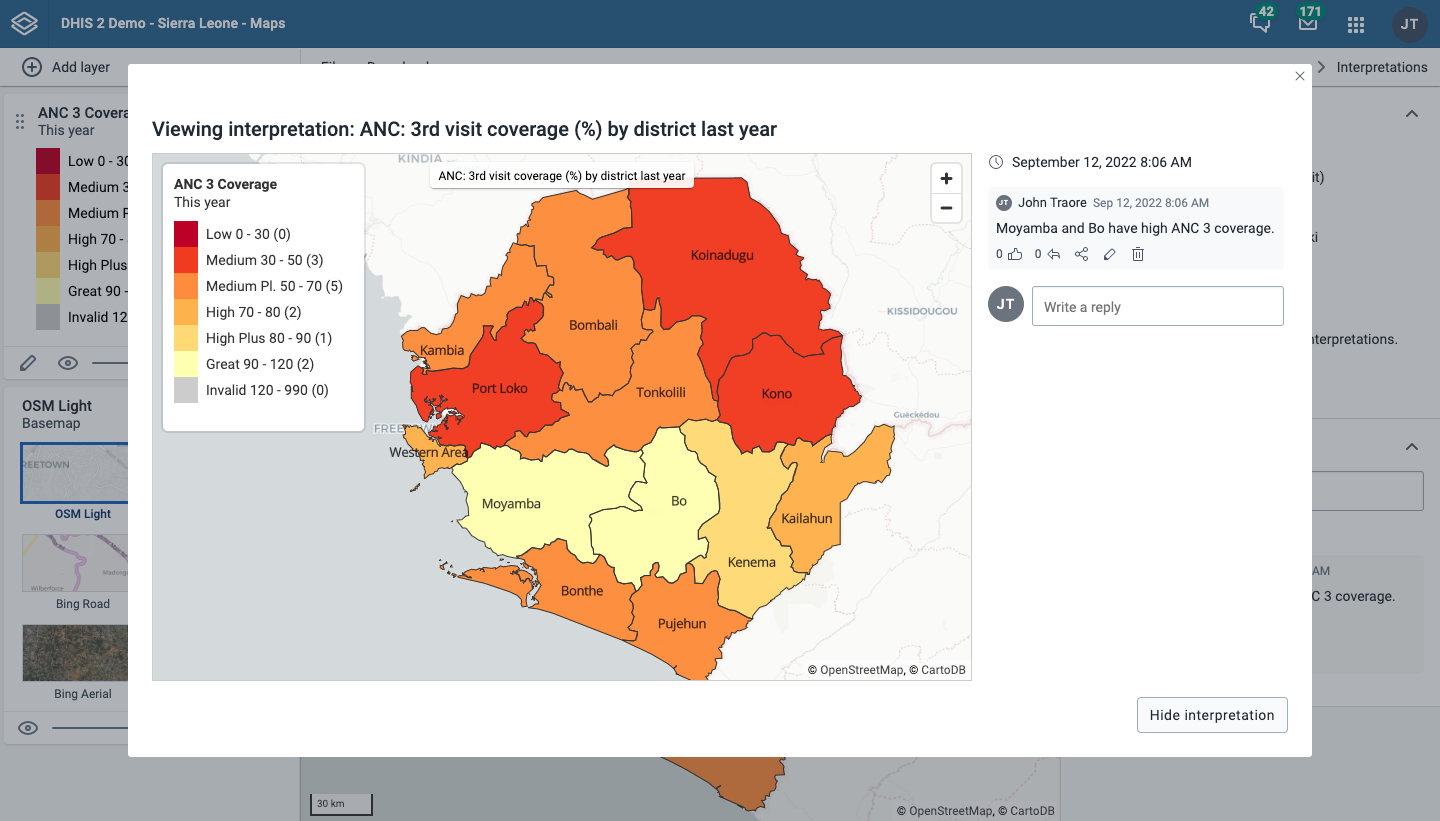
An interpretation is a description of a map for a given period. This information is also visible in the Dashboard app. Click Interpretations and details in the top right of the workspace to open the interpretations panel. The button is only available when the map has been saved.
View interpretations based on relative periods
To view interpretations for relative periods, such as a year ago:
-
Open a saved map with interpretations.
-
Click Interpretations and details in the top right of the workspace to open the interpretations panel.
-
Click See interpretation. Your map shows the data and the date based on when the interpretation was created. To view other interpretations, click them.
Write interpretation for a map
To create an interpretation, you first need to create a map and save it. If you have shared your map with other people, the interpretation you write is visible to those people.
-
Open a saved map.
-
Click Interpretations and details in the top right of the workspace to open the interpretations panel.
-
A text field appears where you can write an interpretation.
-
In the text field, type a comment, question or interpretation. You can also mention other users with
@username. Start by typing@followed by the first letters of the username or real name, and a list of matching users will appear. Mentioned users will receive an internal DHIS2 message with the interpretation or comment. You can see the interpretation in the Dashboard app. -
Click Post interpretation to save the interpretation.
Change sharing settings for an interpretation
-
Click an interpretation (see the section View interpretations based on relative periods).
-
Click the share icon below the interpretation. The sharing settings dialog opens.
-
Search for and add users and user groups that you want to share your map with, and set the access level. Click Give access.
-
Change the access level for the users you want to modify:
-
No access: The public will not have access to the map. This setting is only applicable to All users.
-
View only: Users can view but not edit the map.
-
View and edit: Users can view and edit the map.
-
Remove access: Remove the access for groups or individuals.
-
-
Click Close when sharing settings are updated.

Save a map as an image
You can download your map as an image by clicking the Download button in the top menu.
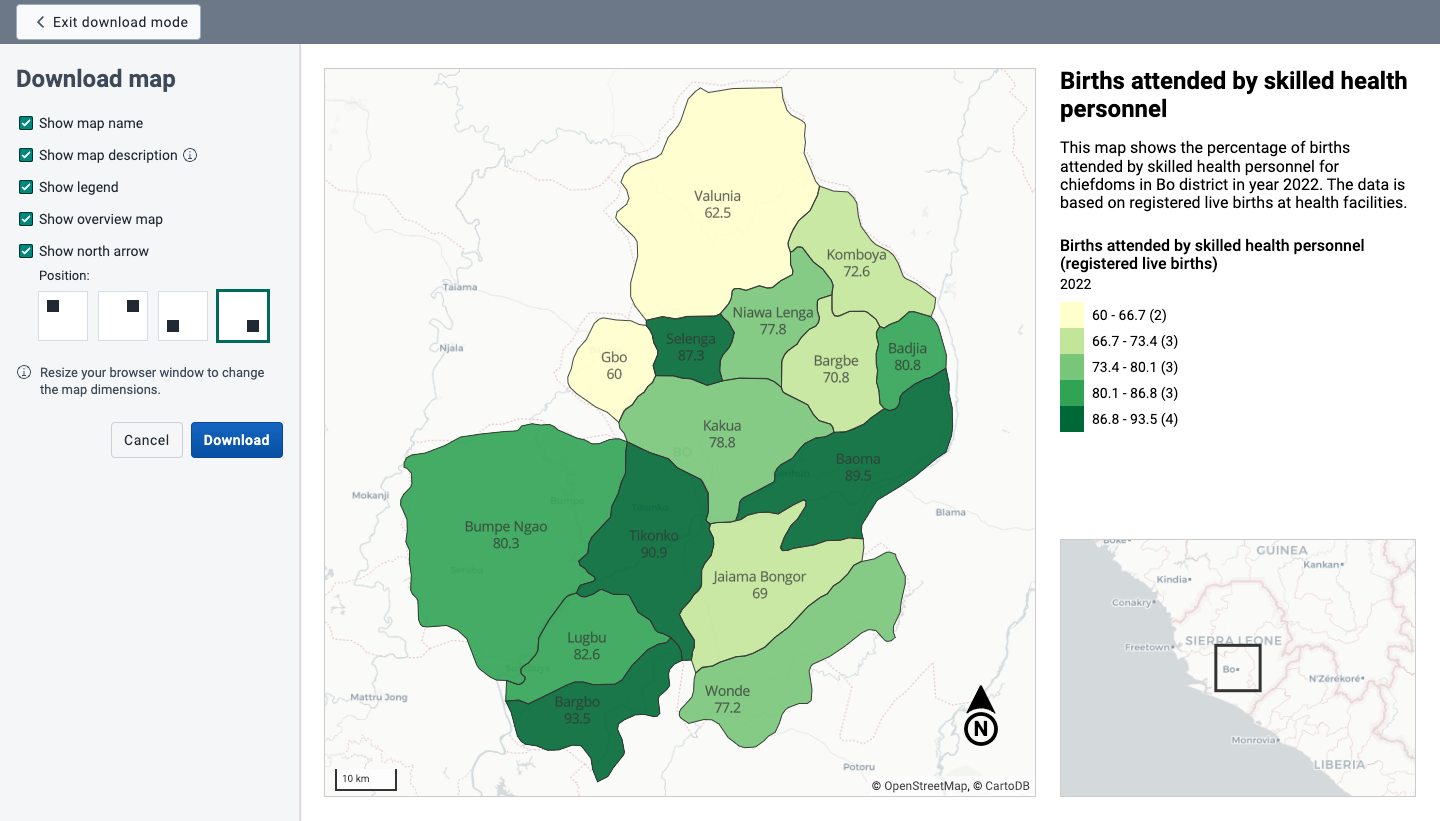
You will enter Download mode where you can adjust the map layout before you download the image. The left column gives you the following options:
- Show map name: Choose if you want to include the map name or not. This option is only available if the map is saved. To change the name, exit download mode and choose File > Rename.
- Show map description: Choose if you want to include the map description or not. This option is only available if a map description was added when the map was saved. To change the map description, exit download mode and choose File > Rename.
- Show legend: Choose if you want to include the map legend. If the map includes more than one layer, you can choose the visibility for each legend.
- Show overview map: Choose if you want to include an overview map (often named inset map). This option will be disabled if there is not enough room for it in the right column.
- Show north arrow: Choose to include a north arrow on the map. The default position is the lower right corner of the map, but you can change it to another corner.
Click Download to download your map.
Resize your browser window to change the map dimensions. You can also reposition both the main map and the overview map.
Search for a location
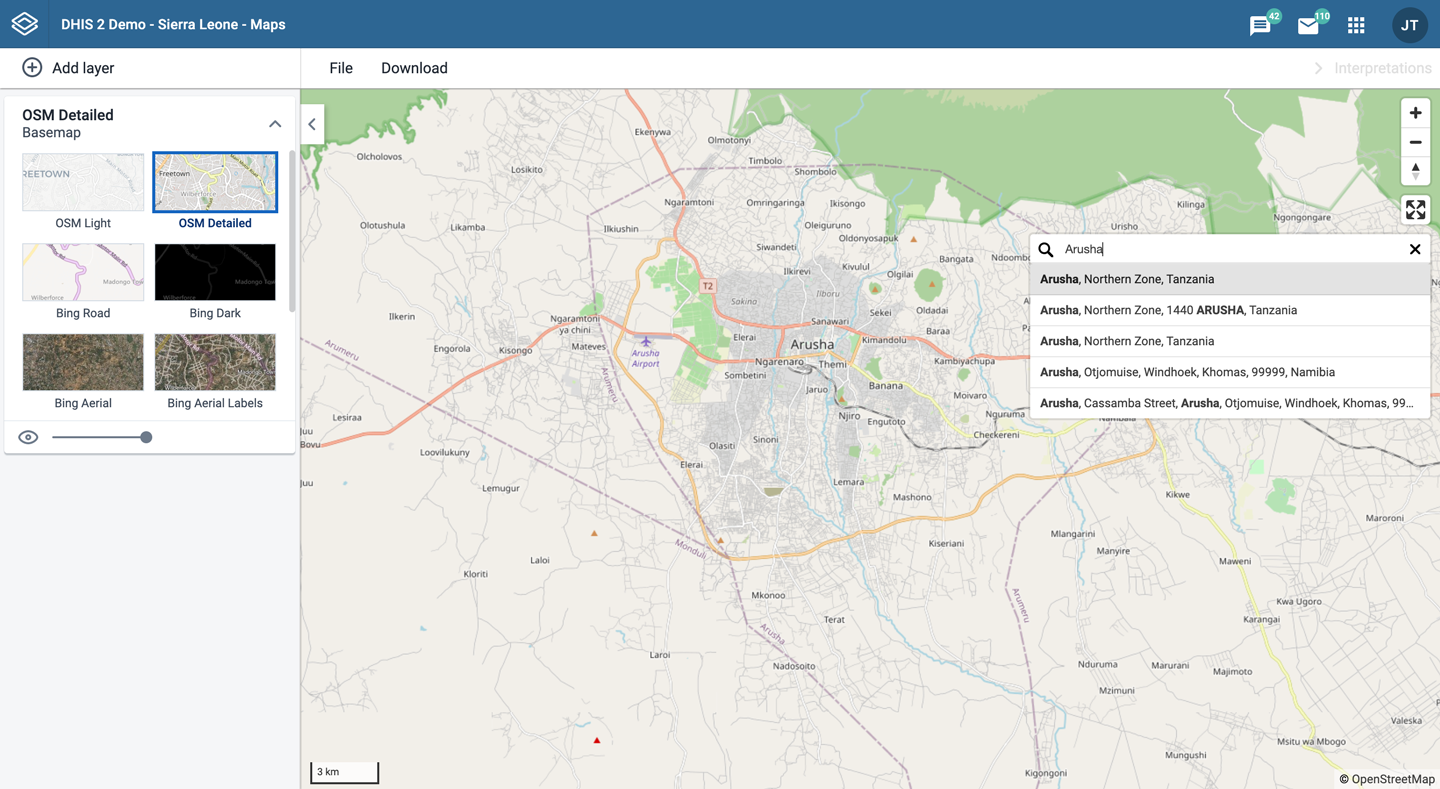
The place search function allows you to search for almost any location or address. This is useful to locate sites, facilities, villages or towns on the map.
-
On the right side of the Maps window, click the magnifier icon.
-
Type the location you are looking for.
A list of matching locations appear as you type.
-
From the list, choose a location. A pin indicates the location on the map.
Measure distances and areas in a map
-
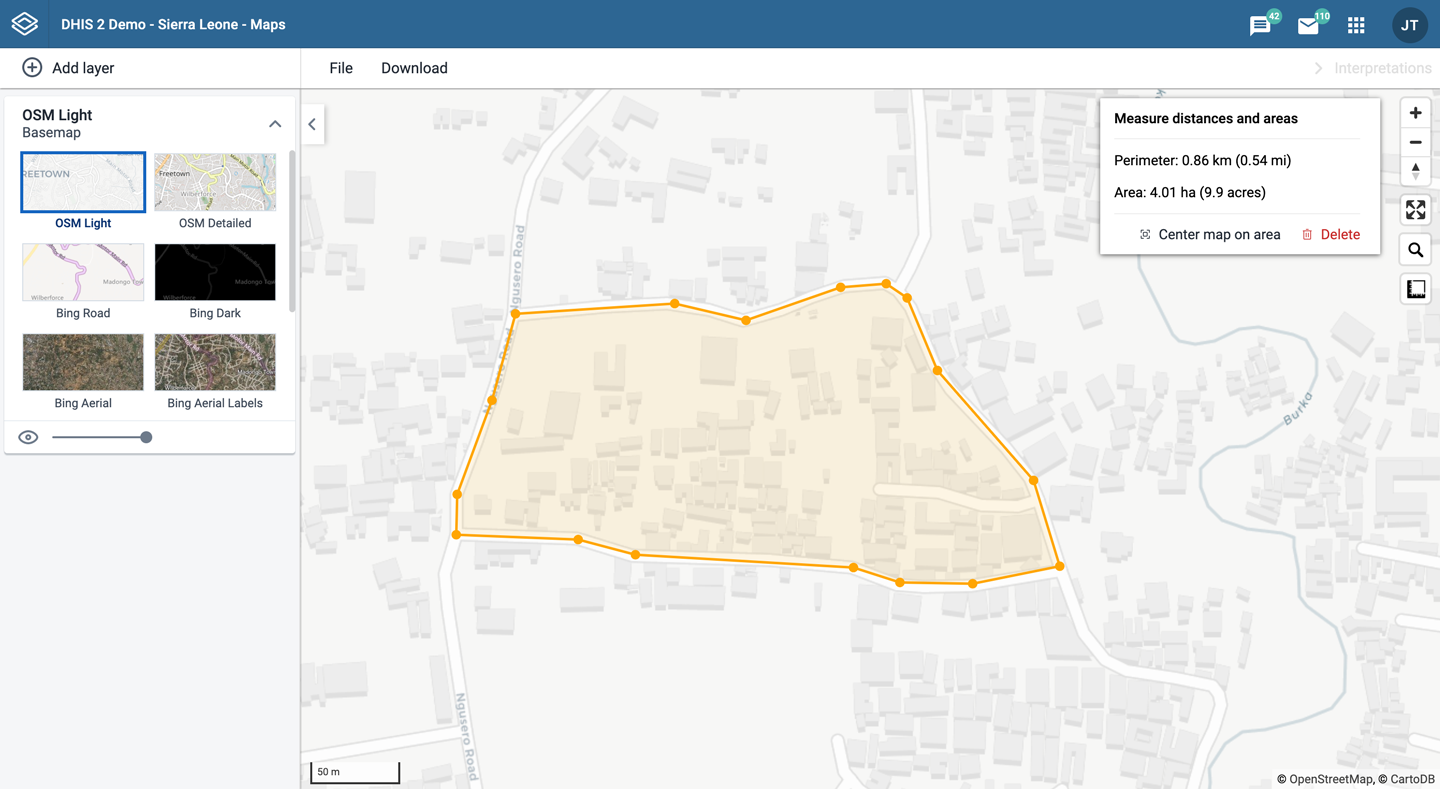
In the upper left part of the map, put the cursor on the Measure distances and areas (ruler) icon and click Create new measurement.
-
Add points to the map.
-
Click Finish measurement.
Get the latitude and longitude at any location
Right-click a point on the map and choose Show longitude/latitude. The values are shown in a popup window.
Maps app administrator
A Maps app administrator can be defined by the system administrator assigning the F_EXTERNAL_MAP_LAYER_PUBLIC_ADD authority. Users with the ALL authority are also Maps app administrators.
The Maps app administrator is able to:
- Choose the sources for Google Earth Engine layers available to other users using the Manage available layer sources button.

- Add new external layer sources in the Maintenance app. The Metadata Management app does not manage external map layers.
See also
-
Configuration:
- Configure DHIS2 Maps
- Accessing map layers from Google Earth Engine
- Geo-enabled microplanning, including details about facility catchment areas
-
Settings:
- Infrastructural indicators / Infrastructural data elements / Infrastructural period type
- Use centroids for organisation unit polygons in event analytics / Organisation unit group set in facility map layers / Organisation unit level in facility map layers / Default basemap
- Google Maps / Bing / Azure API keys
-
Metadata management:
-
Training: