Funcionalidade de relatórios no aplicativo de relatórios
O aplicativo de relatórios permite relatórios prontos, relatórios padrão, relatórios de conjuntos de dados, recursos e relatórios de distribuição de unidades organizacionais.
Usando relatórios padrão
You access the available reports by navigating to Apps->Reports. In the report menu in the left bar, click Standard Report. A list of all pre-defined reports will appear in the main window.
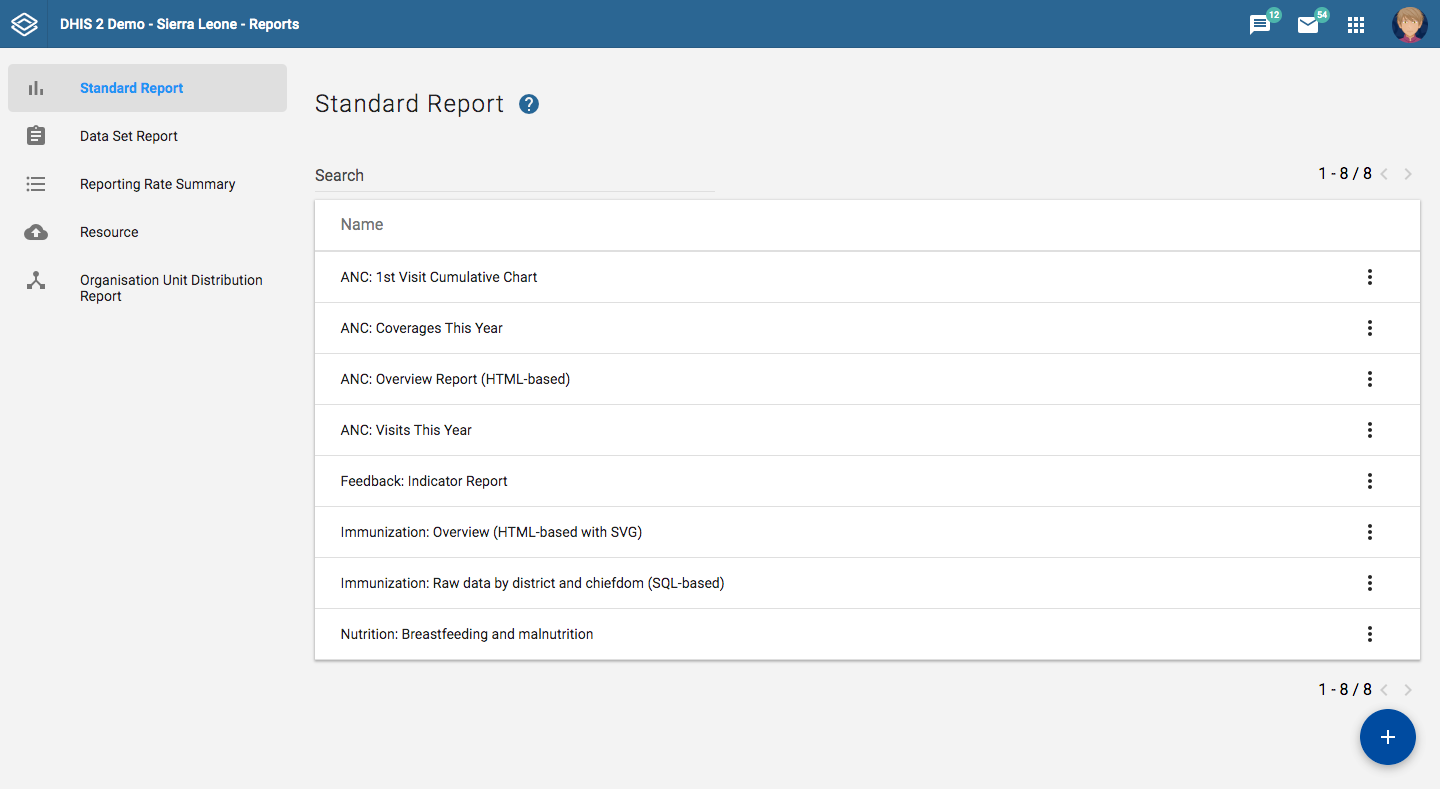
You run/view a report by clicking on the triple-dot icon of the report and then selecting "Create" from the contextual menu. If there are any pre-defined parameters, you will see a report parameter window where you must fill in the values needed for orgunit and/or reporting month, depending on what has been defined in the underlying report table(s). Click on "Generate Report" when you are ready. The report will either appear directly in your browser or be available as a PDF file for download, depending on your browser settings for handling PDF files. You can save the file and keep it locally on your computer for later use.
Usando relatórios de conjunto de dados
Dataset reports are printer friendly views of the data entry screen filled with either raw or aggregated data.
You can access data set reports from Apps->Reports.
A Criteria window will appear where you fill in the details for your report:
** Conjunto de dados: ** o conjunto de dados que você deseja exibir.
Report period: The actual period you want data for. This can be aggregated as well as raw periods. This means that you can ask for a quarterly or annual report even though the data set is collected monthly. A data set's period type (collection frequency) is defined in data set maintenance. First select the period type (Monthly, Quarterly, Yearly etc.) in the drop down next to Prev and Next buttons, and then select one of the available periods from the dropdown list below. Use Prev and Next to jump one year back or forward.
Use data for selected unit only: Use this option if you want a report for an orgunit that has children, but only want the data collected directly for this unit and not the data collected by its children. If you want a typical aggregated report for an orgunit you do not want to tick this option.
Report Organisation unit: Here you select the orgunit you want the report for. This can be at any level in the hierarchy as the data will be aggregated up to this level automatically (if you do not tick the option above).
When you are done filling in the report criteria you click on "Generate". The report will appear as HTML in a printer-friendly format. Use the print and save as functions in the browser to print or save (as HTML) the report.You can also export the data set report in Excel and PDF formats.
Usando o resumo da taxa de relatório
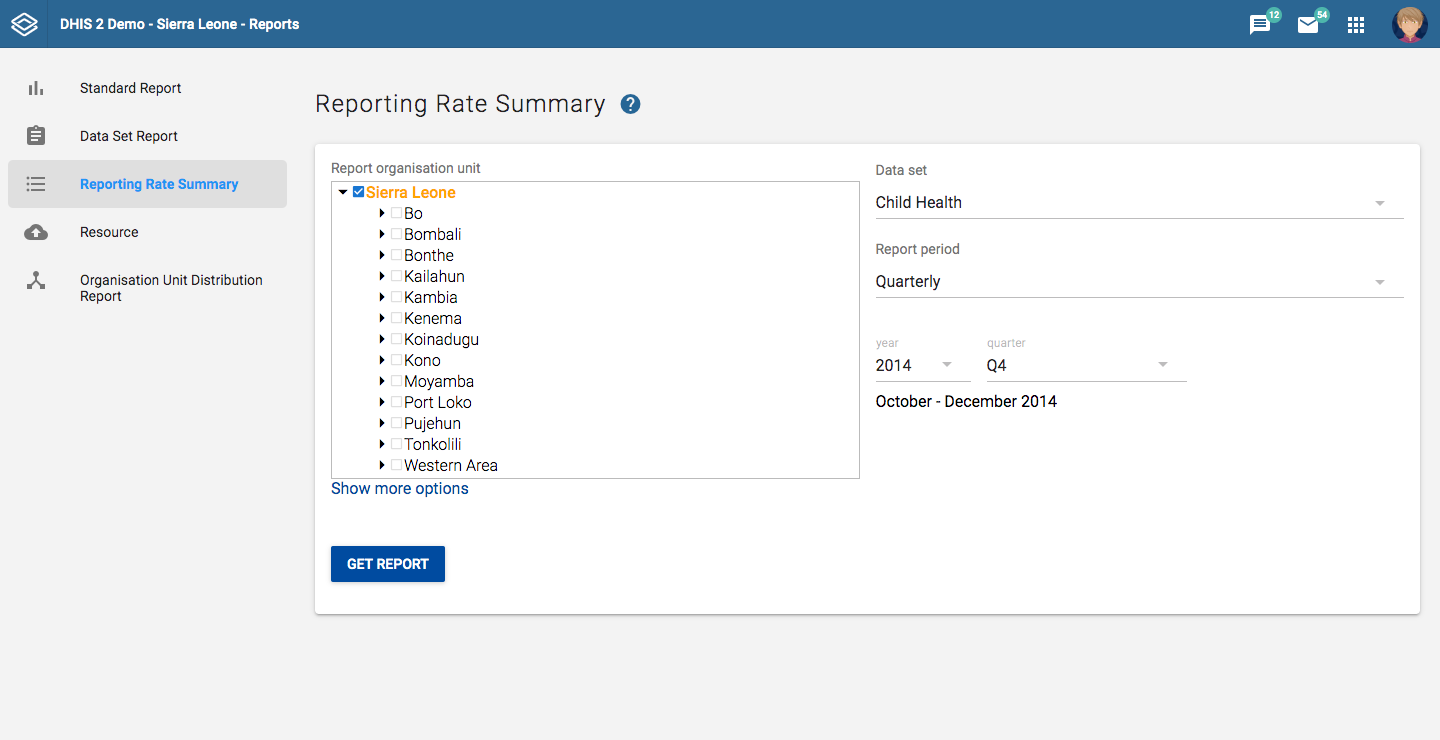
Access the reporting rate summary from the Apps->Reports menu. Reporting rate summaries will show how many datasets (forms) that have been submitted by organisation unit and period.
The reporting rate is calculation is based on complete data set registrations. A complete data set registration refers to a user marking a data entry form as complete, typically by clicking the complete button in the data entry screen, hereby indicating to the system that she considers the form to be complete. This is i.e. a subjective approach to calculating completeness.
O resumo da taxa de relatório, para cada linha, mostrará uma série de medidas:
-
Actual reports: Indicates the number of data entry complete registrations for the relevant data set.
-
Expected reports: Indicates how many data entry complete registrations are expected. This number is based on the number of organisation units the relevant data set has been assigned to (enabled for data entry).
-
Reporting rate: The percentage of reports registered as complete based on the number expected.
-
Reports on time: Same as actual reports, only reports registered as complete within the maximum number of days after the end of the reporting period. This number of days after reporting period can be defined per data set in the data set management.
-
Reporting rate on time: Same as percentage, only reports registered as complete on time used as numerator.
Para executar o relatório, você pode seguir estas etapas:
-
Selecione um orgunit da árvore.
-
Selecione um conjunto de dados.
-
Select a period type and a period from the list of available periods for that period type.
-
The report will then be rendered. Change any of the parameters above and click "Get report" again see the corresponding results.
Usando recursos
The resource tool allows you to upload both files from your local computer to the DHIS server and to add links to other resources on the Internet through URLs. If cloud storage is configured for your system, resources will be saved there.
Para criar um novo recurso:
-
Open the Reports app and click Resource.
-
Clique em ** Adicionar novo **.
-
Insira um nome.
-
Selecione um ** Tipo **: ** Carregar arquivo ** ou ** URL externo **.
-
Clique em Salvar.
Usando relatórios de distribuição de unidade organizacional
You can access the Orgunit Distribution reports from the left side menu in the Apps->Reports.
Orgunit distribution reports are reports that show how the orgunits are distributed on various properties like type and ownership, and by geographical areas.
O resultado pode ser apresentado em um relatório baseado em tabela ou em um gráfico.
** Executando um relatório: **
To run a report first select an orgunit in the upper left side orgunit tree. The report will be based on orgunits located under the selected orgunit. The select the orgunit group set that you want to use, typically these are Type, Ownership, Rural/Urban, but can be any user-defined orgunit group set. The you can click on either Get Report to get the table-based presentation or Get chart to get the same result in a chart. You can also download the table-based report as Excel or CSV.
