Immunization Triangulation Dashboard Design
Introdução
Triangulation is the synthesis of two or more existing data sources to address relevant questions for program planning and decision-making. Triangulation using multiple data sources such as doses administered, stock reports, coverage rates that incorporate population denominator sources, and surveillance data for vaccine-preventable diseases is expected to:
- Improve immunization program performance
- Reduce immunity gaps
- Reach zero-dose children with life-saving vaccines
When DHIS2 is used as an integrated health information platform, it is possible to design dashboards that pull data from different programs and data sources for analysis and triangulation. Even in absence of perfect data, public health practice has long recognized that combining many pieces of weaker evidence can form strong basis for improved decision-making. The principles of data triangulation are:
- Driven by important program objectives
- Use existing data, no new data are collected
- Include diverse data sets (e.g. coverage, stock, surveillance)
- Engage a multidisciplinary team, if possible
- Basic analysis that includes local knowledge in interpretation
- Results communicated for use in improved decision-making
The triangulation dashboard package for immunization programs provides practical examples of visualizations for data triangulation recommended by subject matters experts at CDC and WHO. These dashboards are aligned to the Triangulation for improved decision-making in immunization programmes guidelines (CDC, UNICEF and WHO, 2020).
Acknowledgements
This package was designed in collaboration with subject matter experts from US CDC's Global Immunization Division and the WHO Immunization, Vaccines & Biologics (IVB) department, with substantial inputs from the global HISP network and Ministries of Health who are also using DHIS2 to bring data together for triangulation. Funding support is generously provided by CDC and Gavi, the Vaccine Alliance.
Design Overview
The dashboards included in this package are developed re-using the underlying metadata (indicators, data elements) from the following WHO-approved packages:
- Immunization (EPI) aggregate package for HMIS
- Integrated Disease Surveillance (IDS) aggregate package
- Case-based tracker for vaccine-preventable diseases (VPDs)
NOTE: Please note that the dashboards described in this document and available in the downloadable package are fully based on the measles vaccine as an example for data use. The dashboards and visualizations can be uptaken and generated locally with any other relevant vaccine for the purpose of analysis.
Programme Performance & Data Quality
The dashboard [EPI - Programme Performance] is designed to:
- Allow staff at the national, sub-national and health facility level monitor their immunization programme performance
- Identify potential data quality issues needing further investigation
- Prioritize sub-national areas or health facilities for supportive supervision
Measles/Rubella suspected cases IDS vs VPD-CS
Suspected disease cases reported in the aggregate and case-based surveillance systems can be compared to assess the completeness of investigating suspected cases.
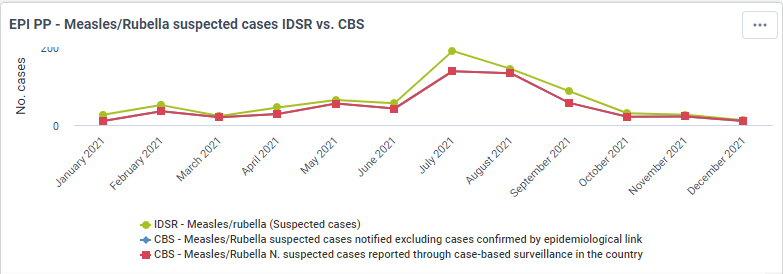
Observe trends over time in the difference between the cases reported in aggregate vs. case-based surveillance. What could these changes be due to (e.g., have there been changes in surveillance guidelines during this time period)? Refer to the suspect disease case definition that the country uses. If you notice higher numbers of suspected cases reported through the aggregate surveillance system than the case-based surveillance system, it indicates that there is incomplete case investigation.
Measles confirmed cases IDS vs VPD-CS
Confirmed disease cases reported in both systems can also be compared. Be sure to include in your graphs the case classification (laboratory-confirmed case, epidemiologically-linked case, clinically compatible case) of the confirmed cases reported in the case-based surveillance system to assess how robust the data are.
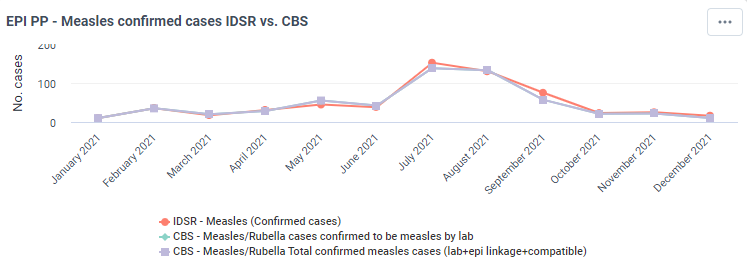
Observe trends over time in the difference between the cases reported in aggregate vs. case-based surveillance. What could these changes be due to (e.g., have there been changes in surveillance guidelines during this time period)?
Ratio of DPT-HepB-HIB 3 to PCV3 and OPV3 doses given
Check for consistency between the same antigens given in a series or different antigens represented at the same age or opportunity. The combination graph shows reported doses given at the same opportunity and ratios of these doses for a single area by month. This type of analysis is most informative at the sub-national or health facility level.
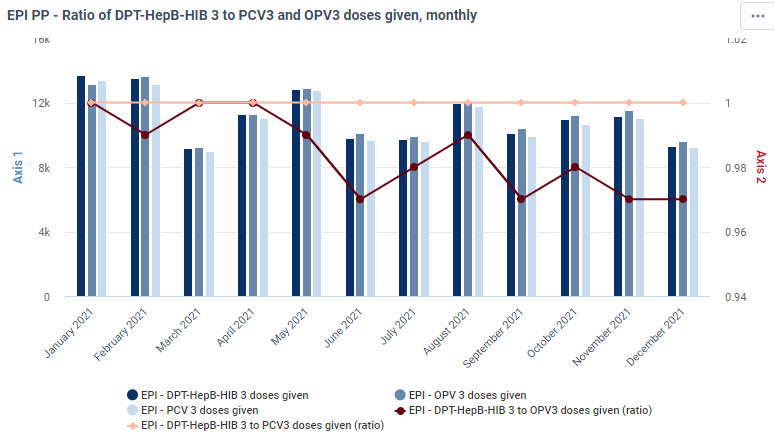
Antigen doses given close in age (e.g., DTP1 and DTP3) are expected to be close, if not decline, related to loss to follow-up, so negative drop-out trends should be investigated. Antigen doses given at the same age should have similar reported data because of being provided at the same healthcare opportunity, but can differ because of stockouts of particular antigens, false contraindications to providing a particular vaccine, or reporting errors. Consult the national immunization schedule for what comparisons may be helpful.
NOTE
The same analysis can be done comparing other antigens like MR1 and Yellow fever (Ratio of MR1 to Yellow Fever doses given, monthly visualization)
Dropout rates by org unit
Analysis of under-immunized persons (drop-outs) alongside coverage are particularly useful for targeting resources. Looking at specific drop-out rates across the vaccination schedule such as BCG-MR1 (or DTP1-MR1), DTP1-DTP3, and MR1-MR2 can be helpful in assessing at what stage in the schedule most of the dropout is occurring. Drop-out rates trends should be assessed by subnational area.

If there are high drop-out rates (>10%), it indicates there are vaccine utilization issues. These subnational areas are in need of remediation. What is the extent of anomalies (i.e., negative drop-out) in reporting across subnational areas? Negative drop-out rates should be investigated in the field.
DPT-HepB-HIB doses available vs doses given vs doses used
Assess vaccine wastage and consistency across doses administered, vaccine stock and supply data. As part of assessing data quality, it can be helpful to compare Total Pentavalent doses given (Penta1 + Penta2 + Penta3) with Pentavalent vials used and Pentavalent vials received at the service delivery level, or lowest level of data available. Examining the number of Pentavalent doses available (Open + Received) and closing balance is also helpful to view in a time series to evaluate issues of unreliable stock and shortages.
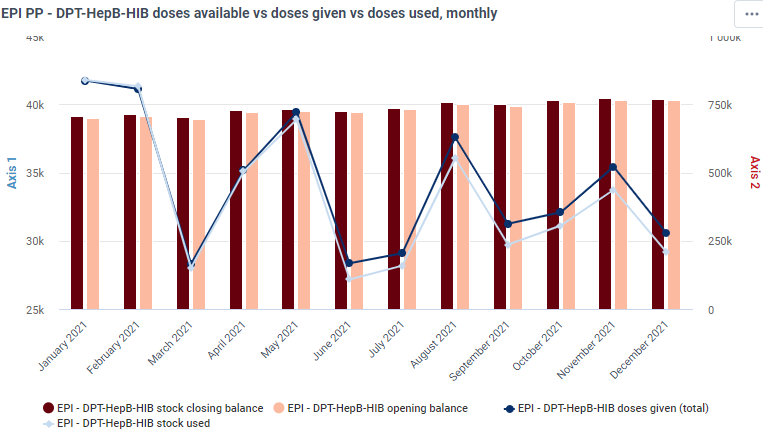
Examine total reported values for the year by health unit. The expectation is that Pentavalent vials received and used should be the same as or exceed the number of children given Pentavalent doses. Viewing month-wise EPI and stock reports can reveal differences over time, and should be done for all health units. Are there health units having unexpectedly high or low vaccine wastage rates? Do any report giving more doses given than vials used? Do any health units appear to have stock shortages? Why? If a stockout was reported, did the doses administered increase after stock was restored (e.g., catch-up)?
DPT-HepB-HIB doses given vs. doses opened and open vaccine wastage rates
Reported vaccine stock data (e.g., vials used) are a commonly available data source and provide a ready opportunity for comparison with doses administered and programme targets. A heat map of doses administered, doses used and vaccine wastage by district/facility may help inform sub-national areas or health facilities that require additional investigation and supportive supervision.
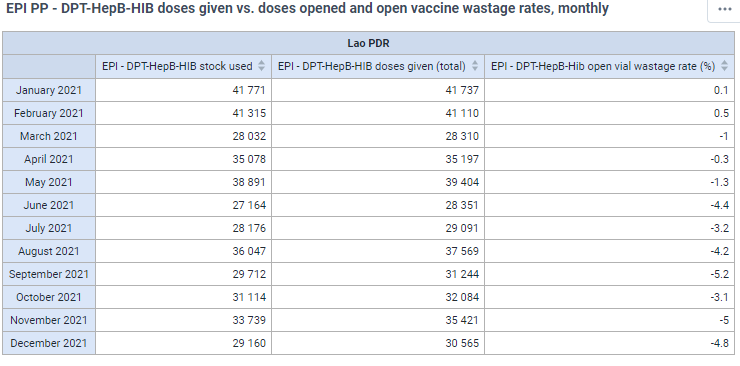
Analysis of levels stock data reported from the service delivery level should most closely match vaccine delivery data, but there may also be challenges with data quality (e.g., gaps in reporting). The comparisons are especially easy for vaccines given in a single dose vial or where vaccine wastage is low, but the comparison can be made for all vaccines. The premise is that the number of doses administered should never exceed the number of doses used or stock available; negative or excessive wastage rates should be viewed skeptically. However, it is important to consider the area's open vial policy, as excessive wastage would be expected if a vial is opened to vaccinate one child or few children compared to the number of doses available in the vial.
DPT-HepB-HIB closed vial doses wasted by reason
Review of closed vial wastage rates are also helpful to assess programme performance, particularly at the sub-national and health facility level. Breaking down the types of closed vial wastage (e.g. broken vials, expired vials, frozen vials, or VVM) may also indicate if improvements are needed in data quality, cold chain management or other programme areas.
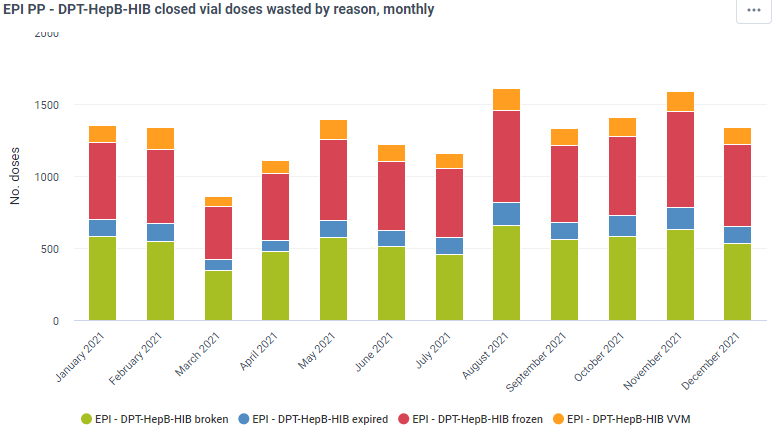
Review the closed vial trends over time (monthy, quarterly or annually). Are there any red flags that require additional investigation or follow-up?
Access (DPT-HepB-HIB 1 coverage) vs Utilization (DPT-HepB-HIB 1 to DPT-HepB-HIB 3 dropout rate)
Looking at specific drop-out rates across the vaccination schedule such as BCG-MR1 (or DTP1-MR1), DTP1-DTP3, and MR1-MR2 can be helpful in assessing at what stage in the schedule most of the dropout is occurring. To help diagnose whether facilities have issues with access or utilization (or both), it may be helpful to graph DTP1 coverage (access) vs. DTP1-DTP3 drop-out (utilization).
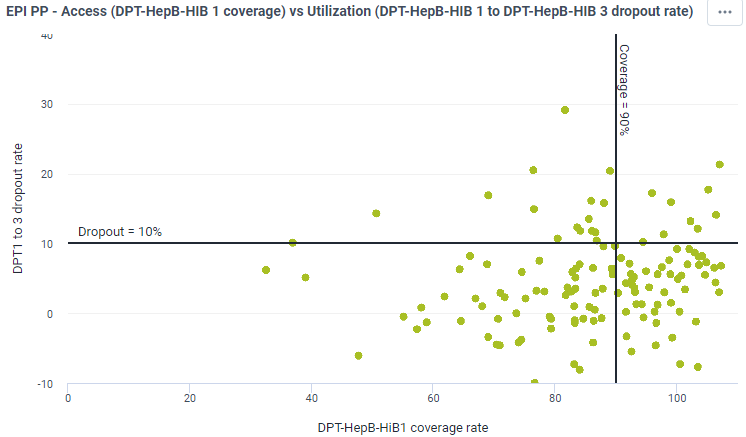
One can identify which sub-national areas or health facilities in the four quadrants of this scatterplot graph have access and/or utilization issues. Intersecting axes include 90% DTP1 coverage and 10% dropout; lower right quadrant of high coverage (+90%) and low dropout (-10%) = no access or utilization issues; upper right quadrant of high coverage and high dropout = utilization issues; lower left quadrant of low coverage and low dropout = access issues; upper left quadrant of low coverage and high dropout = access and utilization issues.
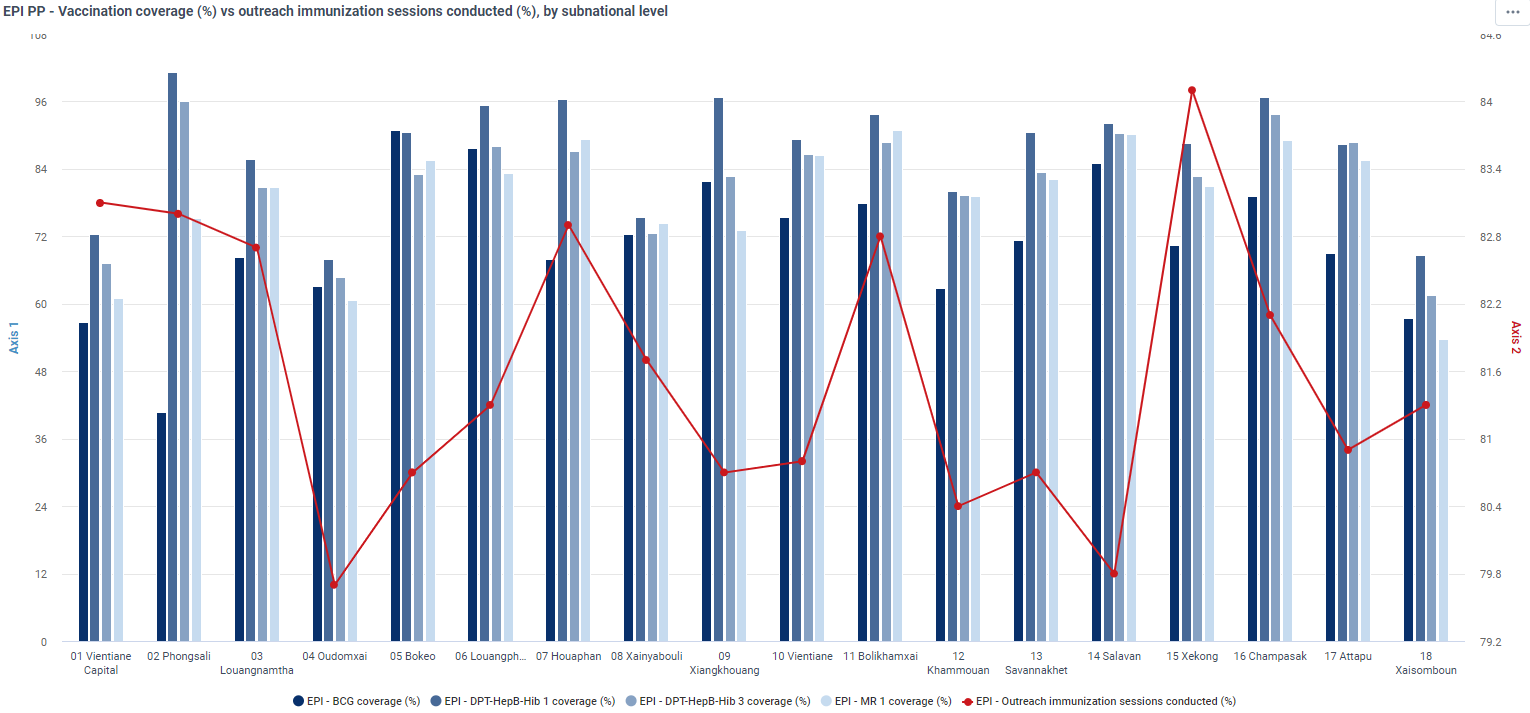
Vaccination coverage (%) vs outreach immunization sessions conducted (%), by subnational level
Comparison of vaccine coverage and program management data is helpful when assessing program performance. In this case, we compare vaccination coverage with percentage of outreach immunization sessions held.
Immunity Gaps
The dashboard ['EPI - Immunity Gaps] is designed to:
- Allow staff at the national, sub-national and health facility level monitor immunity gaps of select VPDs
- Identify potential gaps in immunization and/or VPD surveillance programmes impacted by COVID-19 pandemic
Measles/Rubella suspected cases IDS vs VPD-CS
Same visualization present on the Program Performance dashboard
Measles confirmed cases IDS vs. VPD-CS
Same visualization present on the Program Performance dashboard
Reported measles cases vs incidence

Confirmed measles cases vs MR1 & MR2 coverage
Looking at coverage and surveillance data together in the same graph can be helpful, either to:
- Examine historic programme performance and impact on disease burden
- Assess whether recent disease cases are occurring in birth cohorts with low vaccination coverage, missed by SIAs or not targeted by the programme
- Identify subnational areas in need of remediation.
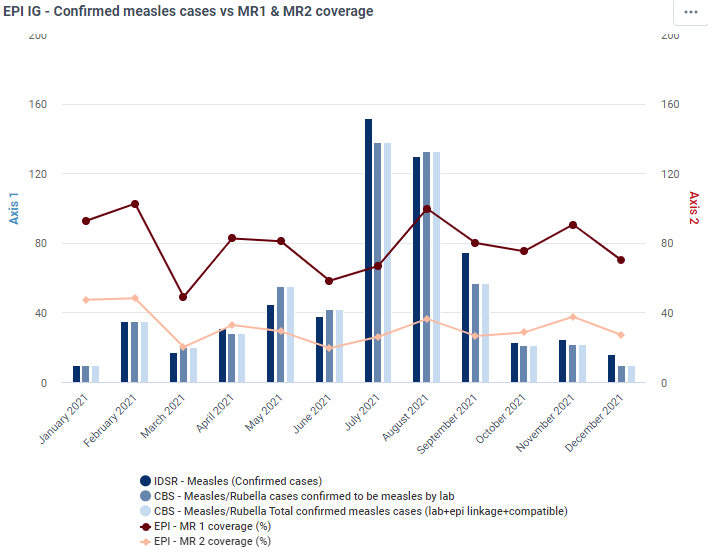

The major questions are whether the trends in the coverage and surveillance data are as expected, or whether there are age groups and/or areas with high numbers of cases that need further examination. Observe the status and trends in vaccine coverage. Are vaccine coverages consistently reaching the national and global targets? When were the different vaccine doses introduced? How did the nationwide and periodic SIAs impact case reports?
Immunization status of confirmed measles cases (VPD-CS) by total and age group
Surveillance data should be analyzed with regard to the age and vaccination status of confirmed disease cases. The data can be used to assess if there are children that should have been recently vaccinated by the immunization programme but have been missed.
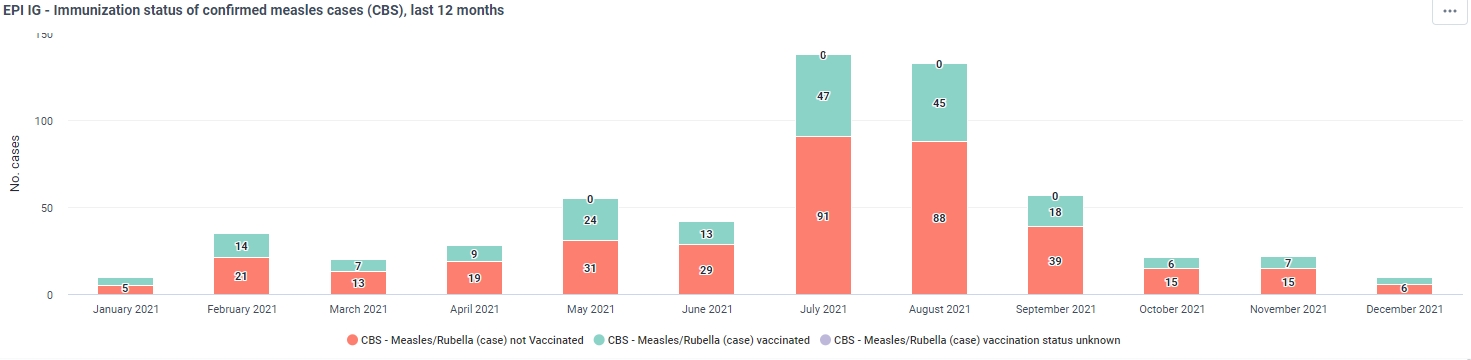

The major questions are which age groups have the most cases, lower proportions of vaccinated cases, and any changes over time. Please note that the age groups for each year contain persons born in different years, and the bars represent different numbers of birth cohorts, (e.g., there is only one birth cohort represented by the “<1 year” bars but four birth cohorts represented by the “1-4 years” bars). Hence the size of the bar is not directly proportional to the incidence in the age group. This figure could be enhanced by adding incidence. Please note that children that are too young to receive the vaccine dose (e.g., children <9 months or <12 months too young to receive MCV1) are expected to be unvaccinated due to their age. These cases are programmatically non-preventable. Among older cases, it is expected that some will be vaccinated, depending on timing of historical vaccine introduction in the country. Interpreting vaccination status in older age groups may be challenging because of the time elapsed since vaccination and the possibility of recall bias. In which age groups is the greatest number of cases? Have they had access to an SIA?
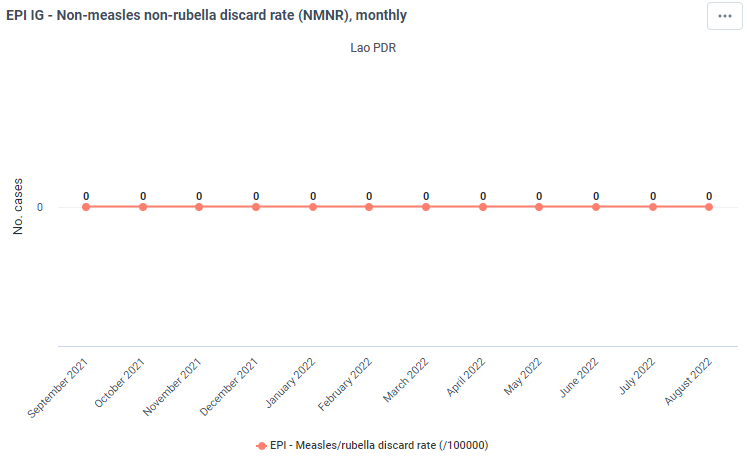
Non-measles non-rubella discard rate (NMNR)
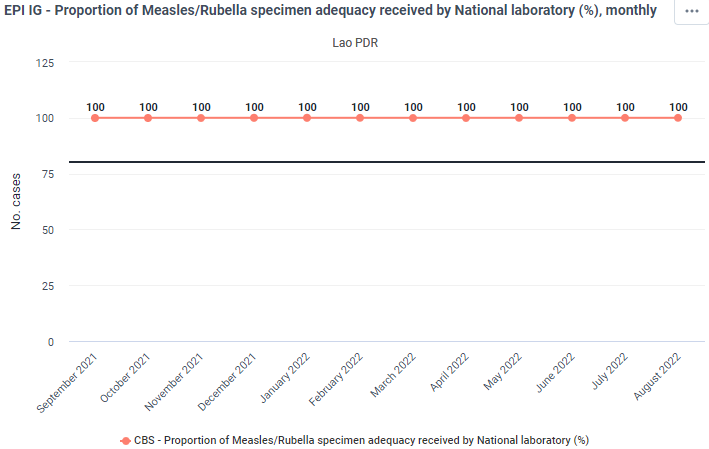
Proportion of Measles/Rubella specimen adequacy received by National laboratory (%)
Surveillance data should be analyzed with regard to the age and vaccination status of confirmed disease cases. The data can be used to assess if there are children that should have been recently vaccinated by the immunization programme but have been missed.
The major questions are which age groups have the most cases, lower proportions of vaccinated cases, and any changes over time. Please note that the age groups for each year contain persons born in different years, and the bars represent different numbers of birth cohorts, (e.g., there is only one birth cohort represented by the “<1 year” bars but four birth cohorts represented by the “1-4 years” bars). Hence the size of the bar is not directly proportional to the incidence in the age group. This figure could be enhanced by adding incidence. Please note that children that are too young to receive the vaccine dose (e.g., children <9 months or <12 months too young to receive MCV1) are expected to be unvaccinated due to their age. These cases are programmatically non-preventable. Among older cases, it is expected that some will be vaccinated, depending on timing of historical vaccine introduction in the country. Interpreting vaccination status in older age groups may be challenging because of the time elapsed since vaccination and the possibility of recall bias. In which age groups is the greatest number of cases? Have they had access to an SIA?
Referências
Centers for Disease Control & Prevention, UNICEF, World Health Organization. (2020). Triangulation for improved decision-making in immunization programmes. Retrieved from https://www.technet-21.org/en/topics/triangulation