Real-Time Monitoring and Post-Campaign Evaluation of Supplementary Immunization Activities
Supplementary Immunization Activities
The metadata and the dashboard of the Supplementary Immunization Activities (SIA) follow the principles and suggestions indicated in the Design chapter of the Vaccination Campaigns documentation. The example outlined in this chapter is a fictional Supplementary Immunization Activity for MR carried out during March of the current year in the north of the country as seen in the EPI-SIA - MR Campaign (2024-03) dashboard in the HMIS Demo instance. The metadata for this example has been designed based on the examples provided by countries’ implementations, and the key recommendations outlined in the DHIS2 Immunization Campaigns documentation and the Joint GAVI/UNICEF guidance on “Planning and Implementing Real-time Monitoring Approaches to Strengthen Vaccination Campaigns”. The campaign in this case targets two population groups defined by age (children between 6-23 months, and children between 24-59 years) and by the distance from the health facility (0-5 km, 6-15 km, and 15+ km). The distance in this case is translated into the different types of vaccination delivery sites available in the distribution plan - 0-5 km = Fixed site, 6-15 km = Advanced site, 15+ km = Mobile site.
SIA Data Sets
The metadata for SIA is distributed in three datasets:
| Nome | Periodicity | Descrição |
|---|---|---|
| EPI-SIA - MR Vaccine delivery - (MR2024-03) | Diariamente | Contains the basic information to be collected during a vaccine distribution: doses by the desired disaggregations (age, sex, type of distribution site, etc), AEFIs, and vaccinating staff. |
| EPI-SIA - Stock MR Campaign (MR2024-03) | Diariamente | Contains the items from the medical stock needed for the campaign. |
| EPI-SIA - MR Campaign targets (MR2024-03) | Yearly | Defines the target population of the campaign. |
The naming convention using "(MR2024-03)" labels a fictional MR (Measles Rubella) campaign that took place in March 2024. MR2020-03 is therefore just a suggestion of a clear and organized way to label datasets - provides context and allows users and implementers to understand when the data was collected or associated with a specific event. Being nothing but an example, it's essential for users and implementers to agree on a locally meaningful way to adapt the coding and naming conventions according to their local practices and guidance. Flexibility in naming conventions allows datasets to be more meaningful and relevant to specific projects and contexts.
Metadata for SIA Real Time Monitoring
The metadata for the mock MR campaign is available in the metadata reference file which is available in the Metadata Downloads section. The file can be recycled and reused as many times as necessary just by replacing the UIDs of the metadata, and the vaccine used (in this case MR) with the vaccine(s) needed for the campaign that needs to be configured. The exception applies to the population DE, which belongs to the common metadata library, unless ad hoc population data points need to be configured for the purpose of defining with more detail the campaign’s denominators.
Vaccine Delivery Data Set
The vaccine delivery dataset contains the core information to be collected during a campaign as outlined in the Design chapter (System Design Overview section) of the Vaccination Campaigns documentation.
The doses of vaccine distributed were disaggregated by site and by age group. The CatCombo here is just an example and can be easily changed according to the needs of the implementation.

The AEFIs are collected via two data elements with no disaggregation - this can be of course changed depending on the needs of the implementation.
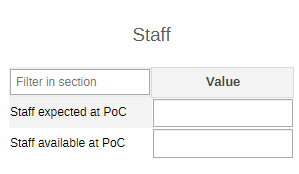
This section was easily recycled from the COVAC (version 1.0.0)/COVIDVAC(Version1.1.0) metadata. An important component during SIAs is the staff availability. With just two DEs it is possible to supervise how many workers were expected at point of care and how many were truly present for the activities.
Stock Data Set
The stock dataset, depending on the local needs, can be kept as a separate stock count used specifically for the ongoing SIA and its duration, can be kept as a general SIA stock dataset where all campaigns are registered, or it can be simply not used if the routine reporting system is used instead. For the first two options, the dataset in the screenshot below could constitute a simple and effective design for the medical stock. Independently from the level and type of implementation, the dataset is based on the LMIS design documentation.

Note that the sections of the dataset in this case have been rendered as tab rather than the usual linear view of the dataset. This design choice was taken for the sake of clarity should the list of items be particularly long, and to simplify roles and responsibilities of stock management throughout the working day.
Campaigns Targets
The target population, as aforementioned, could be collected either directly at the lowest level of distribution if available at daily intervals, or could be separated from the vaccine delivery dataset and assigned at higher levels of the OU hierarchy with a weekly/monthly/annual interval. The example shows a weekly interval. Note also that the example uses the DE “GEN - Population” (DkmMEcubiPv) as available from the common metadata library.

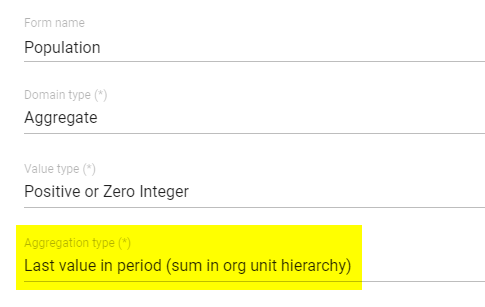
Depending on the duration of the campaign, the periodicity of the population dataset could be set at weekly intervals or larger intervals to facilitate the attainability of the data. This approach is recommended for larger populations that cannot be fully completed within a day or whenever the availability of population data does not provide enough details to enter data below the district level. It should be noted that, in this case, the vaccination delivery and the population data (set at annual periodicity) will have different period intervals. The analysis of the coverage therefore will have to be adjusted accordingly in order to be able to calculate daily coverages.In order to ensure the correct calculations, the population data element should have an aggregation type set to the latest available value.
Data Analysis and Dashboard
The metadata package of the solutions outlined in this document is not available for download because it is highly dependent on the type of design chosen for the campaign and on the local configuration of the EPI metadata. The dashboard for the SIA (EPI-SIA - MR Campaign (2024-03)) available on the HMIS Demo instance proposes the core visualizations for the analysis and monitoring in real-time of the campaign’s progress and can be used as an example or source of inspiration for local customizations and adaptation

The table below highlights important considerations for some of the visualizations present in the dashboard.
| Nome | Modelo | Comments |
|---|---|---|
| SIA_MR2024-03_011 Doses total | Valor unico | This next to the target population (SIA_MR2024-03_007 Population) will highlight any discrepancy. |
| SIA_MR2024-03_003 Coverage | Valor unico | Overall campaign coverage or disaggregated by age groups (SIA_MR2024-03_012 Coverage 24-59 and SIA_MR2303_013 Coverage 6-23). Assign the legend “MR coverage” to appoint a colour code to the value based on the set thresholds. |
| SIA_MR2024-03_001 Population | Tabela Dinâmica | Use the disaggregations of the population to provide a summary of the population reached. |
| SIA_MR2024-03_008 Coverage map | Map | Choropleth map with the coverage by district. Assign the legend “MR coverage” to appoint a colour code to the value of each district (or any other administrative level of relevance) based on the set thresholds. |
| SIA_MR2024-03_010 Doses coverage | Double axes | The cumulative graph will provide an overview of the progress of the campaign both in terms of doses distributed and of coverage of the target population. |
| SIA_MR2024-03_004 Coverage by age | Linha | Cumulative trendline of the coverage by age groups (or any other relevant disaggregation). Particularly useful to spot any underestimated population group. A cumulative column graph on the doses distributed by age groups (SIA_MR2024-03_005 Doses cumulative age) can accompany the coverage trends alongside the “SIA_MR2024-03_027 Vacci distribution” summary table. |
| SIA_MR2024-03_018 Staff discrepancy map | Map | The map is the geographic representation of the table “SIA_MR2303_014 Staff discrepancy”. As explained in the text box, the discrepancy should be interpreted as : Positive number -> Staff available>Staff expected, Negative number -> Staff available |
Rapid Convenience Monitoring for SIAs
The Rapid Convenience Monitoring (RCM) serves as the primary approach for monitoring mass vaccination campaigns. The primary goal of RCM is to locate unvaccinated children and understand the reasons for their lack of vaccination, particularly in high-risk areas. By doing so, RCMs facilitate the prompt implementation of corrective actions, such as reallocating teams to areas with low vaccination coverage, adjusting vaccination schedules, or conducting targeted mop-up vaccination campaigns. Presently, RCMs still often rely on paper reporting systems or other platforms for data collection (e.g. KoBo). Nevertheless, a more modern method of mobile based data collection has become feasible as the implementations of Timor Leste and Bangladesh have shown.
The example outlined in the event program SIA - Rapid Convenience Monitoring follows the general guidelines of a clustered survey as described in the World Health Organization Vaccination Coverage Cluster Surveys: Reference Manual.
The event program is aimed at capturing every child encountered in the selected households during the RCM (one event per child). The outputs of this design aim to improve the outlook on possible reasons for not vaccinating them, to record every child who has not received a vaccine and requires further supplementary activities, and to counter check the coverage reported from the SIA data as the clustering method, if well applied, should provide representative results for the population under survey. The event program could also be used to summarize the data coming from a specific cluster (or any other unit of possible aggregation) rather than reporting the information by child. In this case the design of the event program should be edited to report the total number of children found, the number of children vaccinated, the number of children unvaccinated, the number of children who received previous vaccines via the EPI programme, and should allow the selection of multiple choices for the reasons for the lack of vaccination by creating extra DEs as the system currently does not allow the selection of multiple choices from one single DE option list.
Event Program Structure
| Section | Comments |
|---|---|
| Basic Info | Date of the activity and coordinates of the household. |
| Stratum and Cluster | Useful identifying information on the stratum, cluster, interviewer, and supervisor. |
| Household and child info | UIDs of the child and the house |
| SIA info | Relevant information about the campaign based on whether the child was vaccinated or not during the supplementary or routine activities. |
| Status | Completion of the event and comments if needed. |
Program Flow

Sections Details
Basic Info
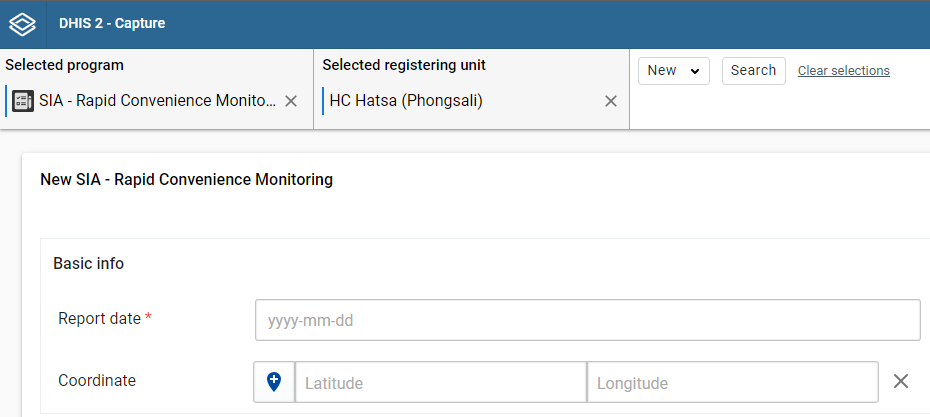
The coordinates can either be entered manually or derived from the map that pops up if the blue location icon on the left of the Latitude is clicked.
Stratum and Cluster

All the fields in the section are typeable. A dropdown menu with the list of options should be applied if there is a need for more control on the data entry.
Household and Child Info
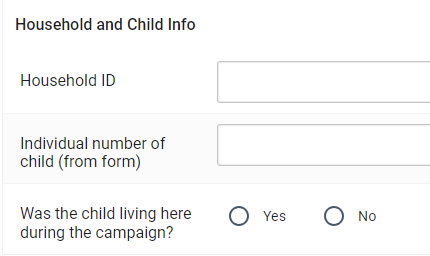
During cluster surveys normally there is a set number of households to be surveyed or, where possible, the houses have already been randomly selected via their GPS coordinates and given an ID.
The Child UID is normally reported on their vaccination card if available. Nonetheless, the use of UIDs for the child should be based on local practices and availability of individual records.
If the child was not in the area during the SIA, the form will prompt the surveyor to check whether the child was nonetheless immunized via the routine EPI activities (SIA Info section).

If the child is found unvaccinated or if their vaccination status is unknown, the child will be added to the indicator adding all the children that require further immunization mop-up activities carried out.
SIA Info
If the child was present in the HH during the SIA period, the next section, SIA Info, will probe the responder with the knowledge on the campaign.
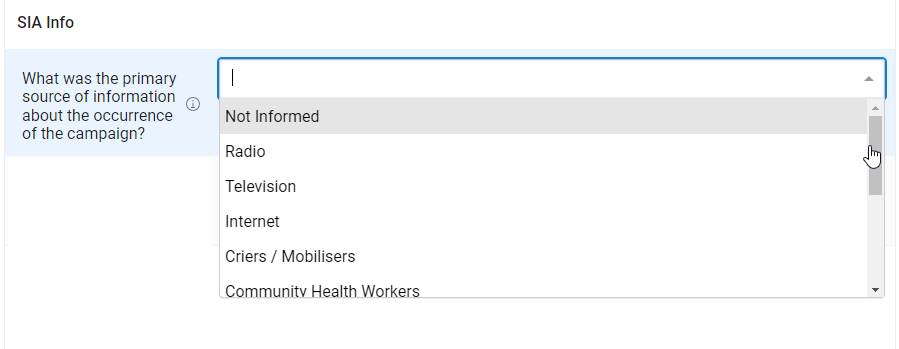
The questionnaire then checks whether the child received a vaccine dose during the SIA.

If the child received a vaccine, the questionnaire asks about eventual AEFIs, and whether the child received the vaccination card.

If the child did not receive the vaccination during the campaign, the responder is requested to provide the reason for the lack of vaccination. As of today the system does not allow the selection of multiple choices. If multiple answers are allowed as per local guidance, it is suggested to replicate the DE with as many repetitions as allowed answers.

EPI Information
Independently from whether the child received the vaccine during the SIA, the questionnaire will probe for any additional information on past routine vaccinations.

If the answer is yes and the card is available, the surveyor is asked to report the dates of the previous vaccines (in this case MR1 and MR2 as the fictional SIA of the example was an MR campaign).

Analytics
The full list of indicators is available in the metadata reference flat file.
The main purpose of the analytics with this activity is to highlight the main reasons for not vaccinating the children, and to locate the children who were not vaccinated.


These, thanks to the coordinates, will be visualized in a map. The mapping of missed children should then trigger an action for a mop-up activity while informing the health promotion programme on the areas that need reinforcement towards the uptake of vaccines. Although the Nepalese example shown by the CDC report visualizes the mapping of missing children by households rather than the individuals, it is a great example of how RTM and mobile-based RCM can rapidly inform and map a clear snapshot of the post-campaign monitoring activities.
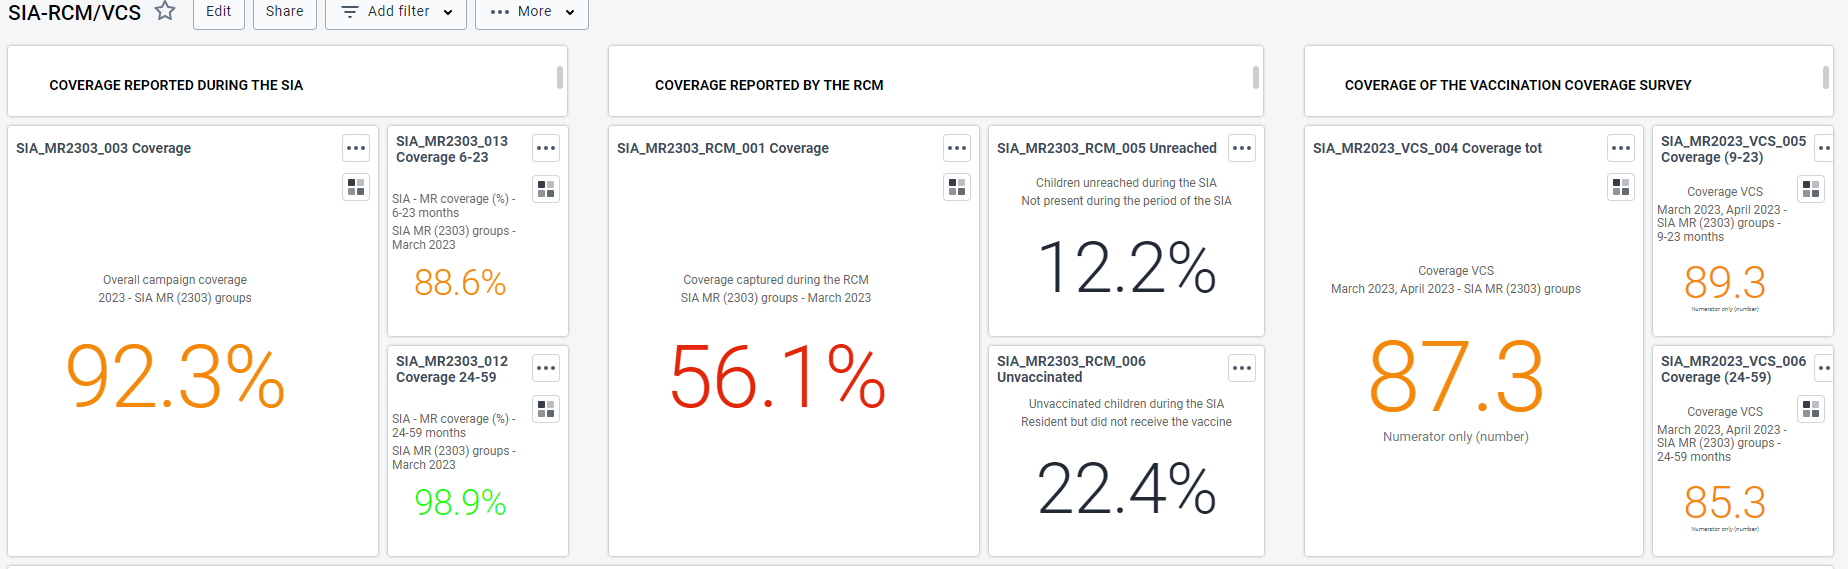
At the same time, the coverages extrapolated from the RCM can be compared to the Vaccine Coverage Survey and the coverages coming from the SIA itself for validation of the numbers. In the screenshot below teh maps also provide the localization of the clusters selected for the RCM and VCS.

Similarly, as the RCM form also provides information on past vaccinations administered by the routine activities of the EPI programme, plotting the coverage extrapolated from the collected data (“Dates of previous vaccine” screenshot above) against EPI coverages for the same vaccine could provide an additional layer of comparison and validation of routine immunization reach and uptake.

The RCM could also compare the AEFI reported during the SIA and the reported vaccination-associated secondary effects as perceived by the communities. This could be of relevance for a better understanding of the communities’ knowledge on vaccination and AEFI, and, in turn, if needed, to improve the health promotion messages related to the subject.

These examples of visualizations and data being integrated with SIA and VCS numbers are available in the SIA-RCM/VCS dashboard present in the HMIS Demo instance.
SIA Coverage Survey
The EPI Programme has become increasingly complex with the introduction of new vaccines aimed at various age groups. As vaccination coverage levels rise in most countries, there is a growing need for more precise coverage estimates. Vaccination coverage refers to the percentage of a specific population that has received vaccinations within a defined timeframe. The analysis of vaccination coverage levels and trends serves several important purposes. Firstly, it allows for the monitoring of routine vaccination services at both national and subnational levels, especially in cases where administrative reports are considered unreliable. Secondly, it provides a means to evaluate the effectiveness of interventions aimed at increasing vaccination coverage. Moreover, the data gathered through vaccination coverage surveys is crucial in evaluating how effectively supplementary immunization activities (SIAs) or vaccination campaigns have reached their intended target population. Additionally, this information sheds light on areas of potential weakness in the vaccination programs. For example, it helps in identifying the proportion of children not receiving any vaccines at all, which may indicate issues with access to health services. It also assists in estimating the rate of dropout between starting and completing the vaccination series, potentially highlighting barriers to re-attendance or weaknesses in tracking activities. Furthermore, vaccination coverage data allows for the estimation of the frequency of missed immunization opportunities due to non-simultaneous vaccination. Lastly, vaccination coverage surveys facilitate a comparison between the coverage of newly introduced vaccines and traditional ones within the national immunization program. If coverage for a newly introduced vaccine is lower, it may suggest challenges related to vaccine supply or suboptimal information and communication efforts surrounding the introduction of the new vaccine.WHO, 2018
Integrating vaccine coverage surveys (VCS) into DHIS2 can pose challenges due to its configuration complexities. However, it remains essential to incorporate survey data into the national RHIS to keep track of the latest coverage information. While survey data is often collected on paper, efforts should be made to digitize it using tools like KoBo or EpiInfo. After data collection and analysis, the aggregate survey data can be seamlessly integrated with routine EPI and campaign data. Surveys could also be fully run from DHIS2 like the example given with the RCM activity - an event program per household or per child run on the DHIS2 Android app for offline data collection is feasible and particularly practical if the final integrated environment is also DHIS2-based. This integration would result in a comprehensive and updated data repository, serving as the primary reference source for evidence-based decisions and actions. By bringing together all key information in one place, this approach ensures a more efficient and informed decision-making process. Though challenges may arise during the configuration process, the benefits of a unified data repository far outweigh the difficulties. It enhances the ability to monitor and update vaccination coverage accurately, contributing to the effectiveness and success of public health interventions.
Vaccine Coverage Survey Data Set
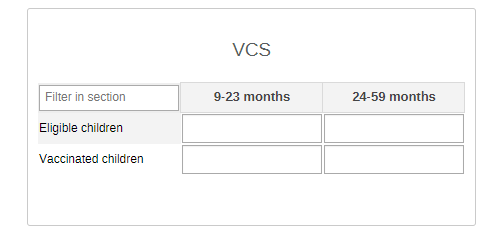
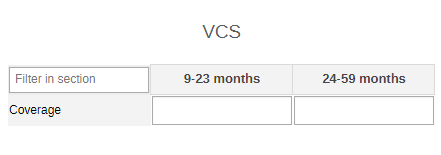
Created with the purpose of showcasing the simplest design for purpose, the VCS dataset is deliberately designed to maintain simplicity by containing only two Data Elements (DEs). This design was selected to offer an alternative example of types of data that could be collected when the data collection and analysis is followed in a different platform, or when third parties are running the activities but are sharing the final outputs. It offers the flexibility of being assigned at different levels of the Organizational Unit (OU) and can report data with varying periodicities based on specific reporting requirements. The dataset could either collect the number of eligible children found during the VCS and the number of children vaccinated during the SIA (Example 1), or it could collect just the already calculated coverage (with or without disaggregations) of the different selected OUs (Example 2). The reported coverage would be likely to be obtained from a different data collection tool that was used for the survey. The demo instance uses the Example nb. 2 for each cluster selected for the survey, but it could also easily adapt to report the reported coverage by district, or even just the coverage of the overall survey depending on needs and data accessibility.
Organizational Unit (OU) Levels
When determining the dataset's assignment within the OU hierarchy, a crucial consideration is to align it with the lowest administrative level shared between the hierarchy used for SIAs, VCSs, and the National RHIS. It can be assigned at the facility level or even lower, enabling more detailed data collection and a wider geographical representation. This is a good solution especially if the initial data collection for the survey is maintained in the initial SIA instance and needs to be representative of the different strata and clusters (e.g. example 1).
Alternatively, the dataset can be assigned at the district level for the purpose of higher-level comparisons, where comprehensive data from multiple facilities are aggregated. This could be the approach that could be taken if the main need is to report just the aggregated data for historical and comparative purposes (e.g. example 2).
Periodicity
The dataset's reporting periodicity can be tailored to match specific needs. If there is a requirement to report data with the same time interval as the VCS itself, the period can be assigned as "daily." Assigning the period as "monthly" emphasizes the month of the survey, which may be useful for certain analytical purposes. On the other hand, if reporting needs are primarily based on the general year when the survey was conducted, the period can be assigned as "yearly." This could be particularly useful for country-wide assessments.
VCS Analytics
Examples of visualizations and data being integrated with SIA and VCS numbers are available in the SIA-RCM/VCS dashboard present in the HMIS Demo instance.
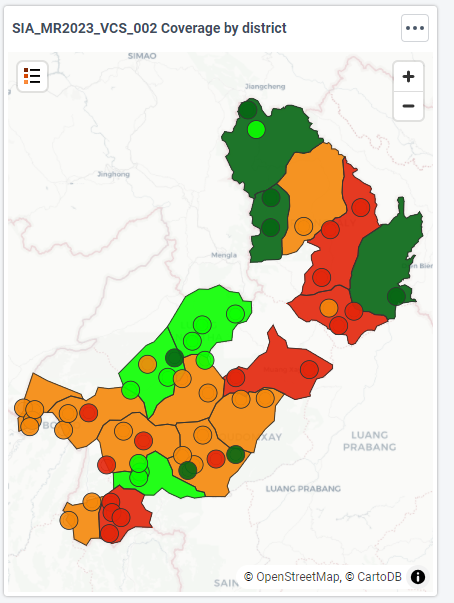
As presented in the screenshot below, the coverage reported as per example 2 in the dataset section is presented alongside the calculated coverages of the SIA and the RCM.
The map displays the coverage by district and also the coverage by the clusters surveyed during the activity. This was done purposefully just to display the potential of the visualization possibilities of the platform. This map can then be displayed alongside the map of the SIA calculated coverages and, if present, the coverage of the RCM.
Integration with Routine HIS Data
SIAs play a crucial role in reducing the number of unvaccinated populations, and it is essential to triangulate their coverages with routine EPI data to ensure the national Health Management Information System (HMIS) remains as up-to-date as possible. Integrating supplementary immunization activities coverage alongside routine EPI data provides a more comprehensive understanding of immunization coverage, supports planning and targeting efforts, facilitates evaluation of program impact, improves resource allocation, and enhances surveillance and outbreak response capabilities.
By integrating SIAs, RCMs, and VCS coverage with routine EPI data, it becomes easier to assess the impact of supplementary immunization campaigns. Health authorities can compare coverage rates before and after the campaigns and determine the effectiveness of the interventions. This evaluation can inform future immunization strategies and help refine programmatic approaches based on up to date and validated data.
Moreover, combining SIAs coverage with routine EPI data provides a more comprehensive picture of immunization coverage in a given population. Routine EPI data typically captures the regular immunization schedule, while SIAs target specific campaigns or interventions aimed at reaching specific populations or addressing particular diseases. By integrating both sources of data and adding RMC data, EPI program managers can have a better understanding of overall immunization coverage. The integration also helps in planning and targeting immunization campaigns more effectively. The combined data can identify areas or populations that may have lower coverage rates despite routine immunization efforts. This information can guide the allocation of resources and the development of targeted interventions to reach those underserved populations.
Finally, integrated data systems enable more robust surveillance and response to outbreaks. By combining SIAs coverages with routine EPI data, health authorities can monitor changes in immunization coverage over time, detect potential gaps or clusters of unimmunized individuals, and take prompt action to prevent or control outbreaks.
The integration of SIA/RCM/VCS data in the rHMIS was also discussed in the DHIS2 GAVI Quarterly Webinar - in ENG “Webinar on maximizing Immunization Impact with Integrated Data” and in FR “Maximiser l’impact de la vaccination grâce aux données intégrées”.
Examples of visualizations fitting an integrated environment are available in the HMIS Demo instance.