DHIS2 Climate App User Guide
Background and context
The purpose of this document is to complement the existing guide provided within the Climate App, offering users a clear, step-by-step reference on how to install the app and use it within their DHIS2 instance. Most of the content in this guide builds upon the instructions available directly in the app after installation, while providing additional context and explanations to make the process easier to follow prior to installation.
This pilot app is part of the ongoing “DHIS2 for Climate” project. It receives frequent updates, so please ensure you are using the latest version available on the DHIS2 App Hub. The app is developed by the University of Oslo, though it is not a DHIS2 core application. However, useful components from this app may be incorporated into the DHIS2 core in the future based on user feedback.
The app allows users to explore and import various weather and climate parameters—such as temperature, precipitation, humidity, and heat stress—directly into DHIS2. See Table 1 for the full list of supported parameters. The primary data source is ERA5-Land, widely recognized as one of the most accurate and complete global climate datasets. These datasets are produced by combining weather observations with advanced climate reanalysis models.
Other supported data sources include:
- ERA5-Land – Copernicus Climate Data Store
- CHIRPS – Climate Hazards Center
- ERA5-HEAT – Copernicus Climate Data Store
- NASA LP DAAC – Land Processes Distributed Active Archive Center
Key features of the app
Explore data: Use this feature to view weather and climate data for your organization units without importing it into the system. No metadata configuration is required, but your organization units must have coordinates and a valid Google Earth Engine (GEE) key. See the section on Installation Prerequisites for more details.
Setup guide: Before importing climate data, you must configure your DHIS2 instance. See the section on Metadata Configuration for Climate Data Import for setup instructions.
Import data: Once metadata configuration is complete, you can import climate data into DHIS2. This allows you to combine climate and health data across all DHIS2 analytics applications. After importing, remember to generate the analytics tables in the Data Administration app.
How the data is calculated
All climate data are computed for your organization units using Google Earth Engine (GEE). Please consider the spatial resolution of the selected dataset.
- For health facilities, the data value corresponds to the exact location of the facility.
- For districts/provinces, all values are aggregated within the district/province.
- If two organization units are located within the same grid cell (at the dataset’s resolution), they will share the same data value.
See Table 1 for detailed descriptions of the available parameters.
Installation prerequisites
- Ensure your DHIS2 instance is running on version 2.37 or higher, as the app is only compatible with these versions.
- Verify that your DHIS2 instance is connected to Google Earth Engine (GEE), which is free to use for governments and non-profit organizations. If you do not already have access, please request it by sending an email to maps@dhis2.org,, specifying the name of your organisation. Alternatively, you may set up a Google Cloud project independently.
- Confirm that your DHIS2 organisation units are configured with geographic coordinates at all administrative levels where you intend to access climate data.
Exploring climate data using the app
Data availability
The Explore data window allows you to select an organisation unit and a specific climatic parameter such as temperature, precipitation, humidity, climate change (temperature anomaly), vegetation, land cover, or elevation. Details of these parameters are provided in Table 1.
Callout: All climate data visualized in the Explore data window are dynamically computed “on the fly” by Google Earth Engine, meaning the data do not need to be imported into DHIS2 as data values to be analyzed.
Some climatic parameters share common aggregation periods, while others do not. For example:
- Temperature can be viewed daily or monthly.
- Vegetation index is displayed by default in 16-day intervals but can also be viewed weekly or monthly.
- Land cover and elevation are aggregated annually.
For parameters available in daily or monthly formats, you can define both start and end periods to limit the time range of your analysis. (Note: this option is not available for land cover or elevation data.)
The app includes two 30-year reference periods; 1961–1990 and 1991–2020 that allow you to compare current monthly values with long-term climate normals for temperature, precipitation, and humidity.
Additional filters are available for some parameters:
- Land cover includes 20 classification types.
- Vegetation index includes two selectable types, depending on your analysis needs.
Table 1: Summary of parameters in the climate app
| Parameter | Elements | Period of aggregation | Source | Reference periods | Data resolution |
| Temperature |
| Daily or Monthly | ERA5 Land | 1961–1990 and 1991–2020 | 9X9 km (0.1°) |
| Precipitation |
| Daily or Monthly | ERA5 Land & CHIRPS | 1961–1990 and 1991–2020 | 9X9 km (0.1°) |
| Humidity |
| Daily or Monthly | ERA5 Land | 1961–1990 and 1991–2020 | 9X9 km (0.1°) |
| Heat |
| Daily or Monthly | ERA5-HEAT | N/A | 31X31 km (0.25°) |
| Climate Change | Temperature anomaly | Months of the year | ERA5 Land | 1961–1990 and 1991–2020 | 9X9 km (0.1°) |
| Vegetation |
| 16-day (default); Weekly; Monthly | NASA | N/A | 250X250m |
| Elevation | Elevation distribution | One-off annual | NASA | N/A | 30m |
| Land Cover |
| Annual (2002-2024) | NASA | N/A | 500m |
Using the Climate App for data exploration
The “Explore data” section provides dynamic visualizations for all the above climatic parameters. Simply select an organisation unit at the left side of the screen. By default, the first page to show up will be the “10 days forecast” tab. Tabs for further parameters can be selected at the Navbar at top. You may click the arrows at left and right to find more.
This image shows the Explore data window in the DHIS2 Demo instance.
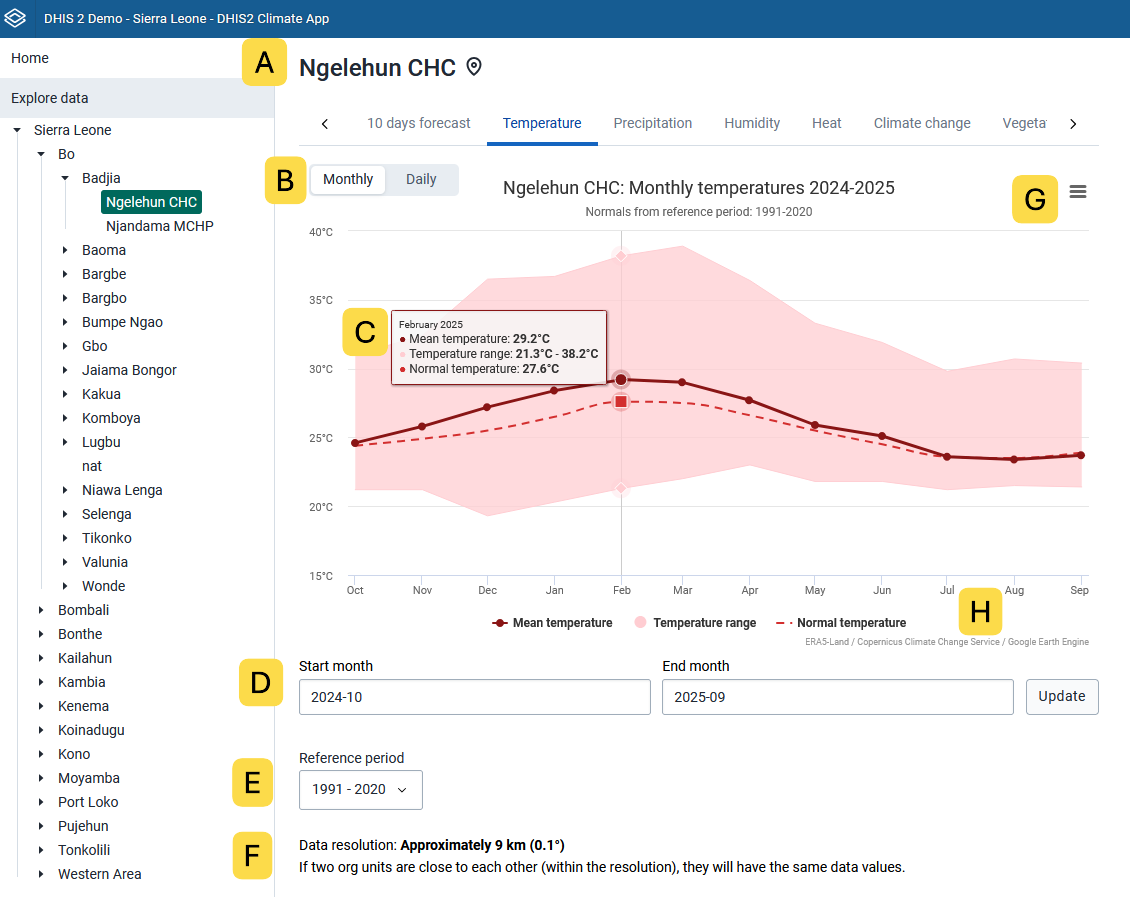
The explorable features are identified by the Letter callout boxes, and described below.
A) The Organisation Unit context. This is selected in the Organisation Unit hierarchy tree at right. When the geography for an Organisation Unit is a point, a “pin” icon appears next to the organisation unit name, while for polygons this icon is a “grid”. Users only have access to their “data view” organisation units.
B) After you select a climatic parameter, you can further select at top left of the visualization name whether to display daily or monthly aggregations.
C) Scrolling over the visualisation will show you the data series values at that time period in a callout box. Here we see temperature values (mean, range, and climatic normal) for February 2025.
D) You may change the start and end periods for the visualization. Click the Update button to view.
E) You may further select between the two 30-year reference periods
F) The resolution of the climate data is described as well as important contextual details on the calculation.
G) In the menu at top right of the visualisation, you can view full screen, print the chart, or download the chart in various formats (PNG, JPEG, PDF, SVG)
H) At the bottom right you can view the linked data source and attribution.
This presentation from the 2025 DHIS2 Annual Conference (starting 10:00) has details on the available datasets to explore through the Climate App as of July 2025.
Metadata configuration for climate data import
Before you can import data, you need to make some configurations in the Maintenance app. For detailed instructions on how to configure DHIS2, choose which data you would like to import below.
1. Create the data elements
Create DHIS2 data elements only for the parameters you plan to import. It is recommended to include the data source in the name to help distinguish it from other sources. For example, precipitation data may be available from both ERA5-Land and CHIRPS.
If you use the same codes specified on table 1, the corresponding data elements will be automatically preselected in the import interface.
When daily data is imported, it can be aggregated into other period types within DHIS2. However, it is not recommended to aggregate across organisation unit levels, particularly from facility level to higher administrative levels, as this may distort spatial accuracy.
For each data element, set the following key configurations (see Table 2 for reference):
- **zeroIsSignificant = true: **data element is able to store zero value when imported
- domainType = AGGREGATE: data element belongs to the aggregate DHIS2 domain
- aggregationLevel = all: to ensure that the data element aggregates climate for each level separately.
Table 2: Datasets metadata configurations
| id | code | name | Short Name | Aggregation Type | description |
| DZte8CXJ6zJ | CHIRPS_PRECIPITATION | CCH - Precipitation (CHIRPS) | Precipitation CHIRPS | SUM | Total precipitation in mm |
| X0Tq9B9meJU | ERA5_HEAT_UTCI | CCH - Heat stress (ERA5-HEAT) | Heat stress | AVERAGE | Average felt temperature in °C. Data source: ERA5-Heat / Copernicus Climate Change Service |
| BmszSzqKgFb | ERA5_HEAT_UTCI_MAX | CCH - Max heat stress (ERA5-HEAT) | Max heat stress | MAX | Same as above |
| N5ENtQKKQcj | ERA5_HEAT_UTCI_MIN | CCH - Min heat stress (ERA5-HEAT) | Min heat stress | MIN | Same as above |
| CLbMVtinuoV | ERA5_LAND_DEWPOINT_TEMPERATURE | CCH - Dewpoint temperature (ERA5-Land) | Dewpoint temperature | AVERAGE | Temperature in °C at 2m above the surface to which the air would have to be cooled for saturation to occur. |
| RMaMv7SrUYd | ERA5_LAND_PRECIPITATION | CCH - Precipitation (ERA5-Land) | Precipitation | SUM | Total precipitation in mm |
| hsQg4SfG5pO | ERA5_LAND_RELATIVE_HUMIDITY | CCH - Relative humidity (ERA5-Land) | Relative humidity | AVERAGE | Percentage of water vapor in the air compared to the total amount of vapor that can exist in the air at its current temperature. Calculated using air temperature and dewpoint temperature at 2m above surface. |
| Pjd8Rn6mTb0 | ERA5_LAND_TEMPERATURE | CCH - Air temperature (ERA5-Land) | Air temperature | AVERAGE | Average air temperature in °C at 2m above the surface |
| BDIuhHdQEDI | ERA5_LAND_TEMPERATURE_MAX | CCH - Max air temperature (ERA5-Land) | Max air temperature | AVERAGE | Maximum air temperature in °C. at 2m above the surface |
| QZilZRiGNvB | ERA5_LAND_TEMPERATURE_MIN | CCH - Min air temperature (ERA5-Land) | Min air temperature | AVERAGE | Minimum air temperature in °C. at 2m above the surface |
| dl1JTXinsIM | MODIS_EVI | CCH - Enhanced vegetation index (MODIS) | EVI | AVERAGE | Enhanced vegetation index (EVI) differs from NDVI by reducing the influence of atmospheric conditions and canopy background noise. EVI values range from -1 to 1, with higher values indicating denser vegetation. Data originates from MODIS (NASA). |
| BC3vgSOKONN | MODIS_NDVI | CCH - Normalized difference vegetation index (MODIS) | NDVI | AVERAGE | Landsat Normalized Difference Vegetation Index (NDVI) is used to quantify vegetation greenness and is useful in understanding vegetation density and assessing changes in plant health. NDVI values range from -1 to 1, with higher values indicating denser vegetation. Data originates from MODIS (NASA). |
| iwwgPNFBtlH | MODIS_LANDCOVER_1 | CCH - Evergreen Needleleaf forest (MODIS) | Evergreen Needleleaf forest | AVERAGE | Percentage of area with this land cover type.Data source: NASA LP DAAC at the USGS EROS Center |
| uXW9TzHcDCA | MODIS_LANDCOVER_10 | CCH - Grasslands (MODIS) | Grasslands | AVERAGE | Same as above |
| evTogVMkoV6 | MODIS_LANDCOVER_11 | CCH - Permanent wetlands (MODIS) | Permanent wetlands | AVERAGE | Same as above |
| CJlLGqQvopa | MODIS_LANDCOVER_12 | CCH - Croplands (MODIS) | Croplands | AVERAGE | Same as above |
| qKotwyKfjau | MODIS_LANDCOVER_13 | CCH - Urban and built-up (MODIS) | Urban and built-up | AVERAGE | Same as above |
| QpLuERXDjNK | MODIS_LANDCOVER_14 | CCH - Cropland/Natural vegetation mosaic (MODIS) | Cropland/Natural vegetation mosaic | AVERAGE | Same as above |
| sU8FbQJFtbH | MODIS_LANDCOVER_15 | CCH - Snow and ice (MODIS) | Snow and ice | AVERAGE | Same as above |
| ET9dc084XVm | MODIS_LANDCOVER_16 | CCH - Barren or sparsely vegetated (MODIS) | Barren or sparsely vegetated | AVERAGE | Same as above |
| eOQR9EGNHDn | MODIS_LANDCOVER_17 | CCH - Water (MODIS) | Water | AVERAGE | Same as above |
| RLAWu61P9V1 | MODIS_LANDCOVER_2 | CCH - Evergreen Broadleaf forest (MODIS) | Evergreen Broadleaf forest | AVERAGE | Same as above |
| bt7b1kiFU0T | MODIS_LANDCOVER_3 | CCH - Deciduous Needleleaf forest (MODIS) | Deciduous Needleleaf forest | AVERAGE | Same as above |
| NNYm1uG1CSS | MODIS_LANDCOVER_4 | CCH - Deciduous Broadleaf forest (MODIS) | Deciduous Broadleaf forest | AVERAGE | Same as above |
| nLORr2NrETU | MODIS_LANDCOVER_5 | CCH - Mixed forest (MODIS) | Mixed forest | AVERAGE | Same as above |
| Yh8EXp49asL | MODIS_LANDCOVER_6 | CCH - Closed shrublands (MODIS) | Closed shrublands | AVERAGE | Same as above |
| SJYCTc90cTb | MODIS_LANDCOVER_7 | CCH - Open shrublands (MODIS) | Open shrublands | AVERAGE | Same as above |
| hEOiu9kECX6 | MODIS_LANDCOVER_8 | CCH - Woody savannas (MODIS) | Woody savannas | AVERAGE | Same as above |
| l9g7AmOAw4V | MODIS_LANDCOVER_9 | CCH - Savannas (MODIS) | Savannas | AVERAGE | Same as above |
| n33IIowe04z | SRTM_ELEVATION_MAX | CCH - Max elevation (SRTM) | Max elevation | FIRST_AVERAGE_ORG_UNIT | Max elevation in meters above sea level. Data source: NASA / USGS / JPL-Caltech |
| pse3lCkdHHF | SRTM_ELEVATION_MEAN | CCH - Mean elevation (SRTM) | Mean elevation | FIRST_AVERAGE_ORG_UNIT | Mean elevation in meters above sea level. Data source: NASA / USGS / JPL-Caltech |
| lfRpta1LI1u | SRTM_ELEVATION_MIN | CCH - Min elevation (SRTM) | Min elevation | FIRST_AVERAGE_ORG_UNIT | Min elevation in meters above sea level. Data source: NASA / USGS / JPL-Caltech |
2. Assign to a data set
If you are importing daily data, assign the data elements to a daily data set (e.g., Weather and Climate). For weekly or monthly data, assign them to a weekly or monthly data set (e.g., Vegetation Index).
Assigning data elements to an appropriate data set helps maintain metadata quality and ensures data integrity, consistency, approvals, and protection. The specific configuration of each data set will depend on the available users and user groups in your system.
Decisions about which organisation units can collect the daily climate data will vary depending on local context. Since data can be provided for any administrative unit with defined geographic boundaries, this choice is left to system administrators. In most cases, the best option is to include all organisation units in your DHIS2 system.
Refer to Table 3 for detailed metadata configuration guidance.
Table 3: Datasets metadata configurations
| id | code | name | shortName | description | Period Type |
| mck6wRvBafz | CCH_DAILY | CCH - Climate/Weather (Daily) | Climate/Weather (Daily) | This will take on all data elements for climate data that can be imported on a daily time period | Daily |
| gKA14xjAFiw | CCH_WEEKLY | CCH - Environment (Weekly) | Environment (Weekly) | This will take on all data elements for vegetation index that is imported on a weekly time period | Weekly |
| seNaPr5spPO | CCH_ANNUAL | CCH - Landcover and Elevation (Annual) | Landcover and Elevation (Annual) | This will take on all data elements for landcover and Elevation that is imported on an annual time period | Yearly |
3. Assign to a data element group
To be able to select the data elements in all the DHIS2 analytics apps you also need to assign them to a data element group. For example for the Climate/Weather group.
| id | code | name | shortName | description |
| U4ClQbCq7Fv | CCH_DAILY | CCH - Climate/Weather (Daily) | Climate/Weather (Daily) | This will take on all data elements for climate data that can be imported on a daily time period |
| YUbFn4nqNJM | CCH_WEEKLY | CCH - Environment (Weekly) | Environment (Weekly) | This will take on all data elements for vegetation index that is imported on a weekly time period |
| u9w6yiCGxHa | CCH_ANNUAL | CCH - Landcover and Elevation (Annual) | Landcover and Elevation (Annual) | This will take on all data elements for landcover and Elevation that is imported on an annual time period |
Import weather and climate data
Before importing weather or climate data, you need to first create the corresponding data elements in DHIS2. Refer to the previous section for detailed instructions. You can import data in batches, and it is recommended to start with a few organisation units to ensure that everything functions as expected before performing larger imports.
Steps to import data
- Data: Select the climate or weather variable you would like to import.
- Period: Choose the start and end dates for your import. The system will import daily data for the selected period, which can later be aggregated into weekly or monthly periods within DHIS2. If your DHIS2 instance uses a timezone different from UTC, the system will automatically calculate daily values based on your configured timezone.
- Parent organisation unit: Select the parent organisation unit for which data should be imported. The system will import data for all organisation units that fall under this parent.
- Organisation unit level: Select the organisation unit level for import. The system will import data for all units at this level under the selected parent. If the parent organisation unit is already at that level, data will be imported only for that single unit.
- Data element: Select the DHIS2 data element where the imported data will be stored. Refer to the previous section for details on how to configure data elements correctly.
- Import summary: After the import, an import summary will be displayed showing:
- The number of data values successfully imported or updated.
- Any data values that failed to import, along with the reason for each failure
Definições
In the Settings section, you can adjust system-wide settings for the Climate App, which will apply to all Climate App users on your DHIS2 instance.
- Default start page for users - this sets the landing page for all users of the Climate App, so you can skip the Home page and go straight to Explore Data.
- Time zone where your org units are located - used for displaying 10-day weather forecasts with the correct time zone of the org unit locations. This overrides the time zone of the user’s web browser.
Chart settings
All charts under the Explore Data section display data for a single organisation unit at a time. Y-axis ranges are set automatically by the data displayed. The Chart settings allow you to set y-axis ranges for various data series displayed in these charts. This would help compare data across organisation units, for example, downloading climate charts at different organisation units to present together.
The list of ranges here are included. This list may change over time as more climate parameters are added to the Climate App.
- Max and min temperature
- Max change in temperature
- Max monthly and daily temperature
- Heat stress upper and lower categories