Analytics
O módulo de análise oferece algum tipo de dados analíticos locais, ou seja, alguns valores analíticos com base nos dados armazenados no dispositivo. Actualmente, não há integração com o servidor-analytics, embora eles compartilhem conceitos básicos, como visualizações, períodos relativos, orgunits relativos, etc.
Aggregated analytics
Eles mostram valores analíticos de forma agregada. Os valores podem vir de dados agregados ou dados do rastreador. Se está familiarizado com ferramentas analíticas da web, este módulo é muito semelhante ao Data Visualizer (tabelas, gráficos, ...).
Raw analytics
This module follows similar concepts to analytics endpoint in the web API. They are two basic parameters that must provide to the analytics engine to perform a evaluation: dimensions and filters.
For example, a basic query that get the number of "ANC 1st visit" (DataElement "fbfJHSPpUQD") in the last 3 months (RelativePeriod) and filtered by a the orgunit "Ngelehun CHC" (Absolute OrganisationUnit "DiszpKrYNg8") would be like this:
d2.analyticsModule().analytics()
        .withDimension(DimensionItem.DataItem.DataElementItem("fbfJHSPpUQD"))
        .withDimension(DimensionItem.PeriodItem.Relative(RelativePeriod.LAST_3_MONTHS))
        .withFilter(DimensionItem.OrganisationUnitItem.Absolute("DiszpKrYNg8"))
        .suspendEvaluate()
The engine will return a Result object containing either a DimensionalResponse or an AnalyticsException. Let's take a look at the structure of the DimensionalResponse:
DimensionalResponse(
        metadata = mapOf(
            "fbfJHSPpUQD" to MetadataItem.DataElementItem,
            "DiszpKrYNg8" to MetadataItem.OrganisationUnitItem,
            "202108" to MetadataItem.PeriodItem,
            "202109" to MetadataItem.PeriodItem,
            "202110" to MetadataItem.PeriodItem
        ),
        dimensions = listOf(
            Dimension.Data,
            Dimension.Period
        ),
        dimensionItems = mapOf(
            Dimension.Data to listOf(
                DimensionItem.DataItem.DataElementItem(uid=fbfJHSPpUQD)
            ),
            Dimension.Period to listOf(
                DimensionItem.PeriodItem.Relative(relative=RelativePeriod.LAST_3_MONTHS)
            ),
            Dimension.OrganisationUnit to listOf(
                DimensionItem.OrganisationUnitItem.Absolute(uid=DiszpKrYNg8)
            )
        ),
        filters = listOf(
            "DiszpKrYNg8"
        ),
        values = listOf(
            DimensionalValue(
                dimensions = listOf("fbfJHSPpUQD", "202108"),
                value = "17"
            ),
            DimensionalValue(
                dimensions = listOf("fbfJHSPpUQD", "202109"),
                value = "112"
            ),
            DimensionalValue(
                dimensions = listOf("fbfJHSPpUQD", "202110"),
                value = "20"
            )
        )
    )
Properties included in the DimensionalResponse object:
- Metadata: it contains a map of ids to
MetadataItem. The ids are strings that identify dataElements, periods (relative or absolute), orgunits, etc. Some examples of ids are "fbfJHSPpUQD", "202108", "LAST_3_MONTHS", "USER_ORGUNIT",... . The purpose of this map is to quickly obtain a printable representation from any id used in the other properties (dimensionItems, filters or values). TheMetadataIteminterface contains two basic properties,idanddisplayNameand it can be easily matched to the underlying class to get more information about the DataElement, Indicator, Period, etc. - Dimensions: ordered list of dimensions in which the values are disaggregated. In the example above, the first dimension is
Data, which means that the first dimension in thedimensionsproperty in the values belongs to theDatadimension. And the second one is Period. - DimensionItems: it contains a map of items grouped by dimension type. It contains the items originally used to build the query: in the example above, the period was relative, so the Period dimension include the relative period
LAST_3_MONTHS. - Filters: list of ids that act as a filter in the query.
- Values: list of
DimensionalValue. Each value contains an ordered list of ids that define the value. In the example above, the value "17" corresponds to "ANC 1st visit" ("fbfJHSPpUQD") and "August 2021" ("202108"). You can use the metadata map to get more information from those ids.
DimensionItems can be used either as dimensions or as filters. And multiple items of the same dimension can be combined in the same query. For example, this query gets "ANC 1st visit" (DataElement "fbfJHSPpUQD") and "ANC 1-3 Dropout Rate" (Indicator "ReUHfIn0pTQ") disaggregated by the category "Location: Fixed/Outreach" (Category "fMZEcRHuamy") using the options "Fixed" (CategoryOption "qkPbeWaFsnU") and "Outreach" (CategoryOption "wbrDrL2aYEc") within the last 3 months (Relative Period) in the UserOrganisationUnit (Relative OrganisationUnit), classifying the values by data item legendSet and overriding the aggregation type:
d2.analyticsModule().analytics()
        .withDimension(DimensionItem.DataItem.DataElementItem("fbfJHSPpUQD"))
        .withDimension(DimensionItem.DataItem.IndicatorItem("ReUHfIn0pTQ"))
        .withDimension(DimensionItem.CategoryItem("fMZEcRHuamy", "qkPbeWaFsnU"))
        .withDimension(DimensionItem.CategoryItem("fMZEcRHuamy", "wbrDrL2aYEc"))

        .withFilter(DimensionItem.PeriodItem.Relative(RelativePeriod.LAST_3_MONTHS))
        .withFilter(DimensionItem.OrganisationUnitItem.Relative(RelativeOrganisationUnit.USER_ORGUNIT))

        .withLegendStrategy(AnalyticsLegendStrategy.ByDataItem)

        .withAggregationType(AggregationType.LAST)

        .suspendEvaluate()
The evaluator imposes some restrictions to the parameters passed as dimensions or filters (they are similar to those imposed by the analtyics web api):
- At least one dimension item must be included as dimension property.
- Pelo menos um item de dimensão de dados deve ser incluído como uma dimensão ou como um filtro.
Additionally, the query is evaluated against the local metadata and data, which imposes additional restrictions:
- DimensionItems (DataElement, Indicator, OrganisationUnit, ...) must be downloaded in the device. By default, the SDK downloads all the dataSets and programs accessible to the user and the related metadata.
- Data must be downloaded in the device. The evaluation only takes into account the data stored in the local database.
Program indicator disaggregations
A program indicator can declare a category combination and a set of category mappings: each mapping assigns, for one category, a filter expression to every category option. When a query includes a program indicator as a data item together with category dimensions, the engine resolves those mappings and applies the corresponding expressions as additional conditions.
The relevant metadata is downloaded with the programs and exposed through:
ProgramIndicator.categoryCombo()andProgramIndicator.attributeCombo(): the category combinations the indicator is disaggregated by. The new filtersbyCategoryCombo()andbyAttributeCombo()are available inProgramIndicatorCollectionRepository.ProgramIndicator.categoryMappingIds(): the uids of theCategoryMappingobjects that apply to the indicator.CategoryMapping(uid,program,categoryId,mappingName,optionMappings) andCategoryOptionMapping(categoryMapping,optionId,filter).
Querying a disaggregated indicator is no different from any other query: just add the category dimensions.
d2.analyticsModule().analytics()
        .withDimension(DimensionItem.DataItem.ProgramIndicatorItem("programIndicatorUid"))
        .withDimension(DimensionItem.CategoryItem("categoryUid", "categoryOptionUid1"))
        .withDimension(DimensionItem.CategoryItem("categoryUid", "categoryOptionUid2"))
        .withFilter(DimensionItem.PeriodItem.Relative(RelativePeriod.LAST_3_MONTHS))
        .suspendEvaluate()
There are three options to define the legendSet strategy. AnalyticsLegendStrategy is a sealed class; from Java, the object values require the INSTANCE suffix (AnalyticsLegendStrategy.ByDataItem.INSTANCE). Code examples:
d2.analyticsModule().analytics()
        .withLegendStrategy(AnalyticsLegendStrategy.ByDataItem)       // Data items use their own LegendSet
        .withLegendStrategy(AnalyticsLegendStrategy.None)             // LegendSets are not used
        .withLegendStrategy(AnalyticsLegendStrategy.Fixed("fqs276KXCXi"))  // The provided LegendSet will be used for all data items
Visualization analytics
The visualization analtyics engine offers handy methods to evaluate Visualization objects. This engine is implemented on top of the raw analtyics engine and it basically fulfill two objectives:
- Para traduzir um objecto de visualização em uma consulta ao mecanismo Analtyics.
- To return a formatted result following the rows, columns and filters defined in the Visualization.
Para usar os objectos de visualização, eles devem ser definidos na seção "Analytics" do aplicativo da web de configurações do Android. Actualmente, não é possível baixar visualizações sob demanda do servidor, apenas baixá-las por meio do webapp de configurações do Android.
As an example, let's suppose we have a Visualization with the following parameters:
- Visualization ("SwtkWZFhrFQ").
- Columns:
- Data: two DataElements (ANC 1st Visit "fbfJHSPpUQD", ANC 2nd Visit "cYeuwXTCPkU").
- Category: Location Fixed/Outreach ("fMZEcRHuamy").
- Rows:
- Period: LAST_3_MONTHS.
- Filter:
- Organisation Unit: Badja ("YuQRtpLP10I").
The expected representation of the visualization would be something like this:
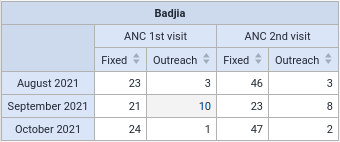
We can get the result of the visualization by calling the "visualizations" repository within the analtyics module. Optionally, we can override the values for Period and OrganisationUnit. This is useful to expose filters in the UI to allow easy modifications of the results.
d2.analyticsModule().visualizations()
        .withVisualization("SwtkWZFhrFQ")
        [.withPeriods()]
        [.withOrganisationUnits()]
        .suspendEvaluate()
The method will return a Result with two possible values: a GridAnalyticsResponse and an AnalyticsResponse. Let's take a look at the structure of the GridAnalyticsResponse. We use the Kotlin representation for convenience:
GridAnalyticsResponse(
        metadata = mapOf(
            "fbfJHSPpUQD" to MetadataItem.DataElementItem,
            "cYeuwXTCPkU" to MetadataItem.DataElementItem,
            "fMZEcRHuamy" to MetadataItem.CategoryItem,
            "qkPbeWaFsnU" to MetadataItem.CategoryOptionItem,
            "wbrDrL2aYEc" to MetadataItem.CategoryOptionItem,
            "YuQRtpLP10I" to MetadataItem.OrganisationUnitItem,
            "202108" to MetadataItem.PeriodItem,
            "202109" to MetadataItem.PeriodItem,
            "202110" to MetadataItem.PeriodItem
        ),
        headers = GridHeader(
            columns = listOf(
                listOf(
                    GridHeaderItem(id=fbfJHSPpUQD, weight=2),
                    GridHeaderItem(id=cYeuwXTCPkU, weight=2)
                ),
                listOf(
                    GridHeaderItem(id=qkPbeWaFsnU, weight=1),
                    GridHeaderItem(id=wbrDrL2aYEc, weight=1),
                    GridHeaderItem(id=qkPbeWaFsnU, weight=1),
                    GridHeaderItem(id=wbrDrL2aYEc, weight=1)
                )
            ),
            rows = listOf(
                listOf(
                    GridHeaderItem(id=202108, weight=1),
                    GridHeaderItem(id=202109, weight=1),
                    GridHeaderItem(id=202110, weight=1)
                )
            )
        ),
        dimensions = GridDimension(
            columns = listOf(
                Dimension.Data,
                Dimension.Category(uid=fMZEcRHuamy)
            ),
            rows = listOf(
                Dimension.Period
            )
        ),
        dimensionItems = mapOf(
            Dimension.Data to listOf(
                DimensionItem.DataItem.DataElementItem(uid=fbfJHSPpUQD),
                DimensionItem.DataItem.DataElementItem(uid=cYeuwXTCPkU)
            ),
            Dimension.Period to listOf(
                DimensionItem.PeriodItem.Relative(relative=LAST_3_MONTHS)
            ),
            Dimension.Category(uid=fMZEcRHuamy) to listOf(
                DimensionItem.CategoryItem(uid=fMZEcRHuamy, categoryOption=qkPbeWaFsnU),
                DimensionItem.CategoryItem(uid=fMZEcRHuamy, categoryOption=wbrDrL2aYEc)
            ),
            Dimension.OrganisationUnit to listOf(
                DimensionItem.OrganisationUnitItem.Absolute(uid=YuQRtpLP10I)
            )
        ),
        filters = listOf(
            "YuQRtpLP10I"
        ),
        values = listOf(
            listOf(
                GridResponseValue(
                    columns=[fbfJHSPpUQD, qkPbeWaFsnU],
                    rows=[202108],
                    value=23
                ),
                GridResponseValue(
                    columns=[fbfJHSPpUQD, wbrDrL2aYEc],
                    rows=[202108],
                    value=3
                ),
                GridResponseValue(
                    columns=[cYeuwXTCPkU, qkPbeWaFsnU],
                    rows=[202108],
                    value=46
                ),
                GridResponseValue(
                    columns=[cYeuwXTCPkU, wbrDrL2aYEc],
                    rows=[202108],
                    value=3
                )
            ),
            listOf(
                GridResponseValue(
                    columns=[fbfJHSPpUQD, qkPbeWaFsnU],
                    rows=[202109],
                    value=21
                ),
                GridResponseValue(
                    columns=[fbfJHSPpUQD, wbrDrL2aYEc],
                    rows=[202109],
                    value=10
                ),
                GridResponseValue(
                    columns=[cYeuwXTCPkU, qkPbeWaFsnU],
                    rows=[202109],
                    value=23
                ),
                GridResponseValue(
                    columns=[cYeuwXTCPkU, wbrDrL2aYEc],
                    rows=[202109],
                    value=8
                )
            ),
            listOf(
                GridResponseValue(
                    columns=[fbfJHSPpUQD, qkPbeWaFsnU],
                    rows=[202110],
                    value=24
                ),
                GridResponseValue(
                    columns=[fbfJHSPpUQD, wbrDrL2aYEc],
                    rows=[202110],
                    value=1
                ),
                GridResponseValue(
                    columns=[cYeuwXTCPkU, qkPbeWaFsnU],
                    rows=[202110],
                    value=47
                ),
                GridResponseValue(
                    columns=[cYeuwXTCPkU, wbrDrL2aYEc],
                    rows=[202110],
                    value=2
                )
            )
        )
)
As we can see, the GridDimensionalResponse is very similar to the DimensionalResponse with additional information about the columns and rows defined in the visualization.
Properties included in the GridDimensionalResponse object:
- Metadata: it has same format and follows the purpose than in
DimensionalResponse. - Cabeçalhos: define a estrutura dos cabeçalhos da tabela. Cada entrada em colunas/linhas representa uma dimensão. O peso representa a quantas colunas/linhas ele se aplica. No exemplo, a primeira dimensão nas colunas (dataElements) tem peso 2, enquanto a segunda dimensão (categoryOptions) tem peso 1. Pode ser facilmente compreendida olhando a tabela.
- Dimensões: tem a mesma finalidade que em
DimensionalResponse, mas as dimensões são agrupadas por colunas e linhas. - DimensionItems: tem o mesmo formato e segue a finalidade do
DimensionalResponse. - Filters: it has same format and follows the purpose than in
DimensionalResponse. - Valores: inclui informações adicionais sobre a representação dos valores. Cada entrada na matriz "valores" representa uma linha da tabela. Esta entrada é uma lista de
GridResponseValue, que representa uma célula na tabela. CadaGridResponseValuecontém informações de contexto sobre as colunas e linhas às quais o valor pertence. Este formato facilita a impressão do resultado em um formato tabular sem processamento adicional.
Dimension support
| Dimension | Elemento | Apoio, suporte |
|---|---|---|
| Data: | Indicadores | Yes* |
| DataElements | sim | |
| DataElements details | sim | |
| Event data items | sim | |
| Indicadores de programa | Yes** | |
| DataSets: Reporting rate | Não | |
| DataSets: Reporting rate on time | Não | |
| DataSets: Actual reports | Não | |
| DataSets: Actual reports on time | Não | |
| DataSets: Expected reports | Não | |
| Period: | Fixed | sim |
| Relative | sim | |
| Unidade Organizacional: | Fixed | sim |
| Relative | sim | |
| Level | sim | |
| OU Groups | sim | |
| De outros: | Categories (CategoryOptions) | Yes*** |
| Category Option Group Sets | Não | |
| Organisation Unit Group Sets | Não |
*Check the table Indicator support for details.
**Check the table Program indicator support for details.
***In the case of ProgramIndicators, they are only applied in EVENT ProgramIndicators.
Indicator support
This table shows the functionality supported by the Indicator dimension item compared to the backend analytics.
| Modelo | Elemento | Backend | Android SDK |
|---|---|---|---|
| Mathematical: | Parenthesis | sim | sim |
| Plus (+) | sim | sim | |
| Minus (-) | sim | sim | |
| Power (^) | sim | Não | |
| Multiply (*) | sim | sim | |
| Divide (/) | sim | sim | |
| Modulus (%) | sim | sim | |
| Logical: | NOT | sim | sim |
| ! | sim | sim | |
| AND | sim | sim | |
| && | sim | sim | |
| OR | sim | sim | |
| || | sim | sim | |
| Comparison: | Equal (==) | sim | sim |
| NotEqual (!=) | sim | sim | |
| GT (>) | sim | sim | |
| LT (<) | sim | sim | |
| GE (>=) | sim | sim | |
| LE (<=) | sim | sim | |
| Literals: | null | sim | sim |
| Functions: | FirstNonNull | sim | sim |
| Greatest | sim | sim | |
| If | sim | sim | |
| IsNotNull | sim | sim | |
| IsNull | sim | sim | |
| Least | sim | sim | |
| Log | sim | Não | |
| Log10 | sim | Não | |
| Subexpression | sim | Não | |
| .aggregationType | sim | sim | |
| .maxDate | sim | sim | |
| .minDate | sim | sim | |
| .periodOffset | sim | sim | |
| .yearToDate | sim | sim | |
| Dimensões: | Constante | sim | sim |
| Elemento de Dados | sim | sim | |
| ProgramAttribute | sim | sim | |
| ProgramDataElement | sim | sim | |
| ProgramIndicator | sim | sim | |
| OrgUnitGroup | sim | Não | |
| ReportingRate | sim | Não | |
| Days | sim | sim | |
| PeriodInYear | sim | sim | |
| YearlyPeriodCount | sim | sim | |
| N_Brace (indicators) | sim | Não |
Program indicator support
This table shows the functionality supported by the ProgramIndicator dimension item compared to the backend analytics.
| Modelo | Elemento | Backend | Android SDK |
|---|---|---|---|
| Mathematical: | Parenthesis | sim | sim |
| Plus (+) | sim | sim | |
| Minus (-) | sim | sim | |
| Power (^) | sim | Não | |
| Multiply (*) | sim | sim | |
| Divide (/) | sim | sim | |
| Modulus (%) | sim | sim | |
| Logical: | NOT | sim | sim |
| ! | sim | sim | |
| AND | sim | sim | |
| && | sim | sim | |
| OR | sim | sim | |
| || | sim | sim | |
| Comparison: | Equal (==) | sim | sim |
| NotEqual (!=) | sim | sim | |
| GT (>) | sim | sim | |
| LT (<) | sim | sim | |
| GE (>=) | sim | sim | |
| LE (<=) | sim | sim | |
| Literals: | null | sim | sim |
| Functions: | FirstNonNull | sim | sim |
| Greatest | sim | sim | |
| If | sim | sim | |
| IsNotNull | sim | sim | |
| IsNull | sim | sim | |
| Least | sim | sim | |
| Log | sim | Não | |
| Log10 | sim | Não | |
| PeriodOffset | sim | Não | |
| Contains | sim | sim | |
| ContainsItems | sim | sim | |
| FunçõesD2: | D2AddDays | Não | Não |
| D2Ceil | Não | Não | |
| D2Concatenate | Não | Não | |
| D2Condition | sim | sim | |
| D2Count | sim | sim | |
| D2CountIfCondition | sim | sim | |
| D2CountIfValue | sim | sim | |
| D2DaysBetween | sim | sim | |
| D2Floor | Não | Não | |
| D2HasValue | sim | sim | |
| D2Left | Não | Não | |
| D2Length | Não | Não | |
| D2MaxValue | sim | sim | |
| D2MinutesBetween | sim | sim | |
| D2MinValue | sim | sim | |
| D2Modulus | Não | Não | |
| D2MonthsBetween | sim | sim | |
| D2Oizp | sim | sim | |
| D2RelationshipCount | sim | sim | |
| D2Right | Não | Não | |
| D2Round | Não | Não | |
| D2Split | Não | Não | |
| D2Substring | Não | Não | |
| D2ValidatePattern | Não | Não | |
| D2WeeksBetween | sim | sim | |
| D2anosentre | sim | sim | |
| D2Zing | sim | sim | |
| D2Zpvc | sim | sim | |
| D2LastEventDate | Não | Não | |
| D2AddControlDigits | Não | Não | |
| D2CheckControlDigits | Não | Não | |
| D2ZScoreWFA | Não | Não | |
| D2ZScoreWFH | Não | Não | |
| D2ZScoreHFA | Não | Não | |
| D2InOrgUnitGroup | Não | Não | |
| D2HasUserRole | Não | Não | |
| Funções de agregação: | média | sim | Não |
| contagem | sim | Não | |
| max | sim | Não | |
| min | sim | Não | |
| percentileCont | sim | Não | |
| stddev | sim | Não | |
| stddevPop | sim | Não | |
| stddevSamp | sim | Não | |
| sum | sim | Não | |
| variance | sim | Não | |
| Variáveis: | AnalyticsPeriodEnd | sim | sim |
| AnalyticsPeriodStart | sim | sim | |
| CreationDate | sim | sim | |
| CurrentDate | sim | sim | |
| CompletedDate | sim | sim | |
| Data de vencimento | sim | sim | |
| EnrollmentCount | sim | sim | |
| Data de inscrição | sim | sim | |
| EnrollmentStatus | sim | sim | |
| EventStatus | sim | sim | |
| EventCount | sim | sim | |
| Data de execução | sim | sim | |
| Data do evento | sim | sim | |
| IncidentDate | sim | sim | |
| OrgunitCount | sim | sim | |
| ProgramStageId | sim | sim | |
| ProgramStageName | sim | sim | |
| SyncDate | sim | sim | |
| TeiCount | sim | sim | |
| ValueCount | sim | sim | |
| ZeroPosValueCount | sim | sim | |
| De outros: | Constante | sim | sim |
| ProgramStageElement | sim | sim | |
| ProgramAttribute | sim | sim | |
| PS_EVENTDATE | sim | sim |
Aggregation type support
| Modelo | Android SDK |
|---|---|
| SUM | sim |
| AVERAGE | sim |
| AVERAGE_SUM_ORG_UNIT | sim |
| LAST | sim |
| LAST_AVERAGE_ORG_UNIT | sim |
| LAST_IN_PERIOD | sim |
| LAST_IN_PERIOD_AVERAGE_ORG_UNIT | sim |
| LAST_LAST_ORG_UNIT | sim |
| FIRST | sim |
| FIRST_AVERAGE_ORG_UNIT | sim |
| FIRST_FIRST_ORG_UNIT | sim |
| COUNT | sim |
| STDDEV | Não |
| VARIANCE | Não |
| MIN | sim |
| MIN_SUM_ORG_UNIT | sim |
| MAX | sim |
| MAX_SUM_ORG_UNIT | sim |
| NONE | Não |
| CUSTOM | Não |
| DEFAULT | Não |
Tracker line list
This kind of analytics is similar to those obtained through the Line Listing web app. It allows to generate line lists at event or enrollment level. These line list might include data elements, attributes, program indicators, variables and optionally filter those entries by the values in the their columns.
A common use-case is to generate a list of event or enrollments that meet a certain criteria, such as a value within a particular range, or a certain status, or a certain date range.
For example, a query that contains all the ACTIVE enrollments in the program "fbfJHSPpUQD" whose attribute "p4mRWMtCxtB" has a value between 40 and 50 would look like this. Note that the status is included as a filter, so there is not an explicit column for it.
d2.analyticsModule().trackerLineList()
            .withEnrollmentOutput("fbfJHSPpUQD")
            .withFilter(
                TrackerLineListItem.ProgramStatusItem(
                    filters = listOf(
                        EnumFilter.EqualTo(EnrollmentStatus.ACTIVE.name)
                    )
                )
            )
            .withColumn(TrackerLineListItem.OrganisationUnitItem())
            .withColumn(
                TrackerLineListItem.ProgramAttribute(
                    uid = "p4mRWMtCxtB",
                    filters = listOf(
                        DataFilter.GreaterThan("40"),
                        DataFilter.LowerThan("50"),
                    ),
                ),
            )
            .suspendEvaluate()
The response is a Result object of TrackerLineListResponse, which has the following structure:
TrackerLineListResponse(
  metadata = mapOf(
      "p4mRWMtCxtB" to MetadataItem.TrackedEntityAttributeItem
  ),
  headers = listOf(
    TrackerLineListItem.OrganisationUnitItem,
    TrackerLineListItem.ProgramAttribute
  ),
  filters = listOf(
    TrackerLineListItem.ProgramStatusItem
  ),
  rows = listOf(
    listOf(
      TrackerLineListValue(id = "ouItem", value = "Child 1"),
      TrackerLineListValue(id = "p4mRWMtCxtB", value = "45")
    ),
    listOf(
      TrackerLineListValue(id = "ouItem", value = "Child 2"),
      TrackerLineListValue(id = "p4mRWMtCxtB", value = "49")
    ),
    listOf(
      TrackerLineListValue(id = "ouItem", value = "Child 2"),
      TrackerLineListValue(id = "p4mRWMtCxtB", value = "41")
    )
  )
)
Optionally, it is possible to use a TrackerVisualization object (called EventVisualization in the API) to evaluate a predefined line list. The TrackerVisualization must have the type LINE_LIST. It is also possible to override a specific value.
For example, this query uses the configuration in the TrackerVisualization "s85urBIkN0z" and adds or overrides the column ProgramStatusItem filtering by ACTIVE.
d2.analyticsModule().trackerLineList()
  .withTrackerVisualization("s85urBIkN0z")
  .withColumn(
    TrackerLineListItem.ProgramStatusItem(
      filters = listOf(
        EnumFilter.EqualTo(EnrollmentStatus.ACTIVE.name)
      )
    )
  )
  .suspendEvaluate()
In order to use the TrackerVisualization objects, they must be set in the "Analytics" section of the Android Settings webapp. Currently, it is not possible to download on-demand visualizations from the server, just to downloaded through the Android Settings webapp.
Event line list
They are event-based analytics. If you are familiar with web analytic tools, it is very similar to Event Reports (line list). It is a simplified case of Tracker Line List.
A common use-case is to generate an event line list of a repeatable stage in the context of a particular TEI in order to show the evolution of a particular value across the events.
Por exemplo, vamos supor que temos um estágio repetível com dois dataElements (altura e peso) e um indicador baseado nesses valores (IMC, Índice de Massa Corporal). Gostaríamos de mostrar a evolução desses valores ao longo dos eventos
d2.analyticsModule().eventLineList()
        .byProgramStage().eq("stage_id")
        .byTrackedEntityInstance().eq("tei_id")
        .withDataElement("height_id")
        .withDataElement("weight_id")
        .withProgramIndicator("BMI_id")
        .suspendEvaluate()
O resultado seria uma lista de eventos com os valores avaliados (elemento de dados e indicadores), bem como algumas propriedades úteis displayName para exibir o resultado em uma tabela ou gráfico.