Configure metadata (Metadata Management app)
Note
This section documents the Metadata Management app, which replaces the functionality of the Maintenance app. The Metadata Management app is available from the DHIS2 App Hub and is compatible with DHIS2 core V41 and above.
If you are using DHIS2 without the Metadata Management app installed, see Configure metadata for the Maintenance app instead.
About the Metadata Management app
In the Metadata Management app you configure all the metadata objects you need to collect and analyze data:
- Catégories
- Éléments de données
- Ensemble de données et formulaires de saisie de données
- Indicators and Predictors
- Unités d’organisation
- Ensembles d'options
- Validations
- Attributs
- Constantes
- Légendes
- Vues SQL
- Langues
- Crochets pour tableaux analytiques
N.B.
Les fonctions auxquelles vous avez accès dépendent des autorisations d'accès de votre rôle d'utilisateur.
The app's sidebar also has Programs and Data approval sections, which this chapter does not cover. For those, see Configure programs (Metadata Management app) and Data approval overview.
Note
The Metadata Management app is released on a continuous release cycle, meaning new sections and features are added regularly. If a section listed above is not yet visible in your installed version of the app, it may not yet have been implemented. You can update the app from the App Hub to get the latest features.
The Metadata Management app is a complete modernisation of the legacy Maintenance app. Key improvements include:
- Merging duplicate metadata — You can merge duplicate metadata objects (currently: category options, indicators, indicator types) directly from the list view. This supports ongoing metadata cleanup.
- Advanced filtering and search — Each object list has improved filtering options to help you find objects by name, code, or other attributes.
- Bulk sharing — You can update sharing settings for multiple objects at once.
Navigating metadata objects

The left-hand sidebar lists all available metadata sections. Click any section to expand it and see the individual object types it contains, as shown below.

When you open the Metadata Management app, the left-hand sidebar displays the metadata object categories. Click a category to expand its object types, then click an object type to view its list.
Metadata objects are presented in a list with predefined columns relevant to each object. You can customise which columns are shown in the list for the current object. These customisations are per user and will not affect other users. Note that these changes do not edit any metadata — they only affect how the list is presented.
Gestion des colonnes visibles

- Click the Manage View button above the list of objects you want to configure.
- A dialog appears with two tabs: Columns and Filters. Select the Columns tab.
- The default selected columns are shown on the right.
- Click any column name in the list of Available columns on the left to move it to the selected list.
- Use the arrow buttons to move columns between the Available and Selected lists.
- Reorder selected columns using the up and down arrow buttons.
- Click Update view once you are satisfied with your changes.
Click Reset to default to restore the default column configuration.
Filtering and searching
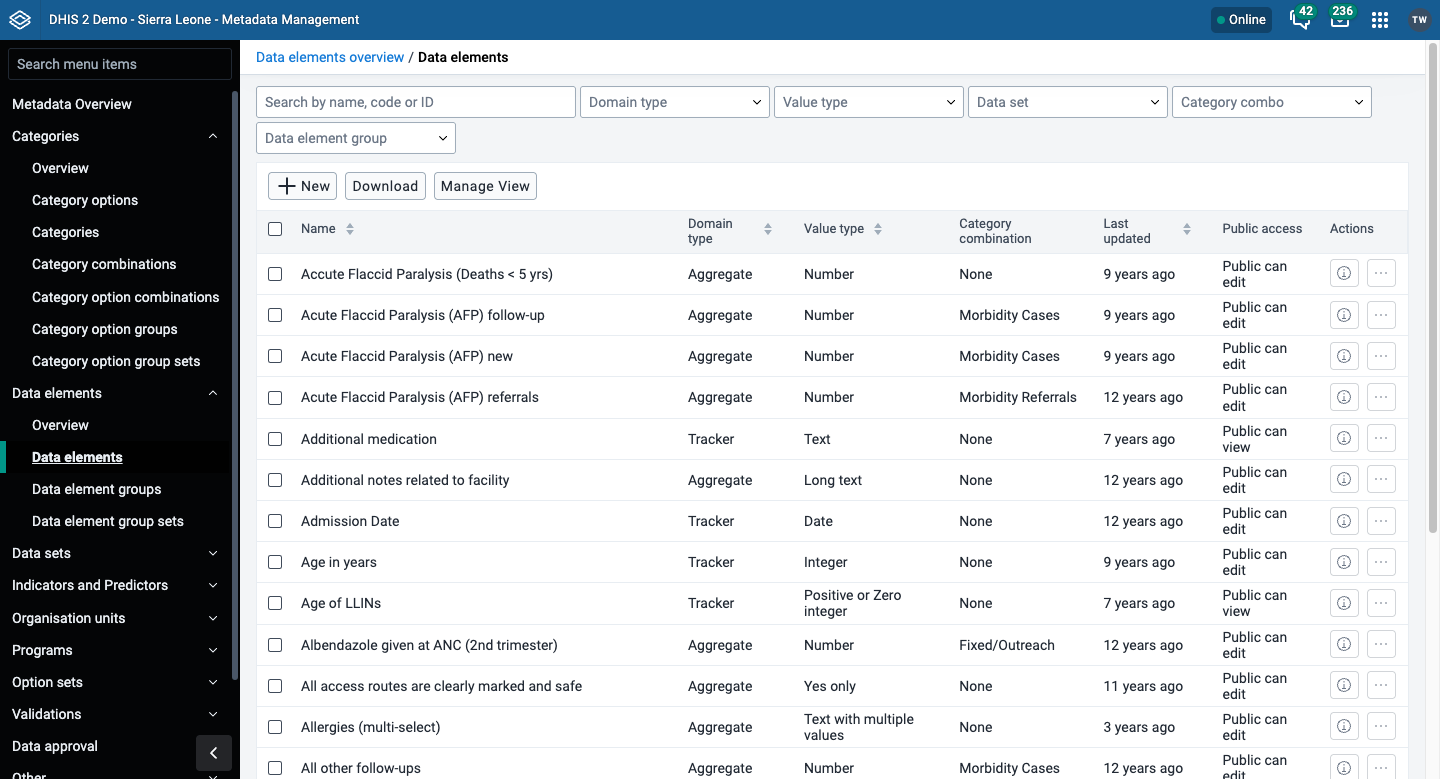
Each object list includes a search bar and a row of filter dropdowns at the top of the list. The available filters are specific to each object type — for example, the data elements list can be filtered by Domain type, Value type, Data set, Category combo and Data element group.
You can also customise which filters appear using the Manage View button:
- Click Manage View above the list.
- Select the Filters tab.
- Move filters between Available filters and Selected filters as needed.
- Click Update view.

Download metadata
You can download the metadata for the object you are currently viewing. The download will respect any active filters.
- Click the Manage View button above the list.
- In the dropdown, select Download.
- In the dialog that appears, select your preferred format and compression.
- Optionally select With sharing to include sharing data for the metadata.
- Cliquez sur Télécharger.
All Metadata view
The new All metadata view allows you to search for keywords across a range of metadata types. Typing in the search box filters the results automatically, and the metadata types dropdown lets you narrow down which types of metadata are displayed. Expanding a type shows five results initially, with the option to load more.


Bulk update sharing
In the Metadata Management app you can select multiple entries in the list view and update the sharing settings of all of them at once. First select the items you want to update. In the example below, the view has been filtered to show only category options in the category Labour complications, and all of them have been selected.
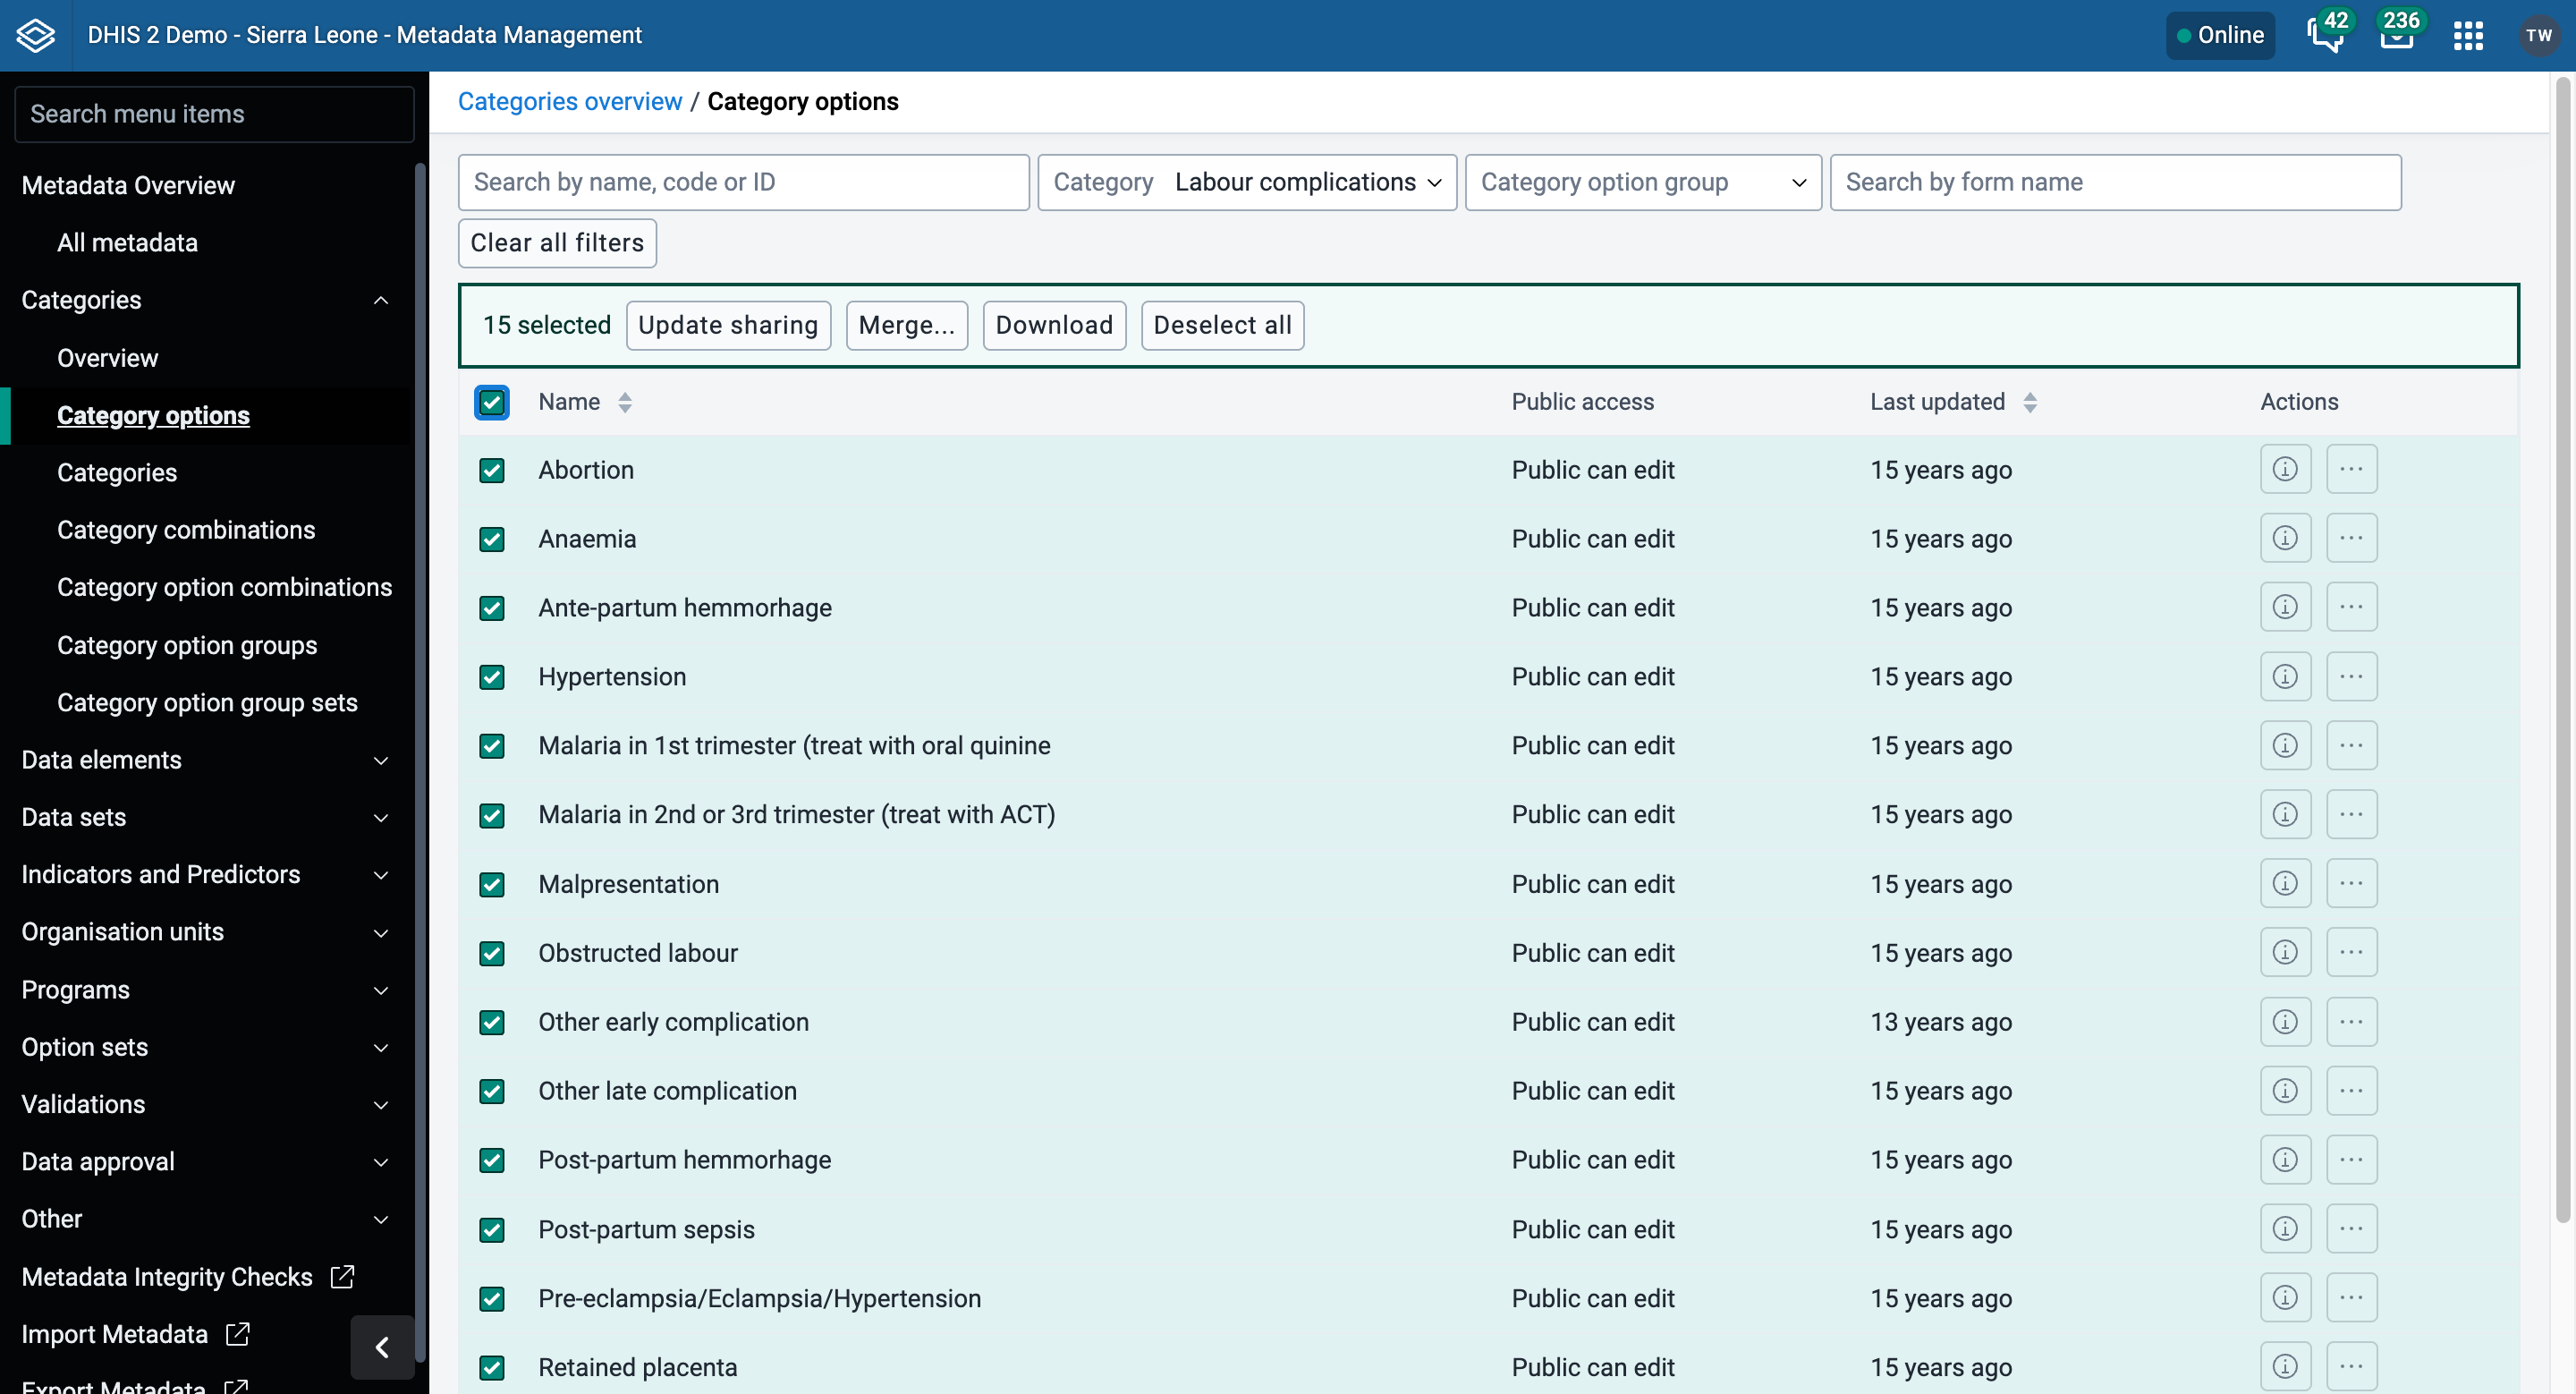
Clicking Update sharing opens a dialog where you choose which sharing settings to add to the selected objects.

Further options for editing objects' existing sharing settings are under development.
Common metadata object fields
Many metadata objects in the sections below share the same handful of fields. This table explains what each one is for and any format constraints, so the individual procedures don't have to repeat it. Where a step below names one of these fields with no further explanation, this table is the reference — sections only add their own explanation for fields that are unique to that object type.
| Champ | Used on | Purpose and best practice |
|---|---|---|
| Nom | All objects | The full display name shown throughout the app, in lists and in most reports. Must usually be unique within the object type. |
| Nom court | Most objects | A shorter version of Name, often with a character limit (commonly 50, sometimes fewer — the form tells you if you exceed it). Used wherever space is tight, for example Pivot Table column headers or mobile apps. |
| Code | All objects | An optional identifier made of letters, numbers, dots, dashes and underscores (no spaces). Codes are how external systems and data exchanges reference DHIS2 objects, so changing a code once it's in use elsewhere can break integrations. Agree on a coding convention before creating objects at scale rather than retrofitting one later. |
| Nom du formulaire | Data elements, category options and similar objects | An alternative name shown as a column header in data entry forms instead of the display Name. Use it when the display Name is too long or phrased differently from what should appear on a data entry form. |
| Description | All objects | Worth filling in even where marked optional. Explain what the object measures or represents and why, in enough detail that someone unfamiliar with the project could understand it without asking you. |
| Start date / End date | Category options and other time-bound objects | Restricts when the object is available, for example a category option that only applies during a specific project phase. |
| Color / Icon | Data elements, indicators, options | Optional visual styling shown in data capture apps (Capture, DHIS2 Android Capture) to help users tell objects apart at a glance. |
| Data dimension / Data dimension type | Categories, category combinations, category option groups and sets, data element and indicator group sets | Controls whether the object becomes available as a selectable dimension in analytics apps such as Pivot Table and Data Visualizer, alongside built-ins like Period and Organisation unit. Where the object offers a choice such as Disaggregation vs Attribute, that choice is specific to how the object is used — see the object's own section below. |
Common actions
Show details, Sharing settings, Translate, Delete and Clone work the same way for almost every object type covered in this chapter, regardless of whether it's a category, a data element, a predictor or something else. This section documents each action once. Each object type's own section below only notes where it deviates from this — for example an object type that doesn't support one of these actions, or has an object-specific detail worth knowing before you use it.
Show details
- Open the Metadata Management app and find the type of metadata object you want to view.
- Dans la liste des objets, cliquez sur le menu des options et sélectionnez Afficher les détails.
Change sharing settings
You can assign different sharing settings to metadata objects to control which users and user groups can view or edit them, for example organisation units and tracked entity attributes.
Some metadata objects also allow you to change the sharing setting of data entry for the object. These additional settings control who can view or enter data in form fields using the metadata.
N.B.
Le paramètre par défaut considère que tout le monde (Accès public) peut trouver, afficher et modifier les objets de métadonnées.
- Open the Metadata Management app and find the type of metadata object you want to modify.
- In the object list, click the options menu and select Sharing settings.
- (Optional) Add users or user groups: search for a user or user group and select it.
- Change sharing settings for the access groups you want to modify:
- Peut modifier et visualiser : Le groupe d'accès peut visualiser et modifier l'objet.
- Peut seulement visualiser : Le groupe d'accès peut seulement visualiser l'objet.
- No access (only applicable to Public access): The public will not have access to the object.
- Change data sharing settings where applicable:
- Peut saisir des données : Le groupe d'accès peut visualiser et saisir des données pour l'objet.
- Peut visualiser les données : Le groupe d'accès peut visualiser les données relatives à l'objet.
- No access: The access group will not have access to data for the object.
- Cliquez sur Fermer
Translate
DHIS2 provides functionality for translations of database content. You can translate a metadata object into any number of locales. A locale represents a specific geographical, political, or cultural region.
Tip
To activate a translation for yourself, open the System Settings app, click Appearance and select a language.
- Open the Metadata Management app and find the type of metadata object you want to translate.
- Dans la liste des objets, cliquez sur le menu Options et sélectionnez Traduire.
Tip
Organisation unit levels don't have an options menu — click directly on the Translate icon next to the list item instead.
- Sélectionnez un emplacement.
- Type a Name and optionally a Short name and Description in the chosen locale.
- Cliquez sur Sauvegarder.
Delete
Note
You can only delete a metadata object if no data is associated with it.
Where deletion is blocked, or where you would rather retire an object than lose its history, use Sharing settings to restrict access instead. The object and its data still exist, but users without access won't see them. Some object types offer a dedicated alternative — an organisation unit can be closed rather than deleted, for example.
Warning
Deleting objects from DHIS2 is not recommended. In almost all cases it is better to deactivate or close an object rather than deleting it, as deletion is irrevocable.
- Open the Metadata Management app and find the type of metadata object you want to delete.
- Dans la liste des objets, cliquez sur le menu Options et sélectionnez Supprimer.
- Cliquez sur Confirmer.
One object type carries an extra risk beyond the general note above:
- Data sets — deleting a data set also irrevocably deletes any data entry forms and section forms built for it. Make sure you have a backup of your database before deleting a data set, in case you need to restore it later.
Clone
Cloning a metadata object can save time when you need to create many similar objects.
- Open the Metadata Management app and find the type of metadata object you want to clone.
- Dans la liste des objets, cliquez sur le menu Options et sélectionnez Cloner.
- All values from the original object are copied. Values that must be unique, such as Name and Code, need to be updated. Modify the other values you want to change.
- Cliquez sur Sauvegarder.
Clone is available for most object types in this chapter. It is not available for: Category option combination, Data set, Section, Section form, Custom form, and Organisation unit level.
Merge
Merging consolidates two duplicate objects into one: it reassigns all references from a source object to a target object, then deletes the source. Unlike the actions above, merge is available for only some object types, and the navigation path and required authority differ by type.
The Metadata Management app provides a merge screen for eight object types:
| Type d'objet | Procedure |
|---|---|
| Catégories | Same pattern as below |
| Des combinaisons de catégories | Same pattern as below |
| Combinaisons d'options de catégories | Same pattern as below |
| Options de catégorie | Merge category options |
| Éléments de données | Same pattern as below |
| Indicateurs | Merge indicators |
| Types d'indicateurs | Merge indicator types |
| Unités d’organisation | Same pattern as below |
All eight work the same way: open the object type's list, choose Merge, select the source object or objects to be removed and the target object to keep, review the summary of changes, then confirm. Each merge screen requires its own authority, and merging is irreversible — the sources are deleted and every reference is repointed at the target. Three are written out in full below; the rest follow the same pattern from their own list view.
Using a transfer list component
Many sections below ask you to assign one type of object to another — category options to a category, say, or data elements to a data element group — using the two-panel selector shown below. Wherever a procedure tells you to "select X and assign them", this is the component it means.
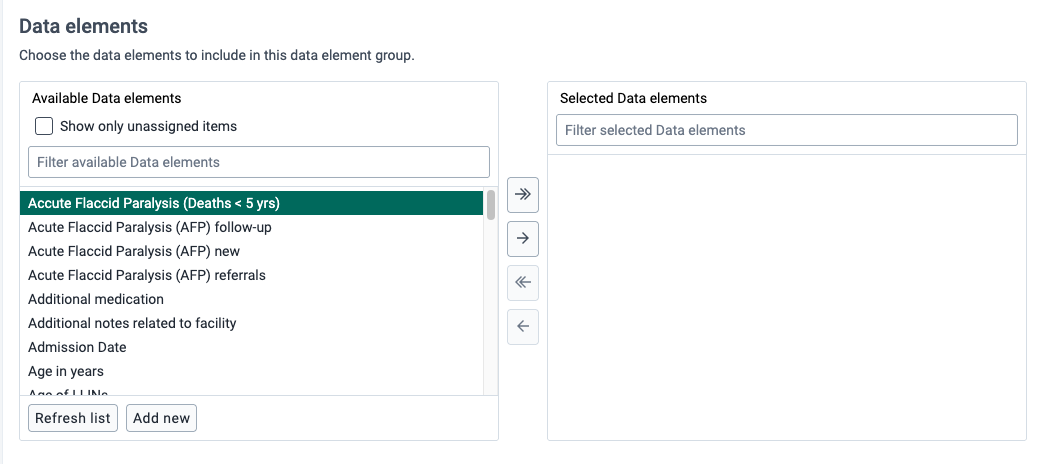
Available (left) panel
- Lists every object of that type that could be assigned, whether or not it's already assigned elsewhere.
- Some object types add a Show only unassigned items checkbox above this list, which narrows the choice to items that do not already belong to another object of the same type. It is most useful when assigning members to groups.
- Each panel also has its own filter box above the list, so you can search the Available and Selected lists independently.
Moving items to Selected
- Double-click a single item in the Available list to move it to the Selected list immediately.
- Click an item to select it, or hold Shift or Ctrl while clicking to select a range or several individual items, then click the single right-pointing arrow to move the selection across.
- Click the double right-pointing arrow to move every item in the Available list to Selected, regardless of what's selected.
Removing items from Selected
- Double-click a single item in the Selected list to move it back to Available.
- Click an item to select it, or hold Shift or Ctrl while clicking to select a range or several individual items, then click the single left-pointing arrow to move the selection back.
- Click the double left-pointing arrow to move every item in the Selected list back to Available.
Add new
Where a transfer list offers an Add new button, clicking it opens a drawer with a blank form for creating a new item. Complete the form and click Save and close. The new item then appears in the Available list, ready to be assigned. This lets you create a missing item without leaving the parent object you are editing.
Manage categories
About categories
Les catégories sont généralement un concept, par exemple "sexe", "âge" ou "état de la maladie". Les éléments de données tels que le "nombre de cas de paludisme confirmés" sont souvent divisés en plus petits éléments afin de déterminer, par exemple, le nombre de cas de paludisme confirmés pour des groupes d'âge particuliers.
Use categories to disaggregate data elements into individual components. You can also use categories to assign metadata attributes to all data recorded in a specific data set, such as "Implementing partner" or "Funding agency."
For example, create a category called "Age" with three category options: "Under 1", "1-5" and "Over 5". Assign that category to the data element through a category combination. This creates three separate fields for the data element in the data entry forms:
- Nombre de cas confirmés de paludisme (Moins de 1 an)
- Nombre de cas confirmés de paludisme (1-5 ans)
- Nombre de cas confirmés de paludisme (plus de 5 ans)
Sans les catégories, vous auriez dû créer séparément chacun des éléments de données énumérés ci-dessus.
In the Metadata Management app, you manage the following category objects:
| Type d'objet | Fonctions disponibles |
|---|---|
| Option de catégorie | Create, edit, clone, share, merge, delete, show details and translate |
| Catégorie | Créer, modifier, cloner, partager, supprimer, afficher les détails et traduire |
| Combinaison de catégories | Créer, modifier, cloner, partager, supprimer, afficher les détails et traduire |
| Combinaison d’options de catégorie | Modifier et afficher les détails |
| Groupe d'options de catégorie | Créer, modifier, cloner, partager, supprimer, afficher les détails et traduire |
| Ensemble de groupes d'options de catégorie | Créer, modifier, cloner, partager, supprimer, afficher les détails et traduire |
Workflow
- Créez toutes les options de catégorie.
- Create categories composed of the multiple category options you have created.
- Create category combinations composed of either one or multiple categories.
- Créez des éléments de données et attribuez-les à une combinaison de catégories.
Create or edit a category option

When possible, reuse category options. For instance, there might be two categories which share a particular category option (for example "< 1 year of age"). When creating the categories, this category option can be reused. This is important if particular category options (or category option combinations) need to be analysed together.
- Open the Metadata Management app and click Categories > Category options.
- Click the + New button to add a new category option, or click the options menu next to an existing one and select Edit.
- Fill in Name, Short name, Code, Form name, Description, Start date and End date — see Common metadata object fields. Only Name is required.
- Sélectionnez des unités d'organisation et attribuez-les.
Tip
You can automatically select all organisation units that belong to an organisation unit level or organisation unit group, for example "Chiefdom" or "Urban". Select an Organisation unit level or Organisation unit group and click Select.
- Cliquez sur Sauvegarder.
Create or edit a category
Après avoir créé toutes les options de catégorie pour une catégorie particulière, vous pouvez alors créer cette catégorie.
- Open the Metadata Management app and click Categories > Categories.
- Click the + New button.
- Fill in Name, Short name, Code and Description — see Common metadata object fields.
- Select a Data dimension type — Disaggregation for a category used to break data elements into components, or Attribute to let the category be used to assign a combination of categories to data recorded through a data set.
- (Optional) Select Data dimension to make the category available as a dimension in analytics apps.
- Sélectionnez les options de catégorie et attribuez-les.
- Cliquez sur Sauvegarder.
Create or edit a category combination
Category combinations let you combine multiple categories into a related set.
Vous pouvez ventiler l'élément de données "Nombre de nouvelles infections par le VIH" dans les catégories suivantes :
- Service VIH : "Autres", "PTME", "Tuberculose"
- Genre : "Masculin", "Féminin"
In this example, there are two levels of disaggregation that consist of two separate data element categories. Each data element category consists of several data element category options.
Dans DHIS2, les différents éléments de données sont désagrégés selon un ensemble commun de catégories. En combinant ces différentes catégories en une combinaison de catégories et en affectant ces combinaisons aux éléments de données, vous pouvez appliquer rapidement les niveaux de désagrégation appropriés à un grand nombre d'éléments de données.
- Open the Metadata Management app and click Categories > Category combinations.
- Click the + New button.
- Fill in Name and Code — see Common metadata object fields.
- Select a Data dimension type — Disaggregation or Attribute.
- (Optional) Select Skip category total in reports.
- Sélectionnez des catégories et attribuez-les.
- Cliquez sur Sauvegarder.
Create or edit a category option group
Vous pouvez regrouper et classer les options de catégorie à partir des groupes d'options de catégorie. L'objectif principal du groupe d'options de catégorie est d'ajouter plus de dimensionnalité à vos données saisies pour l'analyse, par exemple dans les applications Tableau croisé dynamique ou Visualiseur de données.
Consider a system where data is collected by "projects", and projects are modelled as category options. The system must be able to analyse data based on which donor supports the project. In this case, create a category option group set called "Donor". Each donor can be created as a category option group, where each category option / project is put in the appropriate group. In the data analysis applications, the "Donor" group set appears as a data dimension and each donor appears as a dimension item, ready to be included in reports.
Category option groups allow you to classify category options into groups that work together.
- Open the Metadata Management app and click Categories > Category option groups.
- Click the + New button.
- Fill in Name, Short name, Code and Description — see Common metadata object fields.
- Select a Category option group usage — Disaggregation or Attribute. This works the same way as Data dimension type; see Common metadata object fields.
- Sélectionnez les options de catégorie et attribuez-les.
- Cliquez sur Sauvegarder.
Create or edit a category option group set
Vous pouvez regrouper les groupes d'options de catégorie dans des ensembles de groupes d'options de catégorie. L'objectif principal des groupes d'options de catégorie est d'ajouter plus de dimensionnalité à vos données saisies pour l'analyse, par exemple dans les applications Tableau croisé dynamique ou Visualiseur de données.
- Open the Metadata Management app and click Categories > Category option group sets.
- Click the + New button.
- Fill in the Name and Description fields — see Common metadata object fields.
- Select a Data dimension type.
- Select category option groups and assign them.
- Cliquez sur Sauvegarder.
Use category combinations for data sets
If you use a category combination for a data set, the category combination applies to the whole form. This requires the categories and the category combination to have the data dimension type "Attribute". Used as an attribute, a category combination serves as another dimension — similar to "Period" and "Organisation unit" — which you can use in your analysis. When a data set is linked to a category combination, those categories are displayed as drop-down boxes in the Data entry app, and each data value captured in the form is linked to the category options selected in those boxes.
Suppose that an NGO is providing ART services in a given facility. They would need to report each month on the "ART monthly summary", which would contain a number of data elements. The NGO and project could potentially change over time. In order to attribute data to a given NGO and project at any point in time, you need to record this information with each data value at the time of data entry.
-
Créez deux catégories avec pour type de dimension de données "Attribut" : "Partenaire d'implémentation" et "Projets".
-
Créez une combinaison de catégories avec pour type de dimension des données "Attribut": "Partenaires d'implémentation et projets".
-
Attribuez les catégories que vous avez créées à la combinaison de catégories.
-
Créez un ensemble de données appelé "TAR résumé mensuel" et sélectionnez Combinaison de catégorie "Partenaires d'implémentation et projets".
When you enter data in the Data entry app, you can select an "Implementing partner" and a "Project". Each recorded data value is assigned a specific combination of these categories as an attribute. These attributes (when specified as a dimension) can be used in the analysis applications similar to other dimensions, for example the period and organisation unit.

See the Manage data sets section for more on assigning a category combination to a data set.
Assign a code to a category option combination
The system creates the category option combinations automatically, so they do not need to be created. You can assign a code to category option combinations. This makes data exchange between DHIS2 and external systems easier.
- Open the Metadata Management app and click Categories > Category option combinations.
- Dans la liste des objets, cliquez sur le menu Options et sélectionnez Editer.
- In the Code field, type a code.
- Cliquez sur Sauvegarder.
Merge category options
Merging allows you to consolidate two duplicate category options into one, reassigning all references from the source object to the target object and then deleting the source.
Note
You must have the
F_CATEGORY_OPTION_MERGEauthority to access the merge page or see the merge button on the list view.

- Open the Metadata Management app and click Categories > Category options.
- Navigate to Category options > Merge Category options (or go directly to
#/categoryOptions/merge). - Search for and select the source category option (the one to be removed).
- Search for and select the target category option (the one to keep).
- Review the summary of changes.
- Click Confirm merge.

Warning
Merging is irreversible. The source category option will be permanently deleted and all references will be updated to point to the target.
For Show details, Sharing settings, Translate, Delete and Clone, see Common actions. All category objects support these except Category option combination, which only supports Edit and Show details — it's generated automatically by the system rather than created directly. Categories, category combinations, category option combinations and category options all support merging; see Merge.
Manage data elements
About data elements
Les éléments de données constituent la base du DHIS2. Les éléments de données définissent ce qui est réellement enregistré dans le système, par exemple le nombre de vaccinations effectués ou le nombre de cas de malaria.
Les éléments de données tels que le "nombre de cas de paludisme confirmés" sont souvent divisés en plus petites parties pour déterminer, par exemple, le nombre de cas de paludisme confirmés dans des groupes d'âge particuliers.
In the Metadata Management app, you manage the following data element objects:
| Type d'objet | Fonctions disponibles |
|---|---|
| Élément de données | Créer, modifier, cloner, partager, supprimer, afficher les détails et traduire |
| Groupe d'éléments de données | Créer, modifier, cloner, partager, supprimer, afficher les détails et traduire |
| Ensemble de groupes d'éléments de donnée | Créer, modifier, cloner, partager, supprimer, afficher les détails et traduire |
Workflow
- Créez toutes les options de catégorie.
- Create categories composed of the multiple category options you have created.
- Create category combinations composed of either one or multiple categories.
- Créez des éléments de données et attribuez-les à une combinaison de catégories.
Create or edit a data element

- Open the Metadata Management app and click Data elements > Data elements.
- Click the + New button to add a new data element, or click the options menu next to an existing one and select Edit.
- In the Name field, define the precise name of the data element. Each data element must have a unique name.
- In the Short name field, define a short name for the data element. Typically, the short name is an abbreviation of the full data element name. This attribute is often used in reports where space is limited.
- (Facultatif) Dans le champ Code, attribuez un code.
- (Optional) In the Color field, assign a color which will be used for this data element in data capture apps.
- (Optional) In the Icon field, assign an icon which will be used for this data element in data capture apps.
- Dans le champ Description, saisissez une description de l'élément de données. Soyez aussi précis que possible et donnez des informations complètes sur la façon dont l'élément de données est mesuré ainsi que sur son objectif.
- (Optional) In the Field mask field, type a template that provides hints for correct formatting of the data element.
Note
Field masks are currently implemented in the DHIS2 Android Capture app; not in the Capture web app.
The following special characters can be used in the mask:
| Character | Match |
|---|---|
| \d | digit |
| \x | lower case letter |
| \X | capital letter |
| \w | any alphanumeric character |
For example, the pattern \d\d\d-\d\d\d-\d\d\d would show a hyphen for every third digit.
- In the Form name field, type an alternative name of the data element. This name can be used in either section or automatic data entry forms.
- Dans le champ Type de domaine, sélectionnez si l'élément de données est un agrégat ou un élément de données de type tracker.
-
Dans le champ Type de valeur, sélectionnez le type de données que l'élément de données pourra enregistrer.
Tableau : Types de valeurs
Type de valeur Description Texte Valeur textuelle. Le nombre maximum de caractères autorisés par valeur est de 50 000. Long text Textual value. Renders as a text area with no length constraint in forms. Lettre Une seule lettre. Numéro de téléphone Numéro de téléphone. Email Email address. Yes/No Boolean values rendered as drop-down lists in data entry. Yes only Boolean values rendered as check boxes in data entry. Date Dates rendues sous forme de widget de calendrier dans la saisie de données. Date & time Combination of the Date and Time value types. Time Time rendered as hours and minutes in HH:MM format. Number Any real numeric value with a single decimal point. Intervalle unité Tout nombre réel supérieur ou égal à 0 et inférieur ou égal à 1. Pourcentage Nombres entiers inclusivement entre 0 et 100. Nombre entier Tout nombre entier (positif et négatif), y compris zéro. Entier positif Tout nombre entier supérieur à (mais sans inclure) zéro. Entier négatif Tout nombre entier inférieur à (mais sans inclure) zéro. Positive or zero integer Any whole number greater than or equal to zero. Username DHIS2 user. Renders as a dialog for searching for and selecting a user. Coordinate A point coordinate specified as longitude and latitude in decimal degrees. All coordinates should be specified in the format [-19.23, 56.42].Organisation unit Organisation units rendered as a hierarchy tree widget. If the user has assigned "search organisation units", these will be displayed instead of the assigned organisation units. Reference Stores a reference (UID) to another DHIS2 object, allowing a data value to link to a specific record elsewhere in the system. Age Dates rendered as calendar widget OR by entering number of years, months and/or days which calculates the date value based on current date. URL Enables manual entry of a URL. Fichier Une ressource de fichiers où vous pouvez stocker des fichiers externes, par exemple des documents et des photos. Image A file resource where you can store photos. Unlike File, the Image type can display the uploaded image directly in forms. GeoJSON Stores geographic geometry data in GeoJSON format, for example boundary polygons or catchment areas for organisation units. -
In the Aggregation type field, select the default aggregation operation that will be used for the data element.
Tableau : Opérateurs d'agrégation
Every aggregation type answers two separate questions: how the shorter periods inside the reporting period combine, and how child organisation units combine into their parent. Read the names as "what happens over time (what happens over organisation units)" — where the organisation unit half is not stated, it is Sum.
Aggregation operator Over periods Over the organisation unit hierarchy Sum Sum Sum Average Average Average Average (sum in org unit hierarchy) Average Sum Count Count of values Sum Min Minimum Minimum Max Maximum Maximum Min (sum in org unit hierarchy) Minimum Sum Max (sum in org unit hierarchy) Maximum Sum First value Earliest value in the period Sum First value (average in org unit hierarchy) Earliest value in the period Average Last value Most recent value in the period Sum Last value (average in org unit hierarchy) Most recent value in the period Average Last value in period Most recent value, counting only periods inside the requested period Sum Last value in period (average in org unit hierarchy) Most recent value, counting only periods inside the requested period Average Standard deviation Standard deviation (population-based) Standard deviation Variance Variance (population-based) Variance None No aggregation No aggregation Two further entries are not aggregation behaviours at all:
- Default — defer to the aggregation type implied by the data element's value type.
- Custom — the aggregation is supplied elsewhere rather than by one of the operators above.
Tip
The two-axis split is what makes Sum and Average (sum in org unit hierarchy) give different district totals from the same facility data, and it is why Last value at district level gives you the sum of each facility's latest value rather than any one facility's. If a total looks wrong, work out which axis you actually meant.
Note
Choose Last value for data that is a running total or a snapshot rather than a count of events — stock on hand, staff in post, population. Summing snapshots across periods double-counts them.
-
In the Store zero data values field, select if you want to save zero values, or if the system should ignore them.
By default, DHIS2 does not store zero values. If you have a data element where a zero value is meaningful, for example if you want to track the number of vaccine doses administered and zero is a valid entry, select this option.
-
(Optional) In the Category combination field, define which category combination the data element belongs to. This is the disaggregation applied to the data element.
-
(Optional) Assign the data element to one or more Data element groups.
-
Cliquez sur Sauvegarder.
Create or edit a data element group
Data element groups allow you to group related data elements for reporting and analysis purposes.
- Open the Metadata Management app and click Data elements > Data element groups.
- Click the + New button.
- Fill in the Name and (optionally) Short name and Code fields — see Common metadata object fields.
- Sélectionnez des éléments de données et attribuez-les.
- Cliquez sur Sauvegarder.
Create or edit a data element group set
Data element group sets allow you to classify multiple data element groups.
- Open the Metadata Management app and click Data elements > Data element group sets.
- Click the + New button.
- Fill in the Name and Description fields — see Common metadata object fields.
- If you want to use the data element group set in analytics, select Data dimension.
- Sélectionnez des groupe d'éléments de données et attribuez-les.
- Cliquez sur Sauvegarder.
For Show details, Sharing settings, Translate, Delete and Clone, see Common actions.
Manage data sets and data entry forms
About data sets and data entry forms
All data entry in DHIS2 is organised in data sets. A data set is a collection of data elements grouped together for data entry and data export between instances of DHIS2. To use a data set to collect data for a specific organisation unit, you must assign the organisation unit to the data set. Once you have assigned the data set to an organisation unit, that data set is available in the Data entry app. Only the organisation units you have assigned the data set to can use the data set for data entry.
A category combination can link to both data elements and data sets. If you use a category combination for a data set, the category combination is applicable for the whole form. This means that you can use categories to capture information which is common to an entire form, for example the name of a project or grant. When a data set is linked to a category combination, those categories are displayed as drop-down boxes in the Data entry app.
You create and edit data sets in the Metadata Management app. Here you define, for example, which data elements you want to include in the data set and the data collection frequency.
Vous saisissez les données dans l'application Saisie de données. L'application Saisie de données utilise des formulaires de saisie de données pour afficher les ensembles de données. Il existe trois types de formulaires de saisie de données :
Tableau : Types de formulaires de saisie de données
| Type de formulaire de saisie de données | Description |
|---|---|
| Formulaire par défaut | Once you have assigned a data set to an organisation unit, a default form is created automatically. A default form consists of a list of the data elements belonging to the data set together with a column for inputting the values. If your data set contains data elements with a non-default category combination, additional columns are automatically created in the default form. |
| Formulaire à sections | If the default form doesn't meet your needs, you can modify it to create a section form. Section forms give you more flexibility when using tabular forms. In a section form you can, for example, create multiple tables with subheadings and disable (grey out) cells in a table. |
| Formulaire personnalisé | If the form you want to design is too complex for default or section forms, you can create a custom form. A custom form takes more time to create than a section form, but you have full control over the design. You can, for example, mimic an existing paper aggregation form with a custom form. |
Note
If a data set has both a section form and a custom form, the system displays the custom form during data entry. Users who enter data cannot select which form they want to use. In web-based data entry the order of display preference is:
- Custom form (if it exists)
- Section form (if it exists)
- Default form
Mobile devices do not support custom forms. In mobile-based data entry the order of display preference is:
- Section form (if it exists)
- Default form
In the Metadata Management app, you manage the following data set objects:
| Type d'objet | Fonctions disponibles |
|---|---|
| Ensemble de données | Create, assign to organisation units, edit, share, delete, show details and translate; edit compulsory data elements; add data sets to, and remove them from, multiple organisation units at once |
| Formulaire à sections | Créer, modifier et gérer les champs grisés |
| Section | Modifier l'ordre d'affichage, supprimer et traduire |
| Formulaire personnalisé | Créer, modifier un script |
Workflow
You need to have data elements and categories before creating data sets and data entry forms.
- Créez un ensemble de données.
- Assign the data set to organisation units. A default form is created automatically.
- Créez un formulaire à sections ou un formulaire personnalisé.
Vous pouvez maintenant enregistrer des données dans l'application Saisie de données.
Create or edit a data set

- Open the Metadata Management app and click Data sets > Data sets.
- Click the + New button.
- Dans le champ Nom, saisissez le nom précis de l'ensemble de données.
- In the Short name field, type a short name for the data set. The short name must be unique.
- (Facultatif) Dans le champ Code, attribuez un code.
- Dans le champ Description, saisissez une description de l'ensemble de données.
- In the Expiry days field, enter the number of days after which you cannot edit the data set. If set to 0, users can always edit.
- In the Open future periods for data entry field, enter the number of future periods to make available for data entry.
- In the Days after period to qualify for timely submission field, enter the number of days after the end of a period by which a report is considered submitted on time.
- (Optional) In the Category combination field, select the category combination to use for the data set.
- In the Period type field, select the frequency of data entry for this data set.
- If applicable, in the Notification recipients field, select who should receive data set completion notifications.
- (Optional) Select Complete allowed only if validation passes to prevent completing the data entry form if there are active validation rule violations.
- (Optional) Select Complete allowed if compulsory fields are filled to prevent completing the data entry form until all data elements marked as compulsory (see Edit compulsory data elements in a data set) have a value.
- (Optional) Select Skip offline if you want the data set to only be available when the user is connected to the Internet.
- In the data elements section, search for and add the data elements to include in the data set.
- Assign the data set to one or more organisation units.
- Cliquez sur Sauvegarder.
Create or edit a data set notification
Data set notifications are sent to notify users when a data set is completed or is about to expire. You can configure notification templates that determine what is sent, when, and to whom.
Ce qu'il faut envoyer
In the Metadata Management app you can configure a message template and a subject for the notification. The template can include variables such as {organisationUnit.name} and {period} to personalise messages.
Quand faut-il l'envoyer ?
You can configure notifications to send: * On completion — when the data set is marked as complete. * Scheduled days — a set number of days relative to the reporting period end date.
À qui l'envoyer ?
Notifications can be sent to: * User groups * Organisation unit contacts
Override data elements' category combinations in a data set
You can override the category combination of a data element within a specific data set. This allows you to use a different disaggregation for the same data element in different data sets.
- Open the Metadata Management app and click Data sets > Data sets.
- Dans la liste des objets, cliquez sur le menu Options et sélectionnez Editer.
- In the Data elements section, click the override option next to the data element whose category combination you want to override.
- Select the replacement category combination.
- Cliquez sur Sauvegarder.
Edit compulsory data elements in a data set
You can mark specific data elements in a data set as compulsory. Users will be prompted before completing the data set if compulsory data elements have not been filled in.
- Open the Metadata Management app and click Data sets > Data sets.
- In the object list, click the options menu and select Edit compulsory data elements.
- Select the data elements you want to mark as compulsory.
- Cliquez sur Sauvegarder.
Manage section forms
Créer un formulaire à sections
- Open the Metadata Management app and click Data sets > Data sets.
- In the object list, open the relevant data set and navigate to Manage sections.
- Click + New to add a new section.
- Enter a Name for the section, and (optionally) a Code and a Description.
- Select the data elements to include in this section.
- Click Save section.
Note
Repeat for each section in the form. Each data element should belong to only one section.
Modifier un formulaire à sections
- Open the Metadata Management app and click Data sets > Data sets.
- In the object list, open the relevant data set and navigate to Manage sections.
- Click the section you want to edit.
- Modify the section as needed.
- Click Save section.
Gérer les champs gris dans un formulaire à sections
You can disable (grey out) specific cells in a section form to prevent data entry for particular combinations.
- Open the Metadata Management app and click Data sets > Data sets.
- In the object list, open the relevant data set and navigate to Manage sections.
- Click Manage grey fields for the section you want to modify.
- Click on the cells you want to grey out.
- Cliquez sur Sauvegarder.
Modifier l'ordre d'affichage des sections dans un formulaire à sections
- Open the Metadata Management app and click Data sets > Data sets.
- In the object list, open the relevant data set and navigate to Manage sections.
- Drag and drop the sections to reorder them.
Supprimer une section dans un formulaire à sections
- Open the Metadata Management app and click Data sets > Data sets.
- In the object list, open the relevant data set and navigate to Manage sections.
- Click the delete icon next to the section you want to remove.
Traduire une section dans un formulaire à sections
- Open the Metadata Management app and click Data sets > Data sets.
- In the object list, open the relevant data set and navigate to Manage sections.
- Click the translate icon next to the section.
- Select a locale and enter a translated name.
- Cliquez sur Sauvegarder.
Manage custom forms
Note
Custom forms use an HTML editor. While powerful, custom forms require more time to create and maintain than section forms.
Créer un formulaire personnalisé
- Open the Metadata Management app and click Data sets > Data sets.
- In the object list, open the relevant data set and navigate to Manage form.
- Select Custom as the form type.
- Use the HTML editor to design your custom form. Data elements can be inserted as input fields.
- Cliquez sur Sauvegarder.
Scripting dans les formulaires personnalisés
Custom forms support JavaScript for advanced interactions and validation. Scripts are embedded directly in the HTML of the custom form.
Événements
| Événement | Description |
|---|---|
dhis2.de.event.dataValueSaved | Fired after a data value has been saved successfully. |
dhis2.de.event.completed | Fired when a data set is completed. |
dhis2.de.event.unCompleted | Fired when a data set completion is reverted. |
dhis2.de.event.validationSuccess | Fired when validation completes without errors. |
dhis2.de.event.validationError | Fired when validation returns errors. |
Fonctions
| Fonction | Description |
|---|---|
dhis2.de.getDataValue( dataElementId, optionComboId ) | Retrieves the current value for a data element + option combo. |
dhis2.de.setDataValue( dataElementId, optionComboId, value ) | Sets the value for a data element + option combo. |
For Show details, Sharing settings, Translate and Delete, see Common actions — note the extra risk called out there for deleting a data set specifically. Data sets do not support Clone.
Manage indicators
About indicators
An indicator is a formula that can consist of multiple data elements, constants, organisation unit group counts and mathematical operators. Indicators typically consist of a numerator and denominator. You use indicators to calculate coverage rates, incidence and other values that are a result of data element values that have been entered into the system. Calculated totals do not have a denominator.
Note
You never enter indicator values directly in DHIS2 — they are always calculated.
An indicator formula can consist of mathematical operators (for example plus and minus), functions, and the following elements:
Tableau : Éléments de l'indicateur
| Élément de l'indicateur | Type | Description |
|---|---|---|
| Constant | Composante | Constants are numerical values that remain the same for all indicator calculations. This is useful in order to have a single place to change values that might change over time. Constants are applied AFTER data element values have been aggregated. |
| Éléments de données | Composante | Les éléments de données sont remplacés par la valeur de données saisie pour l'élément de données. |
| Jours | Opérateur | "Days" is a special operator that always provides the number of days for a given indicator calculation. For example, if you want to calculate the "Percentage of time vaccine refrigerator was non-functional", you could define the numerator as: (Days – "Number of days vaccine refrigerator was available") / Days. |
| Nombre d'unités d’organisation | Composante | You can use organisation unit groups in formulas. They will be replaced by the number of organisation units in the group. During aggregation, the organisation units in the group will be intersected with the part of the organisation unit hierarchy being requested. |
| Reporting rates | Composante | You can use a data set's reporting rate, actual reports or expected reports as a component in a formula, for example to calculate an indicator that is itself weighted by how completely a data set was reported. |
| Indicateurs | Composante | An indicator formula can reference another indicator, so you can build a composite indicator on top of ones you have already defined instead of repeating their formulas. This is the only expression type in DHIS2 that can reference indicators — predictors and validation rules cannot. |
| Programmes | Composante | Click Programs and select a program to view all data elements, attributes and indicators related to a specific program. |
Vous pouvez utiliser les fonctions suivantes dans une formule d'indicateur :
Tableau : Fonctions des indicateurs
| Indicator function | Arguments | Description |
|---|---|---|
| contains | (expr, sub1, ...) | Searches an expression for one or more substrings. Returns true if the expression contains all the substrings. For example, the following are all true: contains("abcd", "abcd"), contains("abcd", "b") and contains("abcd", "ab", "bc"). Comparisons are case-sensitive. |
| containsItems | (expr, item1, ...) | Searches an expression for one or more items. The expression is made up of comma-separated elements. containsItems returns true if every item exactly matches an element in the expression. For example, containsItems("abcd", "abcd") and containsItems("ab,cd", "ab", "cd") are true, but containsItems("abcd", "b") and containsItems("abcd", "ab", "bc") are false. Comparisons are case-sensitive. Use it with multi-valued data elements to check whether an item is one of the recorded values. |
| if | (boolean-expr, true-expr, false-expr) | Evaluates the boolean expression. If it is true, returns the true expression value; if false, returns the false expression value. The arguments must follow the rules for any indicator expression. |
| is | (expr1 in expression [, expression ...]) | Returns true if expr1 is equal to any of the expressions that follow, otherwise false. |
| isNull | (élément) | Renvoie vrai si la valeur de l'élément est manquante (nulle), sinon faux. |
| isNotNull | (élément) | Renvoie vrai si la valeur de l'élément n'est pas manquante (non nulle), sinon faux. |
| firstNonNull | (element [, element ...]) | Returns the value of the first element that is not missing (not null). Can be given any number of arguments. An argument may also be a numeric or string literal, which is returned if all the preceding items have missing values. |
| greatest | (expression [, expression ...]) | Returns the greatest (highest) value of the expressions given. Can be given any number of arguments. |
| least | (expression [, expression ...]) | Returns the least (lowest) value of the expressions given. Can be given any number of arguments. |
| log | (expression [, base]) | Renvoie le logarithme naturel (base e) de l'expression numérique. Si un entier est donné comme second argument, renvoie le logarithme en utilisant cette base. |
| log10 | (expression) | Renvoie le logarithme commun (base 10) de l'expression numérique. |
| null | Returns no result. For example, if( #{FH8ab5Rog83} < 0, null, 1 ) returns nothing if the data element value is less than 0, otherwise 1. | |
| supprimerlLesZéros | (expression) | Ne renvoie rien si la valeur de l'expression est 0, au cas contraire, renvoie la valeur de l'expression. |
| sousExpression | (expression) | Evaluates part of an expression before aggregating. See Indicator SubExpressions. |
[periodInYear] | The number of this period within the year (1, 2, 3, ...). See Indicator Year-to-date. | |
[yearlyPeriodCount] | The count of periods of this type within the year. See Indicator Year-to-date. | |
| .Typed'agrégation | (type d'agrégation) | Remplace le type d'agrégation d'éléments de données par défaut pour les données agrégées (pas pour des données de programme). |
| .Datemax | (aaaa-mm-jj) | Pour un élément de données (pas pour des données de programme), il s'agit d'une valeur pour des périodes se terminant à une date maximum ou avant. |
| .Datemin | (aaaa-mm-jj) | Pour un élément de données (pas pour des données de programme), il s'agit d'une valeur pour des périodes commençant à une date minimum ou avant. |
| .periodOffset (décalageDePériode) | (constante en entier) | Placed after a data value or expression, returns the value from a period offset relative to the reported period. It can be nested. Note that this shifts data only for aggregate data, not tracker or event data. See the examples below. |
| .yearToDate() | Sums the values of all periods from the start of the year through the current period. A weekly period counts as part of a year if it has four or more days in that year. See Indicator Year-to-date. |
Alongside these functions you can use:
- the mathematical operators
+,-,*,/,%(modulus) and^(power), with parentheses to group parts of an expression - the comparison operators
==,!=,>,<,>=and<= - the logical operators
&&(or the keywordand),||(oror) and!(ornot)
Note
DHIS2 parses indicator, predictor, validation rule and program indicator expressions with one shared grammar, but each expression type only accepts its own subset of functions. A function that belongs to another type is recognised by the parser and then rejected when the expression is validated, which is why an expression can look plausible and still fail to save. In particular:
- Aggregation functions —
avg(),sum(),count(),min(),max(),median(),stddev(),stddevPop(),stddevSamp()andpercentileCont()— and the distribution functionsnormDistCum()andnormDistDen()belong to predictor generator expressions. See Create or edit a predictor. To evaluate part of an indicator expression before it is aggregated, usesubExpressioninstead, and to override how an item aggregates use.aggregationType().- The
orgUnit.ancestor(),orgUnit.dataSet(),orgUnit.group()andorgUnit.program()functions belong to validation rule and predictor expressions.- The
d2:functions andV{...}variables belong to program indicator expressions and program rules. See Reference information: Functions, variables and operators to use in program indicator expressions and filters.subExpression(),.aggregationType(),.periodOffset(),.yearToDate(),[periodInYear],[yearlyPeriodCount]and indicator references are accepted only in indicator expressions.
The aggregation types you can pass to .aggregationType() are:
| Type d'agrégation | Description |
|---|---|
| SUM | Sum of values in both the period and organisation unit dimensions |
| AVERAGE | Average value in both the period and organisation unit dimensions |
| AVERAGE_SUM_ORG_UNIT | Average value in the period dimension, sum in the organisation unit hierarchy |
| COUNT | Nombre de valeurs |
| STDDEV | Écart type (basé sur la population) des valeurs |
| VARIANCE | Variation (basée sur la population) des valeurs |
| MIN | Valeur minimale |
| MAX | Valeur maximale |
| MIN_SUM_ORG_UNIT | Minimum value in the period dimension, sum in the organisation unit hierarchy |
| MAX_SUM_ORG_UNIT | Maximum value in the period dimension, sum in the organisation unit hierarchy |
| PREMIÈRE | First value, sum in the organisation unit hierarchy |
| FIRST_AVERAGE_ORG_UNIT | First value, average in the organisation unit hierarchy |
| FIRST_FIRST_ORG_UNIT | First value in both the period and organisation unit dimensions |
| DERNIÈRE | Last value, sum in the organisation unit hierarchy |
| LAST_AVERAGE_ORG_UNIT | Last value, average in the organisation unit hierarchy |
| LAST_LAST_ORG_UNIT | Last value in both the period and organisation unit dimensions |
| LAST_IN_PERIOD | Last value in the period, sum in the organisation unit hierarchy |
| LAST_IN_PERIOD_AVERAGE_ORG_UNIT | Last value in the period, average in the organisation unit hierarchy |
| NONE | Aucune agrégation n'est effectuée dans aucune dimension |
Examples of .aggregationType, .maxDate, .minDate and .periodOffset:
| Expression d'indicateur | Signification |
|---|---|
#{FH8ab5Rog83}.aggregationType(COUNT) | Nombre de valeurs |
#{FH8ab5Rog83}.aggregationType(LAST) - #{FH8ab5Rog83}.aggregationType(FIRST) | The difference between the first and last values |
#{FH8ab5Rog83}.maxDate(2021-6-30) | Values until 30-Jun-2021 |
#{FH8ab5Rog83}.minDate(2021-1-1) | Values from 1-Jan-2021 onwards |
#{FH8ab5Rog83}.minDate(2021-1-1).maxDate(2021-6-30) | Values between 1-Jan-2021 and 30-Jun-2021 |
#{FH8ab5Rog83}.periodOffset(-1) | Value from the period before |
#{FH8ab5Rog83}.periodOffset(1) | Value from the period after |
#{FH8ab5Rog83} - 2 * D{IpHINAT79UW.uf3svrmp8Oj}.periodOffset(-1) | Data element FH8ab5Rog83 from the reported period, minus twice program data element IpHINAT79UW.uf3svrmp8Oj from the period before |
( #{FH8ab5Rog83} - #{QOlfIKgNJ3D2} ).periodOffset(-2) | Data element FH8ab5Rog83 from two periods before, minus data element QOlfIKgNJ3D2 from two periods before |
( #{FH8ab5Rog83}.periodOffset(-1) + #{FH8ab5Rog83} ).periodOffset(-1) | Data element FH8ab5Rog83 from two periods before plus its value from one period before — note that the functions are nested |
N{IndicatorID}.periodOffset(-1) | Indicator value from the period before (applies to the aggregate data in the indicator) |
Indicator SubExpressions
Normally an indicator aggregates a data element's values first and then evaluates the expression. For example, in the expression:
if( #{nYahlae7fe6} > 10, 1, 0 )
if the data element has aggregation type SUM, DHIS2 sums all of that data element's values for the relevant period and then tests whether the sum is greater than 10.
Sometimes you need the opposite: evaluate each value before it is aggregated. For example, to show how many facilities in a district recorded a value greater than 10, wrap the test in subExpression:
subExpression( if( #{nYahlae7fe6} > 10, 1, 0 ) )
Each individual data value is tested, returning 1 or 0, and (assuming the data element aggregates with SUM) the 1s and 0s are then summed — giving a count of how many values exceeded 10.
Notes on SubExpressions:
-
The 1s and 0s are only summed if the data element's aggregation type is SUM. If it has a different aggregation type and you want them summed, override the aggregation type inside the sub-expression:
subExpression( if( #{nYahlae7fe6} > 10, 1, 0 ) ).aggregationType(SUM) -
A sub-expression may reference only one data element, but it may reference it more than once. For example:
subExpression( if( #{nYahlae7fe6} > 10 && #{nYahlae7fe6} <= 20, 1, 0 ) ) -
A sub-expression may reference a data element with a category option combination and/or an attribute option combination, but it must be exactly the same reference each time. For example:
subExpression( if( #{nYahlae7fe6.beec4Dewah8} > 10 && #{nYahlae7fe6.beec4Dewah8} <= 20, 1, 0 ) ) -
To evaluate an expression before aggregation that involves program data, or more than one data element, category option combination or attribute option combination, use a predictor instead and store the result as a separate data element. You can then reference that predicted data element in an indicator or directly in analytics.
Indicator Year-to-date
Indicators can compute year-to-date values using three expression elements: .yearToDate(), [periodInYear] and [yearlyPeriodCount].
| Élément | Returns |
|---|---|
.yearToDate() | The sum of the values of every period from the start of the year through the current period |
[periodInYear] | The number of the current period within the year — 1, 2, 3, and so on. For monthly data in May this is 5; for quarterly data in Q3 it is 3 |
[yearlyPeriodCount] | The total count of periods of this type in the year — 12 for monthly, 4 for quarterly, 52 or 53 for weekly. This does not change as the year progresses |
In the examples below, #{a} can be #{dataElementUID} or any valid indicator expression item that returns a data value, such as #{dataElementUID.catOptionComboUid}, I{programIndicatorUID} or N{indicatorUID}.
| Expression d'indicateur | Signification |
|---|---|
#{a} | Current period value |
#{a}.yearToDate() | Sum of values year to date. If the period is March, this gives Jan + Feb + Mar |
#{a}.yearToDate() / [periodInYear] | Average year-to-date value. If the period is March, this gives (Jan + Feb + Mar) / 3 |
#{a} - #{a}.yearToDate() / [periodInYear] | The difference between the current period and the year-to-date average |
#{b} * [periodInYear] / [yearlyPeriodCount] | If #{b} is an annual target — say the number of people who should be vaccinated this year — this gives the number who should have been vaccinated by the current period. In February, for monthly data, that is #{b} * 2 / 12 |
Note
A weekly period is treated as part of a year if four or more of its days fall in that year.
Remarques sur les données manquantes
If data is missing for some of the periods in a year-to-date calculation, the result is based only on the periods that have data. Bear this in mind when interpreting year-to-date figures — a low value may mean under-performance or may simply mean a period has not been reported yet.
Workflow
- Create indicator types (unless using the default types).
- Créer des indicateurs.
- (Optional) Create indicator groups.
- (Optional) Create indicator group sets.
Create or edit an indicator type
Indicator types define the factor by which indicator values are multiplied when shown in reports or exported to analytics. A "Per cent" indicator type, for example, multiplies values by 100.
- Open the Metadata Management app and click Indicators and Predictors > Indicator types.
- Click the + New button.
- In the Name field, type the name of the indicator type, for example "Per cent".
- In the Factor field, type the factor. For a percentage indicator, type 100.
- If the indicator type does not have a denominator (for example a count), select Number (without denominator).
- Cliquez sur Sauvegarder.
Create or edit an indicator

- Open the Metadata Management app and click Indicators and Predictors > Indicators.
- Click the + New button, or click the options menu next to an existing indicator and select Edit.
- Dans le champ Nom, saisissez le nom complet de l'indicateur, par exemple "Incidence des cas confirmés de paludisme pour 1000 habitants".
-
In the Short name field, type an abbreviated name, for example "Inc conf. malaria per 1000 pop". The short name must be unique and 50 characters or less.
-
(Facultatif) Dans le champ Code, attribuez un code.
- (Optional) In the Color field, assign a color to represent the indicator.
- (Facultatif) Dans le champ Icône, attribuez une icône pour illustrer la signification de l'indicateur.
- Dans le champ Description, saisissez une brève description informative de l'indicateur et de son mode de calcul.
- If you want to apply an annualization factor during calculation, select Annualized. This scales the numerator up to a yearly equivalent so it can be compared against a denominator that is already annual, such as a population figure. Typically the numerator is multiplied by 365 divided by the number of days in the reporting period.
- Sélectionnez le nombre de Décimales dans la sortie des données.
- Select an Indicator type. This field determines a factor that is automatically applied during calculation.
- (Facultatif) Attribuez une ou plusieurs Légendes.
- (Optional) In the URL field, enter a link — for example to an indicator registry — where a full metadata description of the indicator is available.
- (Optional) Enter a Category option combination for aggregate data export and an Attribute option combination for aggregate data export. These settings are used when mapping aggregated data exported to another server.
- (Optional) Enter values for any custom attributes.
- Click Edit numerator:
- Saisissez une description claire du numérateur.
- Define the numerator by double-clicking components in the right-hand field. Add mathematical operators by double-clicking the icons below the formula field.
- Click Done.
- Click Edit denominator:
- Saisissez une description claire du dénominateur.
- Define the denominator using the formula editor as above.
- Click Done.
- (Optional) Assign the indicator to any compulsory indicator group sets.
- Cliquez sur Sauvegarder.
Create or edit an indicator group
- Open the Metadata Management app and click Indicators and Predictors > Indicator groups.
- Click the + New button.
- Tapez un Nom.
- Sélectionnez des indicateurs et attribuez-les.
- Cliquez sur Sauvegarder.
Create or edit an indicator group set
- Open the Metadata Management app and click Indicators and Predictors > Indicator group sets.
- Click the + New button.
- Fill in the Name, Short name and Description fields — see Common metadata object fields.
- If you want to use the indicator group set as a dimension in analytics, select Data dimension.
- Select Compulsory if every indicator should be required to belong to a group in this group set.
- Sélectionnez des indicateurs et attribuez-les.
- Cliquez sur Sauvegarder.
Merge indicators

Merging consolidates two duplicate indicators into one, reassigning all references from the source to the target and then deleting the source.
Note
You must have the
F_INDICATOR_MERGEauthority to access this page.
- Open the Metadata Management app and navigate to Indicators > Merge Indicators (or go directly to
#/indicators/merge). - Search for and select the source indicator (the one to be removed).
- Search for and select the target indicator (the one to keep).
- Review the summary of changes.
- Click Confirm merge.
Warning
Merging is irreversible. The source indicator will be permanently deleted.
Merge indicator types

Note
You must have the
F_INDICATOR_TYPE_MERGEauthority to access this page.
- Open the Metadata Management app and navigate to Indicator types > Merge Indicator types (or go directly to
#/indicatorTypes/merge). - Search for and select the source indicator type (the one to be removed).
- Search for and select the target indicator type (the one to keep).
- Review the summary of changes.
- Click Confirm merge.
For Show details, Sharing settings, Translate, Delete and Clone, see Common actions. Indicators and indicator types both support merging; see Merge.
Manage organisation units
Dans cette partie, nous verrons comment :
- Créer une nouvelle unité d'organisation et mettre en place la hiérarchie de l'unité d'organisation
- Créer des groupes d'unités d'organisation, des ensembles de groupes et leur attribuer des unités d'organisation
- Modifier la hiérarchie des unités d'organisation
About organisation units
The organisation unit hierarchy defines the organisation structure of DHIS2, for example how health facilities, administrative areas and other geographical areas are arranged with respect to each other. It is the where dimension of DHIS2, similar to how periods represent the when dimension.
The organisation unit hierarchy is built up by parent-child relations. In DHIS2, each of these nodes is an organisation unit. A country might for example have eight provinces, and each province might have a number of districts as children. Normally, the lowest levels consist of facilities where data is collected. Data collecting facilities can also be located at higher levels, for example national or provincial hospitals. You can therefore create skewed organisation trees in DHIS2.
- You can only have one organisation hierarchy at a time.
- You can have any number of levels in a hierarchy. Typically national organisation hierarchies in public health have four to six levels.
- You can create additional classifications by using organisation unit groups and organisation unit group sets, for example to create parallel administrative boundaries to the health care sector.
- Il est recommandé d'utiliser des groupes d'unités d'organisation pour créer une hiérarchie non géographique.
- Une unité d'organisation ne peut être membre que d'un seul groupe d'unités d'organisation au sein d'un ensemble de groupes d'unités d'organisation.
- Un groupe d'unités d'organisation peut appartenir à plusieurs ensembles de groupes d'unités d'organisation.
- La hiérarchie des unités d'organisation est le principal vecteur d'agrégation des données relatives à la dimension géographique.
- When you close an organisation unit, you cannot register or edit events to this organisation unit in the Capture app.
Important
You can change the organisation unit hierarchy after you have created it, even if organisation units are collecting data. However, DHIS2 always uses the latest hierarchy for data aggregation. So if you change the hierarchy, you lose the temporal representation of the hierarchy over time.
For example: District A is sub-divided into District B and District C. Facilities that belonged to District A are reassigned to District B and C. Any historical data entered before the split is still registered as belonging to District B and C, not to the obsolete District A.
In the Metadata Management app, you manage the following organisation unit objects:
| Type d'objet | Fonctions disponibles |
|---|---|
| Unité d’organisation | Créer, modifier, cloner, supprimer, afficher les détails et traduire |
| Groupe d'unités d'organisation | Créer, modifier, cloner, partager, supprimer, afficher les détails et traduire |
| Ensemble de groupes d'unités d'organisation | Créer, modifier, cloner, partager, supprimer, afficher les détails et traduire |
| Niveau de l'unité d'organisation | Assign names |
Workflow
- Create organisation units (representing the hierarchy nodes, top to bottom).
- Créer des groupes d'unités d'organisation.
- Créer des ensembles de groupes d'unités d'organisation.
- Assign organisation units to groups.
- Assign organisation unit groups to group sets.
Create or edit an organisation unit

-
Open the Metadata Management app and click Organisation units > Organisation units. On the left side of the screen, a tree displays the existing organisation unit hierarchy. Click on an organisation unit in the tree to select it; it will be highlighted. When you add a new organisation unit, it is created as a child of the currently selected organisation unit.
-
Click the + New button.
- Fill in Name, Short name, Code, Description, Comment and contact details (Contact person, Address, Phone number, Email) — see Common metadata object fields. Only Name is required.
- Set an Opening date — the date from which the organisation unit is active. Organisation units with a future opening date will not appear in analytics or data entry unless explicitly requested.
- (Optional) Set a Closed date — the date from which the organisation unit is no longer active. See Close an organisation unit.
- (Optional) Add Geometry — point or polygon coordinates for the organisation unit.
- Cliquez sur Sauvegarder.
Create or edit an organisation unit group
Organisation unit groups allow you to classify organisation units for analysis and reporting.
- Open the Metadata Management app and click Organisation units > Organisation unit groups.
- Click the + New button.
- Fill in the Name, Short name and (optionally) Code and Description fields — see Common metadata object fields.
- (Optional) Assign a Symbol for use on maps.
- (Optional) Select a Color, used to display the group on maps and in group set reporting.
- Sélectionnez des unités d'organisation et attribuez-les.
- Cliquez sur Sauvegarder.
Create or edit an organisation unit group set
Organisation unit group sets allow you to classify multiple organisation unit groups into a single dimension, for example "Type of facility" (comprising groups such as "Hospital", "Health centre" and "Community health post").
- Open the Metadata Management app and click Organisation units > Organisation unit group sets.
- Click the + New button.
- Fill in the Name and Description fields — see Common metadata object fields.
- Select Compulsory if you want every organisation unit to be required to be a member of a group in this group set.
- Select Data dimension to make this group set available as a dimension in analytics.
- Sélectionnez des groupes d'unités d'organisation et attribuez-les.
- Cliquez sur Sauvegarder.
Assign names to organisation unit levels
When you have created your organisation unit hierarchy, you can assign names to each level. For example, in a national hierarchy, Level 1 might be named "National", Level 2 "Province", Level 3 "District" and Level 4 "Facility".
- Open the Metadata Management app and click Organisation units > Organisation unit levels.
- For each level in the list, type a name.
- Cliquez sur Sauvegarder.
Move organisation units within a hierarchy
You can move organisation units within the hierarchy by changing the parent of a selected organisation unit. This is done on a dedicated page rather than in the main organisation unit list.
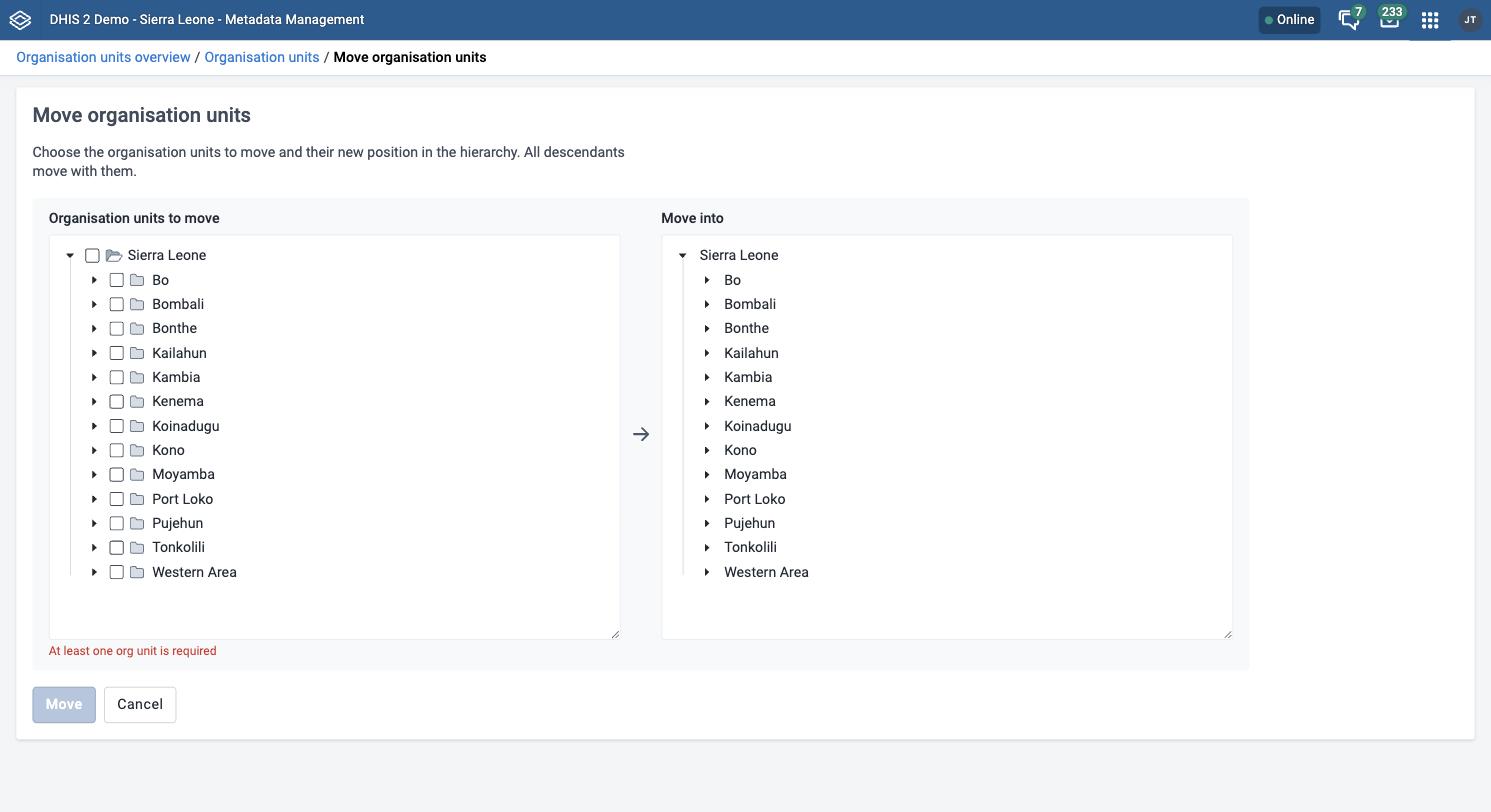
- Open the Metadata Management app and click Organisation units > Hierarchy operations in the left-hand sidebar.
- In the left-hand Organisation units to move tree, select the organisation unit or units you want to move. Hold Shift or Ctrl to select more than one.
Note
If a selected organisation unit has children, all of them move with it to the new parent.
- In the right-hand Move into tree, select the organisation unit you want to move the selection to.
- Click Move x organisation units, where x is the number of organisation units you selected.
Your changes are reflected in the hierarchy tree immediately.
Close an organisation unit
When you close an organisation unit, you cannot register or edit events for this organisation unit in the Capture app.
- Open the Metadata Management app and click Organisation units > Organisation units.
- Dans la liste des objets, cliquez sur le menu Options et sélectionnez Editer.
- Enter a Closed date.
- Cliquez sur Sauvegarder.
For Show details, Sharing settings, Translate, Delete and Clone, see Common actions. Organisation unit levels are the exception — they only support assigning names and translating (via the Translate icon directly, since they have no options menu); they don't support Show details, Sharing settings, Delete or Clone.
Manage validation rules
About validation rules
Une règle de validation se base sur une expression. L'expression définit une relation entre les valeurs des éléments de données. Elle constitue une condition avec des critères logiques.
L'expression est composé de :
-
Une partie gauche
-
Une partie droite
-
Un opérateur
Une règle de validation qui affirme que le nombre total de vaccins administrés aux nourrissons est inférieur ou égal au nombre total de nourrissons.
Les parties gauche et droite doivent renvoyer des valeurs numériques.
In the Metadata Management app, you manage the following validation rule objects:
| Type d'objet | Fonctions disponibles |
|---|---|
| Règle de validation | Créer, modifier, cloner, supprimer, afficher les détails et traduire |
| Groupe de règles de validation | Créer, modifier, cloner, partager, supprimer, afficher les détails et traduire |
| Notifications de validation | Créer, modifier, cloner, supprimer, afficher les détails et traduire |
About sliding windows
You can use sliding windows to group data across multiple periods as opposed to selecting data for a single period. Sliding windows have a size, that is to say, the number of days to cover, a starting point and an end point. The example below shows disease surveillance data:
-
Dans la section orange, les données sont sélectionnées en fonction de la période actuelle. Un seuil est calculé une fois par semaine ou par période, et est affiché dans la section "Résultat".
-
La section bleue constitue la fenêtre coulissante. Elle sélectionne les données des 7 derniers jours. La section "Résultat" affiche le nombre total de cas confirmés d’une maladie.
-
Grâce à la règle de validation, les utilisateurs sont notifiés lorsque le nombre total de cas dépasse le seuil pour la période.

Tableau : Différents comportements des règles de validation
| Avec fenêtres coulissantes | Sans fenêtres coulissantes |
|---|---|
| Utilisés uniquement pour les données d'événements. | Utilisés pour les données d'événements et les données agrégées. |
| La sélection des données se fait en fonction d'un nombre de jours fixe (Type de période). | La sélection des données se base toujours sur une période. |
| La position de la fenêtre coulissante est toujours relative à la période comparée. | Les données sont toujours sélectionnées pour la même période que la période comparée. |
See also: How to use sliding windows when you're Creating or editing a validation rule.
À propos des groupes de règles de validation
A validation rule group allows you to group related validation rules. When you run a validation rule analysis, you can choose to run all of the validation rules in your system, or just the validation rules in one group.
About validation notifications
Vous pouvez configurer une analyse des règles de validation pour envoyer automatiquement des notifications sur des erreurs de validation à des groupes d'utilisateurs sélectionnés. Ces messages sont appelés notifications de validation. Ils sont envoyés via le système de messagerie interne de DHIS2.
Vous pouvez envoyer des notifications de règles de validation sous forme de messages individuels ou de résumés de messages. Ceci est d'une grande utilité, par exemple, lorsque vous voulez envoyer des messages individuels sur les épidémies de maladies hautement prioritaires, et des résumés sur les erreurs de validation de données de routine non prioritaires.
À propos des fonctions des règles de validation
Vous pouvez utiliser les fonctions suivantes dans la partie gauche ou droite d'une règle de validation :
Tableau : Fonctions des règles de validation
| Fonction de la règle de validation | Arguments | Description |
|---|---|---|
| contains | (expr, sub1, ...) | Recherche une expression pour une ou plusieurs sous-chaînes. Elle renvoie "true" si l'expression contient toutes les sous-chaînes. Par exemple, les expressions suivantes sont toutes "true" : contains("abcd", "abcd") ; contains("abcd", "b") ; et contains("abcd", "ab", "bc"). Les comparaisons sont sensibles à la casse. |
| containsItems | (expr, item1, ...) | Recherche un ou plusieurs éléments dans une expression. L'expression est composée d'éléments séparés par des virgules. containsItems renvoie "true" si chaque élément correspond exactement à un élément de l'expression. Par exemple, containsItems("abcd", "abcd") et containsItems("ab,cd", "ab", "cd") sont "true", mais containsItems("abcd", "b") et containsItems("abcd", "ab", "bc") sont "false". Les comparaisons sont sensibles à la casse. containsItems peut être utilisé pour des éléments de données à valeurs multiples afin de vérifier si un item est contenu dans les valeurs de l'élément de données. |
| if | (boolean-expr, true-expr, false-expr) | Évalue l'expression booléenne et, si elle est vraie, renvoie la valeur vraie de l'expression, si elle est fausse, renvoie la valeur fausse de l'expression. Les arguments doivent respecter les règles pour toute expression d'indicateur. |
| is | (expr1 in expression [, expression ...]) | Renvoie vrai si expr1 correspond à l’une des expressions suivantes. Dans le cas contraire, elle renvoie faux. |
| isNull | (élément) | Renvoie vrai si la valeur de l'élément est manquante (nulle), sinon faux. |
| isNotNull | (élément) | Renvoie vrai si la valeur de l'élément n'est pas manquante (non nulle), sinon faux. |
| firstNonNull | (element [, element ...]) | Renvoie la valeur du premier élément non manquant (non nul). Le nombre d'arguments n'a pas de limite. Tout argument peut également être un texte numérique ou de chaîne, qui sera renvoyé si tous les objets précédents ont des valeurs manquantes. |
| greatest | (expression [, expression ...]) | Renvoie la plus grande valeur (la plus élevée) des expressions données. Le nombre d'arguments n'a pas de limite. |
| least | (expression [, expression ...]) | Renvoie la plus petite des valeurs des expressions données. Le nombre d'arguments n'a pas de limite. |
| log | (expression [, base ]) | Renvoie le logarithme naturel (base e) de l'expression numérique. Si un entier est donné comme second argument, renvoie le logarithme en utilisant cette base. |
| log10 | (expression) | Renvoie le logarithme commun (base 10) de l'expression numérique. |
| null | Ne renvoie aucun résultat. Par exemple, si( #{FH8ab5Rog83}<0, null, 1 ) ne renvoie rien si la valeur de l'élément de données est inférieure à 0, dans le cas contraire renvoie 1. | |
| orgUnit.ancestor | (orgUnitUid [, orgUnitUid ...]) | Renvoie "vrai" si l'unité d'organisation est un descendant de l'une des (1 ou plusieurs) unités d'organisation, sinon renvoie "faux". |
| orgUnit.dataSet | (dataSetUid [, dataSetUid ...]) | Renvoie "vrai" si l'unité d'organisation est attribuée à l'un des (1 ou plusieurs) ensembles de données, sinon renvoie "faux". |
| orgUnit.group | (ouGroupUid [, ouGroupUid ...]) | Renvoie "vrai" si l'unité d'organisation fait partie de l'un des (1 ou plusieurs) groupes d'unités d'organisation, sinon renvoie "faux". |
| orgUnit.program | (programUid [, programUid ...]) | Renvoie "vrai" si l'unité d'organisation est attribuée à l'un des (1 ou plusieurs) programmes, sinon renvoie "faux". |
| supprimerlLesZéros | (expression) | Ne renvoie rien si la valeur de l'expression est 0, au cas contraire, renvoie la valeur de l'expression. |
Create or edit a validation rule

-
Open the Metadata Management app and click Validations > Validation rules in the left-hand sidebar.
-
Click the + New button.
-
Tapez un Nom.
Le nom doit être unique parmi les règles de validation.
-
(Facultatif) Dans le champ Code, attribuez un code.
-
(Facultatif) Saisissez une Description.
-
(Optional) Type an Instruction. This is what users will see, both in validation analysis and when reviewing rule violations during data entry, so it's recommended to always provide an instruction that makes it clear what action a user should take when the rule is triggered.
-
Sélectionnez une Importance : Haute, Moyenne ou Faible.
-
Sélectionnez un Type de période.
-
Sélectionnez un Opérateur : Paire obligatoire, Égal à, Paire exclusive, Supérieur à, Supérieur ou égal à ou Pas égal à.
L'opérateur Paire obligatoire permet d'exiger que les valeurs des données soient saisies pour un formulaire pour les côtés gauche et droit de l'expression, ou pour aucun des deux côtés. Cela signifie que vous pouvez exiger que si un champ d'un formulaire est renseigné, alors un ou plusieurs autres champs doivent également être renseignés.
La Paire exclusive permet d'affirmer que si une valeur existe sur le côté gauche, alors il ne devrait y avoir aucune valeur sur le côté droit (ou vice versa). Cela signifie que les éléments de données qui composent la règle de chaque côté doivent s'exclure mutuellement, pour une combinaison période/unité d'organisation/option d'attribut donnée.
-
Créer le côté gauche de l'expression :
-
Cliquez sur Côté gauche.
-
Sélectionnez Fenêtre coulissante si vous voulez afficher les données relatives à la période que vous comparez. Voir aussi À propos des règles de rules.
-
Sélectionnez une Stratégie de valeur manquante. Cette sélection définit la façon dont le système évalue une règle de validation si des données sont manquantes.
Option Description Skip if any value is missing The validation rule will be skipped if any of the values which compose the expression are missing. This is the default option.
Always select this option when you use the Exclusive pair or Compulsory pair operator.Skip if all values are missing The validation rule will be skipped only if all of the operands which compose it are missing. Never skip The validation rule will never be skipped in case of missing data, and all missing operands will be treated effectively as a zero. -
Tapez une Description.
-
Build an expression based on the available data elements, program objects, organisation units, counts and constants.
In the right pane, double-click the data objects you want to include in the expression. Combine with the mathematical operators located below the left pane.
-
Cliquez sur Sauvegarder.
-
-
Créer le côté droit de l'expression :
-
Cliquez sur Côté droit.
-
Sélectionnez une Stratégie de valeur manquante. Cette sélection définit la façon dont le système évalue une règle de validation si des données sont manquantes.
Option Description Skip if any value is missing The validation rule will be skipped if any of the values which compose the expression are missing. This is the default option.
Always select this option when you use the Exclusive pair or Compulsory pair operator.Skip if all values are missing The validation rule will be skipped only if all of the operands which compose it are missing. Never skip The validation rule will never be skipped in case of missing data, and all missing operands will be treated effectively as a zero. -
Sélectionnez Fenêtre coulissante si vous voulez afficher les données relatives à la période que vous comparez. Voir aussi À propos des règles de rules.
-
Tapez une Description.
-
Build an expression based on the available data elements, program objects, organisation units, counts and constants.
In the right pane, double-click the data objects you want to include in the expression. Combine with the mathematical operators located below the left pane.
-
Cliquez sur Sauvegarder.
-
-
(Facultatif) Choisissez les niveaux d'unité d'organisation pour lesquels cette règle devra être évalué. Si vous laissez ce champ vide, la règle de validation sera évaluée à tous les niveaux.
-
(Optional) Select Skip this rule during form validation to stop this rule from being triggered during data entry.
-
Cliquez sur Sauvegarder.
Create or edit a validation rule group
-
Open the Metadata Management app and click Validations > Validation rule groups in the left-hand sidebar.
-
Click the + New button.
-
Tapez un Nom.
-
(Facultatif) Dans le champ Code, attribuez un code.
-
(Facultatif) Saisissez une Description.
-
Double-cliquez sur les Règles de validation que vous voulez attribuer au groupe.
-
Cliquez sur Sauvegarder.
Create or edit a validation notification
-
Open the Metadata Management app and click Validations > Validation notifications in the left-hand sidebar.
-
Click the + New button.
-
Tapez un Nom.
-
(Facultatif) Dans le champ Code, attribuez un code.
-
Sélectionnez Règles de validation.
-
Sélectionnez Groupes d'utilisateurs bénéficiaires
-
(Facultatif) Sélectionnez Envoyer une notification uniquement aux utilisateurs présents dans la hiérarchie.
Si vous sélectionnez cette option, le système filtrera les utilisateurs destinataires. (Le système dérive les utilisateurs destinataires des groupes d'utilisateurs destinataires.) Le filtrage se fait en fonction de l'unité d'organisation à laquelle appartient l'utilisateur destinataire. Les utilisateurs liés aux unités d'organisation qui sont les unités racines les plus anciennes de l'unité d'organisation où a eu lieu la violation recevront des notifications de validation. Le système ignorera les autres utilisateurs, lesquels ne recevront pas de notifications de validation.
-
Créer le modèle de message :
-
Créer le Modèle d'objet.
Double-cliquez sur les paramètres dans le champ Modèle de variables pour les ajouter à votre objet.
-
Créer le Modèle de message.
Double-cliquez sur les noms des paramètres dans le champ Modèle de variables pour les ajouter à votre message.
-
-
Cliquez sur Sauvegarder.
For Show details, Translate, Delete and Clone, see Common actions. Validation rule groups additionally support Sharing settings (also in Common actions).
Manage attributes
About attributes
Vous pouvez utiliser les attributs de métadonnées pour ajouter des informations supplémentaires aux objets de métadonnées. En plus des attributs standard pour chacun de ces objets, il peut être utile de stocker des informations pour des attributs supplémentaires, par exemple la méthode de collecte d'un élément de donnée.
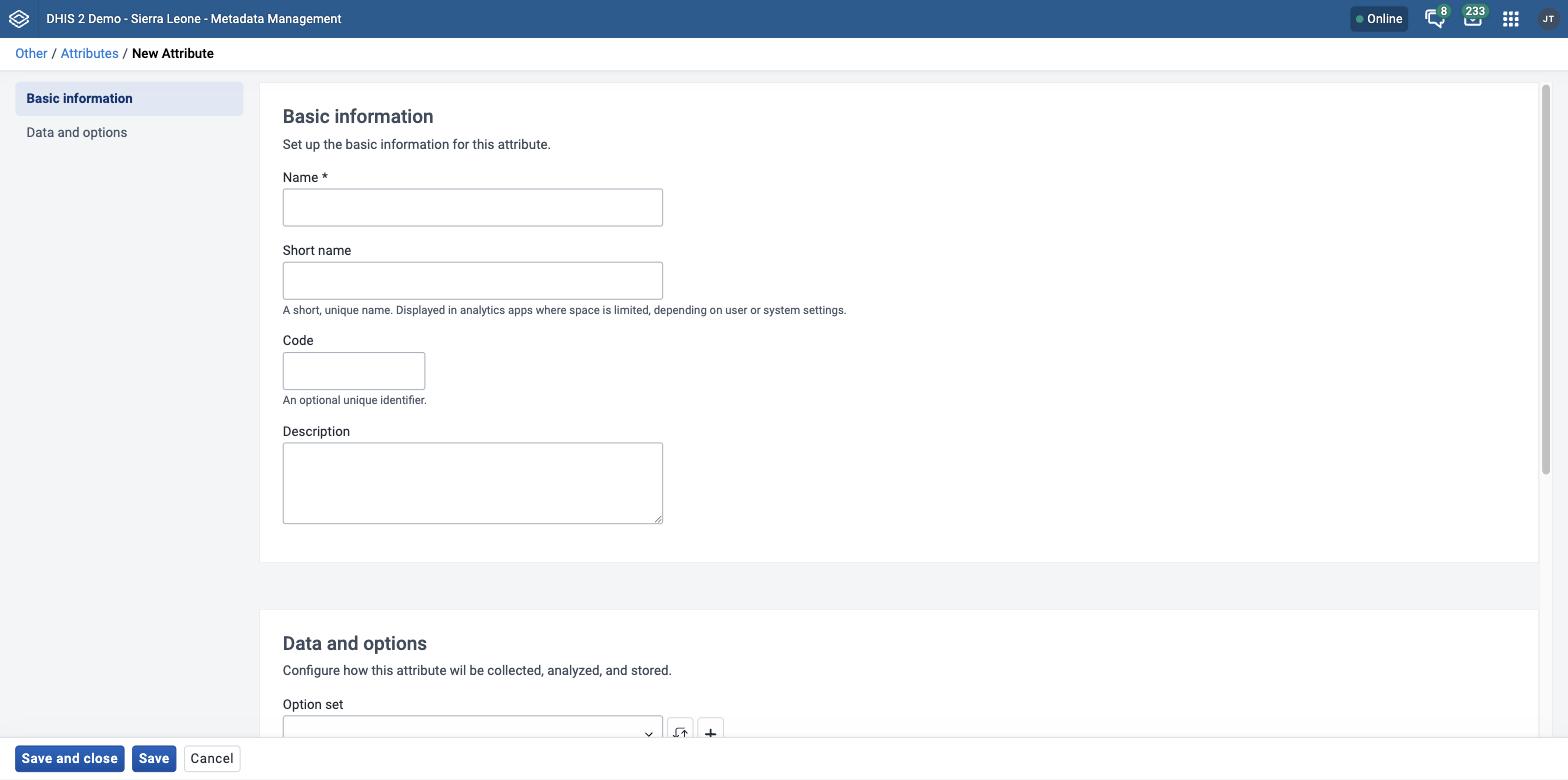
In the Metadata Management app, you manage the following attribute objects:
| Type d'objet | Fonctions disponibles |
|---|---|
| Attribut | Créer, modifier, cloner, supprimer, afficher les détails et traduire |
Créer ou modifier un attribut
-
Open the Metadata Management app and click Other > Attributes in the left-hand sidebar.
-
Click the + New button.
-
Dans le champ Nom, saisissez le nom de l'attribut.
Each attribute must have a unique name.
-
(Facultatif) Dans le champ Code, attribuez un code.
-
Sélectionnez un Type de valeur.
Si la valeur fournie pour l'attribut ne correspond pas au type de valeur, vous recevrez un message d'avertissement.
-
(Optional) Select an Option set to restrict the attribute's values to a predefined list.
-
(Optional) In the Sort order field, type a number to control where this attribute appears relative to other attributes when editing an object's form. Attributes without a sort order are shown afterwards, in alphabetical order.
-
Sélectionnez les options que vous voulez, par exemple :
-
Sélectionnez Obligatoire si vous voulez qu'un objet ait toujours l'attribut dynamique.
-
Sélectionnez Unique si vous voulez que le système fasse en sorte que les valeurs soient uniques pour un type d'objet spécifique.
-
-
Cliquez sur Sauvegarder.
L'attribut dynamique est maintenant disponible pour les objets auxquels vous l'avez attribué.
For Show details, Translate, Delete and Clone, see Common actions. Attributes do not support Sharing settings.
Manage constants
About constants
Les constantes sont des valeurs statiques qui peuvent être mises à la disposition des utilisateurs pour être utilisées dans les éléments de données et les indicateurs. Certains indicateurs, tels que le "Taux de protection sur deux ans", dépendent de constantes qui, généralement, ne changent pas au fil du temps.

In the Metadata Management app, you manage the following constant objects:
| Type d'objet | Fonctions disponibles |
|---|---|
| Constant | Créer, modifier, cloner, partager, supprimer, afficher les détails et traduire |
Create or edit a constant
-
Open the Metadata Management app and click Other > Constants in the left-hand sidebar.
-
Click the + New button.
-
Dans le champ Nom, entrez le nom de la constante.
-
In the Short name field, type an abbreviated name of la constante.
-
(Facultatif) Dans le champ Code, attribuez un code.
-
Dans le champ Description, saisissez une description brève et informative de la constante.
-
Dans le champ Valeur, définissez la valeur de la constante.
-
Cliquez sur Sauvegarder.
La constante est maintenant disponible.
For Show details, Sharing settings, Translate, Delete and Clone, see Common actions.
Manage option sets
About option sets
Les ensembles d'options fournissent une liste déroulante (énumérée) prédéfinie à utiliser dans DHIS2. Vous pouvez définir n'importe quel type d'options.
Un ensemble d'options appelé "Type d'accouchement" devrait avoir les options : "Normal", "Du siège", "Césarienne" et "Assisté".
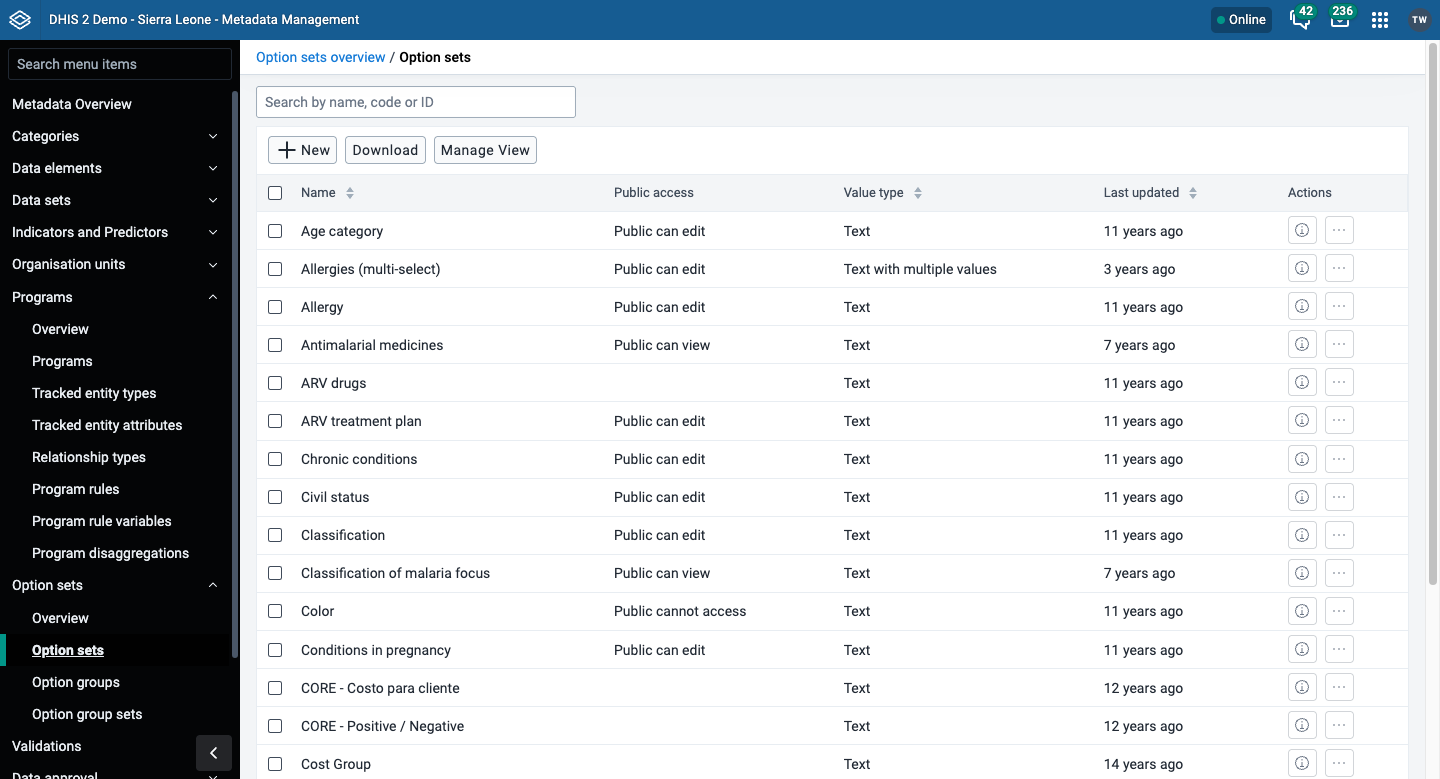
| Type d'objet | Fonctions disponibles |
|---|---|
| Ensemble d'options | Créer, modifier, cloner, partager, supprimer, afficher les détails et traduire |
| Groupe d’options | Créer, modifier, cloner, partager, supprimer, afficher les détails et traduire |
| Ensemble de groupes d'options | Créer, modifier, cloner, partager, supprimer, afficher les détails et traduire |
Create or edit an option set
N.B.
Les ensembles d'options doivent avoir un code ainsi qu'un nom. Vous pouvez changer les noms, mais pas les codes. Les noms et les codes de toutes les options doivent être uniques, même entre différents ensembles d'options. >>

-
Open the Metadata Management app and click Option sets > Option sets in the left-hand sidebar.
-
Click the + New button.
-
In the Primary details tab, fill in Name, Code and (optionally) Description — see Common metadata object fields — select a Value type, then click Save.
-
Pour chaque option dont vous avez besoin, effectuez les tâches suivantes :
-
Cliquez sur l'onglet Options.
-
Click the + New button.
-
Saisissez un Nom et un Code. A titre optionnel, sélectionnez également une Couleur et une Icône qui seront utilisées pour cette option dans les applications de saisie de données.
-
Triez les options par nom, code/valeur ou manuellement.
-
Cliquez sur Sauvegarder.
-
Create or edit an option group
Vous pouvez regrouper et classer les options dans un ensemble d'options en utilisant les groupes d'options. Ainsi, vous pouvez créer un sous-ensemble d'options dans un ensemble d'options. L'objectif principal est de filtrer des ensembles d'options volumineux en parties plus petites et liées.
Options that are grouped can be hidden or shown together in the Capture app through program rules.
N.B.
Vous ne pouvez pas modifier l' ensemble d'options sélectionné dans un Groupe d'options une fois qu'il est créé.
- Open the Metadata Management app and click Option sets > Option groups in the left-hand sidebar.
- Click the + New button.
- Fill in Name, Short name and Code — see Common metadata object fields.
- Select the Option set this group belongs to.
- Once an Option set is selected, assign the Options you want to group.
- Cliquez sur Sauvegarder.
Create or edit an option group set
Option group sets allow you to categorise multiple option groups into a set. The main purpose of the option group set is to add more dimensionality to your captured data for analysis.
N.B.
Vous ne pouvez pas modifier l' Ensemble d'options sélectionné dans un Ensemble de groupes d'options une fois qu'il est créé.
- Open the Metadata Management app and click Option sets > Option group sets in the left-hand sidebar.
- Click the + New button.
- Fill in Name, Code and Description — see Common metadata object fields.
- Select the Option set this group set belongs to.
- (Optional) Select Data dimension to make the group set available to analytics as another dimension, in addition to the standard dimensions of "Period" and "Organisation unit".
-
Select option groups and assign them. Available option groups are displayed in the left panel. Option groups that are currently members of the option group set are displayed in the right hand panel.
-
Cliquez sur Sauvegarder.
For Show details, Sharing settings, Translate, Delete and Clone, see Common actions.
Manage legends
About legends
You can create, edit, clone, share, delete, show details for and translate legends, to make the maps you set up for your users meaningful. You create the maps themselves in the Maps app.
N.B
Les légendes continues doivent être constituées d'éléments de légende qui se terminent et commencent par la même valeur, par exemple : 0-50 et 50-80. Ne définissez pas les éléments de légende de cette façon : 0-50 et 51-80. Cela créerait des lacunes dans votre légende. >>
Create or edit a legend
N.B.
Il n'est pas permis d'avoir des lacunes dans une légende.
Il n'est pas permis d'avoir des éléments de légende qui se chevauchent.

-
Open the Metadata Management app and click Other > Legends in the left-hand sidebar.
-
Click the + New button.
-
Dans le champ Nom, tapez le nom de la légende.
-
(Facultatif) Dans le champ Code, attribuez un code.
-
Créez les éléments de légende que vous voulez avoir dans votre légende :
-
Sélectionnez Valeur de départ et Valeur de fin.
-
Sélectionnez Nombre d'éléments de la légende.
-
Sélectionnez un schéma de couleurs.
-
Cliquez sur Créer des éléments de légende.
Tip
Click the options menu to edit or delete a legend item.
-
-
(Facultatif) Ajoutez d'autres éléments de légende :
-
Click the + New button.
-
Entrez un nom et sélectionnez une valeur de départ, une valeur de fin et une couleur.
-
Cliquez sur OK.
-
-
(Facultatif) Changez les échelles de couleurs.
-
Click the color scale to view a list of color scale options, and select one.
-
To customise a color scale, click the + New button. In the Edit l'élément de légende, cliquez sur le bouton d'échelle de couleurs et sélectionnez manuellement des couleurs, ou entrez vos valeurs de couleur.
-
-
Cliquez sur Sauvegarder.
A finished legend with four items looks like this:
| Elément de légende | Valeur initiale | Valeur finale |
|---|---|---|
| Très mauvais | 0 | 50 |
| Moyen | 50 | 80 |
| Très bien | 80 | 100 |
| Trop haut | 100 | 1000 |
Assign a legend to an indicator or data element
You can assign a legend to an indicator or a data element in the Metadata Management app, either when you create the object or when you edit it. When you then select that indicator or data element in the Maps app, the system automatically selects the assigned legend.
For Show details, Sharing settings, Translate, Delete and Clone, see Common actions.
See also
Manage predictors
À propos des prédicteurs
Un prédicteur permet de définir comment générer une valeur de données agrégées à partir d'une expression contenant des données agrégées et/ou d'événements. La valeur prédite peut être basée sur :
-
Des données de la même période que la valeur prédite, et/ou
-
Des données des périodes antérieures à la valeur prédite
Data from the same period
Un prédicteur peut utiliser des données de la même période que la valeur prédite. Par exemple, vous pouvez compter le nombre d'unités d'organisation ayant une valeur non nulle d'un élément de données en utilisant une expression de prédiction comme :
if( #{ji7o0ILHuU2} != 0, 1, 0 )Lorsque vous appliquez ce prédicteur à l'unité d'organisation où les données sont collectées, il enregistrera 1 comme valeur prédite si l'élément de données a une valeur non nulle pour cette unité d'organisation, sinon 0. (Si l'élément de données pour lequel vous faites la prédiction n'enregistre pas les valeurs nulles, alors les valeurs nulles ne seront pas enregistrés dans la base de données, afin d'économiser de l'espace). Vous pouvez ensuite additionner cette valeur prédite dans l'analyse à un niveau d'unité d'organisation supérieur, pour compter le nombre d'unités d'organisation ayant une valeur non nulle et qui se trouvent sous chaque unité d'organisation dans le rapport.
Data from previous periods
Un prédicteur utilisera les données des périodes précédentes si vous spécifiez une fonction d'agrégation telle que somme() ou moyenne(). Par exemple, l'expression de générateur suivante identifie une valeur qui correspond à la moyenne plus deux fois l'écart-type des données de la période précédente :
avg( #{ji7o0ILHuU2} ) + 2 * stddev( #{ji7o0ILHuU2} )Data from the same and previous periods
A predictor expression can access data both from same period as the prediction and previous periods by accessing data both within an aggregate function (for previous periods), and outside any aggregate function (for the same period). For example, an expression like the following can be used to take a balance of something from the previous period (#{KOh02hHko7C}), add to that the net change in this period (#{ji7o0ILHuU2}), resulting in the balance for this period:
sum( #{KOh02hHko7C} ) + #{ji7o0ILHuU2}The first data value is inside an aggregate expression (sum) to indicate that it is sampling previous period data (even if there is only one previous period), while the second data value is not in an aggregate function to indicate that it is referencing data from the same period.
Vous pouvez, si vous le voulez, indiquer l'élément de données de sortie d'un prédicteur dans l'expression du même prédicteur. Vous pouvez, par exemple, utiliser l'expression de cet exemple pour prédire le bilan d'une période, puis combiner cette valeur avec la variation de la période suivante pour calculer le bilan de la période suivante. Lorsqu'un prédicteur est exécuté sur plusieurs périodes, celles-ci sont traitées dans l'ordre chronologique et le résultat d'une période antérieure peut être utilisé comme valeur d'entrée pour une période ultérieure.
Predictor organisation unit levels
Vous devez sélectionner un ou plusieurs niveaux d'unité d'organisation pour les valeurs de sortie d'un prédicteur. Toutes les valeurs générées par le prédicteur sont stockées pour les unités d'organisation au(x) niveau(x) que vous avez sélectionné(s). Chaque élément de l'expression du prédicteur est la somme de la valeur stockée pour cette unité d'organisation (le cas échéant) plus toutes les valeurs stockées dans les unités d'organisation inférieures à celle-ci (le cas échéant).
N.B.
Lors de la configuration d'un prédicteur, vous devez choisir un ou plusieurs niveaux d'unité d'organisation auxquels les données prédites seront produites. Si aucun niveau n'est sélectionné, aucune valeur prédite ne sera générée.
Attention
Si vous voulez utiliser les valeurs prédites dans les rapports d'analyses, ou faire d'autres prédictions, ne sélectionnez pas plus d'un niveau d'unité d'organisation. Lorsque vous sélectionnez plus d'un niveau, les prédictions au(x) niveau(x) supérieur(s) incluront également toutes les données utilisées dans les prédictions au(x) niveau(x) inférieur(s). Si les prédictions de plusieurs niveaux sont utilisées par la suite dans des analyses ou dans les expressions d'autres prédicteurs, cela peut entraîner un double comptage car les valeurs prédites pour un niveau supérieur incluent les valeurs prédites d'un niveau inférieur.
You may select multiple organisation unit levels if you use the predicted values only in validation rules. For example in disease surveillance, you could have a validation rule alert if an actual value is higher than the range of expected values for that period based on previous period data. To do this, you could create a predictor to compute the average plus twice the standard deviation of previous period data. You could use a validation rule to compare this highest expected value with the actual value. You could run the predictor and validation rule at multiple levels to detect different outbreak scenarios. In one scenario, there might be a significant increase in one facility that exceeds its expected range, but the district containing that facility might not exceed its expected range because the district values are combined with many other facilities. Yet in another scenario, there may be a moderate increase in several facilities that does not exceed the expected range for each facility (because the standard deviation for each facility may be high), but it does exceed the expected range for the district (because the standard deviation for the district as a whole may be lower).
If you want to generate predictions at multiple levels, you could also use different predictors at different levels. For example, you might want to be alerted if the value at one level exceeds the average plus twice the standard deviation, but alerted at another level if it exceeds the average plus 1.8 times the standard deviation. If you want, you could configure the different predictors to have the same output data element. If you use the same output data element, this will still work with validation rules at different organisation unit levels, but you also must be careful not to use the results in analytics or in other predictor calculations to avoid double counting.
In the Metadata Management app, you manage the following predictor objects:
| Type d'objet | Fonctions disponibles |
|---|---|
| Prédicteur | Créer, modifier, cloner, supprimer, afficher les détails et traduire |
Échantillonnage des périodes antérieures
Les prédicteurs peuvent générer des valeurs de données pour des périodes passées, présentes ou futures. Ces valeurs sont basées sur des données de la période prédite et/ou sur des données échantillonnées de périodes antérieures à la période prédite.
Si vous n'avez besoin que des données de la période pour laquelle la prédiction est effectuée, vous n'avez pas besoin de lire cette section. Cette section décrit comment échantillonner des données provenant de périodes antérieures à la période prédite.
Three fields control which previous periods are sampled — Sequential sample count, Annual sample count and Sequential skip count — and a fourth, the Sample skip test, can exclude individual periods that would otherwise be included. They appear together in the predictor's Logic section:

The rest of this section explains what each one does. In the diagrams, the period being predicted is marked in one colour and the periods that get sampled in another.
Sequential sample count
Le Nombre d'échantillons séquentiels d'un prédicteur donne le nombre de périodes immédiatement antérieures à échantillonner. Par exemple, si le type de période d'un prédicteur est Hebdomadaire et que le Nombre d'échantillons séquentiels est 4, cela signifie qu'il faut échantillonner les quatre semaines qui précèdent immédiatement la semaine de la valeur prédite. Ainsi, la valeur prédite pour la semaine 9 devra utiliser les échantillons des semaines 5, 6, 7 et 8 :

If a predictor's period type is Monthly and the Sequential sample count is 4, this means to sample four previous months immediately preceding the predicted value month. So the predicted value for May would use samples from January, February, March and April:

Le Nombre d'échantillons séquentiels peut être supérieur au nombre de périodes dans une année. Par exemple, si vous voulez échantillonner les 24 mois qui précèdent immédiatement le mois de la valeur prédite, définissez le Nombre d'échantillons séquentiels sur 24 :

Sequential skip count
Le Nombre de sauts séquentiels d'un prédicteur indique combien de périodes doivent être sautées immédiatement avant la période de la valeur prédite, dans le Nombre d'échantillons séquentiels. Il peut être utilisé, par exemple, dans la détection d'une épidémie pour sauter un ou plusieurs échantillons immédiatement précédents qui pourraient contenir des valeurs du début d'une épidémie que vous essayez de détecter.
Par exemple, si le Nombre d'échantillons séquentiels est 4, mais que le Nombre de sauts séquentiels est 2, alors les deux échantillons qui précèdent immédiatement la période prédite seront sautés, et seules deux périodes seront échantillonnées :

Annual sample count
Le Nombre d'échantillons annuels d'un prédicteur indique le nombre d'années antérieures pour lesquelles des échantillons doivent être collectés à la même période de l'année. Il peut être utilisé, par exemple, pour la surveillance des maladies dans les cas où l'incidence prévue de la maladie varie au cours de l'année et qu'il serait plus judicieux de le comparer avec la même période relative des années précédentes. Par exemple, si le Nombre d'échantillons annuels est 2 (et que le Nombre d'échantillons séquentiels est zéro), les échantillons seront alors collectés sur des périodes au cours des deux années précédentes, à la même période de l'année.

Sequential and annual sample counts together
Vous pouvez utiliser ensemble les nombres d'échantillons séquentiels et annuels pour collecter des échantillons sur plusieurs périodes séquentielles de plusieurs années passées. Dans ce cas, les échantillons seront prélevés au cours des années précédentes, pendant la période correspondant à la période de valeur prédite, ainsi qu'au cours des années précédentes, avant et après la même période de l'année, comme le détermine le Nombre d'échantillons séquentiels.
Par exemple, si le Nombre d'échantillons séquentiels est 4 et que le Nombre d'échantillons annuels est 2, les échantillons seront prélevés sur les 4 périodes précédant immédiatement la période de valeur prédite. En outre, des échantillons seront prélevés au cours des deux années précédentes pour la période correspondante, ainsi que quatre périodes situées de part et d'autre de celle-ci :

Sequential, annual, and skip sample counts together
You can use the Sequential skip count together with the sequential and annual sample counts. When you do this, the Sequential skip count tells how many periods to skip in the same year as the predicted value period. For example, if the Sequential sample count is 4 and the Sequential skip count is 2, then the two periods immediately preceding the predicted value period will be skipped, but the two periods before that will be sampled:

Si le Nombre de sauts séquentiels est égal ou supérieur au Nombre d'échantillons séquentiels, alors aucun échantillon ne sera collecté pour l'année contenant la période de valeur prédite ; seules les périodes des années passées seront échantillonnées :

Sample skip test
Vous pouvez utiliser le Test de saut d'échantillon pour sauter des échantillons de certaines périodes qui seraient autrement incluses, sur la base des résultats du test d'une expression au cours de ces périodes. Cela peut être utilisé, par exemple, dans la détection de foyers de maladies, où le test de saut d'échantillon peut identifier des foyers de maladies antérieurs, pour exclure ces échantillons de la prédiction de valeurs non liées à un foyer de maladie.
Le Test de saut d'échantillon est une expression qui devrait renvoyer une valeur de vrai ou faux, pour indiquer si la période doit être sautée ou non. Il peut s'agir d'une expression qui teste toute valeur de données de la période précédente. Par exemple, elle peut tester une valeur de donnée explicitement saisie pour indiquer qu'une période précédente doit être sautée. Elle peut aussi comparer une valeur prédite précédemment pour une période avec la valeur réelle enregistrée pour cette période, afin de déterminer si cette période doit être sautée.
Toute période pour laquelle le Test de saut d'échantillon est vrai ne sera pas échantillonnée. Exemple :

Prédicteurs et combinaisons d'options de catégories (désagrégations)
La combinaison d'options de catégorie (désagrégation) pour les données de sortie du prédicteur est choisie de l'une des trois façons suivantes :
- Combinaison d'options de catégorie par défaut.
Si l'élément de données de sortie du prédicteur ne comporte aucune désagrégation (combinaison de catégories "None", également connue sous le nom de combinaison de catégories par défaut), toutes les données de sortie du prédicteur seront rendues dans la combinaison d'options de catégorie par défaut. Dans ce cas, les données de sortie du prédicteur ne sont pas désagrégées.
- Combinaison d'options de catégories fixes
Si l'élément de données de sortie du prédicteur a une combinaison de catégories autre que "None", vous pouvez choisir une désagrégation fixe pour le prédicteur "Combinaison d'options de catégorie de sortie". Si vous le faites ainsi, tous les résultats de ce prédicteur auront cette combinaison d'options de catégorie.
Par exemple, si l'élément de données de sortie a une combinaison de catégories "Sexe et Âge", vous pouvez décider que tous les résultats du prédicteur seront orientés vers une combinaison d'options de catégorie telle que "Femme de moins de 5 ans", "Homme 5 - 10 ans", ou tout autre.
- Utiliser la combinaison d'options de catégorie d'entrée (disponible dans les versions 40.1 et suivantes)
Si l'élément de données de sortie du prédicteur a une combinaison de catégories autre que "None", vous pouvez choisir "Prédire en fonction de la combinaison d'options de catégorie d'entrée" comme valeur pour "Combinaison d'options de catégorie de sortie". Dans ce cas, une prédiction différente est effectuée pour chaque combinaison d'options de catégorie dans la combinaison de catégories de l'élément de données de sortie (c'est-à-dire une prédiction pour "Femme de moins de 5 ans", une seconde pour "Homme de moins de 5 ans"), une troisième pour "Femme de 5 à 10 ans", et ainsi de suite).
(Dans la version 40.1, pour activer cette fonction, il suffit de sélectionner "\<no value>" pour "Combinaison d'options de catégorie de sortie").
> **Tip**
>
> In some installations, the options in a category may have changed over time.
For example, a category "Age" may have had three options "1-5", "6-10", and "over 10",
but then was changed to only have two options "10 and under" and "over 10".
Historical data may have values with any of these options.
To use a predictor with such data, you can define another category
such as "Reporting Age" with all the options ever used, such as "1-5", "6-10",
"10 and under", and "over 10". Use this category in the category combination
for the predictor's output data element. This means that all the input category
options will be reflected in the output.
>
> If you then want a single report for the output data that covers
all the disaggregations, you can use category option groups
in a category option group set. For example use a category option group
"10 and under" that contains category options "1-5", "6-10", and "10 and under".
Prédicteurs et combinaisons d'options d'attribut
If the input data to a prediction has attribute option combinations, a different prediction will be made for each attribute option combination where there is data.
For example, you could use attribute option combinations to represent different projects on your system. The predictor will generate a value with the attribute option combination for Project A when it finds input data for Project A; it will generate a value with the attribute option combination for Project B when it finds input data for Project B; and so on.
Pour toute donnée d'entrée sans combinaison d'options d'attribut (en d'autres termes, avec la combinaison d'options d'attribut par défaut), les prédictions sont générées avec la combinaison d'options d'attribut par défaut. Si vous n'utilisez pas de combinaisons d'options d'attribut dans les données, elles ne seront pas utilisées dans les données de sortie du prédicteur.
If you use attribute option combinations and also "Predict according to input category option combo", there will be a separate prediction for each combination of disaggregation and attribute option combination. For example, there could be a prediction for Project A data for "Female under 5", a prediction for Project A data for "Male under 5", a prediction for Project B data for "Female under 5", and so on.
Create or edit a predictor
-
Open the Metadata Management app and click Indicators and Predictors > Predictors in the left-hand sidebar.
-
Click the + New button.
-
Dans le champ Nom, entrez le nom du prédicteur.
-
In the Short name field, type a short name for the predictor.
-
(Facultatif) Dans le champ Code, attribuez un code.
-
(Facultatif) Saisissez une Description.

-
Sélectionnez un Elément de données de sortie. Les valeurs générées par ce le prédicteur sont enregistrées en tant que données agrégées associées à ces éléments données et la période prédite.
La valeur est arrondie en fonction du type de valeur de l'élément de données : si la valeur est de type entier, la valeur prédite sera arrondi à l’entier le plus proche. Pour tous les autres types de valeur, le nombre est arrondi à quatre chiffres significatifs. (Cependant, s'il y a plus de quatre chiffres à gauche de la décimale, ils ne sont pas remplacés par des zéros.)
-
(Facultatif) Sélectionnez une combinaison d'options de catégorie de sortie. Cette liste déroulante s'affichera uniquement si l'élément de données sélectionné a une combinaison de catégories autre que "Aucune". Si c'est le cas, vous pouvez sélectionner la combinaison d'options de catégorie de désagrégation que vous voulez utiliser pour la sortie, ou vous pouvez sélectionner "Prédire selon la combinaison d'options de catégorie d'entrée" (voir la discussion ci-dessus).
-
Sélectionnez un Type de période.
-
Attribuez un ou plusieurs niveaux d'unité d'organisation. La valeur de sortie sera attribuée à une unité d'organisation de ce niveau (ou de ces niveaux). For aggregate data, the input values depend on the Organisation units providing data setting described below. For tracker-based data, the input values come from the organisation unit to which the valeur de sortie est attribuée, ou à partir de tout niveau inférieur à l'unité d'organisation de la valeur de sortie
-
Organisation units providing data controls where the input values come from for aggregate data. If "at selected levels only", only organisation units at the selected levels are included. If "At selected levels and all levels below" is selected, organisation units at the selected level(s) and all organisation units below are also included.
-
Créer un Générateur. Le générateur est l'expression utilisée pour le calcul de la valeur prédite.

Edit generator expression dialog showing the expression editor and the Operators, Data elements, Program data, Org unit counts, Constants and Reporting rates panels -
Tapez une Description de l'expression du générateur.
-
Select a Missing value strategy. This sets whether the system evaluates the generator expression at all when some of the data it references is missing.
Option Description Skip if any value is missing The expression is not evaluated if any of the values which compose it are missing, so no value is predicted. This is the default option. Skip if all values are missing The expression is not evaluated only if every value which composes it is missing. If at least one value is present, the expression runs and the missing values are treated as zero. Never skip The expression is always evaluated, and every missing value is treated as zero. The strategy decides whether the expression runs. That is separate from what the expression does with a missing value once it is running:
Situation Skip if any value is missing Skip if all values are missing Never skip The only item referenced is missing No value predicted No value predicted Treated as 0 One item missing, others have values No value predicted Missing item treated as 0 Missing item treated as 0 isNull( item )where item is missingNever evaluated truetrueisNotNull( item )where item is missingNever evaluated falsefalsefirstNonNull( item, fallback )where item is missingNever evaluated Returns fallbackReturns fallbackNote
A missing value and a zero are not the same thing. DHIS2 does not store zeros for a data element unless Store zero data values is switched on for it, so a field that looks like it holds zero may hold no value at all. If your expression needs to tell "reported zero" apart from "not reported", test with
isNull()and use Skip if all values are missing or Never skip — under Skip if any value is missing the expression never runs, so the test can never fire. -
Enter the generator expression. You can build the expression by selecting data elements for aggregate data, program data elements, attributes or indicators, organisation unit counts, constants or reporting rates.
Pour utiliser les données échantillonnées de la période passée, vous devez inclure tout élément que vous sélectionnez dans l'une des fonctions agrégées suivantes (veuillez noter que les noms de ces fonctions sont sensibles à la casse) :
Fonction d'agrégation Moyens moyenne(x) Valeur moyenne de x nombre(x) Nombre de valeurs de x max(x) Valeur maximale de x médiane(x) Valeur médiane de x min(x) Valeur minimale de x percentileCont(p, x) Centile continu de x, où p est le centile sous forme de nombre à virgule flottante compris entre 0 et 1. Par exemple, p = 0 renverra la valeur la plus basse, p = 0,5 renverra la médiane, p = 0,75 renverra le 75e percentile, p = 1 renverra la valeur la plus élevée, etc. Continu signifie que la valeur sera interpolée si nécessaire. Par exemple, centileCont( 0.5, #{FTRrcoaog83} ) renverra 2,5 si les valeurs échantillonnées de l'élément de données FTRrcoaog83 sont 1, 2, 3 et 4. stddev(x) Standard deviation of x. This function is equivalent to stddevSamp. It's suggested that you use the function stddevSamp instead for greater clarity. stddevPop(x) Écart type de population de x : sqrt( somme( (x - avg(x))^2 ) / n ) stddevSamp(x) Exemple d'écart type de x : sqrt( somme( (x - avg(x))^2 ) / ( n - 1 ) ). Notez que cette valeur n'est pas calculée lorsqu'il n'y a qu'un seul échantillon. somme(x) Somme des valeurs de x Note
Any items inside an aggregate function will be evaluated for all sampled past periods, and then combined according to the formula inside the aggregate function. Any items outside an aggregate function will be evaluated for the period in which the prediction is being made.
Vous pouvez construire des expressions plus complexes en cliquant sur (ou en saisissant) l'un des éléments situés sous le champ de l'expression : ( ) * / + - Jours. Des nombres constants peuvent être ajoutés par saisie. L'option "jours" insère [jours] dans l'expression qui se résout en nombre de jours dans la période d'où proviennent les données.
Vous pouvez également utiliser les fonctions non agrégées suivantes dans votre expression, soit à l'intérieur de fonctions agrégées, soit contenant des fonctions agrégées, soit indépendantes des fonctions agrégées :
Fonction Moyennes contains(expr, sub1, ...) Searches an expression for one or more substrings. Returns true if the expression contains all the substrings. For example, the following are all true: contains("abcd", "abcd"); contains("abcd", "b"); and contains("abcd", "ab", "bc"). Comparisons are case-sensitive. containsItems(expr, item1, ...) Searches an expression for one or more items. The expression is made up of comma-separated elements. containsItems returns true if every item exactly matches an element in the expression. For example, containsItems("abcd", "abcd") and containsItems("ab,cd", "ab", "cd") are true, but containsItems("abcd", "b") and containsItems("abcd", "ab", "bc") are false. Comparisons are case-sensitive. containsItems can be used for multi-valued data elements to see if an item is contained in the data element values. if(test, valueIfTrue, valueIfFalse) Evaluates test which is an expression that evaluates to a boolean value -- see Boolean expression notes below. If the test is true, returns the valueIfTrue expression. If it is false, returns the valueIfFalse expression. is(expr1 in expression [, expression ...]) Returns true if expr1 is equal to any of the following expressions, otherwise false. isNull(item) Returns the boolean value true if the item is null (missing), otherwise returns false. The item can be any selected item from the right (data element, program data element, etc.). isNotNull(item) Returns true if the item value is not missing (not null), otherwise false. firstNonNull(item [, item ...]) Returns the value of the first item that is not missing (not null). Can be provided any number of arguments. Any argument may also be a numeric or string literal, which will be returned if all the previous items have missing values. greatest(expression [, expression ...]) Returns the greatest (highest) value of the expressions given. Can be provided any number of arguments. least(expression [, expression ...]) Returns the least (lowest) value of the expressions given. Can be provided any number of arguments. log(expression [, base ]) Returns the natural logarithm (base e) of the numeric expression. If an integer is given as a second argument, returns the logarithm using that base. log10(expression) Returns the common logarithm (base 10) of the numeric expression. normDistCum(x [,mean [,stddev]]) Returns the cumulative distribution function (CDF) value for x given the normalized distribution described by the mean and stddev. Equivalent to Excel NORM.DIST(x,mean,stddev,TRUE) or LibreOffice NORMDIST(x,mean,stddev,1). If stddev is not given, it is computed from past sampled values of x. If neither mean nor stddev are given, they are computed from past sampled values of x. See examples. normDistDen(x [,mean [,stddev]]) Returns the probability density function (PDF) value for x given the normalized distribution described by the mean and stddev. Equivalent to Excel NORM.DIST(x,mean,stddev,FALSE) or LibreOffice NORMDIST(x,mean,stddev,0). If stddev is not given, it is computed from past sampled values of x. If neither mean nor stddev are given, they are computed from past sampled values of x. See examples. null Returns no result. For example, if( #{FH8ab5Rog83}<0, null, 1 ) returns nothing if the data element value is less than 0, otherwise 1. orgUnit.ancestor(orgUnitUid [, orgUnitUid ...]) Returns true if the organisation unit is a descendant of any of the (1 or more) organisation units, otherwise false. orgUnit.dataSet(dataSetUid [, dataSetUid ...]) Returns true if the organisation unit is assigned to any of the (1 or more) data sets, otherwise false. orgUnit.group(ouGroupUid [, ouGroupUid ...]) Returns true if the organisation unit is a member of any of the (1 or more) organisation unit groups, otherwise false. orgUnit.program(programUid [, programUid ...]) Returns true if the organisation unit is assigned to any of the (1 or more) programs, otherwise false. removeZeros(expression) Returns nothing if the expression value is 0, otherwise returns the expression value. .maxDate(yyyy-mm-dd) For a data element (not program data), value from periods ending on or before a maximum date. .minDate(yyyy-mm-dd) For a data element (not program data), value from periods starting on or after a minimum date. Boolean expression notes: A boolean expression must evaluate to true or false. The following operators may be used to compare two values resulting in a boolean expression: \<, >, !=, ==, >=, and \<=. The following operators may be used to combine two boolean expressions: && or the keyword and (logical and), and || or the keyword or (logical or). The unary operator ! or the keyword not may be used to negate a boolean expression.
Generator expression examples:
Generator expression Means somme(#{FTRrcoaog83.tMwM3ZBd7BN}) Somme des valeurs échantillonnées de l'élément de données FTRrcoaog83 et de la combinaison d'options de catégorie (désagrégation) tMwM3ZBd7BN avg(I{GSae40Fyppf}) + 2 * stddevSamp(I{GSae40Fyppf}) Average of the sampled values of program indicator GSae40Fyppf plus twice its sample standard deviation sum(D{IpHINAT79UW.eMyVanycQSC}) / sum([days]) Sum of all sampled values of data element eMyVanycQSC from program IpHINAT79UW divided by the number of days in all sample periods (resulting in the overall average daily value) sum(#{FTRrcoaog83}) + #{T7OyqQpUpNd} Sum of all sampled values of data element FTRrcoaog83 plus the value of data element T7OyqQpUpNd in the period being predicted for (includes all disaggregations) 1.2 * A{IpHINAT79UW.RKLKz1H20EE} 1.2 times the value of attribute RKLKz1H20EE of program IpHINAT79UW, in the period being predicted for if(isNull(#{T7OyqQpUpNd}), 0, 1) If the data element T7OyqQpUpNd is null in the period being predicted, then 0, otherwise 1 if(is(#{jeiTh8ahyae} in 'NEGATIVE','UNKNOWN'), 0, 1) If the data element jeiTh8ahyae has value 'NEGATIVE' or 'UNKNOWN' then 0, otherwise 1 percentileCont(0.5, #{T7OyqQpUpNd}) Continuous 50th percentile of the sampled values for data element T7OyqQpUpNd. Note that this is the same as median(#{T7OyqQpUpNd}) if(count(#{T7OyqQpUpNd}) == 1, 0, stddevSamp(#{T7OyqQpUpNd})) If there is one sample value present for data element T7OyqQpUpNd, then 0, otherwise the sample standard deviation of these sample values. (Note that if no samples are present then the stddevSamp returns no value, so no value is predicted.) normDistCum(#{T7OyqQpUpNd}) The cumulative distribution function for the current period value of data element T7OyqQpUpNd based on the normalized distribution defined by the mean and standard deviation of past sampled periods of data element T7OyqQpUpNd normDistCum( #{T7OyqQpUpNd}, median(#{T7OyqQpUpNd}) ) The cumulative distribution function for the current period value of data element T7OyqQpUpNd based on the distribution defined by the median (instead of the mean) and standard deviation of past sampled periods of data element T7OyqQpUpNd normDistCum( #{T7OyqQpUpNd}, avg(#{T7OyqQpUpNd}), stddev(#{T7OyqQpUpNd}) ) Same as normDistCum( #{T7OyqQpUpNd} ) normDistDen( #{T7OyqQpUpNd}, avg(#{IKahz1Quie3}), stddev(#{IKahz1Quie3}) ) The probability density function for the current period value of data element T7OyqQpUpNd based on the distribution defined by the mean and standard deviation of past sampled periods of the different data element IKahz1Quie3 normDistDen( median(#{T7OyqQpUpNd}), avg(#{IKahz1Quie3}), stddev(#{IKahz1Quie3}) ) The probability density function for the median of past sampled values of data element T7OyqQpUpNd based on the distribution defined by the mean and standard deviation of past sampled periods of the different data element IKahz1Quie3 #{T7OyqQpUpNd}.minDate(2022-10-1) Value on or after 1-Oct-2022 #{T7OyqQpUpNd}.maxDate(2022-12-31) Value on or before 31-Dec-2022 #{T7OyqQpUpNd}.minDate(2022-10-1).maxDate(2022-12-31) Value between 1-Oct-2022 and 31-Dec-2022
-
-
(Facultatif) Créez un Exemple de test de saut. L'exemple de test de saut indique les périodes précédentes, s'il y'en a, à exclure de l'échantillon.
-
Saisissez une Description du test de saut.
-
Entrez l’expression du test de saut d'échantillon. Vous pouvez construire expression from the same items as the generator expression. As with the generator, you may click on (or type) any of the elements below the expression field: ( ) * / + - Days.
Les fonctions non agrégées décrites ci-dessus pour les expressions de générateur peuvent également être utilisées dans les tests de saut.
L'expression doit être évaluée à une valeur booléenne de vrai ou faux. Voir les notes sur les expressions booléennes ci-dessus.
Exemples d'expression de test de saut :
Skip test expression Means #{FTRrcoaog83} > #{M62VHgYT2n0} The value of data element FTRrcoaog83 (sum of all disaggregations) is greater than the value of data element M62VHgYT2n0 (sum of all disaggregations) #{uF1DLnZNlWe} > 0 The value of data element uF1DLnZNlWe (sum of all disaggregations) is greater than zero #{FTRrcoaog83} > #{M62VHgYT2n0} || #{uF1DLnZNlWe} > 0 The value of data element FTRrcoaog83 (sum of all disaggregations) is greater than the value of data element M62VHgYT2n0 (sum of all disaggregations) or the value of data element uF1DLnZNlWe (sum of all disaggregations) is greater than zero
-
-
Entrez une valeur pour Nombre d'échantillons séquentiels.
Il s'agit du nombre de périodes séquentielles que le calcul doit remonter pour échantillonner les données pour les calculs.
-
Entrez une valeur pour Nombre d'échantillons annuels.
Il s'agit du nombre d'années que le calcul doit remonter pour pour échantillonner les données pour les calculs.
-
(Facultatif) Entrez une valeur pour Nombre de sauts séquentiels.
Il s'agit du nombre de périodes séquentielles précédant immédiatement la période de la valeur prédite, qui doivent être ignorées avant l'échantillonnage des données.
-
Cliquez sur Sauvegarder.
Predictions by Data Element Group
Vous pouvez utiliser un seul prédicteur pour opérer sur tous les éléments de données d'un groupe au lieu d'un prédicteur différent pour chaque élément de données. Cette fonctionnalité peut être utilisée, par exemple, dans la gestion logistique lorsqu'un élément de données est utilisé pour chaque produit et qu'une combinaison d'options de catégorie est utilisée pour chaque comptage lié à ce produit.
La syntaxe est :
forEach ?de dans :DEG:degUid --> expression principale
où :
| partie | signifie |
|---|---|
| forEach | mot clé à placer au début de l'expression |
| ?de | tout nom de variable commençant par « ? », puis une lettre, puis éventuellement un nombre quelconque de lettres ou de chiffres supplémentaires (sensible à la casse). Exemples : ?de, ?X, ?élémentDeDonnées, etc. |
| dans | mot clé |
| :DEG:degUid | la notation :DEG : suivie de l'UID du groupe de données contenant les données à traiter |
| → | à placer avant l'expression principale |
| expression principale | l'expression à opérer sur chaque élément de données du groupe. Dans cette expression, utilisez le nom de la variable (tel que ?de) comme espace réservé pour chaque élément de données. |
Le prédicteur s'exécute une fois pour chaque élément de données du groupe d'éléments de données. Pour chaque élément de données, les instances de la variable dans l'expression principale sont remplacées par cet élément de données. Le même élément de données est également utilisé comme élément de données de sortie du prédicteur. La valeur prédite est écrite dans cet élément de données à l'aide de la combinaison d'options de catégorie de sortie configurée.
Le prédicteur doit être configuré avec un élément de données de sortie, mais celui-ci est ignoré lors de l'exécution du prédicteur. Il est recommandé de configurer le prédicteur avec l'un des éléments de données du groupe d'éléments de données que le prédicteur utilisera. Vous pouvez ainsi sélectionner une combinaison d'options de catégorie de sortie valide pour cet élément de données.
Lorsque le prédicteur est créé, le groupe d'éléments de données doit contenir au moins un élément de données du type que vous utiliserez. (Le type de données de l'élément de données est utilisé lors de la vérification de la syntaxe du prédicteur.)
Exemple 1
Vos éléments de données représentent divers produits, lesquels appartiennent à un groupe d'éléments de données qui a pour UID aIMu0nieph7.
Vos combinaisons d’options de catégorie ont les UID suivants :
| combinaison d'options de catégorie | signifie |
|---|---|
Gvoecom5muL | Stock au début de la période |
CWa6eew5uco | Réapprovisionnement pendant la période |
nthohhie8Ba | Utilisé pendant la période |
Faey8Iphooy | Perdu, endommagé, expiré ou volé pendant la période |
L'expression de génération du prédicteur suivant calculera le solde des stocks au début de la période suivante (stock initial + réapprovisionnement - stock utilisé - stock perdu) :
forEach ?de in :DEG:aIMu0nieph7 -->
sum( #{?de.Gvoecom5muL} + #{?de.CWa6eew5uco} - #{?de.nthohhie8Ba} - #{?de.Faey8Iphooy} )
La configuration du prédicteur comprend :
| propriété | value |
|---|---|
| Élément de données de sortie | un des éléments de données du groupe |
| Combinaison d'options de catégorie de sortie | Solde des stocks en début de période (Gvoecom5muL) |
| Unités d'organisation fournissant des données | Au(x) niveau(s) sélectionné(s) uniquement |
| Nombre d'échantillons séquentiels | 1 |
| Nombre d'échantillons annuels | 0 |
Le prédicteur s'exécute une fois pour chaque élément de données du groupe d'éléments de données. Étant donné que la fonction d'agrégation somme() est utilisée dans l'expression de génération du prédicteur, toutes les valeurs de l'expression seront extraites de la période précédente (puisque le nombre d'échantillons séquentiels est égal à 1). Le prédicteur écrira le solde initial de chaque élément de données pour les périodes comprises entre les dates de début et de fin de l'exécution du prédicteur, pour les unités d'organisation au(x) niveau(x) sélectionné(s).
Les prédictions sont toujours effectuées à l'avance. Le solde initial prédit pour une période peut être utilisé pour calculer le solde initial de la période suivante.
Exemple 2
Si vous voulez effectuer des prédictions pour la même période que les données d'entrée, il suffit d'omettre la fonction d'agrégation somme(). Pour compléter l'exemple précédent, supposons que vous disposiez d'une autre combinaison d'options de catégorie qui calcule la variation nette du stock au cours de la période :
| combinaison d'options de catégorie | signifie |
|---|---|
Hpiek8IefoS | Variation du stock au cours de la période |
Vous pouvez utiliser l'expression suivante pour calculer la variation du stock ( réapprovisionnement - stock utilisé - stock perdu ) :
forEach ?de dans :DEG:aIMu0nieph7 -->
#{?de.CWa6eew5uco} - #{?de.nthohhie8Ba} - #{?de.Faey8Iphooy}
La combinaison d’options de catégorie de sortie est :
| propriété | value |
|---|---|
| Combinaison d'options de catégorie de sortie | Variation du stock au cours de la période (Hpiek8IefoS) |
Puisqu'il n'y a pas de fonction d'agrégation telle que somme() autour des éléments de l'expression, les données d'entrée proviennent de la même période que la sortie du prédicteur.
For Show details, Sharing settings, Translate, Delete and Clone, see Common actions.
Create or edit a predictor group
-
Open the Metadata Management app and click Indicators and Predictors > Predictor groups in the left-hand sidebar.
-
Click the + New button.
-
Saisissez un Nom. Ce champ doit être unique.
-
(Facultatif) Dans le champ Code, attribuez un code. Ce champ doit être unique.
-
(Facultatif) Saisissez une Description.
-
Double-cliquez sur les prédicteurs que vous souhaitez attribuer au groupe.
-
Cliquez sur Sauvegarder.
For Show details, Sharing settings, Translate, Delete and Clone, see Common actions. Predictor groups support the same actions as individual predictors, including Run now.
Manage push reports
Note
Push reports are not available in the Metadata Management app. If your DHIS2 instance still uses push reports, configure them in the legacy Maintenance app — see Manage push reports.
Manage external map layers
Note
Managing external map layers is planned to move into the Maps app and will not be replicated in the Metadata Management app. External map layers can still be configured in the legacy Maintenance app — see Manage external map layers.
Manage SQL views
La fonctionnalité de vue SQL de DHIS2 permet de stocker la définition de la vue SQL en interne, puis de matérialiser la vue lorsqu'elle est demandée.
Les administrateurs de bases de données doivent faire attention à ne pas créer des vues de base de données directement dans la base de données de DHIS2. Par exemple, lorsque les tableaux de ressources sont générés, ils seront d'abord tous supprimés puis recrées. Si des vues SQL dépendent de ces tableaux, une exception de violation de l'intégrité sera alors lancée et le processus sera interrompu.
Les vues SQL sont déposées par ordre alphabétique inverse en fonction de leurs noms dans DHIS2, et créées dans l'ordre alphabétique normal. Cela vous permet d'avoir des dépendances entre les vues SQL, étant donné que les vues ne dépendent que des autres vues qui arrivent plus tôt dans l'ordre alphabétique. Par exemple, "Vue B" peut dépendre sans risque de "Vue A". Sinon, le fait d'avoir des vues dépendantes d'autres vues entraîne une erreur de violation d'intégrité.
Créer une nouvelle vue SQL
To create a new SQL view, open the Metadata Management app and click Other > SQL views in the left-hand sidebar, then click the + New button.

L'attribut " Nom " de la vue SQL sera utilisé pour déterminer le nom du tableau que DHIS2 créera lorsque la vue sera matérialisée par l'utilisateur. L'attribut "Description" permet de fournir un texte descriptif de ce que fait la vue SQL.
L'attribut "Type de SQL" permet de créer trois types de vues : - Une "Vue" est stockée dans la base de données et est régénérée lorsqu'elle fait l'objet d'une requête - Une "Vue Matérialisée" est stockée dans la base de données et ses résultats sont mis en cache dans la base de données - Une "Requête" n'est pas stockée dans la base de données
Enfin, la "requête SQL" doit contenir la définition de la vue SQL.
Only SQL "SELECT" statements are allowed and certain sensitive tables (i.e., user information) are not accessible.
Press "Save" to store the SQL view definition. If you created a "View" or a "Materialized View", you must also run Run query to finish the creation of the SQL view.
Keep in mind that the columns returned by the used SELECT statement become table columns, that means they must be of a valid table column type. When functions are used it might be necessary to explicitly cast the result to a type by adding ::{TYPE} after the function.
Par exemple, au lieu de jsonb_chacun (qui renverrait un type d'enregistrement qui ne peut pas être un type de colonne) utilisez jsonb_chacun_texte et convertissez le résultat en texte, comme dans l'exemple ci-dessous :
sélectionnez jsonb_chacun_texte(donnéesévènements)::texte...
Vues SQL qui appellent d'autres vues SQL
If you wish to make a SQL view that can be called be other SQL views, then its SQL type must be either "View" or a "Materialized View" (not "Query"). It also must have Run query run on it before being called.
Par exemple, si vous avez créé une vue nommée Nombre d'éléments de données avec le type de SQL "Vue" et ce SQL :
sélectionnez nombre(*) comme nombre d'éléments de données ;
...then you could run Run query from the options menu and create a second SQL view named More than 100 data elements with this SQL:
sélectionnez le cas lorsque le nombre > 100 puis 1 sinon le résultat pour _voir_le nombre_d'élément_de données sera 0 ;
Gestion des vues SQL
In order to utilize the SQL views, simply click the view and from the options menu, choose Run query. Once the process is completed, you will be informed that a table has been created. The name of the table will be provided, and is composed from the "Description" attribute provided in the SQL view definition. Once the view has been generated, you can view it by clicking the view again, and selecting View results.
For Clone, see Common actions.
Tip
If you have a view which depends on another view, be careful about how the views are named. When analytics is run on the DHIS2 server, all views are dropped and then recreated: they are dropped in reverse alphabetical order and recreated in regular alphabetical order. So a view must come after the view it depends on alphabetically — for example "ViewB" can safely depend on "ViewA". If you name them the other way round, analytics may fail because the dependency will not exist yet when the dependent view is recreated.
Manage analytics table hooks
La fonctionnalité "Crochets du tableau analytique" de DHIS2 stocke le code SQL qui est exécuté au cours des différentes phases du processus de génération des tableaux analytiques.
Voir aussi /api/analyticsTableHooks dans la documentation du développeur.
Créer un nouveau crochet de tableau analytique
To create a new analytics table hook, open the Metadata Management app and click Other > Analytics table hooks in the left-hand sidebar, then click the + New button.
Cliquez sur "Sauvegarder" pour enregistrer le crochet.
Manage Locales
Il est possible de créer des emplacements personnalisés dans DHIS2. En plus des lieux disponibles dans le système, vous pouvez ajouter au système un emplacement personnalisé tel que "Anglais" et "Zambie". Cela vous permet de traduire les objets de métadonnées dans les langues locales, ou de tenir compte de légères variations entre pays utilisant une même définition des métadonnées.
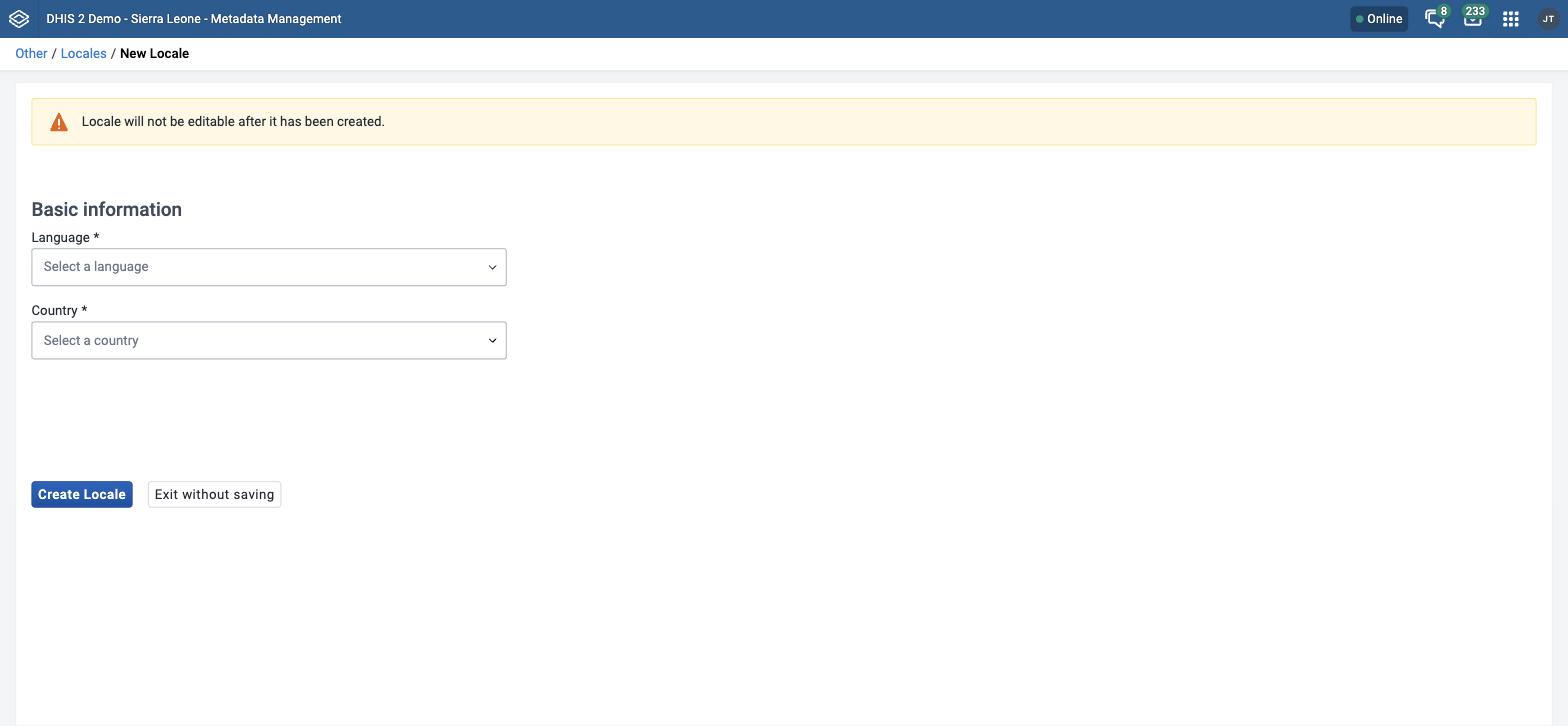
The locale is composed of a language along with a country. Open the Metadata Management app and click Other > Locales in the left-hand sidebar, then click the + New button. Select the desired values and click Create Locale. This custom locale will now be available as one of the translation locales in the system.
Note
A locale cannot be edited once created.
Manage group membership
The legacy Maintenance app had a separate Metadata group editor screen for adding objects to groups in bulk. The Metadata Management app does not have an equivalent screen, and one is not planned. Group membership is instead edited from whichever side of the relationship you happen to be working on, using the standard transfer list:
- One object into many groups — open the object's own edit screen and assign it to groups there. For example, the Data element groups field in Create or edit a data element puts one data element into as many data element groups as you need, without leaving the data element.
- Many objects into one group — open the group's edit screen and assign the members there. For example, Create or edit a data element group assigns any number of data elements to a single group in one pass.
The same pattern applies to the other grouped object types in this chapter: category option groups, indicator groups, organisation unit groups, option groups and predictor groups, and their corresponding group sets.
To see or change which objects are currently in a group, open the group's list from the left-hand sidebar — for example Data elements > Data element groups — and edit the group you want.
Tip
When you are assigning members to a group, use the Show only unassigned items checkbox above the Available list, where it is offered, to hide objects that already belong to another group of the same type. See Using a transfer list component.