
DHIS2 Documentation Team
Copyright © 2008-2021 DHIS2 Team
Dernière mise à jour: 2020-04-26
Warranty: THIS DOCUMENT IS PROVIDED BY THE AUTHORS ‘’AS IS’’ AND ANY EXPRESS OR IMPLIED WARRANTIES, INCLUDING, BUT NOT LIMITED TO, THE IMPLIED WARRANTIES OF MERCHANTABILITY AND FITNESS FOR A PARTICULAR PURPOSE ARE DISCLAIMED. IN NO EVENT SHALL THE AUTHORS OR CONTRIBUTORS BE LIABLE FOR ANY DIRECT, INDIRECT, INCIDENTAL, SPECIAL, EXEMPLARY, OR CONSEQUENTIAL DAMAGES (INCLUDING, BUT NOT LIMITED TO, PROCUREMENT OF SUBSTITUTE GOODS OR SERVICES; LOSS OF USE, DATA, OR PROFITS; OR BUSINESS INTERRUPTION) HOWEVER CAUSED AND ON ANY THEORY OF LIABILITY, WHETHER IN CONTRACT, STRICT LIABILITY, OR TORT (INCLUDING NEGLIGENCE OR OTHERWISE) ARISING IN ANY WAY OUT OF THE USE OF THIS MANUAL AND PRODUCTS MENTIONED HEREIN, EVEN IF ADVISED OF THE POSSIBILITY OF SUCH DAMAGE.
License: Permission is granted to copy, distribute and/or modify this document under the terms of the GNU Free Documentation License, Version 1.3 or any later version published by the Free Software Foundation; with no Invariant Sections, no Front-Cover Texts, and no Back-Cover Texts. A copy of the license is included in the source of this documentation, and is available here online: http://www.gnu.org/licenses/fdl.html
Après avoir lu ce chapitre, vous serez en mesure de comprendre:
What is DHIS2 and what purpose it serves with respect to health information systems (HIS)?
What are the major technological considerations when it comes to deploying DHIS2, and what are the options are for extending DHIS2 with new modules?
Quelle est la différence entre les données basées sur les patients et les données agrégées ?
What are some of the benefits and challenges with using Free and Open Source Software (FOSS) for HIS?
DHIS2 is a tool for collection, validation, analysis, and presentation of aggregate and patient-based statistical data, tailored (but not limited) to integrated health information management activities. It is a generic tool rather than a pre-configured database application, with an open meta-data model and a flexible user interface that allows the user to design the contents of a specific information system without the need for programming. DHIS2 is a modular web-based software package built with free and open source Java frameworks.
DHIS2 is open source software released under the BSD license and can be obtained at no cost. It runs on any platform with a Java Runtime Environment (JRE 7 or higher) installed.
DHIS2 is developed by the Health Information Systems Programme (HISP) as an open and globally distributed process with developers currently in India, Vietnam, Tanzania, Ireland, and Norway. The development is coordinated by the University of Oslo with support from NORAD and other donors.
The DHIS2 software is used in more than 40 countries in Africa, Asia, and Latin America, and countries that have adopted DHIS2 as their nation-wide HIS software include Kenya, Tanzania, Uganda, Rwanda, Ghana, Liberia, and Bangladesh. A rapidly increasing number of countries and organisations are starting up new deployments.
The documentation provided herewith, will attempt to provide a comprehensive overview of the application. Given the abstract nature of the application, this manual will not serve as a complete step-by-step guide of how to use the application in each and every circumstance, but rather will seek to provide illustrations and examples of how DHIS2 can be implemented in a variety of situations through generalized examples.
Before implementing DHIS2 in a new setting, we highly recommend reading the DHIS2 Implementation Guide (a separate manual from this one), also available at the main DHIS2 website.
Les principales caractéristiques et l'objectif du DHIS2 peuvent être résumés comme suit :
Provide a comprehensive data management solution based on data warehousing principles and a modular structure which can easily be customised to the different requirements of a management information system, supporting analysis at different levels of the organisational hierarchy.
Customisation and local adaptation through the user interface. No programming required to start using DHIS2 in a new setting (country, region, district etc.).
Provide data entry tools which can either be in the form of standard lists or tables, or can be customised to replicate paper forms.
Provide different kinds of tools for data validation and improvement of data quality.
Provide easy to use - one-click reports with charts and tables for selected indicators or summary reports using the design of the data collection tools. Allow for integration with popular external report design tools (e.g. JasperReports) to add more custom or advanced reports.
Flexible and dynamic (on-the-fly) data analysis in the analytics modules (i.e. GIS, PivotTables,Data Visualizer, Event reports, etc).
A user-specific dashboard for quick access to the relevant monitoring and evaluation tools including indicator charts and links to favourite reports, maps and other key resources in the system.
Easy to use user-interfaces for metadata management e.g. for adding/editing datasets or health facilities. No programming needed to set up the system in a new setting.
Fonctionnalité permettant de concevoir et de modifier des formules d'indicateurs calculés.
User management module for passwords, security, and fine-grained access control (user roles).
Messages can be sent to system users for feedback and notifications. Messages can also be delivered to email and SMS.
Users can share and discuss their data in charts and reports using Interpretations, enabling an active information-driven user community.
Functionalities of export-import of data and metadata, supporting synchronisation of offline installations as well as interoperability with other applications.
Using the DHIS2 Web-API , allow for integration with external software and extension of the core platform through the use of custom apps.
Further modules can be developed and integrated as per user needs, either as part of the DHIS2 portal user interface or a more loosely-coupled external application interacting through the DHIS2 Web-API.
In summary, DHIS2 provides a comprehensive HIS solution for the reporting and analysis needs of health information users at any level.
The wider context of HIS can be comprehensively described through the information cycle presented in Figure 1.1 below. The information cycle pictorially depicts the different components, stages and processes through which the data is collected, checked for quality, processed, analysed and used.

Le DHIS2 prend en charge les différentes facettes du cycle de l'information, notamment :
Collecte de données.
Effectuer des contrôles de qualité.
Accès aux données à plusieurs niveaux.
Rapports.
Réalisation de graphiques et de cartes ainsi que d'autres formes d'analyse.
Enabling comparison across time (for example, previous months) and space (for example, across facilities and districts).
See trends (displaying data in time series to see their min and max levels).
As a first step, DHIS2 serves as a data collection, recording and compilation tool, and all data (be it in numbers or text form) can be entered into it. Data entry can be done in lists of data elements or in customised user defined forms which can be developed to mimic paper based forms in order to ease the process of data entry.
As a next step, DHIS2 can be used to increase data quality. First, at the point of data entry, a check can be made to see if data falls within acceptable range levels of minimum and maximum values for any particular data element. Such checking, for example, can help to identify typing errors at the time of data entry. Further, user can define various validation rules, and DHIS2 can run the data through the validation rules to identify violations. These types of checks help to ensure that data entered into the system is of good quality from the start, and can be improved by the people who are most familiar with it.
When data has been entered and verified, DHIS2 can help to make different kinds of reports. The first kind are the routine reports that can be predefined, so that all those reports that need to be routine generated can be done on a click of a button. Further, DHIS2 can help in the generation of analytical reports through comparisons of for example indicators across facilities or over time. Graphs, maps, reports and health profiles are among the outputs that DHIS2 can produce, and these should routinely be produced, analysed, and acted upon by health managers.
DHIS2 can be perceived as a platform on several levels. First, the application database is designed ground-up with flexibility in mind. Data structures such as data elements, organisation units, forms and user roles can be defined completely freely through the application user interface. This makes it possible for the system to be adapted to a multitude of locale contexts and use-cases. We have seen that DHIS2 supports most major requirements for routine data capture and analysis emerging in country implementations. It also makes it possible for DHIS2 to serve as management system for domains such as logistics, labs and finance.
Second, due to the modular design of DHIS2 it can be extended with additional software modules or through custom apps. These software modules/apps can live side by side with the core modules of DHIS2 and can be integrated into the DHIS2 portal and menu system. This is a powerful feature as it makes it possible to extend the system with extra functionality when needed, typically for country specific requirements as earlier pointed out.
The downside of the software module extensibility is that it puts several constraints on the development process. The developers creating the extra functionality are limited to the DHIS2 technology in terms of programming language and software frameworks, in addition to the constraints put on the design of modules by the DHIS2 portal solution. Also, these modules must be included in the DHIS2 software when the software is built and deployed on the web server, not dynamically during run-time.
In order to overcome these limitations and achieve a looser coupling between the DHIS2 service layer and additional software artefacts, a REST-based API has been developed as part of DHIS2. This Web API complies with the rules of the REST architectural style. This implies that:
The Web API provides a navigable and machine-readable interface to the complete DHIS2 data model. For instance, one can access the full list of data elements, then navigate using the provided URL to a particular data element of interest, then navigate using the provided URL to the list of data sets which the data element is a member of.
(Meta) Data is accessed through a uniform interface (URLs) using plain HTTP requests. There are no fancy transport formats or protocols involved - just the well-tested, well-understood HTTP protocol which is the main building block of the Web today. This implies that third-party developers can develop software using the DHIS2 data model and data without knowing the DHIS2 2specific technology or complying with the DHIS2 design constraints.
All data including meta-data, reports, maps and charts, known as resources in REST terminology, can be retrieved in most of the popular representation formats of the Web of today, such as XML, JSON, PDF and PNG. These formats are widely supported in applications and programming languages and gives third-party developers a wide range of implementation options.
All computers have an Operating System (OS) to manage it and the programs running it. The operating system serves as the middle layer between the software application, such as DHIS2, and the hardware, such as the CPU and RAM. DHIS2 runs on the Java Virtual Machine, and can therefore run on any operating system which supports Java. Platform independence implies that the software application can run on ANY OS - Windows, Linux, Macintosh etc. DHIS2 is platform independent and thus can be used in many different contexts depending on the exact requirements of the operating system to be used.
Additionally, DHIS2 supports three major database management systems systems (DBMS). DHIS2 uses the Hibernate database abstraction framework and is compatible with the following database systems: PostgreSQL, MySQL and H2. PostgreSQL and MySQL are high-quality production ready databases, while H2 is a useful in-memory database for small-scale applications or development activities.
Lastly, and perhaps most importantly, since DHIS2 is a browser-based application, the only real requirement to interact with the system is with a web browser. DHIS2 supports most web browsers, although currently either Google Chrome, Mozilla Firefox or Opera are recommended.
DHIS2 is a network enabled application and can be accessed over the Internet, a local intranet as well as a locally installed system. The deployment alternatives for DHIS2 are in this chapter defined as i) offline deployment ii) online deployment and iii) hybrid deployment. The meaning and differences will be discussed in the following sections.
An off-line deployment implies that multiple standalone off-line instances are installed for end users, typically at the district level. The system is maintained primarily by the end users/district health officers who enters data and generate reports from the system running on their local server. The system will also typically be maintained by a national super-user team who pay regular visits to the district deployments. Data is moved upwards in the hierarchy by the end users producing data exchange files which are sent electronically by email or physically by mail or personal travel. (Note that the brief Internet connectivity required for sending emails does not qualify for being defined as on-line). This style of deployment has the obvious benefit that it works when appropriate Internet connectivity is not available. On the other side there are significant challenges with this style which are described in the following section.
Hardware: Running stand-alone systems requires advanced hardware in terms of servers and reliable power supply to be installed, usually at district level, all over the country. This requires appropriate funding for procurement and plan for long-term maintenance.
Software platform: Local installs implies a significant need for maintenance. From experience, the biggest challenge is viruses and other malware which tend to infect local installations in the long-run. The main reason is that end users utilize memory sticks for transporting data exchange files and documents between private computers, other workstations and the system running the application. Keeping anti-virus software and operating system patches up to date in an off-line environment are challenging and bad practices in terms of security are often adopted by end users. The preferred way to overcome this issue is to run a dedicated server for the application where no memory sticks are allowed and use an Linux based operating system which is not as prone for virus infections as MS Windows.
Software application: Being able to distribute new functionality and bug-fixes to the health information software to users are essential for maintenance and improvement of the system. Relying on the end users to perform software upgrades requires extensive training and a high level of competence on their side as upgrading software applications might a technically challenging task. Relying on a national super-user team to maintain the software implies a lot of travelling.
**Database maintenance:**A prerequisite for an efficient system is that all users enter data with a standardized meta-data set (data elements, forms etc). As with the previous point about software upgrades, distribution of changes to the meta-data set to numerous off-line installations requires end user competence if the updates are sent electronically or a well-organized super-user team. Failure to keep the meta-data set synchronized will lead to loss of ability to move data from the districts and/or an inconsistent national database since the data entered for instance at the district level will not be compatible with the data at the national level.
An on-line deployment implies that a single instance of the application is set up on a server connected to the Internet. All users (clients) connect to the on-line central server over the Internet using a web browser. This style of deployment is increasingly possible due to increased availability in (mobile) Internet coverage globally, as well as readily available and cheap cloud-computing resources. These developments make it possible to access on-line servers in even the most rural areas using mobile Internet modems (also referred to as dongles).
This on-line deployment style has huge positive implications for the implementation process and application maintenance compared to the traditional off-line standalone style:
Hardware: Hardware requirements on the end-user side are limited to a reasonably modern computer/laptop and Internet connectivity through a fixed line or a mobile modem. There is no need for a specialized server for each user, any Internet enabled computer will be sufficient. A server will be required for on-line deployments, but since there is only one (or several) servers which need to be procured and maintained, this is significantly simpler (and cheaper) than maintaining many separate servers is disparate locations. Given that cloud-computing resources continue to steadily decrease in price while increasing in computational power, setting up a powerful server in the cloud is far cheaper than procuring hardware.
Software platform: The end users only need a web browser to connect to the on-line server. All popular operating systems today are shipped with a web browser and there is no special requirement on what type or version. This means that if severe problems such as virus infections or software corruption occur one can always resort to re-formatting and installing the computer operating system or obtain a new computer/laptop. The user can continue with data entry where it was left and no data will be lost.
Software application: The central server deployment style means that the application can be upgraded and maintained in a centralized fashion. When new versions of the applications are released with new features and bug-fixes it can be deployed to the single on-line server. All changes will then be reflected on the client side the next time end users connect over the Internet. This obviously has a huge positive impact for the process of improving the system as new features can be distributed to users immediately, all users will be accessing the same application version, and bugs and issues can be sorted out and deployed on-the-fly.
**Database maintenance:**Similar to the previous point, changes to the meta-data can be done on the on-line server in a centralized fashion and will automatically propagate to all clients next time they connect to the server. This effectively removes the vast issues related to maintaining an upgraded and standardized meta-data set related to the traditional off-line deployment style. It is extremely convenient for instance during the initial database development phase and during the annual database revision processes as end users will be accessing a consistent and standardized database even when changes occur frequently.
This approach might be problematic in cases where Internet connectivity is volatile or missing in long periods of time. DHIS2 however has certain features which requires Internet connectivity to be available only part of the time for the system to work properly, such as offline data entry. In general however, DHIS2 does require Internet connectivity of some sort, but this is increasingly an easy problem to solve even in remote locations.
From the discussion so far one realizes that the on-line deployment style is favourable over the off-line style but requires decent Internet connectivity where it will be used. It is important to notice that the mentioned styles can co-exist in a common deployment. It is perfectly feasible to have on-line as well as off-line deployments within a single country. The general rule would be that districts and facilities should access the system on-line over the Internet where sufficient Internet connectivity exist, and off-line systems should be deployed to districts where this is not the case.
Defining decent Internet connectivity precisely is hard but as a rule of thumb the download speed should be minimum 10 Kbyte/second for the client and at least 1 Mbit/sec (dedicated) bandwidth for the server.
In this regard mobile Internet modems which can be connected to a computer or laptop and access the mobile network is an extremely capable and feasible solution. Mobile Internet coverage is increasing rapidly all over the world, often provide excellent connectivity at low prices and is a great alternative to local networks and poorly maintained fixed Internet lines. Getting in contact with national mobile network companies regarding post-paid subscriptions and potential large-order benefits can be a worthwhile effort. The network coverage for each network operator in the relevant country should be investigated when deciding which deployment approach to opt for as it might differ and cover different parts of the country.
The on-line deployment approach raises the question of where and how to host the server which will run the DHIS2 application. Typically there are several options:
L’hébergement interne au sein du Ministère de la Santé
L’hébergement par une société externe d'hébergement
Hosting through an external hosting company
The main reason for choosing the first option is often political motivation for having “physical ownership” of the database. This is perceived as important by many in order to “own” and control the data. There is also a wish to build local capacity for server administration related to sustainability of the project. This is often a donor-driven initiatives as it is perceived as a concrete and helpful mission.
Regarding the second option, some places a government data centre is constructed with a view to promoting and improving the use and accessibility of public data. Another reason is that a proliferation of internal server environments is very resource demanding and it is more effective to establish centralized infrastructure and capacity.
Regarding external hosting there is lately a move towards outsourcing the operation and administration of computer resources to an external provider, where those resources are accessed over the network, popularly referred to as “cloud computing” or “software as a service”. Those resources are typically accessed over the Internet using a web browser.
The primary goal for an on-line server deployment is provide long-term stable and high-performance accessibility to the intended services. When deciding which option to choose for server environment there are many aspects to consider:
Human capacity for server administration and operation. There must be human resources with general skills in server administration and in the specific technologies used for the application providing the services. Examples of such technologies are web servers and database management platforms.
Reliable solutions for automated backups, including local off-server and remote backup.
Stable connectivity and high network bandwidth for traffic to and from the server.
Une alimentation électrique stable, redondante.
Secure environment for the physical server regarding issues such as access, theft and fire.
Presence of a disaster recovery plan. This plan must contain a realistic strategy for making sure that the service will be only suffering short down-times in the events of hardware failures, network downtime and more.
Un matériel puissant et robuste.
All of these aspects must be covered in order to create an appropriate hosting environment. The hardware requirement is deliberately put last since there is a clear tendency to give it too much attention.
Looking back at the three main hosting options, experience from implementation missions in developing countries suggests that all of the hosting aspects are rarely present in option one and two at a feasible level. Reaching an acceptable level in all these aspects is challenging in terms of both human resources and money, especially when compared to the cost of option three. It has the benefit that is accommodates the mentioned political aspects and building local capacity for server administration, on the other hand can this be provided for in alternative ways.
Option three - external hosting - has the benefit that it supports all of the mentioned hosting aspects at a very affordable price. Several hosting providers - of virtual servers or software as a service - offer reliable services for running most kinds of applications. Example of such providers are Linode and Amazon Web Services. Administration of such servers happens over a network connection, which most often anyway is the case with local server administration. The physical location of the server in this case becomes irrelevant as that such providers offer services in most parts of the world. This solution is increasingly becoming the standard solution for hosting of application services. The aspect of building local capacity for server administration is compatible with this option since a local ICT team can be tasked with maintaining the externally hosted server, but with not being burdened with worrying about power supply and bandwidth constraints which usually exist outside of major data centres.
An approach for combining the benefits of external hosting with the need for local hosting and physical ownership is to use an external hosting provider for the primary transactional system, while mirroring this server to a locally hosted non-critical server which is used for read-only purposes such as data analysis and accessed over the intranet.
Patient data is data relating to a single patient, such as his/her diagnosis, name, age, earlier medical history etc. This data is typically based on a single patient-health care worker interaction. For instance, when a patient visits a health care clinic, a variety of details may be recorded, such as the patient's temperature, their weight, and various blood tests. Should this patient be diagnosed as having "Vitamin B 12 deficiency anaemia, unspecified" corresponding to ICD-10 code D51.9, this particular interaction might eventually get recorded as an instance of "Anaemia" in an aggregate based system. Patient based data is important when you want to track longitudinally the progress of a patient over time. For example, if we want to track how a patient is adhering to and responding to the process of TB treatment (typically taking place over 6-9 months), we would need patient based data.
Aggregated data is the consolidation of data relating to multiple patients, and therefore cannot be traced back to a specific patient. They are merely counts, such as incidences of Malaria, TB, or other diseases. Typically, the routine data that a health facility deals with is this kind of aggregated statistics, and is used for the generation of routine reports and indicators, and most importantly, strategic planning within the health system. Aggregate data cannot provide the type of detailed information which patient level data can, but is crucial for planning and guidance of the performance of health systems.
In between the two you have case-based data, or anonymous "patient" data. A lot of details can be collected about a specific health event without necessarily having to identify the patient it involved. Inpatient or outpatient visits, a new case of cholera, a maternal death etc. are common use-cases where one would like to collect a lot more detail that just adding to the total count of cases, or visits. This data is often collected in line-listing type of forms, or in more detailed audit forms. It is different from aggregate data in the sense that it contains many details about a specific event, whereas the aggregate data would count how many events of a certain type, e.g. how many outpatient visits with principal diagnosis "Malaria", or how many maternal deaths where the deceased did not attend ANC, or how many cholera outbreaks for children under 5 years. In DHIS2 this data is collected through programs of the type single event without registration.
Patient data is highly confidential and therefore must be protected so that no one other than doctors can get it. When in paper, it must be properly stored in a secure place. For computers, patient data needs secure systems with passwords, restrained access and audit logs.
Security concerns for aggregated data are not as crucial as for patient data, as it is usually impossible to identify a particular person to a aggregate statistic . However, data can still be misused and misinterpreted by others, and should not be distributed without adequate data dissemination policies in place.
Software carries the instructions that tell a computer how to operate. The human authored and human readable form of those instructions is called source code. Before the computer can actually execute the instructions, the source code must be translated into a machine readable (binary) format, called the object code. All distributed software includes the object code, but FOSS makes the source code available as well.
Proprietary software owners license their copyrighted object code to a user, which allows the user to run the program. FOSS programs, on the other hand, license both the object and the source code, permitting the user to run, modify and possibly redistribute the programs. With access to the source code, the users have the freedom to run the program for any purpose, redistribute, probe, adapt, learn from, customise the software to suit their needs, and release improvements to the public for the good of the community. Hence, some FOSS is also known as free software, where “free” refers, first and foremost, to the above freedoms rather than in the monetary sense of the word.
Within the public health sector, FOSS can potentially have a range of benefits, including:
Lower costs as it does not involve paying for prohibitive license costs.
Given the information needs for the health sector are constantly changing and evolving, there is a need for the user to have the freedom to make the changes as per the user requirements. This is often limited in proprietary systems.
Access to source code to enable integration and interoperability. In the health sector interoperability between different software applications is becoming increasingly important, meaning enabling two or more systems to communicate metadata and data. This work is a lot easier, and sometimes dependent on the source code being available to the developers that create the integration. This availability is often not possible in the case of proprietary software. And when it is, it comes at a high cost and contractual obligations.
FOSS applications like DHIS2 typically are supported by a global network of developers, and thus have access to cutting edge research and development knowledge.
The Data Entry app is where you manually enter aggregated data in DHIS2. You register data for an organisation unit, a period, and a set of data elements (data set) at a time. A data set often corresponds to a paper-based data collection tool. You configure the data sets in the Maintenance app.
Note
If a data set has both a section form and a custom form, the system displays the custom form during data entry. Users who enter data can't select which form they want to use. In web-based data entry the order of display preference is:
Custom form (if it exists)
Section form (if it exists)
Default form
Mobile devices do not support custom forms. In mobile-based data entry the order of display preference is:
Section form (if it exists)
Default form
When you close an organisation unit, you can't register or edit data to this organisation unit in the Data Entry app.

Ouvrez l'application Saisie de données.
In the organisation unit tree to the left, select an organisation unit.
Sélectionnez un Ensemble de données.
Sélectionnez une période.
The available periods are controlled by the period type of the data set (reporting frequency). You can jump a year back or forward by clicking Prev year or Next year.
Note
Depending on how you've configured the data entry form, you might have to enter additional information before you can open the date entry form. This can for example be a project derived from a category combination.
Saisir des données dans un formulaire de saisie.
Un champ vert signifie que la valeur a été sauvegardée par le système.
A grey field means that the field is disabled and you can't enter a value. The cursor will automatically jump to the next open field.
To move to the next field, press the Tab key or the Down Arrow key.
To move back to the previous field, press Shift+Tab or the Up Arrow key.
If you type in an invalid value, for example a character in a field that only accepts numeric values, you'll get a pop-up that explains the problem and the field will be coloured yellow (not saved) until you have corrected the value.
If you have defined a minimum maximum value range for the field and you enter a value that is outside this range, you'll get a pop-up message that says the value is out of range. The value remains unsaved until you've changed the value or updated the value range and then re-entered the value.
When you've filled in the form, click Run validation in the top right corner or below the data entry form.
All validation rules which involves data elements in the current data entry form (data set) are then run against the new data. If there are no violations of the validation rules, you'll see a message saying The data entry screen successfully passed validation. If there are validation violations, they will be presented in a list.
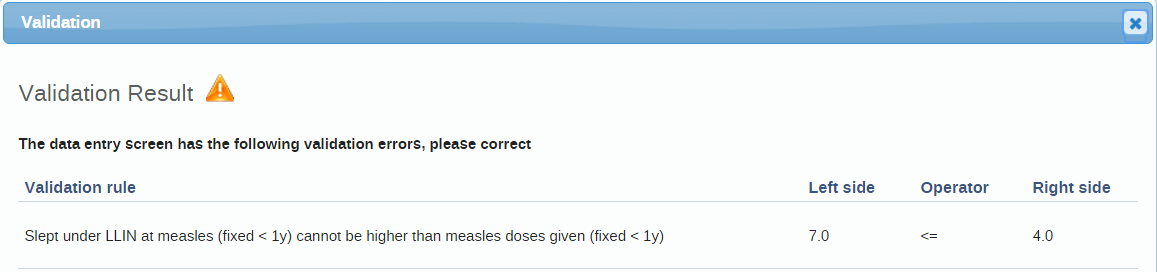
(Facultatif) Corriger les erreurs de validation.
Note
Zero (0) will delete the value if the data element has been configured to not store zeros.
When you've corrected errors and you're done with data entry, click Complete.
The system uses this information when generating completeness reports for district, county, province or the national level.
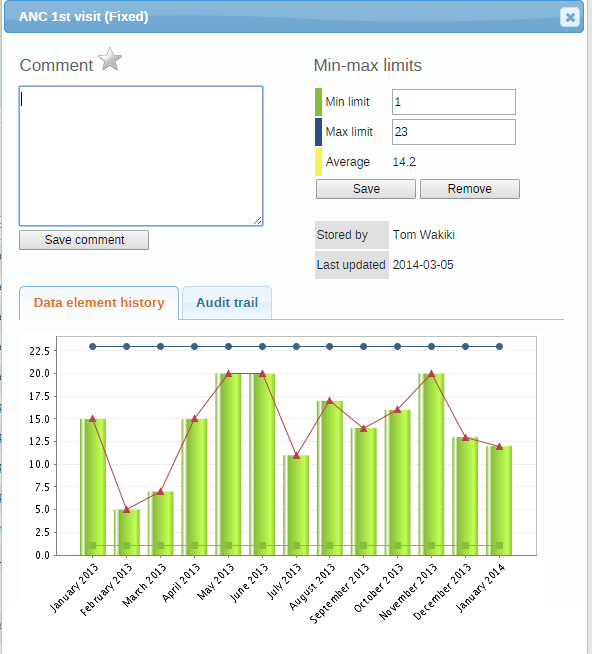
If you for example have a suspicious value that you need to investigate further, you can keep it the system, but mark it for follow-up. In the Data Quality app you can then run a follow-up analysis to view and correct all marked values.
Ouvrez l'application Saisie de données.
Ouvrez un formulaire de saisie existant.
Double-click the field with the value you want to mark for follow-up.
Appuyez sur l'icône étoile.
Ouvrez l'application Saisie de données.
Ouvrez un formulaire de saisie existant.
Cliquez sur Incomplet.
Modifiez les valeurs de données appropriées.
Note
Zero (0) will delete the value if the data element has been configured to not store zeros,
Cliquez sur Terminé.
Vous pouvez afficher les 12 dernières valeurs enregistrées pour un champ.
Ouvrez l'application Saisie de données.
Ouvrez un formulaire de saisie existant.
Double-click the field with the value you want to view the history for.
Cliquez sur Historique de l'élément de donnée.

The audit trail allows you to view other data values which have been entered prior to the current value. The audit trail also shows when the data value was altered and which user who made the changes.
Ouvrez l'application Saisie de données.
Ouvrez un formulaire de saisie existant.
Double-click the field with the value you want to view the audit trail for.
Cliquez sur Journal d'audit.

Dans l'application Saisie de données, ouvrez un formulaire de saisie.
Double-click the field for which you want to set the minimum maximum value range.
Entrez la limite Mini et la limite Maxi.
Cliquez sur Sauvegarder.
If values don't fall within the new value range the next time you enter data, the data entry cell will appear with an orange background.
(Optional) Type a comment to explain the reason for the discrepancy, for example an event at a facility which may have generated a large number of clients.
(Facultatif) Cliquez sur Enregistrer le commentaire.
Astuce
Cliquez sur l'icône étoile pour marquer la valeur en vue d'un suivi ultérieur.
The Data Entry app works even if you don't have a stable Internet connection during data entry. When you don't have an internet connection, the data you enter is saved to your local computer. When the Internet connection is back, the app will push the data to the server. The total bandwidth usage is reduced since data entry forms no longer are retrieved from the server for each rendering.
Note
To use this functionality, you must login to the server while you've an Internet connection.
When you're connected to the Internet, the app displays this message at the top of the data entry form:

If your Internet connection breaks during data entry, the app detects it and displays this message:

Now your data will be stored locally. You can continue to enter data as normal.
Once you have entered all necessary data and the app detects that the Internet connection is back, you'll see this message:

Cliquez sur Télécharger pour synchroniser les données avec le serveur.
When the data has successfully synchronized with the server, you'll see this confirmation message:


It can be useful to enter data for multiple organisation units in the same data entry form, for instance if there are few data elements in the form and a huge number of organisation units in the hierarchy. In that case, you can enable multi-organisation unit data entry.
Note
La saisie de données pour plusieurs unités d'organisation à la fois, fonctionne seulement avec les formulaires à section.
Ouvrez l'application paramètres système.
Sélectionnez Activer les formulaires de plusieurs unités d'organisation.
In the Data Entry app, select the organisation unit immediately above the organisation unit you want to enter data for in the organisation unit hierarchy.
Data elements will appear as columns and organisation units as rows in the form.
Note
The data entry forms should still be assigned to the facilities that you actually enter data for, that is the organisation units now appearing in the form.
L'application Saisie remplace l'application Saisie d'événements. L'idée est d'intégrer à l'avenir les applications Saisie Tracker et Saisie de données dans l'application Saisie.
Dans l'application Saisie d'événements, vous pouvez enregistrez des événements qui se sont produits à un moment et un endroit précis. Un événement peut se produire à n'importe quel moment. Cela contraste avec les données de routine, qui peuvent être saisies à intervalles réguliers prédéfinis. Les événements sont parfois appelés cas ou enregistrements. Dans le DHIS2, les événements sont liés à un programme. L'application Saisie d'événements vous permet de sélectionner l'unité d'organisation et le programme et de spécifier une date à laquelle un événement s'est produit, avant de saisir les informations relatives à l'événement.
Ouvrez l'application Capture.
Sélectionnez une unité d'organisation.
Sélectionnez un programme.
You'll only see programs associated with the selected organisation unit and programs you've access to, and that is shared with your user group through data level sharing.
Si le programme comporte une combinaison de catégories, l'option de catégorie devra être sélectionnée.
Cliquez sur Nouveau.

Remplissez les informations requises. If the programs program stage is configured to capture a location:
If the field is a coordinate field you can either enter the coordinates directly or you can click the map icon to the left of the coordinate field. The latter one will open a map where you can search for a location or set on directly by clicking on the map.
If the field is a polygon field you can click the map icon to the left of the field. This will open a map where you can search for a location and capture a polygon (button in the upper rigth corner of the map).
Si vous le souhaitez, vous pouvez ajouter un commentaire en cliquant sur le bouton Ecrire un commentaire au bas du formulaire.
If desired you can add a relationship by clicking the Add relationship button at the bottom of the form. See the section about Adding a relationship for more information.
Cliquez sur ** Enregistrer et quitter** ou cliquez sur la flèche située à côté du bouton pour sélectionner ** Enregistrer et ajouter un autre**.
Note 1: Some data elements in an event might be mandatory (marked with a red star next to the data element lable). What this means is that all mandatory data elements must be filled in before the user is allowed to complete the event. The exception to this is if the user has the authority called "Ignore validation of required fields in Tracker and Event Capture". If the user has this authority, the mandatory data elements will not be required to be filled in before saving and the red star will not be displayed next to the data element lable. Note that super user that have the "ALL" authority automatically have this authority.
Note 2: The data entry form can also be diaplayed in row view. In this mode the data elements are arranged horizontally. This can be achived by clicking the Switch to row view button on the top right of the data entry form. If you are currently in row view you can switch to the default form view by clicking the Switch to form view button on the top right of the data entry form.
Relationships can be added either during registration, editing or viewing of an event. Currently the Capture App only supports Event to Tracked Entity Instance relationships.
Lorsque vous ouvrez un événement, cliquez sur Ajouter une relation.
Sélectionnez le type de relation que vous souhaitez créer.
Vous avez maintenant deux options : Lier à une instance d'entité suivie existante ou Créer une nouvelle instance d'entité suivie.

Cliquez sur Lier à une instance d'entité suivie existante.
You should now be presented with some options for searching for a Tracked Entity Instance. You have the option to select a program. If a program is selected the attributes are derived from the selected program. If no program is selected, only the attributes that belong to the Tracked Entity Instance will be visible.

- If the **Tracked Entity Instance** or **program** is configured with a unique attribute, this attribute can be
  used for finding a specific **Tracked Entity Instance** or **program**. This attribute should be presented alone.
  When the unique attribute field has been filled out, click the **Search** button located right below
  the unique attribute field.

- If the **Tracked Entity Instance** or **program** has attibutes these can be used for searching by expanding the **Search by attributes** box.
  When all desired attribute fields have been filled out, click the **Search by attributes** button located at the bottom. You can also limit the search by setting the **Organisation unit scope**. If set to *All accessible* you will search for the **Tracked Entity Instance** in all organisation units you have access to. If you select *Selected*, you will be asked to select which organisation units to search within.
After a successful search you will be presented with a list of Tracked Entity Instances matching the search criteria. To create a relationship click the Link button on the Tracked Entity Instance you would like to create a relationship to.
If you did not find the Tracked Entity Instance you were looking for, you can either click the New search or Edit search buttons. New search will take you to new blank search while Edit search will take you back to the search you just performed keeping the search criteria.
Cliquez sur Créer une nouvelle instance d'entité suivie.
You are now presented with a form for registering a new Tracked Entity Instance. You can choose to either register with or without a program. If a program is selected, the new Tracked Entity Instance will be enrolled in said program. You can also change the Organisation unit by removing the one that is automatically set and selecting a new one.

Remplissez les attributs souhaités (et éventuellement obligatoires) ainsi que les détails de l'inscription.
Cliquez sur Créer une nouvelle instance d'entité suivie et un lien.
Note: When filling in data you might face a warning telling you that a possible duplicate has been found. You can click the warning to see these duplicates and if the duplicate is a match you can choose to link that Tracked Entity Instance by clicking the Link button. If the warning is still present when you are done filling in data, you will not see the Create Tracked Entity Instance and Link button. Instead you will be pressented with a button called Review duplicates. When you click this button a list of possible duplicates will be displayed. If any of these duplicates matches the Tracked Entity Instance you are trying to create you can click the Link button, if not you can click the Save as new person button to register a new Tracked Entity Instance.
Ouvrez l'application Capture.
Sélectionnez une unité d'organisation.
Sélectionnez un programme.
Tous les événements inscrits au programme sélectionné apparaissent dans une liste.
Cliquez sur l'événement que vous souhaitez modifier.
Cliquez sur le bouton Modifier l'événement.
Modifiez les détails de l'événement et cliquez sur Sauvegarder.
Ouvrez l'application Capture.
Sélectionnez une unité d'organisation.
Sélectionnez un programme.
Tous les événements inscrits au programme sélectionné apparaissent dans une liste.
Cliquez sur l'icône triple point sur l'événement que vous souhaitez supprimer.
Dans le menu qui s'affiche, cliquez sur Supprimer l'événement.

You can select which columns to show or hide in an event list. This can be useful for example when you have a long list of data elements assigned to a program stage.
Ouvrez l'application Capture.
Sélectionnez une unité d'organisation.
Sélectionnez un programme.
Tous les événements inscrits au programme sélectionné apparaissent dans une liste.
Cliquez sur l'icône de l' engrenage en haut à droite de la liste des événements.
Sélectionnez les colonnes que vous souhaitez afficher et cliquez sur Enregistrer.

N.B. : Vous pouvez réorganiser l'ordre des éléments de données en les faisant glisser et en les déposant dans la liste.
Ouvrez l'application Capture.
Sélectionnez une unité d'organisation.
Sélectionnez un programme.
Tous les événements inscrits au programme sélectionné apparaissent dans une liste.
En haut de la liste des événements se trouvent des boutons portant les mêmes noms que les en-têtes de colonne de la liste.
Utilisez les boutons en haut de la liste pour effectuer le filtrage sur la base d'une date de rapport ou d'un élément de donnée spécifique.

N.B. : Les éléments de données seront filtrés de manière légèrement différente. Un élément de donnée Nombre affichera par exemple un rang à filtrer tandis qu'un élément de donnée Texte vous demandera d'entrer une requête de recherche à filtrer.
Ouvrez l'application Capture.
Sélectionnez une unité d'organisation.
Sélectionnez un programme. Tous les événements inscrits au programme sélectionné apparaissent dans une liste.
Cliquez sur l'un des en-têtes de colonne pour trier la liste de cet élément de donnée par ordre croissant.
Une petite flèche vers le haut s'affiche à côté de la colonne pour indiquer que la liste est triée par ordre croissant.
Une petite flèche vers le bas s'affiche à côté de la colonne pour indiquer que la liste est triée par ordre décroissant.

Ouvrez l'application Capture.
Sélectionnez une unité d'organisation.
Sélectionnez un programme. Tous les événements inscrits au programme sélectionné apparaissent dans une liste.
Cliquez sur l'icône flèche vers le bas en haut à droite de la liste des événements.
Sélectionnez le format que vous souhaitez télécharger.

N.B. : Vous pouvez télécharger une liste d'événements aux formats JSON, XML ou CSV.
Les listes de travail sont des modèles de listes avec des filtres, des colonnes et un ordre de tri des événements prédéfinis.
Sélectionnez une unité d'organisation.
Sélectionnez un programme auquel est associée une liste de travail.
Les modèles de liste de travail devraient être disponibles au-dessus de la liste d'événements elle-même.

Cliquez sur le bouton d'un modèle de liste de travail pour l'activer.

Les événements peuvent être attribués aux utilisateurs. Cette fonction doit être activée par programme.
Sélectionnez une unité d'organisation et un programme dont l'affectation des utilisateurs est activée.
Cliquez sur Nouvel événement dans le coin supérieur droit.
Vous trouverez la section sur le cessionnaire au bas de la page de saisie des données. Recherchez et sélectionnez l'utilisateur auquel vous souhaitez attribuer l'événement. Le cessionnaire sera préservé lorsque vous sauvegarderez l'événement.


Sélectionnez une unité d'organisation et un programme dont l'affectation des utilisateurs est activée.
Cliquez sur un événement dans la liste
Dans la colonne de droite, vous trouverez la section sur les cessionnaires.

Cliquez sur le bouton "Modifier", ou sur le bouton Attribuer si l'événement n'a pas encore d'attributaire.


Recherchez et sélectionnez l'utilisateur auquel vous souhaitez réattribuer l'événement. L'attribution est alors enregistrée immédiatement.
Dans la liste des événements, vous pourrez consulter le nom de l'attributaire par événement. De plus, vous pouvez trier et filtrer la liste en fonction de l'attributaire.
Cliquez sur le filtre Attribué à.

Sélectionnez votre filtre d'affectation préféré, puis cliquez sur mettre à jour.

L'application Saisie ne prend pas encore en charge les programmes Tracker, mais ceux-ci sont toujours répertoriés. Si vous sélectionnez un programme Tracker, l'application vous dirigera vers l'application Saisie Tracker comme indiqué ci-dessous.


In the Event Capture app you register events that occurred at a particular time and place. An event can happen at any given point in time. This stands in contrast to routine data, which can be captured for predefined, regular intervals. Events are sometimes called cases or records. In DHIS2, events are linked to a program. The Event Capture app lets you select the organisation unit and program and specify a date when a event happened, before entering information for the event.
The Event Capture app works online and offline. If the Internet connectivity drops, you can continue to capture events. The events will be stored locally in your web browser (client). When connectivity has returned, the system will ask you to upload the locally stored data. The system then sends the data to the server where the data is stored.
Note
If you close the web browser while in offline mode, it is not possible to reopen a new web browser window and continue the working session. However the data will still be saved locally and can be uploaded to the server the next time the machine is online and the you have logged into the server.
You only see programs associated with the organisation unit you've selected and programs you've access to view through your user role.
Both skip-logic and validation error/warning messages are supported during registration.
When you close an organisation unit, you can't register or edit events to this organisation unit in the Event Capture app. You can still view and filter the event list and view the details of an event.
On-the-fly indicator expression evaluation is supported. If a program has indicators defined for it and the moment all values related to the indicator expression are filled, the system will calculate indicator and display the result.

Sorting: this can be done by clicking the sorting icon of each column header. A red sorting icon implies the current sorting column. However, the sorting functionality works only within the page displayed. Currently, it is not possible to do sorting from serverside.
Filtering: this is done by clicking the small search icon shown to the right of each column header. Clicking them provides an input field to type a filtering criteria. The system starts applying the filter the moment a user starts to type. During filtering it is possible to define start and end dates for date type data elements and lower and upper limits for number types. Server side filtering is not-support at the moment.
Ouvrez l'application Saisie d'évènements.
Sélectionnez une unité d'organisation.
Sélectionnez un programme.
You'll only see programs associated with the selected organisation unit and programs you've access to through your user role.
Cliquez sur Enregistrer l'événement.
Choisissez une date.
Remplissez les informations requises.
If the program's program stage is configured to capture GPS coordinate, you can enter the coordinates in two ways:
Entrez les valeurs directement dans les champs correspondants.
Choose a location in a map. The map option also displays polygons and points that are defined for organisation units.
Cliquez sur Sauvegarder et ajouter un nouveau ou Sauvegarder et revenir en arrière.
Note: Some data elements in an event might be mandatory (marked with a red star next to the data element lable). What this means is that all mandatory data elements must be filled in before the user is allowed to save the event. The exception to this is if the user has the authority called "Ignore validation of required fields in Tracker and Event Capture". If the user has this authority, the mandatory data elements will not be required to be filled in before saving and the red star will not be displayed next to the data element lable. Note that super user that have the "ALL" authority automatically have this authority.
Ouvrez l'application Saisie d'évènements.
Sélectionnez une unité d'organisation.
Sélectionnez un programme.
Tous les événements inscrits au programme sélectionné apparaissent dans une liste.
Cliquez sur l'événement que vous souhaitez modifier et sélectionnez Modifier.
Modifiez les détails de l'événement et cliquez sur Mettre à jour.
The Edit in grid function allows you to edit a selected event within the table but only those columns (data elements) visible in the grid. If you need more columns, use Show/hide columns to specify which columns should be displayed in the list.
Ouvrez l'application Saisie d'évènements.
Sélectionnez une unité d'organisation.
Sélectionnez un programme.
Tous les événements inscrits au programme sélectionné apparaissent dans une liste.
Cliquez sur l'événement que vous souhaitez modifier et sélectionnez Modifier dans la grille.
Modifiez les détails de l'événement.
Cliquez sur un autre événement pour fermer le mode d'édition.
Vous pouvez partager un événement en mode édition via son adresse web.
Ouvrez l'application Saisie d'évènements.
Ouvrez l'événement que vous souhaitez partager en mode édition.
Copiez l'URL.
Make sure that the URL contains "event" and "ou" (organisation unit) parameters.
Paste the URL in the sharing method of your choice, for example an e-mail or a message within DHIS2.
If you're not logged in to DHIS2 when you click the link, you'll be asked to do so and then taken to the dashboard.
Ouvrez l'application Saisie d'évènements.
Sélectionnez une unité d'organisation.
Sélectionnez un programme.
Tous les événements inscrits au programme sélectionné apparaissent dans une liste.
Cliquez sur un événement et sélectionnez Historique de l'audit.
Ouvrez l'application Saisie d'évènements.
Sélectionnez une unité d'organisation.
Sélectionnez un programme.
Tous les événements inscrits au programme sélectionné apparaissent dans une liste.
Cliquez sur un événement et sélectionnez Supprimer.
Cliquez sur Supprimer pour confirmer la suppression.
You can select which columns to show or hide in an event list. This can be useful for example when you have a long list of data elements assigned to a program stage. Once you've modified the layout, it's saved on your user profile. You can have different layouts for different programs.
Ouvrez l'application Saisie d'évènements.
Sélectionnez une unité d'organisation.
Sélectionnez un programme.
Tous les événements inscrits au programme sélectionné apparaissent dans une liste.
Cliquez sur l'icône Afficher/masquer les colonnes.
Sélectionnez les colonnes que vous souhaitez afficher et cliquez sur Fermer.
Ouvrez l'application Saisie d'évènements.
Sélectionnez une unité d'organisation.
Sélectionnez un programme.
Tous les événements inscrits au programme sélectionné apparaissent dans une liste.
Cliquez sur Imprimer la liste.
Ouvrez l'application Saisie d'évènements.
Sélectionnez une unité d'organisation.
Sélectionnez un programme.
Tous les événements inscrits au programme sélectionné apparaissent dans une liste.
Cliquez sur l'icône Télécharger et sélectionnez un format.
Vous pouvez télécharger une liste d'événements aux formats XML, JSON ou CSV.

The Tracker Capture app is an advanced version of the Event Capture app.
Event Capture: handles single events without registration
Tracker Capture: handles multiple events (including single event) with registration.
You capture event data for a registered tracked entity instance (TEI).
You only see programs associated with the organisation unit you've selected and programs you've access to view through your user role.
The options you see in the search and register functions depend on the program you've selected. The program attributes control these options. The attributes also decide the columns names in the TEI list.
Si vous ne sélectionnez pas un programme, le système choisit les attributs par défaut.
Both skip-logic and validation error/warning messages are supported during registration.
When you close an organisation unit, you can't register or edit events to this organisation unit in the Tracker Capture app. You can still search for TEIs and filter the search results. You can also view the dashboard of a particular TEI.
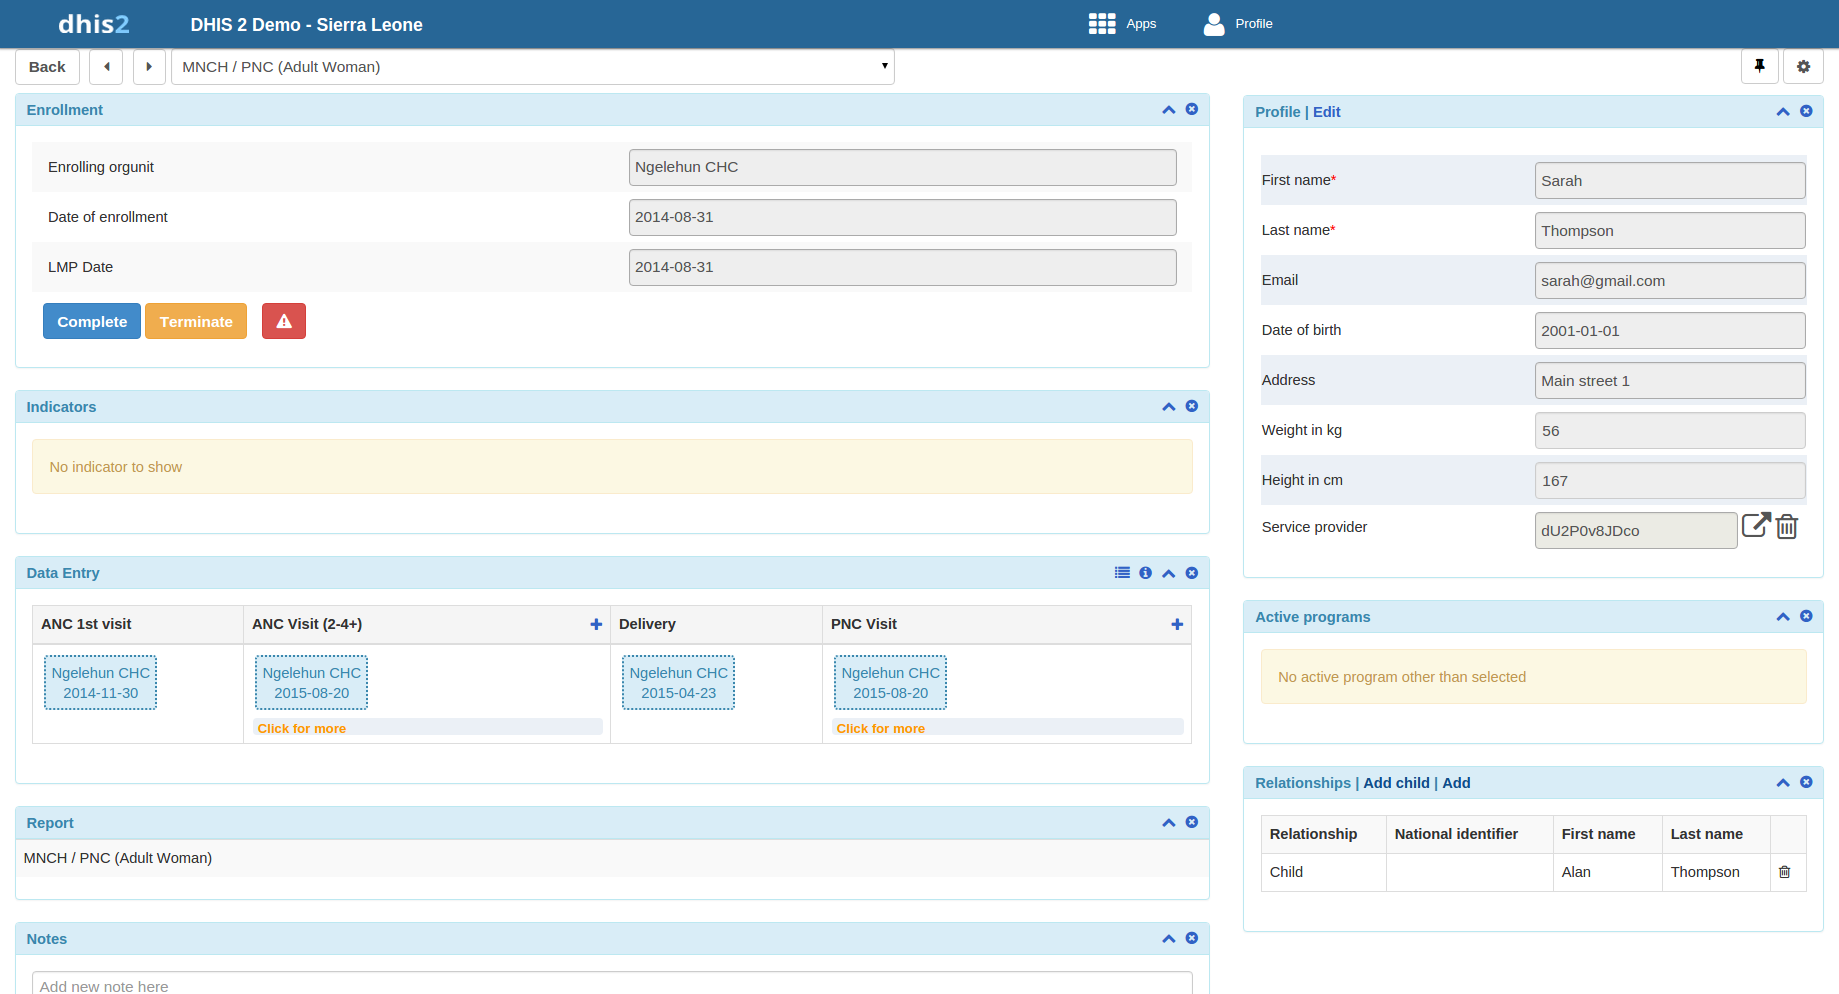
Vous pouvez gérer une TEI à partir de son tableau de bord dans l'application Saisie Tracker.
The dashboard consist of widgets. Drag and drop the widgets to place them in the order and in the position you want.
Click the pin icon to stick the right column of widgets to a fix position. This is useful especially during data entry.
If you have many data elements or big form to fill in, stick the right widget column. Then all the widgets you've placed in the right column remain visible while you scroll in the data entry part.
Any indicator defined for the program you've selected will have its value calculated and displayed in the Indicators widget.
Navigation :
Retour : vous ramène à la page de recherche et d'enregistrement
Previous and next buttons: takes you to the previous or next TEI dashboard in the TEI search results list
Working process of Mother and child health program

Créer une nouvelle TEI ou trouver une TEI existante.
Vous pouvez effectuer une recherche sur des attributs définis, par exemple le nom ou l'adresse.
Inscrire la TEI à un programme.
Based on the services of the program by the time, the app creates an activity plan for the TEI.
The TEI is provided with various services depending on the program. All services are recorded.
Utilisez les informations sur les cas individuels pour créer des rapports.
Vous pouvez partager une sélection de programmes sur l'"écran d'accueil".
Ouvrez l'application Saisie Tracker.
Sélectionnez le programme auquel vous voulez vous relier.
Copiez l'URL.
Paste the URL in the sharing method of your choice, for example an e-mail or a message within DHIS2.
Note: If the program does not exist in the selected organisation unit (that is stored in the local cache) the system will instead select the first available program for that organisation unit. If the local cache is empty/clean and the root organisation unit of the current user does not have the specified program, the system will also here select the first available program for the root organisation unit.
Vous pouvez partager un tableau de bord de la TEI via son adresse web.
Ouvrez l'application Saisie Tracker.
Ouvrez le tableau de bord que vous souhaitez partager.
Copiez l'URL.
Make sure that the URL contains "tei", "program" and "ou" (organisation unit) parameters.
Paste the URL in the sharing method of your choice, for example an e-mail or a message within DHIS2.
If you're not logged in to DHIS2 when you click the link, you'll be asked to do so and then taken to the dashboard.
Vous pouvez créer une TEI et l'inscrire à un programme à partir d'une seule opération :
Ouvrez l'application Saisie Tracker.
In the organisation unit tree in the left hand pane, select an comme complets pour l'ensemble de données dont il est question.
Sélectionnez un programme.
Cliquez sur Enregistrer.
Remplissez les informations requises.
Both tracked entity type and program can be configured to use a feature type. This makes it possible to capture geometry for either the TEI or the enrollment. Supported feature type is Point and Polygon. Please see How to use geometry.
If the selected program is configured to display first stage during registation, all mandatory fields in the stage will have to be filled in. At the end of the stage you will also be asked if you want to complete the stage that you have entered data for. If you select Yes, the stage will have the status completed once saved. If you select No, the stage will have the staus active.
If searching for program is configured, a background search will be performed on searchable fields to help you prevent registering duplicates. If there is any matching TEIs, a blue box will be displayed on the right side of the form with the possibility to view these matching TEIs.

If there is any matching TEIs, click Continue to review possible duplicates before registering a new one.
If there is no matching TEIs, click Save and continue or Save and add new
Save and continue: completes the registration and opens the registered TEI's dashboard
Save and add new: completes the registration but stays on the same page. Use this option when you want to register and enroll one TEI after another without enter data.
Note: All mandatory attributes have to be filled in to be able to save. Mandatory attributes are marked with a red star next to the attribute lable. If the user has the authority called "Ignore validation of required fields in Tracker and Event Capture" you will not be required to fill in the mandatory attributes and will not see the red star next to the attribute lable. Note that super user that have the "ALL" authority automatically have this authority.
There are multiple ways to find a TEI: Using the "Lists" which is predefined lists in the current selection, or "Search" for global lookup.
Lists is used to find and display TEIs in the selected organisation unit and program.
Ouvrez l'application Saisie Tracker
In the organisation unit tree in the left hand pane, select an organisation unit
Sélectionnez un programme
Cliquez sur le bouton "Listes" s'il n'est pas encore sélectionné
S'il n'est pas configuré, un ensemble de listes prédéfinies sera disponible :
Toute TEI ayant un statut d'inscription quelconque
Les TEI dont l'inscription au programme en cours est active
Les TEI dont l'inscription au programme en cours est terminée
Les TEI dont l'inscription au programme en cours a été annulée

You can select which columns to show or hide in the lists for each program. This will be saved in your user settings.
Cliquez sur le bouton de l'icône grille.
Cochez les colonnes que vous souhaitez inclure
Cliquez sur Enregistrer
There is also an option to create a custom working list with own filters. This can be used to create custom lists on the fly.

Les listes peuvent également être téléchargées ou imprimées.

If the program has any custom tracked entity filters associated with it, these will take the place of the four predefined lists mentioned above. The predefined lists will when well configured be an effective way to find or work with the data relevant for the user in that program.
Working lists can be defined with a wide variety of options, here are some examples:

See the API documentation for a full list of functionality supported for these predefined tracked entity instance filters.
Search is used to search for TEIs in the organisation units the user has search access to. This can be used if you want to find a TEI, but you dont know which organisation unit or program the TEI was enrolled in. There are two ways of doing this: With and without a program context. Searchable fields needs to be configured. For configuring searching with program context, this is done individually for each program in the program maintenance app. For configuring searching without a program context, this is done individually for each tracked entity type in the tracked entity type maintenance app.
Recherche sans contexte de programme:
Ouvrez l'application Saisie Tracker.
Cliquez sur le bouton Recherche.
Searchable fields will be displayed in groups. Unique attributes is only individually searchable. Non-unique attributes can be combined.
Remplissez les critères de recherche et cliquez sur le bouton de l'icône recherche.
Recherche dans le contexte d'un programme:
Ouvrez l'application Saisie Tracker.
Select an organisation unit which has the program you wish to search in
Sélectionnez le programme
Cliquez sur le bouton Recherche.
Searchable fields will be displayed in groups. Unique attributes is only individually searchable. Non-unique attributes can be combined.
Remplissez les critères de recherche et cliquez sur le bouton de l'icône recherche.

After the search has been done, you will be presented with the search result. Whats displayed depends on the outcome of the search.
Pour la recherche d'attributs uniques :
If no matching TEI found, you will get the possibility to open the registration form.
If the TEI was found in the selected organisation unit, the TEI dashboard will automatically open.
If the TEI was found in outside the selected organisation unit, you will get the possibility to open the TEI.
Pour la recherche d'attributs non-uniques :
If no matching TEI's found, you will get the possibility to open the registration form.
If matching TEI's found, you can either click on any TEI in the result list, or open the registration form.
If a too large number of matches was found, you will be prompted to refine your search criteria

The search results have functionality for flagging tracked entity instances as possible duplicates, see next chapter.
When choosing to open the registration form, the search values will automatically be filled into the registration form.
When searching for tracked entity instances in the tracker capture app, the user will sometimes suspect that one or more of the search hits are duplicates of other tracked entity instances. The user has the option of clicking on the flag possible duplicate link in the rightmost column of the search result grid.
Tracked entity instances flagged in this way will be marked as "possible duplicate" in the DHIS2 database. The flag indicates that the tracked entity instance is/has a duplicate. The presence of such a flag is visible to the user in two places. One is the result list itself (in this example Mark Robinson is already flagged as a potential duplicate):
L'autre endroit se trouve dans le tableau de bord des instances d'entités suivies :

In addition to informing users about the tracked entity instance potentially being a duplicate, the flag will be used by the underlying system for finding and merging duplicates in coming versions of DHIS2.
If the program is configured with access level protected, and the user searches and finds tracked entity instances that is owned by organisation unit that the user does not have data capture authority for, the user is presented with the option of breaking the glass. The user will gove a reason for breaking the glass, then gain temporary ownership of the tracked entity instance.
Ouvrez l'application Saisie Tracker.
Ouvrir un tableau de bord d'une TEI existante.
Sélectionnez un programme.
Dans le widget Enregistrement, cliquez sur Ajouter nouveau.
Enterez les informations requises et cliquez sur Inscrire.
In a TEI dashboard, you enter event data in the Timeline Data entry or Tabular data entry widgets.
Nom du widget | Description |
|---|---|
Calendrier Saisie des données | Pour la saisie de données à partir de formulaires par défaut ou personnalisés. En fonction de la définition du programme, en particulier des étapes du programme, les événements seront affichés dans les délais prévus. En cliquant sur l'un d'entre eux, vous pouvez alors afficher les données correspondantes. Si une étape nécessite un nouvel événement, une icône Plus s'affiche pour la création d'un nouvel événement. Pour procéder à la saisie des données, il est obligatoire d'avoir la date de l'événement. Une fois qu'une date d'événement est spécifiée, il n'est donc pas possible de modifier la date d'échéance. L'hypothèse est qu'en spécifiant une date d'événement, l'événement a déjà eu lieu. Si l'événement n'a pas encore eu lieu, il est possible de changer la date d'échéance - ce qui ne fait rien d'autre que de reprogrammer. Les boutons en bas de page permettent de modifier le statut d'un événement sélectionné. Une autre caractéristique clé de ce widget est l'ajout de plusieurs notes pour un événement. Normalement, l'enregistrement des données se fait par le biais d'éléments de données, mais il y a des cas où il est nécessaire d'enregistrer des informations ou des commentaires supplémentaires. C'est là que la section des notes s'avère pratique. Cependant, il n'est pas possible de supprimer une note. L'idée est que les notes ressemblent plus à des journaux de bord. Les messages d'erreur/avertissement de type "skip-logic" et "validation" sont pris en charge pendant la saisie des données. Le calendrier de saisie de données donne également la possibilité de comparer votre saisie de données aux saisies précédentes. Cette fonction peut être activée en cliquant sur le bouton "Passer au formulaire de comparaison" ; (Deux feuilles de papier) dans le coin supérieur droit du widget Calendrier de saisie des données. |
Saisie des données sous forme de tableau | Pour la saisie de données sous forme de tableau. Le widget affiche la liste des étapes du programme sous forme d'étiquettes sur le côté gauche. Les événements seront listés dans un tableau pour les étapes de programme reproductibles, et permet de modifier en ligne les valeurs de données des événements. |
Vous pouvez créer un événement pour une TEI en suivant les étapes suivantes :
Ouvrez l'application Saisie Tracker.
Ouvrir un tableau de bord d'une TEI existante.
In the Timeline Data entry or Tabular data entry widget, click the +-button.
Sélectionnez un Stade du programme et fixez une Date de rapport.
Program stages can be configured to use a feature type. This makes it possible to capture geometry for an event. Supported feature type is Point and Polygon. Please see How to use geometry.
Cliquez sur Sauvegarder.
Vous pouvez programmer un événement pour une date ultérieure en suivant les étapes suivantes :
Ouvrez l'application Saisie Tracker.
Ouvrir un tableau de bord d'une TEI existante.
In the Timeline Data entry or Tabular data entry widget, click the Calendar icon.
Sélectionnez un Stade du programme et fixez une Date prévue.
Cliquez sur Sauvegarder.
Sometimes it might be nessascary to refer a patient to a different Organisation unit. To refer a TEI:
Ouvrez l'application Saisie Tracker.
Ouvrir un tableau de bord d'une TEI existante.
In the Timeline Data entry or Tabular data entry widget, click the Arrow icon.
Select a Programstage, Organisation unit and set a ****Report date****.
Click either One-time referral which will only refer TEI for one single event or Move permanently which will move TEI ownership to the selected Organisation Unit. Further access to the TEI will be based on the ownership organisation unit.
Some data elements in an event might be mandatory (marked with a red star next to the data element lable). What this means is that all mandatory data elements must be filled in before the user is allowed to complete the event. The exception to this is if the user has the authority called "Ignore validation of required fields in Tracker and Event Capture". If the user has this authority, the mandatory data elements will not be required to be filled in before saving and the red star will not be displayed next to the data element lable. Note that super user that have the "ALL" authority automatically have this authority.
Tracked entity type, program and program stage can be configured to use a feature type. This makes it possible to capture geometry for a TEI, program or event. Supported feature types are Point and Polygon.
Option 1: Remplissez la latitude et la longitude dans le champ.
Option 2: 1. Cliquez sur l'icône carte. 2. Find the location you want by either searching or locating it on the map 3. Faites un clic droit sur l'endroit souhaité, et sélectionnez Définir les coordonnées. 4. Cliquez sur Capture en bas
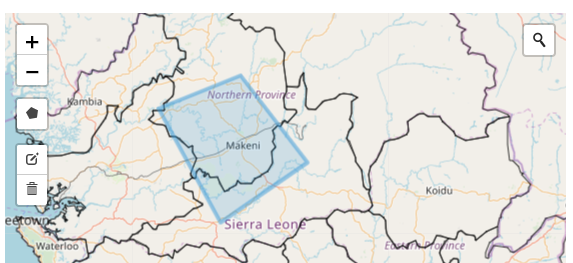
Les polygones peuvent également être supprimés 1. Cliquez sur l'icône carte. 2. Click the trash can icon at the left side of the map, and select Clear all
In the Maintenance App a program stage can be configured to allow user assignment. If user assignment is enabled, you will be able to assign a user to an event.
The Enrollment widget gives access to information and functionality for the enrollment in the selected program.

The current ownership of all enrollments in the selected program is displayed in the "Owned by" part of the enrollment widget. The ownership will always start out as the organisation unit that first enrolled the TEI into the given program.
Ownership can be different for a TEIS different programs, for example one clinic can follow up a patient in HIV, while another clinic follows up the same patient in MCH.
To update the ownership for a TEI/program combination, the user has to utilize the referral functionality and select the "Move permanently" option while referring.
A user that has capture access to the organisation unit that is the current owner of the TEI/Program will have write access to all enrollments for that TEI/Program combination. A user that has search access to the organisation unit that is the current owner will have access to search and find the TEI/Program combindation.
If you deactivate a TEI dashboard, the TEI becomes 'read-only'. You can't enter data, enroll the TEI or edit the TEI's profile.
Ouvrez l'application Saisie Tracker.
Ouvrir un tableau de bord d'une TEI existante.
Dans le widget Inscription, cliquez sur Désactiver.
Cliquez sur Oui pour confirmer.
Ouvrez l'application Saisie Tracker.
Ouvrir un tableau de bord d'une TEI existante.
Dans le widget Inscription, cliquez sur Activer.
Click Yes to confirm.
Ouvrez l'application Saisie Tracker.
Ouvrir un tableau de bord d'une TEI existante.
Dans le widget Inscription, cliquez sur Terminé.
Click Yes to confirm.
Ouvrez l'application Saisie Tracker.
Ouvrir un tableau de bord d'une TEI existante.
Dans le widget Inscription, cliquez sur Rouvrir.
Click Yes to confirm.
Ouvrez l'application Saisie Tracker.
Ouvrir un tableau de bord d'une TEI existante.
Dans le widget Profil, cliquez sur l'icône Historique de l'audit.
An enrollment note is useful to record information about for example why an enrollment was cancelled.
Ouvrez l'application Saisie Tracker.
Ouvrir un tableau de bord d'une TEI existante.
Dans le widget Notes, tapez votre note et cliquez sur Ajouter.
Ouvrez l'application Saisie Tracker.
Ouvrir un tableau de bord d'une TEI existante.
Dans le widget Messagerie, sélectionnez SMS ou E-mail.
Entrez les informations de contact requises.
If the TEI's profile contains an e-mail address or a phone number, these fields are filled in automatically.
Saisissez un message.
Cliquez sur Envoyer.
You can use mark a TEI's enrollment for follow-up and then use this status as a filter when you create Upcoming events and Overdue events reports. This can be useful for example to monitor high-risk cases during a pregnancy program.
Ouvrez l'application Saisie Tracker.
Ouvrir un tableau de bord d'une TEI existante.
Dans le widget Inscription, cliquez sur l'icône Marquer pour suivi.
You edit a TEI's profile or tracked entity attributes in the Profile widget.
Ouvrez l'application Saisie Tracker.
Ouvrir un tableau de bord d'une TEI existante.
Dans le widget Profil, cliquez sur Editer.
Modifiez le profil et cliquez sur Enregistrer.
You can create a relationship from one TEI to another, for example linking a mother and a child together or a husband and a wife. Depending on how the relationship type is configured, the relative can inherit attributes.
Assume there are two programs: Antenatal care for the mother and Immunization for the child. If first name, last name and address attributes are required for both programs, it is possible to configure last name and address attributes as inheritable. Then during child registration, there is no need to enter these inheritable attributes. You can add them automatically based on the mother's value. If you want to have a different value for the child, you can override the automatically generated value.
Ouvrez l'application Saisie Tracker.
Ouvrir un tableau de bord d'une TEI existante.
Dans le widget Relations, cliquez sur Ajouter.
Sélectionnez un type de relation.
Cherchez le parent et sélectionnez-le.
Cliquez sur Sauvegarder.
Note: If the relationship is a bi-directional relationship, the relationship will be displayed in the TEI that the relationship was created in and in the TEI that the relationship was linked to. Also, if the relationship is bi-directional, each end of the relationship will have a unique name that will be displayed in the relationship widget under the "Relationship" column.
Vous pouvez partager un tableau de bord de la TEI via son adresse web.
Ouvrez l'application Saisie Tracker.
Ouvrez le tableau de bord que vous souhaitez partager.
Copiez l'URL.
Make sure that the URL contains "tei", "program" and "ou" (organisation unit) parameters.
Paste the URL in the sharing method of your choice, for example an e-mail or a message within DHIS2.
If you're not logged in to DHIS2 when you click the link, you'll be asked to do so and then taken to the dashboard.
If you deactivate a TEI, the TEI becomes 'read-only'. Data associated with the TEI is not deleted.
Ouvrez l'application Saisie Tracker.
Ouvrir un tableau de bord d'une TEI existante.
In the top right corner, click the  button > Deactivate.
Cliquez sur Oui pour confirmer.
Ouvrez l'application Saisie Tracker.
Ouvrir un tableau de bord d'une TEI existante.
In the upper top corner, click the button > Activate.
Cliquez sur Oui pour confirmer.
Attention
Lorsque vous supprimez une TEI, vous supprimez également toutes les données associées à cette TEI.
Ouvrez l'application Saisie Tracker.
Ouvrir un tableau de bord d'une TEI existante.
In the top right corner, click the button > Delete.
Click Yes to confirm.
Ouvrez l'application Saisie Tracker.
Ouvrir un tableau de bord d'une TEI existante.
Cliquez sur l'icône Réglages, et sélectionnez Afficher/masquer les widgets.
Sélectionnez les widgets que vous souhaitez afficher ou masquer.
Cliquez sur Fermer
Vous pouvez sauvegarder la disposition du tableau de bord par défaut pour un programme.
Ouvrez l'application Saisie Tracker.
Ouvrir un tableau de bord d'une TEI existante.
Click the Settings icon, and select Save dashboard layout as default.
If you are the administrator you have the option of locking the layout of the dashboard for all users.
Ouvrez l'application Saisie Tracker.
Ouvrir un tableau de bord d'une TEI existante.
Organize the widgets to the desired layout and save it as default (see section above).
Click the Settings icon, and select Lock layout for all users.
Users will still be able to reorganize the widgets temporarily, but the layout will be reset to the admin's saved layout after page refresh. The remove widget buttons will be hidden when the dashboard layout is locked.
The top bar can be a helpful tool to see important data in a quick and easy way. To start using the top bar:
Ouvrez l'application Saisie Tracker.
Ouvrir un tableau de bord d'une TEI existante.
Cliquez sur l'icône Paramètres, et sélectionnez Paramètres de la barre supérieure.
Click Activate top bar and click the data you would like to display in the top bar.

Le widget Saisie de données chronologique dispose de 5 modes d'affichage de tableaux différents qui peuvent être sélectionnés. Les différentes options sont les suivantes : - Formulaire par défaut - Affiche tous les éléments de données verticalement.
Comparer le formulaire précédent - Affiche l'étape de programme précédente (reproduisible) à côté de l'étape de programme actuellement sélectionnée.
Comparer tout le formulaire - Affiche les stades du programme précédents (reproduisibles) à côté du stade du programme actuellement sélectionné.
Formulaire grille - Affiche les éléments de données horizontalement.
Formulaire POP-over - Identique au Formulaire grille, mais lorsqu'on clique dessus, les éléments de données s'affichent dans une nouvelle fenêtre.
Pour changer le mode d'affichage actuel, cliquez sur la deuxième icône dans la barre supérieure des widgets (voir image ci-dessous) :
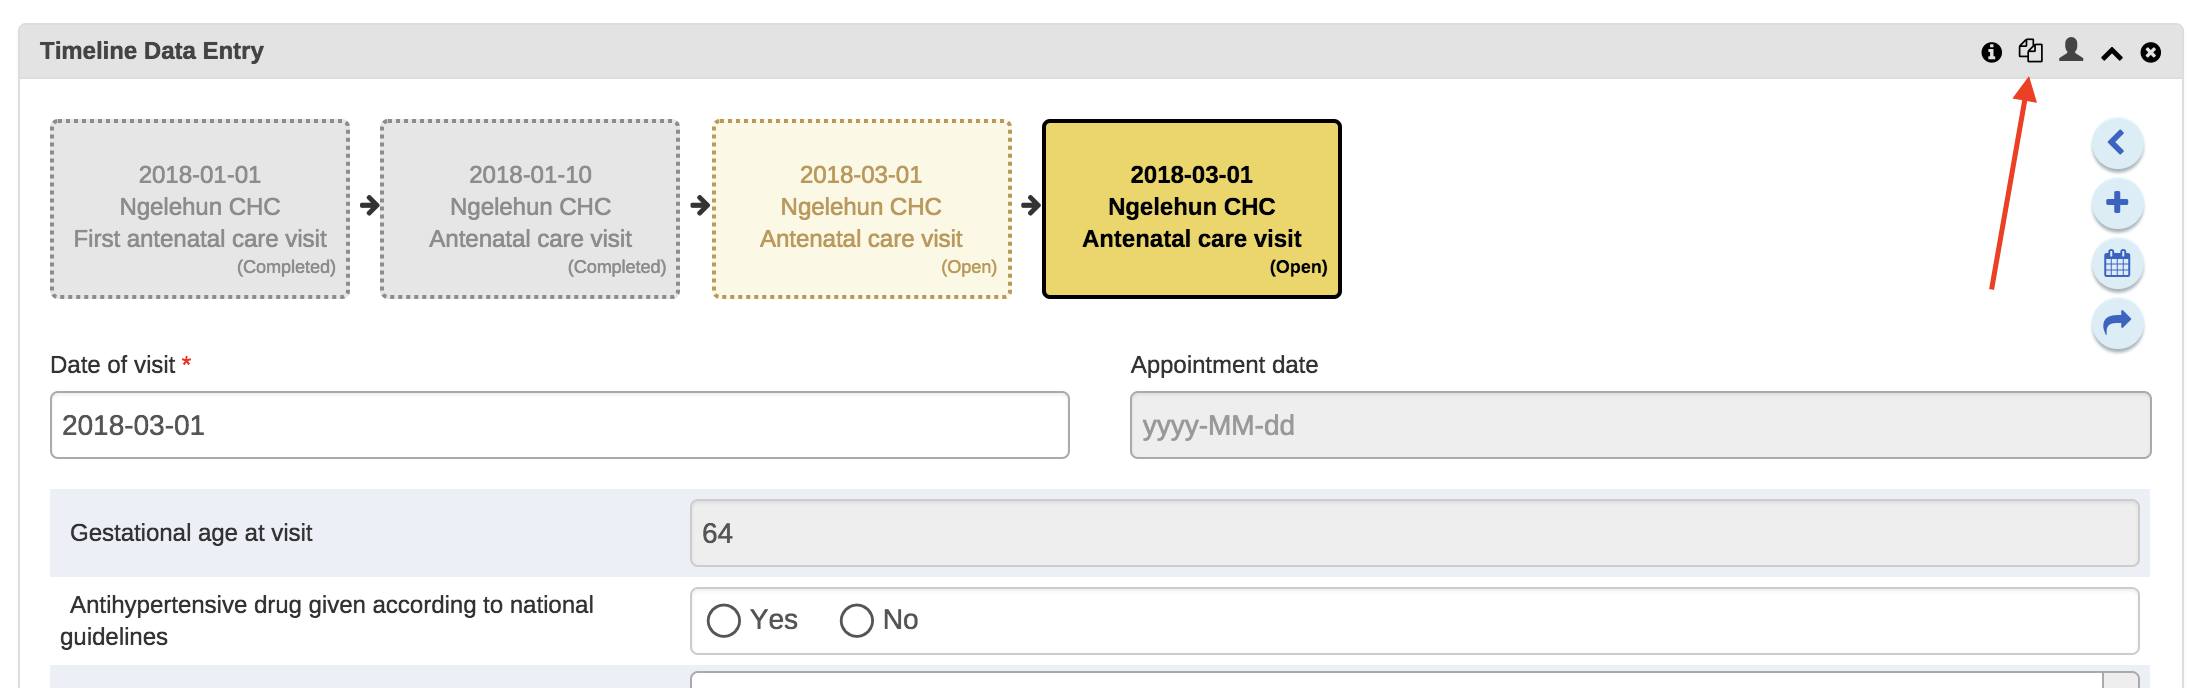
Une fois qu'une option est sélectionnée, la sélection est alors enregistrée pour cette étape spécifique du programme. Cela signifie que vous pouvez avoir différents modes de tableau pour les différentes étapes d'un programme.
Notes: 1. The **Compare form* options will function best if you have multipe repeatable events (of the same program stage) present.* 2. The **Grid form* and POP-over form options are not selectable if the program stage has more than 10 data elements.* 3. The icon in the widgets bar will change depending on the option you have selected.
Ouvrez l'application Saisie Tracker.
Cliquez sur Rapports.
Sélectionnez un type de rapport.
| Report type | Description |
|---|---|
Program summary | A summary report for a particular program, organisation unit and time frame. The report consist of a list of TEIs and their records organised based on program stages. |
Program statistics | A statistics report for a particular program. The report provides for example an overview of drop-outs or completion rates in a given time frame at a particular organisation unit. |
Upcoming events | A tabular report showing tracked entity instances and their upcoming events for a selected program and time. You can sort the columns and search the values. Show/hide operations are possible on the columns. You can also export the table to Microsoft Excel. |
Overdue events | A list of events for a selected program. The report displays a list of TEIs and their events that are not completed on time. You can sort the columns and search the values You can also export the table to Microsoft Excel. |

The summary report displays a list of TEIs and their records for "MNCH/PNC (Adult Woman)" program. The records are organized in the form of tabs where each tab is a program stage. The columns in the table are data elements which are configured to be displayed in reports under program stage definition.
DHIS2 has an optional feature that allows authorized users to approve data that has been entered. It allows data to be reviewed and approved at selected levels in the organisation unit hierarchy, so the approval follows the structure of the hierarchy from lower levels to higher levels.
Data is approved for a combination of (a) period, (b) organisation unit and © workflow. Data may be approved for the organisation unit for which it is entered, as well as for higher-level organisation units to which the data is aggregated. As part of system settings, you can choose the organisation unit level(s) at which data is approved. It can be approved at higher levels only after it has been approved for all that organisation unit's descendants at lower levels for the same workflow and period. When you approve a workflow, it approves data for any data sets that have been assigned to that workflow.
After a period, organisation unit and workflow combination has been approved, data sets associated with that workflow will be locked for that period and organisation unit, and any further data entry or modification will be prohibited unless it is first un-approved.
For example, the following diagram illustrates that data has already been approved for organisation units C and D, for a given period and workflow. It may now be approved for organisation unit B for the same period and workflow. But it is not ready to be approved for organization unit A. Before it can be approved for organisation unit A, it must be approved for B, and for any other children of organisation unit A, for that period and workflow.
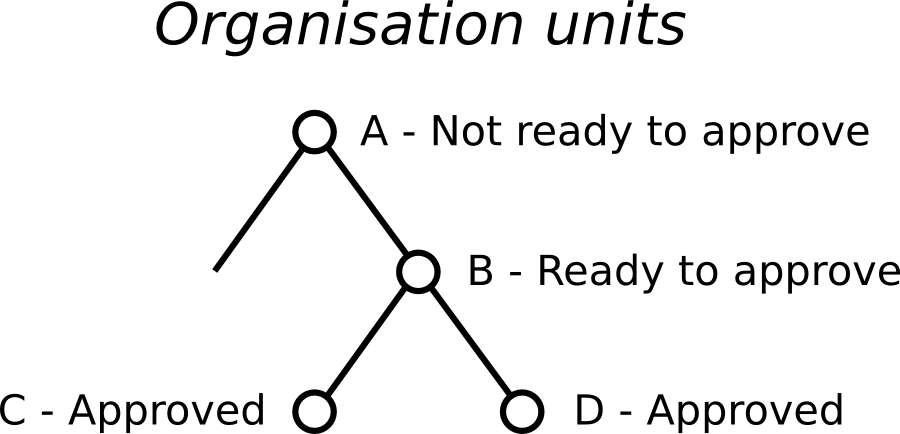
DHIS2 supports two different types of approval processes: either a one-step process where the data is approved at each level, or a two-step process where data is first approved and then accepted at each level. This is illustrated in the following diagram:

In the one-step process, data is approved at one level, and then approved at the next higher level. Until it is approved at the next higher level, it may be unapproved at the first level. (For example, if the data was approved my mistake, this allows the approver to undo their mistake.) Once the data is approved at the next higher level, it may not be unapproved at the lower level unless it is first unapproved at the higher level.
In the two-step process, data is approved at one level, and then the approval is accepted at the same level. This acceptance is done by a user who is authorized to approve data at the next higher level. Once the data is accepted, it may not be changed or unapproved unless it is first unaccepted.
The two-step process is not required by DHIS2. It is an optional step for a user reviewing data at the next higher level. It has the benefit of locking the acceptance from the level below, so reviewer does not have to worry that the data could be changing from below while it is being reviewed. It can also be used by the higher-level user to keep track of which lower-level data has already been reviewed.
Two-step process can be activated by checking Acceptance required before approval in SystemSettings app under General section.
To approve data, you must be assigned a role containing one of these authorities:
Approve data - You may approve data for the organisation unit(s) to which you are assigned. Note that this authority does not allow you to approve data for lower-levels below the organisation unit(s) to which you are assigned. This is useful to separate the users authorized to approve at one level from the users authorized to approve at levels below.
Approve data at lower levels - Allows you to approve data for all lower levels below the organisation units assigned to you. This is useful if, for example, you are a district-level user whose role includes approving the data for all the facilities within that district, but not for the district itself. If you are assigned this as well as the Approve data authority, you may approve data at the level of the organisation unit(s) to which you have been assigned, and for any level below.
Accept data at lower levels - Allows you to accept data for the level just below the organisation unit(s) assigned to you. This authority can be given to the same users as approve data. Or it may be given to different users, if you want to have some users who accept data from the level below, and a different set of users who approve data to go up to the next level above.
In the Maintenance app section under Data approval level you can specify the levels at which you want to approve data in the system. Click the Add new button on this page and select the organisation unit level at which you want approvals. It will be added to the list of approval settings. You may configure the system for approving data at every organisation unit level, or only at selected organisation unit levels.
Note that when you add a new approval level, you may optionally choose a Category option group set. This feature is discussed later in this chapter.
Also in maintenance under Data approval workflow, you can define the workflows that will be used for approving data. Each workflow can be associated with one or more approval levels. Any two workflows may operate at all the same approval levels as each other, some of the same and some different levels, or completely different levels.
If you want data for a data set to be approved according to a workflow, then assign the workflow to the data set when you add or edit the data set. If you do not want data for a data set to be subject to approval, then do not assign any workflow to that data set. For data sets that you want to approve at the same time as each other, assign them to the same workflow. For data sets that you want to approve independently, assign each data set to its own workflow.
On the System Approval Settings page, you may select the option Hide unapproved data in analytics to hide unapproved data in reports, pivot table, data visualizer and GIS. If this option is checked, unapproved data will be hidden from users assigned to higher-level organisation units compared to where approval is required. Users who are assigned to organisation units where data is ready for approval can still view the data, as can users assigned to higher-level organisation units if they have the Approve data at lower levels authority. If this option is not checked, then all data is shown whether approved or not.
If the option Hide unapproved data in analytics is enabled, data will be hidden from viewing by users associated with higher levels. When determining whether a data record should be hidden for a specific user, the system associates a user with a specific approval level and compares it to the level to which the data record has been approved up to. A user is associated with the approval level which matches the level of the organisation unit(s) she is linked to, or if no approvel level exists at that level, the next approval level linked to an organisation unit level below herself. A user will be allowed to see data which has been approved up to the level immediately below her associated approval level. The rationale behind this is that a user must be ablet to view the data that has been approved below so that she can eventually view and approve it herself.
Note that if the user has been granted the View unapproved data or the ALL authority she will be able to view data irrespective of the approval status.
Lets consider the following example: There are four organisation unit levels, with approval levels associated with level 2 and 4. User A at country level (1) gets associated with approval level 1 since the approval level exists at the same level as the organisation unit level. User B gets associated with approval level 2 since there is no approval level directly linked to her organisation unit level and approval level 2 is the immediate level below. User C gets associated with approval level 2. User D is below all approval levels which implies that she can see all data entered at or below her organisation unit level.

A partir de cet exemple, considérons quelques scénarios :
Data is entered at facility level: Only User D can see the data, as the data has not yet been approved at all.
Data is approved by User D at facility level: Data becomes visible to User C and User B, as the data is now approved at their level.
Data is approved by User C at district level: Data becomes visible to User A, as data is now approved at the level immediately below herself.
To approve data, go to Reports and choose Data Approval. When this report shows data that is configured for approval, it shows the approval status of the data in the report. The approval status will be one of the following:
Waiting for lower level org units to approve - This data is not yet ready to be approved, because it first needs to be approved for all the child organisation units to this organisation unit, for the same workflow and period.
Ready for approval - This data may now be approved by an authorized user.
Approuvé - Ces données ont déjà été approuvées.
Approved and accepted - This data has already been approved, and also accepted.
If the data you are viewing is in an approval state that can be acted upon, and if you have sufficient authority, one or more of the following actions will be available to you on the Data Approval form:
Approve - Approve data that has not yet been approved, or that was formerly approved and has been unapproved.
Unapprove - Return to an unapproved state data that has been approved or accepted.
Accepter - Accepter les données approuvées.
Unaccept - Return to an unaccepted (but still approved) state data that has been accepted.
In order to unapprove data for a given organisation unit, you must have the authority to approve data for that organisation unit or to approve data for a higher-level organisation unit to which that data is aggregated. The reason for this is as follows: If you are reviewing data for approval at a higher organisation unit level, you should consider whether the data at lower organisation units are reasonable. If all lower-level data looks good, you can approve the data at the higher level. If some lower-level data looks suspect, you can unapprove the data at the lower level. This allows the data to be reviewed again at the lower level, corrected if necessary, and re-approved up through the organisation unit levels according to the hierarchy.
When defining an approval level, you specify the organisation unit level at which data will be approved. You may also optionally specify a category option group set. This is useful if you are using category option groups to define additional dimensions of your data, and you want approvals to be based on these dimensions. The following examples illustrate how this can be done within a single category option group set, and by using multiple category option group sets.
For example, suppose you define a category option group set to represent NGOs who serve as healthcare partners at one or more organisation units. Each category option group within this set represents a different partner. The category option group for Partner 1 may group together category options (such as funding account codes) that are used by that partner as a dimension of the data. So data entered by Partner 1 is attributed to a category option in Partner 1's category option group. Whereas data entered by partner 2 is attributed to a category option in Partner 2's category option group:
| Ensemble de groupes d'options de catégorie | Groupe d'options de catégorie | Options de catégories |
|---|---|---|
| Partenaire | Partenaire 1 | Compte 1A, Compte 1B |
| Partenaire | Partenaire 2 | Compte 2A, Compte 2B |
Each partner could enter data for their accounts independently of the other, for the same or different workflows, at the same or different facilities. So for example, data can be entered and/or aggregated at the following levels for each partner, independently of each other:
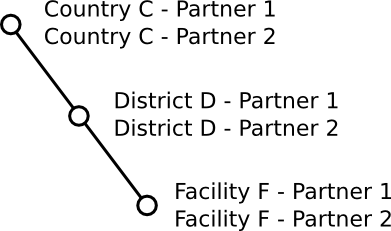
Tip
You can use the sharing feature on category options and category option groups to insure that a user can enter data (and/or see data) only for certain category options and groups. If you don't want users to see data that is aggregated beyond of their assigned category options and/or category option groups, you can assign Selected dimension restrictions for data analysis, when adding or updating a user.
You can optionally define approval levels for partner data within any or all of these organisation unit levels. For example, you could define any or all of the following approval levels:
| Niveau d'approbation | Niveau de l'unité d'organisation | Ensemble de groupes d'options de catégorie |
|---|---|---|
| 1 | Pays | Partenaire |
| 2 | District | Partenaire |
| 3 | Etablissement | Partenaire |
You can also define approval levels for different category option group sets. To continue the example, suppose that you have various agencies that manage the funding to the different partners. For example, Agency A funds accounts 1A and 2A, while Agency B funds accounts 1B and 2B. You could set up category option groups for Agency A, and Agency B, and make them both part of a category option group set called Agency. So you would have:
| Ensemble de groupes d'options de catégorie | Groupe d'options de catégorie | Options de catégorie |
|---|---|---|
| Partenaire | Partenaire 1 | Compte 1A, Compte 1B |
| Partenaire | Partenaire 2 | Compte 2A, Compte 2B |
| Agence | Agence A | Compte 1A, Compte 2A |
| Agence | Agence B | Compte 1B, Compte 2B |
Now suppose that at the country level, you want each partner to approve the data entered by that partner. Once this approval is done, you want each agency to then approve the data from accounts that are managed by that agency. Finally, you want to approve data at the country level across all agencies. You could do this by defining the following approval levels:
| Niveau d'approbation | Niveau d'unité d'organisation | Ensemble de groupes d'options de catégorie |
|---|---|---|
| 1 | Pays | |
| 2 | Pays | Agence |
| 3 | Pays | Partenaire |
Note that multiple approval levels can be defined for the same organisation unit level. In our example, Partner 1 would approve country-wide data at approval level 3 from category options Account 1A and Account 1B. Next, Agency A would approve country-wide data at approval level 2 from category options Account 1A (after approval by Partner 1) and Account 2A (after approval by Partner 2.) Finally, after approval from all agencies, country-wide data can be approved at approval level 1 across all category options. Note that approval level 1 does not specify a category option group set, meaning that it is for approving data across all category options.
This example is meant to be illustrative only. You may define as many category option groups as you need, and as many approval levels as you need at the same organisation unit level for different category option group sets.
If you have multiple approval levels for different category option group sets at the same organisation unit level, you may change the approval ordering in the Settings section, under System Approval Settings. Just click on the approval level you wish to move, and select Move up or Move down. If you have an approval level with no category option groups set, it must be the highest approval level for that organisation unit level.
L'application Rapports permet de produire des rapports standard, des rapports sur les ensembles de données, des rapports sur les ressources et des rapports sur la répartition des unités d'organisation.
You access the available reports by navigating to Apps->Reports (Beta). In the report menu in the left bar, click Standard Report. A list of all pre-defined reports will appear in the main window.

You run/view a report by clicking on the triple-dot icon of the report and then selecting "Create" from the contextual menu. If there are any pre-defined parameters, you will see a report parameter window where you must fill in the values needed for orgunit and/or reporting month, depending on what has been defined in the underlying report table(s). Click on "Generate Report" when you are ready. The report will either appear directly in your browser or be available as a PDF file for download, depending on your browser settings for handling PDF files. You can save the file and keep it locally on your computer for later use.
Dataset reports are printer friendly views of the data entry screen filled with either raw or aggregated data. These are only available for data sets that have custom data entry forms and not for default or section forms.
Vous pouvez accéder aux rapports d'ensembles de données depuis Apps->Rapports (Beta).
A Criteria window will appear where you fill in the details for your report:
Ensemble de données: L'ensemble de données que vous souhaitez afficher.
Report period: The actual period you want data for. This can be aggregated as well as raw periods. This means that you can ask for a quarterly or annual report even though the data set is collected monthly. A data set's period type (collection frequency) is defined in data set maintenance. First select the period type (Monthly, Quarterly, Yearly etc.) in the drop down next to Prev and Next buttons, and then select one of the available periods from the dropdown list below. Use Prev and Next to jump one year back or forward.
Use data for selected unit only: Use this option if you want a report for an orgunit that has children, but only want the data collected directly for this unit and not the data collected by its children. If you want a typical aggregated report for an orgunit you do not want to tick this option.
Report Organisation unit: Here you select the orgunit you want the report for. This can be at any level in the hierarchy as the data will be aggregated up to this level automatically (if you do not tick the option above).
When you are done filling in the report criteria you click on "Generate". The report will appear as HTML in a printer-friendly format. Use the print and save as functions in the browser to print or save (as HTML) the report.You can also export the data set report in Excel and PDF formats.
Access the reporting rate summary from the Apps->Reports (Beta) menu. Reporting rate summaries will show how many datasets (forms) that have been submitted by organisation unit and period.
The reporting rate is calculation is based on complete data set registrations. A complete data set registration refers to a user marking a data entry form as complete, typically by clicking the complete button in the data entry screen, hereby indicating to the system that she considers the form to be complete. This is i.e. a subjective approach to calculating completeness.
Le récapitulatif du taux de génération de rapports affichera pour chaque ligne un éventail de mesures spécifiques :
Actual reports: Indicates the number of data entry complete registrations for the relevant data set.
Expected reports: Indicates how many data entry complete registrations are expected. This number is based on the number of organisation units the relevant data set has been assigned to (enabled for data entry).
Reporting rate: The percentage of reports registered as complete based on the number expected.
Reports on time: Same as actual reports, only reports registered as complete within the maximum number of days after the end of the reporting period. This number of days after reporting period can be defined per data set in the data set management.
Reporting rate on time: Same as percentage, only reports registered as complete on time used as numerator.
Pour exécuter le rapport, vous pouvez suivre les étapes ci-dessous :
Sélectionnez une unité d'organisation dans l'arborescence.
Sélectionnez un ensemble de données.
Select a period type and a period from the list of available periods for that period type.
The report will then be rendered. Change any of the parameters above and click "Get report" again see the corresponding results.

The resource tool allows you to upload both files from your local computer to the DHIS server and to add links to other resources on the Internet through URLs. If cloud storage is configured for your system, resources will be saved there.
Pour créer une nouvelle ressource :
Ouvrez l'application Rapports (Beta) et cliquez sur Ressource.
Cliquez sur AJOUTER.
Entrez un Nom.
Sélectionnez un Type: Télécharger un fichier ou URL externe.
Cliquez sur Sauvegarder.
You can access the Orgunit Distribution reports from the left side menu in the Apps->Reports (Beta).
Orgunit distribution reports are reports that show how the orgunits are distributed on various properties like type and ownership, and by geographical areas.
Le résultat peut être présenté dans un rapport sous forme de tableau ou dans un graphique.
Exécuter un rapport:
To run a report first select an orgunit in the upper left side orgunit tree. The report will be based on orgunits located under the selected orgunit. The select the orgunit group set that you want to use, typically these are Type, Ownership, Rural/Urban, but can be any user-defined orgunit group set. The you can click on either Get Report to get the table-based presentation or Get chart to get the same result in a chart. You can also download the table-based report as Excel or CSV.

Lorsque vous ouvrez l'application data-visualizer à partir du menu dhis2, vous obtenez une ardoise vierge et vous pouvez commencer à créer votre visualisation immédiatement.

Sélectionnez le type de visualisation souhaité à l'aide du sélecteur situé dans le coin supérieur gauche :

From the dimension menu on the left you can select the dimension you want to show in your visualization, including data, period, organisation units and dynamic dimensions.

You can also change the selections by clicking on the chips in the layout area.
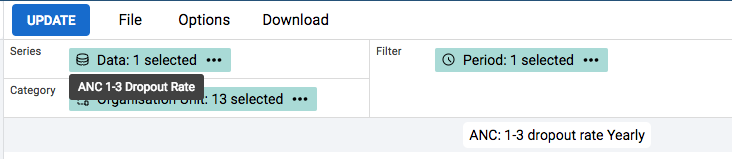
En combinant des données avec différentes échelles de mesure, vous obtiendrez une visualisation plus significative en ayant plus qu'un seul axe. Pour les graphiques à "colonnes", "barres" et "lignes", vous pouvez le faire en cliquant sur "Gérer les axes" dans le menu contextuel de la dimension série.

Dans la fenêtre de dialogue de gestion des axes, vous pouvez attribuer des éléments de données aux deux axes.

When viewing a visualization, you can expand the interpretations on the right side by clicking on the Interpretations button in the upper right corner. The visualization description will also be shown. The description suppots rich text format.
To view the visualization according to the date of a particular interpretation, click on the interpretation or its "View" button. This will regenerate the visualization with the relevant date, which is indicated next to the visualization title.

Clicking on "Back to all interpretations" or the "Exit View" button inside the interpretations panel will clear the interpretation and regenerate the visualization with the current date.
Il peut s'avérer parfois être de voir à quoi ressemblerait la visualisation sur une carte. Pour ce faire, vous pouvez sélectionner le type de visualisation "Ouvrir comme carte" après la création de votre visualisation.

With the Pivot Table app, you can create pivot tables based on all available data dimensions in DHIS2. A pivot table is a dynamic tool for data analysis which lets you summarize and arrange data according to its dimensions. Examples of data dimensions in DHIS2 are:
data dimension itself (for example data elements, indicators and events)
périodes (représentant la période de temps pour les données)
organisation hierarchy (representing the geographical location of the data)
From these dimensions you can freely select dimension items to include in the pivot table. You can create additional dimensions in DHIS2 with the group set functionality. This allows for different aggregation pathways, such as aggregation by "Partner" or facility type.
A pivot table can arrange data dimensions on columns, rows, and as filters. When you place a data dimension on columns, the pivot table will display one column per dimension item. If you place multiple data dimensions on columns, the pivot table displays one column for all combinations of the items in the selected dimensions. When you place a data dimension on rows, the pivot table displays one row per dimension item in a similar fashion. The dimensions you select as filters will not be included in the pivot table, but will aggregate and filter the table data based on the selected filter items.
Tip
You must select at least one dimension on columns or rows.
You must include at least one period.
Data element group sets and reporting rates can't appear in the same pivot table.
A pivot table can't contain more than the maximum number of analytic records which have been specified in the system settings. The maximum number of records could also be constrained by the maximum RAM which is available to your browser. You will be prompted with a warning if your requested table exceeds a particular size. From this prompt, you can either cancel the request or continue building the table. Consider making smaller tables instead of one table which displays all of your data elements and indicators together.
The Pivot Table app supports drill-down and up for periods and organisation unit. This means that you can for example drill down from yearly periods to quarters, months and weeks inside a pivot table. You can also drill down from the global organisation unit to countries, provinces and facilities.
Ouvrez l'application Tableau croisé dynamique.
In the menu to the left, select the dimension items you want to analyse, for example data elements or indicators.
Click Layout and arrange the data dimensions as columns, rows and filters.
Vous pouvez conserver la sélection par défaut si vous le souhaitez.
Cliquez sur Mettre à jour.
Dans cet exemple, les indicateurs sont répertoriés sous forme de colonnes et les périodes sous forme de lignes.
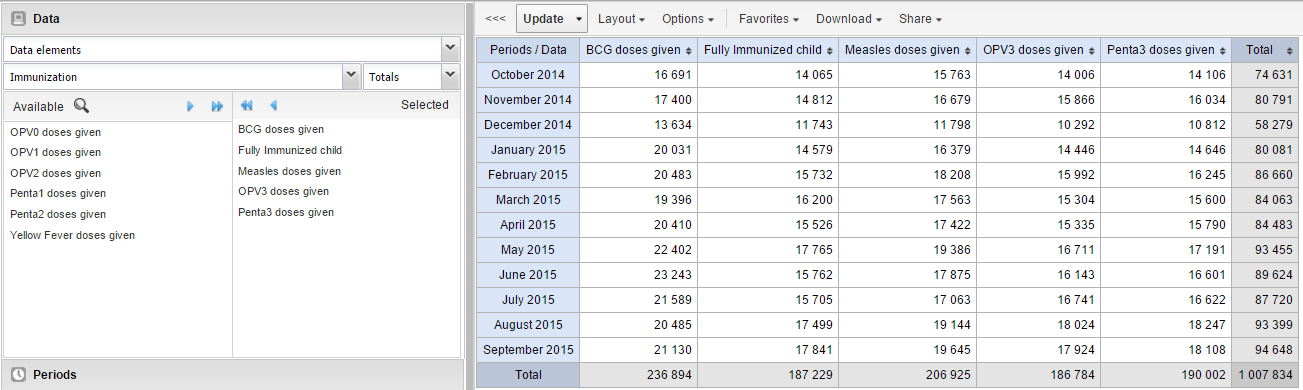
The left menu lists sections for all available data dimensions. From each section you can select any number of dimension items. As an example, you can open the section for data elements and select any number of data elements from the available list. You can select an item by marking it and clicking on the arrow in the section header or simply double-clicking on the item. Before you can use a data dimension in your pivot table you must at least select one dimension item. If you arrange a dimension as columns or rows but do not select any dimension items, the dimension is ignored.
You must choose at least one data dimension type to create a pivot table. The available types are described in this table:
| Types de dimension de données | Définition | Exemples |
|---|---|---|
| Indicateurs | Un indicateur est une formule calculée basée sur des éléments de données. | Couverture de la vaccination dans un arrondissement spécifique. |
| Éléments de données | Représente le phénomène pour lequel des données ont été saisies. | Nombre de cas de paludisme ; nombre de doses de BCG administrées. |
| Ensemble de données | Une collection d'éléments de données regroupés pour la collecte de données. Vous pouvez sélectionne r:
| Taux de rapport pour les formulaires de vaccination et de morbidité. |
| Éléments de données d'événements | Un élément de données qui fait partie d'un programme représentant des événements qui ont été saisis. | Poids et taille moyens des enfants dans un programme de nutrition. |
| Indicateurs du programme | Une formule calculée basée sur des éléments de données dans un programme représentant des événements. | Indice de masse corporelle moyen pour les enfants participant à un programme de nutrition. |
You can combine these dimensions to display for example aggregate data with reporting rates, or event data items together with program indicators, all in the same pivot tables. For the "data element" data dimension, you are also able to select "Totals" and "Details", which will allow you to view different category combination options together on the same pivot table.
For the period dimension you can choose between using fixed periods or relative periods. An example of a fixed period is "January 2012". To select fixed periods start by selecting a period type from the period type list. You can then select periods from the list of available periods.
Relative periods are periods relative to the current date. Examples of relative periods are "Last month", "Last 12 months", "Last 5 years". Relative periods can be selected by ticking the check-boxes next to each period. The main advantage of using relative periods is that when you save a pivot table favorite, it will stay updated with the latest data as time goes by without the need for constantly updating it.
For the organisation unit dimension you can select any number of organisation units from the hierarchy. To select all organisation units below a specific parent organisation unit, right click and click "Select all children". To manually select multiple organisation units, click and hold the Ctrl key while clicking on organisation units. You can tick "User org unit", "User sub-units" or "User sub-x2-units" in order to dynamically insert the organisation unit or units associated with your user account. This is useful when you save a pivot table favorite and want to share it with other users, as the organisation units linked with the other user's account will be used when viewing the favorite.
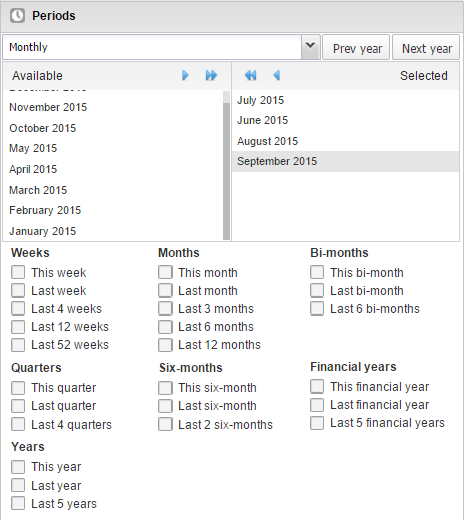
Dynamic dimensions can consist of organisation unit group sets, data element group sets, or category option group sets which have been configured with the type of "Disaggregation". Once the group sets have been configured, they will be come available in the pivot tables, and can be used as additional analysis dimensions, for instance to analyse aggregate data by Type of organisation unit or Implementing partner. Dynamic dimensions work the same as fixed dimensions.
Tip
Some dynamic dimensions may contain many items. This can cause issues with certain browsers due to the length of the URL when many dimension members are selected. A special "All" check box is available for dynamic dimensions, which allows you to include all available dimensions implicitly in your pivot table, without specifying each and every dimension member.
After selecting data dimensions it is time to arrange your pivot table. Click "Layout" in the top menu to open the layout screen. In this screen you can position your data dimensions as table columns, rows or filters by clicking and dragging the dimensions from the dimensions list to the respective column, row and filter lists. You can set any number of dimensions in any of the lists. For instance, you can click on "Organisation units" and drag it to the row list in order to position the organisation unit dimension as table rows. Note that indicators, data elements and data set reporting rates are part of the common "Data" dimension and will be displayed together in the pivot table. For instance, after selecting indicators and data elements in the left menu, you can drag "Organisation Unit" from the available dimensions list to the row dimension list in order to arrange them as rows in the pivot table.
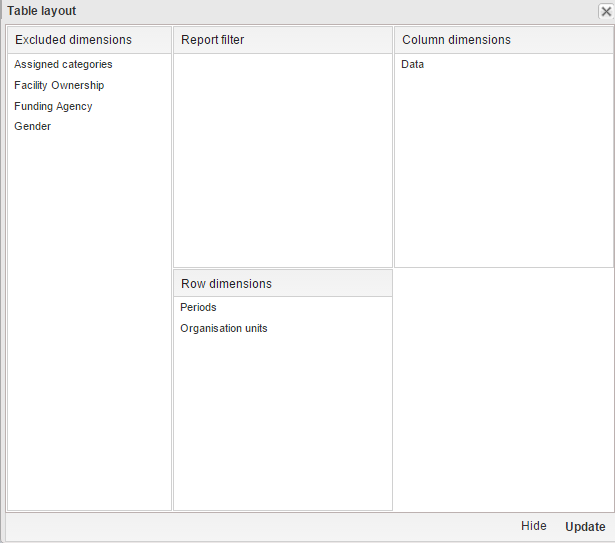
After you have set up your pivot table you can click "Update" to render your pivot table, or click "Hide" to hide the layout screen without any changes taking effect. Since we in our example have selected both the period and organisation unit dimension as rows, the pivot table will generate all combinations of the items in these dimensions and produce a table like this:
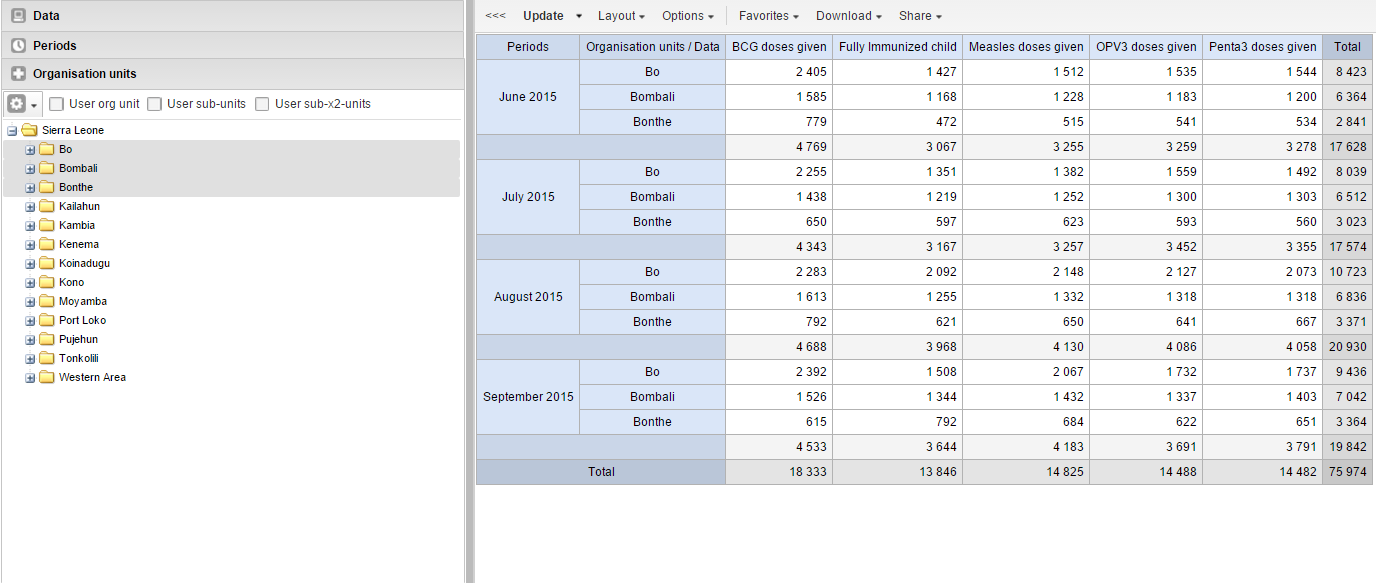
Ouvrez l'application Tableau croisé dynamique.
Créez un nouveau tableau croisé dynamique ou ouvrez un favori.
Cliquez sur Options.
Définissez les options selon les besoins.
Option | Description | |
|---|---|---|
Data | Show column totals Show row totals | Displays total values in the table for each row and column, as well as a total for all values in the table. |
Show column sub-totals Show row sub-totals | Displays subtotals in the table for each dimension. If you only select one dimension, subtotals will be hidden for those columns or rows. This is because the values will be equal to the subtotals. | |
Show dimension labels | Shows the dimension names as part of the pivot tables. | |
Hide empty rows | Hides empty rows from the table. This is useful when you look at large tables where a big part of the dimension items don't have data in order to keep the table more readable. | |
Hide empty columns | Hides empty columns from the table. This is useful when you look at large tables where a big part of the dimension items don't have data in order to keep the table more readable. | |
Skip rounding | Skips the rounding of data values, offering the full precision of data values. Can be useful for finance data where the full dollar amount is required. | |
Aggregation type | The default aggregation operator can be over-ridden here, by selecting a different aggregation operator. Some of the aggregation types are Count, Min and Max. | |
Number type | Sets the type of value you want to display in the pivot table: Value, Percentage of row or Percentage of column. The options Percentage of row andPercentage of column mean that you'll display values as percentages of row total or percentage of column total instead of the aggregated value. This is useful when you want to see the contribution of data elements, categories or organisation units to the total value. | |
Measure criteria | Allows for the data to be filtered on the server side. You can instruct the system to return only records where the aggregated data value is equal, greater than, greater or equal, less than or less or equal to certain values. If both parts of the filter are used, it's possible to filter out a range of data records. | |
Events | Include only completed events | Includes only completed events in the aggregation process. This is useful for example to exclude partial events in indicator calculations. |
Organisation units | Show hierarchy | Shows the name of all ancestors for organisation units, for example "Sierra Leone / Bombali / Tamabaka / Sanya CHP" for Sanya CHP. The organisation units are then sorted alphabetically which will order the organisation units according to the hierarchy. When you download a pivot table with organisation units as rows and you've selected Show hierarchy, each organisation unit level is rendered as a separate column. This is useful for example when you create Excel pivot tables on a local computer. |
Legend | Apply legend | Applies a legend to the values. This mean that you can apply a colour to the values. Select By data item to color the table cells individually according to each data element or indicator. You configure legends in the Maintenance app. |
Style | Colors the text or background of cells in pivot tables based on the selected legend. You can use this option for scorecards to identify high and low values at a glance. | |
Style | Display density | Controls the size of the cells in the table. You can set it to Comfortable, Normal or Compact. Compact is useful when you want to fit large tables into the browser screen. |
Font size | Controls the size of the table text font. You can set it to Large, Normal or Small. | |
Digit group separator | Controls which character to separate groups of digits or "thousands". You can set it to Comma, Space or None. | |
General | Table title | Type a title here to display it above the table. |
Parameters (for standard reports only) |
| |
Reporting period | Controls whether to ask user to enter a report period. | |
Organisation unit | Controls whether to ask user to enter an organisation unit. | |
Parent organisation unit | Controls whether to ask user to enter a parent organisation unit. | |
Include regression | Includes a column with regression values to the pivot table. | |
Include cumulative | Includes a column with cumulative values to the pivot table. | |
Sort order | Controls the sort order of the values. | |
Top limit | Controls the maximum number of rows to include in the pivot table. |
Cliquez sur Mettre à jour.
Saving your charts or pivot tables as favorites makes it easy to find them later. You can also choose to share them with other users as an interpretation or display them on the dashboard.
You view the details and interpretations of your favorites in the Pivot Table, Data Visualizer, Event Visualizer, Event Reports apps. Use the Favorites menu to manage your favorites.
Cliquez sur Favoris > Ouvrir.
Enter the name of a favorite in the search field, or click Prev and Next to display favorites.
Cliquez sur le nom du favori que vous souhaitez ouvrir.
Cliquez sur Favoris > Sauvegarder.
Entrez un Nom et une Description pour votre favori. Le champ de description supporte un format RTF, voir la section interprétations pour plus de détails.
Cliquez sur Sauvegarder.
Cliquez sur Favoris > Renommer.
Entrez le nouveau nom que vous souhaitez donner à votre favori.
Cliquez sur Mettre à jour.
An interpretation is a link to a resource with a description of the data at a given period. This information is visible in the Dashboard app. To create an interpretation, you first need to create a favorite. If you've shared your favorite with other people, the interpretation you write is visible to those people.
Cliquez sur Favoris > Écrire une interprétation.
In the text field, type a comment, question or interpretation. You can also mention other users with '@username'. Start by typing '@' plus the first letters of the username or real name and a mentioning bar will display the available users. Mentioned users will receive an internal DHIS2 message with the interpretation or comment. You can see the interpretation in the Dashboard app.
It is possible to format the text with bold, italic by using the Markdown style markers * and _ for bold and italic respectively. Keyboard shortcuts are also available: Ctrl/Cmd + B and Ctrl/Cmd + I. A limited set of smilies is supported and can be used by typing one of the following character combinations: :) :-) :( :-( :+1 :-1. URLs are automatically detected and converted into a clickable link.
Search for a user group that you want to share your favorite with, then click the + icon.
Modifiez les paramètres de partage pour les groupes d'utilisateurs que vous souhaitez modifier.
Lecture et écriture : Tout le monde peut consulter et éditer l'objet.
Lecture uniquement : tout le monde peut consulter l'objet.
None: The public won't have access to the object. This setting is only applicable to Public access.
Cliquez sur Partager.
When you are subscribed to a favorite, you receive internal messages whenever another user likes/creates/updates an interpretation or creates/update an interpretation comment of this favorite.
Ouvrez un favori.
Cliquez >>> en haut à droite de l'espace de travail.
Cliquez sur l'icône en cloche en haut à droite pour vous abonner à ce favori.
Cliquez sur Favoris > Créer un lien.
Sélectionnez l'une des options suivantes :
Open in this app: You get a URL for the favorite which you can share with other users by email or chat.
Open in web api: You get a URL of the API resource. By default this is an HTML resource, but you can change the file extension to ".json" or ".csv".
Cliquez sur Favoris > Supprimer.
Cliquez sur OK.
Pour afficher les interprétations pour des périodes relatives, par exemple des interprétations de l'année dernière :
Ouvrez un favori avec des interprétations.
Cliquez >>> en haut à droite de l'espace de travail.
Click an interpretation. Your chart displays the data and the date based on when the interpretation was created.To view other interpretations, click them.
Pour télécharger les données depuis le tableau croisé dynamique actuel :
Cliquez sur Télécharger.
Under Table layout, click the format you want to download: Microsoft Excel, CSV or HTML.
The data table will have one column per dimension and contain names of the dimension items.
Tip
When you download a pivot table with organisation units as rows and you've selected Show hierarchy in Table options, each organisation unit level is rendered as a separate column. This is useful for example when you create Excel pivot tables on a local computer.
Tip
You can create a pivot table in Microsoft Excel from the downloaded Excel file.
You can download data in the current pivot table in JSON, XML, Excel, and CSV as plain data formats with different identification schemes (ID, Code, and Name). The data document uses identifiers of the dimension items and opens in a new browser window to display the URL of the request to the Web API in the address bar. This is useful for developers of apps and other client modules based on the DHIS2 Web API or for those who require a plan data source, for instance for import into statistical packages.
Pour télécharger les formats standards de source de données :
Cliquez sur Télécharger.
Sous Source de données standards, cliquez sur le format que vous souhaitez télécharger.
Format | Action | Description |
|---|---|---|
JSON | Click JSON | Downloads JSON format based on ID property. You can also download JSON format based on Code or Name property. |
XML | Click XML | Downloads XML format based on ID property. You can also download XML format based on Code or Name property. |
Microsoft Excel | Click Microsoft Excel | Downloads XML format based on ID property. You can also download Microsoft Excel format based on Code or Name property. |
CSV | Click CSV | Downloads CSV format based on ID property. You can also download CSV format based on Code or Name property. |
JRXML | Put the cursor on Advanced and click JRXML | Produces a template of a Jasper Report which can be further customized based on your exact needs and used as the basis for a standard report in DHIS2. |
Raw data SQL | Put the cursor on Advanced and click Raw data SQL | Provides the actual SQL statement used to generate the pivot table. You can use it as a data source in a Jasper report, or as the basis for an SQL view. |
You can download data in CSV format directly without rendering the data in the web browser. This helps to reduce any constraints in the system settings that has been set with regards to the maximum number of analytic records. This lets you download much larger batches of data that you can use for later offline analysis.
To download data in CSV format without first rendering data in the web browser:
Cliquez sur la flèche à côté de Mettre à jour.
Cliquez sur CSV pour télécharger le format basé sur la propriété ID.
Le fichier est téléchargé sur votre ordinateur.
Tip
You can also download CSV format based on Code or Name property.
Certain analysis-related resources in DHIS2, like pivot tables, charts and maps, can be embedded in any web page by using a plug-in. You will find more information about the plug-ins in the Web API chapter in the DHIS2 Developer Manual.
To generate a HTML fragment that you can use to display the pivot table in an external web page:
Cliquez sur Intégrer.
Cliquez sur Sélectionner pour mettre en évidence le fragment HTML.
When you have made a pivot table you can switch between pivot table, chart and map visualization of your data.
Cliquez sur Graphique > Ouvrir ce tableau sous forme de graphique.
Votre tableau croisé dynamique actuel s'ouvre sous forme de graphique.
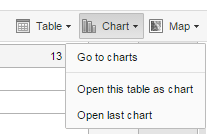
If you want to visualize a small part of your pivot table as a chart you can click directly on a value in the table instead opening the whole table.
Dans le tableau croisé dynamique, cliquez sur une valeur.
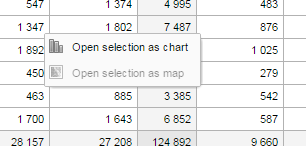
To verify the selection, hold the cursor over Open selection as chart. The highlighted dimension headers in the table indicate what data will be visualized as a chart.
Cliquez sur Ouvrir la sélection sous forme de graphique.
Cliquez sur Graphique > Ouvrir ce tableau sous forme de carte.
Votre tableau croisé dynamique actuel s'ouvre sous forme de carte.
Dans le tableau croisé dynamique, cliquez sur une valeur.
Un menu s'affiche.
Cliquez sur Ouvrir la sélection sous forme de carte.
Votre sélection s'ouvre sous forme de carte.
The Maps App is introduced in release 2.29 and serves as a replacement of the GIS App offering a more intuitive and user-friendly interface.
With the Maps app you can overlay multiple layers and choose among different base maps. You can create thematic maps of areas and points, view facilities based on classifications, and visualize catchment areas for each facility. You can add labels to areas and points, and search and filter using various criteria. You can move points and set locations on the fly. Maps can be saved as favorites and shared with other users and groups, or downloaded as an image.
Note
To use predefined legends in the Maps app, you need to create them first in the Maintenance app.
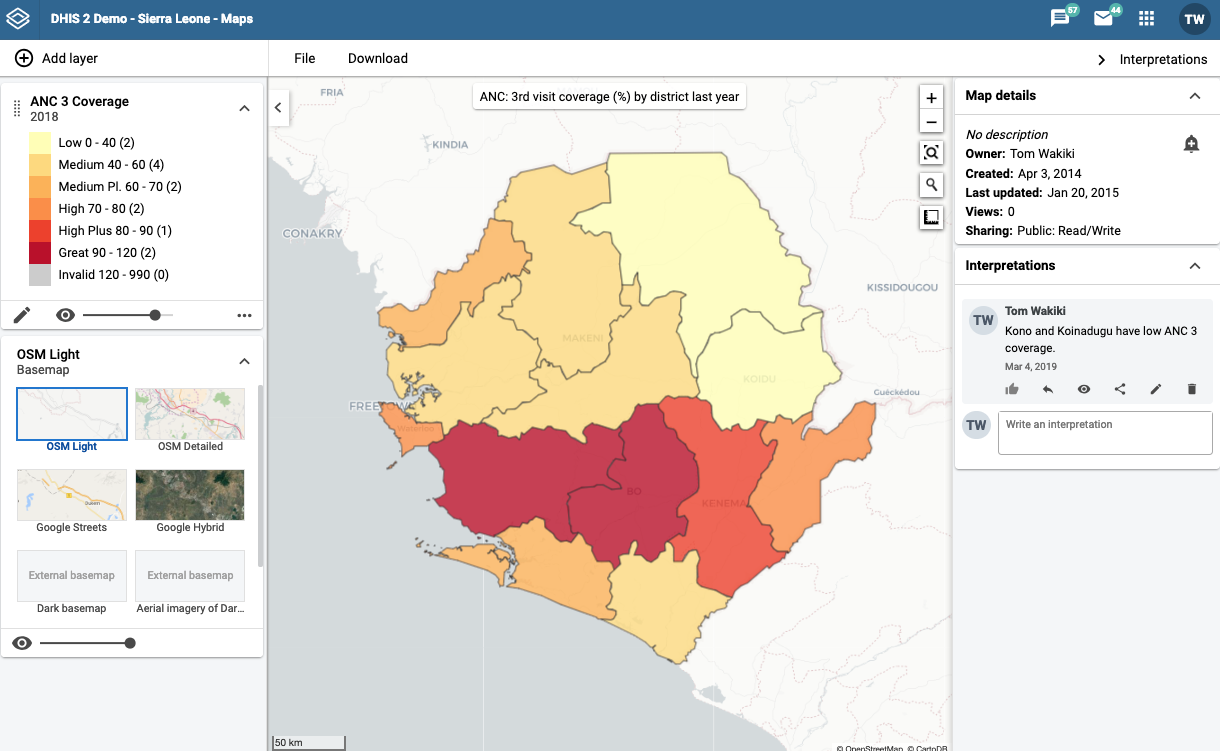
The layer panel on the left side of the workspace shows an overview of the layers for the current map:
As layers are added, using the (+) Add layer button, they are arranged and managed in this panel.
The basemap is always shown in the panel. The default basemap is OSM Light and is selected by default. OpenStreetMap Detailed, Google Streets and Google Hybrid are also available. You can use these maps as background maps and layers. Switch between them by selecting the desired image.
The small arrow button to the right of the layer panel, at the top, allows the panel to be hidden or shown.
The File button near the top left allows you to open and save maps:
Nouveau
effacera toutes les couches cartographiques existantes pour créer une nouvelle carte.
ouvrir
will display a dialog box with a list of existing maps where they be opened, renamed, shared and deleted. The title of the current map is displayed in the header bar above the File button.
Sauvegarder
permettra d'enregistrer les modifications apportées à la carte actuelle.
Enregistrer sous
enregistrera la carte actuelle sous un nouveau nom.
Renommer
allows you to change the name and/or description of the current map.
Traduire
allows you to translate the name and/or description of the current map.
Partager
will open a dialog where the current map can be shared with everyone or a group of users.
Obtenir le lien
fournira un lien direct vers la carte actuelle.
Supprimer
permet de supprimer la carte actuelle.
The Interpretations button at top right opens an interpretations panel on the right side of the workspace. The button is only clickable if the map is saved.
Le bouton Détails de la carte affiche des informations sur la carte actuelle.
Interpretations allows you to view, add, edit and share interpretations about the current map.
The + and **-**buttons on the map allow you to zoom in and out of the map respectively. The mouse scroll wheel can also be used for altering the zoom.
Zoom to content (bounded magnifying glass symbol) automatically adjusts the zoom level and map center position to put the data on your map in focus.
Search (magnifying glass symbol) allows searching for and jumping to a location on the map.
The ruler button allows you to find the distance between two locations on the map.
Pour afficher des informations d'un événement, cliquez simplement dessus.
Right-click on the map to display the longitude and latitude of that location.
Cartes de référence
Basemap layers are represented by layer cards in the layer panel such as:
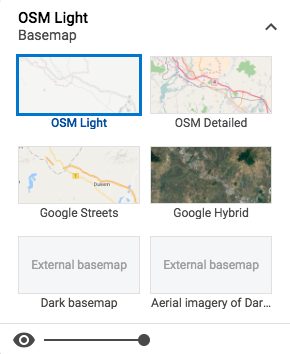
En haut de la carte de référence, de gauche à droite, se trouvent :
Le titre de la carte de référence sélectionnée
Un symbole de flèche pour réduire et agrandir la carte de fond de référence
In the middle of the basemap card is the list of available basemaps. The current basemap is highlighted.
En bas de la carte de fond de référence se trouvent :
Un symbole d'oeil pour basculer la visibilité de la couche
Un curseur pour modifier la transparence de la couche
In the Apps menu, click Maps. The DHIS2 Maps window opens.
Click the (+) Add layer button in the top left. You are presented with the layer selection dialog:
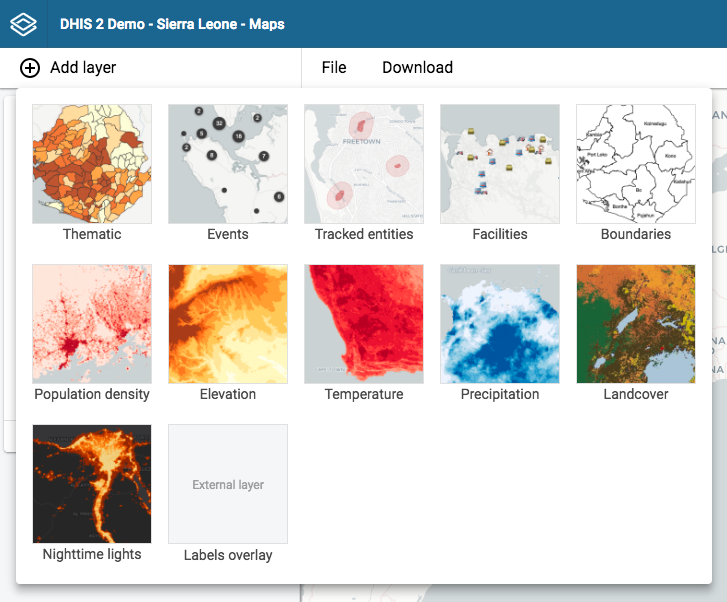
Sélectionnez une couche à ajouter à la carte actuelle. Les options possibles sont les suivantes :
In addition, there are several layers provided by Google Earth Engine and other services:
Densité de population
Altitude
Température
Précipitation
Couverture terrestre
Lumières nocturnes
Labels overlay is an external layer defined in the Maintenance app.
Thematic maps represent spatial variation of geographic distributions. Select your desired combination of indicator/data element, period and organisation unit level. If your database has coordinates and aggregated data values for these organisation units, they will appear on the map.
Note
You must generate the DHIS2 analytics tables to have aggregated data values available.
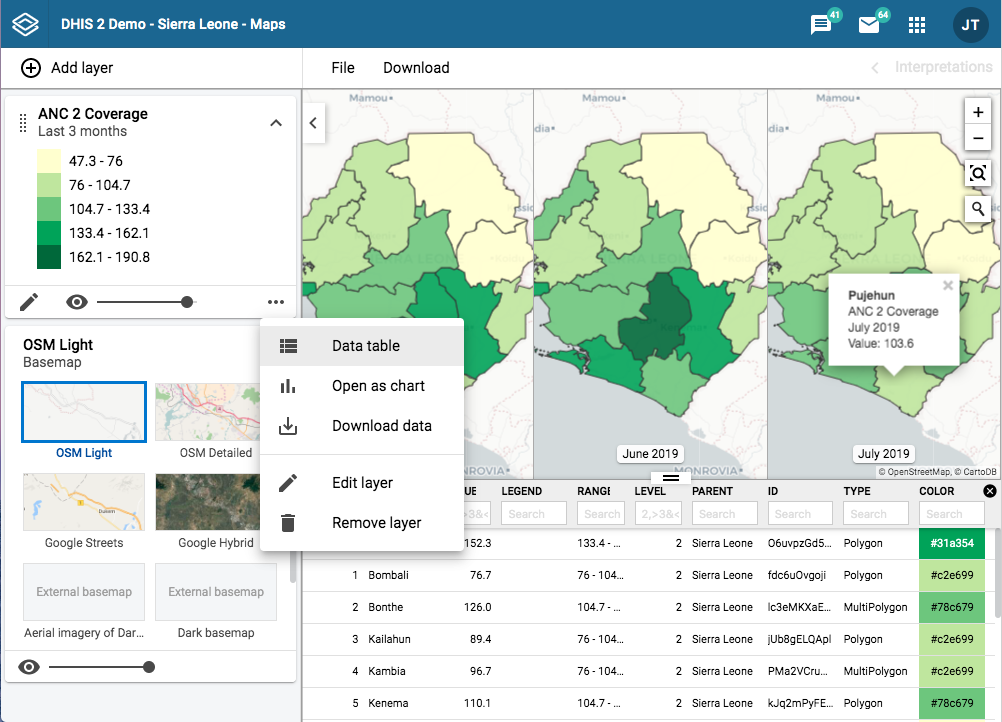
Thematic layers are represented by layer cards in the layer panel such as:
En haut de la carte thématique, de gauche à droite, vous trouverez :
un champ de saisie permettant de faire glisser et de réorganiser les couches avec la souris
Le titre et la période associés à la couche
Un symbole de flèche pour réduire et agrandir la carte thématique
In the middle of the thematic card is a legend indicating the value ranges displayed on the layer.
En bas de la carte thématique, de gauche à droite, vous trouverez :
Un bouton d'édition (crayon) pour ouvrir la boîte de dialogue de configuration de la couche
Un symbole d'oeil pour basculer la visibilité de la couche
Un curseur pour modifier la transparence de la couche
Un bouton "Plus d'actions" (trois points) avec des options supplémentaires :
A data table toggle button to show or hide the data table associated with the layer
Télécharger les données vous permet de télécharger les données de cette couche au format GeoJSON pour les utiliser dans d'autres logiciels de cartographie
Modifier la couche est le même que le bouton Modifier ci-dessus
Supprimer la couche supprimera cette couche de la carte actuelle.
To create an event layer, choose Thematic on the Add layer selection. This opens the Events layer configuration dialog.
Dans l'onglet DONNÉES:

Select a data type and then select respectively the group and the target element. The available fields depend on the type of item selected.
Select a value from the Aggregation type field for the data values to be shown on the map. By default, "By data element" is selected. Alternative values are: Count; Average; Sum; Standard deviation; Variance; Min; Max. See also Aggregation operators.
Dans l'onglet PÉRIODE
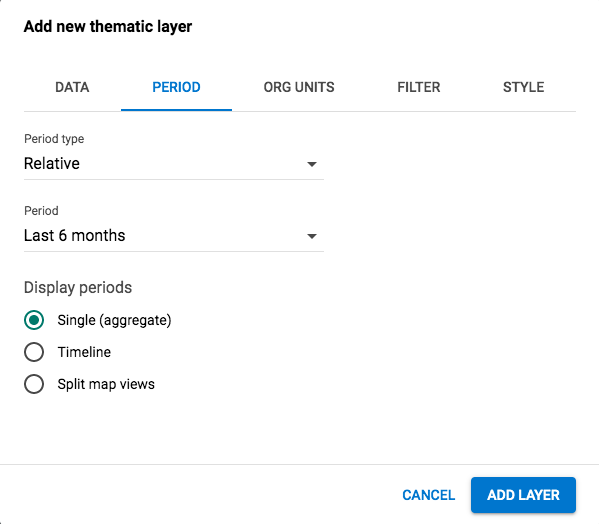
select the time span over which the thematic data is mapped. You can select either a relative or a fixed period.
période relative
In the Period type field select Relative, then select one of the relative periods, for example Last year or Last 12 months, in the Period field. If you select a relative period covering multiple years/months/weeks/days the layer can be displayed as
Unique (agrégée)
Afficher les valeurs agrégées pour la période relative sélectionnée (par défaut).
Déroulement
Includes a timeline allowing you to step through the periods. Only one timeline layer can be added to the same map.
Vues de carte fractionnées
Show multiple maps allowing you to compare different periods side by side. Supported for relative periods with 12 items or below. Can not be combined with other layer types.
Période fixe
In the Period type field select period length, then select the target in the Period field.
Dates de début et de fin
In the Period type field select Start/end dates and fill in a start date and an end date.
Dans l'onglet Unités d'Org.:

Select the organisation units you want to include in the layer. It is possible to select either
One or more specific organisation units, organisation unit levels in the hierarchy, organisation unit groups, or
A relative level in the organisation unit hierarchy, with respect to the user. By selecting a User organisation unit the map data will appear differently for users at different levels in the organisation unit hierarchy.
Dans l'onglet FILTRE:

Click ADD FILTER and select an available data item to add a new filter to the data set.
Select a data dimension from the drop down box. You can reduce the number of dimensions shown by using the search field. Click on the name to select a dimension.
When a dimension is selected you get a second drop down with dimension items. Check the items you want to include in the filter.
Multiple filters may be added. Click the trash button on the right of the filter to remove it.
Dans l'onglet STYLE:

Sélectionnez la légende Automatique ou Prédéfinie.
Automatic legend types means that the application will create a legend set for you based on your what method, number of classes, low color and high color you select. Method alludes to the size of the legend classes. Set to
des intervalles égaux
la plage de chaque intervalle sera (la plus haute valeur de données - la plus basse valeur de données / nombre de classes)
Comptes égaux
le créateur de la légende va tenter de répartir les unités d'organisation uniformément.
If you have facilities in your thematic layer, you can set the radius for minimum and maximum values by changing the values in the Low size and High size boxes respectively.
Cliquez sur AJOUTER UNE COUCHE.
In the layer panel, click the edit (pencil) icon on the thematic layer card.
Modifiez le paramètre de l'un des onglets comme vous le souhaitez.
Cliquez sur METTRE À JOUR LA COUCHE.
Thematic layers have a data table option that can be toggled on or off from the thematic layer card.

La table de données affiche les données qui forment la couche thématique
clicking on a title will sort the table based on that column; toggling between ascending and descending.
entering text or expressions into the filter fields below the titles will apply those filters to the data, and the display will adjust according to the filter. The filters are applied as follows:
PRÉNOM
filtrer par noms contenant ce texte
VALEUR
filter values by given numbers and/or ranges, for example: 2,>3&\<8
LÉGENDE
filtrer par légendes contenant ce texte
INTERVALLE
filtrer par plages contenant ce texte
NIVEAU
filtrez le niveau par nombres et/ou plages de valeurs, par exemple : 2,>3&\<8
PARENT
filtrer par noms de parent contenant ce texte
Identifiant
filtrer par Identifiants contenant ce texte
TYPE
filtrer par types d'affichage SIG contenant ce texte
COULEUR
filtrer par noms de couleurs contenant ce texte
Note
Data table filters are temporary and are not saved with the map layers as part of the favourite.
The NAME filter field in the data table provides an effective way of searching for individual organisation units.
When there are visible organisation units on the map, you can easily navigate up and down in the hierarchy without using the level/parent user interface.
Faites un clique droit sur l'une des unités d'organisation.
Sélectionnez Accéder au niveau supérieur ou Accéder au niveau inférieur.
The drill down option is disabled if you are on the lowest level or if there are no coordinates available on the level below. Likewise the drill up option is disabled from the highest level.
Pour effacer toutes les données d'une couche thématique :
In the layer card to the left, click the more actions (three dots) icon and then on Remove layer.
La couche est supprimée de la carte actuelle.
The event layer displays the geographical location of events registered in the DHIS2 tracker. Provided that events have associated point or polygon coordinates, you can use this layer to drill down from the aggregated data displayed in the thematic layers to the underlying individual events or cases.
You can also display aggregated events at the facility or at the boundary level. You do this through a thematic layer using event data items. This is useful when you only have the coordinates for the Org Unit under which the events are recorded.

Event layers are represented by layer cards in the layer panel such as:
En haut de la carte d'évènement, de gauche à droite, se trouvent :
un champ de saisie permettant de faire glisser et de réorganiser les couches avec la souris
Le titre et la période associés à la couche
Un symbole de flèche pour réduire et développer la carte d'évènement
In the middle of the event card is a legend indicating the styling of the layer.
En bas de la carte d'évènement, de gauche à droite, se trouvent :
Un bouton d'édition (crayon) pour ouvrir la boîte de dialogue de configuration de la couche
Un symbole d'oeil pour basculer la visibilité de la couche
Un curseur pour modifier la transparence de la couche
Un bouton "Plus d'actions" (trois points) avec des options supplémentaires :
Télécharger les données vous permet de télécharger les données de cette couche au format GeoJSON pour les utiliser dans d'autres logiciels de cartographie
Modifier la couche est le même que le bouton Modifier ci-dessus
Supprimer la couche supprimera cette couche de la carte actuelle.
To create an event layer, choose Events on the Add layer selection. This opens the Events layer configuration dialog.
Dans l'onglet DONNÉES:

Select a program and then select a program stage. The Stage field is only shown once a program is selected.
If there is only one stage available for the selected program, the stage is automatically selected.
Select a value from the Coordinate field for the positions shown on the map. By default, "Event location" is selected. Depending on the data elements or attributes that belong to a program, other coordinates such as "Household position" are available.
Dans l'onglet PÉRIODE

select the time span for when the events took place. You can select either a fixed period or a relative period.
Période fixe
In the Period field, select Start/end dates and fill in a start date and an end date.
période relative
In the Period field, select one of the relative periods, for example This month or Last year.
Dans l'onglet Unités d'Org.:

Select the organisation units you want to include in the layer. It is possible to select either
Une ou plusieurs unités d'organisation spécifiques, ou
A relative level in the organisation unit hierarchy, with respect to the user. By selecting a User organisation unit the map data will appear differently for users at different levels in the organisation unit hierarchy.
Dans l'onglet FILTRE:

Click ADD FILTER and select an available data item to add a new filter to the data set.
For data item of type option set, you can select any of the options from the drop down box by using the down-wards arrow or by start typing directly in the box to filter for options.
For data item of type number, you can select operators like equal, not equal, greater than or less than.
For data item of type boolean (yes/no), you can check the box if the condition should be valid or true.
For data item of type text you will get two choices: Contains implies that the query will match all values which contains your search value, and Is exact implies that only values which is completely identical to your search query will be returned.
Multiple filters may be added. Click the trash button on the right of the filter to remove it.
Dans l'onglet STYLE:

Select Group events to group nearby events (cluster), or View all events to display events individually.
Sélectionnez une couleur pour l'événement ou les points de regroupement.
Sélectionnez le rayon (entre 1 et 20) pour les événements.
Select Show buffer to display visual buffer around each event. The radius of the buffer can be modified here. This option is only available if you select View all events mentionnées ci-dessus.
Select a Style by data element to colorise the events according to a data value. The options varies for different data types:
Option sets: Select a color for each option in an option set. You can set default colors for an option in the Maintenance app.
Numbers: You can style a numeric data element in the same way as thematic layers using automatic or predefined legends.
Booleans: Select a color for true/yes and another for false/no.
Cliquez sur AJOUTER UNE COUCHE.
In the layer panel, click the edit (pencil) icon on the event layer card.
Modify the setting on the DATA, PERIOD, FILTER, ORG UNIT and STYLE tabs as desired.
Cliquez sur METTRE À JOUR LA COUCHE.
Vous pouvez modifier les informations affichées dans la fenêtre fenêtre pop-up de l'événement.

Ouvrez l'application Maintenance.
Sélectionnez Programme.
Cliquez sur le programme que vous souhaitez modifier et sélectionnez 2 Assigner des éléments de données.
For every data element you want to display in the pop-up window, select corresponding Display in reports.
Cliquez sur Sauvegarder.
Les données brutes des couches Evénements peuvent être téléchargées au format GeoJSON pour une géo-analyse et un traitement plus avancés dans un logiciel SIG de bureau tel que QGIS. Les données téléchargées comprennent tous les événements individuels en tant que caractéristiques GeoJSON, y compris les attributs de chaque élément de données sélectionné pour Afficher dans les rapports

In the layer card to the left, click the more actions (three dots) icon and then on Download data
Sélectionnez le format de l'ID à utiliser comme clé pour les valeurs des éléments de données du fichier GeoJSON téléchargé. Trois options sont disponibles :
ID - Utiliser l'identifiant unique de l'élément de données
Code - Utilisez le code de l'élément de données
Choisissez d'utiliser ou non des touches lisibles pour d'autres attributs de l'événement, tels que la phase du programme, la latitude, la longitude, les données de l'événement et l'ID, le nom et le code de l'unité d'organisation. Lorsque cette option est non sélectionnée, ces valeurs seront alors l'identifiant lisible par l'ordinateur au lieu du nom lisible par l'homme (et traduit).
Cliquez sur le bouton TELECHARGER pour générer et télécharger un fichier GeoJSON. L'application de cartographie demandera au serveur DHIS2 des données qu'elle va ensuite traiter. Cette opération peut prendre plusieurs minutes.
Une fois que le fichier GeoJSON a été téléchargé, il peut être importé dans la plupart des applications logicielles SIG standard.
Notez que les données téléchargées ne contiennent pas d'informations de style étant donné qu'elles ne sont pas prises en charge naturellement par le format GeoJSON. Les styles peuvent éventuellement être recréés dans des applications SIG externes en utilisant les attributs de chaque élément.
Pour effacer toutes les données de la couche d'un événement d'une carte :
In the layer card to the left, click the more actions (three dots) icon and then on Remove layer.
La couche est supprimée de la carte actuelle.
The tracked entity layer displays the geographical location of tracked entities registered in the DHIS2. Provided that tracked entities have associated point or polygon coordinates, you can explore these on a map.

Tracked entity layers are represented by layer cards in the layer panel such as:
En haut de la carte d'entité suivie, de gauche à droite, se trouvent les éléments suivants :
A grab field to allow dragging and re-ordering layers with the mouse.
Le titre et la période associés à la couche.
Un symbole de flèche pour réduire et élargir la carte d'entité suivie.
In the middle of the tracked entity card is a legend indicating the styling of the layer.
En bas de la carte d'entité suivie, de gauche à droite, on peut mener les actions suivantes :
Un bouton d'édition (crayon) pour ouvrir la boîte de dialogue de configuration de la couche
Un symbole d'oeil pour basculer la visibilité de la couche
Un curseur pour modifier la transparence de la couche
Un bouton "Plus d'actions" (trois points) avec des options supplémentaires :
Modifier la couche est le même que le bouton Modifier ci-dessus
Supprimer la couche supprimera cette couche de la carte actuelle.
To create an tracked entity layer, choose Tracked entities on the Add layer selection. This opens the Tracked entity layer configuration dialog.
Dans l'onglet DONNÉES:

Sélectionnez le Type d'entité suivie que vous souhaitez afficher sur la carte.
Sélectionnez un Programme auquel appartiennent les entités suivies.
Définissez le Statut du programme comme étant Actif ou Terminé.
Set the Follow up status of the tracked entity for the given program.
Dans l'onglet Relations

Caution
Displaying tracked entity relationships in Maps is an experimental feature
Si un type d'entité suivie est sélectionné, vous pouvez alors cocher la case Afficher les relations des entités suivies.
Une fois coché, vous pouvez sélectionner le type de relation à afficher sur la carte dans la liste déroulante. Seules les relations provenant du type d'entité suivie sélectionné sont disponibles.
Dans l'onglet PÉRIODE

If no program is selected, you can set start and end dates when the tracked entities were last updated.
If a program is selected, you can set start and end dates for the program period.
Dans l'onglet Unités d'Org.:

Select the organisation units you want to include in the layer. You have 3 selection modes:
Selected only: Include tracked entities belonging to selected org units only.
Selected and below: Included tracked entities in and right below selected org units.
Selected and all below: Included tracked entities in and all below selected org units.
Dans l'onglet STYLE:

Sélectionnez une couleur pour les points et les polygones des entités suivies.
Select the point size (radius between 1 and 20) for the points.
Select Show buffer to display visual buffer around each tracked entity. The buffer distance in meters can be modified here.
Lorsque vous sélectionnez un type de relation dans l'onglet "Relations", vous pouvez sélectionner couleur, taille du point et couleur de la ligne pour les relations et les instances d'entités suivies connexes.
Cliquez sur AJOUTER/METTRE A JOUR UNE COUCHE.
In the layer panel, click the edit (pencil) icon on the tracked entity layer card.
Modify the setting on the DATA, PERIOD, ORG UNIT and STYLE tabs as laisser le choix qui vous est proposé par défaut.
Cliquez sur METTRE À JOUR LA COUCHE.
Pour effacer une couche d'entité suivie d'une carte :
In the layer card to the left, click the more actions (three dots) icon and then on Remove layer.
La couche est supprimée de la carte actuelle.
The facility layer displays icons that represent types of facilities. Polygons do not show up on the map, so make sure that you select an organisation unit level that has facilities.
A polygon is an enclosed area on a map representing a country, a district or a park.
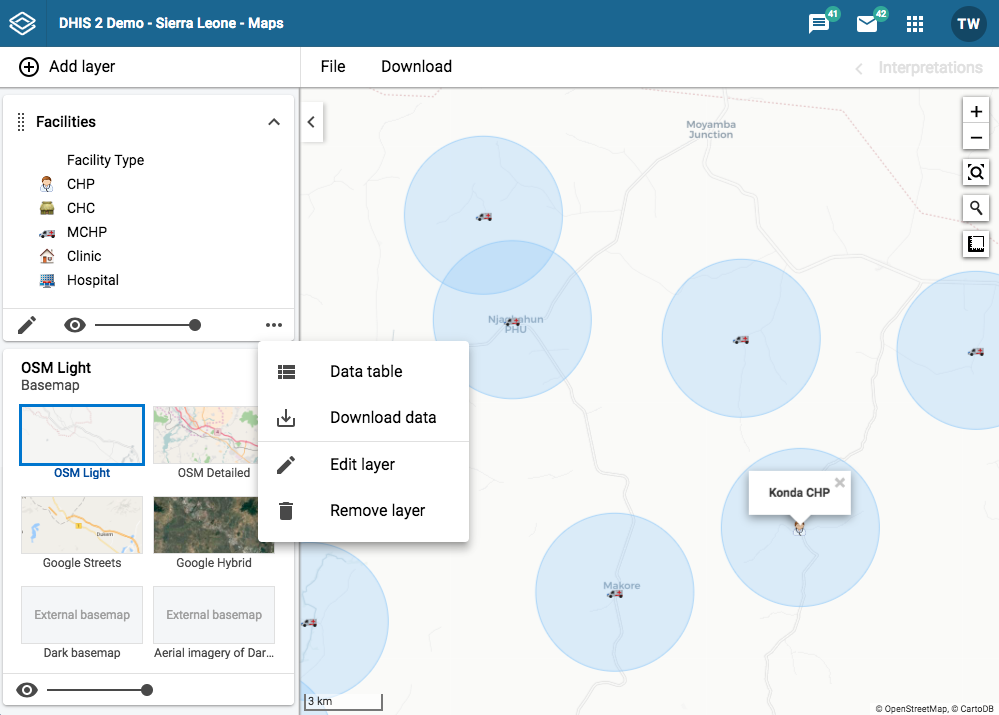
Facility layers are represented by layer cards in the layer panel such as:
En haut de la carte des infrastructures, de gauche à droite, se trouvent :
un champ de saisie permettant de faire glisser et de réorganiser les couches avec la souris
Le titre Infrastructures
Un symbole d'oeil pour basculer la visibilité de la couche
Un symbole de flèche pour réduire et agrandir la carte des infrastructures
In the middle of the facilities card is a legend indicating the group set representation.
En bas de la carte des infrastructures, de gauche à droite, se trouvent :
Un bouton d'édition (crayon) pour ouvrir la boîte de dialogue de configuration de la couche
Un curseur pour modifier la transparence de la couche
Un bouton "Plus d'actions" (trois points) avec des options supplémentaires :
A data table toggle button to show or hide the data table associated with the layer
Télécharger les données vous permet de télécharger les données de cette couche au format GeoJSON pour les utiliser dans d'autres logiciels de cartographie
Modifier la couche est le même que le bouton Modifier ci-dessus
Supprimer la couche supprimera cette couche de la carte actuelle.
To create facility layer, choose Facilities on the **Add layer**selection. This opens the Facility layer configuration dialog.
Dans l'onglet ENSEMBLE DE GROUPES:

Dans l'onglet UNITÉS D'ORGANISATION

select the organisation unit level(s) and/or group(s) from the selection fields on the right hand side.
Select the organisation units you want to include in the layer. It is possible to select either
Une ou plusieurs unités d'organisation spécifiques, ou
A relative level in the organisation unit hierarchy, with respect to the user. By selecting a User organisation unit the map data will appear differently for users at different levels in the organisation unit hierarchy.
Dans l'onglet STYLE:

sélectionnez le style que vous souhaitez appliquer aux infrastructures
Afficher les étiquettes
Allows labels to be shown on the layer. Font size, weight and color can be modified here.
Afficher le buffer
Allows a visual buffer to be displayed on the layer around each facility. The radius of the buffer can be modified here.
Cliquez sur AJOUTER UNE COUCHE.
In the layer panel, click the edit (pencil) icon on the facility layer card.
Modify the setting on the GROUP SET, ORGANISATION UNITS and STYLE tabs as desired.
Cliquez sur METTRE À JOUR LA COUCHE.
Facility layers have a data table option that can be toggled on or off from the facility layer card.

La table de données affiche les données qui composent la couche de l'infrastructure.
clicking on a title will sort the table based on that column; toggling between ascending and descending.
entering text or expressions into the filter fields below the titles will apply those filters to the data, and the display will adjust according to the filter. The filters are applied as follows:
PRÉNOM
filtrer par noms contenant ce texte
Identifiant
filtrer par Identifiants contenant ce texte
TYPE
filtrer par types d'affichage SIG contenant ce texte
Note
Data table filters are temporary and are not saved with the map layers as part of the favourite.
The NAME filter field in the data table provides an effective way of searching for individual facilities.
Pour effacer toutes les données d'une couche d'infrastructures :
In the layer card to the left, click the more actions (three dots) icon and then on Remove layer.
La couche est supprimée de la carte actuelle.
You can have facilities in Facility, Boundary and Thematic layers.
Faites un clique droit sur une infrastructure et cliquez sur Relocaliser.
Placez le curseur dans le nouvel emplacement.
Les nouvelles coordonnées sont stockées de façon permanente. Cette action ne peut pas être annulée.
Faites un clique droit sur une infrastructure et cliquez sur Permuter la longitude/latitude.
This is useful if a user inverted latitude and longitude coordinates when creating the organisation unit.
You can view organisation unit information set by the administrator as follows:
| Fonction | Action |
|---|---|
Afficher les informations pour la période en cours |
|
Afficher les informations pour une période sélectionnée |
|
The boundary layer displays the borders and locations of your organisation units. This layer is particularly useful if you are offline and don't have access to background maps.
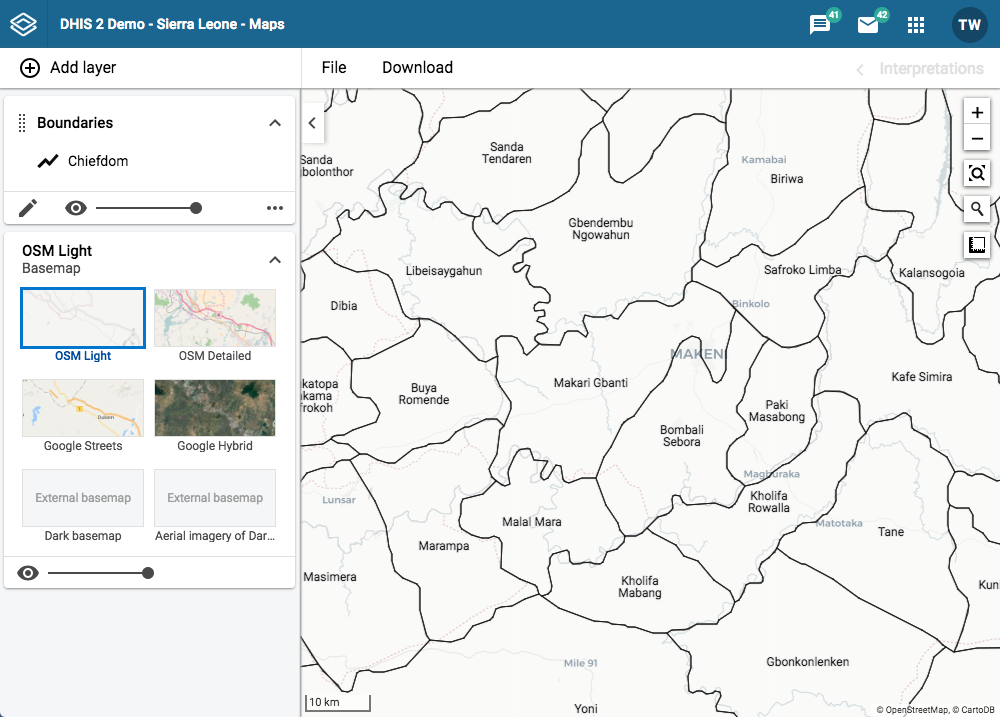
Boundary layers are represented by layer cards in the layer panel such as:
En haut de la carte frontière, de gauche à droite, se trouvent :
un champ de saisie permettant de faire glisser et de réorganiser les couches avec la souris
Le titre Frontières
Un symbole de flèche pour réduire et agrandir la carte frontière
Au bas de la carte frontière, de gauche à droite, se trouvent :
Un bouton d'édition (crayon) pour ouvrir la boîte de dialogue de configuration de la couche
Un symbole d'oeil pour basculer la visibilité de la couche
Un curseur pour modifier la transparence de la couche
Un bouton "Plus d'actions" (trois points) avec des options supplémentaires :
A data table toggle button to show or hide the data table associated with the layer
Télécharger les données vous permet de télécharger les données de cette couche au format GeoJSON pour les utiliser dans d'autres logiciels de cartographie
Modifier la couche est le même que le bouton Modifier ci-dessus
Supprimer la couche supprimera cette couche de la carte actuelle.
To create boundary layer, choose Boundaries on the **Add layer**selection. This opens the Boundary layer configuration dialog.
Dans l'onglet UNITÉS D'ORGANISATION
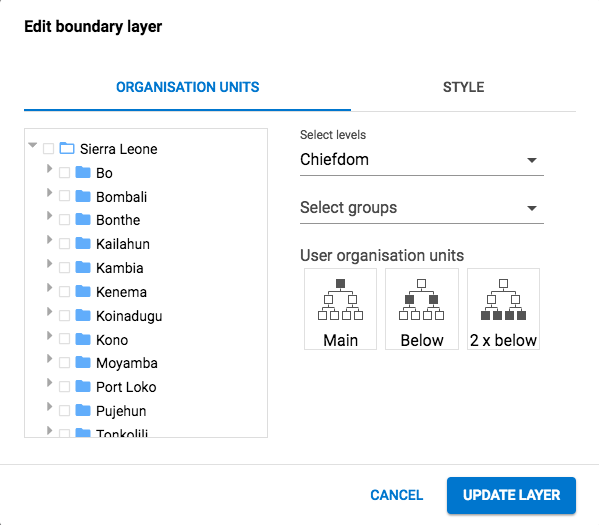
select the organisation unit level(s) and/or group(s) from the selection fields on the right hand side.
Select the organisation units you want to include in the layer. It is possible to select either
Une ou plusieurs unités d'organisation spécifiques, ou
A relative level in the organisation unit hierarchy, with respect to the user. By selecting a User organisation unit the map data will appear differently for users at different levels in the organisation unit hierarchy.
Dans l'onglet STYLE:

sélectionnez le style que vous souhaitez appliquer aux frontières.
Afficher les étiquettes
Allows labels to be shown on the layer. Font size and weight can be modified here.
rayon de point
Sets the base radius when point type elements, such as facilities, are presented on the boundary layer.
Cliquez sur AJOUTER UNE COUCHE.
In the layer panel, click the edit (pencil) icon on the boundary layer card.
Modify the setting on the ORGANISATION UNITS and STYLE tabs as laisser le choix qui vous est proposé par défaut.
Cliquez sur METTRE À JOUR LA COUCHE.
Boundary layers have a data table option that can be toggled on or off from the boundary layer card.

Le tableau de données affiche les données qui forment la couche frontière
clicking on a title will sort the table based on that column; toggling between ascending and descending.
entering text or expressions into the filter fields below the titles will apply those filters to the data, and the display will adjust according to the filter. The filters are applied as follows:
PRÉNOM
filtrer par noms contenant ce texte
NIVEAU
filtrez le niveau par nombres et/ou plages de valeurs, par exemple : 2,>3&\<8
PARENT
filtrer par noms de parent contenant ce texte
Identifiant
filtrer par Identifiants contenant ce texte
TYPE
filtrer par types d'affichage SIG contenant ce texte
Note
Data table filters are temporary and are not saved with the map layers as part of the favourite.
The NAME filter field in the data table provides an effective way of searching for individual organisational units displayed in the boundary layer.
You can modify the target of the boundary layer in the hierarchy without using the level/parent user interface.
Faites un clique droit sur l'une des frontières.
Sélectionnez Accéder au niveau supérieur ou Accéder au niveau inférieur.
The drill down option is disabled if you are on the lowest level. Likewise the drill up option is disabled from the highest level.
Pour effacer toutes les données d'une couche frontière :
In the layer card to the left, click the more actions (three dots) icon and then on Remove layer.
La couche est supprimée de la carte actuelle.

The Google Earth Engine layer lets you display satellite imagery and geospatial datasets from Google's vast catalog. These layers is useful in combination with thematic and event layers to enhance analysis. The following layers are supported:
Population density estimates with national totals adjusted to match UN population division estimates. Population in 100 x 100 m grid cells (from 2010).
Elevation above sea-level. You can adjust the min and max values so it better represents the terrain in your region.
Temperature: Land surface temperatures collected from satellite. Blank spots will appear in areas with a persistent cloud cover.
Precipitation collected from satellite and weather stations on the ground. The values are in millimeters within 5 days periods. Updated monthly, during the 3rd week of the following month.
Couverture terrestre : 17 types de couverture terrestre distincts collectés à partir de satellites.
Nighttime lights: Lights from cities, towns, and other sites with persistent lighting, including gas flares (from 2013).
To create an Earth Engine layer, choose the desired layer from the **Add layer**selection. This opens the layer configuration dialog.
Dans l'onglet STYLE

Modifier les paramètres spécifiques au type de couche.
Ajustez la plage, les étapes et les couleurs de la légende comme vous le souhaitez.
Cliquez sur AJOUTER UNE COUCHE.
Les couches de carte externes sont représentées comme suit :
Plans de base
These are available in the basemap card in the layers panel and are selected as any other basemap.
Les superpositions
These are available in the Add layer selection. Unlike basemaps, overlays can be placed above or below any other overlay layers.
Overlay layers are represented by additional layer cards in the layer panel such as:
En haut de la carte superposée, de gauche à droite, vous trouverez :
un champ de saisie permettant de faire glisser et de réorganiser les couches avec la souris
le titre de la couche de carte externe
Un symbole de flèche pour réduire et agrandir la carte de superposition
En bas de la carte de superposition, de gauche à droite, se trouvent :
Un curseur pour modifier la transparence de la couche
A delete (trash can) icon to remove the layer from the current thematic map.
Voici quelques exemples de couches externes :

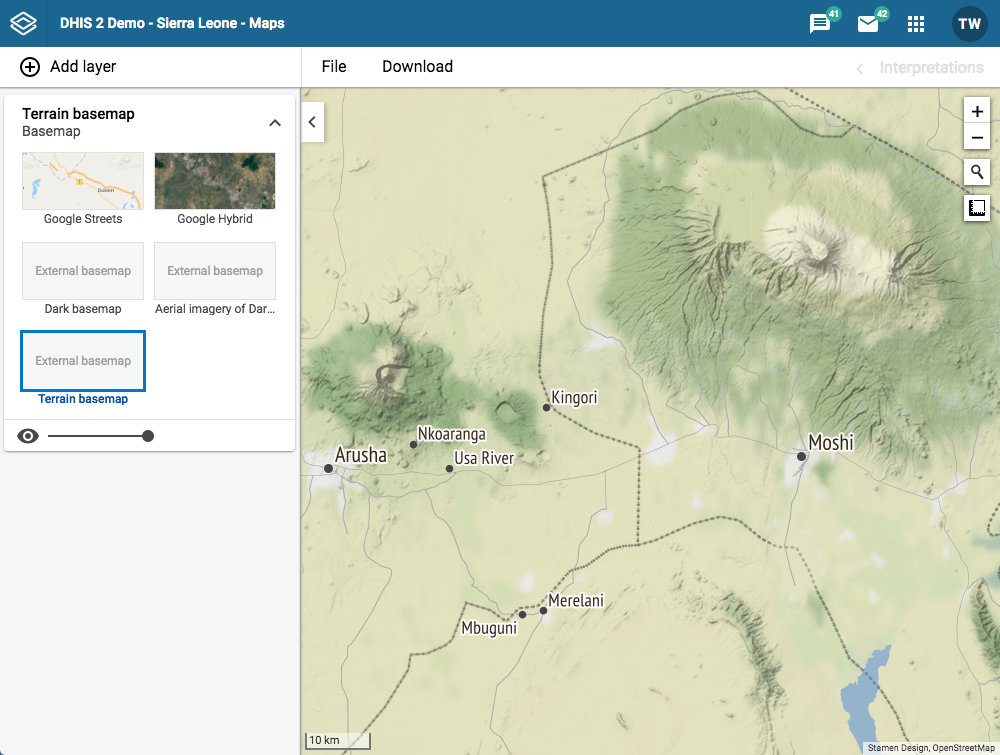
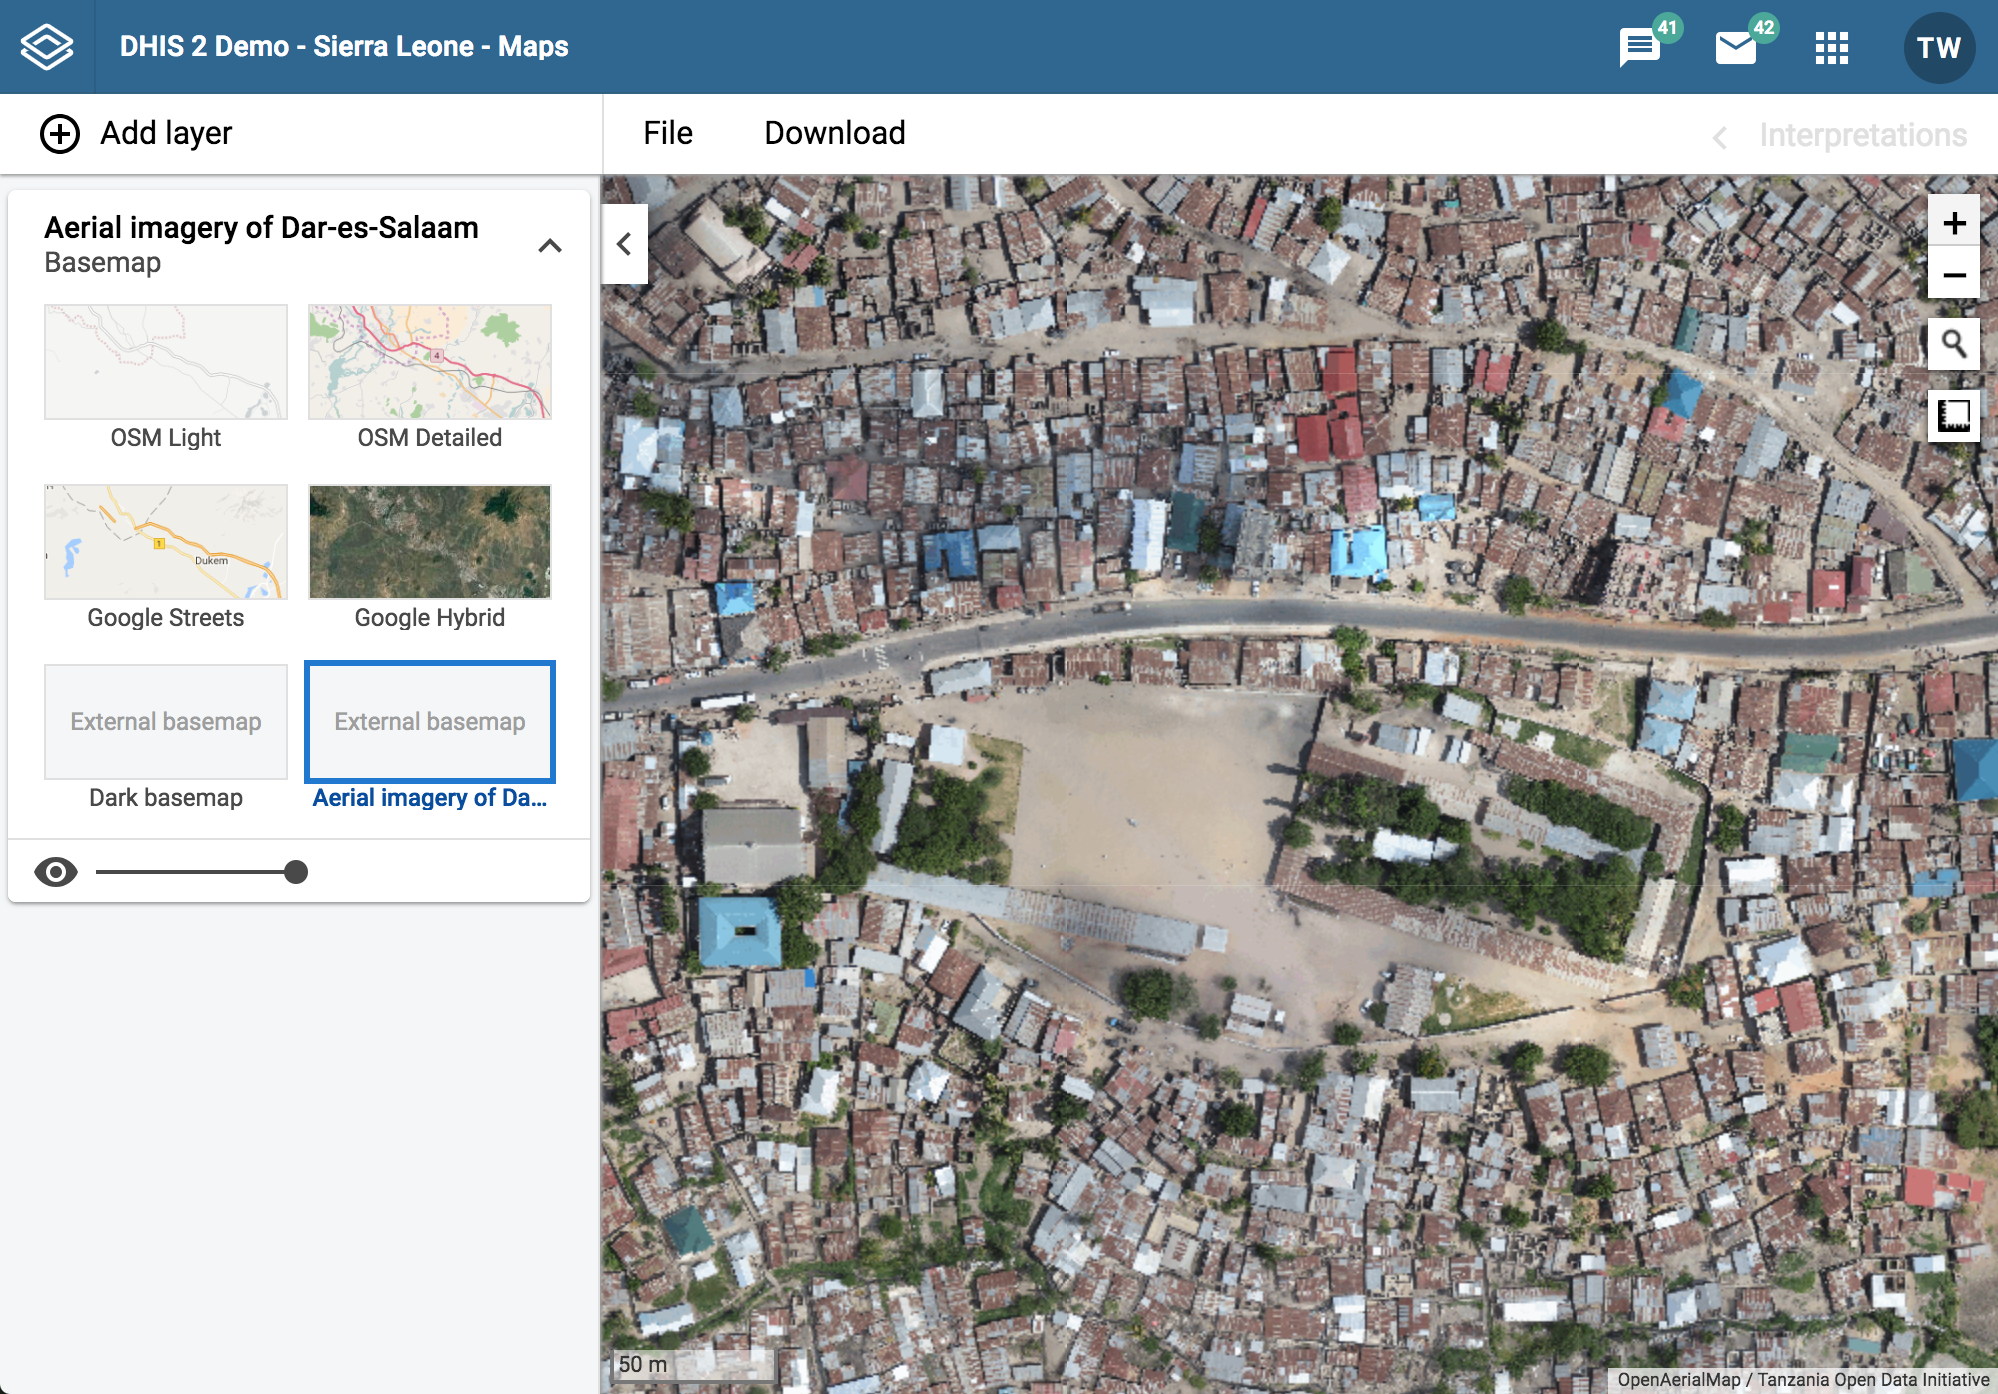
Use the File menu to manage your maps. Several menu items will be disabled until you open or save a map.
Saving your maps makes it easy to restore them later. It also gives you the opportunity to share them with other users as an interpretation or put it on the dashboard. You can save all types of layer configurations as a favorite.
Cliquez sur Fichier > Nouveau.
NB ! Cette action effacera les couches de carte actuelles que vous avez créées sans les sauvegarder.
Cliquez sur Fichier > Ouvrir. Une boîte de dialogue s'ouvre avec une liste de cartes.
Find the favorite you want to open. You can either use \< and > or the search field to find a saved map. The list is filtered on every character that you enter. You can filter the list by selecting Show all, Created by me or Created by others.
Cliquez sur le nom de la carte que vous souhaitez ouvrir.
Après création d'une carte, il est nécessaire de la sauvegarder pour une utilisation ultérieure :
Cliquez sur Fichier > Enregistrer.
Enter a Name (required) and a Description (optional) the first time you save a map.
Cliquez sur SAUVEGARDER.
Cliquez sur Fichier > Enregistrer sous.
Enter a Name (required) and a Description (optional) for the map.
Cliquez sur SAUVEGARDER.
Cliquez sur Fichier > Renommer.
Entrez un nouveau Nom et/ou Description pour votre carte.
Cliquez sur RENOMMER. La carte est alors mise à jour.
Cliquez sur Fichier > Traduire.
Sélectionnez la Locale (langue) de votre traduction.
Enter a translated Name and Description. The original text will show below the field.
Cliquez sur SAUVEGARDER.
After you have created a map and saved it, you can share the map with everyone or a user group. To modify the sharing settings:
Cliquez sur Fichier > Partager. La boîte de dialogue des paramètres de partage s'ouvre.
In the text box, search for the name of the user or group you want to share your favorite with and select it.
L'utilisateur ou le groupe choisi est ajouté à la liste des destinataires.
Répétez cette étape pour ajouter plus de groupes d'utilisateurs.
Si vous souhaitez autoriser l'accès externe, cochez la case correspondante.
Pour chaque groupe d'utilisateurs, choisissez un paramètre d'accès. Les options possibles sont les suivantes :
Aucun (uniquement pour les groupes par défaut, car ils ne peuvent pas être supprimés)
Lecture seule
Lecture et écriture
Cliquez sur FERMER pour fermer la boîte de dialogue.
Cliquez sur Fichier > Lien vers le site. Une boîte de dialogue de lien s'ouvre.
Copiez le lien.
Cliquez sur Fichier > Supprimer. Une boîte de dialogue de confirmation s'affiche.
Cliquez sur SUPPRIMER pour confirmer que vous souhaitez supprimer le favori. Your map is deleted and the layers are cleared from the view.
An interpretation is a description of a map at a given period. This information is visible in the Dashboard app. Click Interpretations in the top right of the workspace to open the interpretations panel. The button is only clickable if the map is saved.
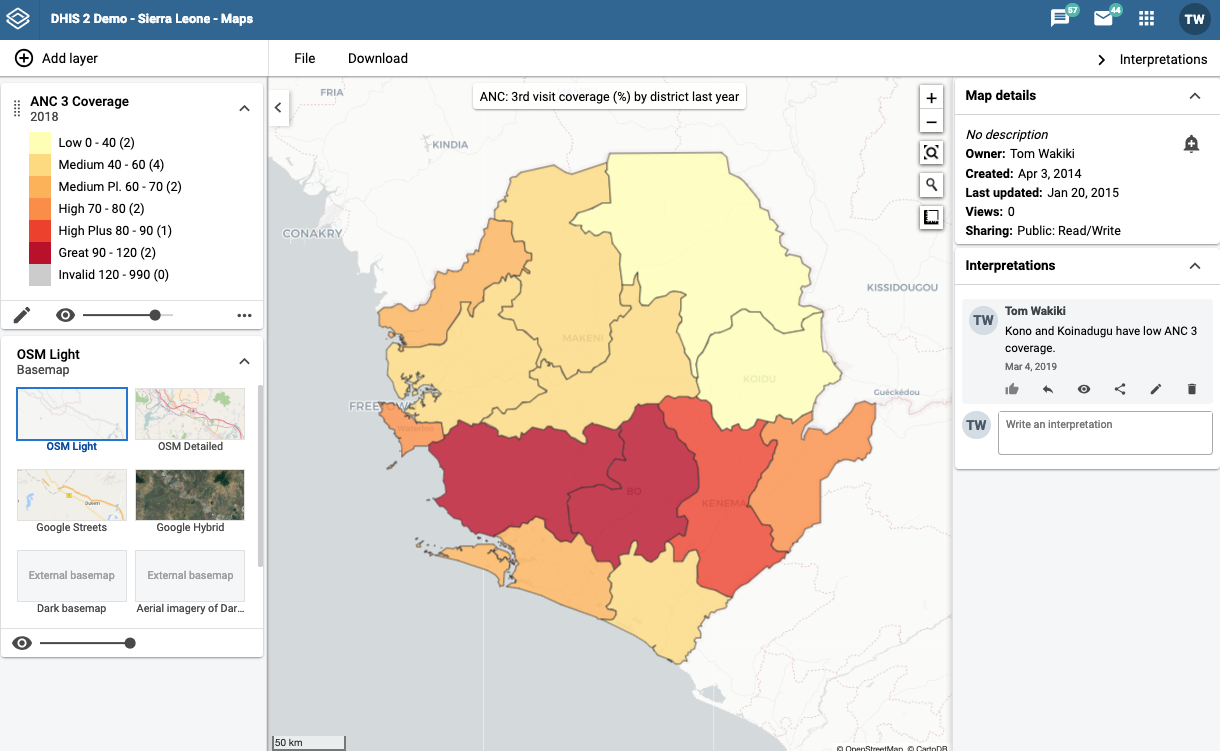
Pour afficher les interprétations pour des périodes relatives, par exemple des interprétations de l'année dernière :
Ouvrez un favori avec des interprétations.
Click Interpretations in the top right of the workspace to open the interpretations panel.
Click an interpretation. Your map displays the data and the date based on when the interpretation was created. To view other interpretations, click them.
To create an interpretation, you first need to create a map and save it. If you've shared your map with other people, the interpretation you write is visible to those people.
Ouvrez un favori avec des interprétations.
Click Interpretations in the top right of the workspace to open the interpretations panel.
A text field will appear with a placeholder "Write an interpretation" for users that have read access to the favorite.
In the text field, type a comment, question or interpretation. You can also mention other users with '@username'. Start by typing '@' plus the first letters of the username or real name and a mentioning bar will display the available users. Mentioned users will receive an internal DHIS2 message with the interpretation or comment. You can see the interpretation in the Dashboard app.
Click SAVE if you want your interpretation to have the same sharing settings as the map.
Click SAVE & SHARE if you want to change the sharing settings (see below) for your interpretation.
Cliquez sur une interprétation (voir ci-dessus comment visualiser une interprétation).
Click Share below the interpretation. The sharing settings dialog opens.
Search for and add a users and user groups that you want to share your map with.
Modifiez les paramètres de partage pour les utilisateurs que vous souhaitez modifier :
Lecture et écriture : Tout le monde peut consulter et éditer l'objet.
Lecture uniquement : tout le monde peut consulter l'objet.
No access: The public won't have access to the object. This setting is only applicable to Public access.
Cliquez sur FERMER après la mise à jour des paramètres de partage.
Vous pouvez télécharger votre carte sous forme d'image en cliquant sur le bouton "Télécharger" dans le menu du haut
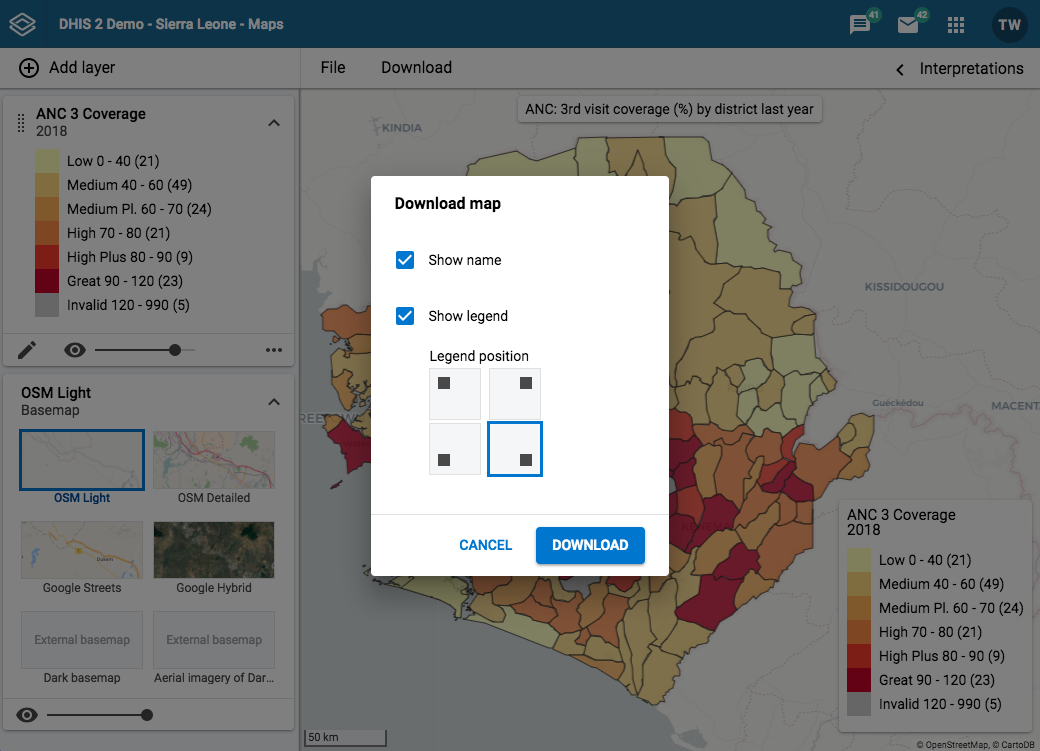
Map download is not supported in Internet Explorer or Safari, we recommend to use Google Chrome or Firefox.
Select if you want to include the map name or not. This option is only available if the map is saved.
Select if you want to include the map legend. You can position the legend in one of the 4 corners of your map.
Cliquez sur Télécharger pour télécharger votre carte.
The place search function allows you to search for almost any location or address. This function is useful in order to locate for example sites, facilities, villages or towns on the map.
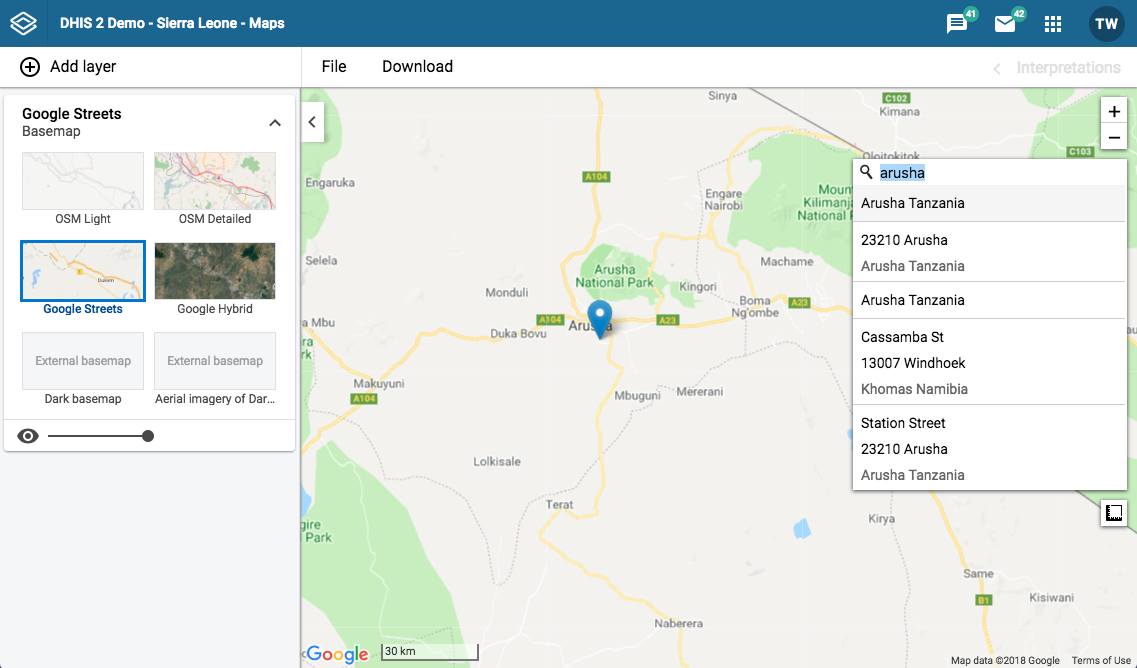
Sur le côté droit de la fenêtre Cartes, cliquez sur l'icône loupe.
Saisissez l'emplacement que vous recherchez.
Une liste des emplacements correspondants apparaît au fur et à mesure que vous saisissez.
From the list, select a location. A pin indicates the location on the map.
In the upper left part of the map, put the cursor on the Measure distances and areas (ruler) icon and click Create new measurement.
Ajouter des points à la carte.
Cliquez sur Terminer la mesure.
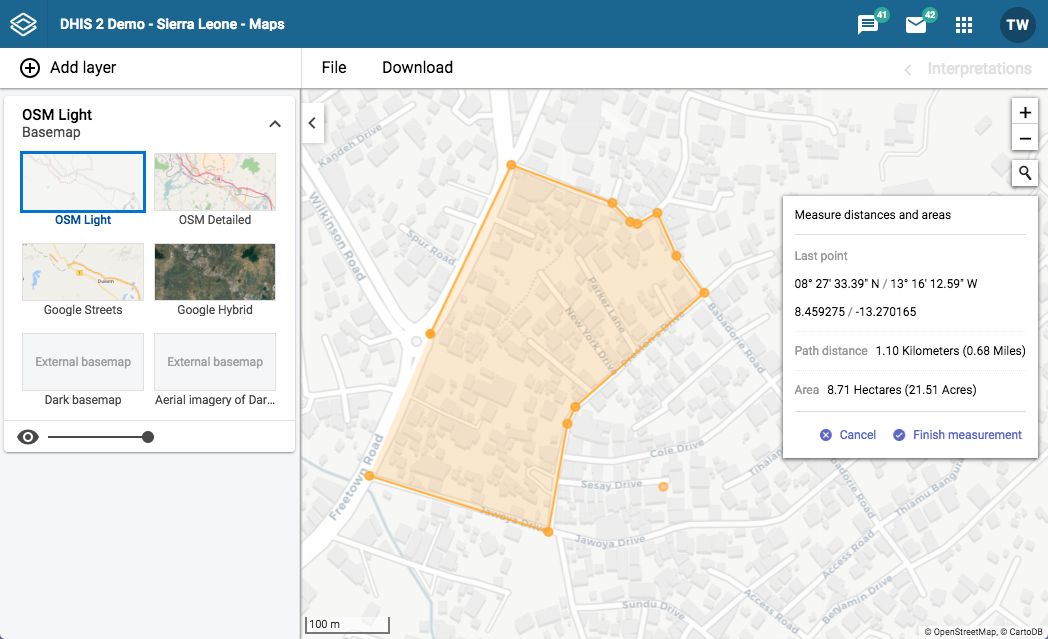
Right-click a point on the map and select Show longitude/latitude. The values display in a pop-up window.
Dashboards are intended to provide quick access to different analytical objects (maps, charts, reports, tables, etc) to an individual user. Dashboards can also be shared with user groups.
A user or administrator could create a dashboard called "Antenatal care" which might contain all relevant information on antenatal care. This dashboard could then be shared with the user group called "ANC control", which might consist of all users of the ANC control program. All users within this group would then be able to view the same dashboard.
Dashboards have a title, description, and any number of dashboard items. The dashboard items can be of many different types, including charts, maps, reports, tables, resources, messages, and text items. Above the dashboard is the control bar, which shows all your available dashboards, including a dashboard search field, and a + button for creating a new dashboard.
The dashboard has two modes: view and edit/create. When you first log in to DHIS2, your most recently used dashboard will be displayed in view mode, if you are on the same computer as you were previously. If you are using a different computer, then the first starred dashboard will be displayed. If there are no starred dashboards, then the first dashboard (alphabetically) will be displayed. Starred dashboards always show first in the dashboard list.
The screenshot below shows a dashboard called "Antenatal Care", which has been populated with charts and maps.
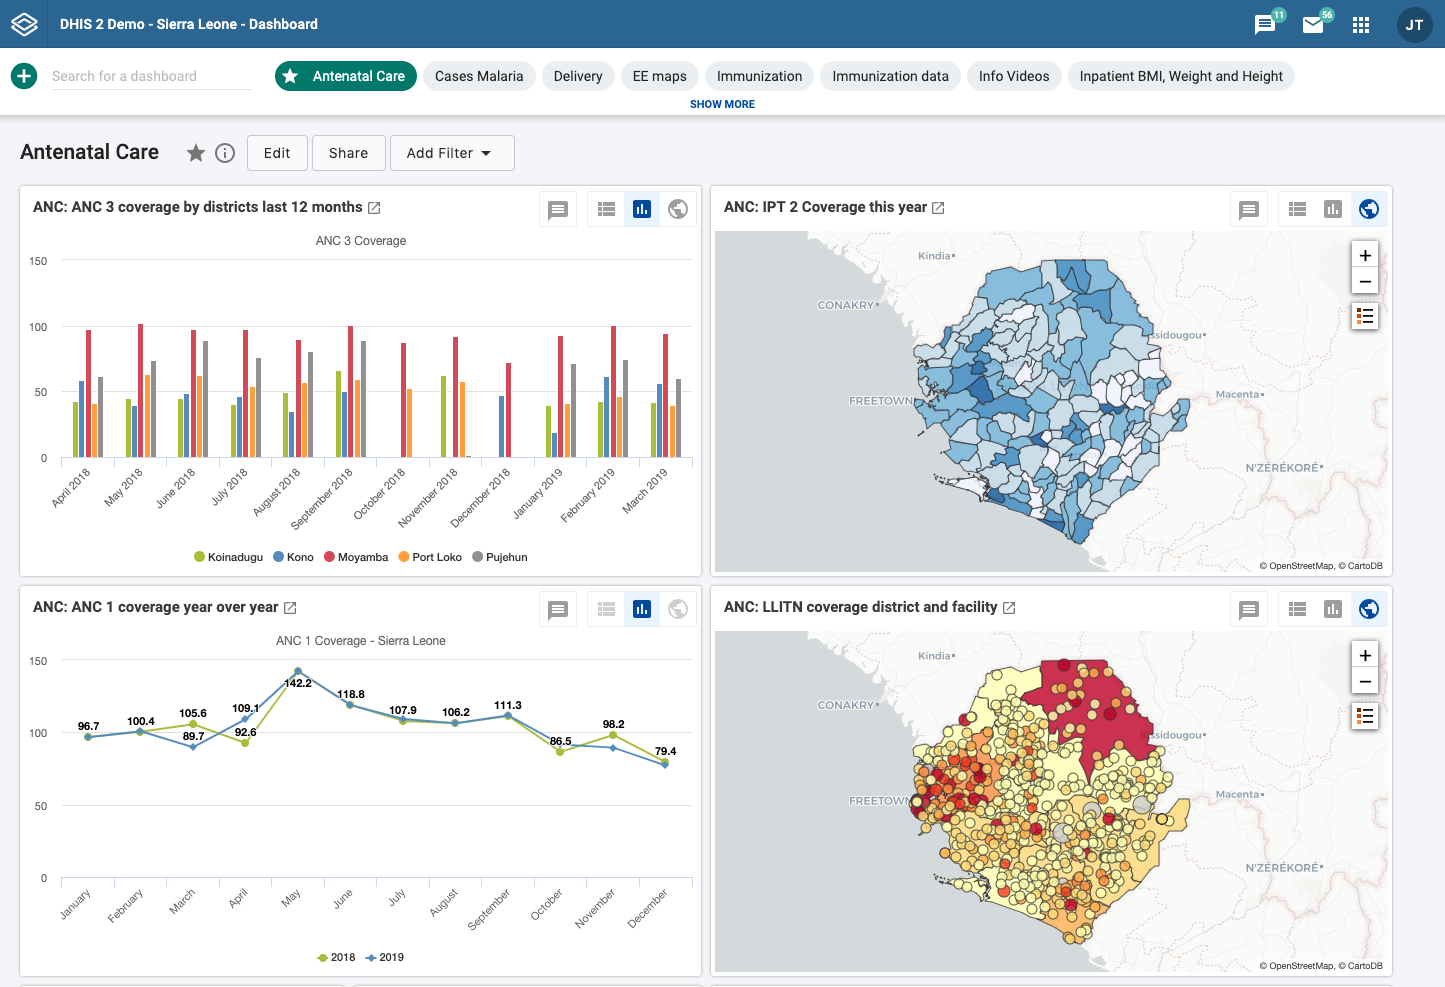
You can search for a specific dashboard using the search field in the upper left of the control bar entitled “Search for a dashboard”. The search is case insensitive, and as you type, the list of dashboards will filter down to those that match your search text.
You can set a specific height for the dashboards control bar by down-clicking and dragging the bottom edge of the control bar. When you finish dragging, the new height will be set. Clicking on SHOW MORE will expand the control bar to its maximum height (10 "rows"). Clicking on SHOW LESS will reset the height to your customized height.
To create a new dashboard, click the green + button in the left corner of the control bar to go into create mode. Add a title in the title field, and optionally a description in the description field.

Créer un mode :
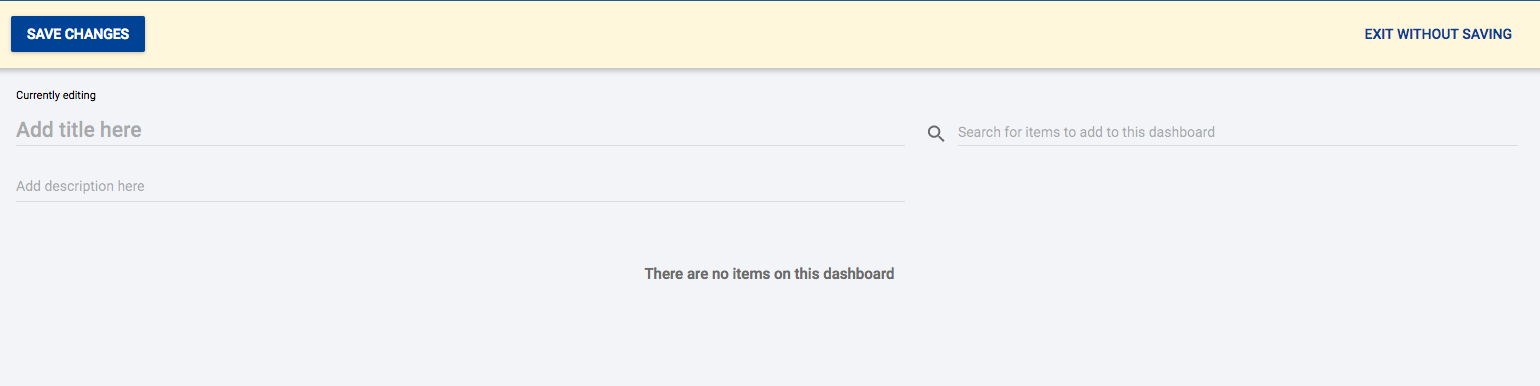
Add items to the dashboard by searching from the item selector in the upper right part of the dashboard area. Available items include:
Tableaux croisés dynamiques
Graphiques
Cartes
Rapports d'évènements
Graphiques d'évènements
Rapports
Ressources
Applications
Adresses électronique
Zones de texte
Espaceur
The list of items in the drop-down initially displays the first 5 available from each category, based on the search text you enter. Email, text boxes and spacer items are also found in the drop-down. To view more items, click on SEE MORE, and the list for that type will be extended to 15 items. If you still do not find the item you want, try typing a more specific search text.
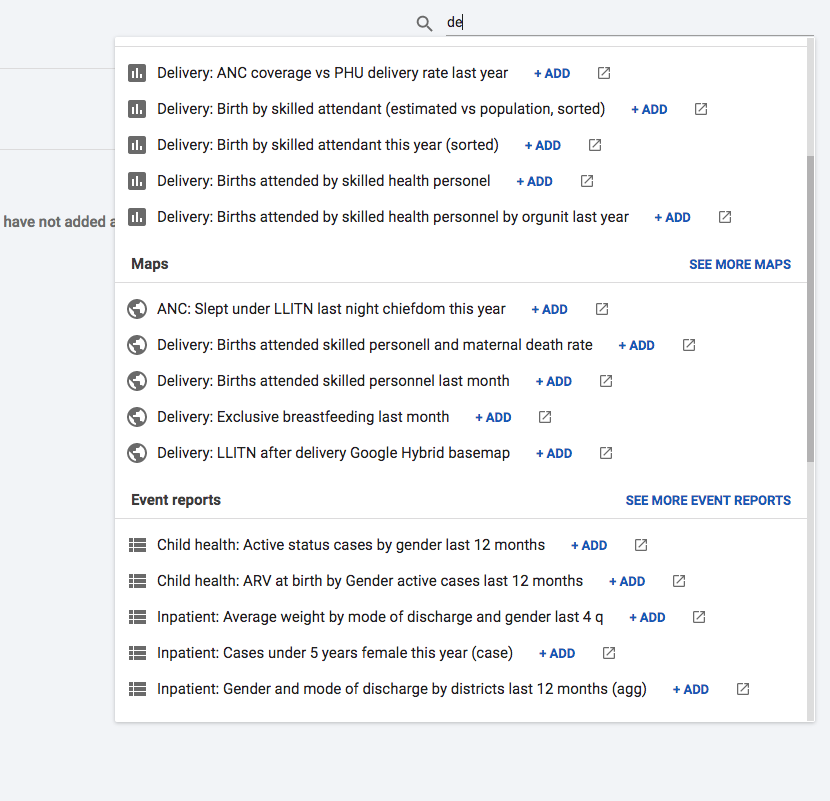
Once you select an item, it will be added to the top left position of the dashboard. The added items can be moved using the mouse by down-clicking on the item and dragging it to the desired position. It can also be resized with the mouse by down-clicking on the drag handle in the lower right corner of the item and dragging to the desired size.
The dashboard is configured with the "anti-gravity" setting for positioning items. This means that items will "rise" upwards until they run into another item. In order to force empty vertical space between items (like an empty row), you can add spacer items to the dashboard. They are only visible in edit/create mode. In view mode, they are not displayed, but take up the defined space.
Elément d'espacement en mode édition/création:
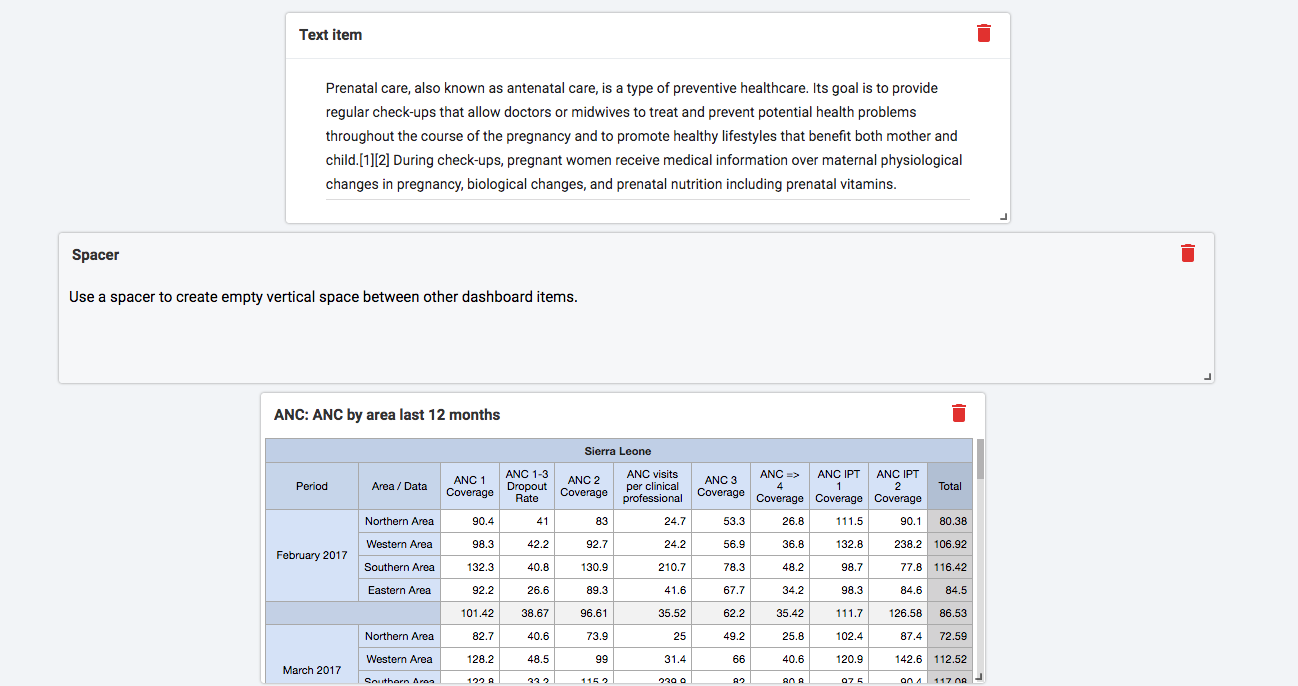
**Spacer en mode visualisation **
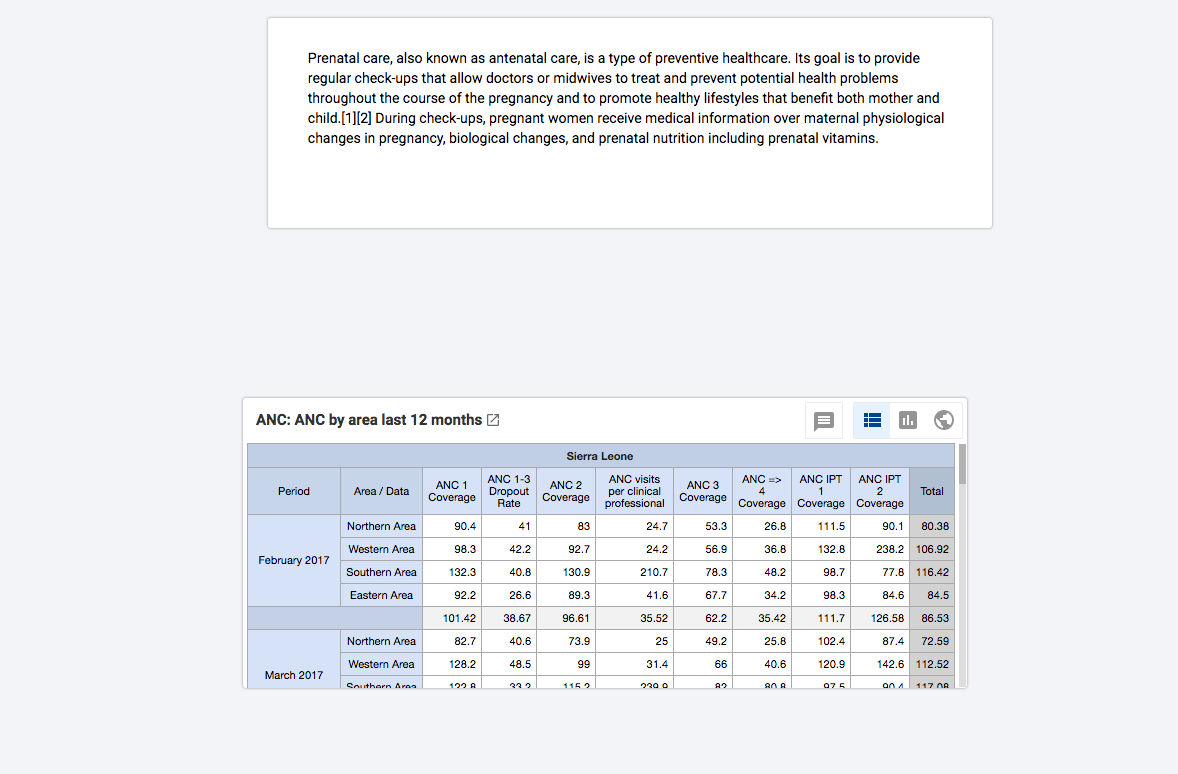
Remove items by clicking on the red trash can at the upper right of the item. Be aware that because of the "anti-gravity" setting in the dashboard, when you remove an item, the items that are positioned below the removed item will "rise" upwards.
When creating or editing a dashboard, changes are only saved when you click SAVE CHANGES button in the dashboard edit bar at the top of the page. If you don't want to save your changes, click the EXIT WITHOUT SAVING button to the upper right. You will then be returned to view mode with the dashboard you were previously viewing.
If you have access rights to edit the currently active dashboard, there will be an EDIT button to the right of the dashboard title in view mode. Click on this button to enter edit mode.

Refer to the above section about creating dashboards for information on adding and removing items to the dashboard.

You can add translations for dashboard title and description while in edit mode. The dialog provides a list of languages to translate to, and shows the original dashboard title underneath the name input field.
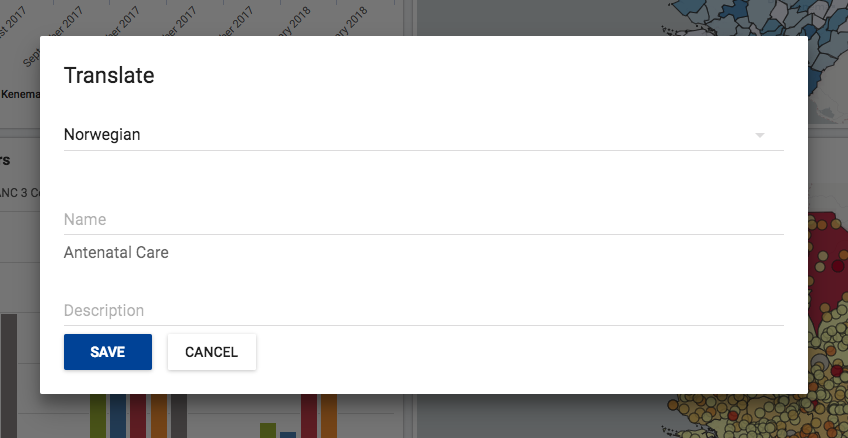
Cliquez sur le bouton TRADUIRE situé au-dessus du tableau de bord.
Sélectionnez la langue vers laquelle vous souhaitez traduire.
Ajoutez le titre et/ou la description et cliquez sur SAUVEGARDER.
If you have access to delete the dashboard, then there will be a DELETE button located above the dashboard, when in edit mode. A confirmation dialog will first be displayed to confirm that you want to delete the dashboard.
When in view mode, you can toggle showing the description, star a dashboard, apply filters, and share the dashboard with other users and groups.
To view the description, click on the i button to the right of the title
Your starred dashboards are listed first in the list of dashboards. To star a dashboard, click on the star button to the right of the title. When the star is “filled”, that means the dashboard is starred. Starring a dashboard only applies to you, not other users.
Multiple filters can be applied to a dashboard for changing the data displayed in the various dashboard items. The filters are applied to each dashboard item in the same way: each added filter overrides the original value for that dimension in the original chart, table or map (visualization). It is possible to filter on Organisation Units, Periods and other dynamic dimensions depending on the DHIS2 instance.
To add a filter, click on the Add Filter button and choose the dimension:

Une boîte de dialogue s'ouvre et permet de sélectionner le filtre.
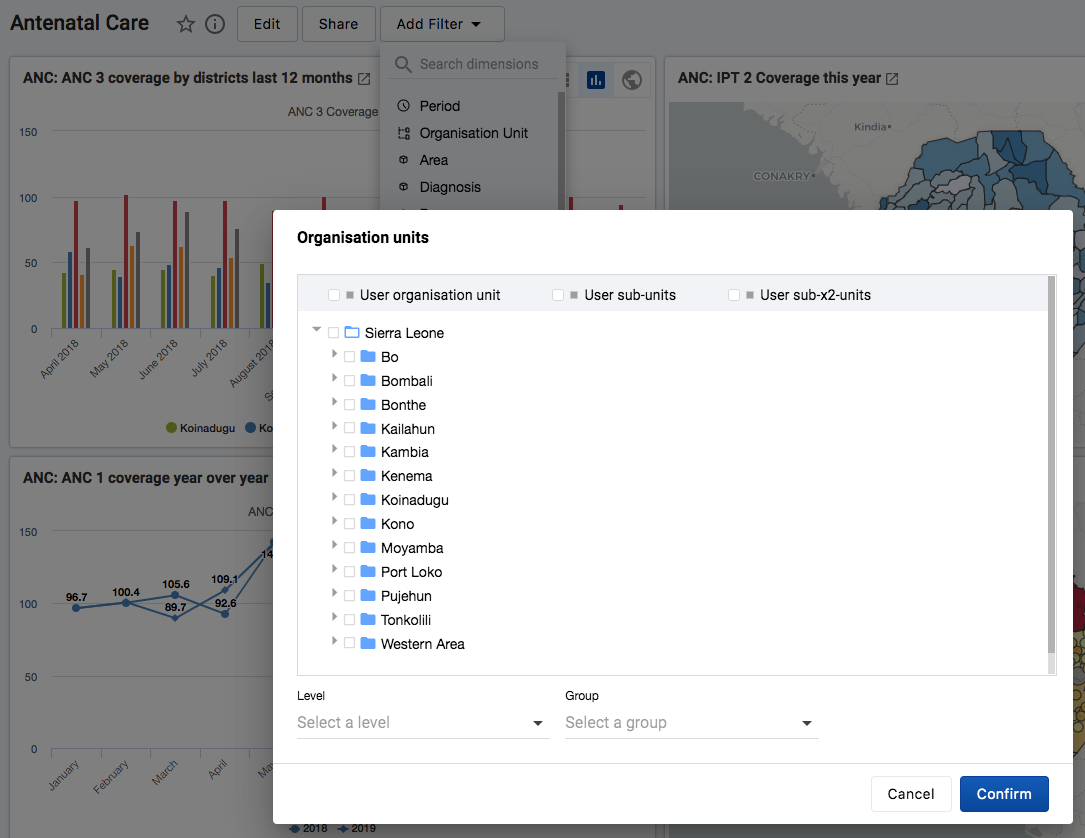
Click on Confirm in the dialog to apply the filter to the current dashboard.
Filters are not stored, so when switching to a different dashboard they are lost. Filter badges appear above the dashboard items to indicate that what is shown in the dashboard items is not the original visualization, but a manipulated one where the filters override the stored dimensions' values.
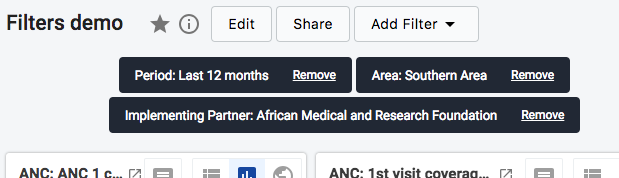
Filter badges can be clicked for opening the filter selection dialogs thus allowing for filter editing. A filter can be removed by clicking on the Remove button in the badge. Whenever a filter is added, edited or removed, the dashboard items reload to show the updated data. Filter badges are always visible at the top of the page when scrolling the dashboard content.
Dashboard items showing charts, pivot tables and maps can be toggled between these visualizations. Click on the buttons in the upper right corner of the item to toggle between visualizations.

You can write interpretations for the chart, pivot table, map, event report, and event chart items. Click on the interpretations button  , and the item will be expanded vertically underneath to show the interpretations and replies. You can like an interpretation, reply to an interpretation, and add your own interpretation. You can edit, share or delete your own interpretations and replies, and if you have moderator access, you can delete others’ interpretations.
It is possible to format the description field, and interpretations with bold, italic by using the Markdown style markers * and _ for bold and italic respectively. The text field for writing new interpretations has a toolbar for adding rich text. Keyboard shortcuts are also available: Ctrl/Cmd + B and Ctrl/Cmd + I. A limited set of smilies is supported and can be used by typing one of the following character combinations: :) :-) :( :-( :+1 :-1. URLs are automatically detected and converted into a clickable link.
Interpretations are sorted in descending order by date, with the most recent shown on top. Interpretation replies are sorted in ascending order by date, with the oldest shown on top.
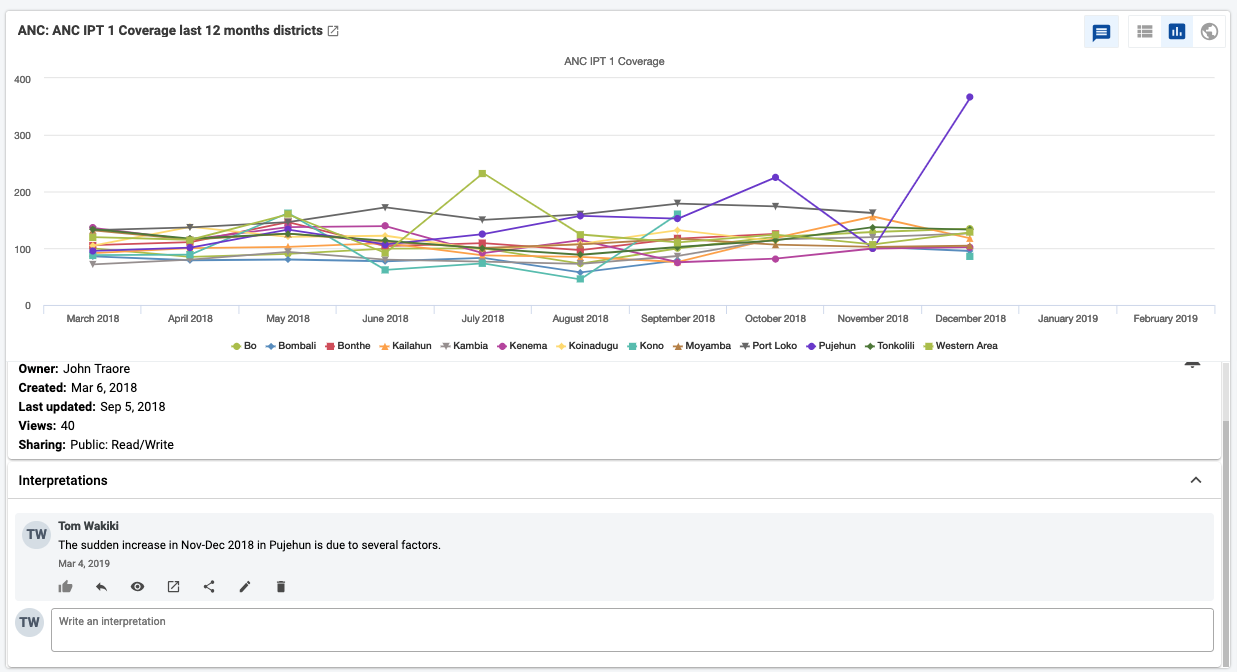
In order to share a dashboard with user groups, click on the SHARE button to the right of the dashboard title to display the dashboard sharing settings options. To share the dashboard with specific users or user groups, type in the name in the input field to add them to the dashboard sharing settings
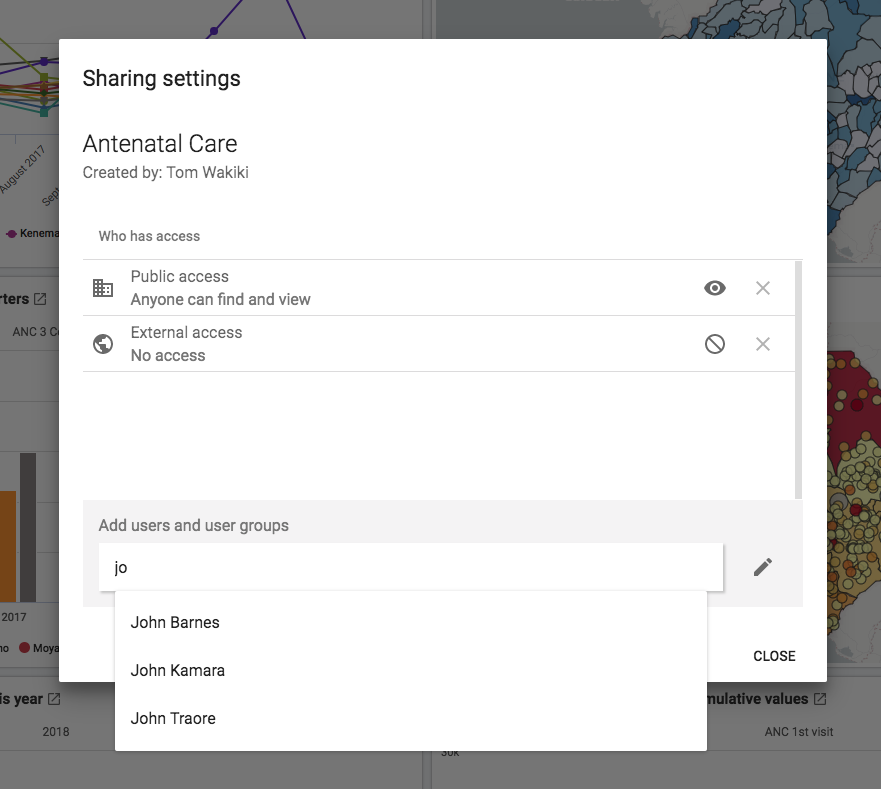
Tous les tableaux de bord ont deux groupes de partage définis par défaut.
Accès externe (sans login)
This option, when selected, provides access to the dashboard as an external resource. This is useful for when you are creating an external web portal but would like to call information from a dashboard you have made internally within DHIS2. By default, this option is not selected.
Accès public (avec login)
This option allows the selected dashboard to be pushed to all users within your DHIS2 instance. This can also be hidden from public view by selecting the "None" option, which is the default option for new dashboards.
User groups that have been added manually can be assigned two types of permissions within the dashboard
Lecture seule
Fournit au groupe d'utilisateurs des droits de visualisation uniquement sur le tableau de bord.
Lecture et écriture
Allows the user groups to edit the dashboard in addition to viewing it. Editing allows for altering the layout, resizing and removing items, renaming/deleting the dashboard etc.
You can provide users with the url of the dashboard, allowing them to navigate directly to the dashboard. To get the dashboard url, just access the dashboard in view mode, and copy the browser url. For example, the url to the Antenatal Care dashboard in play.dhis2.org/demo is:
https://play.dhis2.org/demo/dhis-web-dashboard/#/nghVC4wtyzi
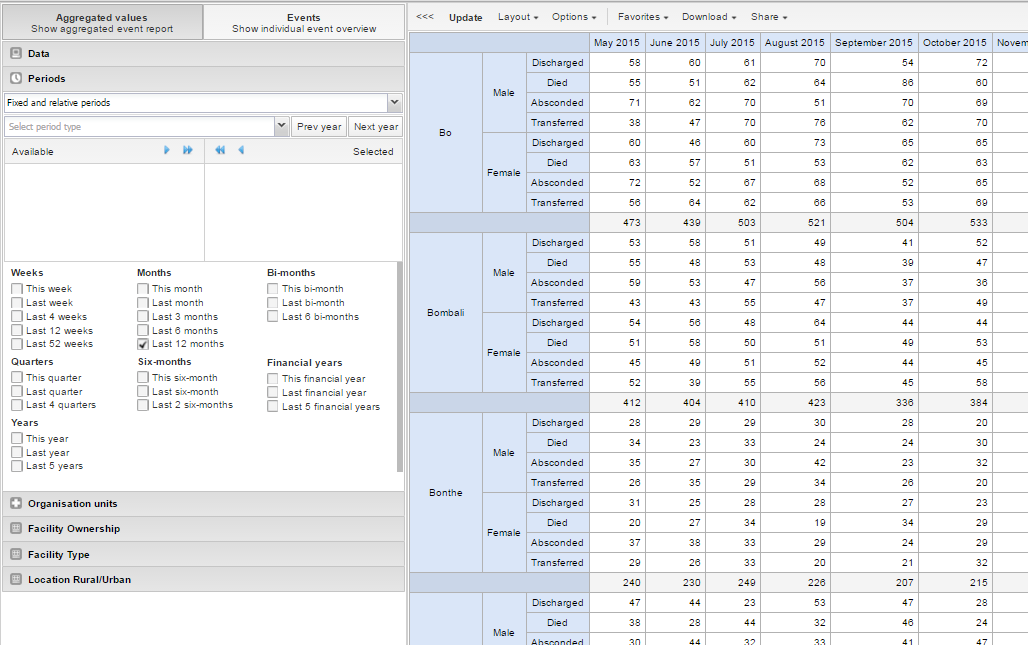
With the **Event Report**s app you can analyse events in two types of reports:
Aggregated event reports: Pivot table-style analysis with aggregated numbers of events
By selecting Aggregated values from the top-left menu you can use the Event Reports app to create pivot tables with aggregated numbers of events. An event report is always based on a program. You can do analysis based on a range of dimensions. Each dimension can have a corresponding filter. Dimensions can be selected from the left-side menu. Similar to the pivot tables app, aggregated event reports may be limited by the amount of RAM accessible by the browser. If your requested table exceeds a set size, you will recieve a warning prompt asking whether or not you want to continue.
Rapports d'événements individuels : Listes d'événements
By selecting Events from the top-left menu you can use the Event Reports app to make searches or queries for events based on a flexible set of criteria. The report will be displayed as a table with one row per event. Each dimension can be used as a column in the table or as a filter. Each dimension can have a criteria (filter). Data elements of type option set allows for "in" criteria, where multiple options can be selected. Numeric values can be compared to filter values using greater than, equal or less than operators.
Ouvrez l'application Rapports d'événements.
Sélectionnez Valeurs agrégées ou Événements.
Dans le menu de gauche, sélectionnez les méta-données que vous souhaitez analyser.
Cliquez sur Mise en page et organisez les dimensions.
Vous pouvez conserver la sélection par défaut si vous le souhaitez.
Cliquez sur Mettre à jour.
An event report is always based on a program and you can do analysis based on a range of dimensions. For programs with category combinations, you can use program categories and category option group sets as dimensions for tables and charts. Each dimension item can have a corresponding filter.
Sélectionner des éléments de données :
Cliquez sur Données.
Sélectionnez un programme et une étape du programme.
The data elements associated with the selected program are listed under Available. Each data element acts as a dimension.
Select the data elements you need by double-clicking their names.
Data elements can be filtered by type (Data elements, Program attributes, Program indicators) and are prefixed to make them easily recognizable.
After selecting a data element, it is visible under Selected data items.
(Optional) For each data element, specify a filter with operators such as "greater than", "in" or "equal" together with a filter value.
Sélectionner les périodes.
Cliquez sur Périodes.
Sélectionnez une ou plusieurs périodes.
You have three period options: relative periods, fixed periods and start/end dates. You can combine fixed periods and relative periods in the same chart. You cannot combine fixed periods and relative periods with start/end dates in the same chart. Overlapping periods are filtered so that they only appear once.
Fixed periods: In the Select period type box, select a period type. You can select any number of fixed periods from any period type. Fixed periods can for example be "January 2014".
Relative periods: In the lower part of the Periods section, select as many relative periods as you like. The names are relative to the current date. This means that if the current month is March and you select Last month, the month of February is included in the chart. Relative periods has the advantage that it keeps the data in the report up to date as time goes.
Start/end dates: In the list under the Periods tab, select Start/end dates. This period type lets you specify flexible dates for the time span in the report.
Sélectionner les unités d'organisation
Cliquez sur Unités d'organisation.
Cliquez sur l'icône de la boîte de vitesse.
Sélectionnez un Mode de sélection et une unité d'organisation.
Il existe trois différents modes de sélection :
Selection mode | Description |
|---|---|
Select organisation units | Lets you select the organisation units you want to appear in the chart from the organization tree. Select User org unit to disable the organisation unit tree and only select the organisation unit that is related to your profile. Select User sub-units to disable the organisation unit tree and only select the sub-units of the organisation unit that is related to your profile. Select User sub-x2-units to disable the organisation unit tree and only select organisation units two levels down from the organisation unit that is related to your profile. This functionality is useful for administrators to create a meaningful "system" favorite. With this option checked all users find their respective organisation unit when they open the favorite. |
Select levels | Lets you select all organisation units at one or more levels, for example national or district level. You can also select the parent organisation unit in the tree, which makes it easy to select for example, all facilities inside one or more districts. |
Select groups | Lets you select all organisation units inside one or several groups and parent organisation units at the same time, for example hospitals or chiefdoms. |
Cliquez sur Mettre à jour.
You can define which data dimension you want to appear as columns, rows and filters in the pivot table. Each data element appears as individual dimensions and can be placed on any of the axes.
Note
Data elements of continuous value types (real numbers/decimal numbers) can only be used as filters, and will automatically be positioned as filters in the layout dialog. The reason for this is that continuous number cannot be grouped into sensible ranges and used on columns and rows.
Cliquez sur Mise en page.
Glissez et déposez les dimensions dans l'espace approprié.
Cliquez sur Mettre à jour.
Vous pouvez personnaliser l'affichage d'un rapport d'événement.
Cliquez sur Options.
Set the options as required. Available options are different between aggregated event reports and individual event reports.
Option | Description | Available for report type | |
|---|---|---|---|
Data | Show column totals | Displays totals at the end of each column in the pivot table. | Aggregated event report |
Show column sub-totals | Displays sub-totals for each column in the pivot table. | Aggregated event report | |
Show row totals | Displays totals at the end of each row in the pivot table. | Aggregated event report | |
Show row sub-totals | Displays sub-totals for each row in the pivot table. | Aggregated event report | |
Show dimension labels | Displays labels for dimensions. | Aggregated event report | |
Hide empty rows | Hides empty rows in the pivot table. | Aggregated event report | |
Hide n/a data | Hides data tagged as N/A from the chart. | Aggregated event report | |
Include only completed events | Includes only completed events in the aggregation process. This is useful when you want for example to exclude partial events in indicator calculations. | Aggregated event report Individual event report | |
Limit | Sets a limit of the maximum number of rows that you can display in the table, combined with a setting for showing top or bottom values. | Aggregated event report | |
Output type | Defines the output type. The output types are Event, Enrollment andTracked entity instance. | Aggregated event report | |
Program status | Filters data based on the program status: All, Active, Completed or Cancelled. | Aggregated event report | |
Event status | Filters data based on the event status: All, Active, Completed, Scheduled, Overdue or Skipped. | Aggregated event report | |
| Organisation units | Show hierarchy | Includes the names of all parents of each organisation unit in labels. | Aggregated event report |
Style | Display density | Controls the size of the cells in the table. You can set it to Comfortable, Normal or Compact. Compact is useful when you want to fit large tables into the browser screen. | Aggregated event report Individual event report |
Font size | Controls the size of the table text font. You can set it to Large, Normal or Small. | Aggregated event report Individual event report | |
Digit group separator | Controls which character to separate groups of digits or "thousands". You can set it to Comma, Space or None. | Aggregated event report Individual event report |
Cliquez sur Mettre à jour.
You can download the data source behind an event report in HTML, JSON, XML, Microsoft Excel or CSV formats.
Cliquez sur Télécharger.
Sous Source de données standards, cliquez sur le format que vous souhaitez télécharger.
Format | Description |
|---|---|
HTML | Creates HTML table based on selected meta data |
JSON | Downloads data values in JSON format based on selected meta data |
XML | Downloads data values in XML format based on selected meta data |
Microsoft Excel | Downloads data values in Microsoft Excel format based on selected meta data |
CSV | Downloads data values in CSV format based on selected meta data |
Saving your charts or pivot tables as favorites makes it easy to find them later. You can also choose to share them with other users as an interpretation or display them on the dashboard.
You view the details and interpretations of your favorites in the Pivot Table, Data Visualizer, Event Visualizer, Event Reports apps. Use the Favorites menu to manage your favorites.
Cliquez sur Favoris > Ouvrir.
Enter the name of a favorite in the search field, or click Prev and Next to display favorites.
Cliquez sur le nom du favori que vous souhaitez ouvrir.
Cliquez sur Favoris > Sauvegarder.
Entrez un Nom et une Description pour votre favori. Le champ de description supporte un format RTF, voir la section interprétations pour plus de détails.
Cliquez sur Sauvegarder.
Cliquez sur Favoris > Renommer.
Entrez le nouveau nom que vous souhaitez donner à votre favori.
Cliquez sur Mettre à jour.
An interpretation is a link to a resource with a description of the data at a given period. This information is visible in the Dashboard app. To create an interpretation, you first need to create a favorite. If you've shared your favorite with other people, the interpretation you write is visible to those people.
Cliquez sur Favoris > Écrire une interprétation.
In the text field, type a comment, question or interpretation. You can also mention other users with '@username'. Start by typing '@' plus the first letters of the username or real name and a mentioning bar will display the available users. Mentioned users will receive an internal DHIS2 message with the interpretation or comment. You can see the interpretation in the Dashboard app.
It is possible to format the text with bold, italic by using the Markdown style markers * and _ for bold and italic respectively. Keyboard shortcuts are also available: Ctrl/Cmd + B and Ctrl/Cmd + I. A limited set of smilies is supported and can be used by typing one of the following character combinations: :) :-) :( :-( :+1 :-1. URLs are automatically detected and converted into a clickable link.
Search for a user group that you want to share your favorite with, then click the + icon.
Modifiez les paramètres de partage pour les groupes d'utilisateurs que vous souhaitez modifier.
Lecture et écriture : Tout le monde peut consulter et éditer l'objet.
Lecture uniquement : tout le monde peut consulter l'objet.
None: The public won't have access to the object. This setting is only applicable to Public access.
Cliquez sur Partager.
When you are subscribed to a favorite, you receive internal messages whenever another user likes/creates/updates an interpretation or creates/update an interpretation comment of this favorite.
Ouvrez un favori.
Cliquez >>> en haut à droite de l'espace de travail.
Cliquez sur l'icône en cloche en haut à droite pour vous abonner à ce favori.
Cliquez sur Favoris > Créer un lien.
Sélectionnez l'une des options suivantes :
Open in this app: You get a URL for the favorite which you can share with other users by email or chat.
Open in web api: You get a URL of the API resource. By default this is an HTML resource, but you can change the file extension to ".json" or ".csv".
Cliquez sur Favoris > Supprimer.
Cliquez sur OK.
Pour afficher les interprétations pour des périodes relatives, par exemple des interprétations de l'année dernière :
Ouvrez un favori avec des interprétations.
Cliquez >>> en haut à droite de l'espace de travail.
Click an interpretation. Your chart displays the data and the date based on when the interpretation was created.To view other interpretations, click them.
Après avoir produit un rapport d'événement, vous pouvez l'ouvrir sous forme de tableau :
Cliquez sur Graphique > Ouvrir cette graphique sous forme de tableau.
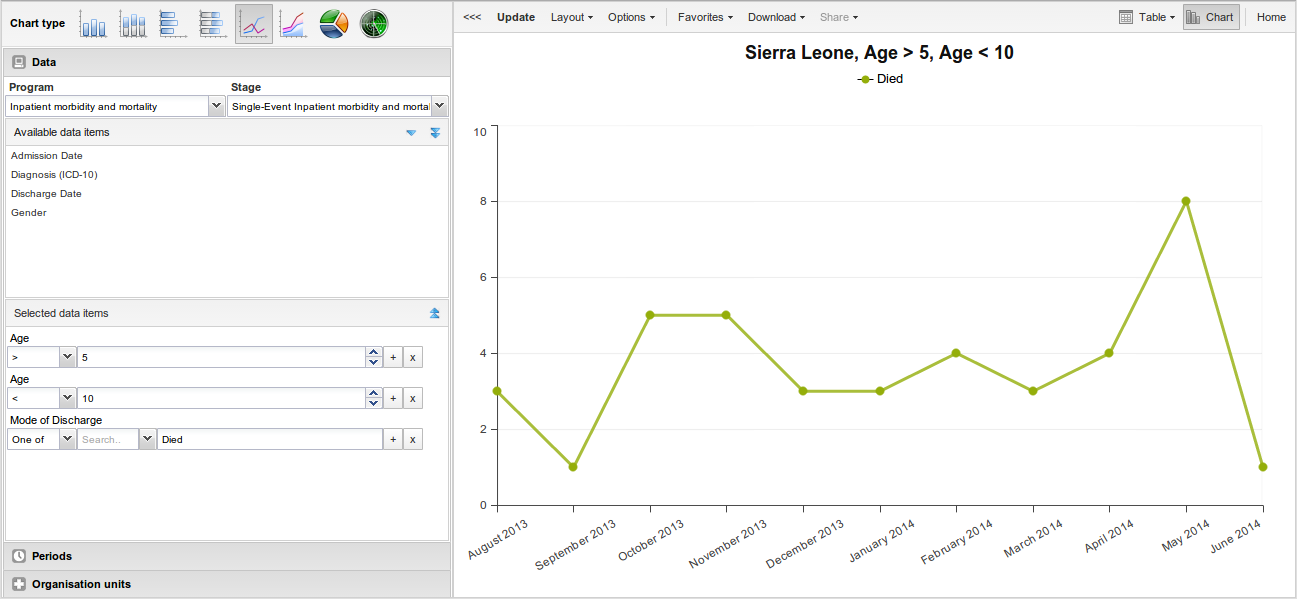
With the Event Visualizer app, you can create charts based on event data.
\<Ouvrez l'application Visualiseur d'événement et sélectionnez un type de graphique.
Dans le menu de gauche, sélectionnez les méta-données que vous souhaitez analyser.
Cliquez sur Mise en page et organisez les dimensions.
Vous pouvez conserver la sélection par défaut si vous le souhaitez.
Cliquez sur Mettre à jour.
The Event Visualizer app has eight different chart types, each with different characteristics. To select a chart type:
Dans Type de graphique, cliquez sur le type de graphique dont vous avez besoin.
Chart type | Description |
|---|---|
Column chart | Displays information as vertical rectangular columns with lengths proportional to the values they represent. Useful when you want to, for example, compare performance of different districts. |
Stacked column chart | Displays information as vertical rectangular columns, where bars representing multiple categories are stacked on top of each other. Useful when you want to, for example, display trends or sums of related data elements. |
Bar chart | Same as column chart, only with horizontal bars. |
Stacked bar chart | Same as stacked column chart, only with horizontal bars. |
Line chart | Displays information as a series of points connected by straight lines. Also referred to as time series. Useful when you want to, for example, visualize trends in indicator data over multiple time periods. |
Area chart | Is based on line chart, with the space between the axis and the line filled with colors and the lines stacked on top of each other. Useful when you want to compare the trends of related indicators. |
Pie chart | Circular chart divided into sectors (or slices). Useful when you want to, for example, visualize the proportion of data for individual data elements compared to the total sum of all data elements in the chart. |
Radar chart | Displays data on axes starting from the same point. Also known as spider chart. |
Cliquez sur Mettre à jour.
An event chart is always based on a program and you can do analysis based on a range of dimensions. For programs with category combinations, you can use program categories and category option group sets as dimensions for tables and charts. Each dimension item can have a corresponding filter. You select dimension items from the left-side menu.
Sélectionner des éléments de données :
Cliquez sur Données.
Sélectionnez un programme et une étape du programme.
The data elements associated with the selected program are listed under Available. Each data element acts as a dimension.
Select the data elements you need by double-clicking their names.
Data elements can be filtered by type (Data elements, Program attributes, Program indicators) and are prefixed to make them easily recognizable.
After selecting a data element, it is visible under Selected data items.
(Optional) For each data element, specify a filter with operators such as "greater than", "in" or "equal" together with a filter value.
Sélectionner les périodes.
Cliquez sur Périodes.
Sélectionnez une ou plusieurs périodes.
You have three period options: relative periods, fixed periods and start/end dates. You can combine fixed periods and relative periods in the same chart. You cannot combine fixed periods and relative periods with start/end dates in the same chart. Overlapping periods are filtered so that they only appear once.
Fixed periods: In the Select period type box, select a period type. You can select any number of fixed periods from any period type. Fixed periods can for example be "January 2014".
Relative periods: In the lower part of the Periods section, select as many relative periods as you like. The names are relative to the current date. This means that if the current month is March and you select Last month, the month of February is included in the chart. Relative periods has the advantage that it keeps the data in the report up to date as time goes.
Start/end dates: In the list under the Periods tab, select Start/end dates. This period type lets you specify flexible dates for the time span in the report.
Sélectionner les unités d'organisation
Cliquez sur Unités d'organisation.
Cliquez sur l'icône de la boîte de vitesse.
Sélectionnez un Mode de sélection et une unité d'organisation.
Il existe trois différents modes de sélection :
Selection mode | Description |
|---|---|
Select organisation units | Lets you select the organisation units you want to appear in the chart from the organization tree. Select User org unit to disable the organisation unit tree and only select the organisation unit that is related to your profile. Select User sub-units to disable the organisation unit tree and only select the sub-units of the organisation unit that is related to your profile. Select User sub-x2-units to disable the organisation unit tree and only select organisation units two levels down from the organisation unit that is related to your profile. This functionality is useful for administrators to create a meaningful "system" favorite. With this option checked all users find their respective organisation unit when they open the favorite. |
Select levels | Lets you select all organisation units at one or more levels, for example national or district level. You can also select the parent organisation unit in the tree, which makes it easy to select for example, all facilities inside one or more districts. |
Select groups | Lets you select all organisation units inside one or several groups and parent organisation units at the same time, for example hospitals or chiefdoms. |
Cliquez sur Mettre à jour.
You can define which data dimension you want to appear as series, category and filter. Each data element appears as individual dimensions and can be placed on any of the axes. Series and category panels can only have one dimension at the time.
Note
Data elements of continuous value types (real numbers/decimal numbers) can only be used as filters, and will automatically be positioned as filters in the layout dialog. The reason for this is that continuous number cannot be grouped into sensible ranges and used on columns and rows.
Cliquez sur Mise en page.
Drag and drop the dimensions to the appropriate space. Only one dimension can be in each section.
Cliquez sur Mettre à jour.
Vous pouvez personnaliser l'affichage d'un rapport d'événement.
Cliquez sur Options.
Définissez les options selon les besoins.
Option | Description | |
|---|---|---|
Data | Show values | Displays values as numbers on top of each series. |
Use 100% stacked values | Displays 100 % stacked values in column charts. | |
Use cumulative values | Displays cumulative values in line charts. | |
Hide n/a data | Hides data tagged as N/A from the chart. | |
Include only completed events | Includes only completed events in the aggregation process. This is useful when you want for example to exclude partial events in indicator calculations. | |
Hide empty categories | Hides the category items with no data from the chart. None: doesn't hide any of the empty categories Before first: hides missing values only before the first value After last: hides missing values only after the last value Before first and after last: hides missing values only before the first value and after the last value All: hides all missing values This is useful for example when you create column and bar charts. | |
Trend line | Displays the trend line which visualizes how your data evolves over time. For example if performance is improving or deteriorating. Useful when periods are selected as category. | |
Target line value/title | Displays a horizontal line and title (optional) at the given domain value. Useful for example when you want to compare your performance to the current target. | |
Base line value/title | Displays a horizontal line and title (optional) at the given domain value. Useful for example when you want to visualize how your performance has evolved since the beginning of a process. | |
Sort order | Allows you to sort the values on your chart from either low to high or high to low. | |
Output type | Defines the output type. The output types are Event, Enrollment andTracked entity instance. | |
Program status | Filters data based on the program status: All, Active, Completed or Cancelled. | |
Event status | Filters data based on the event status: All, Active, Completed, Scheduled, Overdue or Skipped. | |
Axes | Range axis min/max | Defines the maximum and minimum value which will be visible on the range axis. |
Range axis tick steps | Defines the number of ticks which will be visible on the range axis. | |
Range axis decimals | Defines the number of decimals which will be used for range axis values. | |
Range axis title | Type a title here to display a label next to the range axis (also referred to as the Y axis). Useful when you want to give context information to the chart, for example about the unit of measure. | |
Domain axis title | Type a title here to display a label below the domain axis (also referred to as the X axis). Useful when you want to give context information to the chart, for example about the period type. | |
General | Hide chart legend | Hides the legend and leaves more room for the chart itself. |
Hide chart title | Hides the title (default or custom) of your chart. | |
Chart title | Type a title here to display a custom title above the chart. If you don't enter a title, the default title is displayed. | |
Hide chart subtitle | Hides the subtitle of your chart. | |
Chart subtitle | Type a subtitle here to display a custom subtitle above the chart but below the title. If you don't enter a subtitle, no subtitle is displayed in the chart. |
Cliquez sur Mettre à jour.
After you have created a chart you can download it to your local computer as an image or PDF file.
Cliquez sur Télécharger.
Sous Graphiques, cliquez sur Image (.png) ou PDF (.pdf).
The file is automatically downloaded to your computer. Now you can for example embed the image file into a text document as part of a report.
You can download the data source behind a chart in HTML, JSON, XML, Microsoft Excel or CSV formats. The data document uses identifiers of the dimension items and opens in a new browser window to display the URL of the request to the Web API in the address bar. This is useful for developers of apps and other client modules based on the DHIS2 Web API or for those who require a plan data source, for instance for import into statistical packages.
Pour télécharger les formats standards de source de données :
Cliquez sur Télécharger.
Sous Source de données standards, cliquez sur le format que vous souhaitez télécharger.
Format | Description |
|---|---|
HTML | Creates HTML table based on selected meta data |
JSON | Downloads data values in JSON format based on selected meta data |
XML | Downloads data values in XML format based on selected meta data |
Microsoft Excel | Downloads data values in Microsoft Excel format based on selected meta data |
CSV | Downloads data values in CSV format based on selected meta data |
Saving your charts or pivot tables as favorites makes it easy to find them later. You can also choose to share them with other users as an interpretation or display them on the dashboard.
You view the details and interpretations of your favorites in the Pivot Table, Data Visualizer, Event Visualizer, Event Reports apps. Use the Favorites menu to manage your favorites.
Cliquez sur Favoris > Ouvrir.
Enter the name of a favorite in the search field, or click Prev and Next to display favorites.
Cliquez sur le nom du favori que vous souhaitez ouvrir.
Cliquez sur Favoris > Sauvegarder.
Entrez un Nom et une Description pour votre favori. Le champ de description supporte un format RTF, voir la section interprétations pour plus de détails.
Cliquez sur Sauvegarder.
Cliquez sur Favoris > Renommer.
Entrez le nouveau nom que vous souhaitez donner à votre favori.
Cliquez sur Mettre à jour.
An interpretation is a link to a resource with a description of the data at a given period. This information is visible in the Dashboard app. To create an interpretation, you first need to create a favorite. If you've shared your favorite with other people, the interpretation you write is visible to those people.
Cliquez sur Favoris > Écrire une interprétation.
In the text field, type a comment, question or interpretation. You can also mention other users with '@username'. Start by typing '@' plus the first letters of the username or real name and a mentioning bar will display the available users. Mentioned users will receive an internal DHIS2 message with the interpretation or comment. You can see the interpretation in the Dashboard app.
It is possible to format the text with bold, italic by using the Markdown style markers * and _ for bold and italic respectively. Keyboard shortcuts are also available: Ctrl/Cmd + B and Ctrl/Cmd + I. A limited set of smilies is supported and can be used by typing one of the following character combinations: :) :-) :( :-( :+1 :-1. URLs are automatically detected and converted into a clickable link.
Search for a user group that you want to share your favorite with, then click the + icon.
Modifiez les paramètres de partage pour les groupes d'utilisateurs que vous souhaitez modifier.
Lecture et écriture : Tout le monde peut consulter et éditer l'objet.
Lecture uniquement : tout le monde peut consulter l'objet.
None: The public won't have access to the object. This setting is only applicable to Public access.
Cliquez sur Partager.
When you are subscribed to a favorite, you receive internal messages whenever another user likes/creates/updates an interpretation or creates/update an interpretation comment of this favorite.
Ouvrez un favori.
Cliquez >>> en haut à droite de l'espace de travail.
Cliquez sur l'icône en cloche en haut à droite pour vous abonner à ce favori.
Cliquez sur Favoris > Créer un lien.
Sélectionnez l'une des options suivantes :
Open in this app: You get a URL for the favorite which you can share with other users by email or chat.
Open in web api: You get a URL of the API resource. By default this is an HTML resource, but you can change the file extension to ".json" or ".csv".
Cliquez sur Favoris > Supprimer.
Cliquez sur OK.
Pour afficher les interprétations pour des périodes relatives, par exemple des interprétations de l'année dernière :
Ouvrez un favori avec des interprétations.
Cliquez >>> en haut à droite de l'espace de travail.
Click an interpretation. Your chart displays the data and the date based on when the interpretation was created.To view other interpretations, click them.
Après création d'un graphique, vous pouvez l'ouvrir comme un tableau croisé dynamique :
Cliquez sur Graphique > Ouvrir cette graphique sous forme de tableau.
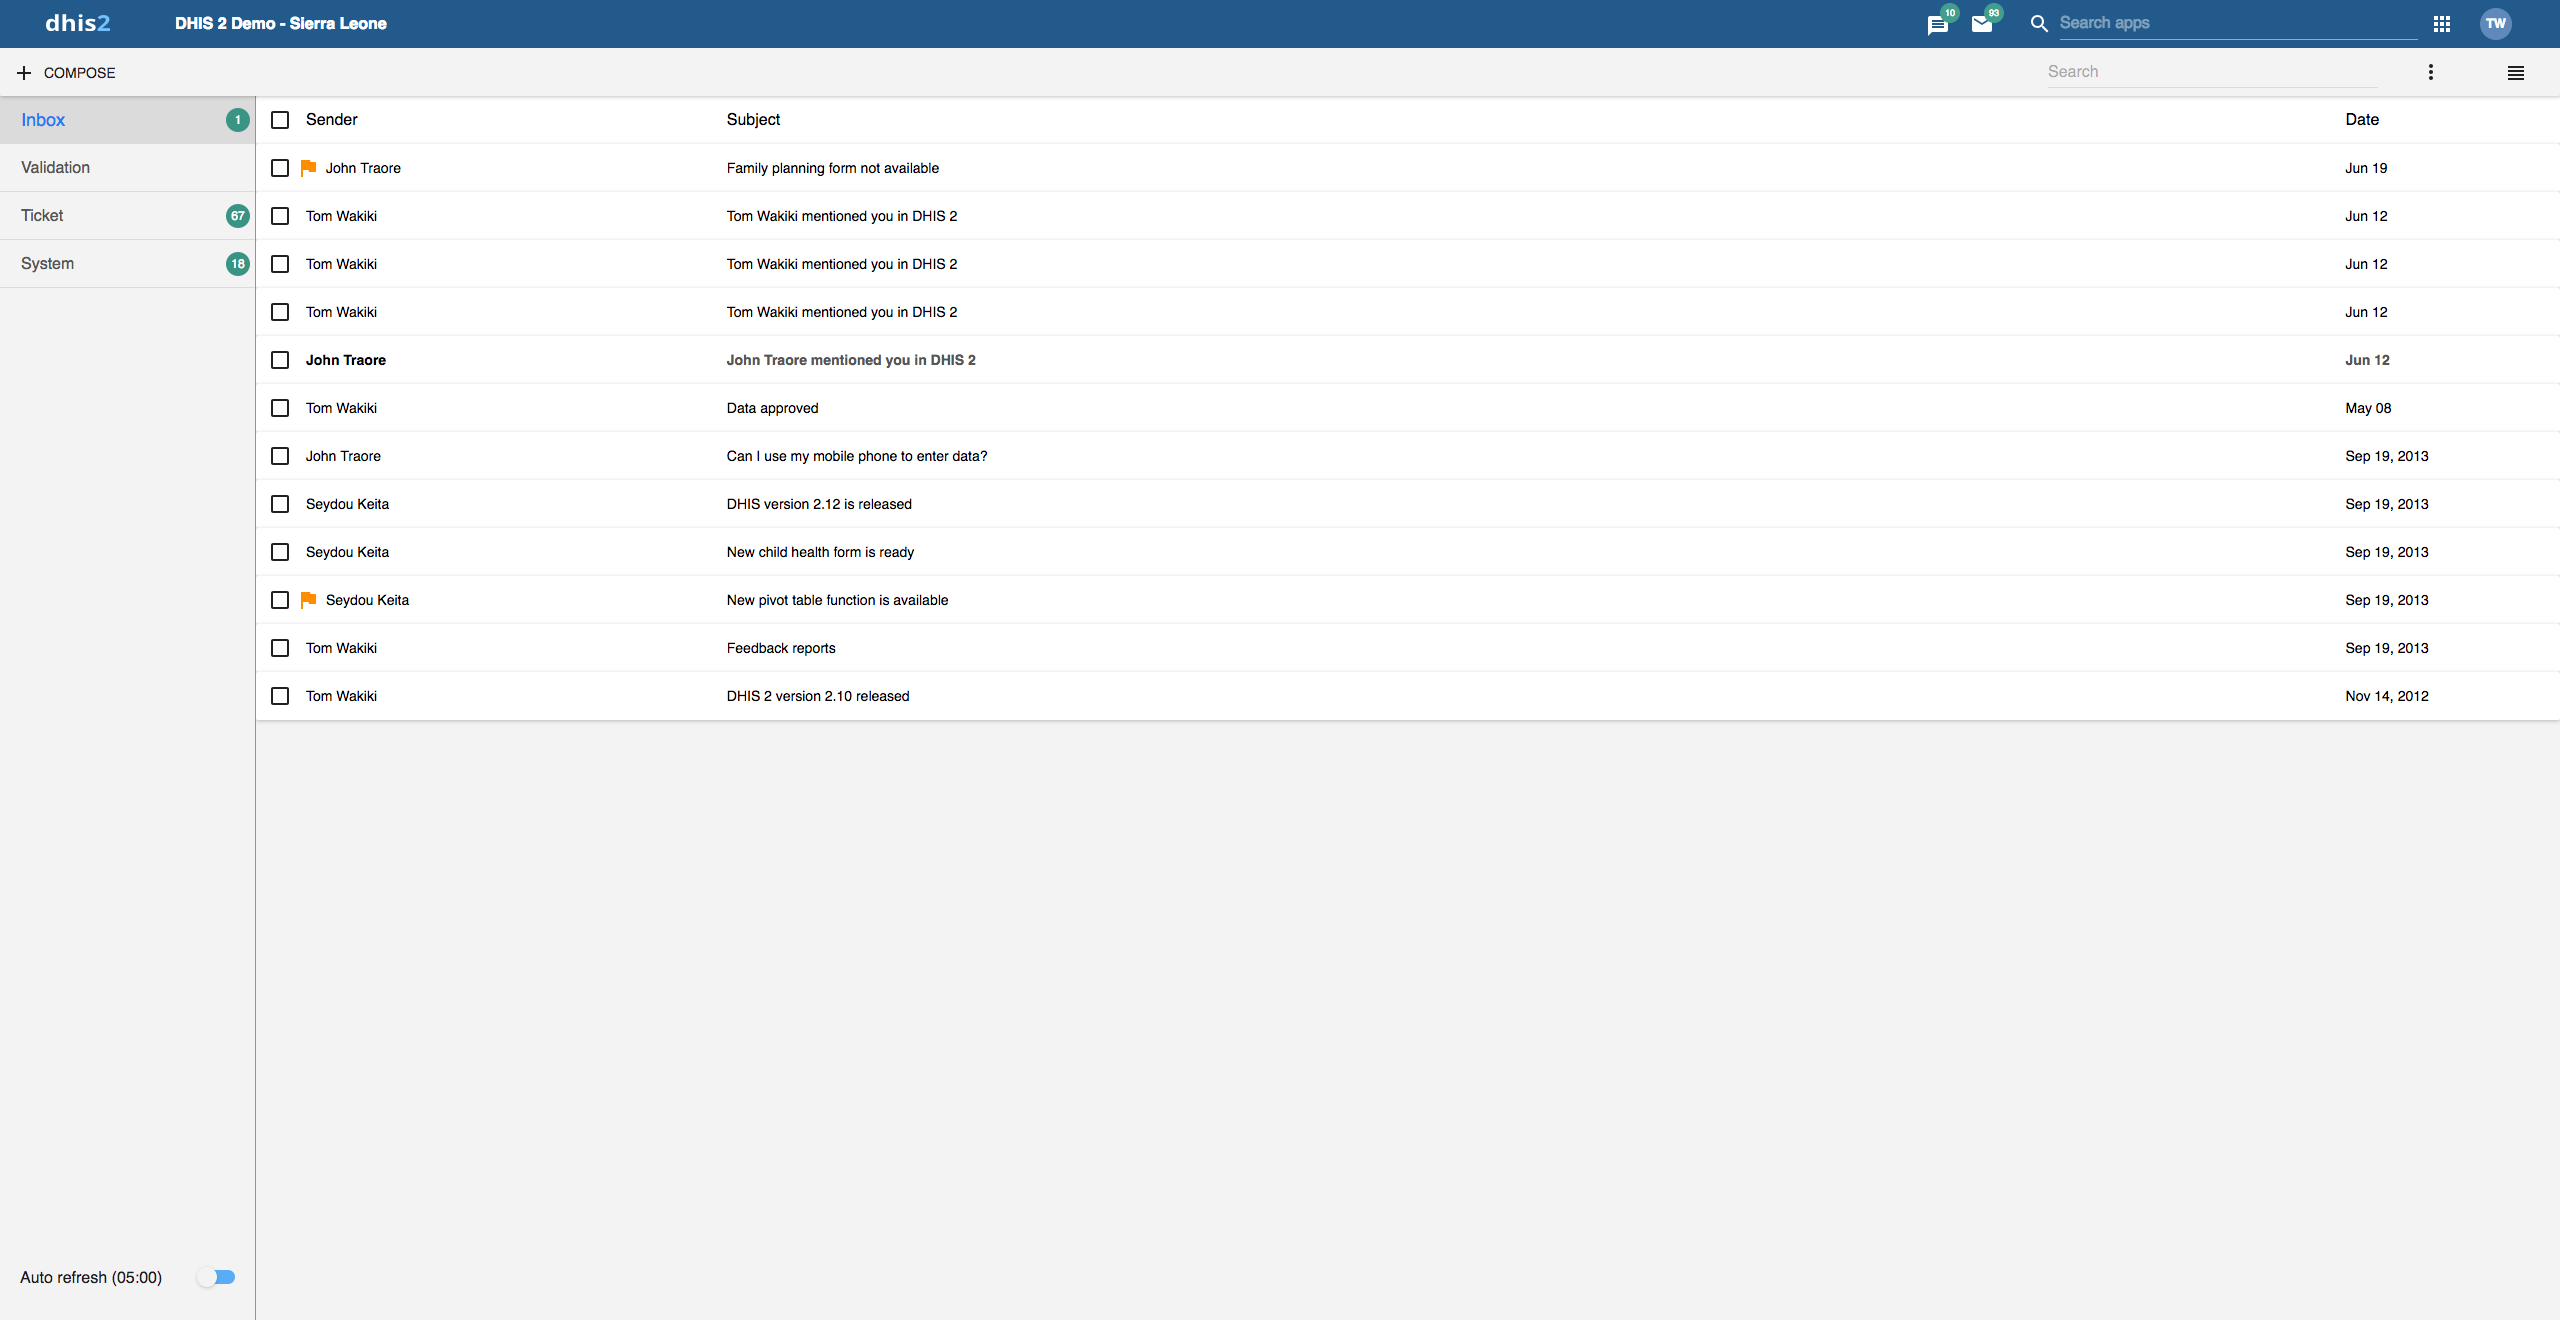
Within DHIS2 you can send messages and feedback messages to users, user groups and organisation units. When you send a feedback message, it is routed to a particular user group called the feedback recipient group. If you are a member of this user group, you have access to feedback handling tools. You can, for example, set the status of an incoming feedback to "Pending" while you are waiting for information.
In addition to the user-to-user and feedback messages, depending on your configuration the system will also send you system-generated messages. These messages could be triggered by different events, including system or background job failures and validation analysis results. Feedback handling tools are also available for validation results and the priority will be set to the importance of the validation rule violated.
To visit the app click message icon in header bar or find the Messaging app in the app search box.
Note
Messages and feedback messages are not sent to users' e-mail addresses, the messages only appear within DHIS2.
With 2.30 we introduced a new messaging app which offers a richer messaging experience. Specifically:
Switch between list view and compact view by clicking the icon in the top right corner.
- The list view is simplistic and gives a good overview of all messages and is especially suited for feedback and validation messages.
- The compact view is a modern way of view messages where the user has more information in one view, hence viewing and replying several messages is easier.
The first screenshot in this section displays list view, while the screenshot in section Read a message displays the compact view.
A new search field is added which enables the user to search for messages. The search filters messages on different message attributes; subject, text and senders. This implies that you are able to narrow down the message conversation list by entering a search.
A auto refresh feature is added so that the app fetches new messages at a set interval, every 5 minutes. This feature is disabled by default.
For every message conversation you are able to add participants to the conversation. This is very useful if you want input on that particular conversation or if someone should also see the information. It is not possible to delete participants from a conversation.
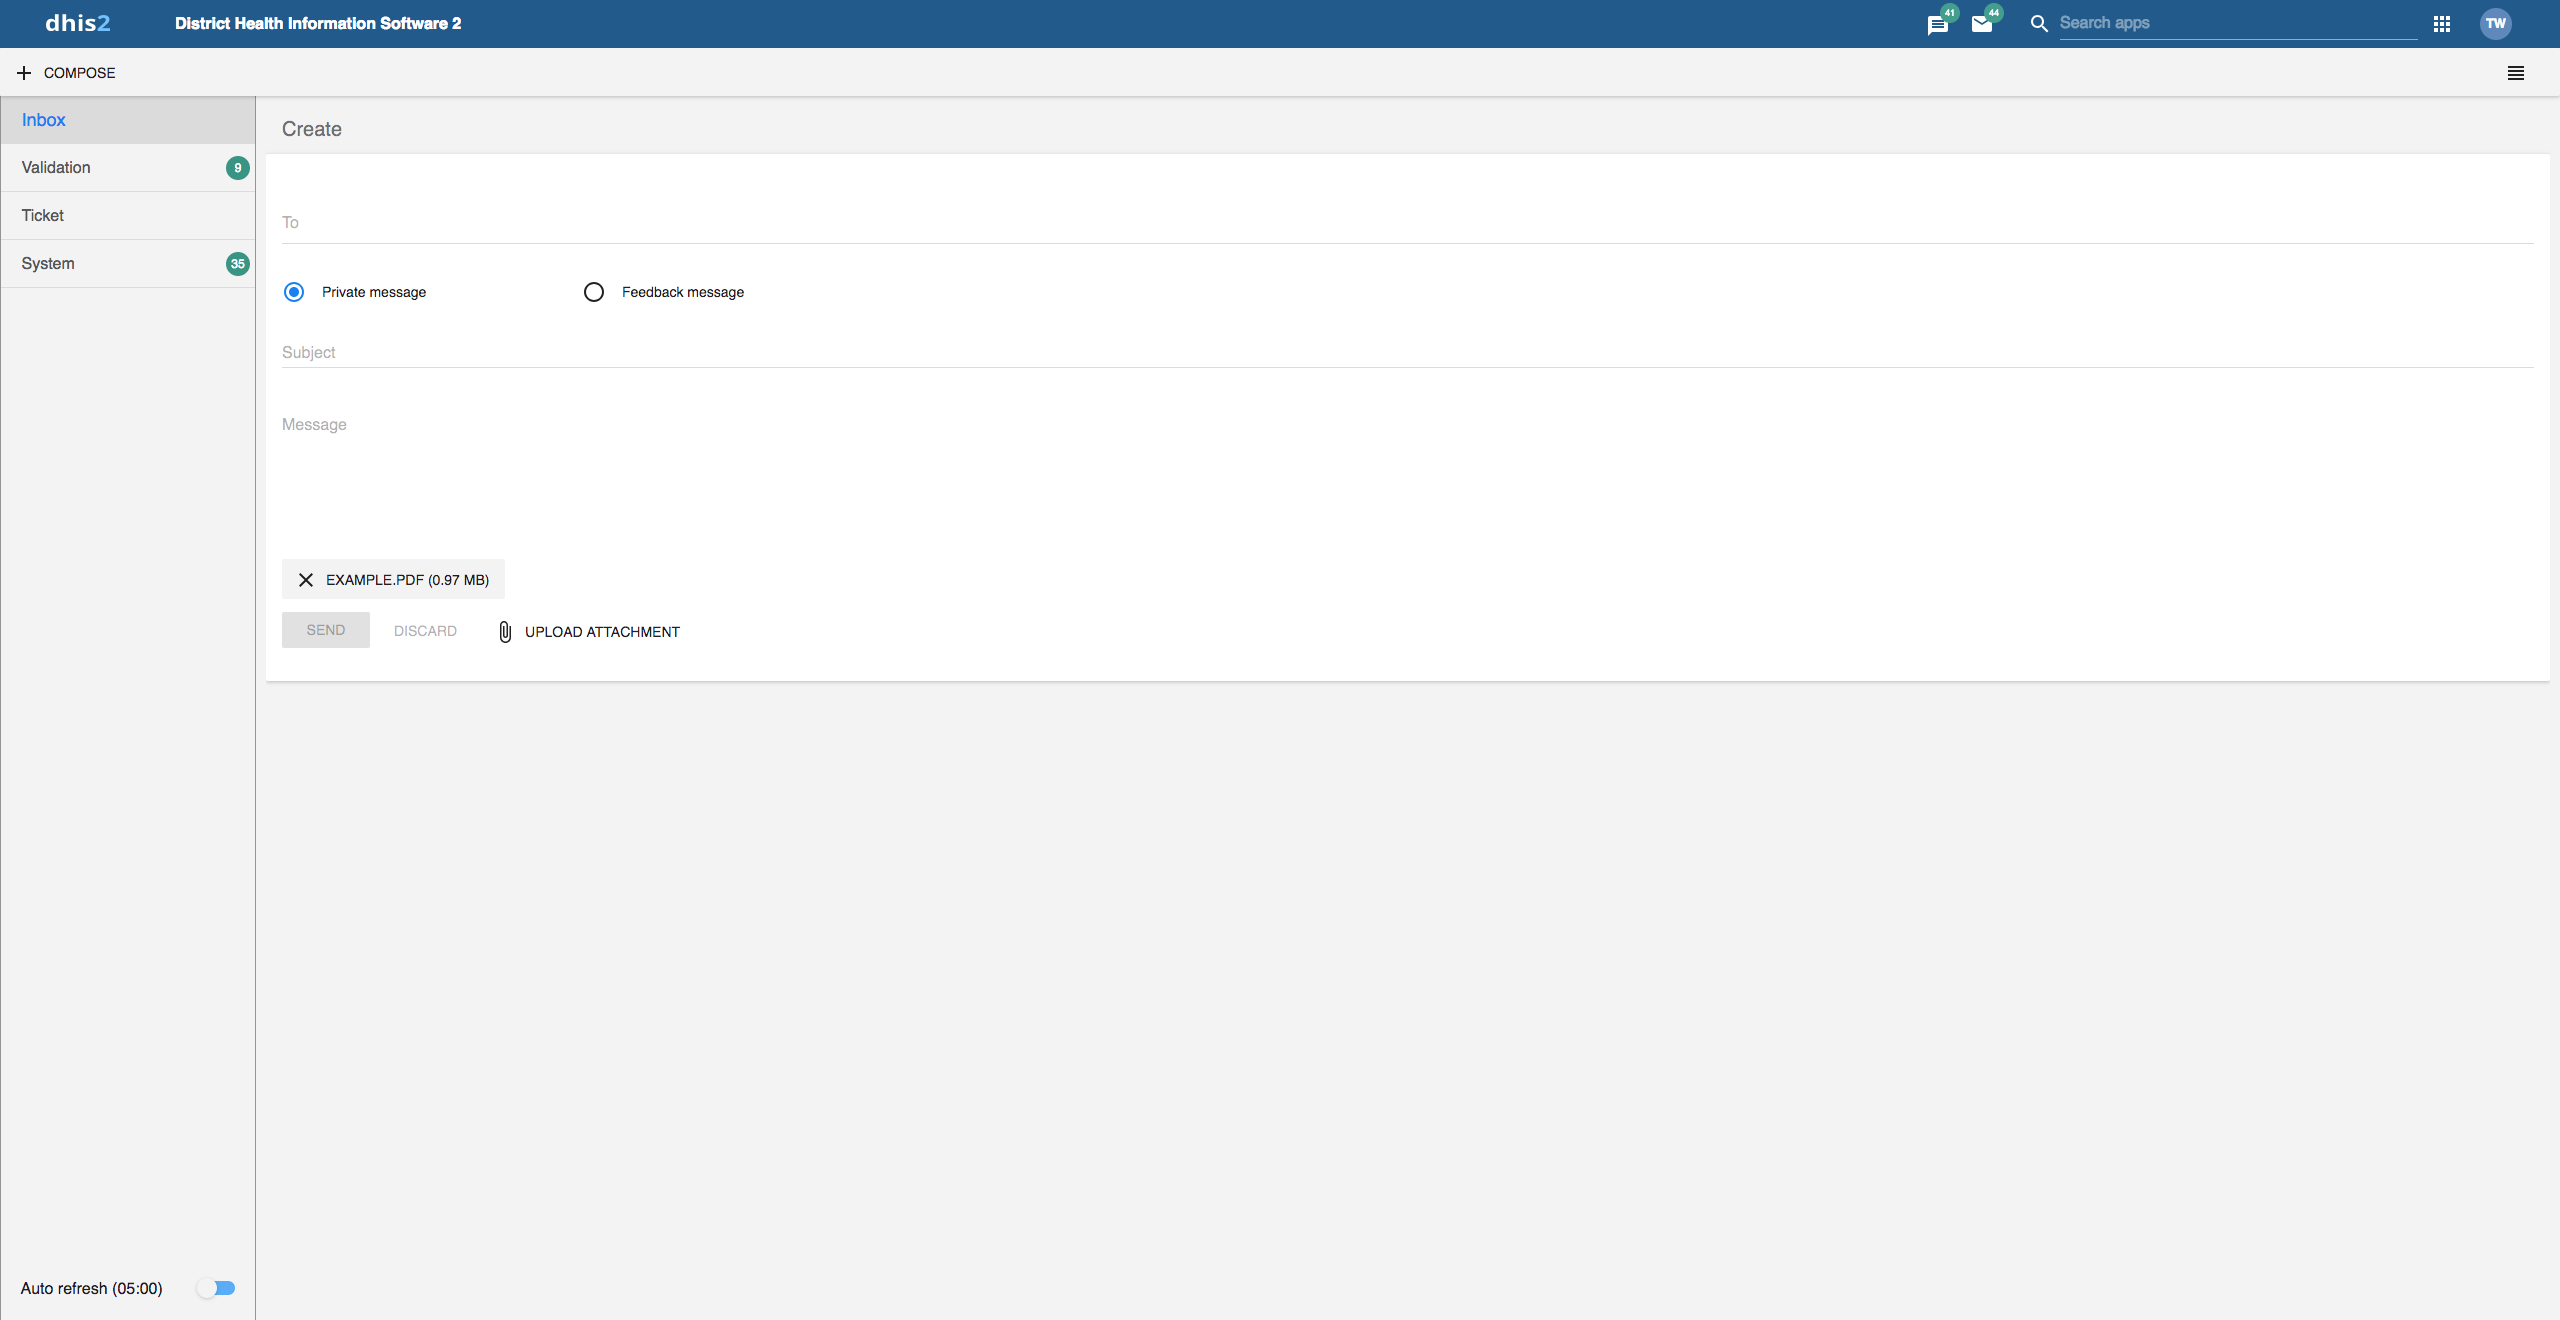
Cliquez sur Composer.
Define who you want to receive the message. You can send a message to organisation units, users and user groups.
Saisissez un objet et le corps du message.
Cliquez sur Envoyer.
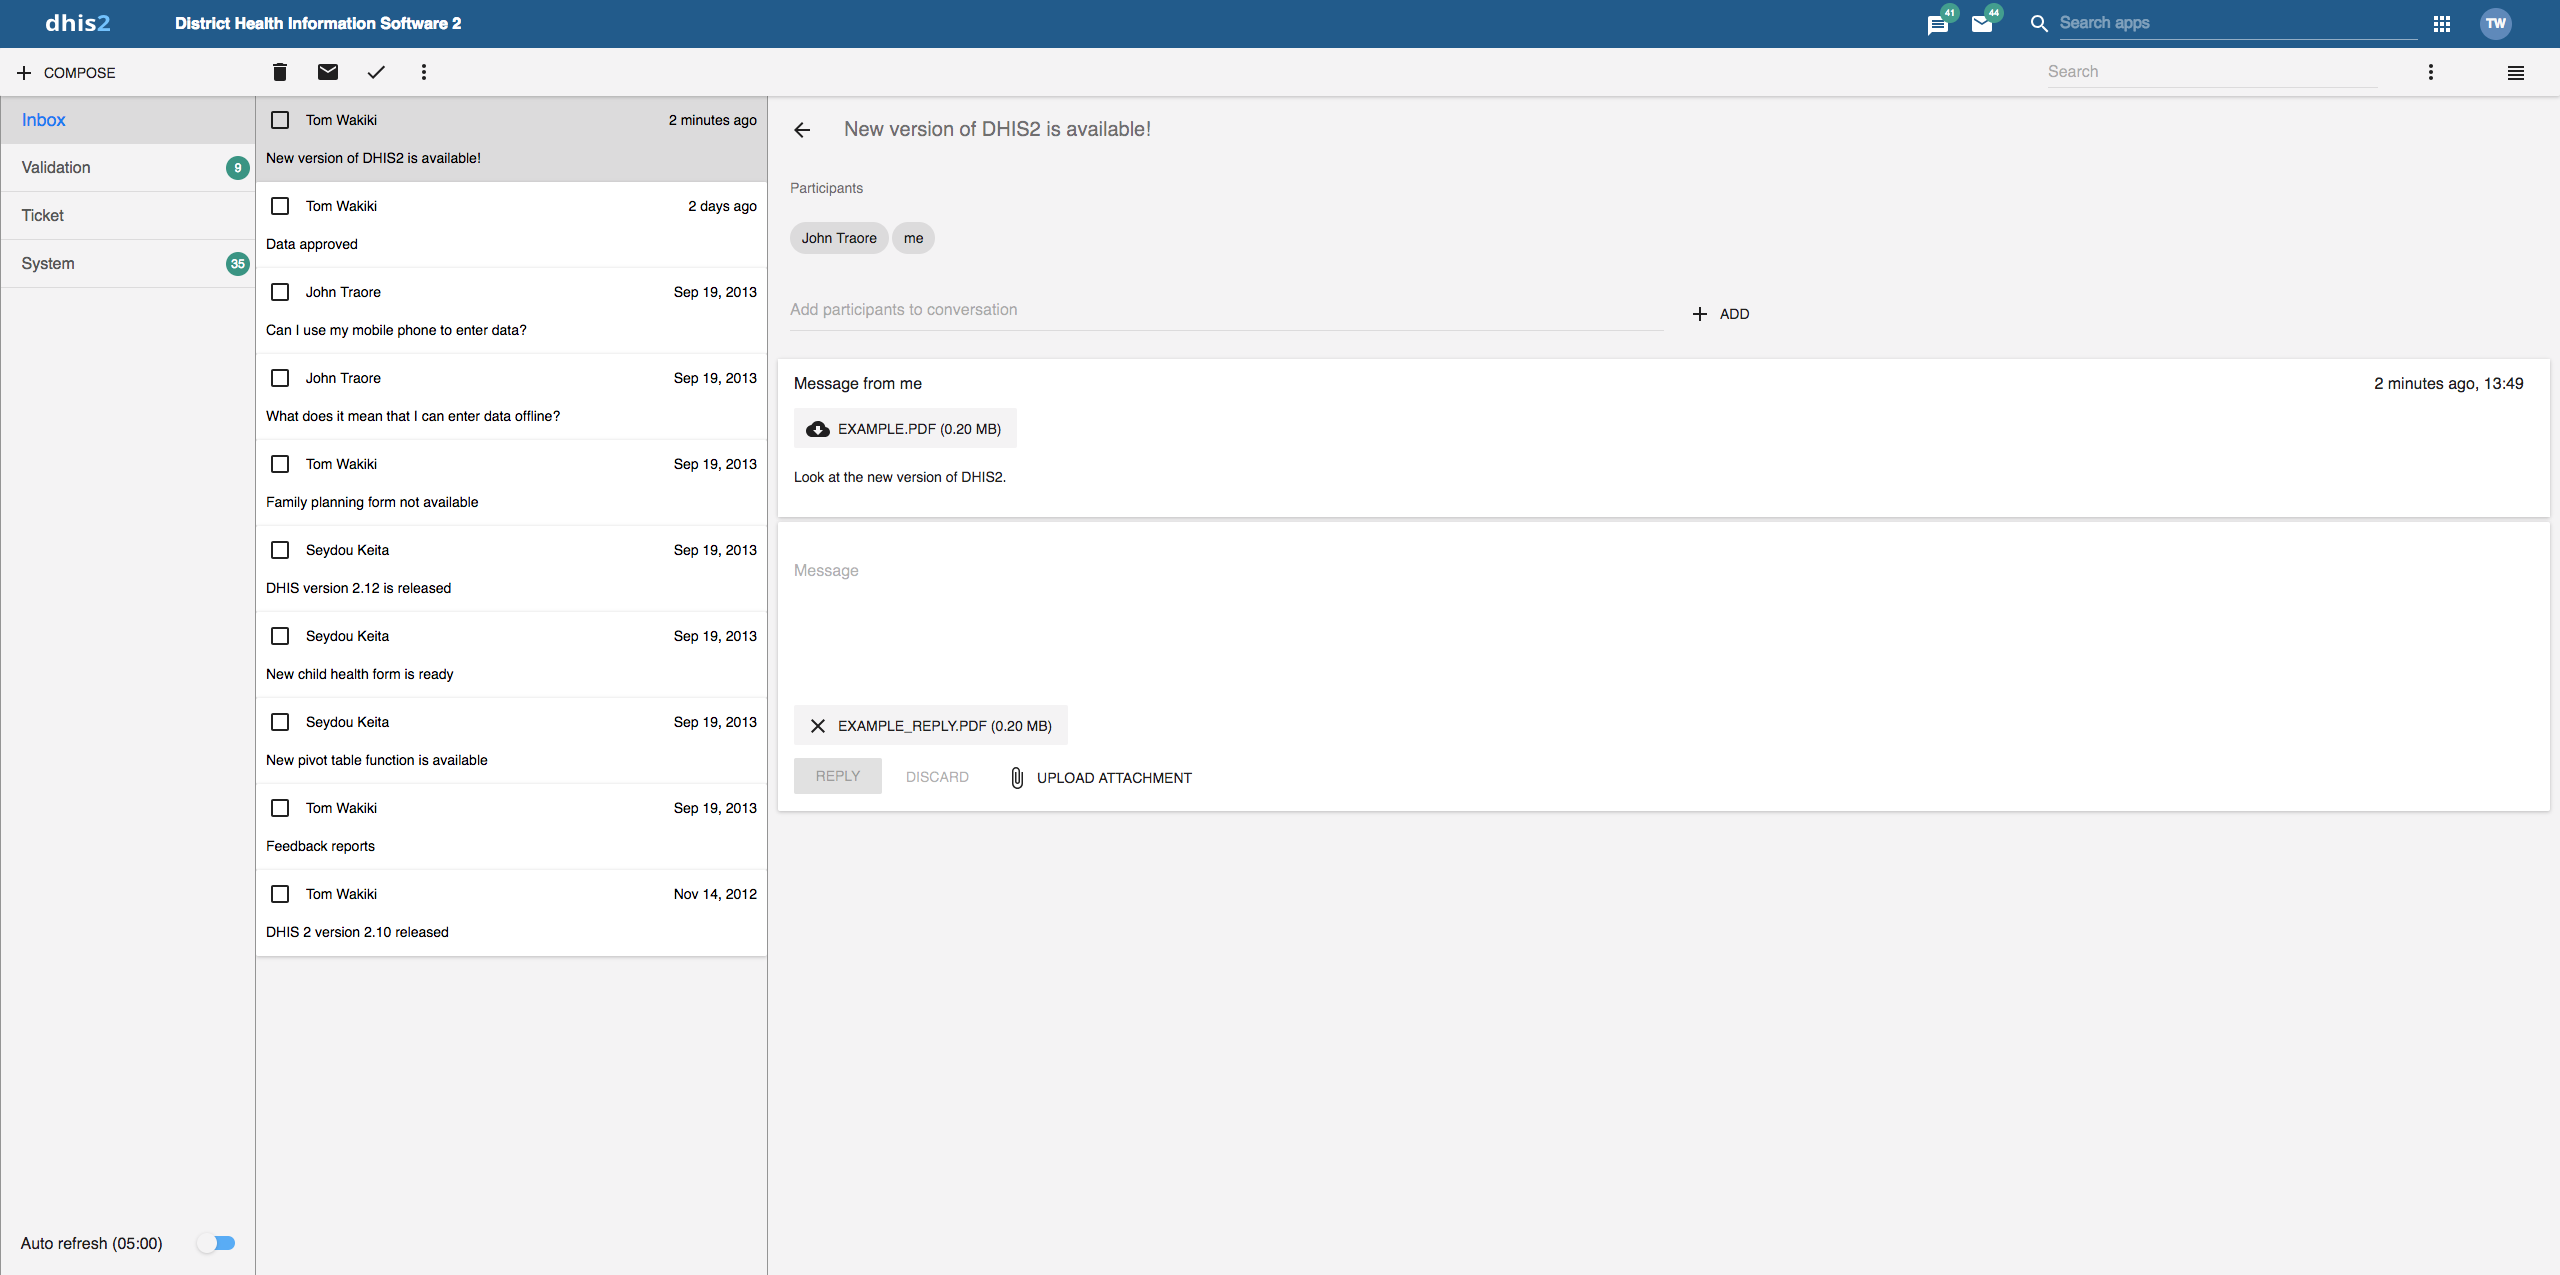
Sélectionnez le type de message approprié à gauche.
Cliquez sur un message.
If the message is part of a conversation, you will see all messages in this conversation.
Follow the steps as for creating a message, only selecting Feedback message instead of entering recipients.
The message will be created as a feedback message and will appear in all of the specified users' Ticket folder.
With 2.31 we introduced attachments to messages. When creating or replying to a message conversation you have the possibility to add attachments. Currently there are no limitations to type or size of the file.
Note
You will only see feedback messages and have access to the extended handling tools if you are a member of the user group that is set up to handle feedback messages.
With the new app you manage extended tools for tickets and validation messages through the icon menu which appears when viewing a message or checking of messages in the conversation list.


You will receive feedback messages to your Ticket folder and validation messages to your Validation folder. For feedback and validation messages you have the following options in addition to the messages options:
| Fonction | Description |
|---|---|
Priorité | Vous pouvez marquer un commentaire avec différentes priorités: neutre, Faible, Moyenne ou Élevée. Définir la priorité facilite la distinction du commentaire que vous devez résoudre en premier et ceux pouvant attendre. |
Statut | Tous les commentaires reçoivent le statut Ouvert à la création. Pour garder une traçabilité des commentaires existants, vous pouvez définir le statut sur En attente, non valide ou Résolu. Vous pouvez filtrer les commentaires dans votre boîte de réception en fonction de leur statut. Ceci facilite le basculement entre les commentaires et les messages normaux. |
Attribué à | Vous pouvez affecter un commentaire à n'importe quel membre du groupe d'utilisateurs autorisé à les gérer. - Aucun signifie que vous n'avez affecté aucun utilisateur au commentaire. |
Réponse interne | Lorsque vous travaillez au sein d'une équipe de traitement des commentaires, vous pouvez en discuter avant de répondre à l'expéditeur. Vous pouvez conserver cette discussion dans la même conversation que le commentaire lui-même. Pour envoyer une réponse dans le groupe d'utilisateurs de traitement des commentaires, cliquez sur Réponse interne. |
Pour configurer la fonction commentaire, vous devez :
Create a user group (for example "Feedback message recipients") that contains all the users who should receive feedback messages.
Open the System Settings app and click General > Feedback recipients and select the user group you created in the previous step.
In User settings, you can change the display language of DHIS2 and the language of the database. The database language is the translated content of the metadata, such as data elements and indicators. You can also choose a display style, and enable or disable SMS and email notifications. If you wish to, you can choose to display a short name, such as "Joe" in the analysis modules, rather than your full name.
In User profile, you can add personal information to your profile such as your email address, mobile phone number, date of birth, profile picture and more. When you send messages, the person receiving the message can see these profile details. You can also provide account names for various direct messaging services, which will be used by the system.
In Account settings, you can reset your password and setup 2-Factor authentication. Setting up 2-Factor authentication will require you to download the Google Authenticator app on you mobile device.
In the View full profile section, you find a summary of your profile details. This section includes a few fields that you cannot edit yourself, such as user roles and user organisation units.
Dans la section A propos de DHIS2, vous trouverez une liste détaillée sur l'instance DHIS2.
In the Maintenance app you configure all the metadata objects you need to collect and analyze data:
Les catégories
Eléments de données
Ensemble de données et formulaires de saisie de données
Indicateurs
Les unités d’organisation
Program metadata: tracked entity, tracked entity attribute and relationship type
Règles de validation
Les attributs
Les constantes
Les ensembles d'options
Les légendes
Les prédicteurs
Les push reports
Les couches de carte externes
Note
The functions you have access to depend on your user role's access permissions.
Metadata objects are presented in a list with predefined columns that are relevant for each object. You may customize which columns are shown in the list for the current object. These customizations are per user, and therefore will not affect other users. Note that these changes do not edit any metadata, just how the list is presented.
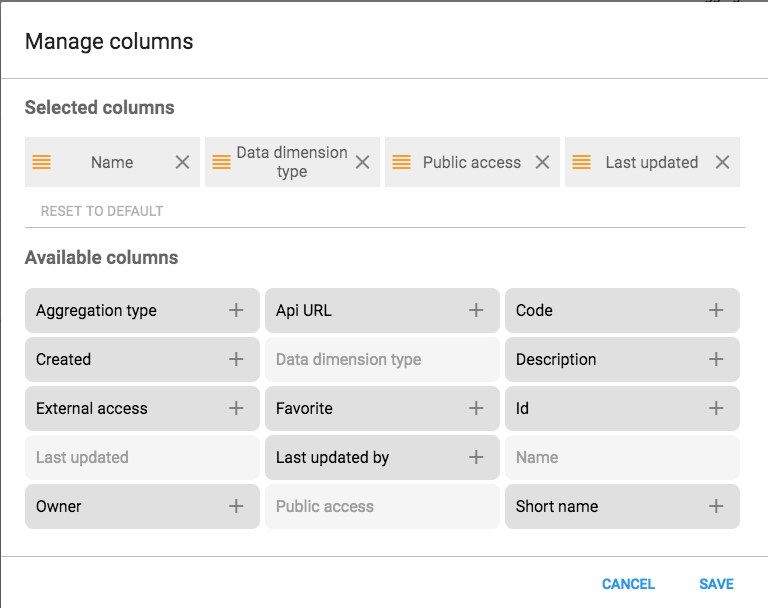


Vous pouvez facilement réinitialiser les valeurs par défaut en cliquant sur le bouton Rétablir les valeurs par défaut.
Vous pouvez télécharger les métadonnées relatives à l'objet que vous consultez actuellement. Le téléchargement des métadonnées tiendra compte de tous les filtres que vous avez activés pour la liste.
Categories are typically a concept, for example "Gender", "Age" or "Disease Status". Data elements such as "Number of cases of confirmed malaria" are often broken into smaller component parts to determine, for example, the number of confirmed malaria cases of particular age groups.
Use categories to disaggregate data elements into individual components. You can also use categories to assign metadata attributes to all data recorded in a specific dataset, such as "Implementing partner" or "Funding agency."
Create three categories: "Under 1", "1-5" and "Over 5". Assign them as categories to the data element. This creates three separate fields for this data in the data entry forms:
Nombre de cas de paludisme confirmés (Moins de 1 an)
Nombre de cas de paludisme confirmés (1-5 ans)
Nombre de cas de paludisme confirmés (plus de 5 ans)
Without categories, you would have had to create each of the data elements listed above separately.
In the Maintenance app, you manage the following and category objects:
Type d'objet | Fonctions disponibles |
|---|---|
Option de catégorie | Créer, modifier, cloner, partager, supprimer, afficher les détails et traduire |
Catégorie | Créer, modifier, cloner, partager, supprimer, afficher les détails et traduire |
Combinaison de catégories | Créer, modifier, cloner, partager, supprimer, afficher les détails et traduire |
Combinaison d'options de catégorie | Modifier et afficher les détails |
Groupe d'options de catégorie | Créer, modifier, cloner, partager, supprimer, afficher les détails et traduire |
Ensemble de groupes d'options de catégorie | Créer, modifier, cloner, partager, supprimer, afficher les détails et traduire |
Créez toutes les options de catégorie.
Create categories composed by the multiple category options you've created.
Create category combinations composed by either one or multiple categories.
Créer des éléments de données et attribuez-les à une combinaison de catégories.
When possible, recycle category options. For instance, there might be two categories which might share a particular category option (for example \<1 year of age). When creating the categories, this category option could be reused. This is important if particular category options (or category option combinations) that need to be analyzed together.
Open the Maintenance app and click Category > Category option.
Cliquez sur le bouton d'ajout.
Remplissez le formulaire :
Nom
Date de début
Date de fin
Sélectionnez des unités d'organisation et attribuez-les.
Tip
You can automatically select all organisation units that belong to an organisation unit level or organisation unit group, for example "Chiefdom" or "Urban. To do this:
Select an Organisation unit level or Organisation unit group and click Select.
Cliquez sur Sauvegarder.
When you have created all category options for a particular category, you can create that category.
Ouvrez l'application Maintenance et cliquez sur Catégorie > Catégorie.
Cliquez sur le bouton d'ajout.
Remplissez le formulaire :
Nom
Code
Type de dimension des données
A category either be of type "Disaggregation" or "Attribute". For disaggregation of data elements, you select Disaggregation. The data dimension type "Attribute" allows the category to be used to assign a combination of categories to data recorded through a data set.
Dimension des données
If you select Data dimension, the category will be available to the analytics as another dimension, in addition to the standard dimensions of "Period" and "Organisation unit".
Sélectionnez les options de catégorie et attribuez-les.
Cliquez sur Sauvegarder.
Category combinations lets you combine multiple categories into a related set.
You can disaggregate the data element "Number of new HIV infections" into the following categories:
Service VIH : "Autres", "PTME", "Tuberculose"
Sexe : "Masculin", "Féminin"
In this example, there are two levels of disaggregation that consist of two separate data element categories. Each data element category consist of several data element category options.
In DHIS2, different data elements are disaggregated according to a common set of categories. By combining these different categories into a category combination and assigning these combinations to data elements, you can apply the appropriate disaggregation levels quickly to a large number of data elements.
Open the Maintenance app and click Category > Category combination.
Cliquez sur le bouton d'ajout.
Remplissez le formulaire :
Nom
Code
Type de dimension des données
Sauter le total des catégories dans les rapports
Sélectionnez des catégories et attribuez-les.
Cliquez sur Sauvegarder.
You can group and classify category options by using category option groups. The main purpose of the category option group set is to add more dimensionality to your captured data for analysis in for example the Pivot table or Data Visualizer apps.
Consider a system where data is collected by "projects", and projects are modelled as category options. The system must be able to analyse data based on which donor supports the project. In this case, create a category option group set called "Donor". Each donor can be created as a category option group, where each category option / project is put in the appropriate group. In the data analysis applications, the "Donor" group set will appear as a data dimension, while each donor appear as dimension items, ready to be included in reports.
Pour créer un groupe d'options de catégorie :
Open the Maintenance app and click Category > Category option group.
Cliquez sur le bouton d'ajout.
Remplissez le formulaire :
Nom
Nom abrégé : Définissez un nom abrégé pour l'élément de données.
Code
Type de dimension des données
Sélectionnez les Options de catégorie et attribuez-les.
Cliquez sur Sauvegarder.
You can group category option groups in category option group sets. The main purpose of the category option group set is to add more dimensionality to your captured data for analysis in for example the Pivot table or Data Visualizer apps.
Open the Maintenance app and click Category > Category option group set.
Cliquez sur le bouton d'ajout.
Remplissez le formulaire :
Nom
Description
Dimension des données
Type de dimension des données
Sélectionnez les Groupes d'options de catégorie et attribuez-les.
Cliquez sur Sauvegarder.
When categories and category combinations have the data dimension type "Attribute", they can apply a common set of attributes to a related set of data values contained in a data set. When category combinations are used as a attribute, they serve as another dimension (similar to "Period" and "Organisation unit") which you can use in your analysis.
Suppose that a NGO is providing ART services in a given facility. They would need to report each month on the "ART monthly summary", which would contain a number of data elements. The NGO and project could potentially change over time. In order to attribute data to a given NGO and project at any point in time, you need to record this information with each data value at the time of data entry.
Create two categories with the data dimension type "Attribute": "Implementing partner" and "Projects".
Create a category combination with the data dimension type "Attribute": "Implementing partners and projects".
Affectez les catégories que vous avez créées à la combinaison de catégories.
Create a data set called "ART monthly summary" and select the "Implementing partners and projects" category combination.
When you enter data in the Data entry app, you can select an "Implementing partner" and a "Project". Each recorded data value, is assigned a specific combination of these categories as an attribute. These attributes (when specified as a dimension) can be used in the analysis applications similar to other dimensions, for example the period and organisation unit.
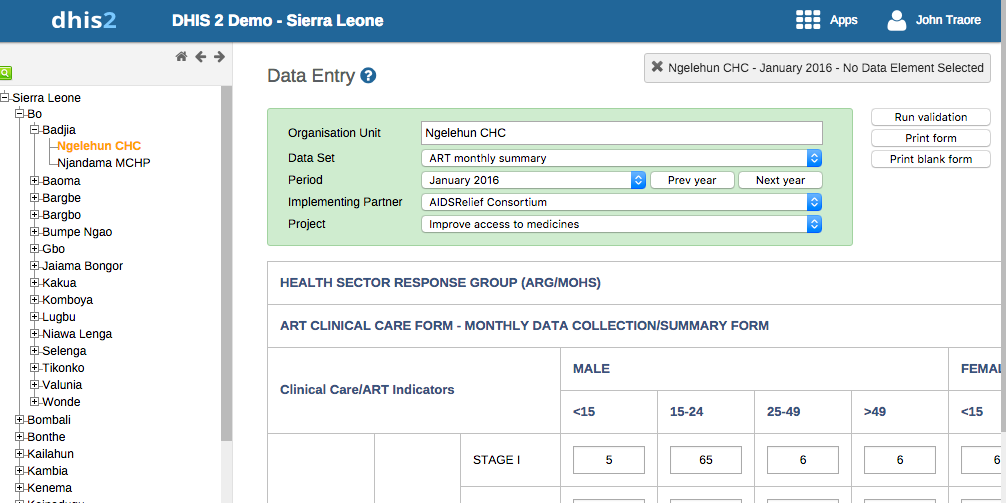
You can assign a code to category option combinations. This makes data exchange between DHIS2 and external systems easier. The system creates the category option combinations automatically.
Open the Maintenance app and click Category > Category option combination.
Dans la liste, cherchez l'objet que vous souhaitez modifier.
Cliquez sur le menu des options et sélectionnez Modifier.
Entrez un code.
Cliquez sur Sauvegarder.
Cloning a data element or other objects can save time when you create many similar objects.
Open the Maintenance app and find the type of metadata object you want to clone.
Dans la liste des objets, cliquez sur le menu des options et sélectionnez Cloner.
Modifiez les options que vous souhaitez.
Cliquez sur Sauvegarder.
You can assign different sharing settings to metadata objects, for example organisation units and tracked entity attributes. These sharing settings control which users and users groups that can view or edit a metadata object.
Some metadata objects also allows you to change the sharing setting of data entry for the object. These additional settings control who can view or enter data in form fields using the metadata.
Note
The default setting is that everyone (Public access) can find, view and edit metadata objects.
Open the Maintenance app and find the type of metadata object you want to modify.
In the object list, click the context menu and select Sharing settings.
(Optional) Add users or user groups: search for a user or a user group and select it. The user or user group is added to the list.
Modifiez les paramètres de partage pour les groupes d'accès que vous souhaitez modifier.
Can edit and view: The access group can view and edit the object.
Peut seulement visualiser : Le groupe d'accès peut seulement visualiser l'objet.
No access (only applicable to Public access): The public won't have access to the object.
Change data sharing settings for the access groups you want to modify.
Can capture data: The access group can view and capture data for the object.
Can view data: The access group can view data for the object.
No access: The access group won't have access to data for the object.
Cliquez sur Fermer
Note
You can only delete a data element and other data element objects if no data is associated to the data element itself.
Warning
Any data set that you delete from the system is irrevocably lost. All data entry forms, and section forms which may have been developed will also be removed. Make sure that you have made a backup of your database before deleting any data set in case you need to restore it at some point in time.
Open the Maintenance app and find the type of metadata object you want to delete.
Dans la liste des objets, cliquez sur le menu des options et sélectionnez Supprimer.
Cliquez sur Confirmer.
Open the Maintenance app and find the type of metadata object you want to view.
In the object list, click the options menu and select Show details.
DHIS2 provides functionality for translations of database content, for example data elements, data element groups, indicators, indicator groups or organisation units. You can translate these elements to any number of locales. A locale represents a specific geographical, political, or cultural region.
Tip
To activate a translation, open the System Settings app, click > Appearance and select a language.
Open the Maintenance app and find the type of metadata object you want to translate.
Dans la liste des objets, cliquez sur le menu des options et sélectionnez Traduire.
Tip
If you want to translate an organisation unit level, click directly on the Translate icon next to each list item.
Sélectionnez un lieu.
Tapez un Nom, Nom abrégé et Description.
Cliquez sur Sauvegarder.
Data elements are the base of DHIS2. Data elements define what is actually recorded in the system, for example number of immunisations or number of cases of malaria.
Data elements such as "Number of cases of confirmed malaria" are often broken into smaller component parts to determine, for example, the number of confirmed malaria cases of particular age groups.
In the Maintenance app, you manage the following data elements objects:
Type d'objet | Fonctions disponibles |
|---|---|
Élément de donnée | Créer, modifier, cloner, partager, supprimer, afficher les détails et traduire |
Groupe d'éléments de données | Créer, modifier, cloner, partager, supprimer, afficher les détails et traduire |
Ensemble de groupes d'éléments de données | Créer, modifier, cloner, partager, supprimer, afficher les détails et traduire |
Créez toutes les options de catégorie.
Create categories composed by the multiple category options you've created.
Create category combinations composed by either one or multiple categories.
Créer des éléments de données et attribuez-les à une combinaison de catégories.
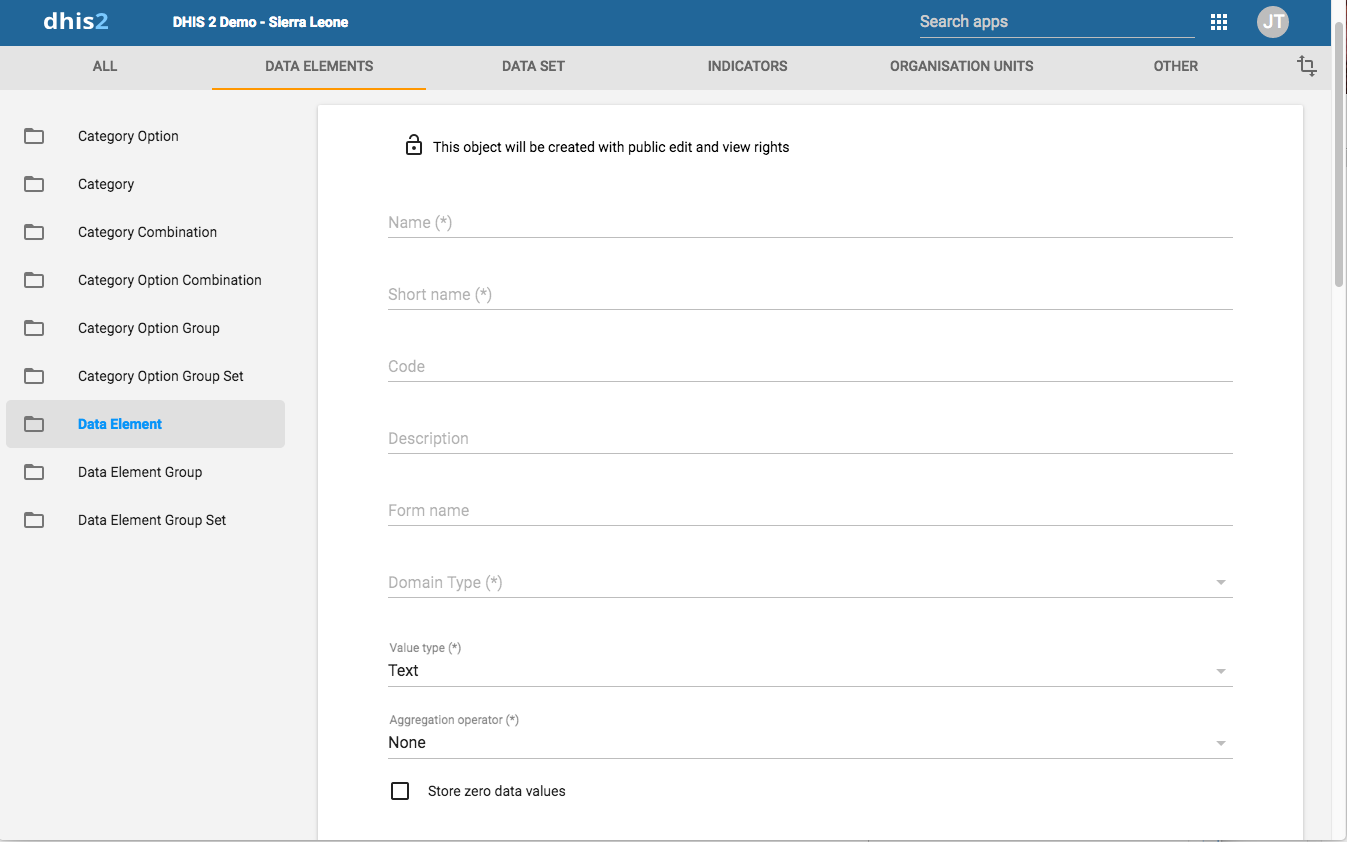
Open the Maintenance app and click Data elements > Data element.
Cliquez sur le bouton d'ajout.
Dans le champ Nom, définissez le nom précis de l'élément de données.
Chaque élément de données doit avoir un nom unique.
In the Short name field, define a short name for the data element.
Typically, the short name is an abbreviation of the full data element name. This attribute is often used in reports to display the name of the data element, where space is limited.
(Facultatif) Dans le champ Code, attribuez un code.
Dans de nombreux pays, les éléments de données se voient attribuer un code.
(Optional) In the Color field, assign a color which will be used for this data element in the data capture apps.
(Optional) In the Icon field, assign an icon which will be used for this data element in the data capture apps.
In the Description field, type a description of the data element. Be as precise as possible and include complete information about how the data element is measured and what its purpose is.
(Optional) In the Field mask field, you may type a template that's used to provide hints for correct formatting of the data element.
NOTE
So far this is only implemented in the DHIS2 Android Capture app; not in the Capture and Tracker Capture web apps.
Voici donc les caractères spéciaux qui peuvent être utilisés dans le masque. Les caractères spéciaux correspondent exactement à un caractère du type donné.
| Caractère | Correspondance |
|---|---|
| \d | chiffre |
| \x | lettre minuscule |
| \X | lettre majuscule |
| \w | tout caractère alphanumérique |
For example, the pattern can be used to show hyphens as needed in the input field of the data element. E.g "\d\d\d-\d\d\d-\d\d\d, would show a hyphen for every third digit.
In the Form name field, type an alternative name of the data element. This name can be used in either section or automatic data entry forms. The form name is applied automatically.
In the Domain type field, select whether the data element is an aggregate or tracker type of data element.
In the Value type field, select the type of data that the data element will record.
Value type | Description |
|---|---|
Age | - |
Coordinate | A point coordinate specified as longitude and latitude in decimal degrees. All coordinate should be specified in the format "-19.23 , 56.42" with a comma separating the longitude and latitude. |
Date | Dates rendered as calendar widget in data entry. |
Date & time | Is a combination of the DATE and TIME data elements. |
Email. | |
File | A file resource where you can store external files, for example documents and photos. |
Image | A file resource where you can store photos. Unlike the FILE data element, the IMAGE data element can display the uploaded image directly in forms. |
Integer | Any whole number (positive and negative), including zero. |
Letter | A single letter. |
Long text | Textual value. Renders as text area with no length constraint in forms. |
Negative integer | Any whole number less than (but not including) zero. |
Number | Any real numeric value with a single decimal point. Thousands separators and scientific notation is not supported. |
Percentage | Whole numbers inclusive between 0 and 100. |
Phone number | Phone number. |
Positive integer | Any whole number greater than (but not including) zero. |
Positive of zero integer | Any positive whole number, including zero. |
Organisation unit | Organisation units rendered as a hierarchy tree widget. If the user has assigned "search organisation units", these will be displayed instead of the assigned organisation units. |
Unit interval | Any real number greater than or equal to 0 and less than or equal to 1. |
Text | Textual value. The maximum number of allowed characters per value is 50,000. |
Time | Time is stored in HH:mm format. HH is a number between 0 and 23 mm is a number between 00 and 59 |
Tracker associate | Tracked entity instance. Rendered as dialog with a list of tracked entity instances and a search field. |
Username | DHIS2 user. Rendered as a dialog with a list of users and a search field. |
Yes/No | Boolean values, renders as drop-down lists in data entry. |
Yes only | True values, renders as check-boxes in data entry. |
In the Aggregation type field, select the default aggregation operation that will be used on the data element.
Most data elements should have the Sum operator. This includes all data elements which should be added together. Other data elements, such as staffing levels, should be set to use the Average operator, when values along the time dimension should not be added together, but rather averaged.
Aggregation operator | Description |
|---|---|
Average | Average the values in both the period as and the organisation unit dimensions. |
Average (sum in organisation unit hierarchy) | Average of data values in the period dimension, sum in the organisation unit dimensions. |
Count | Count of data values. |
Min | Minimum of data values. |
Max | Maximum of data values. |
None | No aggregation is performed in any dimension. |
Sum | Sum of data values in the period and organisation unit dimension. |
Standard deviation | Standard deviation (population-based) of data values. |
Variance | Variance (population-based) of data values. |
If you want to save zeros for a particular reason, select Store zero data values. By default, DHIS2 does not store zeros entered in the data entry module.
In the URL field, enter a link to an in-depth description of the data element.
For example a link to a metadata repository or registry that contains detailed technical information about the definition and measurement of the data element.
In the Category combination field, define which category combination the data element should have. This is also known as the "disaggregation".
Sélectionnez un ensemble d'options.
Option sets are predefined lists of options which can be used in data entry.
Sélectionnez un Ensemble d'options pour les commentaires.
Option sets for comments are predefined lists of options which can be used to specify standardized comments for data values in data entry.
Attribuez une ou plusieurs Légendes.
Legends are used in for example the Maps app to display certain data elements with certain icons.
Set the Aggregation levels to allow the data element to be aggregated at one or more levels:
In the left pane, select the levels you want to assign to the data element.
Cliquez sur la flèche de droite pour attribuer les niveaux d'agrégation.
By default, the aggregation will start at the lowest assigned organisation unit. If you for example select "Chiefdom", it means that "Chiefdom", "District", and "National" aggregates use "Chiefdom" (the highest aggregation level available) as the data source, and PHU data will not be included. PHU data will still be available for the PHU level, but not included in aggregations to the levels above.
If you select both "District" and "Chiefdom", it means that the "District" and "National" level aggregates use District data as their source, "Chiefdom" will use Chiefdom, and "PHU" will use PHU.
If applicable, enter custom attributes values, for example Classification or Collection method.
Note
You create custom attributes in the Maintenance app: Other > Attributes.
If applicable, select compulsory data element group sets, for example Main data element group or Tracker-based data.
Note
You'll only see data element group sets in this form if you've created them and set them to Compulsory.
You create data element group sets in the Maintenance app: Data element > Date element group set.
Cliquez sur Sauvegarder.
Data element groups lets you classify related data elements into a common theme. For example, two data elements "Measles immunisation" and "BCG Immunisation" might be grouped together into a data element group "Childhood immunisation".
Pour créer un groupe d'éléments de données :
Open the Maintenance app and click Data elements > Data element group.
Cliquez sur le bouton d'ajout.
Remplissez le formulaire :
Nom
Nom abrégé
Code
Sélectionnez des éléments de données et attribuez-les.
Cliquez sur Sauvegarder.
Data element group sets allows you to categorise multiple data element groups into a set. The system uses data element group sets during analysis and reporting to combine similar data element groups into a common theme. A data element group can be part of multiple data element group sets.
Open the Maintenance app and click Data elements > Data element group set.
Cliquez sur le bouton d'ajout.
Remplissez le formulaire :
Nom
Code
Description
Obligatoire
Dimension des données
Sélectionnez des groupe d'éléments de données et attribuez-les.
Available data element groups are displayed in the left panel. Data element groups that are currently members of the data element group set are displayed in the right hand panel.
Cliquez sur Sauvegarder.
Cloning a data element or other objects can save time when you create many similar objects.
Open the Maintenance app and find the type of metadata object you want to clone.
Dans la liste des objets, cliquez sur le menu des options et sélectionnez Cloner.
Modifiez les options que vous souhaitez.
Cliquez sur Sauvegarder.
You can assign different sharing settings to metadata objects, for example organisation units and tracked entity attributes. These sharing settings control which users and users groups that can view or edit a metadata object.
Some metadata objects also allows you to change the sharing setting of data entry for the object. These additional settings control who can view or enter data in form fields using the metadata.
Note
The default setting is that everyone (Public access) can find, view and edit metadata objects.
Open the Maintenance app and find the type of metadata object you want to modify.
In the object list, click the context menu and select Sharing settings.
(Optional) Add users or user groups: search for a user or a user group and select it. The user or user group is added to the list.
Modifiez les paramètres de partage pour les groupes d'accès que vous souhaitez modifier.
Can edit and view: The access group can view and edit the object.
Peut seulement visualiser : Le groupe d'accès peut seulement visualiser l'objet.
No access (only applicable to Public access): The public won't have access to the object.
Change data sharing settings for the access groups you want to modify.
Can capture data: The access group can view and capture data for the object.
Can view data: The access group can view data for the object.
No access: The access group won't have access to data for the object.
Cliquez sur Fermer
Note
You can only delete a data element and other data element objects if no data is associated to the data element itself.
Warning
Any data set that you delete from the system is irrevocably lost. All data entry forms, and section forms which may have been developed will also be removed. Make sure that you have made a backup of your database before deleting any data set in case you need to restore it at some point in time.
Open the Maintenance app and find the type of metadata object you want to delete.
Dans la liste des objets, cliquez sur le menu des options et sélectionnez Supprimer.
Cliquez sur Confirmer.
Open the Maintenance app and find the type of metadata object you want to view.
In the object list, click the options menu and select Show details.
DHIS2 provides functionality for translations of database content, for example data elements, data element groups, indicators, indicator groups or organisation units. You can translate these elements to any number of locales. A locale represents a specific geographical, political, or cultural region.
Tip
To activate a translation, open the System Settings app, click > Appearance and select a language.
Open the Maintenance app and find the type of metadata object you want to translate.
Dans la liste des objets, cliquez sur le menu des options et sélectionnez Traduire.
Tip
If you want to translate an organisation unit level, click directly on the Translate icon next to each list item.
Sélectionnez un lieu.
Tapez un Nom, Nom abrégé et Description.
Cliquez sur Sauvegarder.
All data entry in DHIS2 is organised in data sets. A data set is a collection of data elements grouped together for data entry and data export between instances of DHIS2. To use a data set to collect data for a specific organisation unit, you must assign the organisation unit to the data set. Once you have assigned the data set to an organisation unit, that data set is available in the Data entry app. Only the organisation units that you have assigned the data set to can use the data set for data entry.
A category combination can link to both data elements and data sets. If you use a category combination for a data set, the category combinations is applicable for the whole form. This means that you can use categories to capture information which is common to an entire form, for example the name of the a project or grant. When a data set is linked to a category combination, those categories will be displayed as drop-down boxes in the Data entry app. Data captured in the form will then be linked to the selected category options from those drop-down boxes. For information about how to create categories and category combinations, see section "Manage data elements and categories". Make sure that you set the type of categories and category combinations to "Attribute".
An scenario for when categories are useful is when you need to capture a data entry form for a implementing partner organisation and a project. In that case:
Create category options and categories for all partner organisations and projects and link them in a new category combination.
Assign the category combination to the data set (form) for which you need to capture this information.
When opening this data set in data entry module, the partner organisation and project categories will automatically be rendered as drop-down boxes, allowing you to select a specific implementing partner organisation and project before continuing to do data entry.
You create and edit data sets in the Maintenance app. Here you define, for example, which data elements you want to include in the data set and the data collection frequency.
You enter data in the Data entry app. The Data entry app uses data entry forms to display the data sets. There are three types of data entry forms:
| Type de formulaire de saisie | Description |
|---|---|
Formulaire par défaut | Une fois que vous avez attribué un ensemble de données à une unité d'organisation, un formulaire par défaut est créé automatiquement. Le formulaire par défaut est alors disponible dans l'application Saisie de données pour les unités d'organisation auxquelles vous l'avez attribué Un formulaire par défaut consiste en une liste des éléments de données appartenant à l'ensemble de données ainsi qu'une colonne pour la saisie des valeurs. Si votre ensemble de données contient des éléments de données avec une combinaison de catégories autre que celle par défaut, par exemple des groupes d'âge ou le sexe, des colonnes supplémentaires sont automatiquement créées dans le formulaire par défaut en fonction des différentes catégories. Si vous utilisez plus d'une combinaison de catégories, vous obtenez alors plusieurs colonnes dans le formulaire par défaut avec différents intitulés de colonne pour les options. |
Formulaire à sections | Si le formulaire par défaut ne correspond pas à vos besoins, vous pouvez le modifier pour créer un formulaire à sections. Les formulaires à sections vous donnent plus de flexibilité pour l'utilisation des formes tabulaires. Dans un formulaire à sections, vous pouvez, par exemple, créer plusieurs tableaux avec des sous-titres et désactiver (griser) des cellules dans un tableau. Lorsque vous ajoutez un formulaire à sections à un ensemble de données, le formulaire à sections est disponible dans l' application Saisie de données. |
Formulaire personnalisé | Si le formulaire que vous souhaitez concevoir est trop compliqué pour les formulaires par défaut ou à sections, vous pouvez alors créer un formulaire personnalisé. La création d'un formulaire personnalisé prend plus de temps que celle d'un formulaire à sections, mais vous avez le plein contrôle de la conception. Vous pouvez, par exemple, reproduire un formulaire d'agrégation papier existant avec un formulaire personnalisé. Cela facilite la saisie des données et devrait réduire le nombre d'éléments de données mal saisis. Lorsque vous ajoutez un formulaire personnalisé à un ensemble de données, le formulaire personnalisé est disponible dans l' application Saisie de données. |
Note
If a data set has both a section form and a custom form, the system displays the custom form during data entry. Users who enter data can't select which form they want to use. In web-based data entry the order of display preference is:
Custom form (if it exists)
Section form (if it exists)
Default form
Mobile devices do not support custom forms. In mobile-based data entry the order of display preference is:
Section form (if it exists)
Default form
Dans l'application Maintenance, vous gérez les objets suivants de l'ensemble de données :
Type d'objet | Fonctions disponibles |
|---|---|
Ensemble de données | Créer, affecter aux unités d'organisation, éditer, partager, supprimer, afficher les détails et traduire Modifier un élément de données obligatoire Ajouter et supprimer simultanément plusieurs ensembles de données des unités d'organisation |
Formulaire à sections | Créer, éditer et gérer les zones grises |
Section | Modifier l'ordre d'affichage, supprimer et traduire |
Formulaire personnalisé | Créer, modifier et scripter |
You need to have data elements and categories to create data sets and data entry forms.
Créez un ensemble de données.
Affectez l'ensemble de données à des unités d'organisation.
Un formulaire par défaut est créé automatiquement.
Créer un formulaire de section ou un formulaire personnalisé.
Vous pouvez maintenant enregistrer des données dans l'application Saisie de données.
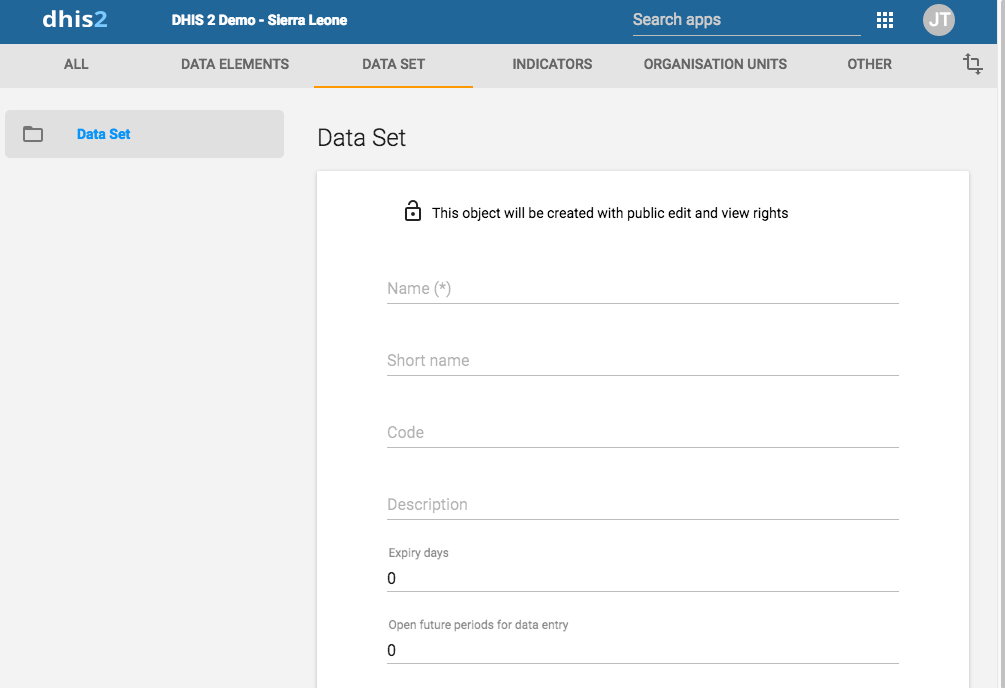
Ouvrez l'application Maintenance et cliquez sur Ensemble de données > Ensemble de données.
Cliquez sur le bouton d'ajout.
Dans le champ Nom, saisissez le nom précis de l'ensemble de données.
Dans le champ Nom abrégé, définissez un nom abrégé pour l'ensemble de données.
Typically, the short name is an abbreviation of the full data set name. This attribute is often used to display the name of the data set where space is limited.
(Facultatif) Dans le champ Code, attribuez un code.
Dans le champ Description, saisissez une description de l'ensemble de données.
Indiquez le nombre de Jours d'expiration.
The number of expiry days controls for how long it should be possible to enter data in the Data entry app for this data set. Expiry days refer to the number of days after the end date of the selected data entry period where the data entry form should be open for entry. After the number of days has expired, the data set will be locked for further entry.
You can set manual exceptions to this using the lock exception functionality in the Data Administration app.
Note
To allow data entry into all possible historical time periods, set the number of expiry days to zero.
If you want it to be possible to enter data for future periods, type the number of periods in the Open future periods for data entry field.
The value is the number of future periods which are available for data entry.
For a monthly data set a value of 2 allows you to enter data for 2 months in advance. This is useful for, by example, population, target and planning data.
In the Days after period to qualify for timely submission field, type the number of days in which data can be entered to be considered reported on time.
To verify the number of timely reports submitted, go to Reports > Reporting rate summary.
Sélectionnez un Type de période.
The period type defines the frequency of reporting for the particular data set. The frequency can for example be daily, quarterly or yearly.
Sélectionnez une Combinaison de catégories pour l'affecter à l'ensemble de données.
Tip
Click Add new to create category combinations that you're missing. In the form that opens, create the category combinations you need. When you're done, click Refresh values.
In the Complete notification recipients list, select a user group that should receive a message when the data set is marked as complete in the Data Entry app.
Le message est transmis via le système de messagerie DHIS2.
If you want the user who entered the data to receive a message when the data set is marked as complete in the Data entry app, select Send notification to completing user.
Le message est transmis via le système de messagerie DHIS2.
Le cas échéant, sélectionnez un ** Flux d'approbation des données**.
If you want it to be possible to use the data set within the Java mobile DHIS2 application, select Enable for Java mobile client.
If you want it to be mandatory to fill all values for a data element in data entry if one or more values have been filled, select All fields for data elements required.
This means that if you enter one data value for a data element in an entry field (that is for a category option combination), then you must enter data for all fields belonging to that data element (that is all category option combinations).
If you want it to be possible to mark a data entry form as complete only if the validation of that form is successful, select Complete allowed only if validation passes.
If you select this option, you can't mark the form as complete if validation fails.
If you want it to be mandatory that any missing values require a comment to justify their absence, select Missing values requires comment on complete.
(Facultatif) Attribuez une ou plusieurs Légendes.
Le cas échéant, sélectionnez Sauter hors ligne.
This option controls whether this data entry form should be downloaded and saved in the user's web browser. Normally you shouldn't select Skip offline. This is the default setting. If you have big forms which are rarely used you can consider selecting this option to speed up initial loading in the data entry module.
Le cas échéant, sélectionnez Décoration des éléments de données.
If you select this option, descriptions of data elements render in call-outs in downloaded data sets in offline mode in the Data entry app.
Le cas échéant, sélectionnez Rendre les sections sous forme d'onglets.
This option is only applicable for section forms. The option allows you to render each section as a tab horizontally above the data set. This is useful for long data sets as it allows appropriate sections to be selected quickly without going through the entire form.
Le cas échéant, sélectionnez Rendre verticalement.
Cette option n'est applicable que pour les formulaires à sections.
Sélectionnez des éléments de données et attribuez-les.
You can override the category combination for each selected data set by clicking on the gear icon above the list of selected data elements. This allows you to utilize a specific category combination (disaggregation) within the current data set instead of the category combination associated directly with the data element itself.
Sélectionnez des indicateurs et attribuez-les.
In the organisation unit tree, select the organisation units you want to assign the data set to.
Tip
Click Organisation unit level to select all organisation units that belong to a certain organisation level.
Click Organisation unit group to select all organisation units that belong to a certain organisation unit group.
Cliquez sur Sauvegarder.
You can now use the data set in the Data Entry app for the organisation units that you have assigned to and for periods according to the selected frequency (period type).
Open the Maintenance app and click Data set > Data set notification.
Cliquez sur le bouton d'ajout.
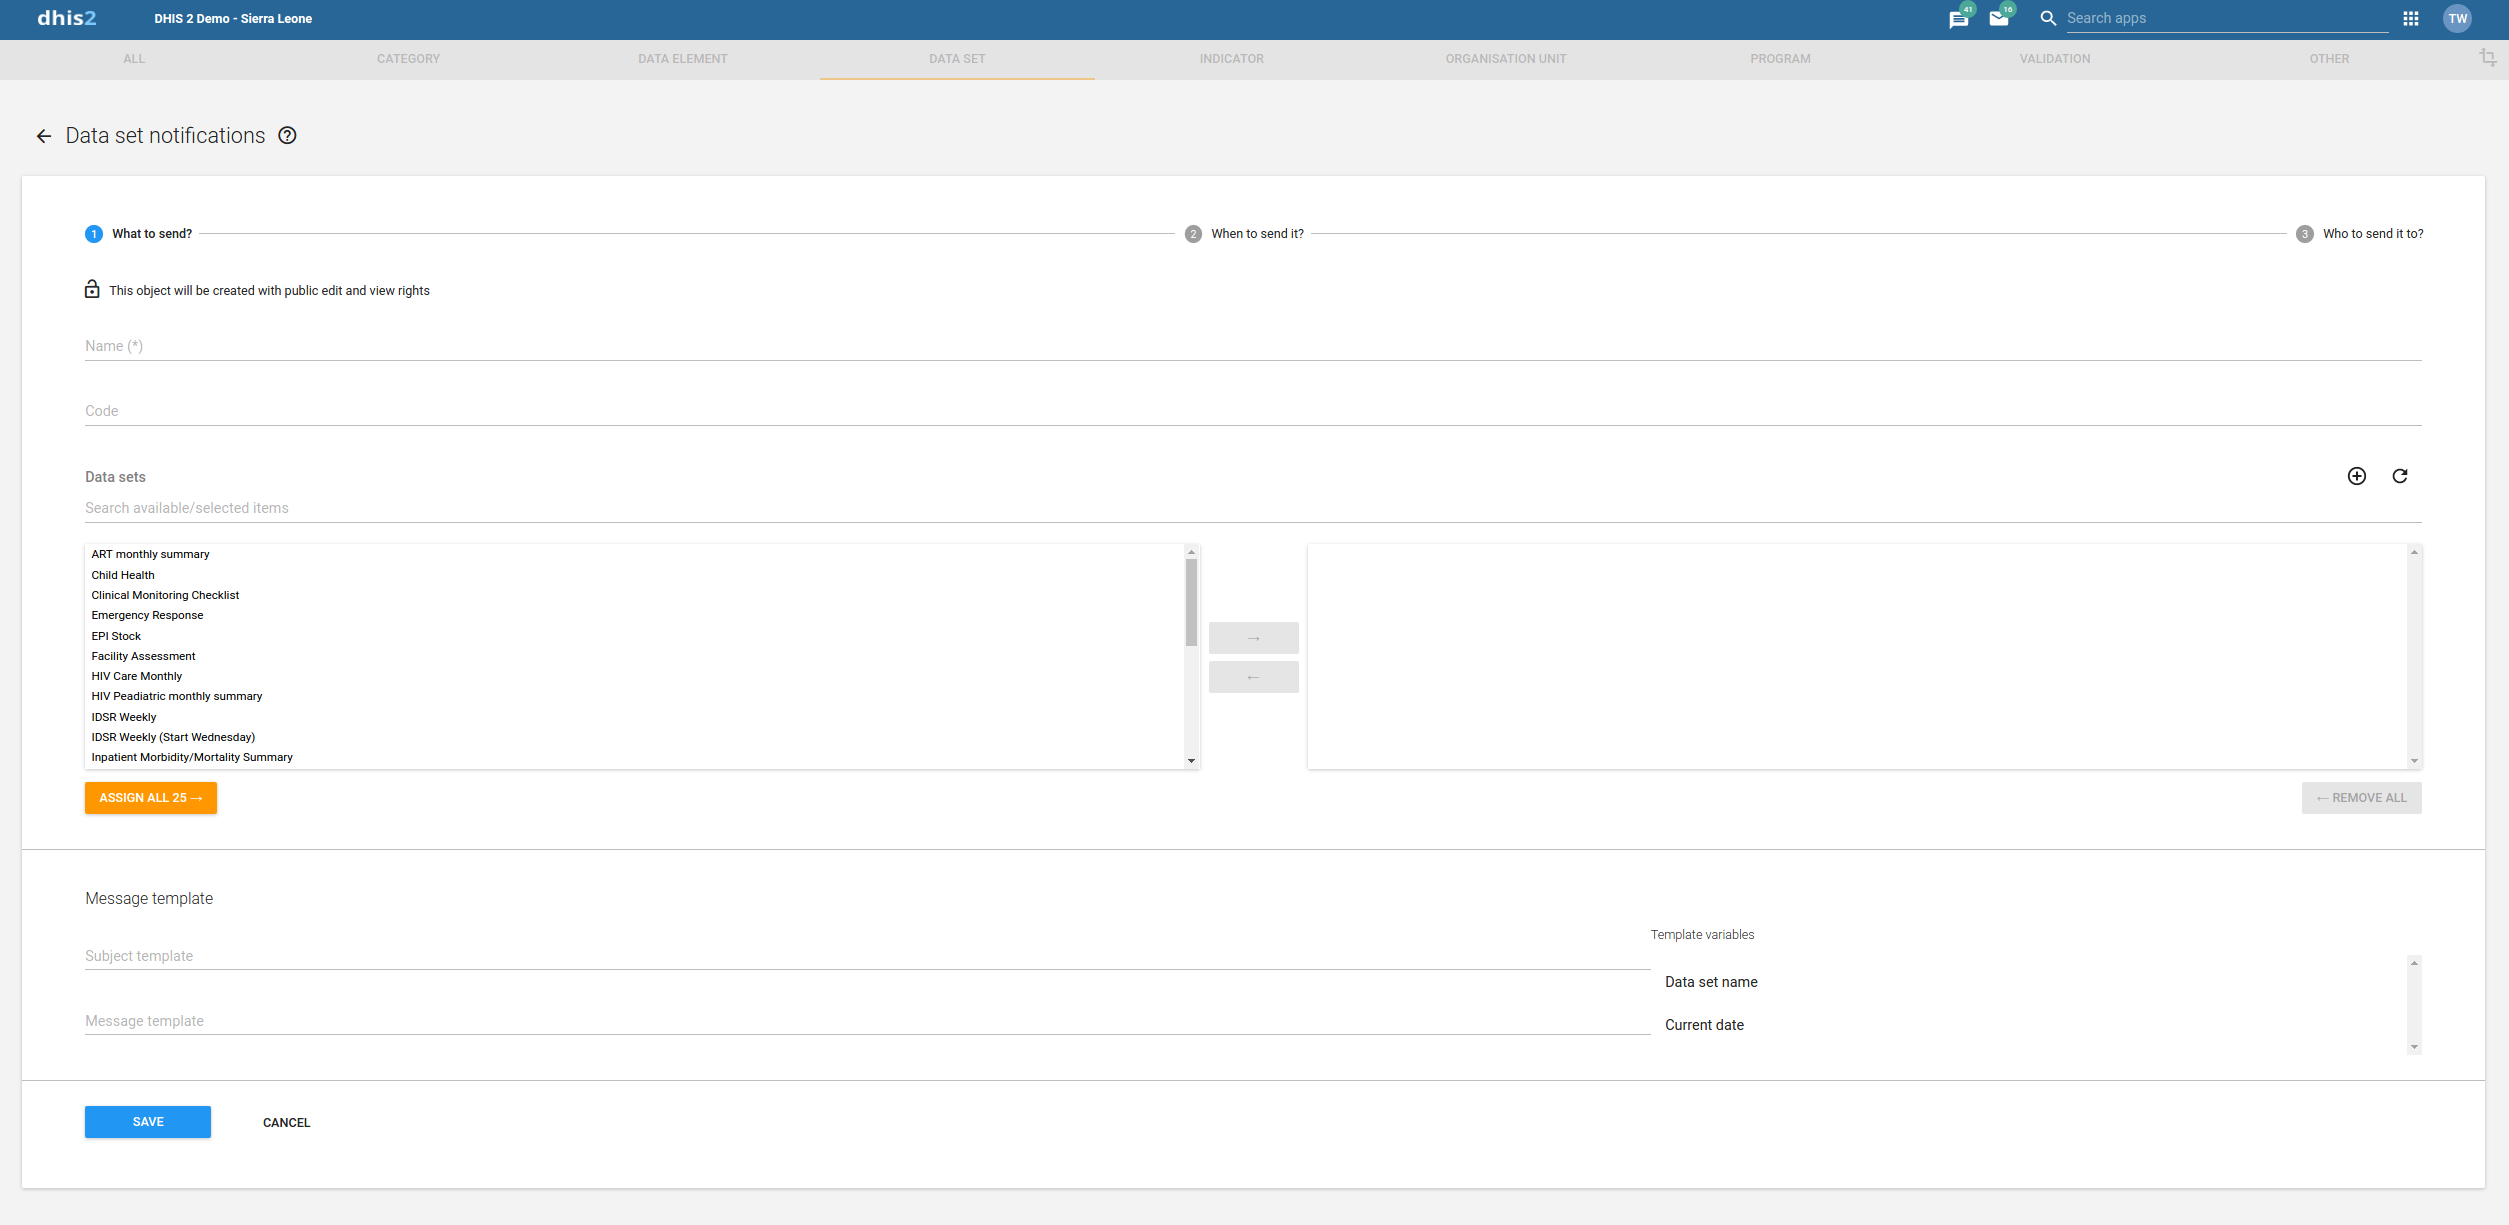
In the Name field, type the precise name of the data set notification.
(Facultatif) Dans le champ Code, attribuez un code.
Saisissez Ensembles de données.
These data sets will be associated to this notification. In case any of them is completed for a certain period and organisation unit, notification will be generated by the system.
Note
Nothing will happen if no data set is selected
Dans la section Modèle de message, nous avons deux paramètres.
Subject template subject of the notification sent in notification. It can have values from the list of variables available on the right side.
Message template actual message sent in notification. It can have values from the list of variables available on the right side.
Note
Subject is only relevant in case of Email and internal DHIS2 messages. It is ignored in case of SMS.
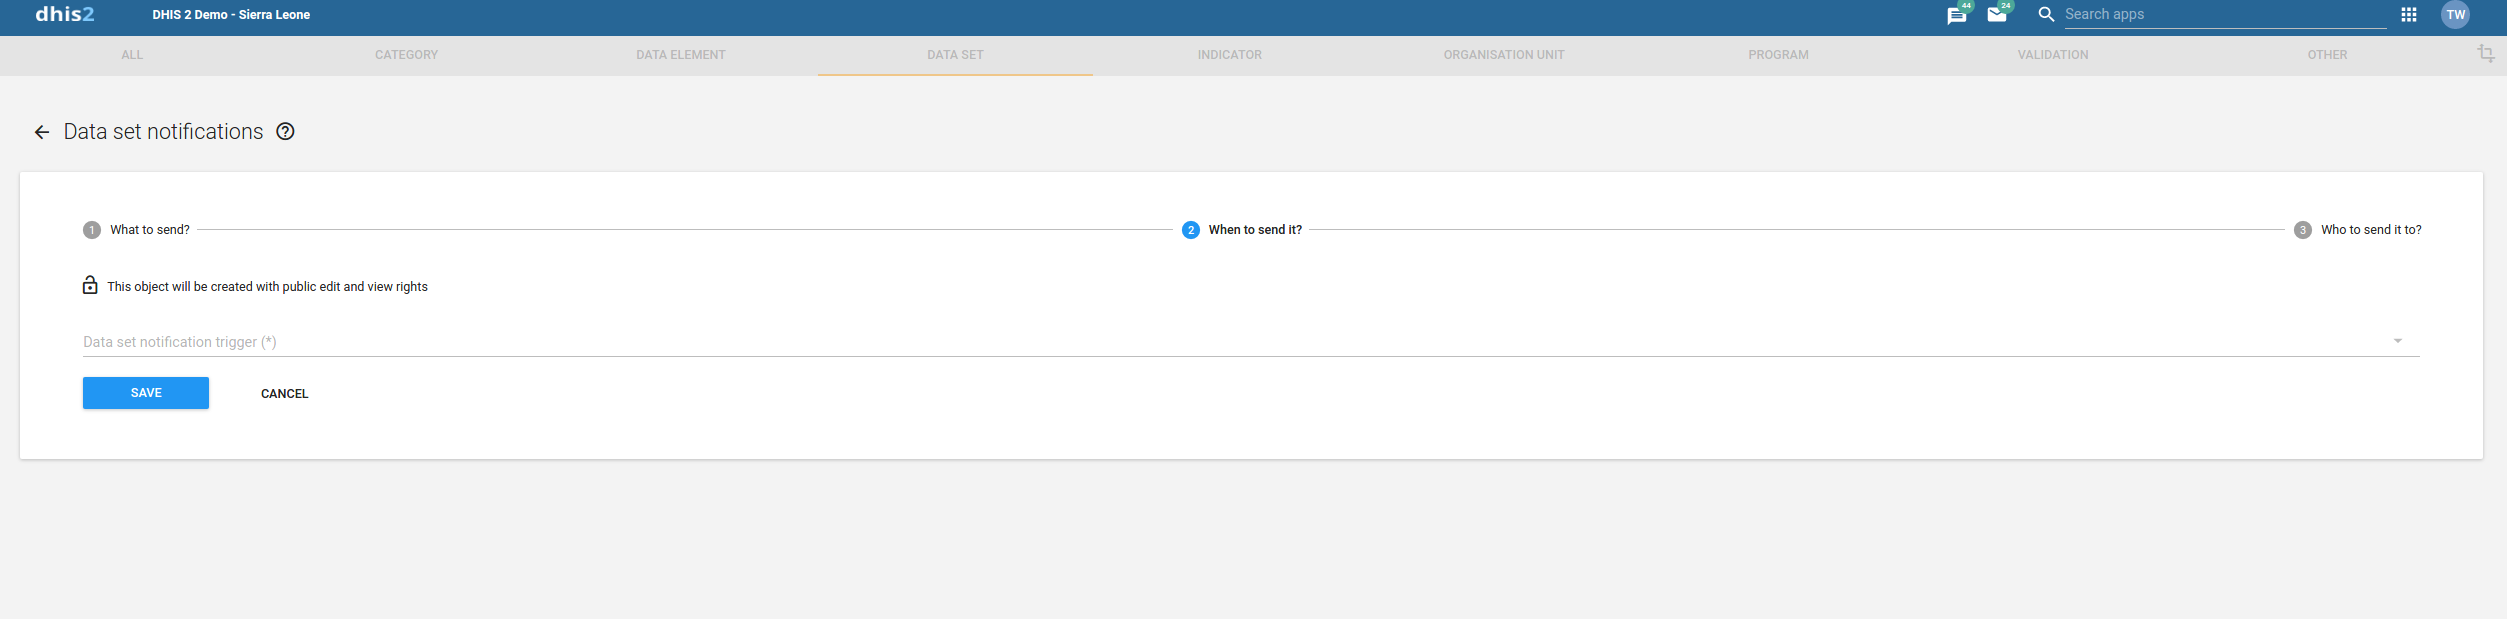
Data set notification trigger field determine when to send notification.
Data Set Completion will trigger notification as soon as data set is completed.
Schedule Days will schedule notification based on number days relative to scheduled date. Schedule date will be decided by Period associated with Data set.
Send notification as provides two different types of notifications
Résumé collectif envoie la notification en mode résumé
Single notification sends notification in single mood
Note
Send notification as option is only available in case of scheduled notification. This option is set to default which is Single notification in case of completion notification
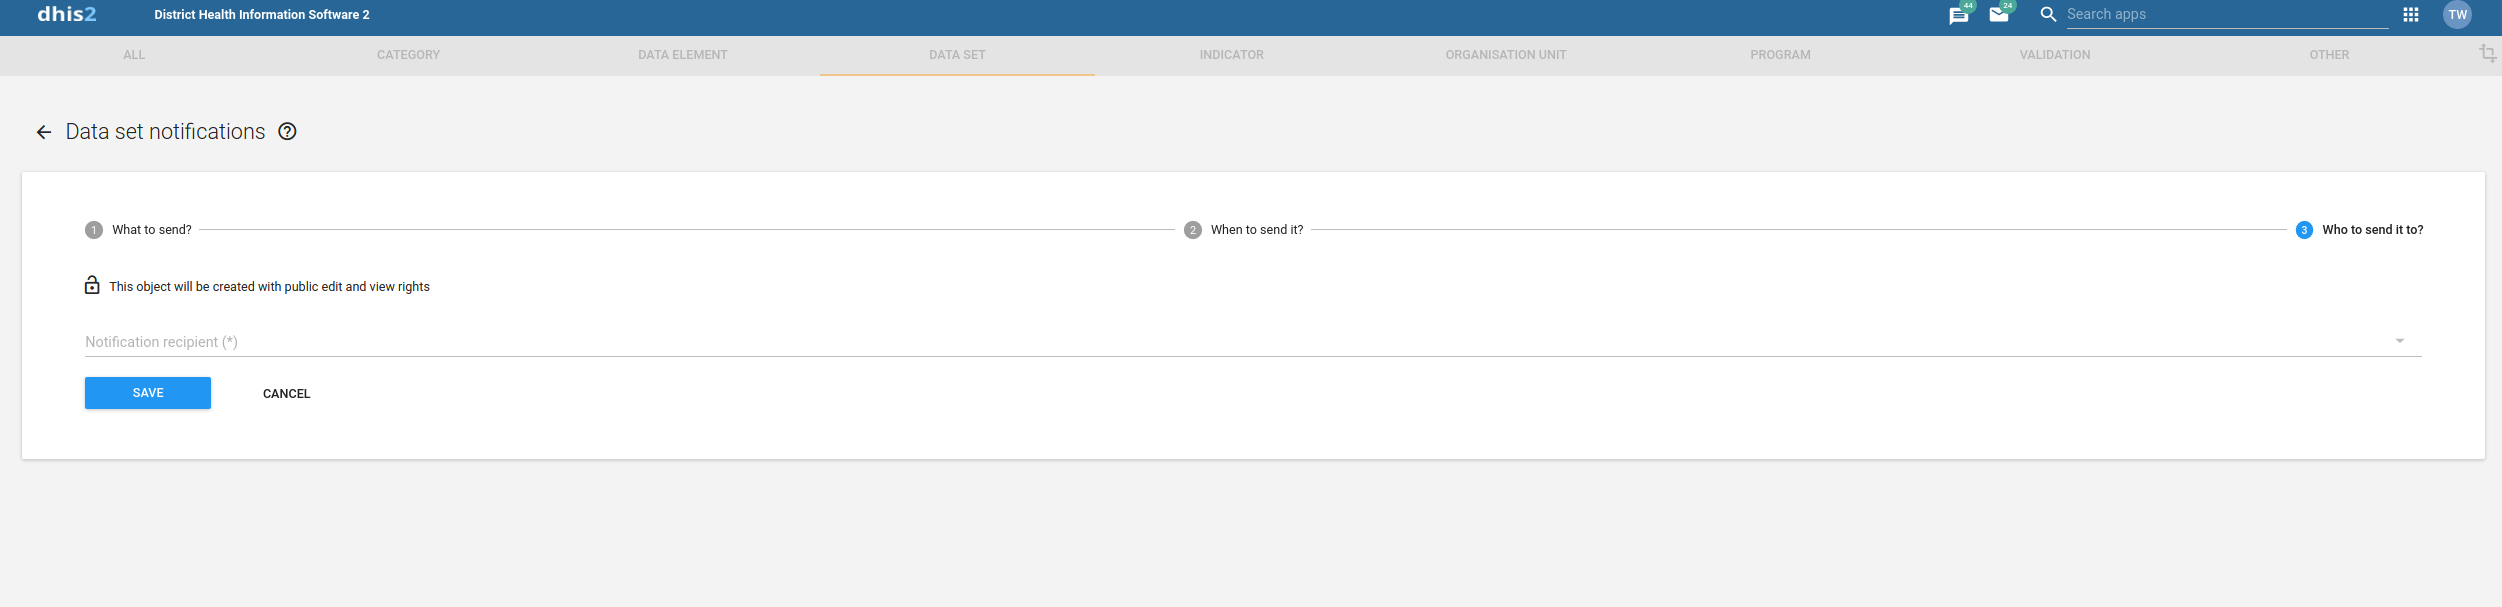
Notification recipient field determine recipients of the notification.
Organisation Unit contact will send notification to contact assigned to organisation unit which the data has been collected from.
UserGroup will send notification to all the member of the selected UserGroup.
Note
An internal DHIS2 message will be sent in case if recipient is UserGroup. Moreover user will also receive SMS/EMAIL if phone number and email address exist for that user and SMS/EMAIL notifications are enabled in SystemSettings
You can override which category combination to use for a data element within the context of a data set. This means that a data element can use different category combinations within different data sets. This is useful when you want to reuse a data element since you don't have to replicate the data element to allow multiple category combinations.
If different regions within your organisation unit hierarchy use different disaggregations, or if the disaggregations change over time, you can represent this by creating different data sets with the appropriate category combinations.
Ouvrez l'application Maintenance et cliquez sur Ensemble de données > Ensemble de données.
Dans la liste, cherchez l'ensemble de données que vous souhaitez modifier.
Cliquez sur le menu des options et sélectionnez Modifier.
Allez à la section des éléments de données et cliquez sur l'icône de clé.
Sélectionnez de nouvelles combinaisons de catégories et cliquez sur Fermer.
Cliquez sur Sauvegarder.
You can add or remove data elements which will be marked as compulsory during data entry.
Ouvrez l'application Maintenance et cliquez sur Ensemble de données > Ensemble de données.
Dans la liste, cherchez l'ensemble de données que vous souhaitez modifier.
Cliquez sur le menu des options et sélectionnez Modifier les éléments de données obligatoires.
Attribuer les éléments de données obligatoires.
Cliquez sur Sauvegarder.
You can download a default data from in PDF format for offline data entry.
Ouvrez l'application Maintenance et cliquez sur Ensemble de données > Ensemble de données.
Dans la liste, cherchez l'objet que vous souhaitez télécharger.
Cliquez sur le menu des options et sélectionnez Obtenir le PDF pour la saisie des données.
Section forms are separated automatically by data element category combinations, which produce a spreadsheet like data entry form for each section.
Ouvrez l'application Maintenance et cliquez sur Ensemble de données > Ensemble de données.
In the list, find the data set you want to create a section form for.
Cliquez sur le menu des options et sélectionnez Gérer les sections.
Cliquez sur le bouton d'ajout.
(Facultatif) Dans le champ Nom, saisissez le nom de la section.
(Optional) In the Description field, type a description of the section.
(Optional) To display totals for rows in the section form during data entry, select Show row totals.
(Optional) To display totals for columns in the section form during data entry, select Show column totals.
Attribuer des éléments de données à la section :
(Facultatif) Sélectionnez un Filtre de combinaison de catégories.
Note
You can only use one category combination per section.
Option | Description |
|---|---|
None | Displays all data elements that don't have a category combination. |
<No filter> | Displays all data elements. |
Sélectionnez des éléments de données et attribuez-les.
(Optional) Sort the data elements within the section by using the up and down arrows to the left of the assigned data elements field.
Cliquez sur Sauvegarder.
Repeat add section steps for each section you want to have in your section form.
In the Data Entry app you can now use the section form. The section form appears automatically when sections are available for the selected data set. Data sets which have section forms will automatically display the section form.
Note how each data element category has been separated into a separate section, and a data entry table has been automatically generated by the system. Use of section forms in combination with data element categories can drastically reduce the amount of time which is required to create data entry forms for data sets.
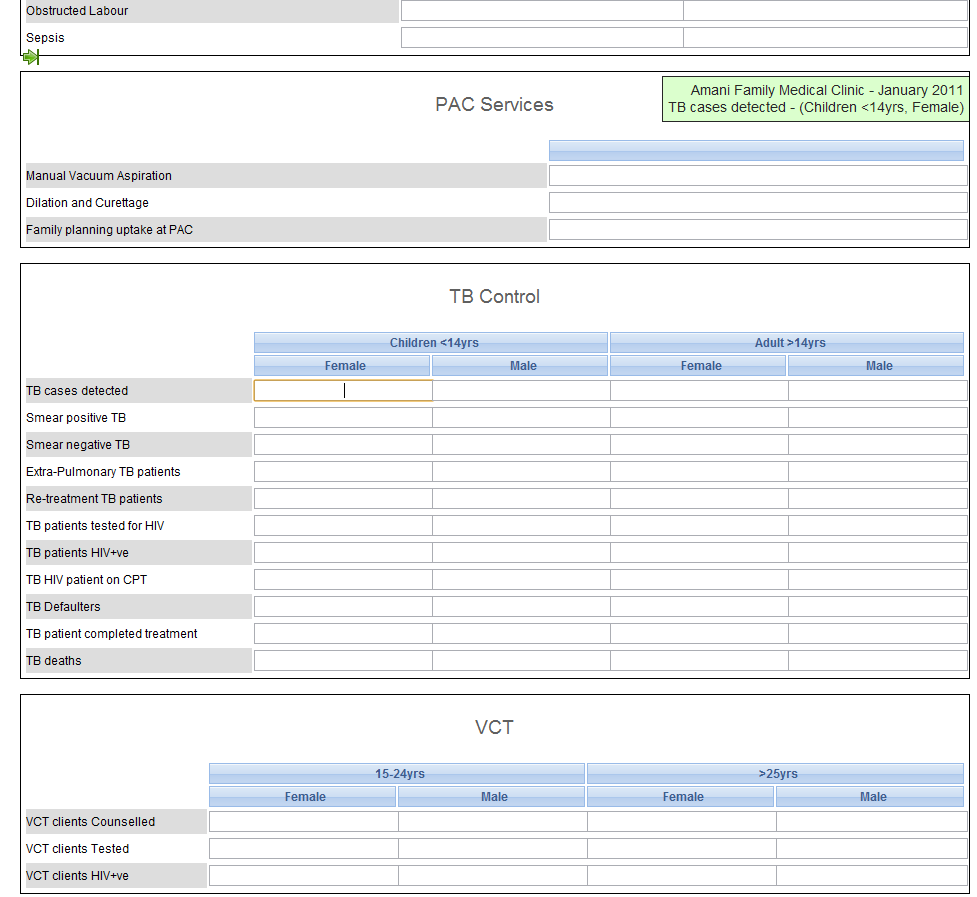
Ouvrez l'application Maintenance et cliquez sur Ensemble de données > Ensemble de données.
In the list, find the data set you want to edit the section form for.
Cliquez sur le menu des options et sélectionnez Gérer les sections.
Dans la liste, cherchez la section que vous souhaitez modifier.
Cliquez sur le menu des options et sélectionnez Modifier.
Modifiez la section et cliquez sur Enregistrer.
Répétez les étapes de modification de section pour chaque section que vous souhaitez éditer.
You can disable data elements and category options for data entry. That means it won’t be possible to enter data into these fields during data entry.

Ouvrez l'application Maintenance et cliquez sur Ensemble de données > Ensemble de données.
In the list, find the data set you want to edit the section form for.
Cliquez sur le menu des options et sélectionnez Gérer les sections.
Dans la liste, cherchez la section que vous souhaitez modifier.
Cliquez sur le menu des options et sélectionnez Gérer les champs gris.
Sélectionnez les champs que vous souhaitez désactiver.
Note
If you've sections that contain data elements assigned to multiple category combinations, switch between the category combinations to view all fields.
Cliquez sur Sauvegarder.
Vous pouvez contrôler l'ordre dans lequel les sections sont affichées dans un formulaire à sections.
Ouvrez l'application Maintenance et cliquez sur Ensemble de données > Ensemble de données.
In the list, find the data set you want to edit the section form for.
Cliquez sur le menu des options et sélectionnez Gérer les sections.
Dans la liste, cherchez la section que vous souhaitez déplacer.
Cliquez sur le menu des options et sélectionnez Déplacer vers le haut ou Déplacer vers le bas.
If the section you want to move is the first or last section in the list, you'll only see one of the move options.
Ouvrez l'application Maintenance et cliquez sur Ensemble de données > Ensemble de données.
In the list, find the data set you want to edit the section form for.
Cliquez sur le menu des options et sélectionnez Gérer les sections.
Dans la liste, cherchez la section que vous souhaitez supprimer.
Cliquez sur le menu des options et sélectionnez Supprimer.
Ouvrez l'application Maintenance et cliquez sur Ensemble de données > Ensemble de données.
In the list, find the data set you want to edit the section form for.
Cliquez sur le menu des options et sélectionnez Traduire.
Sélectionnez un lieu.
Entrez les informations requises.
Cliquez sur Fermer
You design custom forms in a built-in WYSIWYG HTML editor. If you select Source, you can paste HTML code directly in the editing area. For a complete guide on how to use the editor, refer to http://docs.ckeditor.com/.

Pour créer un formulaire personnalisé :
Ouvrez l'application Maintenance et cliquez sur Ensemble de données.
Dans la liste, cherchez l'ensemble de données pour lequel vous souhaitez ajouter un formulaire personnalisé.
Cliquez sur le menu des options et sélectionnez Concevoir le formulaire de saisie.
Dans la zone d'édition, créez le formulaire personnalisé.
Double-click on a object in the left-hand list to insert it in the form.
If you already have the HTML code for your form, click Source and paste the code.
Sélectionnez un Style d'affichage du formulaire.
Cliquez sur Sauvegarder.
In custom data entry form you can use JavaScript to create dynamic behaviour and customizations. As an example, you can hide form sections based on specific user input for data elements, or show specific information when a form loads.
The DHIS2 data entry module provides a range of events which you can register for and use to perform actions at certain times. The events are registered on the document element. The jQuery event object and the data set identifier are always the first two arguments provided to the callback functions. The table below provides an overview of the events and when they are triggered.
| Clé | Description | Arguments |
|---|---|---|
dhis2.de.event.formLoaded | Déclenché après le rendu du formulaire de saisie, mais avant la définition des valeurs de données dans les champs de saisie. | Événement | ID de l'ensemble de données |
dhis2.de.event.dataValuesLoaded | Déclenché après la définition des valeurs de données dans les champs de saisie. | Événement | ID de l'ensemble de données |
dhis2.de.event.formReady | Déclenché lorsque le formulaire de saisie est entièrement rendu et chargé avec tous les éléments. | Événement | ID de l'ensemble de données |
dhis2.de.event.dataValueSaved | Déclenché lorsqu'une valeur de données est sauvegardée avec succès. | Événement | ID de l'ensemble de données | Objet de la valeur de données |
dhis2.de.event.completed | Déclenché lorsqu'un ensemble de données est marqué avec succès comme étant complet. | Événement | ID de l'ensemble de données | Objet de l'enregistrement complet |
dhis2.de.event.uncompleted | Déclenché lorsqu'un ensemble de données est marqué avec succès comme étant incomplet. | Événement | ID de l'ensemble de données |
dhis2.de.event.validationSuccess | Triggered when validation is done and there were no violations. | Événement | ID de l'ensemble de données |
dhis2.de.event.validationError | Déclenché lorsque la validation est effectuée et il y a eu une ou plusieurs violations. | Événement | ID de l'ensemble de données |
dhis2.ou.event.orgUnitSelected | Déclenché lorsqu'une ou plusieurs unités d'organisation sont sélectionnées dans l'arbre web des unités d'organisation. | Événement | Le ID des unités d'Org | Noms des unités d'Org | Les ID des des sous-unités d'org |
Pour s'inscrire à un événement :
<script type="text/javascript">

dhis2.util.on( 'dhis2.de.event.formReady', function( event, ds ) {
  console.log( 'The form with id: ' + ds + ' is loaded!' );
} );

dhis2.util.on( 'dhis2.de.event.dataValueSaved', function( event, ds, dv ) {
  console.log( 'Data value: ' + dv.value + ' was saved with data element: ' + dv.de );
} );

dhis2.util.on( 'dhis2.de.event.completed', function( event, ds, cr ) {
  console.log( 'Form was completed for org unit: ' + cr.ou );
} );

</script>
Note
Be careful to only use "namespaced" events like the ones in the example above and not general ones like "click" as the dhis2.util.on method will deregister the event first.
If your function only applies to certain data sets you can use the supplied data set identifier and shortcut your function for unwanted data sets like this:
dhis2.de.on( 'dhis2.de.event.validationSuccess', function( event, ds ) {
  if ( $.inArray( ds, ['utXOiGbEj14', 'Re7qzHEThSC'] ) == -1 ) {
    return false;
  }
  console.log( 'Form with id: ' + ds + ' validated successfully!' );
} );
The identifiers of the input fields in the data entry form is on the format described below. This format can be used to select the input fields in your script and perform actions on them:
<dataelementid>-<optioncomboid>-val
Since the data set identifier is provided for all events a feasible alternative is to utilize the "files" Web API resource and keep your callback functions in a single file, where you let the JavaScript code take action based on which data set is currently loaded.
The DHIS2 data entry module contains JavaScript API functions which can be accessed from custom data entry forms.
dhis2.de.api.getSelections: This function returns a JavaScript object which contains properties for all dimensions with corresponding values for the identifiers of the selected options. It contains properties for "ds" (data set), "pe" (period), "ou" (organisation unit) and identifiers for all data set categories.
Voici un exemple de réponse :
{
 +  ds: "lyLU2wR22tC",
 +  pe: "201605",
 +  ou: "g8upMTyEZGZ",
 +  LFsZ8v5v7rq: "CW81uF03hvV",
 +  yY2bQYqNt0o: "yMj2MnmNI8L"
 +}
Exemple d'utilisation de cette fonction en JavaScript :
var sel = dhis2.de.api.getSelections();
 +var orgUnit = sel["ou"];
 +var partner = sel["LFsZ8v5v7rq"];
You can assign different sharing settings to metadata objects, for example organisation units and tracked entity attributes. These sharing settings control which users and users groups that can view or edit a metadata object.
Some metadata objects also allows you to change the sharing setting of data entry for the object. These additional settings control who can view or enter data in form fields using the metadata.
Note
The default setting is that everyone (Public access) can find, view and edit metadata objects.
Open the Maintenance app and find the type of metadata object you want to modify.
In the object list, click the context menu and select Sharing settings.
(Optional) Add users or user groups: search for a user or a user group and select it. The user or user group is added to the list.
Modifiez les paramètres de partage pour les groupes d'accès que vous souhaitez modifier.
Can edit and view: The access group can view and edit the object.
Peut seulement visualiser : Le groupe d'accès peut seulement visualiser l'objet.
No access (only applicable to Public access): The public won't have access to the object.
Change data sharing settings for the access groups you want to modify.
Can capture data: The access group can view and capture data for the object.
Can view data: The access group can view data for the object.
No access: The access group won't have access to data for the object.
Cliquez sur Fermer
Note
You can only delete a data element and other data element objects if no data is associated to the data element itself.
Warning
Any data set that you delete from the system is irrevocably lost. All data entry forms, and section forms which may have been developed will also be removed. Make sure that you have made a backup of your database before deleting any data set in case you need to restore it at some point in time.
Open the Maintenance app and find the type of metadata object you want to delete.
Dans la liste des objets, cliquez sur le menu des options et sélectionnez Supprimer.
Cliquez sur Confirmer.
Open the Maintenance app and find the type of metadata object you want to view.
In the object list, click the options menu and select Show details.
DHIS2 provides functionality for translations of database content, for example data elements, data element groups, indicators, indicator groups or organisation units. You can translate these elements to any number of locales. A locale represents a specific geographical, political, or cultural region.
Tip
To activate a translation, open the System Settings app, click > Appearance and select a language.
Open the Maintenance app and find the type of metadata object you want to translate.
Dans la liste des objets, cliquez sur le menu des options et sélectionnez Traduire.
Tip
If you want to translate an organisation unit level, click directly on the Translate icon next to each list item.
Sélectionnez un lieu.
Tapez un Nom, Nom abrégé et Description.
Cliquez sur Sauvegarder.
An indicator is a formula that can consist of multiple data elements, constants, organisation unit group counts and mathematical operators. The indicator consist typically of a numerator and denominator. You use indicators to calculate coverage rates, incidence and other values that are a result of data element values that have been entered into the system. Calculated totals do not have a denominator.
N.B.
Ne saisissez jamais les valeurs des indicateurs directement dans le DHIS2, calculez-les.
An indicator formula can consist of mathematical operators, for example plus and minus; functions (see below); and of the following elements:
| Élément d'indicateurs | Type | Description |
|---|---|---|
Constante | Composante | Les constantes sont des valeurs numériques qui restent les mêmes pour tous les calculs d'indicateurs. Ceci est utile lorsqu'on veut avoir un endroit unique pour changer les valeurs susceptibles de changer dans le temps. Les constantes sont appliquées APRÈS l'agrégation des valeurs des éléments. |
Éléments de données | Composante | Les éléments de données sont remplacés par la valeur des données saisies pour l'élément de donnée. |
Jours | Opérateur | "Jours" est un opérateur spécial qui fournit toujours le nombre de jours pour le calcul d'un indicateur donné. Par exemple : si vous voulez calculer le "Pourcentage de temps où le réfrigérateur à vaccins n'a pas fonctionné" ;, vous pouvez alors définir le numérateur comme ("Days-"Nombre de jours où le réfrigérateur à vaccins était disponible"")/"Jours" ; Si le réfrigérateur était disponible pendant 25 jours en juin, l'indicateur serait alors calculé comme suit (30-25/25)*100 = 17 % Si vous voulez calculer le total pour le premier trimestre, le nombre de jours ("Jours" ;) serait : 31+28+31 = 90 Le paramètre "Jours" sera toujours le nombre de jours dans la période d'intérêt. |
Nombre d'unités d'organisation | Composante | Vous pouvez utiliser des groupes d'unités d'organisation dans les formules. Ils seront remplacés par le nombre d'unités d'organisation du groupe. Lors de l'agrégation, les unités d'organisation du groupe seront recoupées avec la partie requise de la hiérarchie des unités d'organisation. Ceci vous permet d'utiliser le nombre d'établissements publics dans un district spécifique dans les indicateurs. Cela est utile par exemple lorsque vous créez des enquêtes et des rapports sur les infrastructures des établissements. |
Programmes | Composante | Cliquez sur Programmes et sélectionnez un programme pour visualiser tous les éléments de données, attributs et indicateurs liés à un programme spécifique. Les composantes de programme que vous incluez dans votre formule auront une étiquette de programme qui leur sera attribuée. |
Vous pouvez utiliser les fonctions suivantes dans une formule d'indicateur :
Fonction de l'indicateur | Arguments | Description |
|---|---|---|
si | (boolean-expr, true-expr, false-expr) | Évalue l'expression booléenne et si vrai retourne la valeur de l'expression vraie, si faux retourne la valeur de l'expression fausse. Les arguments doivent respecter les règles pour toute expression indicatrice. |
estNul | (élément) | Retourne vrai si la valeur de l'élément est manquante (nulle), sinon faux. |
n'est pas Nul | (élément) | Retourne vrai si la valeur de l'élément n'est pas manquante (non nulle), sinon faux. |
premier Non Nul | (élément [, élément ...]) | Retourne la valeur du premier élément qui n'est pas manquant (pas nul). Peut être fourni avec un nombre quelconque d'arguments. Tout argument peut également être un numérique ou une chaîne littérale, qui sera renvoyé si tous les objets précédents ont des valeurs manquantes. |
plus grande | (expression [, expression ...]) | Retourne la plus grande (la plus élevée) valeur des expressions données. Peut être fourni avec un nombre quelconque d'arguments. |
plus faible | (expression [, expression ...]) | Retourne la valeur la plus faible (la plus basse) des expressions données. Peut être fourni avec un nombre quelconque d'arguments. |
Dans l'application Maintenance, vous pouvez gérer les objets d'indicateurs suivants :
Type d'objet | Fonctions disponibles |
|---|---|
Indicateur | Créer, modifier, cloner, partager, supprimer, montrer les détails et traduire |
Type d'indicateur | Créer, modifier, cloner, supprimer, afficher les détails et traduire |
Groupe d'indicateurs | Créer, modifier, cloner, partager, supprimer, afficher les détails et traduire |
Ensemble de groupes d'indicateurs | Créer, modifier, cloner, partager, supprimer, afficher les détails et traduire |
Créer des types d'indicateurs.
Créer des indicateurs.
Créer des groupes d'indicateurs.
Créer des ensembles de groupes d'indicateurs.

Indicator types define a factor that is applied during aggregation. Indicator values that are calculated during a data mart export or report table generation process will appear properly formatted, and will therefore not require an additional multiplier (for example 100 in the case of percent) for the values to appear correctly formatted.
Note
As of version 2.4 of DHIS2, the "Calculated data element" object has been deprecated. Instead, you can create a calculated data element by creating an indicator type with a factor of "1" and by setting the "Number" option to "Yes". The effect of setting the "Number" option to "Yes" will be that the indicator will effectively not have a denominator. You will therefore only be able to define a numerator, which will serve as the formula of the calculated data element.
Open the Maintenance app and click Indicator > Indicator type.
Cliquez sur le bouton d'ajout.
In the Name field, type the name of the indicator type, for example "Per cent", "Per thousand", "Per ten thousand".
Entrez un Facteur.
The factor is the numeric factor that will be multiplied by the indicator formula during the calculation of the indicator.
Cliquez sur Sauvegarder.
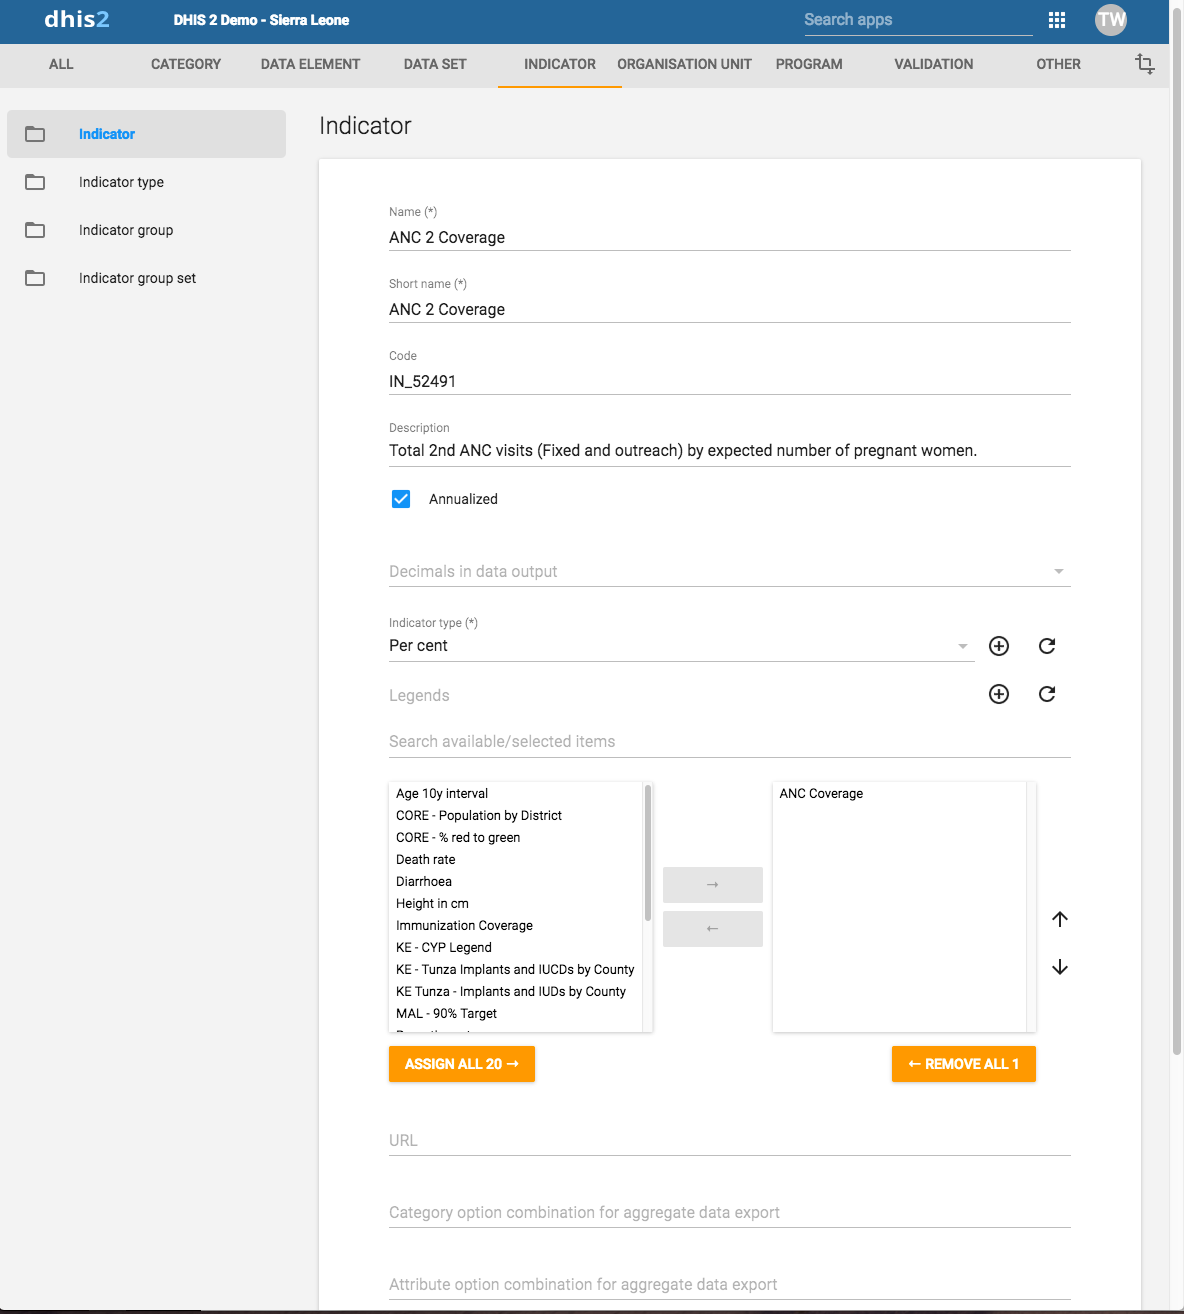
Open the Maintenance app and click Indicator > Indicator.
Cliquez sur le bouton d'ajout.
In the Name field, type the full name of the indicator, for example "Incidence of confirmed malaria cases per 1000 population".
In the Short name field, type an abbreviated name of the indicator, for example "Inc conf. malaria per 1000 pop".
The short name must be less than or equal to 25 characters, including spaces.
(Facultatif) Dans le champ Code, attribuez un code.
Dans de nombreux pays, les indicateurs se voient attribuer un code.
(Facultatif) Dans le champ Couleur, attribuez une couleur pour représenter l'indicateur.
(Facultatif) Dans le champ Icône, attribuez une icône pour illustrer la signification de l'indicateur.
In the Description field, type a brief, informative description of the indicator and how it is calculated.
If you want to apply an annualization factor during the calculation of the indicator, select Annualized.
Typically, an annualized indicator's numerator is multiplied by a factor of 12, and the denominator is for instance a yearly population figure. This allows for monthly coverage values to be calculated with yearly population figures.
Sélectionnez le nombre de Décimales dans la sortie des données.
Sélectionnez un Type d'indicateur.
This field determines a factor that will automatically be applied during the calculation of the indicator. Possible choices are determined by the indicator types. For example, a "Percent" indicator will automatically be multiplied by a factor of 100 when exported to the data mart, so that it will display as a percentage.
(Facultatif) Attribuez une ou plusieurs Légendes.
In the URL field, enter a link, for example a link to an indicator registry, where a full metadata description of the indicator can be made available.
(Optional) Enter a Category option combination for aggregate data export..
You use this setting to map aggregated data exported as raw data to another server. Typically you do this type of data exchange mapping when you want to create anonymous aggregated data from patient data recorded in programs (event data).
(Optional) Enter an Attribute option combination for aggregate data export..
You use this setting to map aggregated data exported as raw data to another server. Typically you do this type of data exchange mapping when you want to create anonymous aggregated data from patient data recorded in programs (event data).
If applicable, enter custom attributes values, for example Classification or Collection method.
Note
You create custom attributes in the Maintenance app: Other > Attributes.
Cliquez sur Modifier le numérateur.
Saisissez une description claire du numérateur.
Define the numerator by double-clicking components in the right-hand field. The components then appears as part of the formula in the left-hand field. Add mathematical operators by double-clicking the icons below the left-hand field.
You formula must be mathematically valid. This includes correct use of parentheses when necessary.
Cliquez sur Terminé pour enregistrer toutes les modifications apportées au numérateur.
Cliquez sur Modifier le dénominateur.
Saisissez une description claire du dénominateur.
Define the denominator by double-clicking components in the right-hand field. The components then appears as part of the formula in the left-hand field. Add mathematical operators by double-clicking the icons below the left-hand field.
You formula must be mathematically valid. This includes correct use of parentheses when necessary.
Cliquez sur Terminé pour enregistrer toutes les modifications apportées au dénominateur.
If applicable, select compulsory indicator group sets, for example Human resources.
Note
You'll only see indicator group sets in this form if you've created them and set them to Compulsory.
You create indicator group sets in the Maintenance app: Indicator > Indicator group set.
Cliquez sur Sauvegarder.

Open the Maintenance app and click Indicator > Indicator group.
Cliquez sur le bouton d'ajout.
Saisissez un nom.
Sélectionnez des indicateurs et attribuez-les.
Cliquez sur Sauvegarder.

Indicator group sets create combined groups of similar indicators. For example, you might have a group of indicators called "Malaria" and "Leishmaniasis". Both of these groups could be combined into a group set called "Vector-borne diseases". Indicator groups sets are used during analysis of data to combine similar themes of indicators.
Open the Maintenance app and click Indicators > Indicator group.
Cliquez sur le bouton d'ajout.
Remplissez le formulaire :
Nom
Description
Obligatoire
Sélectionnez des indicateurs et attribuez-les.
Available indicator groups are displayed in the left panel. Indicator groups that are currently members of the indicator group set are displayed in the right hand panel.
Cliquez sur Sauvegarder.
Cloning a data element or other objects can save time when you create many similar objects.
Open the Maintenance app and find the type of metadata object you want to clone.
Dans la liste des objets, cliquez sur le menu des options et sélectionnez Cloner.
Modifiez les options que vous souhaitez.
Cliquez sur Sauvegarder.
You can assign different sharing settings to metadata objects, for example organisation units and tracked entity attributes. These sharing settings control which users and users groups that can view or edit a metadata object.
Some metadata objects also allows you to change the sharing setting of data entry for the object. These additional settings control who can view or enter data in form fields using the metadata.
Note
The default setting is that everyone (Public access) can find, view and edit metadata objects.
Open the Maintenance app and find the type of metadata object you want to modify.
In the object list, click the context menu and select Sharing settings.
(Optional) Add users or user groups: search for a user or a user group and select it. The user or user group is added to the list.
Modifiez les paramètres de partage pour les groupes d'accès que vous souhaitez modifier.
Can edit and view: The access group can view and edit the object.
Peut seulement visualiser : Le groupe d'accès peut seulement visualiser l'objet.
No access (only applicable to Public access): The public won't have access to the object.
Change data sharing settings for the access groups you want to modify.
Can capture data: The access group can view and capture data for the object.
Can view data: The access group can view data for the object.
No access: The access group won't have access to data for the object.
Cliquez sur Fermer
Note
You can only delete a data element and other data element objects if no data is associated to the data element itself.
Warning
Any data set that you delete from the system is irrevocably lost. All data entry forms, and section forms which may have been developed will also be removed. Make sure that you have made a backup of your database before deleting any data set in case you need to restore it at some point in time.
Open the Maintenance app and find the type of metadata object you want to delete.
Dans la liste des objets, cliquez sur le menu des options et sélectionnez Supprimer.
Cliquez sur Confirmer.
Open the Maintenance app and find the type of metadata object you want to view.
In the object list, click the options menu and select Show details.
DHIS2 provides functionality for translations of database content, for example data elements, data element groups, indicators, indicator groups or organisation units. You can translate these elements to any number of locales. A locale represents a specific geographical, political, or cultural region.
Tip
To activate a translation, open the System Settings app, click > Appearance and select a language.
Open the Maintenance app and find the type of metadata object you want to translate.
Dans la liste des objets, cliquez sur le menu des options et sélectionnez Traduire.
Tip
If you want to translate an organisation unit level, click directly on the Translate icon next to each list item.
Sélectionnez un lieu.
Tapez un Nom, Nom abrégé et Description.
Cliquez sur Sauvegarder.
Dans cette partie, nous verrons comment :
Create a new organisation unit and build up the organisation unit hierarchy
Create organisation unit groups, group sets, and assign organisation units to them
Modifier la hiérarchie des unités d'organisation
The organisation unit hierarchy defines the organisation structure of DHIS2, for example how health facilities, administrative areas and other geographical areas are arranged with respect to each other. It is the "where" dimension of DHIS2, similar to how periods represent the "when" dimension.
The organisation unit hierarchy is built up by parent-child relations. In DHIS2, each of these nodes is an organisation unit. A country might for example have eight provinces, and each province might have a number of districts as children. Normally, the lowest levels consist of facilities where data is collected. Data collecting facilities can also be located at higher levels, for example national or provincial hospitals. Therefore, you can create skewed organisation trees in DHIS2.
Vous ne pouvez avoir qu'une seule hiérarchie d'organisation en même temps.
Vous pouvez avoir un nombre illimité de niveaux dans une hiérarchie.
Typically national organisation hierarchies in public health have four to six levels.
You can create additional classifications by using organisation groups and organisation group sets.
For example to create parallel administrative boundaries to the health care sector.
It is recommended to use organisation unit groups to create a non-geographical hierarchy.
An organisation unit can only be a member of a single organisation unit group within an organisation unit group set.
An organisation unit group can be part of multiple organisation unit group sets.
The organisation unit hierarchy is the main vehicle for data aggregation on the geographical dimension.
When you close an organisation unit, you can't register or edit events to this organisation unit in the Event Capture and Tracker Capture apps.
Important
You can change the organisation unit hierarchy after you've created it, even organisation units that collect data. However, DHIS2 always uses the latest hierarchy for data aggregation. So if you change the hierarchy, you loose the temporal representation of the hierarchy across time.
District A is sub-divided into District B and District C. Facilities which belonged to District A are reassigned to District B and C. Any historical data, which you entered before the split occurred, is still registered as belonging to District B and C, not to the obsolete District A.
In the Maintenance app, you manage the following organisation unit objects:
Type d'objet | Fonctions disponibles |
|---|---|
Unité d'organisation | Créer, modifier, cloner, supprimer, afficher les détails et traduire |
Groupe d'unités d'organisation | Créer, modifier, cloner, partager, supprimer, afficher les détails et traduire |
Ensemble de groupes d'unités d'organisation | Créer, modifier, cloner, partager, supprimer, afficher les détails et traduire |
Niveau de l'unité d'organisation | Modifier et traduire |
Opérations de la hiérarchie | Déplacer les unités d'organisation |
Le flux de travail recommandé est le suivant :
Créer des unités d'organisation.
Créer des groupes d'unités d'organisation.
Créer des ensembles de groupes d'unités d'organisation.

You add organisation units to the hierarchy one by one, either as a root unit or as a child of a selected organisation unit. You can only have one root unit.
Open the Maintenance app and click Organisation unit > Organisation unit.
Cliquez sur le bouton d'ajout.
Select which organisation unit your new organisation unit will belong to:
Cliquez sur Unité d'organisation mère.
In the organisation unit tree, locate the parent organisation unit and select it. Your selection is marked in yellow.
Tip
Click the arrows to expand the organisation unit tree.
Cliquez sur Sélectionner.
Entrez un Nom de l'unité d'organisation.
Chaque unité organisationnelle doit avoir un nom unique.
Entrez un nom abrégé pour l'unité d'organisation.
Typically, the short name is an abbreviation of the full organisation unit name. This attribute is often used in reports to display the name of the organisation unit, where space is limited.
(Facultatif) Attribuez un Code.
Dans de nombreux pays, les unités d'organisation se voient attribuer un code.
(Facultatif) Tapez une Description de l'unité d'organisation.
Sélectionnez une Date d'ouverture.
The opening dates control which organisation units that existed at a point in time, for example when analysing historical data.
Le cas échéant, sélectionnez une date de fermeture.
In the Comment field, enter any additional information that you would like to add.
(Optional) In the URL field, enter a link to an external web site that has additional information about the organisation unit.
Entrez les coordonnées :
Personne de contact
Addresse
Numéro de téléphone
(Facultatif) Entrez la Latitude et la Longitude.
You must have latitude and longitude values to create maps in the Maps app. Then your organisation units can be represented as points on a map, for example a health facility. Without this information, the Maps app will not work.
It might be more efficient to import coordinates later as a batch job for all organisation units using the Import-Export app. You also use the Import-Export app to create polygons. A polygon is an organisation unit that represent an administrative boundary.
Le cas échéant, sélectionnez des Ensembles de données et attribuez-les.
Note
You control whether a user should be able to assign data sets to an organisation unit in the System Settings app:
Open the System Settings app, click Access and select Allow assigning object to related objects during add or update.
Le cas échéant, sélectionnez des Programmes et attribuez-les.
Note
You control whether a user should be able to assign programs to an organisation unit in the System Settings app:
Open the System Settings app, click Access and select Allow assigning object to related objects during add or update.
If applicable, enter custom attributes values, for example HR identifier.
Note
You configure the custom attributes in the Maintenance app:
Open the Maintenance app and click Other > Attribute.
Cliquez sur Sauvegarder.
Organisation unit groups allow you to classify related organisation units into a common theme. You can for example group all organisation units that are hospitals in an Hospital group.
Open the Maintenance app and click Organisation unit > Organisation unit group.
Cliquez sur le bouton d'ajout.
Remplissez le formulaire :
Name: Provide a precise, unique and descriptive name for the organisation unit group.
Short name: The short name should be less than 25 characters. Typically, the short name is an abbreviation of the full organisation unit name. This attribute is used in certain places in DHIS2 where space is limited.
Code
Symbol: Select a symbol which will be used to display the organisation unit (points only) when the layer is displayed in the Maps app.
In the organisation tree, click the organisation units you want to add to the organisation unit group.
You can locate an organisation unit in the tree by expanding the branches (click on the arrow symbol), or by searching for it by name.
Les unités d'organisation sélectionnées s'affichent en orange.
Cliquez sur Sauvegarder.
Organisation unit group sets allows you to create additional classifications of organisation units. The group sets create new dimensions so that you can make a more detailed data analysis. You an easily filter, organise or aggregate data by groups within a group set.
Vous pouvez avoir un nombre quelconque d'ensembles de groupes d'unités d'organisation.
The default organisation unit group sets are Type and Ownership.
An organisation unit can only be a member of a single organisation unit group within an organisation unit group set.
An organisation unit group can be part of multiple organisation unit group sets.
You can define whether an organisation unit group set is compulsory or not, which will affect the completeness of the data. Compulsory means that all organisation units must be member of a group in that group set.
Note
In the Data integrity part of the Data administration app you can verify if you've accidentally assigned the same organisation unit to multiple groups within the same group set. In this app you also find information about organisation units that are not members of a compulsory organisation unit group set.
Open the Maintenance app and click Organisation unit > Organisation unit group set.
Cliquez sur le bouton d'ajout.
Remplissez :
Name: Provide a precise name for the organisation unit group set.
Code
Description: Describe what the organisation unit group set measures or captures.
If you want all organisation units to be members of a group within the group set, select Compulsory.
(Facultatif) Sélectionnez une Dimension des données.
(Facultatif) Sélectionnez Inclure la sous-hiérarchie dans l'analyse.
If you select this, a sub-organisation unit will inherit the organisation unit group property from its closest "parent" organisation unit. Any property on the sub-organisation unit will override the inherit value.
If an organisation unit have no associated organisation unit group, the organisation unit can inherit its closest parent's organisation unit group. If none of the parent organisation unit groups have an organisation unit group for a given org unit group set, the result will still be "blank", but if at least one parent has an organisation unit group, sub-organisation unit will inherit it.
include subhierarchy in analytics" is enabled, which means the org units inherit their closest parents org unit group IF the org unit is white (no org unit group associated with it).
Sélectionnez des groupes d'unités d'organisation et attribuez-les.
In the left-hand list, you find the available organisation unit groups. Use the arrows to move selected groups between the two lists.
If there are no organisation unit groups in the left-hand list, click Add new. In the form that opens, create the organisation units group you need. When you're done, click Refresh values.
Note
An organisation unit can only be a member of a single organisation unit group within an organisation unit group set.
Click Save.

You want to analyse data based on the ownership of the facilities. All facilities have an owner so you need to make sure that all organisation units get this classification. To do that you can use the Compulsory option:
Create a group for each ownership type, for example "MoH", "Private" and "Faith-based".
Affectez tous les établissements de la base de données à l'un de ces groupes.
Create an organisation unit group set called "Ownership" and select Compulsory.
Assign the organisation unit groups "MoH", "Private" and "Faith-based" to the "Ownership" organisation group set.
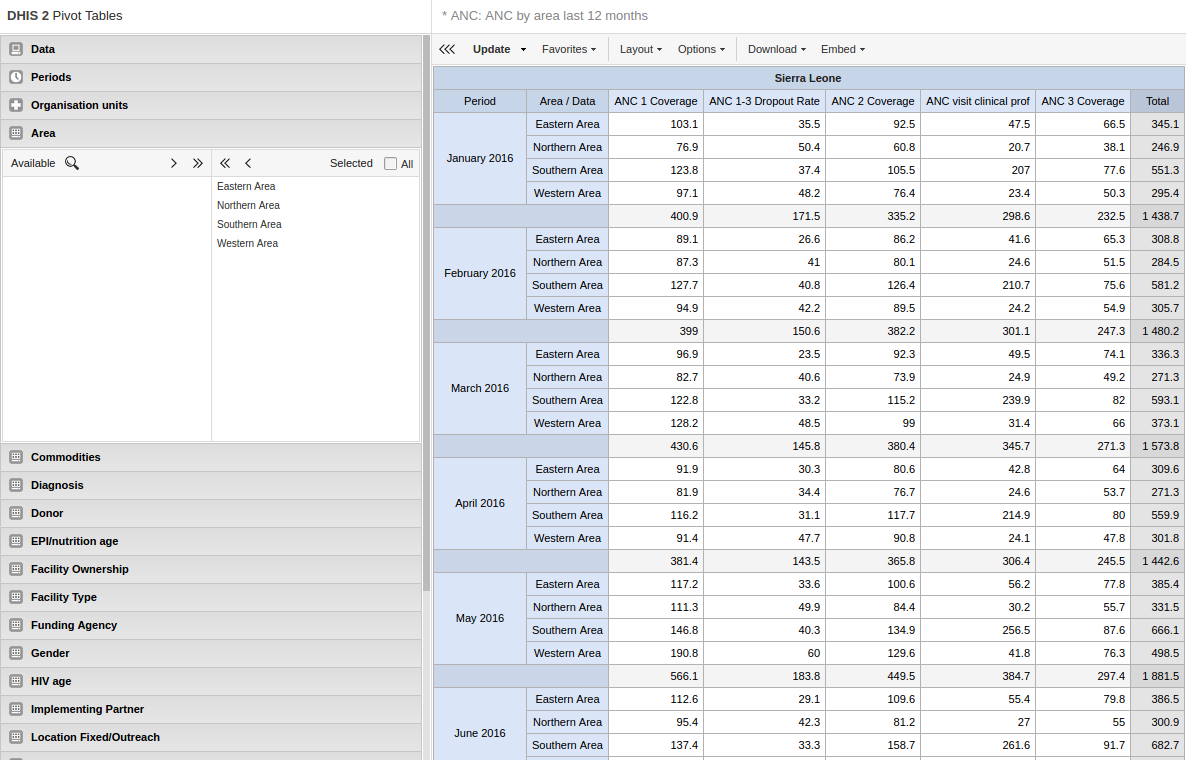
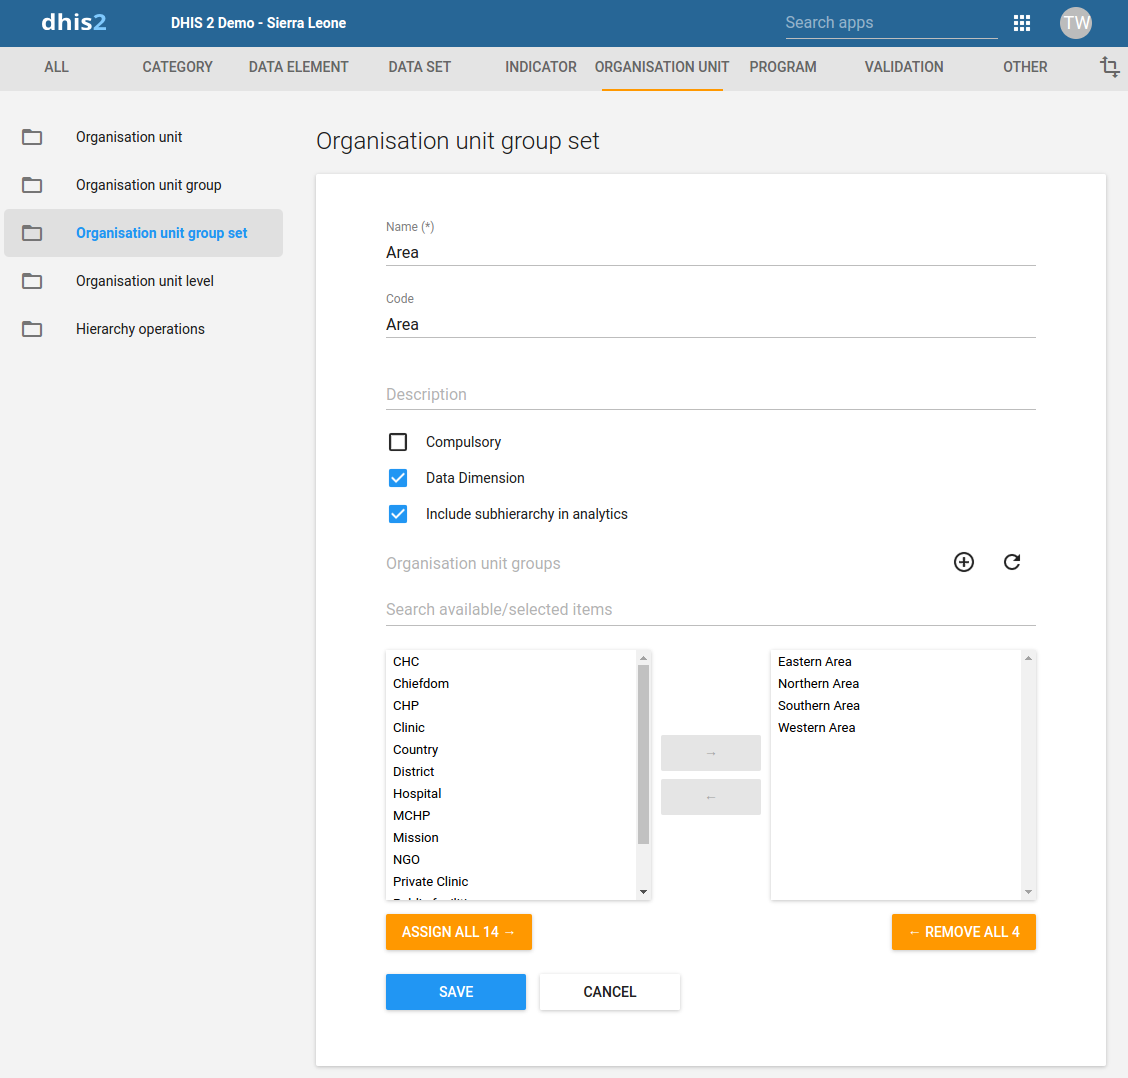
Group you organisation unit in two ways and aggregate data on these two parallel hierarchies
Utilisation dans l'agrégation des données (uniquement dans les applications d'analyse)
An additional setting to the organisation unit group set, creates a dynamic "membership" to a organisation unit group set.
Vous ne devez pas changer la hiérarchie de l'unité d'organisation
Flexible et dynamique
Inclusion dynamique de la hiérarchie
Classification dynamique supplémentaire
When you add children to an organisation unit, DHIS2 automatically creates a new organisation unit level if necessary. The system also assigns a generic name to this level, for example "Level 5". You can replace the generic name with a contextual name, for example "Country", "Province", "District" or "Health Facility". DHIS2 uses the contextual names anywhere levels are referred to, for example in the Maps app.
Open the Maintenance app and click Organisation unit > Organisation unit level.
The loading time of the list depends on the depth of the organisation unit hierarchy tree.
Pour les niveaux d'unité d'organisation que vous souhaitez modifier, entrez un nom.
Sélectionnez le nombre de niveaux hors ligne.
Note
You configure the default value in the System Settings app:
Open the System Settings app, click General and select a level in the Max offline organisation unit levels list.
Cliquez sur Sauvegarder.
You can move organisation units within in the hierarchy by changing the parent of a selected organisation unit.
Open the Maintenance app and click Organisation unit > Hierarchy operations.
In the left-hand hierarchy tree, select the organisation unit(s) you want to move.
Note
If the selected organisation unit is has sub-organisation units, all of them move to the new parent organisation unit.
In the right-hand hierarchy tree, select which organisation unit you want to move the selected organisation unit(s) to.
Click Move x organisation units, where x stands for the number of organisation units you have selected.
Your changes are immediately reflected in the left-hand side hierarchy tree.
When you close an organisation unit, you can't register or edit events to this organisation unit in the Event Capture and Tracker Capture apps.
Open the Maintenance app and click Organisation unit > Organisation unit.
Dans la liste des objets, cliquez sur le menu des options et sélectionnez Editer.
Sélectionnez une Date de fermeture.
Cliquez sur Sauvegarder.
Cloning a data element or other objects can save time when you create many similar objects.
Open the Maintenance app and find the type of metadata object you want to clone.
Dans la liste des objets, cliquez sur le menu des options et sélectionnez Cloner.
Modifiez les options que vous souhaitez.
Cliquez sur Sauvegarder.
You can assign different sharing settings to metadata objects, for example organisation units and tracked entity attributes. These sharing settings control which users and users groups that can view or edit a metadata object.
Some metadata objects also allows you to change the sharing setting of data entry for the object. These additional settings control who can view or enter data in form fields using the metadata.
Note
The default setting is that everyone (Public access) can find, view and edit metadata objects.
Open the Maintenance app and find the type of metadata object you want to modify.
In the object list, click the context menu and select Sharing settings.
(Optional) Add users or user groups: search for a user or a user group and select it. The user or user group is added to the list.
Modifiez les paramètres de partage pour les groupes d'accès que vous souhaitez modifier.
Can edit and view: The access group can view and edit the object.
Peut seulement visualiser : Le groupe d'accès peut seulement visualiser l'objet.
No access (only applicable to Public access): The public won't have access to the object.
Change data sharing settings for the access groups you want to modify.
Can capture data: The access group can view and capture data for the object.
Can view data: The access group can view data for the object.
No access: The access group won't have access to data for the object.
Cliquez sur Fermer
Note
You can only delete a data element and other data element objects if no data is associated to the data element itself.
Warning
Any data set that you delete from the system is irrevocably lost. All data entry forms, and section forms which may have been developed will also be removed. Make sure that you have made a backup of your database before deleting any data set in case you need to restore it at some point in time.
Open the Maintenance app and find the type of metadata object you want to delete.
Dans la liste des objets, cliquez sur le menu des options et sélectionnez Supprimer.
Cliquez sur Confirmer.
Open the Maintenance app and find the type of metadata object you want to view.
In the object list, click the options menu and select Show details.
DHIS2 provides functionality for translations of database content, for example data elements, data element groups, indicators, indicator groups or organisation units. You can translate these elements to any number of locales. A locale represents a specific geographical, political, or cultural region.
Tip
To activate a translation, open the System Settings app, click > Appearance and select a language.
Open the Maintenance app and find the type of metadata object you want to translate.
Dans la liste des objets, cliquez sur le menu des options et sélectionnez Traduire.
Tip
If you want to translate an organisation unit level, click directly on the Translate icon next to each list item.
Sélectionnez un lieu.
Tapez un Nom, Nom abrégé et Description.
Cliquez sur Sauvegarder.
A validation rule is based on an expression. The expression defines a relationship between data element values. The expression forms a condition with certain logical criteria.
L'expression se compose de :
Une partie gauche
Une partie droite
Un opérateur
A validation rule asserting that the total number of vaccines given to infants is less than or equal to the total number of infants.
In the Maintenance app, you manage the following validation rule objects:
Type d'objet | Ce que vous pouvez faire |
|---|---|
Règle de validation | Créer, modifier, cloner, supprimer, afficher les détails et traduire |
Groupe de règles de validation | Créer, modifier, cloner, supprimer, partager, afficher les détails et traduire |
Notification de validation | Créer, modifier, cloner, supprimer, afficher les détails et traduire |
You can use sliding windows to group data across multiple periods as opposed to selecting data for a single period. Sliding windows have a size, that is to say, the number of days to cover, a starting point and an end point. The example below shows disease surveillance data:.
The data in the orange section, selects data based on the current period. There is a threshold, which is calculated once for each week or period, and this is shown in the "Result" section.
The data in the blue section is the sliding window. It selects data from the past 7 days. The "Result" shows the total number of confirmed cases of a disease.
The validation rule makes sure users are notified when the total number of cases breaks the threshold for the period.

Avec fenêtres coulissantes | Sans fenêtres coulissantes |
|---|---|
Utilisées uniquement pour les données sur les événements. | Utilisées pour les données sur les événements et les données agrégées. |
La sélection des données est basée sur un nombre fixe de jours (Type de period). | La sélection des données est toujours basée sur une période. |
La position de la fenêtre coulissante est toujoursrelative à la période comparée. | Les données sont toujours sélectionnées pour la même période que celle faisant l'objet de comparaison. |
See also: How to use sliding windows when you're Creating or editing a validation rule.
A validation rule group allows you to group related validation rules. When you run a validation rule analysis, you can choose to run all of the validation rules in your system, or just the validation rules in one group.
You can configure a validation rule analysis to automatically send notifications about validation errors to selected user groups. These messages are called validation notifications. They are sent via the internal DHIS2 messaging system.
You can send validation rule notifications as individual messages or as message summaries. This is useful, for example, if you want to send individual messages for high-priority disease outbreaks, and summaries for low-priority routine data validation errors.
Open the Maintenance app and click Validation > Validation rule.
Cliquez sur le bouton d'ajout.
Tapez un Nom.
Le nom doit être unique parmi les règles de validation.
(Facultatif) Dans le champ Code, attribuez un code.
(Facultatif) Tapez une Description.
Sélectionnez une Importance : Haute, Moyenne ou Faible.
Sélectionnez un Type de période.
Select an Operator: Compulsory pair, Equal to, Exclusive pair, Greater than, Greater than or equal to or Not equal to.
The Compulsory pair operator allows to require that data values must be entered for a form for both left and right sides of the expression, or for neither side. This means that you can require that if one field in a form is filled, then one or more other fields must also be filled.
The Exclusive pair allows to assert that if any value exist on the left side then there should be no values on the right side (or vice versa). This means that data elements which compose the rule on either side should be mutually exclusive from each other, for a given time period / organisation unit /attribute option combo.
Créer le côté gauche de l'expression :
Cliquez sur Côté gauche.
Select Sliding window if you want to view data relative to the period you are comparing. See also About validation rules.
Select a Missing value strategy. This selection sets how the system evaluates a validation rule if data is missing.
Option | Description |
|---|---|
Skip if any value is missing | The validation rule will be skipped if any of the values which compose the expression are missing. This is the default option. Always select this option you use the Exclusive pair or Compulsory pair operator. |
Skip if all values are missing | The validation rule will be skipped only if all of the operands which compose it are missing. |
Never skip | The validation rule will never be skipped in case of missing data, and all missing operands will be treated effectively as a zero. |
Tapez une Description.
Build an expression based on the available data elements, program objects, organisation units, counts and constants.
In the right pane, double-click the data objects you want to include in the expression. Combine with the mathematical operators located below the left pane.
Cliquez sur Sauvegarder.
Créer le côté droit de l'expression :
Cliquez sur Côté droit.
Select a Missing value strategy. This selection sets how the system evaluates a validation rule if data is missing.
Option | Description |
|---|---|
Skip if any value is missing | The validation rule will be skipped if any of the values which compose the expression are missing. This is the default option. Always select this option you use the Exclusive pair or Compulsory pair operator. |
Skip if all values are missing | The validation rule will be skipped only if all of the operands which compose it are missing. |
Never skip | The validation rule will never be skipped in case of missing data, and all missing operands will be treated effectively as a zero. |
Select Sliding window if you want to view data relative to the period you are comparing. See also About validation rules.
Tapez une Description.
Build an expression based on the available data elements, program objects, organisation units, counts and constants.
In the right pane, double-click the data objects you want to include in the expression. Combine with the mathematical operators located below the left pane.
Cliquez sur Sauvegarder.
(Optional) Choose which Organisation unit levels this rule should be evaluated for. Leaving this empty will cause the validation rule to be evaluated at all levels.
(Optional) Click Skip this rule during form validation to avoid triggering this rule while doing data entry
Cliquez sur Sauvegarder.
Open the Maintenance app and click Validation > Validation rule group.
Cliquez sur le bouton d'ajout.
Tapez un Nom.
(Facultatif) Dans le champ Code, attribuez un code.
(Facultatif) Tapez une Description.
Double-click the Validation rules you want to assign to the group.
Cliquez sur Sauvegarder.
Open the Maintenance app and click Validation > Validation notification.
Cliquez sur le bouton d'ajout.
Tapez un Nom.
(Facultatif) Dans le champ Code, attribuez un code.
Sélectionnez Règles de validation.
Sélectionnez Groupes d'utilisateurs bénéficiaires
(Facultatif) Sélectionnez Notifier uniquement les utilisateurs dans la hiérarchie.
If you select this option, the system will filter the recipient users. (The system derives the recipient users from the recipient user groups.) The filter is based on which organisation unit the recipient user belongs to. The users linked to organisation units which are ancestors of the organisation unit where the violation took place will receive validation notifications. The system will ignore other users and these users won't receive validation notifications.
Créer le modèle de message :
Créer le Modèle d'objet.
Double-click the parameters in the Template variables field to add them to your subject.
Créer le Modèle de message.
Double-click the parameter names in the Template variables field to add them to your message.
Cliquez sur Sauvegarder.
Cloning a data element or other objects can save time when you create many similar objects.
Open the Maintenance app and find the type of metadata object you want to clone.
Dans la liste des objets, cliquez sur le menu des options et sélectionnez Cloner.
Modifiez les options que vous souhaitez.
Cliquez sur Sauvegarder.
You can assign different sharing settings to metadata objects, for example organisation units and tracked entity attributes. These sharing settings control which users and users groups that can view or edit a metadata object.
Some metadata objects also allows you to change the sharing setting of data entry for the object. These additional settings control who can view or enter data in form fields using the metadata.
Note
The default setting is that everyone (Public access) can find, view and edit metadata objects.
Open the Maintenance app and find the type of metadata object you want to modify.
In the object list, click the context menu and select Sharing settings.
(Optional) Add users or user groups: search for a user or a user group and select it. The user or user group is added to the list.
Modifiez les paramètres de partage pour les groupes d'accès que vous souhaitez modifier.
Can edit and view: The access group can view and edit the object.
Peut seulement visualiser : Le groupe d'accès peut seulement visualiser l'objet.
No access (only applicable to Public access): The public won't have access to the object.
Change data sharing settings for the access groups you want to modify.
Can capture data: The access group can view and capture data for the object.
Can view data: The access group can view data for the object.
No access: The access group won't have access to data for the object.
Cliquez sur Fermer
Note
You can only delete a data element and other data element objects if no data is associated to the data element itself.
Warning
Any data set that you delete from the system is irrevocably lost. All data entry forms, and section forms which may have been developed will also be removed. Make sure that you have made a backup of your database before deleting any data set in case you need to restore it at some point in time.
Open the Maintenance app and find the type of metadata object you want to delete.
Dans la liste des objets, cliquez sur le menu des options et sélectionnez Supprimer.
Cliquez sur Confirmer.
Open the Maintenance app and find the type of metadata object you want to view.
In the object list, click the options menu and select Show details.
DHIS2 provides functionality for translations of database content, for example data elements, data element groups, indicators, indicator groups or organisation units. You can translate these elements to any number of locales. A locale represents a specific geographical, political, or cultural region.
Tip
To activate a translation, open the System Settings app, click > Appearance and select a language.
Open the Maintenance app and find the type of metadata object you want to translate.
Dans la liste des objets, cliquez sur le menu des options et sélectionnez Traduire.
Tip
If you want to translate an organisation unit level, click directly on the Translate icon next to each list item.
Sélectionnez un lieu.
Tapez un Nom, Nom abrégé et Description.
Cliquez sur Sauvegarder.
You can use metadata attributes to add additional information to metadata objects. In addition to the standard attributes for each of these objects it may be useful to store information for additional attributes, for example the collection method for a data element.
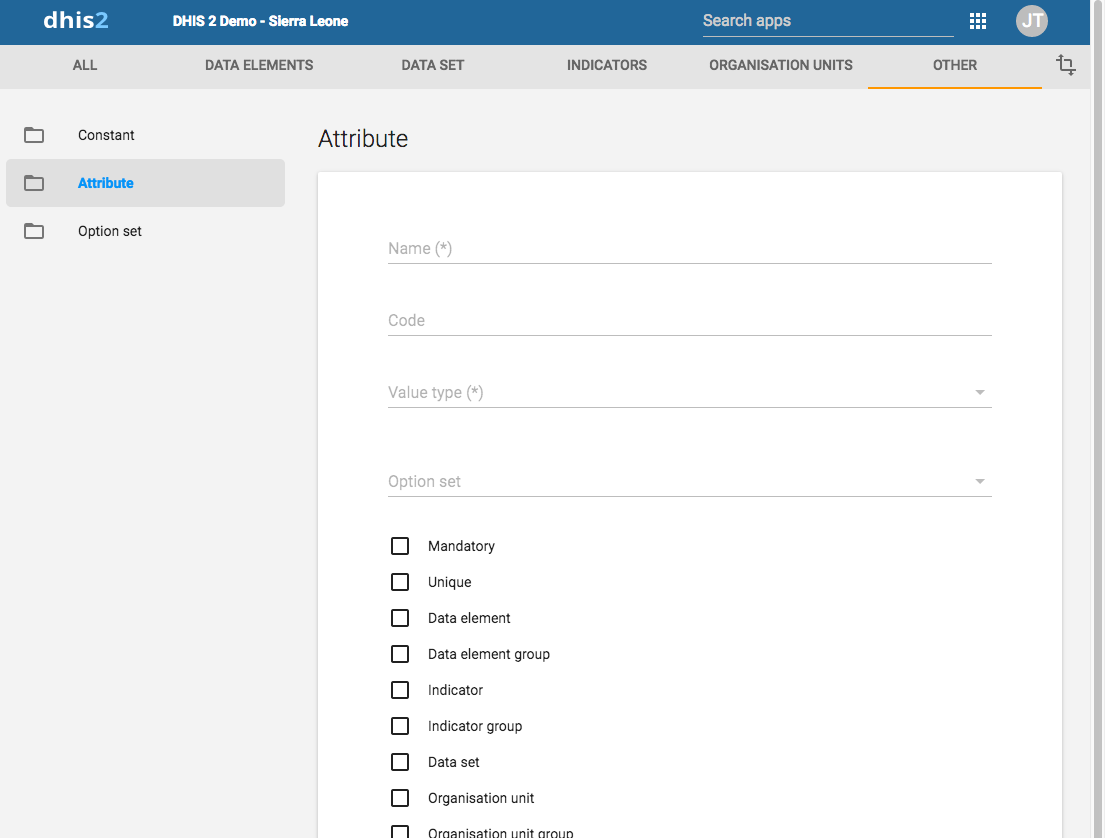
Dans l'application Maintenance, vous pouvez gérer les attributs suivants :
Type d'objet | Fonctions disponibles |
|---|---|
Attribut | Créer, modifier, cloner, supprimer, afficher les détails et traduire |
Ouvrez l'application Maintenance et cliquez sur Attributs.
Cliquez sur le bouton d'ajout.
Dans le champ Nom, tapez le nom de l'attribut.
Chaque attribut doit avoir un nom unique
(Facultatif) Dans le champ Code, attribuez un code.
Sélectionnez un Type de valeur.
If the value supplied for the attribute does not match the value type you will get a warning.
Sélectionnez un ensemble d'options.
Sélectionnez les options que vous souhaitez, par exemple :
Select Mandatory if you want an object to always have the dynamic attribute.
Select Unique if you want the system to enforce that values are unique for a specific object type.
Cliquez sur Sauvegarder.
The dynamic attribute is now available for the objects you assigned it to.
Cloning a data element or other objects can save time when you create many similar objects.
Open the Maintenance app and find the type of metadata object you want to clone.
Dans la liste des objets, cliquez sur le menu des options et sélectionnez Cloner.
Modifiez les options que vous souhaitez.
Cliquez sur Sauvegarder.
Note
You can only delete a data element and other data element objects if no data is associated to the data element itself.
Warning
Any data set that you delete from the system is irrevocably lost. All data entry forms, and section forms which may have been developed will also be removed. Make sure that you have made a backup of your database before deleting any data set in case you need to restore it at some point in time.
Open the Maintenance app and find the type of metadata object you want to delete.
Dans la liste des objets, cliquez sur le menu des options et sélectionnez Supprimer.
Cliquez sur Confirmer.
Open the Maintenance app and find the type of metadata object you want to view.
In the object list, click the options menu and select Show details.
DHIS2 provides functionality for translations of database content, for example data elements, data element groups, indicators, indicator groups or organisation units. You can translate these elements to any number of locales. A locale represents a specific geographical, political, or cultural region.
Tip
To activate a translation, open the System Settings app, click > Appearance and select a language.
Open the Maintenance app and find the type of metadata object you want to translate.
Dans la liste des objets, cliquez sur le menu des options et sélectionnez Traduire.
Tip
If you want to translate an organisation unit level, click directly on the Translate icon next to each list item.
Sélectionnez un lieu.
Tapez un Nom, Nom abrégé et Description.
Cliquez sur Sauvegarder.
Constants are static values which can be made available to users for use in data elements and indicators. Some indicators, such as "Couple year protection rate" depend on constants which usually do not change over time.
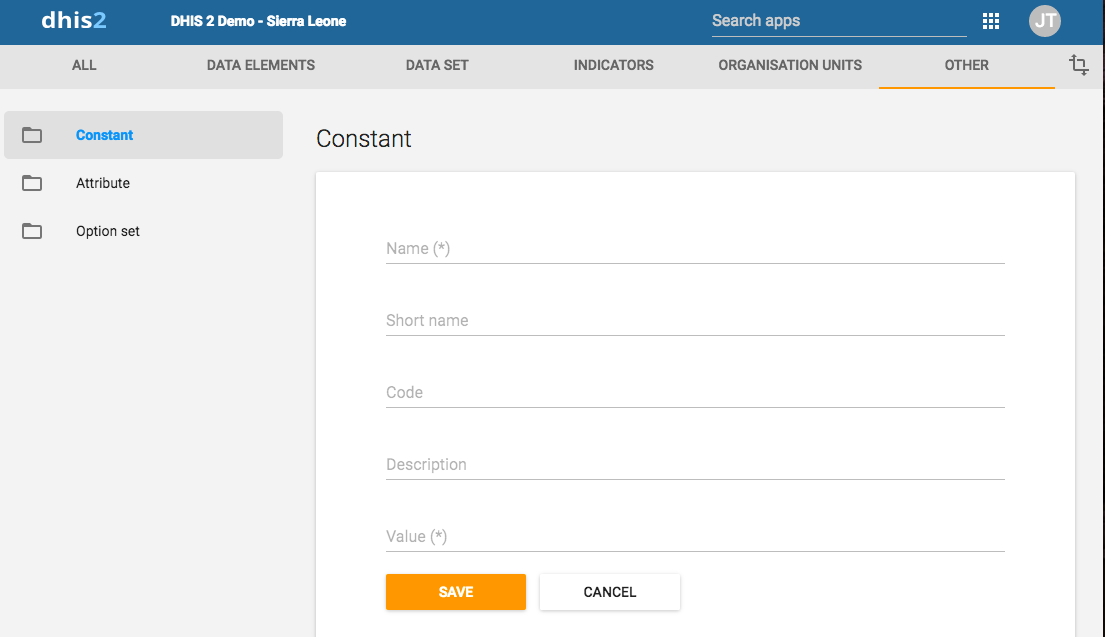
Dans l'application Maintenance, vous pouvez gérer les objets de constante suivants :
Type d'objet | Fonctions disponibles |
|---|---|
Constante | Créer, modifier, cloner, partager, supprimer, afficher les détails et traduire |
Ouvrez l'application Maintenance et cliquez sur Autre > Constante.
Cliquez sur le bouton d'ajout.
Dans le champ Nom, entrez le nom de la constante.
(Optional) In the Short name field, type an abbreviated name of the constant.
(Facultatif) Dans le champ Code, attribuez un code.
In the Description field, type a brief, informative description of the constant.
Dans le champ Valeur, définissez la valeur de la constante.
Cliquez sur Sauvegarder.
La constante est maintenant disponible.
Cloning a data element or other objects can save time when you create many similar objects.
Open the Maintenance app and find the type of metadata object you want to clone.
Dans la liste des objets, cliquez sur le menu des options et sélectionnez Cloner.
Modifiez les options que vous souhaitez.
Cliquez sur Sauvegarder.
You can assign different sharing settings to metadata objects, for example organisation units and tracked entity attributes. These sharing settings control which users and users groups that can view or edit a metadata object.
Some metadata objects also allows you to change the sharing setting of data entry for the object. These additional settings control who can view or enter data in form fields using the metadata.
Note
The default setting is that everyone (Public access) can find, view and edit metadata objects.
Open the Maintenance app and find the type of metadata object you want to modify.
In the object list, click the context menu and select Sharing settings.
(Optional) Add users or user groups: search for a user or a user group and select it. The user or user group is added to the list.
Modifiez les paramètres de partage pour les groupes d'accès que vous souhaitez modifier.
Can edit and view: The access group can view and edit the object.
Peut seulement visualiser : Le groupe d'accès peut seulement visualiser l'objet.
No access (only applicable to Public access): The public won't have access to the object.
Change data sharing settings for the access groups you want to modify.
Can capture data: The access group can view and capture data for the object.
Can view data: The access group can view data for the object.
No access: The access group won't have access to data for the object.
Cliquez sur Fermer
Note
You can only delete a data element and other data element objects if no data is associated to the data element itself.
Warning
Any data set that you delete from the system is irrevocably lost. All data entry forms, and section forms which may have been developed will also be removed. Make sure that you have made a backup of your database before deleting any data set in case you need to restore it at some point in time.
Open the Maintenance app and find the type of metadata object you want to delete.
Dans la liste des objets, cliquez sur le menu des options et sélectionnez Supprimer.
Cliquez sur Confirmer.
Open the Maintenance app and find the type of metadata object you want to view.
In the object list, click the options menu and select Show details.
DHIS2 provides functionality for translations of database content, for example data elements, data element groups, indicators, indicator groups or organisation units. You can translate these elements to any number of locales. A locale represents a specific geographical, political, or cultural region.
Tip
To activate a translation, open the System Settings app, click > Appearance and select a language.
Open the Maintenance app and find the type of metadata object you want to translate.
Dans la liste des objets, cliquez sur le menu des options et sélectionnez Traduire.
Tip
If you want to translate an organisation unit level, click directly on the Translate icon next to each list item.
Sélectionnez un lieu.
Tapez un Nom, Nom abrégé et Description.
Cliquez sur Sauvegarder.
Option sets provide a pre-defined drop-down (enumerated) list for use in DHIS2. You can define any kind of options.
An option set called "Delivery type" would have the options: "Normal", "Breach", "Caesarian" and "Assisted".
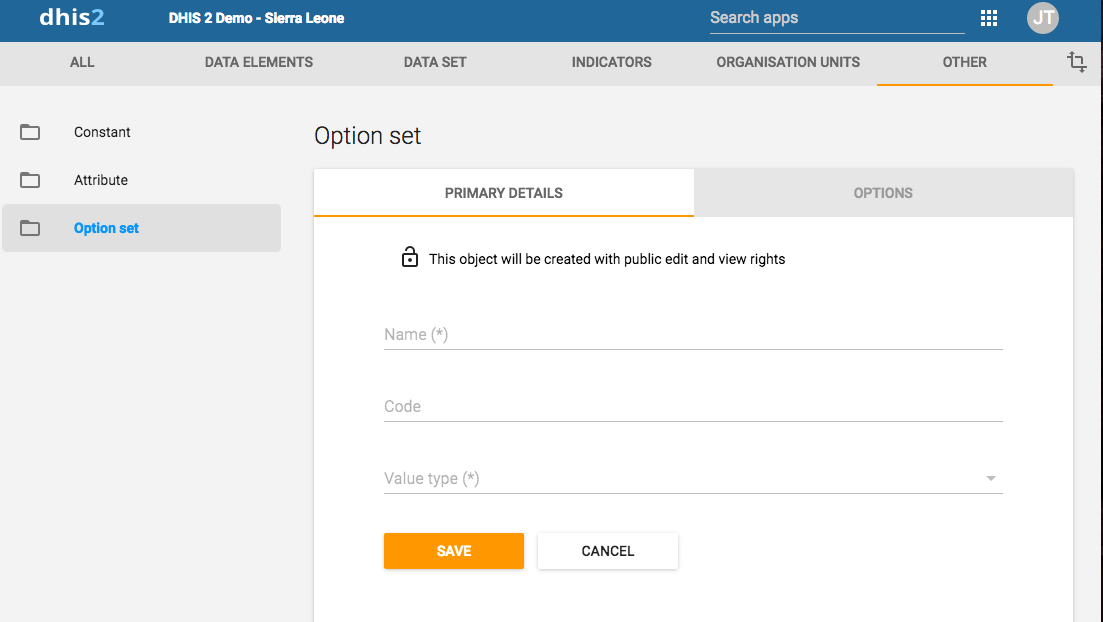
Type d'objet | Fonctions disponibles |
|---|---|
Ensemble d'options | Créer, modifier, cloner, partager, supprimer, afficher les détails et traduire |
Groupe d'options | Créer, modifier, cloner, partager, supprimer, afficher les détails et traduire |
Ensemble de groupes d'options | Créer, modifier, cloner, partager, supprimer, afficher les détails et traduire |
Important
Option sets must have a code as well as a name. You can change the names but you can't change the codes. Both names and codes of all options must be unique, even across different option sets.
Ouvrez l'application Maintenance et cliquez sur Autre > Ensemble d'options.
Cliquez sur le bouton d'ajout.
Dans l'onglet Détails primaires, définissez l'ensemble d'options :
Dans le champ Nom, entrez le nom de la constante.
Dans le champ Code, attribuez un code.
Sélectionnez un Type de valeur.
Cliquez sur Sauvegarder.
Pour chaque option dont vous avez besoin, effectuez les tâches suivantes :
Cliquez sur l'onglet Options.
Cliquez sur le bouton d'ajout.
Type a Name and a Code. Optionally also select a Color and an Icon which will be used for this option in the data capture apps.
Triez les options par nom, code/valeur ou manuellement.
Cliquez sur Sauvegarder.
You can group and classify options within an option set by using option groups. This way you can create a subset of options in an option set. The main purpose of this is to be able to filter huge option sets into smaller, related parts.
Les options regroupées peuvent être masquées ou affichées ensemble dans le tracker et la saisie d'événements grâce aux règles du programme.
N.B.
Vous ne pouvez pas modifier l' ensemble d'options sélectionné dans un Groupe d'options une fois qu'il est créé.
Ouvrez l'application Maintenance et cliquez sur Autre > Groupe d'options.
Cliquez sur le bouton d'ajout.
Remplissez le formulaire :
Une fois qu'un Ensemble d'options est sélectionné, vous pouvez attribuer les Options que vous souhaitez regrouper.
Cliquez sur Sauvegarder.
Option group sets allows you to categorise multiple option groups into a set. The main purpose of the option group set is to add more dimensionality to your captured data for analysis.
N.B.
Vous ne pouvez pas modifier l' Ensemble d'options sélectionné dans un Ensemble de groupes d'options une fois qu'il est créé.
Ouvrez l'application Maintenance et cliquez sur Autre > Ensemble de groupes d'options.
Cliquez sur le bouton d'ajout.
Remplissez le formulaire :
Si vous sélectionnez Dimension des données, l'ensemble de groupes sera alors disponible pour l'analyse sous forme d'une autre dimension, en plus des dimensions standard de "Période" et "Unité d'organisation".
Sélectionnez des groupes d'options et attribuez-les.
Les groupes d'options disponibles sont affichés dans le panneau de gauche. Par contre, les groupes d'options faisant actuellement partie de l'ensemble de groupes d'options sont affichés dans le panneau de droite.
Cloning a data element or other objects can save time when you create many similar objects.
Open the Maintenance app and find the type of metadata object you want to clone.
Dans la liste des objets, cliquez sur le menu des options et sélectionnez Cloner.
Modifiez les options que vous souhaitez.
Cliquez sur Sauvegarder.
You can assign different sharing settings to metadata objects, for example organisation units and tracked entity attributes. These sharing settings control which users and users groups that can view or edit a metadata object.
Some metadata objects also allows you to change the sharing setting of data entry for the object. These additional settings control who can view or enter data in form fields using the metadata.
Note
The default setting is that everyone (Public access) can find, view and edit metadata objects.
Open the Maintenance app and find the type of metadata object you want to modify.
In the object list, click the context menu and select Sharing settings.
(Optional) Add users or user groups: search for a user or a user group and select it. The user or user group is added to the list.
Modifiez les paramètres de partage pour les groupes d'accès que vous souhaitez modifier.
Can edit and view: The access group can view and edit the object.
Peut seulement visualiser : Le groupe d'accès peut seulement visualiser l'objet.
No access (only applicable to Public access): The public won't have access to the object.
Change data sharing settings for the access groups you want to modify.
Can capture data: The access group can view and capture data for the object.
Can view data: The access group can view data for the object.
No access: The access group won't have access to data for the object.
Cliquez sur Fermer
Note
You can only delete a data element and other data element objects if no data is associated to the data element itself.
Warning
Any data set that you delete from the system is irrevocably lost. All data entry forms, and section forms which may have been developed will also be removed. Make sure that you have made a backup of your database before deleting any data set in case you need to restore it at some point in time.
Open the Maintenance app and find the type of metadata object you want to delete.
Dans la liste des objets, cliquez sur le menu des options et sélectionnez Supprimer.
Cliquez sur Confirmer.
Open the Maintenance app and find the type of metadata object you want to view.
In the object list, click the options menu and select Show details.
DHIS2 provides functionality for translations of database content, for example data elements, data element groups, indicators, indicator groups or organisation units. You can translate these elements to any number of locales. A locale represents a specific geographical, political, or cultural region.
Tip
To activate a translation, open the System Settings app, click > Appearance and select a language.
Open the Maintenance app and find the type of metadata object you want to translate.
Dans la liste des objets, cliquez sur le menu des options et sélectionnez Traduire.
Tip
If you want to translate an organisation unit level, click directly on the Translate icon next to each list item.
Sélectionnez un lieu.
Tapez un Nom, Nom abrégé et Description.
Cliquez sur Sauvegarder.
You can create, edit, clone, delete, show details and translate legends to make the maps you're setting up for your users meaningful. You create maps in the Maps app.
Note
Continuous legends must consist of legend items that end and start with the same value, for example: 0-50 and 50-80. Do not set legend items like this: 0-50 and 51-80. This will create gaps in your legend.
N.B.
Il n'est pas permis d'avoir des lacunes dans une légende.
Il n'est pas permis d'avoir des éléments de légende qui se chevauchent.
Ouvrez l'application Maintenance et cliquez sur Autre > Légende.
Cliquez sur le bouton d'ajout.
Dans le champ Nom, tapez le nom de la légende.
(Facultatif) Dans le champ Code, attribuez un code.
Créez les éléments de légende que vous voulez avoir dans votre légende :
Sélectionnez Valeur de départ et Valeur de fin.
Sélectionnez Nombre d'éléments de la légende.
Sélectionnez un schéma de couleurs.
Cliquez sur Créer des éléments de légende.
Tip
Click the options menu to edit or delete a legend item.
(Facultatif) Ajoutez d'autres éléments de légende :
Cliquez sur le bouton d'ajout.
Entrez un nom et sélectionnez une valeur de départ, une valeur de fin et une couleur.
Cliquez sur OK.
(Facultatif) Changez les échelles de couleurs.
Click the colour scale to view a list of color scale options, and select a color scale.
To customize a color scale, click the add button. In the Edit legend item dialog, click the color scale button and hand-pick colors, or enter your color values.
Cliquez sur Sauvegarder.
| Élément de légende | Valeur de départ | Valeur finale |
|---|---|---|
| Faible mauvais | 0 | 50 |
| Moyen | 50 | 80 |
| Elevé Bon | 80 | 100 |
| Trop élevé | 100 | 1000 |
Cloning a data element or other objects can save time when you create many similar objects.
Open the Maintenance app and find the type of metadata object you want to clone.
Dans la liste des objets, cliquez sur le menu des options et sélectionnez Cloner.
Modifiez les options que vous souhaitez.
Cliquez sur Sauvegarder.
You can assign different sharing settings to metadata objects, for example organisation units and tracked entity attributes. These sharing settings control which users and users groups that can view or edit a metadata object.
Some metadata objects also allows you to change the sharing setting of data entry for the object. These additional settings control who can view or enter data in form fields using the metadata.
Note
The default setting is that everyone (Public access) can find, view and edit metadata objects.
Open the Maintenance app and find the type of metadata object you want to modify.
In the object list, click the context menu and select Sharing settings.
(Optional) Add users or user groups: search for a user or a user group and select it. The user or user group is added to the list.
Modifiez les paramètres de partage pour les groupes d'accès que vous souhaitez modifier.
Can edit and view: The access group can view and edit the object.
Peut seulement visualiser : Le groupe d'accès peut seulement visualiser l'objet.
No access (only applicable to Public access): The public won't have access to the object.
Change data sharing settings for the access groups you want to modify.
Can capture data: The access group can view and capture data for the object.
Can view data: The access group can view data for the object.
No access: The access group won't have access to data for the object.
Cliquez sur Fermer
Note
You can only delete a data element and other data element objects if no data is associated to the data element itself.
Warning
Any data set that you delete from the system is irrevocably lost. All data entry forms, and section forms which may have been developed will also be removed. Make sure that you have made a backup of your database before deleting any data set in case you need to restore it at some point in time.
Open the Maintenance app and find the type of metadata object you want to delete.
Dans la liste des objets, cliquez sur le menu des options et sélectionnez Supprimer.
Cliquez sur Confirmer.
Open the Maintenance app and find the type of metadata object you want to view.
In the object list, click the options menu and select Show details.
DHIS2 provides functionality for translations of database content, for example data elements, data element groups, indicators, indicator groups or organisation units. You can translate these elements to any number of locales. A locale represents a specific geographical, political, or cultural region.
Tip
To activate a translation, open the System Settings app, click > Appearance and select a language.
Open the Maintenance app and find the type of metadata object you want to translate.
Dans la liste des objets, cliquez sur le menu des options et sélectionnez Traduire.
Tip
If you want to translate an organisation unit level, click directly on the Translate icon next to each list item.
Sélectionnez un lieu.
Tapez un Nom, Nom abrégé et Description.
Cliquez sur Sauvegarder.
You can assign a legend to an indicator or a data element in the Maintenance app, either when you create the object or edit it. When you then select the indicator or data element in the Maps app, the system automatically selects the assigned legend.
A predictor tells DHIS2 how to generate a data value based on data values from past periods and/or the period of the data value. It defines which past periods to sample, and how to combine the data to produce a predicted value. A predictor always generates an aggregate data value, but the past data values used to calculate the predicted value may come from aggregate data, event data, or both.
A simple use of predictors would be to copy a past period data value into a new period, for example into the next month, or into the same quarter in the next year. A more complex use of predictors would be for disease surveillance, to predict what value would be expected in a given week or month of the year, based on previous data values. A validation rule could then be used to see how the actual value compares with the expected (predicted) value.
You can specify the organisation unit level(s) for which a predictor will generate values. For example in disease surveillance you can use one predictor to give the expected value at each local facility, given the amount of variation you would expect at a single facility, while using a different predictor to estimate the value you would expect summed over all facilities in a district, given the (smaller) proportional variation that you would expect when adding up the values for all facilities in the district. You could also define additional predictors at any higher levels of the organisation unit hierarchy, where you might expect different proportions of variation. Alternatively, you can define a single predictor for all these levels and use the standard deviation function to determine what amounts of deviation were measured at each level.
Dans l'application Maintenance, vous pouvez gérer les objets prédicteurs suivants :
Type d'objet | Fonctions disponibles |
|---|---|
Prédicteur | Créer, modifier, cloner, supprimer, afficher les détails et traduire |
Predictors can generate data values for periods that are in the past, present, or future. These values are based on data sampled from periods before the predicted period, and/or data from the predicted period. When you use data sampled from past periods (periods before the predicted period), several parameters determine the choice of which past periods to sample from:
A predictor's Sequential sample count gives the number of immediate prior periods to sample. For example, if a predictor's period type is Weekly and the Sequential sample count is 4, this means to sample four prior weeks immediately preceding the predicted value week. So the predicted value for week 9 would use samples from weeks 5, 6, 7, and 8:

If a predictor's period type is Monthly and the Sequential sample count is 4, this means to sample four prior months immediately preceding the predicted value month. So the predicted value for May would use samples from weeks January, February, March, and April:

The Sequential sample count can be greater than the number of periods in a year. For example, if you want to sample the 24 months immediately preceding the predicted value month, set the Sequential sample count to 24:

A predictor's Sequential skip count tells how many periods should be skipped immediately prior to the predicted value period, within the Sequential sample count. This could be used, for instance, in outbreak detection to skip one or more immediately preceding samples that might in fact contain values from the beginning of an outbreak that you are trying to detect.
For example, if the Sequential sample count is 4, but the Sequential skip count is 2, then the two samples immediately preceding the predicted period will be skipped, resulting in only two periods being sampled:

A predictor's Annual sample count gives the number of prior years for which samples should be collected at the same time of year. This could be used, for instance, for disease surveillance in cases where the expected incidence of the disease varies during the year and can best be compared with the same relative period in previous years. For example, if the Annual sample count is 2 (and the Sequential sample count is zero), then samples would be collected from periods in the immediately preceding two years, at the same time of year.

You can use the sequential and annual sample counts together to collect samples from a number of sequential periods over a number of past years. When you do this, samples will be collected in prior years during the period at the same time of year as the predicted value period, and also in previous years both before and after the same time of year, as determined by the Sequential sample count number.
For example, if the Sequential sample count is 4 and the Annual sample count is 2, samples will be collected from the 4 periods immediately preceding the predicted value period. In addition samples will be collected in the prior 2 years for the corresponding period, as well as 4 periods on either side:

You can use the Sequential skip count together with the sequential and annual sample counts. When you do this, the Sequential skip count tells how many periods to skip in the same year as the predicted value period. For example, if the Sequential sample count is 4 and the Sequential skip count is 2, then the two periods immediately preceding the predicted value period period will be skipped, but the two periods before that will be sampled:

If the Sequential skip count is equal to or greater than the Sequential sample count, then no samples will be collected for the year containing the predicted value period; only periods from past years will be sampled:

You can use the Sample skip test to skip samples from certain periods that would otherwise be included, based on the results of testing an expression within those periods. This could be used, for instance, in disease outbreak detection, where the sample skip test could identify previous disease outbreaks, to exclude those samples from the prediction of a non-outbreak baseline expected value.
The Sample skip test is an expression that should return a value of true or false, to indicate whether or not the period should be skipped. It can be an expression that tests any data values in the previous period. For example, it could test for a data value that was explicitly entered to indicate that a previous period should be skipped. Or it could compare a previously predicted value for a period with the actual value recorded for that period, to determine if that period should be skipped.
Any periods for which the Sample skip test is true will not be sampled. For example:

Ouvrez l'application Maintenance et cliquez sur Autre > Prédicteur.
Cliquez sur le bouton d'ajout.
Dans le champ Nom, entrez le nom du prédicteur.
(Facultatif) Dans le champ Code, attribuez un code.
(Facultatif) Tapez une Description.
Select an Output data element. Values generated by this predictor are stored as aggregate data associated with this data element and the predicted period.
The value is rounded according to the value type of the data element: If the value type is an integer type, the predicted value is rounded to the nearest integer. For all other value types, the number is rounded to four significant digits. (However if there are more than four digits to the left of the decimal place, they are not replaced with zeros.)
(Optional) Select an Output category combo. This dropdown will only show if the selected data element has categoryCombos attached to it. If this is the case, you can select which categoryCombo you would like to use.
Sélectionnez un Type de période.
Assign one or more organisation unit levels. The output value will be assigned to an organisation unit at this level (or these levels). The input values will come from the organisation unit to which the output is assigned, or from any level lower under the output comme complets pour l'ensemble de données dont il est question.
Create a Generator. The generator is the expression that is used to calculate the predicted value.
Tapez une Description de l'expression du générateur.
Enter the generator expression. You can build the expression by selecting data elements for aggregate data, or program data elements, attributes or indicators. Organisation unit counts are not yet supported.
To use sampled, past period data, you should enclose any items you select in one of the following aggregate functions:
Aggregate function | Means |
|---|---|
avg(x) | Average (mean) value of x |
count(x) | Count of the values of x |
max(x) | Maximum value of x |
median(x) | Median value of x |
min(x) | Minimum value of x |
percentileCont(p, x) | Continuous percentile of x, where p is the percentile as a floating point number between 0 and 1. For example, p = 0 will return the lowest value, p = 0.5 will return the median, p = 0.75 will return the 75th percentile, p = 1 will return the highest value, etc. Continuous means that the value will be interpolated if necessary. For example, percentileCont( 0.5, #{FTRrcoaog83} ) will return 2.5 if the sampled values of data element FTRrcoaog83 are 1, 2, 3, and 4. |
stddev(x) | Standard deviation of x. Note: this function is still available for backwards comptibility and is eqivalent to stddevPop. It's suggested that you use the newer functions stddevPop or stddevSamp instead for greater clarity and for compatibility with future versions of DHIS 2. |
stddevPop(x) | Population standard deviation of x: sqrt( sum( (x - avg(x))^2 ) / n ) |
stddevSamp(x) | Sample standard deviation of x: sqrt( sum( (x - avg(x))^2 ) / ( n - 1 ) ). Note that this value is not computed when there is only one sample. |
sum(x) | Sum of the values of x |
Any items inside an aggregate function will be evaluated for all sampled past periods, and then combined according to the formula inside the aggregate function. Any items outside an aggregate function will be evaluated for the period in which the prediction is being made.
You can build more complex expressions by clicking on (or typing) any of the elements below the expression field: ( ) * / + - Days. Constant numbers may be added by typing them. The Days option inserts [days] into the expression which resolves to the number of days in the period from which the data came.
You can also use the following functions in your expression, either inside or containing aggregate functions, or independent of them:
Function | Means |
|---|---|
if(test, valueIfTrue, valueIfFalse) | Evaluates test which is an expression that evaluates to a boolean value -- see Boolean expression notes below. If the test is true, returns the valueIfTrue expression. If it is false, returns the valueIfFalse expression. |
isNull(item) | Returns the boolean value true if the item is null (missing), otherwise returns false. The item can be any selected item from the right (data element, program data element, etc.). |
Boolean expression notes: A boolean expression must evaluate to true or false. The following operators may be used to compare two values resulting in a boolean expression: \<, >, !=, ==, >=, and \<=. The following operators may be used to combine two boolean expressions: && (logical and), and || (logical or). The unary operator ! may be used to negate a boolean expression.
Exemples d'expressions génératrices :
Generator expression | Means |
|---|---|
sum(#{FTRrcoaog83.tMwM3ZBd7BN}) | Sum of the sampled values of data element FTRrcoaog83 and category option combination (disaggregation) tMwM3ZBd7BN |
avg(#{FTRrcoaog83}) + 2 * stddevSamp(#{FTRrcoaog83}) | Average of the sampled values of of data element FTRrcoaog83 (sum of all disaggregations) plus twice its sample standard deviation |
sum(#{FTRrcoaog83}) / sum([days]) | Sum of all sampled values of data element FTRrcoaog83 (sum of all disaggregations) divided by the number of days in all sample periods (resulting in the overall average daily value) |
sum(#{FTRrcoaog83}) + #{T7OyqQpUpNd} | Sum of all sampled values of data element FTRrcoaog83 plus the value of data element T7OyqQpUpNd in the period being predicted for |
1.2 * #{T7OyqQpUpNd} | 1.2 times the value of data element T7OyqQpUpNd in the period being predicted for |
if(isNull(#{T7OyqQpUpNd}), 10, 20) | If the data element T7OyqQpUpNd is null, then 10, otherwise 20. |
percentileCont(0.5, #{T7OyqQpUpNd}) | Continuous 50th percentile of the sampled values for data element T7OyqQpUpNd. Note that this is the same as median(#{T7OyqQpUpNd}) |
if(count(#{T7OyqQpUpNd}) == 1, 0, stddevSamp(#{T7OyqQpUpNd})) | If there is one sample value present for data element T7OyqQpUpNd, then 0, otherwise the sample standard deviation of these sample values. (Note that if no samples are present then the stddevSamp returns no value, so no value is predicted.) |
(Optional) Create a Sample skip test. The sample skip test tells which previous periods if any to exclude from the sample.
Tapez une Description du test de saut.
Enter the sample skip test expression. You can build the expression by selecting data elements for aggregate data, or program data elements, attributes or indicators. Organisation unit counts are not yet supported. As with the generator function, you may click on (or type) any of the elements below the expression field: ( ) * / + - Days. The functions IF() and ISNULL() as described above may also be used.
The expression must evaluate to a boolean value of true or false. See Boolean expression notes above.
Exemples d'expression de test de saut :
Skip test expression | Means |
|---|---|
#{FTRrcoaog83} > #{M62VHgYT2n0} | The value of data element FTRrcoaog83 (sum of all disaggregations) is greater than the value of data element M62VHgYT2n0 (sum of all disaggregations) |
#{uF1DLnZNlWe} > 0 | The value of data element uF1DLnZNlWe (sum of all disaggregations) is greater than the zero |
#{FTRrcoaog83} > #{M62VHgYT2n0} || #{uF1DLnZNlWe} > 0 | The value of data element FTRrcoaog83 (sum of all disaggregations) is greater than the value of data element M62VHgYT2n0 (sum of all disaggregations) or the value of data element uF1DLnZNlWe (sum of all disaggregations) is greater than the zero |
Entrez une valeur de Nombre séquentiel d'échantillons.
This is for how many sequential periods the calculation should go back in time to sample data for the calculations.
Entrez une valeur de Nombre annuel d'échantillons.
This is for how many years the calculation should go back in time to sample data for the calculations.
(Facultatif) Entrez une valeur de Nombre séquentiel de sauts.
This is how many sequential periods, immediately preceding the predicted value period, should be skipped before sampling the data.
Cliquez sur Sauvegarder.
Open the Maintenance app and click Other > Predictor group.
Cliquez sur le bouton d'ajout.
Saisissez un Nom. Ce champ doit être unique.
(Optional) In the Code field, assign a code. This field needs to be unique.
(Facultatif) Tapez une Description.
Double-cliquez sur les prédicteurs que vous souhaitez attribuer au groupe.
Cliquez sur Sauvegarder.
Cloning a data element or other objects can save time when you create many similar objects.
Open the Maintenance app and find the type of metadata object you want to clone.
Dans la liste des objets, cliquez sur le menu des options et sélectionnez Cloner.
Modifiez les options que vous souhaitez.
Cliquez sur Sauvegarder.
Note
You can only delete a data element and other data element objects if no data is associated to the data element itself.
Warning
Any data set that you delete from the system is irrevocably lost. All data entry forms, and section forms which may have been developed will also be removed. Make sure that you have made a backup of your database before deleting any data set in case you need to restore it at some point in time.
Open the Maintenance app and find the type of metadata object you want to delete.
Dans la liste des objets, cliquez sur le menu des options et sélectionnez Supprimer.
Cliquez sur Confirmer.
Open the Maintenance app and find the type of metadata object you want to view.
In the object list, click the options menu and select Show details.
DHIS2 provides functionality for translations of database content, for example data elements, data element groups, indicators, indicator groups or organisation units. You can translate these elements to any number of locales. A locale represents a specific geographical, political, or cultural region.
Tip
To activate a translation, open the System Settings app, click > Appearance and select a language.
Open the Maintenance app and find the type of metadata object you want to translate.
Dans la liste des objets, cliquez sur le menu des options et sélectionnez Traduire.
Tip
If you want to translate an organisation unit level, click directly on the Translate icon next to each list item.
Sélectionnez un lieu.
Tapez un Nom, Nom abrégé et Description.
Cliquez sur Sauvegarder.
Push reports allows you to increase awareness and usage of data analysis by sending reports with charts, tables and maps directly to users e-mail addresses.
Un rapport push tire son contenu des tableaux de bord existants.
A push report lists the dashboard items in the same order as on the dashboard.
A push report can only contain dashboard items with charts, maps or tables.
You create the push report and its schedule in the Maintenance app.
The Title and Message parameters you set up in the Maintenance app, are included in each report. The Name you give the report is not included in the report. Instead, the name is used to identify the push analysis object in the system. This way a report can be named one thing, and the title of the report can be another.
When you run a push report job, the system compiles a list of recipients from the user groups you've selected. The system then generates a report for each member of the selected user groups. Each of the dashboard items are generated specifically for each user. This means that the data included in the report reflects the data the user has access to. All users could therefore get the same report (if all the data is "static") or custom reports (if all the data is "dynamic"), or a combination of the two.
Push reports are sent by e-mail to the recipients, not through the internal DHIS2 messaging system. If a user doesn't have a valid e-mail, or if the job fails, no e-mails are sent. In this case, the problem is logged on the server.
Note
The data generated in the push reports is public so verify that you don't include any sensitive data.

In the Maintenance app, you manage the following push reports objects:
Type d'objet | Fonctions disponibles |
|---|---|
Analyse push | Créer, modifier, cloner, supprimer, afficher les détails, traduire, prévisualiser et exécuter |
Open the Maintenance app and click Other > Push analysis.
Cliquez sur le bouton d'ajout.
Dans le champ Nom, tapez le nom du rapport prévu.
This name is not included in the report e-mail. Instead, the name is used to identify the push analysis object in the system.
(Facultatif) Dans le champ Code, attribuez un code.
Ajouter un Titre de rapport.
Ce titre est inclus dans le courriel du rapport.
(Facultatif) Ajoutez un Message.
Ce message est inclus dans le courrier électronique du rapport.
Sélectionnez un Tableau de bord sur lequel vous baserez le rapport.
Sélectionnez et attribuez les groupes d'utilisateurs auxquels vous souhaitez envoyer le rapport.
Select a Scheduling frequency: Daily, Weekly or Monthly.
Note
If you schedule a push report to "Monthly" and "31", the scheduled report job will not run if the month has less than 31 days.
(Facultatif) Sélectionnez Activer pour activer la tâche de Rapport push.
La âche ne sera pas exécuté tant que vous ne l'aurez pas activée.
Cliquez sur Sauvegarder.
Open the Maintenance app and click Other > Push analysis.
Dans la liste des Rapports push, trouvez le Rapport push que vous souhaitez visualiser.
Cliquez sur le menu des options et sélectionnez Aperçu.
Un aperçu du Rapport push s'ouvre dans une nouvelle fenêtre.
Open the Maintenance app and click Other > Push analysis.
Dans la liste des Rapports push, trouvez le Rapport push que vous souhaitez lancer.
Cliquez sur le menu des options et sélectionnez Exécuter maintenant.
La tâche de Rapport push s'exécute immédiatement.
Cloning a data element or other objects can save time when you create many similar objects.
Open the Maintenance app and find the type of metadata object you want to clone.
Dans la liste des objets, cliquez sur le menu des options et sélectionnez Cloner.
Modifiez les options que vous souhaitez.
Cliquez sur Sauvegarder.
Note
You can only delete a data element and other data element objects if no data is associated to the data element itself.
Warning
Any data set that you delete from the system is irrevocably lost. All data entry forms, and section forms which may have been developed will also be removed. Make sure that you have made a backup of your database before deleting any data set in case you need to restore it at some point in time.
Open the Maintenance app and find the type of metadata object you want to delete.
Dans la liste des objets, cliquez sur le menu des options et sélectionnez Supprimer.
Cliquez sur Confirmer.
Open the Maintenance app and find the type of metadata object you want to view.
In the object list, click the options menu and select Show details.
DHIS2 provides functionality for translations of database content, for example data elements, data element groups, indicators, indicator groups or organisation units. You can translate these elements to any number of locales. A locale represents a specific geographical, political, or cultural region.
Tip
To activate a translation, open the System Settings app, click > Appearance and select a language.
Open the Maintenance app and find the type of metadata object you want to translate.
Dans la liste des objets, cliquez sur le menu des options et sélectionnez Traduire.
Tip
If you want to translate an organisation unit level, click directly on the Translate icon next to each list item.
Sélectionnez un lieu.
Tapez un Nom, Nom abrégé et Description.
Cliquez sur Sauvegarder.
You can customize GIS by including map layers from various sources and combine them with your own data in DHIS2. DHIS2 supports common map service formats such as Web Map Service (WMS), Tile Map Service (TMS) and XYZ tiles.
Note
DHIS2 only supports the Web Mercator projection (EPSG:3857) so make sure that the external service supports this projection.
Type d'objet | Fonctions disponibles |
|---|---|
Couche externe de la carte | Créer, modifier, cloner, supprimer, afficher les détails et traduire |
Open the Maintenance app and click Other > External map layer.
Cliquez sur le bouton d'ajout.
In the Name field, type a name that describes the content of the external map layer.
C'est ce nom que vous verrez dans l'application Cartes.
(Facultatif) Dans le champ Code, attribuez un code.
Sélectionnez un format de Service cartographique.
Le DHIS2 prend en charge trois formats habituels de services cartographiques :
Le Web Map Service (WMS)
Image format: PNG format allows layers to be transparent, JPG format offers better compression and is often faster to load.
Layers: A WMS can contain several individual layers, and you can specify which you want to include (comma separated). Refer to the WMS GetCapabilities document to see the available layers.
Le Tile Map Service (TMS)
Les pavés XYZ (peuvent également être utilisées pour le WMTS)
Entrez le URL dans le service de cartographie.
Note
XYZ and TMS URLs must contain placeholders {}, for example: http://{s}.tile.osm.org/{z}/{x}/{y}.png.
(Optional) Enter Source of the map layers. The field can contain HTML tags if you want to link to the source.
When you use an external map service it is important to highlight where the data comes from.
Sélectionnez un Positionnement :
Bottom - basemap: For the Maps app, this makes the external map layer selectable as the base map (i.e. as an alternative to the DHIS2 base maps).
Top - overlay: For the Maps app, this allows the external map to be added from the Add Layer selection and placed anywhere above the base map.
(Facultatif) Ajoutez une légende.
Vous pouvez ajouter une légende de deux façons :
Select a predefined Legend to describe the colors of the map layer.
Tip
Click Add new to create legends that you're missing. In the form that opens, create the legends you need. When you're done, click Refresh values.
Enter a link to an external image legend in Legend image URL.
These are often provided for WMS. See under LegendURL in the WMS GetCapabilites document.
Cliquez sur Sauvegarder.
Cloning a data element or other objects can save time when you create many similar objects.
Open the Maintenance app and find the type of metadata object you want to clone.
Dans la liste des objets, cliquez sur le menu des options et sélectionnez Cloner.
Modifiez les options que vous souhaitez.
Cliquez sur Sauvegarder.
Note
You can only delete a data element and other data element objects if no data is associated to the data element itself.
Warning
Any data set that you delete from the system is irrevocably lost. All data entry forms, and section forms which may have been developed will also be removed. Make sure that you have made a backup of your database before deleting any data set in case you need to restore it at some point in time.
Open the Maintenance app and find the type of metadata object you want to delete.
Dans la liste des objets, cliquez sur le menu des options et sélectionnez Supprimer.
Cliquez sur Confirmer.
Open the Maintenance app and find the type of metadata object you want to view.
In the object list, click the options menu and select Show details.
DHIS2 provides functionality for translations of database content, for example data elements, data element groups, indicators, indicator groups or organisation units. You can translate these elements to any number of locales. A locale represents a specific geographical, political, or cultural region.
Tip
To activate a translation, open the System Settings app, click > Appearance and select a language.
Open the Maintenance app and find the type of metadata object you want to translate.
Dans la liste des objets, cliquez sur le menu des options et sélectionnez Traduire.
Tip
If you want to translate an organisation unit level, click directly on the Translate icon next to each list item.
Sélectionnez un lieu.
Tapez un Nom, Nom abrégé et Description.
Cliquez sur Sauvegarder.
The SQL View functionality of DHIS2 will store the SQL view definition internally, and then materialize the view when requested.
Database administrators must be careful about creating database views directly in the DHIS2 database. For instance, when the resource tables are generated, all of them will first be dropped and then re-created. If any SQL views depend on these tables, an integrity violation exception will be thrown and the process will be aborted.
The SQL views are dropped in reverse alphabetical order based on their names in DHIS2, and created in regular alphabetical order. This allows you to have dependencies between SQL views, given that views only depend on other views which come earlier in the alphabetical order. For instance, "ViewB" can safely depend on "ViewA". Otherwise, having views depending on other view result in an integrity violation error.
To create a new SQL view, click Apps > Maintenance > Other > SQL View and click the Add + button.
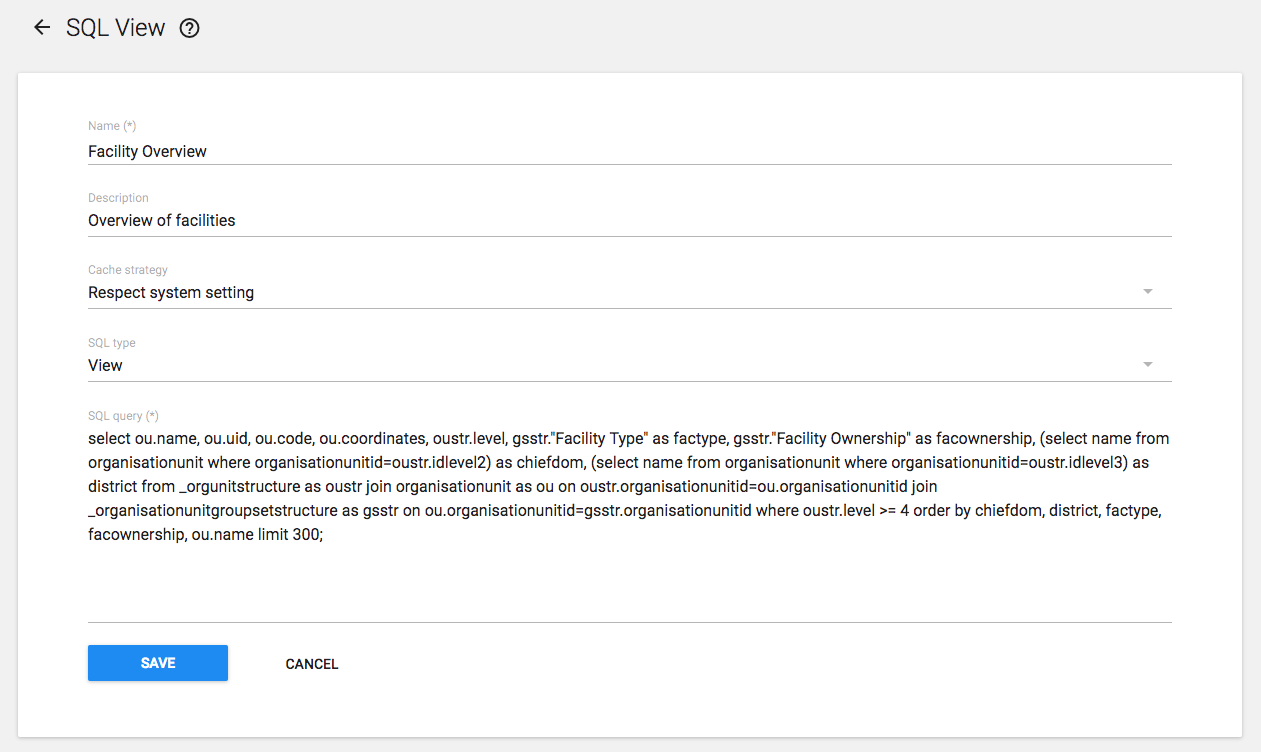
The "Name" attribute of the SQL view will be used to determine the name of the table that DHIS2 will create when the view is materialized by the user. The "Description" attribute allows one to provide some descriptive text about what the SQL view actually does. Finally, the "SQL query" should contain the SQL view definition. Only SQL "SELECT" statements are allowed and certain sensitive tables (i.e. user information) are not accessible Press "Save" to store the SQL view definition.
In order to utilize the SQL views, simply click the view and from the context menu, choose "Execute query". Once the process is completed, you will be informed that a table has been created. The name of the table will be provided, and is composed from the "Description" attribute provided in the SQL view definition. Once the view has been generated, you can view it by clicking the view again, and selecting "Show SQL View".
Tip
If you have a view which depends on another view, you should be careful about how the views are named. When analytics is run on the DHIS2 server, all views must be dropped, and are recreated. When analytics starts, the views are dropped in alphabetical order, and then recreated in reverse alphabetical order. Thus, if view A depends on view B, it must appear before view B in alphabetical order. If it appears after view B in alphabetical order, analytics may fail, as the view with dependencies will not be dropped in the correct order.
It is possible to create custom locales in DHIS2. In addition to the locales available through the system, you might want to add a custom locale such as "English" and "Zambia" to the system. This would allow you to translate metadata objects to local languages, or to account for slight variants between countries which use a common metadata definition.
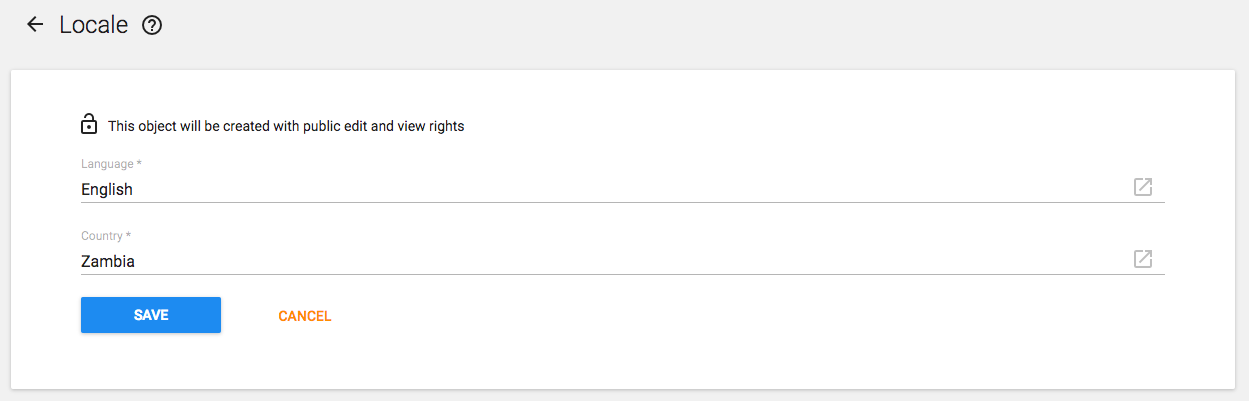
The locale is composed of a language along with a country. Select the desired values and press "Add". This custom locale will now be available as one of the translation locales in the system.
The Metadata group editor in the Maintenance app allows you to edit multiple object groups at the same time. You can edit the following objects types:
Type d'objet | Fonctions disponibles |
|---|---|
Option de catégorie | |
Groupe d'options de catégorie | |
Élément de donnée | Ajouter un élément de donnée à plusieurs groupes d'éléments de données Supprimer un élément de donnée de plusieurs groupes d'éléments de données |
Groupe d'éléments de données | Ajouter plusieurs éléments de données à un groupe d'éléments de données Supprimer plusieurs éléments de données d'un groupe d'éléments de données |
Indicateur | Ajouter un indicateur à plusieurs groupes d'indicateurs Supprimer un indicateur de plusieurs groupes d'indicateurs |
Groupe d'indicateurs | Ajouter plusieurs indicateurs à un groupe d'indicateurs Supprimer plusieurs indicateurs d'un groupe d'indicateurs |
Ouvrez l'application Maintenance et cliquez sur Éditeur de groupes de métadonnées.
Cliquez sur Gérer les éléments du groupe.
Sélectionnez un type de groupe d'objets, par exemple Groupes d'indicateurs.
Sélectionnez un groupe d'objets, par exemple VIH.
In the left-hand list, select the object(s) you want to add to the object group and click the right arrow.
In the right-hand list, select the object(s) you want to remove from the object group and click the left arrow.
Ouvrez l'application Maintenance et cliquez sur Éditeur de groupes de métadonnées.
Cliquez sur Gérer les groupes pour l'article.
Sélectionnez un type d'objet, par exemple Indicateurs.
Sélectionnez un objet, par exemple couverture de CPN MILD.
In the left-hand list, select the objects group(s) you want to add the object to and click the right arrow.
In the right-hand list, select the object group(s) you want to remove the object from and click the left arrow.
Multiple users can access DHIS2 simultaneously and each user can have different authorities. You can fine-tune these authorities so that certain users can only enter data, while others can only generate reports.
You can create as many users, user roles and user groups as you need.
You can assign specific authorities to user groups or individual users via user roles.
Vous pouvez créer plusieurs rôles d'utilisateur, chacun disposant de ses propres autorités.
You can assign user roles to users to grant the users the corresponding authorities.
You can assign each user to organisation units. Then the user can enter data for the assigned organisation units.
Condition | Définition | Exemple |
|---|---|---|
Authorité | Autorisation d'effectuer une ou plusieurs tâches spécifiques | Créer un nouvel élément de donnée Mettre à jour une unité d'organisation Visualiser un rapport |
Utilisateur | Compte d'utilisateur DHIS2 d'une personne | administrateur traore invité |
Rôle de l'utilisateur | Un groupe d'autorités | Commis à la saisie de données Administrateur du systèmer Accès aux programmes de soins prénataux |
Groupe d'utilisateurs | Un groupe d'utilisateurs | Personnel du Kenya Destinataires des messages de feedback Coordinateurs du programme VIH |
L'application Utilisateurs vous permet de gérer les utilisateurs, les rôles des utilisateurs et les groupes d'utilisateurs.
Type d'objet | Fonctions disponibles |
|---|---|
Utilisateur | Créer, modifier, inviter, cloner, désactiver, afficher par unité d'organisation, supprimer et afficher les détails |
Rôle de l'utilisateur | Créer, modifier, partager, supprimer et afficher des détails |
Groupe d'utilisateurs | Créer, modifier, rejoindre, quitter, partager, supprimer et afficher les détails |
Each user in DHIS2 must have a user account which is identified by a user name. You should register a first and last name for each user as well as contact information, for example an email address and a phone number.
It is important that you register the correct contact information. DHIS2 uses this information to contact users directly, for example sending emails to notify users about important events. You can also use the contact information to share for example dashboards and pivot tables.
A user in DHIS2 is associated with an organisation unit. You should assign the organisation unit where the user works.
When you create a user account for a district record officer, you should assign the district where he/she works as the organisation unit.
L'unité organisationnelle assignée influence la manière dont l'utilisateur peut utiliser le DHIS2 :
In the Data Entry app, a user can only enter data for the organisation unit she is associated with and the organisation units below that in the hierarchy. For instance, a district records officer will be able to register data for her district and the facilities below that district only.
In the Users app, a user can only create new users for the organisation unit she is associated with in addition to the organisation units below that in the hierarchy.
In the Reports app, a user can only view reports for her organisation unit and those below. (This is something we consider to open up to allow for comparison reports.)
An important part of user management is to control which users are allowed to create new users with which authorities. In DHIS2, you can control which users are allowed to perform this task. The key principle is that a user can only grant authorities and access to data sets that the user itself has access to. The number of users at national, province and district level are often relatively few and can be created and managed by the system administrators. If a large proportion of the facilities are entering data directly into the system, the number of users might become unwieldy. It is recommended to delegate and decentralize this task to the district officers, it will make the process more efficient and support the facility users better.
A user role in DHIS2 is a group of authorities. An authority means the permission to perform one or more specific tasks.
A user role can contain authorities to create a new data element, update an organisation unit or view a report.
A user can have multiple user roles. If so, the user's authorities will be the sum of all authorities and data sets in the user roles. This means that you can mix and match user roles for special purposes instead of only creating new ones.
A user role is associated with a collection of data sets. This affects the Data Entry app: a user can only enter data for the data sets registered for his/her user role. This can be useful when, for example, you want to allow officers from health programs to enter data only for their relevant data entry forms.
Recommandations :
Créer un rôle d'utilisateur pour chaque poste au sein de l'organisation.
Create the user roles in parallel with defining which user is doing which tasks in the system.
Only give the user roles the exact authorities they need to perform their job, not more. Only those who are supposed to perform a task should have the authorities to perform it.
A user group is a group of users. You use user groups when you set up sharing of objects or notifications, for example push reports or program notifications.
Voir également :
Define the positions you need for your project and identify which tasks the different positions will perform.
Créez plus ou moins un rôle d'utilisateur pour chaque poste.
Créez des utilisateurs.
Attribuez des rôles d'utilisateur aux utilisateurs.
Affectez les utilisateurs à des unités d'organisation.
(Facultatif) Regrouper les utilisateurs en groupes d'utilisateurs.
Share datasets with users or user-groups via the Sharing Dialog in Data set management section of the Maintenance app
Tip
For users to be able to enter data, you must add them to an organisational unit level and share a dataset with them.
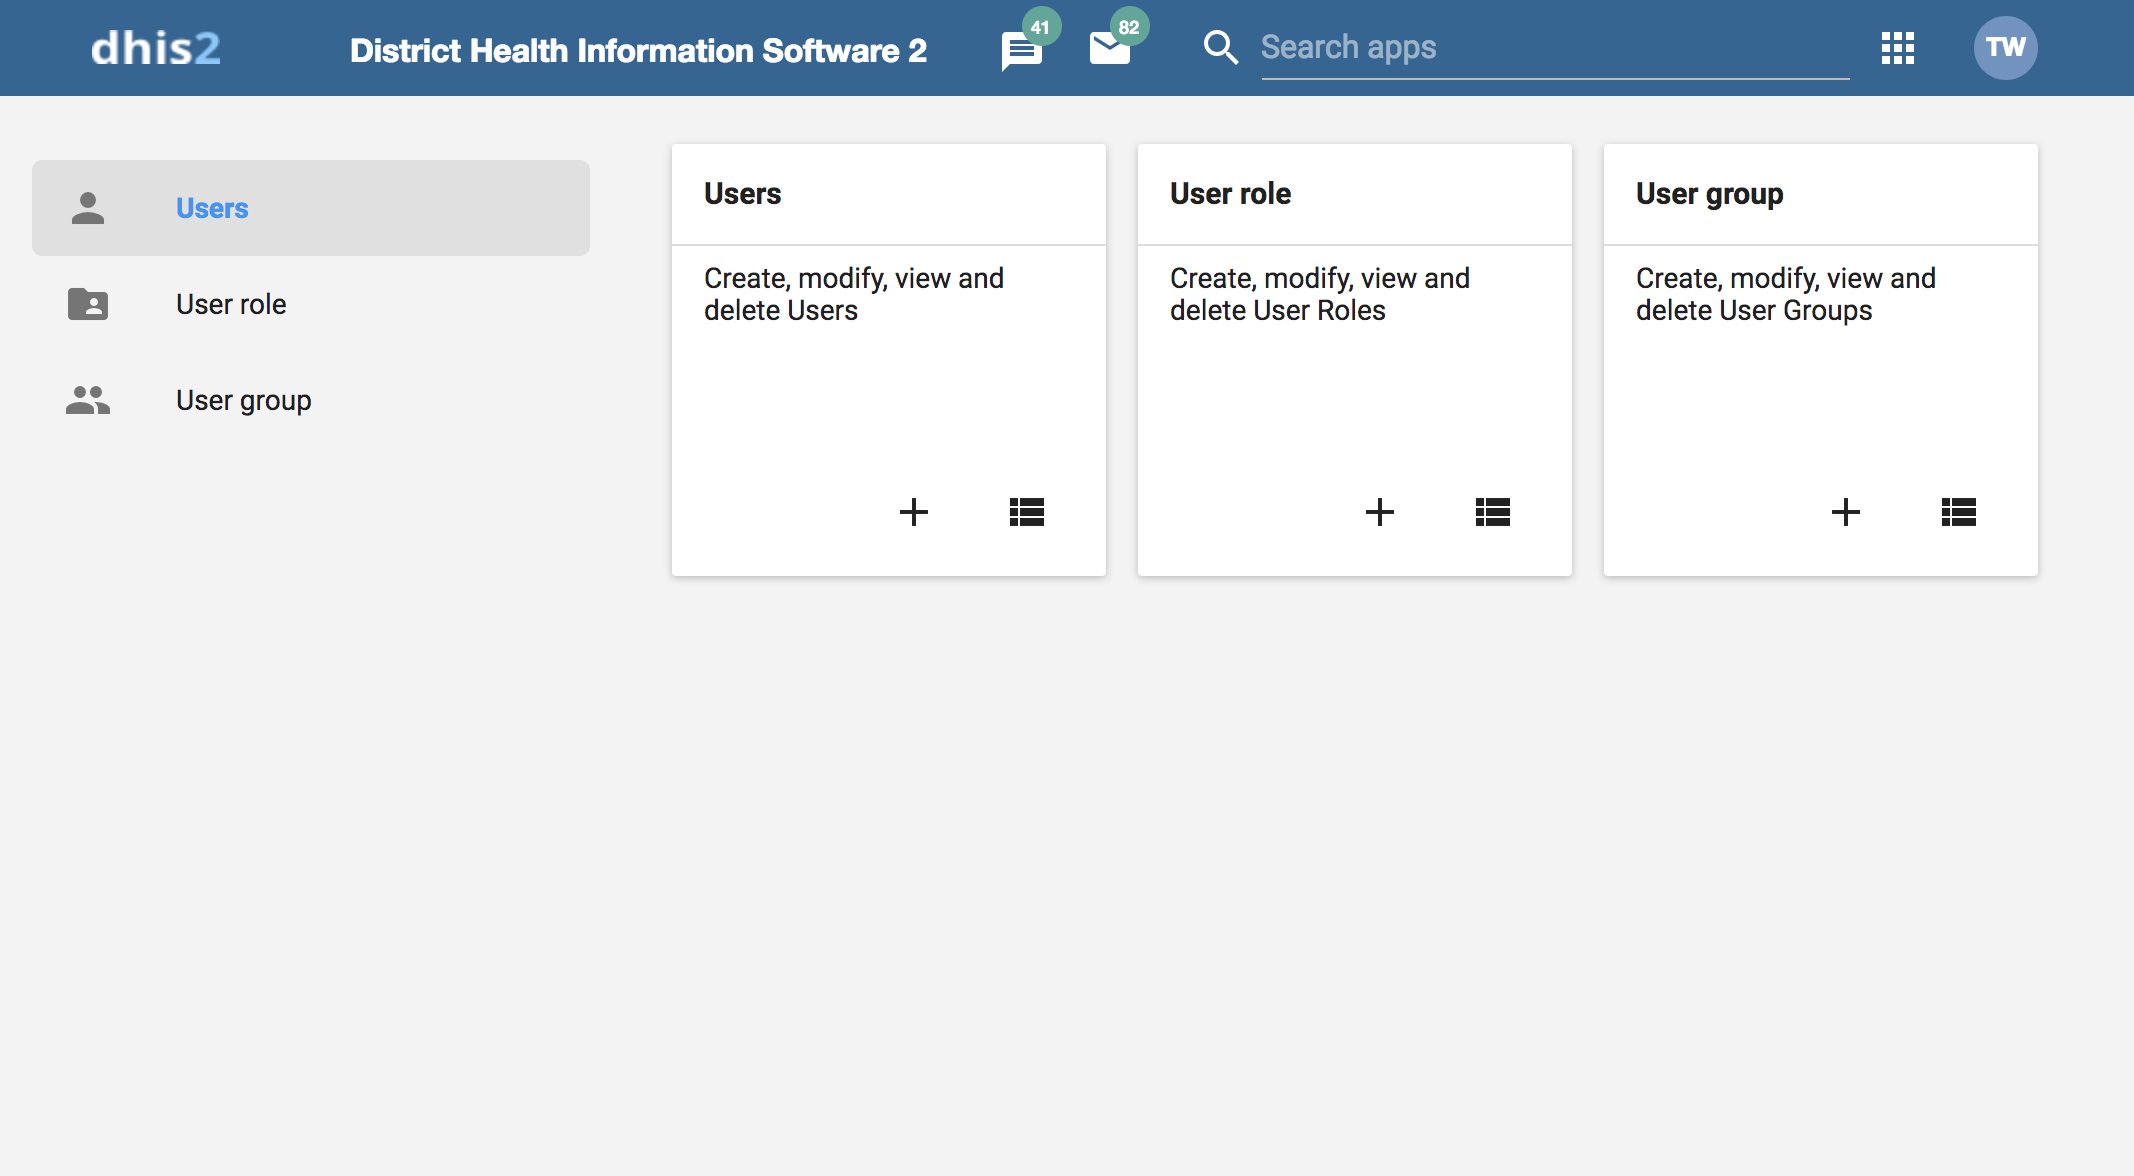
Ouvrez l'application Utilisateurs et cliquez sur le + de la carte Utilisateurs.
Select whether you want to fill in all the personal user information, or invite the user by email to complete the rest of the user information:
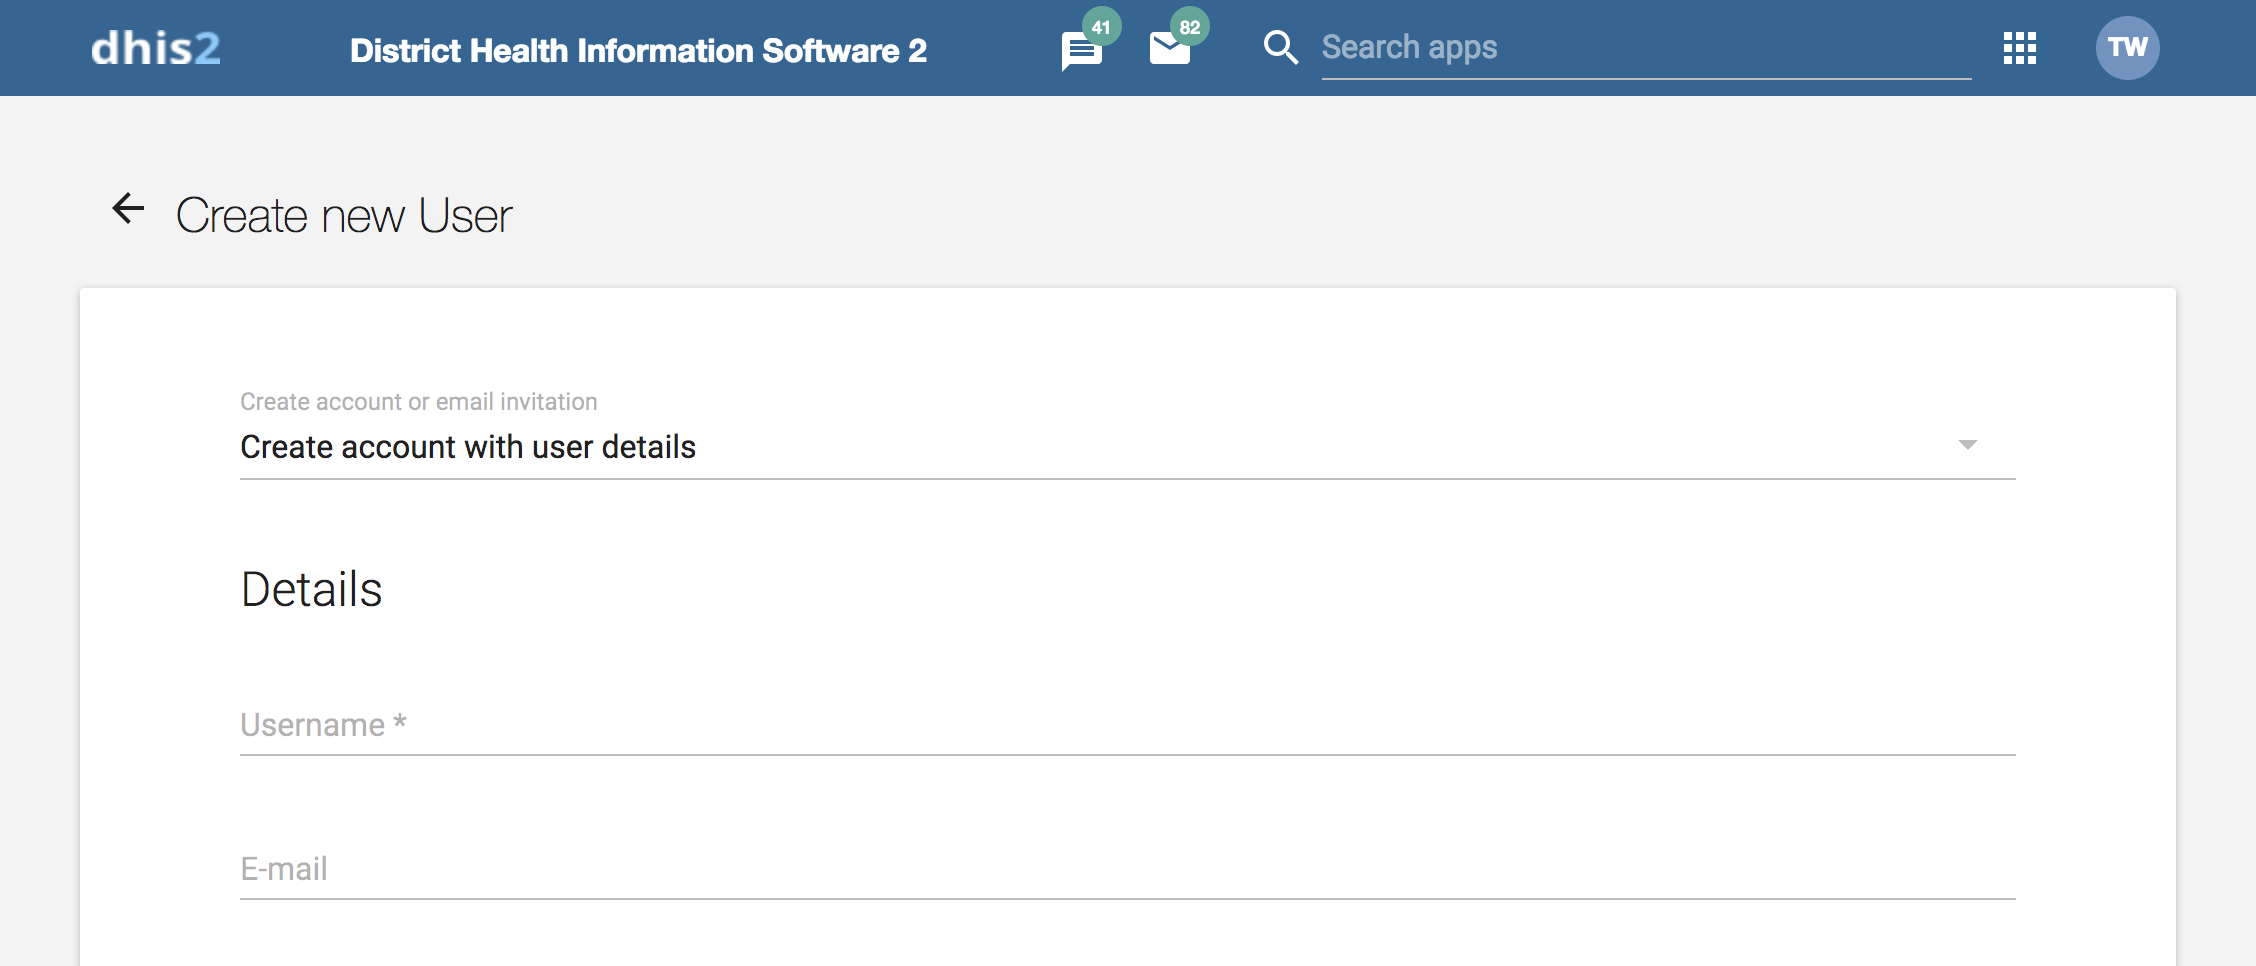 Choose this option if you would like to enter all the login details of the new user such as username, password, etc. Under these conditions, the fields username, password, surname, first name, and roles are mandatory.
Email invitation to create account 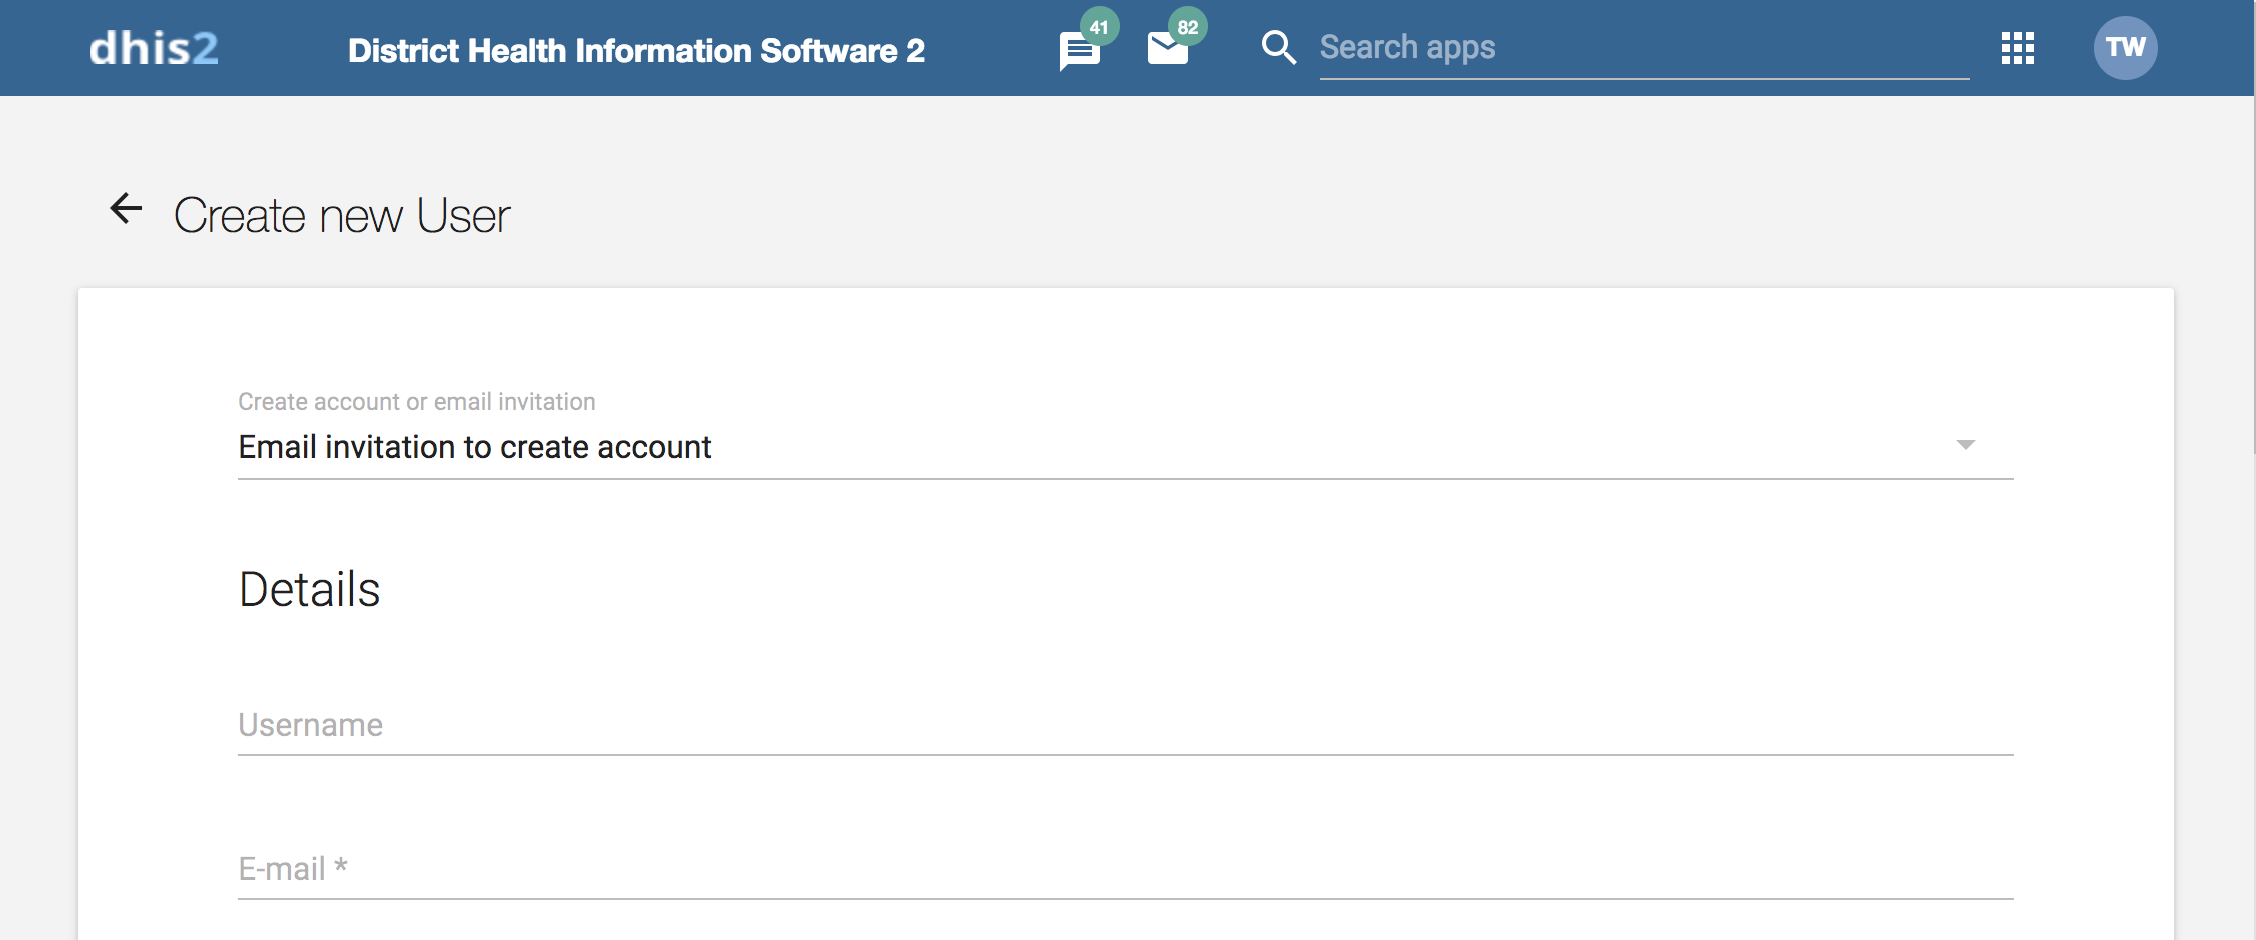 Choose this option if you want to send an invitation by email to the user. Then she/he must return to DHIS2 and finish setting up their user account. The account that the user finishes setting up will be limited according to how you configure the account.
In order to use this feature "Enable email message notifications" in SystemSettings -> Messaging should be checked.
Enter the email address to which the invitation should be sent. If you want to, you may also enter the user name that the account will have. If you leave the user name empty, then the user may choose their own user name when they respond to the invitation (as long as it is not taken already for another user.)
After you've created the user, the system sends an email to the address you provided. It contains a unique web link by which the user can return to the system and activate their account by entering the rest of their user information. The user must finish setting up the account within 4 days, after that the invitation becomes invalid.
(Facultatif) Entrez des valeurs dans les champs OpenID, identifiant LDAP, numéro de téléphone portable, WhatsApp, Facebook Messenger, Skype, Telegram et Twitter.
Select an Interface language.
You can select a language into which fixed elements of the DHIS2 user interface have been translated.
Select a Database language.
You can select a language into which implementation-supplied items have been translated in the database, for example data element names or organisation unit level names.
Dans la section Rôles disponibles, double-cliquez sur les rôles que vous souhaitez attribuer à l'utilisateur.
Select Data capture and maintenance organisation units.
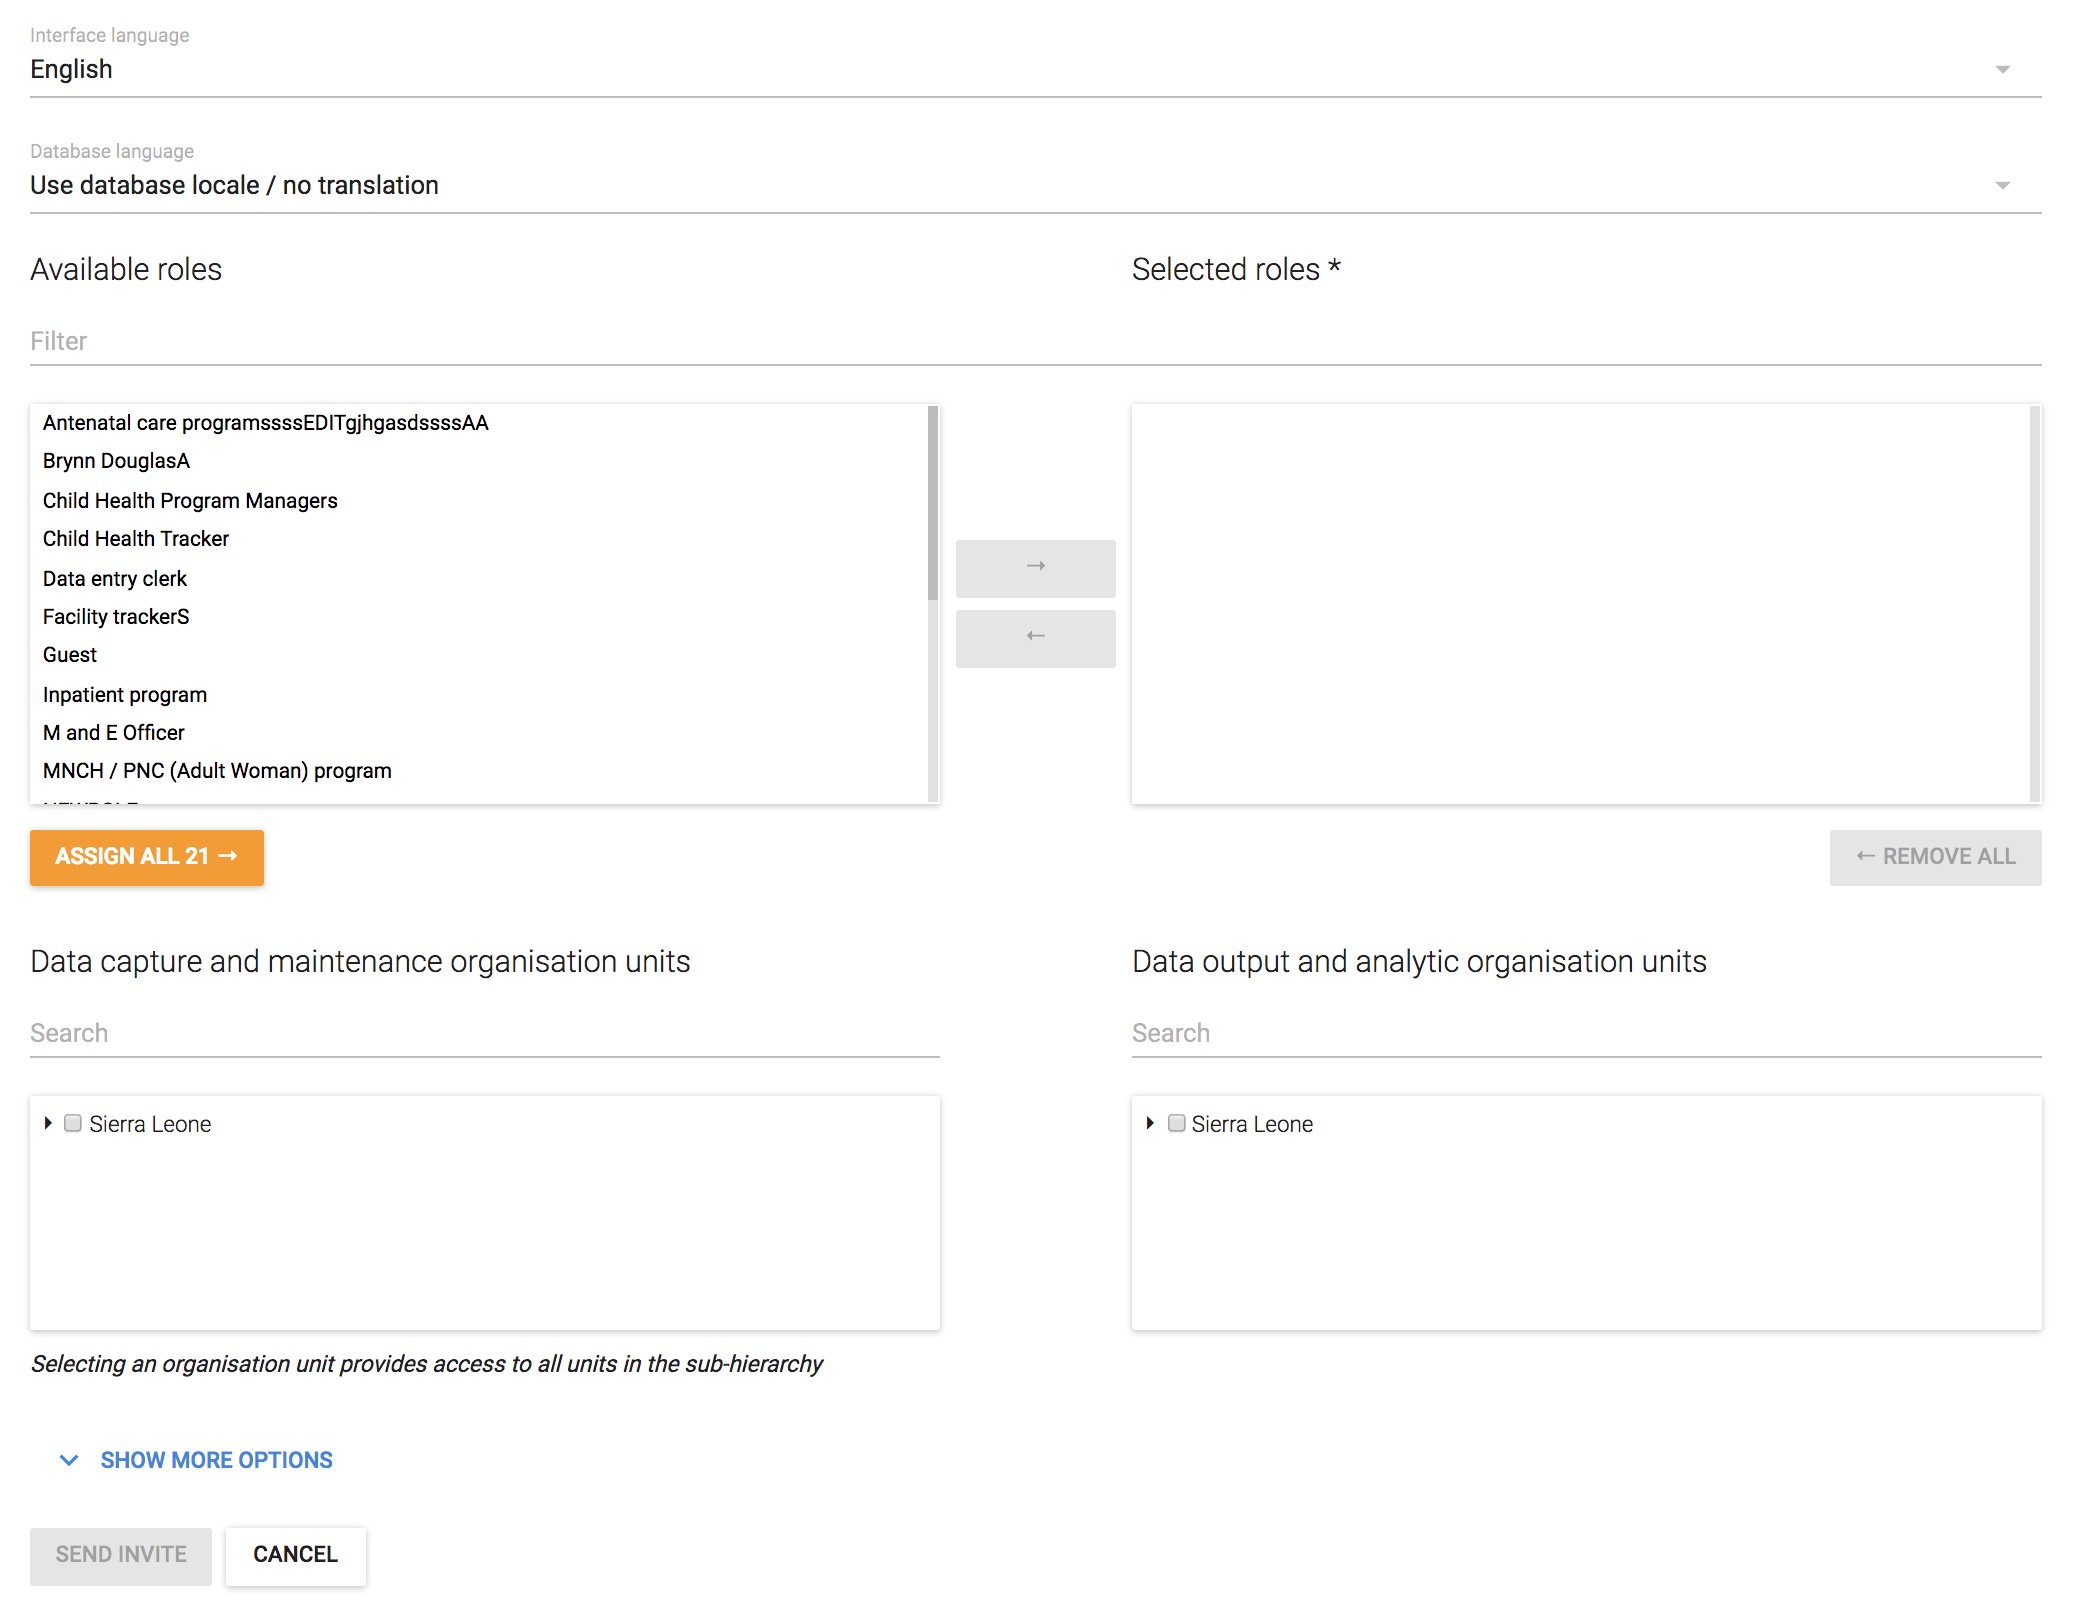
The data capture and maintenance organisation units control for which organisation units the user can do data entry. You must assign at least one data capture and maintenance organisation unit to each user.
Users will have access to all sub-organisation units of the assigned organisation units. For example, if you've assigned a user to a district which has several facilities contained in the district, the user would have access to the district's data, as well as all of the facilities contained within the district.
(Optional) Select Data output and analysis organisation units.
The data output and analysis organisation units controls for which organisation units the user can view aggregated data in the analytics apps, for example the Pivot Table and GIS apps. You can assign any number of data output and analysis organisation units to a user.
Users will have access to all sub-organisation units of the assigned organisation units. You shouldn't select the descendants of an organisation unit which you have already selected. For example, if you've assigned the user to a district, you shouldn't select the facilities within that district.
Note
Assigning data output and analysis organisation units organisation units is optional. If you don't specify any organisation unit, the user will have access to the full organisation unit hierarchy for viewing aggregated data. As with the data capture organisation units, you should not select descendant organisation units of a unit which you have already selected.
In several places in the analytics apps, you can select "user organisation unit" for the organisation unit dimension. This mechanism will first attempt to use the data view organisation units linked to the current user. If not found, it will use the data capture and maintenance organisation units. If the user has been assigned to multiple organisation units, the use of "user organisation unit" may result in unpredictable behaviour.
Click Show more options and an additional three fields will show. (Optional)
In the Search organisation units select the organisation units you want the user to be able to search in.
(Optional) In the Available user groups section, double-click the user groups you want to assign to the user.
(Optional) In the Available dimension restrictions for data analytics section, double-click the dimensions you want to assign to the user.
You can restrict the values the user sees in data analytics apps by selecting dimensions that will restrict the user's view.
Example
Let's say you have defined Implementing Partner as a category option group set, and you have shared with this user only one or more specific implementing partners (category option groups). If you want to make sure that the user does not see totals in analytics that include values from other groups, assign Implementing Partner to the user.
This insures that any data visible to the user through the analytics apps will be filtered to select only the Implementing Partner category option group(s) which are visible to the user.
Open the Users app and find the type of user object you want to edit.
In the object list, directly click the relevant object, or click the menu icon and select Edit.
Modifiez les options que vous souhaitez.
Cliquez sur Sauvegarder.
You can disable a user. This means that the user's account is not deleted, but the user can't log in or use DHIS2.
Ouvrez l'application Utilisateurs et cliquez sur Utilisateur.
In the list, click the menu icon of relevant user record and select Disable.
Cliquez sur OK pour confirmer.
Ouvrez l'application Utilisateurs et cliquez sur Utilisateur.
In the list, click the menu icon of the relevant user and select Profile.
You can view all users that have been assigned to a particular organisation unit.
Ouvrez l'application Utilisateurs et cliquez sur Utilisateur.
Above the user list, click on the Organisation Unit filter input.
A pop-up will appear in which you can select the organisation units you would like to filter by.
The list of users will be filtered to only include users which have been assigned to the selected organisation units.
Ouvrez l'application Utilisateurs et cliquez sur Utilisateur.
In the object list, click the menu icon of the relevant user and select Replicate.
Entrez un nouveau nom d'utilisateur et un nouveau mot de passe pour le compte d'utilisateur cloné.
Cliquez sur Répliquer.
In the object list, click the user you just created and click Edit.
Modifiez les options que vous souhaitez.
Cliquez sur Sauvegarder.
Pour modifier le mot de passe d'un utilisateur, suivez les étapes suivantes :
Ouvrez l'application Utilisateurs et cliquez sur Utilisateur.
In the object list, click the menu icon of the relevant user and select Edit.
Saisissez un nouveau mot de passe et confirmez en le retapant.
Cliquez sur Sauvegarder.
Les règles ci-après s'appliquent lorsque vous créez un nouveau mot de passe. Le mot de passe :
Doit contenir au moins 8 caractères. Notez que ce nombre est configurable par le biais du paramètre du système "Minimum de caractères dans le mot de passe", qui peut comporter jusqu'à 14 caractères.
Ne doit pas contenir plus de 40 caractères.
Doit contenir au moins un caractère spécial (caractère non alphanumérique).
Doit contenir au moins un caractère majuscule.
Doit contenir au moins un caractère minuscule.
Doit contenir au moins un chiffre (nombre).
Ne doit pas contenir le nom d'utilisateur ou l'adresse électronique du compte d'utilisateur.
Not contain generic words such as system, admin, user, login, and manager.
Ne doit pas être l'un des 24 mots de passe précédents que l'utilisateur a utilisés. Cette règle ne s'applique pas lorsqu'un super-utilisateur réinitialise le mot de passe pour un autre utilisateur.
Open the Users app and find the type of user object you want to delete.
In the object list, click the menu icon of the relevant object and select Remove.
Cliquez sur OK pour confirmer.
Open the Users app and find the type of user object you want to view.
In the object list, click the menu icon of the relevant object and select Show details.
If a user has enabled Two Factor Authentication and then loses access to his/her authentication device (e.g. smartphone gets lost or broken), this user will not be able to log into the system any more. To solve this issue, a user manager can disable Two Factor Authentication for the affected user, so that the user is able to access the system again using just a password.
Ouvrez l'application Utilisateurs et cliquez sur Utilisateur.
In the object list, click the menu icon of the relevant user and select Disable Two Factor Authentication.
Cliquez sur OK pour confirmer.
Note
The option to disable Two Factor Authentication will only be available for users that have set up Two Factor Authentication via the user-profile-app.
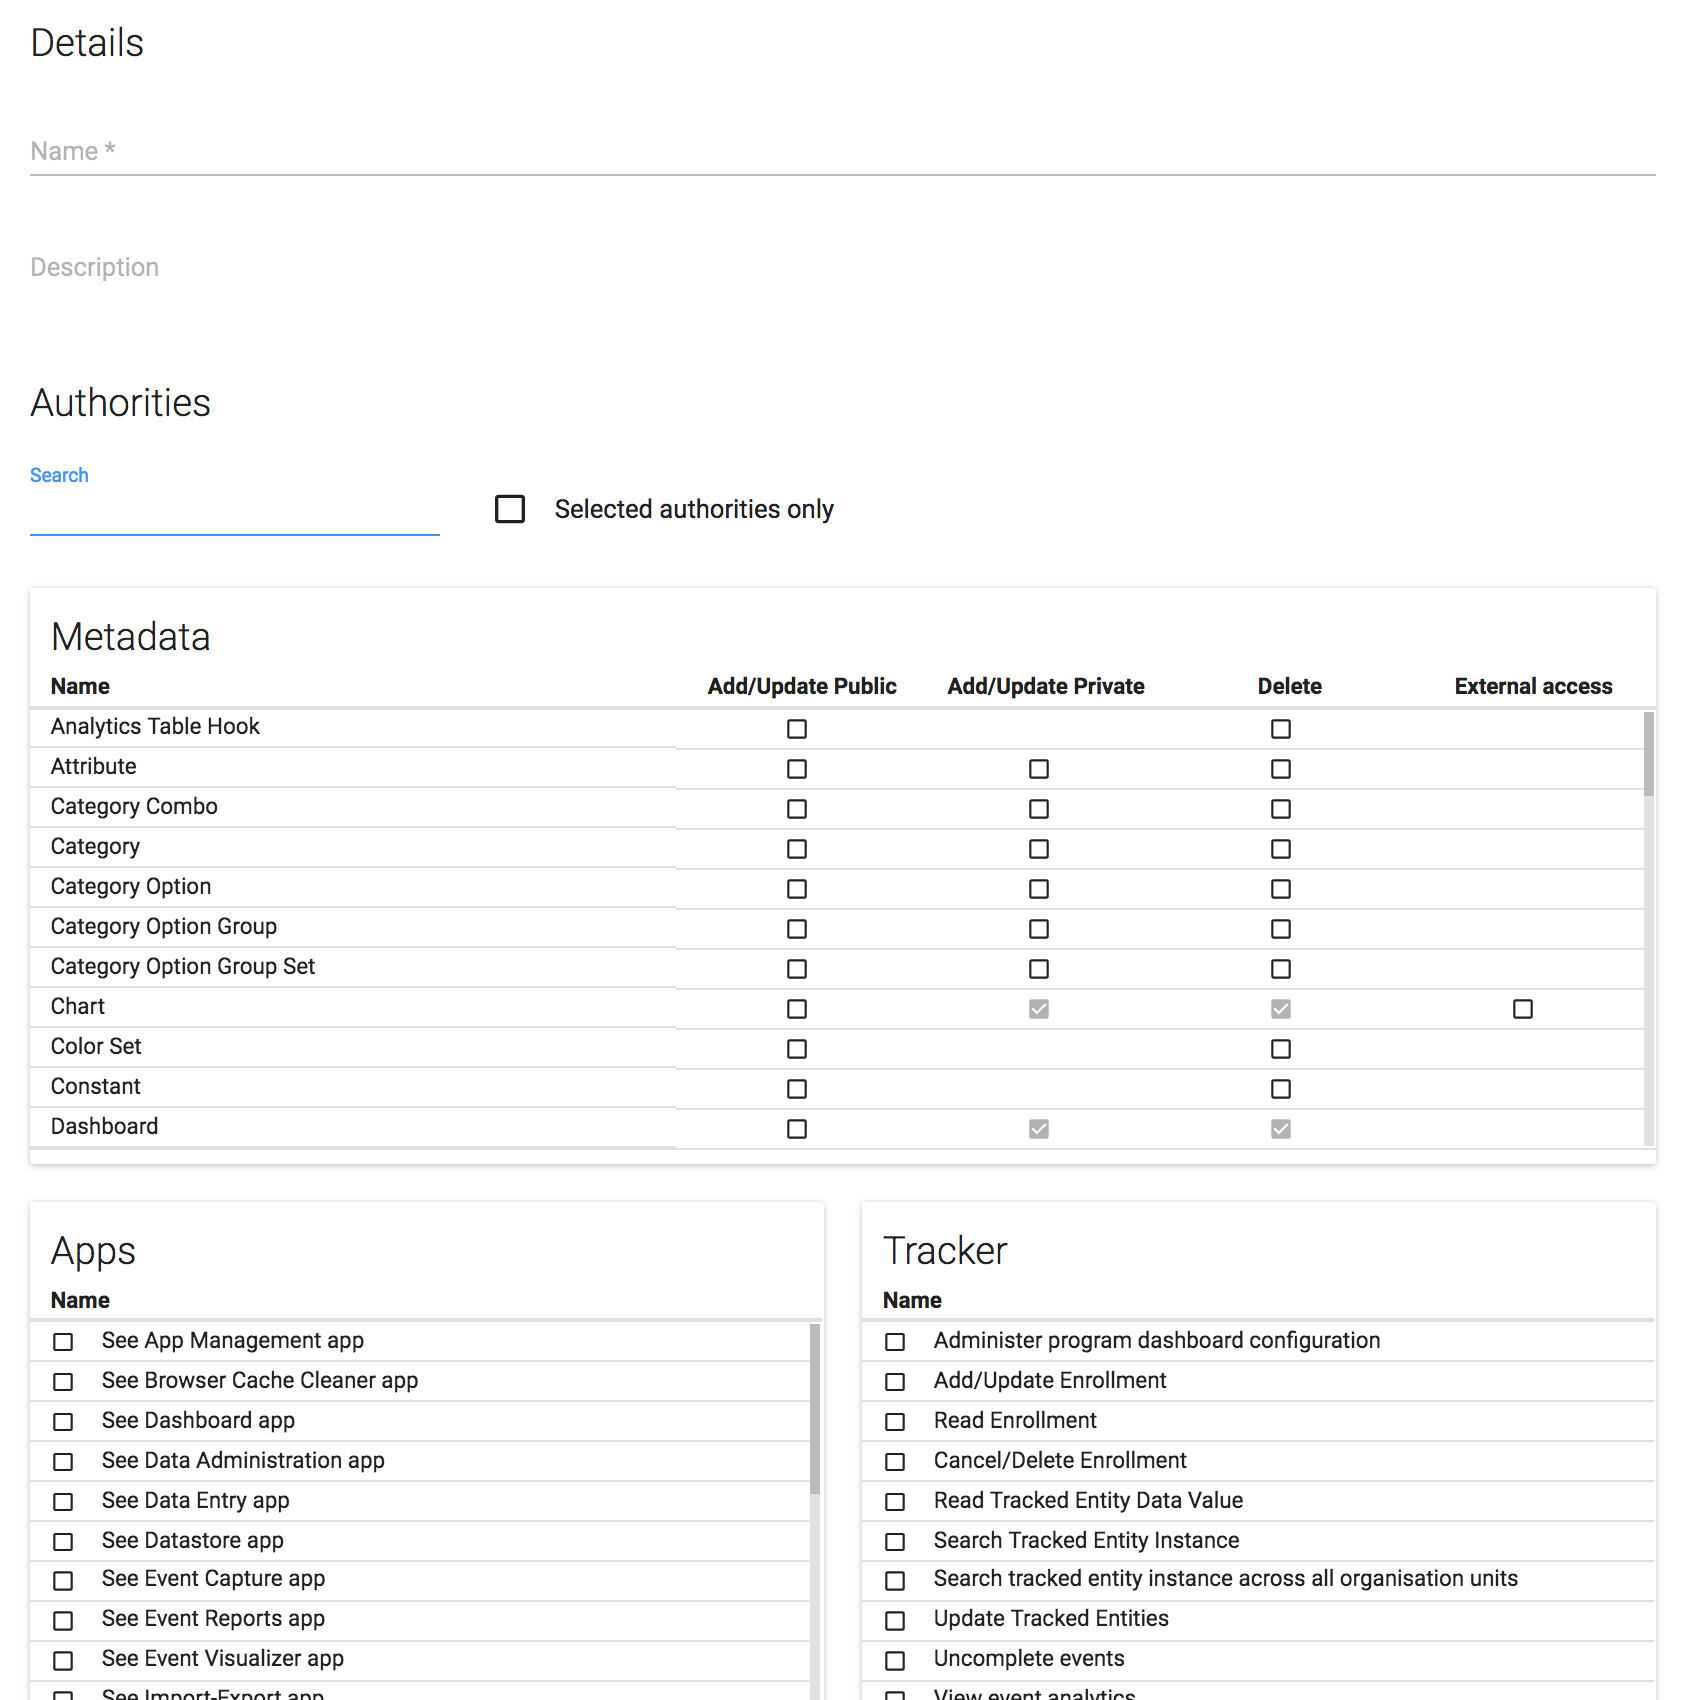
Ouvrez l'application Utilisateurs et cliquez sur Rôle de l'utilisateur.
Cliquez sur AJOUTER.
Entrez un Nom, par exemple "Super utilisateur" ou "Utilisateur dmin ".
Tapez une Description.
In the Authorities section, select the authorities you want to give to the user role. You can also use the filter inputs above the authority section to search for a specific authority.
Cliquez sur Ajouter.
Open the Users app and find the type of user object you want to edit.
In the object list, directly click the relevant object, or click the menu icon and select Edit.
Modifiez les options que vous souhaitez.
Cliquez sur Sauvegarder.
Open the Users app and find the type of user object you want to delete.
In the object list, click the menu icon of the relevant object and select Remove.
Cliquez sur OK pour confirmer.
Open the Users app and find the type of user object you want to view.
In the object list, click the menu icon of the relevant object and select Show details.
Open the Users app and find the type of user object you want to modify.
In the object list, click the relevant object and select Sharing settings.
(Optional) Search for a user group and select it, then click the plus icon. The user group is added to the list.
(Facultatif) Sélectionnez Accès externe (sans login).
Modifiez les paramètres des groupes d'utilisateurs que vous souhaitez modifier.
Peut modifier et visualiser : Tout le monde dans le groupe d'utilisateurs peut voir et modifier l'objet
Cliquez sur Sauvegarder.
Ouvrez l'application Utilisateurs et cliquez sur Groupe d'utilisateurs.
Cliquez sur AJOUTER.
Dans le champ Nom, entrez le nom du groupe d'utilisateurs.
In the Available users section, double-click the users you want to add to the user group.
In the Available user groups section, double-click the user groups you want to add to the user group.
Cliquez sur Ajouter.
Ouvrez l'application Utilisateurs et cliquez sur Groupe d'utilisateurs.
In the list, click the relevant user group and select Join group.
Ouvrez l'application Utilisateurs et cliquez sur Groupe d'utilisateurs.
In the list, click the relevant user group and select Leave group.
Open the Users app and find the type of user object you want to edit.
In the object list, directly click the relevant object, or click the menu icon and select Edit.
Modifiez les options que vous souhaitez.
Cliquez sur Sauvegarder.
Open the Users app and find the type of user object you want to delete.
In the object list, click the menu icon of the relevant object and select Remove.
Cliquez sur OK pour confirmer.
Open the Users app and find the type of user object you want to view.
In the object list, click the menu icon of the relevant object and select Show details.
Open the Users app and find the type of user object you want to modify.
In the object list, click the relevant object and select Sharing settings.
(Optional) Search for a user group and select it, then click the plus icon. The user group is added to the list.
(Facultatif) Sélectionnez Accès externe (sans login).
Modifiez les paramètres des groupes d'utilisateurs que vous souhaitez modifier.
Peut modifier et visualiser : Tout le monde dans le groupe d'utilisateurs peut voir et modifier l'objet
Cliquez sur Sauvegarder.
DHIS2 supports the OpenID standard, which allows third party login using a OpenID provider, for more information see http://openid.net. To create a custom OpenID URL for a user name you can visit this URL and log in with your OpenID provider: http://openid-provider.appspot.com.
Pour activer la priese en charde d'OpenID dans DHIS2, vous devez :
Set your OpenID provider: This can be done inside system settings, under "Access". Here you can set both the OpenID provider, and also the label to display on the login page to login with this provider (defaults to Login with OpenID).
Set the OpenID identifier on the user: For every user that should be able to login with his OpenID identifier, you will need to set this on the user itself. This can be done in user management, under the email field, there is not a field called OpenID which can be used to fill in the OpenID identifier.
DHIS2 supports a concept for user management referred to as managed users which allows to explicitly define which users should be allowed to manage or modify which users. To "manage a user" implies that you can see and modify that user. The basic concept for user management is that you can see and modify users which you have been granted all of the authorities; in other words you can modify users which have a subset of your own authorities. The managed users concept gives you greater control over this.
The managed users concept allows you to define which users should be able to manage which users. This is configured through user groups and memberships within such groups. A user group can be configured to be allowed to manage other user groups from the standard add and update user interface. The effect is that a specific user can manage all users which are members of user groups which can be managed by a user group that the user is member of. In other words, users can be managed by all members of user groups which are managing user groups they are member of.
To enable this concept you should grant users the authority to "Add/update users within managed groups", and not grant access to the standard "Add/update users" authority. An implication of the managed users concept is that when creating a user with the "Add/update users within managed groups" only, the user must be made a member of at least one user group that the current user can manage. If not, the current user would lose access to the user being created immediately. This is validated by the system.
When granted the "Add/update users within managed groups" authority, the system lets a user add members to user groups for which she has read-only access to. The purpose of this is to allow for decentralized user management. You may define a range of user groups where other users may add or remove members, but not remove or change the name of the group.
In a health system, users are logically grouped with respect to the task they perform and the position they occupy.
Define which users should have the role as system administrators. They are often part of the national HIS division and should have full authority in the system.
Créez plus ou moins un rôle d'utilisateur pour chaque poste.
Voici des exemples de positions courantes :
Fonction | Tâches habituelles | Autorités recommandées | Commentaire |
|---|---|---|---|
Administrateurs de système | Mettre en place la structure de base (métadonnées) du système. | Ajouter, mettre à jour et supprimer les éléments essentiels du système, par exemple les éléments de données, les indicateurs et les ensembles de données. | Seuls les administrateurs du système doivent modifier les métadonnées. Si vous autorisez des utilisateurs extérieurs à l'équipe d'administrateurs du système à modifier les métadonnées, cela peut entraîner des problèmes de coordination. Les mises à jour du système ne doivent être effectuées que par les administrateurs du système. |
Responsables nationaux de la santé Responsables de santé des provinces | Suivre et analyser les données | Accès au module de rapports, aux applications, SIG Qualité des données et au tableau de bord. | N'ont pas besoin d'accès pour entrer des données, modifier des éléments de données ou des ensembles de données. |
Responsables des divisions du système national d'information sur la santé (HISO) Agents chargés des dossiers et informations sanitaires des districts (DHRIO) Agents chargés des dossiers et informations sanitaires des établissements (HRIO) | Saisir les données provenant d'établissements qui ne peuvent pas le faire directement Suivre, évaluer et analyser les données | Accès à toutes les applications d'analyse et de validation Accès à l' application Saisie de données. | - |
Commis à la saisie des données | - | - | - |
| Accepter les données à des niveaux inférieurs | F_ACCEPT_DATA_LOWER_LEVELS |
| Accéder à mon entrepôt de données | F_MYDATAMART_VIEW |
| Ajouter un établissement | F_FRED_CREATE |
| Ajouter un lieu | F_LOCALE_ADD |
| Ajouter un ensemble d'options | F_OPTIONSET_ADD |
| Ajouter un ensemble de groupes d'unités d'organisation | F_ORGUNITGROUPSET_ADD |
| Ajouter une règle de programme | F_PROGRAM_RULE_ADD |
| Ajouter une carte publique | F_MAP_PUBLIC_ADD |
| Ajouter un type de relation | F_RELATIONSHIPTYPE_ADD |
| Ajouter/Supprimer des membres dans les groupes d'utilisateurs en lecture seule | F_USER_GROUPS_READ_ONLY_ADD_MEMBERS |
| Ajouter une vue SQL | F_SQLVIEW_ADD |
| Ajouter des entités suivies | F_TRACKED_ENTITY_ADD |
| Ajouter une valeur d'attribut d'entité suivie | F_TRACKED_ENTITY_ATTRIBUTEVALUE_ADD |
| Ajouter un formulaire d'entité suivie | F_TRACKED_ENTITY_FORM_ADD |
| Ajouter un commentaire sur l'instance d'entité suivie | F_TRACKED_ENTITY_COMMENT_ADD |
| Ajouter une relation d'entité suivie | F_RELATIONSHIP_ADD |
| Ajouter/mettre à jour un attribut | F_ATTRIBUTE_ADD |
| Ajouter/mettre à jour un graphique | F_CHART_ADD |
| Ajouter/Mettre à jour un concept | F_CONCEPT_ADD |
| Ajouter/Mettre à jour une constante | F_CONSTANT_ADD |
| Ajouter/mettre à jour une valeur de données | F_DATAVALUE_ADD |
| Ajouter/mettre à jour un type d'indicateur | F_INDICATORTYPE_ADD |
| Ajouter/Mettre à jour la règle Min/max | F_DATAELEMENT_MINMAX_ADD |
| Ajouter/Mettre à jour une unité d'organisation | F_ORGANISATIONUNIT_ADD |
| Ajouter/Mettre à jour un groupe d'options de catégorie privée | F_CATEGORY_OPTION_GROUP_PRIVATE_ADD |
| Ajouter/Mettre à jour un ensemble de groupes d'options de catégorie privée | F_CATEGORY_OPTION_GROUP_SET_PRIVATE_ADD |
| Ajouter/Mettre à jour un élément de donnée privé | F_DATAELEMENT_PRIVATE_ADD |
| Ajouter/Mettre à jour une catégorie d'élément de donnée privé | F_CATEGORY_PRIVATE_ADD |
| Ajouter/Mettre à jour une combinaison de catégories d'élément de donnée privé | F_CATEGORY_COMBO_PRIVATE_ADD |
| Ajouter/Mettre à jour une option de catégorie d'élément de donnée privé | F_CATEGORY_OPTION_PRIVATE_ADD |
| Ajouter/Mettre à jour une combo d'options de catégorie d'élément de donnée privé | F_CATEGORY_OPTION_COMBO_PRIVATE_ADD |
| Ajouter/Mettre à jour des groupes d'éléments de données privés | F_DATAELEMENTGROUP_PRIVATE_ADD |
| Ajouter/Mettre à jour des ensembles de groupes d'éléments de données privés | F_DATAELEMENTGROUPSET_PRIVATE_ADD |
| Ajouter/Mettre à jour un ensemble de données privé | F_DATASET_PRIVATE_ADD |
| Ajouter/Mettre à jour un document privé | F_DOCUMENT_PRIVATE_ADD |
| Ajouter/Mettre à jour un indicateur privé | F_INDICATOR_PRIVATE_ADD |
| Ajouter/Mettre à jour un groupe d'indicateurs privés | F_INDICATORGROUP_PRIVATE_ADD |
| Ajouter/Mettre à jour des ensembles de groupes d'indicateurs privés | F_INDICATORGROUPSET_PRIVATE_ADD |
| Ajouter/Mettre à jour un ensemble d'options privées | F_OPTIONSET_PRIVATE_ADD |
| Ajouter/Mettre à jour un groupe d'unités d'organisations privées | F_ORGUNITGROUP_PRIVATE_ADD |
| Ajouter/Mettre à jour un ensemble de groupes d'unités d'organisation privées | F_ORGUNITGROUPSET_PRIVATE_ADD |
| Ajouter/Mettre à jour un programme privé | F_PROGRAM_PRIVATE_ADD |
| Ajouter/Mettre à jour un rapport privé | F_REPORT_PRIVATE_ADD |
| Ajouter/Mettre à jour une vue SQL privée | F_SQLVIEW_PRIVATE_ADD |
| Ajouter/Mettre à jour un attribut d'entité privée suivie | F_TRACKED_ENTITY_ATTRIBUTE_PRIVATE_ADD |
| Ajouter/Mettre à jour un groupe d'utilisateurs privés | F_USERGROUP_PRIVATE_ADD |
| Ajouter/Mettre à jour le rôle de l'utilisateur privé | F_USERROLE_PRIVATE_ADD |
| Ajouter/Mettre à jour le groupe de règles de validation privées | F_VALIDATIONRULEGROUP_PRIVATE_ADD |
| Ajouter/Mettre à jour un attribut de programme | F_PROGRAM_ATTRIBUTE_ADD |
| Ajouter/Mettre à jour un indicateur de programme | F_ADD_PROGRAM_INDICATOR |
| Ajouter/Mettre à jour une étape du programme | F_PROGRAMSTAGE_ADD |
| Ajouter/Mettre à jour une section de l'étape du programme | F_PROGRAMSTAGE_SECTION_ADD |
| Ajouter/Mettre à jour un groupe d'options de catégorie publique | F_CATEGORY_OPTION_GROUP_PUBLIC_ADD |
| Ajouter/mettre à jour un ensemble de groupes d'options de catégorie publique | F_CATEGORY_OPTION_GROUP_SET_PUBLIC_ADD |
| Ajouter/Mettre à jour un graphique public | F_CHART_PUBLIC_ADD |
| Ajouter/Mettre à jour un tableau de bord public | F_DASHBOARD_PUBLIC_ADD |
| Ajouter/Mettre à jour un élément de donnée publique | F_DATAELEMENT_PUBLIC_ADD |
| Ajouter/Mettre à jour une catégorie d'élément de donnée publique | F_CATEGORY_PUBLIC_ADD |
| Ajouter/Mettre à jour une combo de catégories d'éléments de données publiques | F_CATEGORY_COMBO_PUBLIC_ADD |
| Ajouter/Mettre à jour une option de catégorie d'élément de donnée publique | F_CATEGORY_OPTION_PUBLIC_ADD |
| Ajouter/Mettre à jour une option de catégorie d'élément de donnée publique | F_CATEGORY_OPTION_DELETE |
| Ajouter/Mettre à jour une combo d'options de catégorie d'élément de donnée publique | F_CATEGORY_OPTION_COMBO_PUBLIC_ADD |
| Ajouter/Mettre à jour des groupes d'éléments de données publiques | F_DATAELEMENTGROUP_PUBLIC_ADD |
| Ajouter/Mettre à jour des ensembles de groupes d'éléments de données publiques | F_DATAELEMENTGROUPSET_PUBLIC_ADD |
| Ajouter/Mettre à jour un ensemble de données publiques | F_DATASET_PUBLIC_ADD |
| Ajouter/Mettre à jour un document public | F_DOCUMENT_PUBLIC_ADD |
| Ajouter/Mettre à jour un indicateur public | F_INDICATOR_PUBLIC_ADD |
| Ajouter/Mettre à jour un groupe d'indicateurs publics | F_INDICATORGROUP_PUBLIC_ADD |
| Ajouter/Mettre à jour des ensembles de groupes d'indicateurs publics | F_INDICATORGROUPSET_PUBLIC_ADD |
| Ajouter/Mettre à jour un ensemble d'options publiques | F_OPTIONSET_PUBLIC_ADD |
| Ajouter/Mettre à jour un groupe d'unités d'organisation publiques | F_ORGUNITGROUP_PUBLIC_ADD |
| Ajouter/Mettre à jour un ensemble de groupes d'unités d'organisation publiques | F_ORGUNITGROUPSET_PUBLIC_ADD |
| Ajouter/Mettre à jour un programme public | F_PROGRAM_PUBLIC_ADD |
| Ajouter/Mettre à jour un rapport public | F_REPORT_PUBLIC_ADD |
| Ajouter/Mettre à jour un tableau de rapports publics | F_REPORTTABLE_PUBLIC_ADD |
| Ajouter/Mettre à jour une vue SQL publique | F_SQLVIEW_PUBLIC_ADD |
| Ajouter/Mettre à jour un attribut d'entité suivie publique | F_TRACKED_ENTITY_ATTRIBUTE_PUBLIC_ADD |
| Ajouter/Mettre à jour un groupe d'utilisateurs publics | F_USERGROUP_PUBLIC_ADD |
| Ajouter/Mettre à jour un rôle d'utilisateur public | F_USERROLE_PUBLIC_ADD |
| Ajouter/Mettre à jour un groupe de règles de validation publiques | F_VALIDATIONRULEGROUP_PUBLIC_ADD |
| Ajouter/Mettre à jour une section | F_SECTION_ADD |
| Ajouter/Mettre à jour une entité suivie | F_TRACKED_ENTITY_ADD |
| Ajouter/Mettre à jour des attributs d'entité suivie | F_ALLOW_EDIT_TRACKED_ENTITY_ATTRIBUTES |
| Ajouter/Mettre à jour une valeur de données d'entité suivie | F_TRACKED_ENTITY_DATAVALUE_ADD |
| Ajouter/Mettre à jour une instance d'entité suivie | F_TRACKED_ENTITY_INSTANCE_ADD |
| Ajouter/Mettre à jour un utilisateur | F_USER_ADD |
| Ajouter/Mettre à jour un groupe d'utilisateurs gérant les relations | F_USERGROUP_MANAGING_RELATIONSHIPS_ADD |
| Ajouter/Mettre à jour un utilisateur au sein du groupe géré | F_USER_ADD_WITHIN_MANAGED_GROUP |
| Ajouter/Mettre à jour des critères de validation | F_VALIDATIONCRITERIA_ADD |
| Ajouter/Mettre à jour une règle de validation | F_VALIDATIONRULE_ADD |
| Ajouter des groupes de règles de validation | F_VALIDATIONRULEGROUP_ADD |
| Gérer un entrepôt de données | F_DATAMART_ADMIN |
| Gérer un entrepôt de données | F_DATA_MART_ADMIN |
| Gérer le visualiseur de données | F_DV_ADMIN |
| Gérer le SIG | F_GIS_ADMIN |
| Approuver des données | F_APPROVE_DATA |
| Approuver des données aux niveaux inférieurs | F_APPROVE_DATA_LOWER_LEVELS |
| Archiver des données | F_ARCHIVE_DATA |
| Modifier la configuration du SIG | F_GIS_CONFIGURATION_UPDATE |
| Modifier le lieu de l'instance d'entité suivie | F_TRACKED_ENTITY_INSTANCE_CHANGE_LOCATION |
| Modifier l'ordre dans l'ensemble de données | F_DATASET_ORDER_CHANGE |
| Modifier les paramètres du système | F_SYSTEM_SETTING |
| Modifier le lieu de l'instance d'entité suivie | F_TRACKED_ENTITY_CHANGE_LOCATION |
| Accès externe aux graphiques | F_CHART_EXTERNAL |
| Gestion de concept | F_CONCEPT_MANAGEMENT |
| Gestion de constante | F_CONSTANT_MANAGEMENT |
| Copier un élément Excel | F_COPY_EXCEL_ITEM_ADMINISTRATION |
| Créer et télécharger une sauvegarde | F_DASHBOARD_DOWNLOAD_BACKUP |
| Verrouillage de l'administration des données | F_DATAADMIN_LOCK |
| Déverrouillage de l'administration des données | F_DATAADMIN_UNLOCK |
| Supprimer un attribut | F_ATTRIBUTE_DELETE |
| Supprimer un groupe d'options de catégorie | F_CATEGORY_OPTION_GROUP_DELETE |
| Supprimer un ensemble de groupes d'options de catégorie | F_CATEGORY_OPTION_GROUP_SET_DELETE |
| Supprimer un graphique | F_CHART_DELETE |
| Supprimer un concept | F_CONCEPT_DELETE |
| Supprimer une constante | F_CONSTANT_DELETE |
| Supprimer un élément de donnée | F_DATAELEMENT_DELETE |
| Supprimer une catégorie d'élément de donnée | F_CATEGORY_DELETE |
| Supprimer une combo de catégories d'élément de donnée | F_CATEGORY_COMBO_DELETE |
| Supprimer des groupes d'éléments de données | F_DATAELEMENTGROUP_DELETE |
| Supprimer des ensembles de groupes d'éléments de données | F_DATAELEMENTGROUPSET_DELETE |
| Supprimer un ensemble de données | F_DATASET_DELETE |
| Supprimer une valeur de donnée | F_DATAVALUE_DELETE |
| Supprimer un document | F_DOCUMENT_DELETE |
| Supprimer un modèle Excel | F_EXCEL_TEMPLATE_MANAGEMENT_DELETE |
| Supprimer un établissement | F_FRED_DELETE |
| Supprimer un indicateur | F_INDICATOR_DELETE |
| Supprimer un groupe d'indicateurs | F_INDICATORGROUP_DELETE |
| Supprimer des ensembles de groupes d'indicateurs | F_INDICATORGROUPSET_DELETE |
| Supprimer un type d'indicateur | F_INDICATORTYPE_DELETE |
| Supprimer un lieu | F_LOCALE_DELETE |
| Supprimer la règle Min/max | F_DATAELEMENT_MINMAX_DELETE |
| Supprimer un ensemble d'options | F_OPTIONSET_DELETE |
| Supprimer une unité d'organisation | F_ORGANISATIONUNIT_DELETE |
| Supprimer un groupe d'unités d'organisation | F_ORGUNITGROUP_DELETE |
| Supprimer un ensemble de groupes d'unités d'organisation | F_ORGUNITGROUPSET_DELETE |
| Supprimer un programme | F_PROGRAM_DELETE |
| Supprimer un attribut de programme | F_PROGRAM_ATTRIBUTE_DELETE |
| Supprimer l'inscription au programme | F_PROGRAM_INSTANCE_DELETE |
| Supprimer une étape du programme | F_PROGRAMSTAGE_DELETE |
| Supprimer une section de l'étape du programme | F_PROGRAMSTAGE_SECTION_DELETE |
| Supprimer un type de relation | F_RELATIONSHIPTYPE_DELETE |
| Supprimer un rapport | F_REPORT_DELETE |
| Supprimer un tableau de rapport | F_REPORTTABLE_DELETE |
| Supprimer une section | F_SECTION_DELETE |
| Supprimer un SMS | F_MOBILE_DELETE_SMS |
| Supprimer une vue SQL | F_SQLVIEW_DELETE |
| Supprimer une entité suivie | F_TRACKED_ENTITY_DELETE |
| Supprimer un attribut d'entité suivie | F_TRACKED_ENTITY_ATTRIBUTE_DELETE |
| Supprimer la valeur de l'attribut d'entité suivie | F_TRACKED_ENTITY_ATTRIBUTEVALUE_DELETE |
| Supprimer la valeur de données de l'entité suivie | F_TRACKED_ENTITY_DATAVALUE_DELETE |
| Supprimer un formulaire d'entité suivie | F_TRACKED_ENTITY_FORM_DELETE |
| Supprimer une instance d'entité suivie | F_TRACKED_ENTITY_INSTANCE_DELETE |
| Supprimer un commentaire sur l'instance d'entité suivie | F_TRACKED_ENTITY_COMMENT_DELETE |
| Supprimer une visite de l'instance d'entité suivie | F_PROGRAM_STAGE_INSTANCE_DELETE |
| Supprimer la relation d'une l'entité suivie | F_RELATIONSHIP_DELETE |
| Supprimer un utilisateur | F_USER_DELETE |
| Supprimer un groupe d'utilisateurs | F_USERGROUP_DELETE |
| Supprimer le rôle de l'utilisateur | F_USERROLE_DELETE |
| Supprimer un utilisateur au sein d'un groupe géré | F_USER_DELETE_WITHIN_MANAGED_GROUP |
| Supprimer des critères de validation | F_VALIDATIONCRITERIA_DELETE |
| Supprimer une règle de validation | F_VALIDATIONRULE_DELETE |
| Supprimer un groupe de règles de validation | F_VALIDATIONRULEGROUP_DELETE |
| Supprimer les éléments de données en double | F_ELIMINATE_DUPLICATE_DATA_ELEMENTS |
| Administration des rapports Excel | F_EXCEL_REPORT_ADMINISTRATION |
| Exécuter une vue SQL | F_SQLVIEW_EXECUTE |
| Exporter le plan d'activité vers le fichier XLS | F_ACTIVITY_PLAN_EXPORT |
| Exporter des données | F_EXPORT_DATA |
| Exporter des événements | F_EXPORT_EVENTS |
| Exporter des méta-données | F_METADATA_EXPORT |
| Générer des plans d'activités | F_GENERATE_ACTIVITY_PLANS |
| Générer des valeurs min-max | F_GENERATE_MIN_MAX_VALUES |
| Produire un rapport statistique des programmes | F_GENERATE_STATISTICAL_PROGRAM_REPORT |
| Produire un rapport de synthèse des programmes | F_GENERATE_PROGRAM_SUMMARY_REPORT |
| Produire un rapport tabulaire des entités suivies | F_GENERATE_BENEFICIARY_TABULAR_REPORT |
| Importer des données | F_IMPORT_DATA |
| Importer des événements | F_IMPORT_EVENTS |
| Importer à partir d'autres systèmes | F_IMPORT_OTHER_SYSTEMS |
| Importer un fichier GML | F_IMPORT_GML |
| Importer des méta-données | F_METADATA_IMPORT |
| Insérer un script Java et une feuille de style CSS personnalisés | F_INSERT_CUSTOM_JS_CSS |
| Lister les modèles Excel | F_EXCEL_TEMPLATE_MANAGEMENT_LIST |
| Lister les instances d'entité suivie | F_TRACKED_ENTITY_INSTANCE_LIST |
| Lister les groupes d'utilisateurs | F_USERGROUP_LIST |
| Lister les rôles des utilisateurs | F_USERROLE_LIST |
| Charger les messages de rappel des événements | F_PROGRAM_STAGE_INSTANCE_REMINDER |
| Charger l'historique de l'instance d'entité suivie | F_TRACKED_ENTITY_INSTANCE_HISTORY |
| Verrouiller un ensemble de données | F_DATASET_LOCK |
| Gérer les voies d'intégration | F_MANAGE_INTEGRATION_ROUTES |
| Gérer des indicateurs du programme | F_PROGRAM_INDICATOR_MANAGEMENT |
| Gérer la règle du programme | F_PROGRAM_RULE_MANAGEMENT |
| Gérer des entités suivies | F_TRACKED_ENTITY_MANAGEMENT |
| Gérer les rappels des instances d'entité suivie | F_TRACKED_ENTITY_INSTANCE_REMINDER_MANAGEMENT |
| Accès externe à la cartes | F_MAP_EXTERNAL |
| Fusionner des unités d'organisation | F_MERGE_ORGANISATION_UNITS |
| Déplacer une unité d'organisation | F_ORGANISATIONUNIT_MOVE |
| Saisie de données individuelles multiples | F_NAME_BASED_DATA_ENTRY |
| Gestion des ensembles d'options | F_OPTIONSET_MANAGEMENT |
| Enregistrement d'une unité d'organisation | F_ORGANISATION_REGISTRATION |
| Effectuer des tâches de maintenance | F_PERFORM_MAINTENANCE |
| Inscription au programme | F_PROGRAM_ENROLLMENT |
| Gestion des événements du programme | F_PROGRAM_INSTANCE_MANAGEMENT |
| Gestion des sections d'une étape du programme | F_PROGRAMSTAGE_SECTION_MANAGEMENT |
| Gestion du suivi des programmes | F_PROGRAM_TRACKING_MANAGEMENT |
| Désinscription au programme | F_PROGRAM_UNENROLLMENT |
| Réduire la taille des unités d'organisation | F_PRUNE_ORGANISATION_UNITS |
| Supprimer les événements des entités suivies vides | F_TRACKED_ENTITY_REMOVE_EMPTY_EVENTS |
| Renommer le fichier modèle Excel | F_EXCEL_TEMPLATE_MANAGEMENT_RENAME |
| Accès externe au tableau des rapports | F_REPORTTABLE_EXTERNAL |
| Excuter la validation | F_RUN_VALIDATION |
| Administration de la planification | F_SCHEDULING_ADMIN |
| Programmation du générateur de requêtes agrégées | F_SCHEDULING_CASE_AGGREGATE_QUERY_BUILDER |
| Planification de l'envoi des messages | F_SCHEDULING_SEND_MESSAGE |
| Recherche d'un plan d'activités | F_ACTIVITY_PLAN |
| Recherche d'événements sans inscription | F_PROGRAM_STAGE_INSTANCE_SEARCH |
| Recherche d'un événement avec inscription | F_PROGRAM_TRACKING_SEARCH |
| Recherche d'une instance d'entité suivie | F_TRACKED_ENTITY_INSTANCE_SEARCH |
| Recherche d'instances d'entité suivie dans toutes les unités d'organisation | F_TRACKED_ENTITY_INSTANCE_SEARCH_IN_ALL_ORGUNITS |
| Voir le module API | M_dhis-web-api |
| Voir le module Application Maintenance | M_dhis-web-maintenance-appmanager |
| Voir le module Nettoyeur de cache du navigateur | M_dhis-web-cache-cleaner |
| Voir le module Intégration du tableau de bord | M_dhis-web-dashboard-integration |
| Voir le module Tableau de bord | M_dhis-web-dashboard |
| Voir le module Administration de données | M_dhis-web-maintenance-dataadmin |
| Voir le module Maintenance des éléments de données et des indicateurs | M_dhis-web-maintenance-datadictionary |
| Voir le module Saisie de données | M_dhis-web-dataentry |
| Voir le module Entrepôt de données | M_dhis-web-datamart |
| Voir le module Maintenance des ensembles de données | M_dhis-web-maintenance-dataset |
| Voir le module Visualiseur de données | M_dhis-web-visualizer |
| Voir le module Saisie d'événements | M_dhis-web-event-capture |
| Voir le module Rapports d'événements | M_dhis-web-event-reports |
| Voir le module Visualiseur d'événements | M_dhis-web-event-visualizer |
| Voir le module Rapport Excel | M_dhis-web-excel-reporting |
| Voir le module Exporter un entrepôt de données | M_dhis-web-exportdatamart |
| Voir le module API FRED | M_dhis-web-api-fred |
| Voir le module SIG | M_dhis-web-gis |
| Voir le module SIG | M_dhis-web-mapping |
| Voir le module Import-Export | M_dhis-web-importexport |
| Voir les dossiers individuels | M_dhis-web-caseentry |
| Voir le module Light | M_dhis-web-light |
| Voir le module Saisie de données des listes sommaires | M_dhis-web-dataentry-national |
| Voir le module Maintenance mobile | M_dhis-web-maintenance-mobile |
| Voir le module Rapports NRHM | M_dhis-web-reports |
| Voir le module Maintenance des unités d'organisation | M_dhis-web-maintenance-organisationunit |
| Voir le module Tableau croisé dynamique | M_dhis-web-pivot |
| Voir le module Rapport | M_dhis-web-reporting |
| Voir le module Maintenance des paramètres | M_dhis-web-maintenance-settings |
| Voir le module Smartphone | M_dhis-web-mobile |
| Voir le module SMS | M_dhis-web-sms |
| Voir le module Entité suivie et programmes | M_dhis-web-maintenance-program |
| Voir le module Saisie Tracker | M_dhis-web-tracker-capture |
| Voir le module Maintenance des utilisateurs | M_dhis-web-maintenance-user |
| Voir le module Analyse de validation | M_dhis-web-validationrule-local-in |
| Voir le module Règle de validation | M_dhis-web-validationrule |
| Envoyer un message | F_SEND_MESSAGE |
| Envoyer un SMS | F_MOBILE_SENDSMS |
| Définir le paramètre mobile | F_MOBILE_SETTINGS |
| Événement unique sans saisie de données d'inscription | F_ANONYMOUS_DATA_ENTRY |
| Événement unique avec saisie de données d'inscription | F_SINGLE_EVENT_DATA_ENTRY |
| Accès externe à la vue Sql | F_SQLVIEW_EXTERNAL |
| Gestion de la vue Sql | F_SQLVIEW_MANAGEMENT |
| Agrégation des entités suivies | F_TRACKED_ENTITY_AGGREGATION |
| Gestion des formulaires d'entités suivies | F_TRACKED_ENTITY_FORM_MANAGEMENT |
| Tableau de bord des instances d'entité suivie | F_TRACKED_ENTITY_INSTANCE_DASHBOARD |
| Gestion des instances d'entité suivie | F_TRACKED_ENTITY_INSTANCE_MANAGEMENT |
| Gestion des relations des entités suivies | F_RELATIONSHIP_MANAGEMENT |
| Mettre à jour un établissement | F_FRED_UPDATE |
| Mettre à jour un niveau d'unité d'organisation | F_ORGANISATIONUNITLEVEL_UPDATE |
| Mettre à jour une règle de programme | F_PROGRAM_RULE_UPDATE |
| Mettre à jour le type de relation | F_RELATIONSHIPTYPE_UPDATE |
| Mettre à jour des entités suivies | F_TRACKED_ENTITY_UPDATE |
| Mettre à jour l'attribut de l'entité suivie | F_TRACKED_ENTITY_ATTRIBUTE_EDIT |
| Téléverser un modèle Excel | F_EXCEL_TEMPLATE_MAMAGEMENT_UPLOAD |
| Afficher et rechercher les attributs et les identificateurs des entités suivies | F_ACCESS_TRACKED_ENTITY_ATTRIBUTES |
| Afficher le navigateur de données | F_VIEW_DATABROWSER |
| Consulter le rapport d'exhaustivité de l'étape du programme | F_PROGRAM_STAGE_COMPLETENESS |
| Afficher le suivi des programmes | F_PROGRAM_TRACKING_LIST |
| Consulter le rapport | F_REPORT_VIEW |
| Voir l'attribut d'entité suivie | F_TRACKED_ENTITY_ATTRIBUTE_VIEW |
| Consulter les données non approuvées | F_VIEW_UNAPPROVED_DATA |
| Afficher l'utilisateur | F_USER_VIEW |
| Afficher le groupe d'utilisateurs gérant les relations | F_USERGROUP_MANAGING_RELATIONSHIPS_VIEW |
| Afficher l'utilisateur au sein d'un groupe géré | F_USER_VIEW_WITHIN_MANAGED_GROUP |
| Supprimer une instance d'entité suivie ainsi que les inscriptions et événements associés | F_TEI_CASCADE_DELETE |
| Supprimer une inscription et l'événement associé | F_ENROLLMENT_CASCADE_DELETE |
| Modifier des données expirées | F_EDIT_EXPIRED |
Ce chapitre traite de la fonction de partage des entités dans le DHIS2.
Many objects in DHIS2, like reports, charts, maps and indicators, can be shared. DHIS2 supports sharing of metadata or sharing of data. Sharing of metadata means making an object, like a report, available for reading or modification to a group of users or to everyone. Sharing of data means making the actual data captured available to others, and controlling who can capture that kind of data. For instance for reports, the sharing dialog can be opened by clicking on the "Sharing settings" button next to each report in the list. Implementers can use this feature to allow access to certain objects to only certain user groups. Users can use the feature to decide who they would like to share objects (such as pivot tables, charts, dashboards, etc) with.
If sharing is supported for a particular class of objects, a dialog will be available called "Sharing settings", usually available by clicking on the name of the object or in the analytics tools, through an icon (Share with other people). Once you have accessed the sharing settings for the object you wish to share, a dialog similar to the one below will be shown.
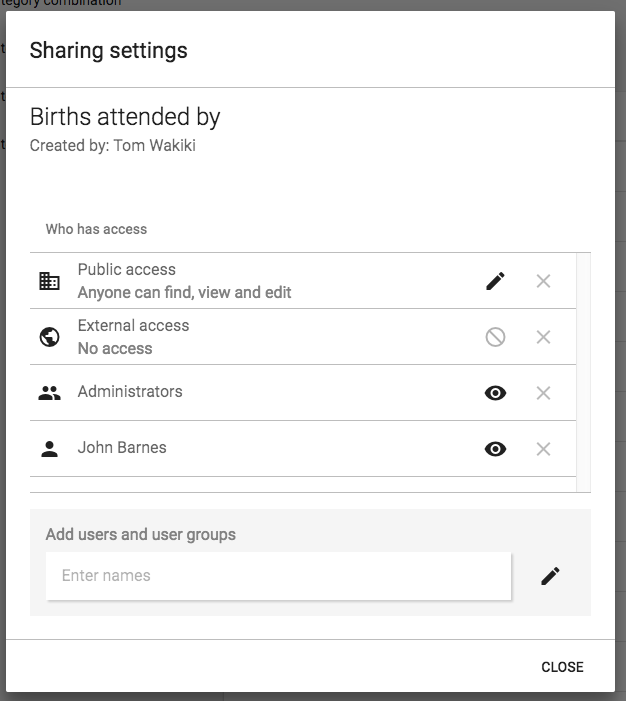
You can share your report with everyone or with a number of user groups. "External access" can be enabled to allow this resource to be shared with everyone, including users which cannot logon to DHIS2. This is useful for sharing public resources with external systems. Note, that if objects are shared externally, then they are visible to anyone who has access to the URL which provides the resource without any login credentials.
Next to "Public access" you can choose your public access option under "METADATA": "No access", "Can view only" or "Can edit and view", and under "DATA": "No access", "Can view data", "Can capture data". Public access refers to users which are logged into the system. Edit also implies deleting the report.
To share with a group, simply start typing the name of the group and the "Search for user groups" input field and select your desired group. Click on the "+" icon next to the input field to share with that group. For each group you can set an access option, similar to public access.
Sharing with a user group implies that all users in that group will get access to the shared object. To create a user group you can go to the dashboard module and click on "Groups". This will lead you to the list of groups where you can click "Add new" in the top right corner. Creating user groups is open for everyone from the dashboard module.
The objects which support metadata sharing are indicator, indicator group, indicator group set, data dictionary, data set, program, standard report, resource, report table, chart, map and user group. Out of those objects, report table, chart, map and user group are open for everyone to create privately. Private means that the objects are available only to yourself or potentially to a number of user groups if you choose to share the object. These objects are referred to as "open" objects and can be created by all users. The remaining objects require that your user account has the authority to create them. These objects are referred to as "non-open" objects.
A user can be granted the authority to create publicly accessible objects or privately accessible objects. In order to create a publicly accessible object (available for viewing or editing by anyone) your user account must have the authority to do so. As an example, to create a publicly accessible chart, your user must have the "Create public chart" authority granted. The authority to create private objects applies only to non-open objects. For example, to allow a user to create indicators which will only be accessible to that user and not to everyone, the user can be issued with the "Create private indicator" authority.
Sharing a non-open object with another person and let her edit the object requires that the person's user account has the authority for updating that type of objects granted. For instance, if you want to let another person edit your indicator, that person's user account must have the "Update indicator" authority granted. This does not apply for open objects.
When you create a new object it will automatically become viewable for everyone if your user account has the authority to create public objects. As an example, if you create a standard report and you have the "Create public standard report" authority granted, the report will become viewable for everyone. If you do not have that authority granted the report will be viewable only to yourself. After you have created an object, you may navigate to the "Sharing settings" dialog and set your desired access control level.
If you need a user account which is able to view absolutely all objects you can create a user role with the "ALL" authority and assign a user to that role. If you need to switch between a "complete" view of objects and a "personal" view of objects it is recommended to create two user accounts, one assigned with the "ALL" authority and one without.
The metadata sharing functionality is useful in several scenarios. One use-case is setting up a DHIS2 instance for a global organisation with operations in multiple countries. Typically the organisation has a set of global data sets, indicators and reports which should apply to all countries, while all countries will have the need for country-specific data sets, indicators and reports. In this scenario the following approach could work:
Créez un groupe d'utilisateurs pour le personnel mondial.
Créez un groupe d'utilisateurs pour le personnel dans chaque pays.
Create global data sets and reports, make them viewable for everyone and editable for the global user group only.
Create country-specific data sets and reports, make them viewable and editable for the country user group and the global user group only.
This way, the global indicators and reports could be viewed and analysed by everyone, but maintained by the global user group only. The country-specific data sets, indicators and reports could be viewed and maintained by the country and global personnel, without being visible or impacting the system for other countries in the organisation.
A similar approach could work for a scenario with a donor, multiple funding agencies and implementing partners in a country, where user groups could be set up for each of those entities. That way each implementing partner could create and share their reports within their organisation without affecting or allowing access to others. Reports could also be shared with supervisors and funding agencies at the end of reporting periods.
Another use-case is a country department of health with multiple health programs. Typically there is a need for having general reports and charts for the department while allowing the health programs to develop specific reports and charts for internal use. This can be achieved by creating user groups for each health program. Later, when developing reports and charts, these can be made viewable and editable to the program user group only. This way the reports will not be visible to other programs and users. This is beneficial because the reports are kept internal to the program and because the visible list of reports of other users are kept shorter and more relevant.
The objects which support data sharing are data set, tracked entity type, program and program stage. The purpose of data sharing is to control which users can capture data, and which users can see the data captured.
Applies to the object types of tracked entity type, program and program stage. When working with single event programs in event capture, a user will have to possess the "DATA:Can view data" sharing level to see the program and its data. Without this sharing level, the program and its data will not be visible to the user. When working with tracker programs in tracker capture, the user will need to have "DATA:Can view data" to both the tracked entity type and program. In case of a tracker program, the user will also need "DATA:Can view data" on each program stage individually to be able to see the data within the program. To capture data the user needs the "DATA:Can capture data" sharing level.
Note
To see and capture data for a program, a data capture user also needs to report for an organisation unit to where the program has been assigned.
| Type d'objet | Peut visualiser les données | Peut saisir des données | Commentaire |
|---|---|---|---|
Type d'entité suivie |
|
| |
Programme |
|
| "Peut visualiser les données" et "Peut saisir des données" exigent également que l'utilisateur ait "Peut visualiser les données" pour le type d'entité suivie. |
Étape du programme |
|
| "Peut visualiser les données" et "Peut saisir des données" exigent également que l'utilisateur ait "Peut visualiser les données"pour le programme et le type d'entité suivie. |
| Type d'objet | Peut visualiser les données | Peut saisir des données | Commentaire |
|---|---|---|---|
Programme |
|
|
Applies to the object types of data set and category option . When working in Data Entry app, the user will need to have "DATA:Can capture data" to both see and capture data in the data set. To save data for an entry field in Data Set users need:
Authority: F_DATAVALUE_ADD ( Can add data value )
L'ensemble de données est partagé avec "Données : Peut saisir des données".
L'élément de données est partagé avec les "Métadonnées" : Peut consulter".
All Category Options used by selected Data Set are shared with "Data: Can capture data"
Note
To see and capture data for a data set, a data capture user also needs to report for an organisation unit to where the data set has been assigned.
| Type d'objet | Peut visualiser les données | Peut saisir des données | Commentaire |
|---|---|---|---|
Ensemble de données |
|
| Pour sauvegarder la valeur des données dans l'application de saisie de données, les utilisateurs ont également besoin de "Peut saisir des données" ; pour les options de catégorie dans l'ensemble de données sélectionné. |
| Option de catégorie |
|
| Pour que la Combo d'options de catégorie et la Combo d'options d'attribut soient accessibles en écriture, toutes les Options de category doivent être partagées avec "Peut saisir des données" ;. |
Setting up the Maps simply means storing coordinates for the organisation units you want to show on the map in the database. Coordinates are often distributed in proprietary formats and will need to be converted to a format which DHIS2 understands. ESRI shapefiles are the most common geospatial vector data format for desktop applications. You might find shapefiles for your country here or in many other geospatial data repositories on the web. Some amount of work needs to be done in order to use these coordinates in DHIS2 GIS, namely transforming the data into a suitable format and ensuring the name which are contained in the geospatial data match exactly with the names of the organization units which they should be matched to.
If you go to the organisation unit module and edit one of the units, you can see a text field called Coordinates. Here you may fill in its coordinates directly (geojson format) which is useful if you just want to update a couple of units.
An example point/facility coordinate:
[29.341,-11.154]
An example polygon/area coordinates string:
[[[[29.343,-11.154],[28.329,-11.342],[28.481,-10.239],[29.833,-10.412]]]]
However, if you are going to e.g. add coordinates for all units at a certain level you don't want to do that manually. This is where the automatic GML import comes into play and the following section explains the preferred way of using it.
Important
The only co-ordinate reference system supported by DHIS2 is EPSG:4326, also known as geographic longitude/latitude. Coordinates must be stored with the longitude (east/west position) proceeding the latitude (north/south position). If your vector data is in a different CRS than EPSG 4326, you will need to re-project the data first before importing into DHIS2.
Étape 1 - Simplifier/généraliser vos données géographiques
The boundaries in geographical data files are usually very accurate, too much so for the needs of a web-based GIS. This usually does not affect the performance when using GIS files on a local system, but it is usually necessary to optimize the geographical data for the web-based GIS system of DHIS2. All geographical data needs to be downloaded from the server and rendered in a browser, so if the data is overly complex, the performance of the DHIS2 GIS will be negatively impacted. This optimization process can be described as follows:
Coordinates: The number of significant decimal digits (e.g. 23.02937874993774) should be shortened to fewer digits (e.g. 23.03). Although this will result in some inaccuracies on the map, given the usual scale at which maps in DHIS2 are produced (> 1:50,000), the loss of precision should not be noticeable. Normally, no more than four significant digits after the decimal point should be necessary., Polygons: In addition to shortening the number of significant digits, the actual number of points should also be reduced to an optimal level. Finding this optimal level may take a bit of experimentation. Decreasing the precision of the points as well as the number of points through generalization, will lead to degradation of the polygon. However, after a bit of experimentation, an optimal level of generalization can be found, where the accuracy of the polygon is visually acceptable, and the performance of the GIS is optimal.
For polygons, we need to make the boundary lines less detailed by removing some of the line points. Make a backup of your shapefiles before you start. One possible method is the use of MapShaper which is an online tool which can be used to generalize geographical data. To use MapShaper, simply upload your shapefile to the site. Then, at the centre bottom you see a slider that starts at 0%. It is usually acceptable to drag it up to about 80%. In the left menu you can check "show original lines" to compare the result and you may want to give a different simplification method a try. When you are happy with the result, click "export" in the top right corner. Then check the first of the four options called "Shapefile - polygons", click "create" and wait for the download buttons to appear. Now, download the two files to your local computer and overwrite the existing ones. Move on to the next step with your new simplified shapefile.
Étape 2 - Convertir le Shapefile en GML
The recommended tool for geographical format conversions is called "ogr2ogr". This should be available for most Linux distributions sudo apt-get install gdal-bin. For Windows, go to http://fwtools.maptools.org/and download "FWTools", install it and open up the FWTools command shell. During the format conversion we also want to ensure that the output has the correct coordinate projection (called EPSG:4326 with geographic longitude and latitude). For a more detailed reference of geographic coordinates, please refer to this site. If you have already reprojected the geographic data to the geographic latitude/longitude (EPSG:4326) system, there is no need to explicitly define the output coordinate system, assuming that ogr2ogr can determine the input spatial reference system. Note that most shapefiles are using the EPSG:4326 system. You can determine the spatial reference system by executing the following command.
ogrinfo -al -so filename.shp
Assuming that the projection is reported to be EPSG:27700 by ogrinfo, we can transform it to EPSG:4326 by executing the following command.
ogr2ogr -s_srs EPSG:27700 -t_srs EPSG:4326 -f GML filename.gml filename.shp
If the geographic data is already in EPSG:4326, you can simply transform the shapefile to GML by executing the following command.
ogr2ogr -f GML filename.gml filename.shp
Vous trouverez le fichier GML créé dans le même dossier que le fichier Shapefile.
Étape 3 - Préparer le fichier GML
Unfortunately, the GML file is not ready for importation yet. Open it in a robust text editor like Geany (Linux) or Notepad++ (Windows). GML is an XML based format which means that you will recognize the regular XML tag hierarchy. In the GML file an organisation unit is represented as a \<gml:featureMember>. Inside the feature members we usually find a lot of attributes, but we are just going to import their coordinates.
In order to import geospatial data from the feature members of the GML input, DHIS2 must match each of them with an organisation unit in its database. The feature member element must, in other words, contain a reference to its corresponding organisation unit. The reference itself must be one of three possible DHIS2 identifiers: uid, code or name. The identifier of choice must be provided as a property for each feature member element. The importer will look for a property with the local name of either Uid, Code or Name, e.g. "ogr:Name" or "anyPrefix:Code".
If your feature members already contain a property of the identifier you wish to use (such as the name of an area) you can use search and replace in a text editor to rename these elements to a name DHIS2 will recognize (see the below table). This is typically a workflow which is applicable when using the name as the identifier (the source shapefile or even GML will usually contain the name for each area it defines).
| Priorité de correspondance | Identificateur | Orthographes valides | Unique garanti |
|---|---|---|---|
| 1 | Uid | uid, Uid, UID | Oui |
| 2 | Code | code, Code, CODE | Non |
| 3 | Nom | nom, Nom, NOM | Non |
In the case of renaming properties one would usually find a tag named something like "ogr:DISTRICT_NAME", "ogr:NAME_1" and rename it to "ogr:Name". If using the code or uid identifiers on the other hand, looking up the correct values in the DHIS2 database and going through the GML file, adding the properties for each corresponding feature member might be necessary. In any of the cases it is important to realize that the identifier used must uniquely identify an organisation unit (e.g. if there are two organisation units in the database of the same name or code, these cannot be matched properly on either). As uid is the only guaranteed-to-be-unique identifier it is the most robust choice. However, as matching on name is usually easier (given that the name is already part of your data), a viable approach to solving uniqueness conflicts can be to match any non-uniquely named organisation units on a different identifier (uid, preferably) and the rest on their names.
As can be seen in the above table there is a matching priority, meaning is any two or more identifiers are provided for the same feature member, matching will be performed on the highest priority identifier. Note also the valid properties which can be used in you GML. The namespace prefix is not important as only the local name is used.
A common pitfall of performing preparation of the GML files is syntax- or element naming errors. Therefore please make sure that all properties of the GML file are started and terminated with correctly corresponding tags. Also make sure the properties follow either of the given valid spellings of the property name. The identifying properties are supposed to look like e.g. \<ogr:Name>Moyamba District\</ogr:Name>, \<somePrefix:uid>x7uuia898nJ\</somePrefix:uid> or \<CODE>OU_12345\</CODE>. Another common error is not making sure the identifier matches exactly, especially when using the name property. All matches are performed on exact values, meaning that "Moyamba" in a source GML file would not be matched against "Moyamba District" in the database.
Have a brief look at the identifiers and compare them to the corresponding values in the database. If they seem to match fairly good, it is about time to do a preview in the import-export module.
Go to Services -> Import-Export, select "Preview", select the GML file and click "Import". Look for new/updated organisation units. Our intention is to add coordinates to already existing organisation units in the database, so we want as many updates as possible and 0 new. Those listed as new will be created as root units and mess up the organisation unit trees in DHIS2. If any listed as new, click the number and the organisation units in question will appear in the list below. If there are any slight misspellings compared to the organisation unit names in the database - fix them and do the preview again. Otherwise, click the "discard all" button below the list and then the "Import all" button above the list.
If the import process completes successfully, you should now be able to utilize the geographical data in the DHIS2 GIS. If not, check the log for hints and look for common errors such as:
- Name duplicates in the GML file. The name column in the database is unique and does not accept two organisation units with the same name.
- The "shortname" column in the organisationunit table in your database has a too small varchar definition. Increase it to 100.
- Special name characters in the GML file. Be sure to convert these to appropriate XML equivalents or escape sequences.
- Entrée GML mal formatée, balises non concordantes
In the bigger picture of HIS terminology all data in DHIS2 are usually called aggregated as they are aggregates (e.g. monthly summaries) of medical records or some kind of service registers reported from the health facilities. Aggregation inside DHIS2 however, which is the topic here, is concerned with how the raw data captured in DHIS2 (through data entry or import)are further aggregated over time (e.g. from monthly to quarterly values) or up the organisational hierarchy (e.g. from facility to district values).
Raw data refers to data that is registered into the DHIS2 either through data entry or data import, and has not been manipulated by the DHIS2 aggregation process. All these data are stored in the table (or Java object if you prefer) called DataValue.
Aggregated data refers to data that has been aggregated by the DHIS2, meaning it is no longer raw data, but some kind of aggregate of the raw data.
Indicator values can also be understood as aggregated data, but these are special in the way that they are calculated based on user defined formulas (factor * numerator/denominator). Indicator values are therefore processed data and not raw data, and are located in the aggregatedindicatorvalue table/object. Indicators are calculated at any level of the organisational hierarchy and these calculations are then based on the aggregated data values available at each level. A level attribute in the aggregateddatavalue table refers to the organisational level of the orgunit the value has been calculated for.
Period and Period type are used to specify the time dimension of the raw or aggregated values, and data can be aggregated from one period type to another, e.g. from monthly to quarterly, or daily to monthly. Each data value has one period and that period has one period type. E.g. data values for the periods Jan, Feb, and Mar 2009, all of the monthly period type can be aggregated together to an aggregated data value with the period Q1 2009 and period type Quarterly.
Data (raw) can be registered at any organisational level, e.g. at national hospital at level 2, a health facility at level 5, or at a bigger PHC at level 4. This varies form country to country, but DHIS2 is flexible in allowing data entry or data import to take place at any level. This means that orgunits that themselves have children can register data, sometimes the same data elements as their children units. The basic rule of aggregation in DHIS2 is that all raw data is aggregated together, meaning data registered at a facility on level 5 is added to the data registered for a PHC at level 4.
It is up to the user/system administrator/designer to make sure that no duplication of data entry is taking place and that e.g. data entered at level 4 are not about the same services/visits that are reported by orgunit children at level 5.
NOTE
In some cases you want to have duplication of data in the system, but in a controlled manner. E.g. when you have two different sources of data for population estimates, both level 5 catchment population data and another population data source for level 4 based on census data (because sum of level 5 catchments is not always the same as level 4 census data). Then you can specify using advanced aggregation settings (see further down) that the system should e.g. not add level 5 population data to the level 4 population data, and that level 3,2,1 population data aggregates are only based on level 4 data and does not include level 5 data.
How data is aggregated depends on the dimension of aggregation (see further down).
Along the orgunit level dimension data is always summed up; i.e. simply added together. Note that raw data is never percentages, and therefore can be summed together. Indicator values that can be percentages are treated differently (re-calculated at each level, never summed up).
Along the time dimension there are several possibilities, the two most common ways to aggregate are sum and average. The user can specify for each data element which method to use by setting the aggregation operator (see further down). Monthly service data are normally summed together over time, e.g. the number of vaccines given in a year is the sum of the vaccines given for each month of that year. For population, equipment, staff and other kind of what is often called semi-permanent data the average method is often the one to use, as, e.g. 'number of nurses' working at a facility in a year would not be the sum of the two numbers reported in the six-monthly staffing report, but rather the average of the two numbers. More details further down under 'aggregation operators'.
Organisational units are used to represent the 'where' dimension associated with data values. In DHIS2, organisational units are arranged in a hierarchy, which typically corresponds to the hierarchical nature of the organisation or country. Organisational unit levels correspond to the distinct levels within the hierarchy. For instance, a country may be organized into provinces, then districts, then facilities, and then sub-centres. This organisational hierarchy would have five levels. Within each level, a number of organisational units would exist. During the aggregation process, data is aggregated from the lower organisational unit levels to higher levels. Depending on the aggregation operator, data may be 'summed' or 'averaged' within a given organisational unit level, to derive the aggregate total for all the organisational units that are contained within a higher level organisational unit level. For instance, if there are ten districts contained in a province and the aggregation operator for a given data element has been defined as 'SUM', the aggregate total for the province would be calculated as the sum of the values of the individual ten districts contained in that province.
Periods are used to represent the 'when' dimension associated with data values. Data can easily be aggregated from weeks to months, from months to quarters, and from quarters to years. DHIS2 uses known rules of how these different intervals are contained within other intervals (for instance Quarter 1 2010 is known to contain January 2010, February 2010 an March 2010) in order to aggregate data from smaller time intervals, e.g. weeks, into longer time intervals, e.g. months.
The data element dimension specifies 'what' is being recorded by a particular data value. Data element categories are actually degenerated dimensions of the data element dimension, and are used to disaggregate the data element dimension into finer categories. Data element categories, such as 'Age' and 'Gender', are used to record a particular data element, typically for different population groups. These categories can then be used to calculate the overall total for the category and the total of all categories.
The 'sum' operator simply calculates the sum of all data values that are contained within a particular aggregation matrix. For instance, if data is recorded on a monthly basis at the district level and is aggregated to provincial quarterly totals, all data contained in all districts for a given province and all weeks for the given quarter will be added together to obtain the aggregate total.
When the average aggregation operator is selected, the unweighted average of all data values within a given aggregation matrix are calculated.
It is important to understand how DHIS2 treats null values in the context of the average operator. It is fairly common for some organisational units not to submit data for certain data elements. In the context of the average operator, the average results from the number of data elements that are actually present (therefore NOT NULL) within a given aggregation matrix. If there are 12 districts within a given province, but only 10 of these have submitted data, the average aggregate will result from these ten values that are actually present in the database, and will not take into account the missing values.
The normal rule of the system is to aggregate all raw data together when moving up the organisational hierarchy, and the system assumes that data entry is not being duplicated by entering the same services provided to the same clients at both facility level and also entering an 'aggregated' (sum of all facilities) number at a higher level. This is to more easily facilitate aggregation when the same services are provided but to different clients/catchment populations at facilities on level 5 and a PHC (the parent of the same facilities) at level 4. In this way a facility at level 5 and a PHC at level 4 can share the same data elements and simply add together their numbers to provide the total of services provided in the geographical area.
Sometimes such an aggregation is not desired, simply because it would mean duplicating data about the same population. This is the case when you have two different sources of data for two different orgunit levels. E.g. catchment population for facilities can come from a different source than district populations and therefore the sum of the facility catchment populations do not match the district population provided by e.g. census data. If this is the case we would actually want duplicated data in the system so that each level can have as accurate numbers as possible, but then we do NOT want to aggregate these data sources together.
In the Data Element section you can edit data elements and for each of them specify how aggregation is done for each level. In the case described above we need to tell the system NOT to include facility data on population in any of the aggregations above that level, as the level above, in this case the districts have registered their population directly as raw data. The district population data should then be used at all levels above and including the district level, while facility level should use its own data.
This is controlled through something called aggregation levels and at the end of the edit data element screen there is a tick-box called Aggregation Levels. If you tick that one you will see a list of aggregation levels, available and selected. Default is to have no aggregation levels defined, then all raw data in the hierarchy will be added together. To specify the rule described above, and given a hierarchy of Country, Province, District, Facility: select Facility and District as your aggregation levels. Basically you select where you have data. Selecting Facility means that Facilities will use data from facilities (given since this is the lowest level). Selecting District means that the District level raw data will be used when aggregating data for District level (hence no aggregation will take place at that level), and the facility data will not be part of the aggregated District values. When aggregating data at Province level the District level raw data will be used since this is the highest available aggregation level selected. Also for Country level aggregates the District raw data will be used. Just to repeat, if we had not specified that District level was an aggregation level, then the facility data and district data would have been added together and caused duplicate (double) population data for districts and all levels above.
Resource tables provide additional information about the dimensions of the data in a format that is well suited for external tools to combine with the data value table. By joining the data value table with these resource tables one can easily aggregate along the data element category dimension or data element/indicator/organisation unit groups dimensions. E.g. by tagging all the data values with the category option male or female and provide this in a separate column 'gender' one can get subtotals of male and female based on data values that are collected for category option combinations like (male, \<5) and (male,>5). See the Pivot Tables section for more examples of how these can be used. orgunitstructure is another important table in the database that helps to provide the hierarchy of orgunits together with the data. By joining the orgunitstructure table with the data values table you can get rows of data values with the full hierarchy, e.g. on the form: OU1, OU2, OU3, OU4, DataElement, Period, Value (Sierra Leone, Bo, Badija, Ngelehun CHC, BCG \<1, Jan-10, 32) This format makes it much easier for e.g. pivot tables or other OLAP tools to aggregate data up the hierarchy.
Report tables are defined, cross-tabulated reports which can be used as the basis of further reports, such as Excel Pivot Tables or simply downloaded as an Excel sheet. Report tables are intended to provide a specific view of data which is required, such as "Monthly National ANC Indicators". This report table might provide all ANC indicators for a country, aggregated by month for the entire country. This data could of course be retrieved from the main datamart, but report tables generally perform faster and present well defined views of data to users.
To create a new report table, go to the Report tables section of the Reports module (Reports -> Report Table). Above the list of standard reports, use the "Add report table" or "Add Dataelement Dimension Table" buttons. A regular report table can be used to hold data on data elements, indicators or dataset completeness, while Dataelement dimension tables are used to include data element categories in report tables. Creating the tables are done in the same way, however, the only exception being when choosing data.
To create a report table, you start by making some general choices for the table, the most important of which is the crosstab dimension. Then, you choose which data elements, indicators, datasets or data element dimensions you want to include. Finally you select which organisation units and time periods to use in the report table. Each of these steps are described in detail below.

Recoupement des dimensions
You can cross-tab one or more of the following dimensions: data element/indicator, orgunit, and period, which means that columns will be created based on the values of the dimensions chosen, e.g. if indicators is selected you will get column names in the table reflecting the names of the selected indicators.
For example, if you cross-tab on indicators and periods, the column headers will say "\<indicator title> \<period>". The organisation units will be listed as rows. See screenshot for clarification:

If you cross-tab on indicators and organisation units, the column headers of the table will say "\<indicator title> \<organisation unit>". Now the periods will be listed as rows. See screenshot for clarification:

Note that the options made here regarding crosstab dimensions may have consequences for what options are available when using the report table as a data source later, for example for standard reports.
Ordre de tri
Affects the rightmost column in the table, allows you to choose to sort it low to high or high to low.
Limite maximale
Top limit allow you to set a maximum number of rows you want to include in the report table.
Inclure la régression
This adds additional columns with regression values that can be included in the report design, e.g. in line charts.

Indicateurs/Éléments de données
Here you select the data elements/indicators that you want to include in the report. Use the group filter to more easily find what you are looking for and double click on the items you want to include, or use the buttons to add/remove elements. You can have both data elements and indicators in the same report.
Ensembles de données
Here you select the data sets that you want to include in the report. Including a data set will give you data on the data completeness of the given set, not data on its data elements. Double click on the items you want to include, or use the buttons.
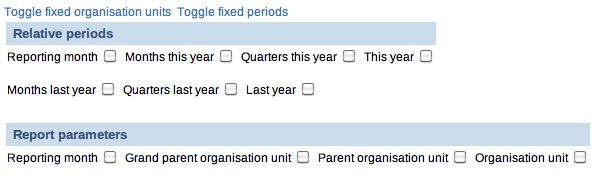
There are two ways to select both what organisation units to include in a report, and what time periods should be included: relative, or fixed. Fixed organisation units and/or periods means that you select the units/periods to include in the report table when you create the report table. Using relative periods, you can select the time and/or units as parameters when the report table is populated, for example when running a standard report or creating a chart. A combination is also possible, for example to add some organisation units in the report permanently while letting the users choose additional. Report parameters is discussed below. In general, using fixed organisation units and/or time periods are an unnecessary restriction.
Unités d'organisation fixes
To add fixed organisation units, click "Toggle fixed organisation units". A panel will appear where you can choose orgunits to always include in the report. If you leave it blank, the users select orgunits when running the report through the use of report parameters. Use the drop down menu to filter organisation units by level, double click or use the buttons to add/remove.
Périodes fixes
To add fixed periods, click "Toggle fixed organisation units". A panel will appear where you can choose periods to always include in the report. If you leave it blank, the users select periods when running the report through the use of report parameters. Use the drop down menu to choose period type (week, month, etc), the Prev and Next button to choose year, and double click or use the buttons to add/remove.
Périodes relatives
Instead of using fixed/static periods like 'Jan-2010' or 'Q1-2010', more generic periods can be used to create reusable report tables, e.g. for monthly reports the period 'Reporting month' will simply pick the current reporting month selected by the user when running the report. Note that all relative periods are relative to a "reporting month". The reporting month is either selected by the users, otherwise the current month is used. Here is a description of the possible relative periods:
Reporting month:
Use this for monthly reports. The month selected in the reporting month parameter will be used in the report.
Months/Quarters this year:
This will provide one value per month or quarter in the year. This is well suited for standard monthly or quarterly reports where all month/quarters need to be listed. Periods that still have no data will be empty, but will always keep the same column name.
This year:
This is the cumulative so far in the year, aggregating the periods from the beginning of the year up to and including the selected reporting month.
Months/Quarters last year:
This will provide one value per month or quarter last year, relative to the reporting month. This is well suited for standard monthly or quarterly reports where all month/quarters need to be listed. Periods that still have no data will be empty, but will always keep the same column name.
Last year:
This is the cumulative last year, relative to the reporting month, aggregating all the periods from last year.
Exemple - périodes relatives
Let's say we have chosen three indicators: A, B and C, and we have also chosen to use the relative periods 'Reporting month' and 'This year' when we created the report table. If the reporting month (selected automatically or by the user) is for example May 2010, the report table will calculate the values for the three selected indicators for May 2010 (= the 'Reporting month') and the accumulated values for the three selected indicators so far in 2010 (= so far 'This year').
Thus, we will end up with six values for each of the organisation units: "Indicator A May 2010", "Indicator B May 2010" "Indicator C May 2010", "Indicator A so far in 2010", "Indicator B so far in 2010" and "Indicator C so far in 2010".
Paramètres du rapport
Report parameters make the reports more generic and reusable over time and for different organisation units. These parameters will pop up when generating the report table or running a report based on the report table. The users will select what they want to see in the report. There are four possible report parameters, and you can select none, all, or any combination.
Reporting month:
This decides which month will be used when the system is choosing the relative periods. If the box it not checked, the user will not be asked for the reporting month when the report is generated - the current month will then be used.
Grand parent organisation unit:
Select the grand parent of all the orgunit children and grand children you want listed in the report. E.g. a selected region will trigger the use of the region itself, all its district, and all their sub-districts.
Parent organisation unit:
Select the parent of all the orgunit children you want listed in the report. E.g. a selected district will trigger the use of the district itself and all its children/sub-districts.
Organisation unit:
This triggers the use of this orgunit in the report. No children are listed.
Exemple - paramètres de rapport
Continuing with the example on relative periods just above, let's say that in addition to 'Reporting month', we have chosen 'Parent organisation unit' as a report parameter when we created the report table. When we're running the report table, we will be asked to select an organisation unit. Now, let's say we choose "Region R" as the organisation unit. "Region R" has the children "District X" and "District Y".
When the report is run, the system will aggregate data for both "District X" and "District Y". The data will be aggregated from the lowest level where they have been collected. The values for the districts will be aggregated further to give an aggregated value for "Region R".
Thus, the report table will generate the six values presented in the previous example, for "District X", "District Y" and "Region R".
These tables enable the use of data element categories in report tables. There are two differences from regular report tables. The first is that it is not possible to select crosstab dimensions, as the columns will always be the disaggregations from the category combinations. The other is the actual choice of data. Only one category combination can be added per report, and only data elements from the same category combo can be selected.
Subtotals and the total will also be included in the table, e.g. a gender (male, female) + EPI age(\<1, >1) category combo would give the following columns: male+\<1, male+>1, Female+\<1, female+>1, male, female,\<1, >1, total.
Sélection des données

Use the drop down menu to choose category combinations. The data elements using this category combination will be listed. Double click to add to the report, or use the buttons.
To make the report tables reusable over time and across orgunits they can have parameters. Four types of parameters are allowed; orgunit, parent orgunit (for listing of orgunits in one area), grand parent orgunit and reporting month. As a side note it can be mentioned that we are looking into expanding this to include reporting quarter and year, or to make that period parameter more generic with regard to period type somehow. The ability to use period as a parameter makes the report table reusable over time and as such fits nicely with report needs such as monthly, quarterly or annual reports. When a report is run by the user in DHIS2, the user must specify the values for the report tables that are linked to the report. First the report table is re-generated (deleted and re-created with updated data), and then the report is run (in the background, in Jasper report engine).
Report tables can consist of values related to data elements, indicators or data completeness, which is related to completeness of reporting across orgunits for a given month. Completeness reports will be covered in a separate section.
There are three dimensions in a report table that identify the data; indicators or data elements, orgunits and periods. For each of these dimensions the user can select which metadata values to include in the report. The user must select one or more data elements or indicators to appear in the report. The orgunit selection can be substituted with a parameter, either one specific orgunit or an orgunit parent (making itself and all its children appear in the report). If one or more orgunits are selected and no orgunit parameter is used, then the report is static with regard to which orgunits to include, which in most cases is an unnecessary restriction to a report.
Utilisation des périodes relatives
The period selection is more advanced as it can in addition to specific periods like Jan-09, Q1-08, 2007 also contain what is called relative periods. As report usually is run routinely over time a specific period like Jan-09 is not very useful in a report. Instead, if you want to design a monthly report, you should use the relative period called Reporting Month. Then you must also include Reporting Month as one of your report parameters to let the system know what exactly is the Reporting Month on the time of report generation. There are many other relative periods available, and they all relate to the report parameter Reporting Month. E.g. the relative period called So far this year refers to the accumulative value for the year incl. the Reporting Month. If you want a trend report with multiple periods in stead of one aggregated period, you can select e.g. 'Months this year', which would give you values for each month so far in the year. You can do a similar report with quarters. The idea is to support as many generic report types as possible using relative periods, so if you have other report needs, please suggest new relative periods on the mailing list, and they might be added to the report table options.
Recoupement des dimensions
Cross tabbing is a very powerful functionality in report design, as the typical DHIS2 data table with references to period, data element/indicator and orgunit makes more advanced report design very difficult, as you cannot put e.g. specific indicators, periods or orgunits on specific columns. E.g. by cross-tabbing on the indicator dimension in an indicator report table you will get the indicator names on the column headers in your report, in addition to a column referencing orgunit, and another column referencing period. With such a table design you could drag and drop indicator names to specific columns or chart positions in the iReport software. Similarly you can cross tab on orgunits or periods to make their names specifically available to report design. E.g. by cross-tabbing on periods and selecting the two relative periods 'Reporting month' and 'This year', you can design reports with both the last month and the accumulative annual value for given month as they will be available as column headers in your report table. It is also possible to combine two dimensions in cross-tabbing, e.g. period and indicator, which makes it possible to e.g. look at three selected indicators for two specific relative periods. This would e.g. make it possible to make a table or chart based report with BCG, DPT3 and Measles coverage, both for the last month and the accumulative coverage so far in the year.
All in all, by combining the functionality of cross tabbing, relative periods and report table parameters you should have a tool to support most report scenarios. If not, we would be very happy to receive suggestions to further improvements to report tables. As already mentioned, we have started to look at more fine-grained parameters for the period dimension as the 'Reporting month' does not cover enough, or at least is not intuitive enough, when it comes to e.g. quarterly reports.
When the report table is run, the system will calculate values for specified indicators/data elements/data sets, orgunits and periods. The data will be presented in DHIS2 in a table layout. The column headers will correspond to the cross-tab dimension you have selected. An example report table showing ANC coverage for a district in The Gambia, is shown below. Here the indicator and the periods are cross-tabbed, as can be seen from the column headers.
Above the table there are six buttons; five download buttons and one Back button. Clicking the Back button will simply take you back to the previous screen. The function of the five download buttons, are presented below the screenshot:

Les cinq boutons de téléchargement
Download as Excel:
Télécharge un fichier Excel généré que vous pouvez ouvrir dans Excel.
Download as CSV:
Downloads a generated .csv file. CSV stands for **C**omma **S**eparated **V**alues. It's a text file with the file ending .csv. Each line in the file corresponds to a row in the table, while the columns are separated with semi colons (;). The file can be opened in a text editor as well as in a spread sheet program (such as Excel).
Download as PDF:
Downloads a generated PDF file. The data will be presented in a similar layout as the generated table you are already viewing in DHIS2.
Download as Report:
Downloads a "styled" PDF file. In addition to present the data in a table layout, this file also presents a chart, showing the aggregated data from all the chosen periods and the parent organisation unit chosen for the report table. The report is generated using the Jasper report engine.
Download as JRXML:
Downloads the design file for the generated Report described in the previous bullet. The design file (with the file ending .jrxml) can be opened in the Jasper iReport Designer software. If you plan to design standard reports, this is the starting point.
données à l'aide de cartes géographiques à thèmes. Vous pouvez y visualiser aussi bien les éléments de données que les indicateurs ; et en supposant que vous disposiez des coordonnées de toutes vos unités d’organisation, vous pouvez parcourir votre hiérarchie organisationnelle et faire apparaitre des cartes pour tous les niveaux à l’aide de polygones ou de points. Toutes les informations affichées sur les cartes sont générées par DHIS 2 ; tout ce que vous devez faire est de procéder à l’enregistrement des coordonnées de vos unités d'organisation pour que les cartes deviennent disponibles. Voir le chapitre spécifique qui traite du SIG pour obtenir plus de détails. { #reporting_standard_reports }
A standard report is a manually designed report that presents data in a manually specified layout. Standard reports can be based either on report tables or SQL queries. Both approaches are described in the following sections. The main advantage of using report tables is that of simplicity - no special development skills are required. In cases where you have special requirements or need to utilize additional parts of the DHIS2 database you might want to use a SQL based standard report. In any case you will be able to utilize report parameters in order to create dynamic reports. The following guide will use the report table approach, while the SQL approach is covered towards the end.
Jasper iReport Designer is a tool for creating reports that can be used as Standard Reports in DHIS2. The tool allows for the creation of standard report templates that can easily be exported from DHIS2 with up to date data. The process of creating reports involves four major steps:
A report table must be created in DHIS2 with the indicators/data elements/datasets to be used in the report.
You have to run the report table and download the design file (Click the "Download as JRXML" button).
Open the downloaded .jrxml file using the free software Jasper iReport Designer to edit the layout of the report.
The edited report can then be uploaded to DHIS2 to be used as a standard report.
If you want to preview your report during the design in iReport, you actually have to upload your file to DHIS2 to see how it looks.
These four steps will be describe in detail in the coming sections. In general, when you are making standard reports you should have a clear idea of how it should look before you even make the report table, as how the report table is designed has implications for how the report can be formatted in iReport. For example, what crosstab dimensions are selected in the report table has consequences for what crosstabs are available for the standard report, and it has consequences for what types of charts you can make.
NOTE
If you have not created a report table yet, you have to do so. See section "How to create report tables" to do so.*
Locate your desired report table and run it by clicking the green circle with a white arrow inside. When the report is shown, click the "Download as JRXML" button to download the design file. Then open that file in the Jasper iReport Designer software.
You are now ready to edit the layout of the report. The main iReport window consists of a "Report Inspector" to the left, the report document in the middle, a "Palette" area on the upper right hand side and a "Properties" area on the lower right hand side. The "Report Inspector" are used for selecting and examining the various properties of the report, and when selecting an item in the inspector, the "Properties" panel changes to display properties relating to the selection. The "Palette" is used for adding various elements, e.g. text boxes, images and charts to the document.
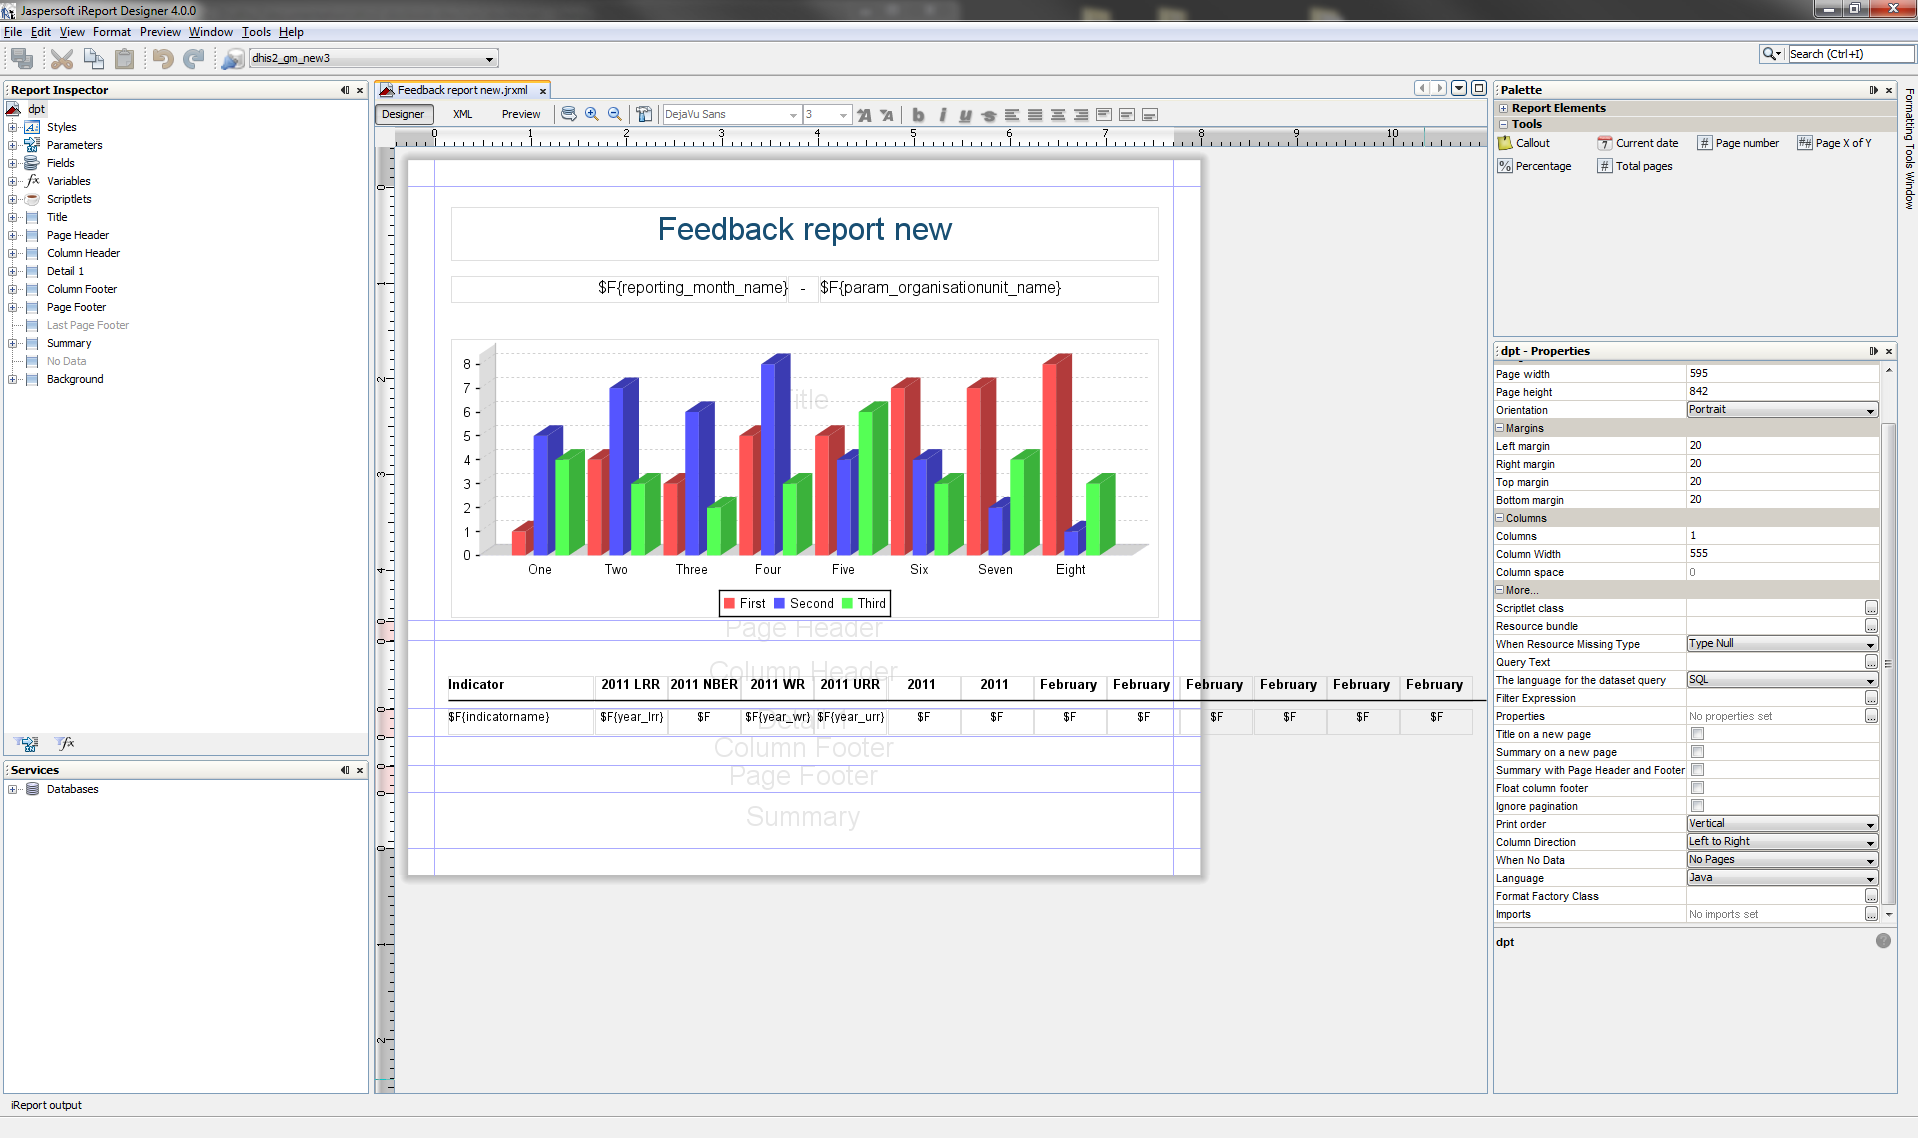
NOTE
If you cannot see the Palette or Properties sidebar, you can enable them from the menu item called "Window" on the menu bar.
The iReport document is divided into seven main bands, divided by layout separators (the blue lines). These lines are used to decide how big each of the areas should be on the report.
Ces zones ont toutes des objectifs différents :
Titre - zone pour le titre du rapport
En-tête de page - zone pour l'en-tête de la page
En-tête de colonne - zone pour les en-têtes de colonne (pour le tableau)
Détail 1 - zone où seront placées les données du rapport proprement dit
Pied de page de la colonne - zone pour créer le pied de page du tableau
Bas de page - zone pour le bas de page
Summary - elements in this area will be placed at the end of the report
By default you will see that only the Title, Column Header and the Detail 1 bands have data. For most reports this is OK. The Title band is suitable for a title and e.g. a chart. Data fields entered into the Detail 1 area will be iterated over to create a table. For example, if a field called "dataelementname" is placed in the Detail 1 band, all data elements in the report table will be listed here. We'll come back to data fields management just a little below.
The unused bands in the report are contracted to add more space for your report data. You can however increase/decrease the band height as you like. There are two ways to do that. The first way is simply to drag the blue band-line as shown below.

The other way to adjust the band height is to select a band in the "Report Inspector", and then adjust the "Band height" value in the "Detail 1 - properties" area in the lower right corner.

As the fields are already present on the report, you probably don't want to do anything than just fix the layout and drag fields around. You can also resize the fields by dragging the side, top or bottom lines. If you want to change the text in the column headers, you simply double click the field and change the text.
To add the a field to the table, we simply drag it to the Detail 1 band from the "Report Inspector". The column header will be added automatically.
By double clicking the box, the text can be edited. The format of the text, such as size, font and alignment, can be adjusted with the tools above the document.

NOTE
Fields starting with "$F" present values that are retrieved from the database every time the report is run. The values here will vary, so do not change these fields unless you want a static value here!
There are two types of text in iReport: «Text labels» and «Text fields» (data fields). They work in different ways, and should be used for different purposes. The main point is that text fields are just placeholders that will be filled with the correct text from the report table when the report is run, while text labels will stay the way they are when the report is run.
Static text are text plain text labels that can be edited normally. There are two ways to edit text labels:
En double-cliquant dans la zone de saisie
By using the Static text properties in the Properties panel

Text fields are formulas that will be filled from the report table when the report is run. Unlike static text, these can not be edited in a normal way. However, they can be manipulated in various ways to ensure that the desired output will be produced. There are three ways to edit the text fields:
En faisant un clic droit sur la zone de texte et en sélectionnant Modifier l'expression
By double clicking the text field (not recommended, as this will not bring up the expression editor)
By using the Text field properties in the Properties panel


Text fields can represent either numbers or text, so that they can be used both for showing for example names of district or for numeric values. It is therefore important the Expression class, seen in the Text field properties matches the Text field expression. For the default text fields in the .jrxml file downloaded from DHIS2 this is not a problem, but it is important when making new text fields. The two most important Expression classes are java.lang.Double for numbers and java.lang.String for text.
For example, let us say you have a quarterly report where you would like to add a new column with the yearly total. You therefore add a new Static text field to the column header band, and a Text field to the details band in. By default, new Text fields are set to java.lang.String (text). However, the yearly total column will be filled with numbers. We therefore have to change the Expression class for the new text field to java.lang.Double:

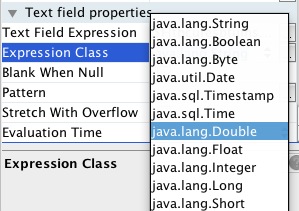
When we edit the text field expression, we see the Expression editor window with all the available columns from the report table. We can see here that each of these are marked with what type they are - text or number. What we need to make sure of is therefore that the expression class we choose for the text field matches the actual expression.
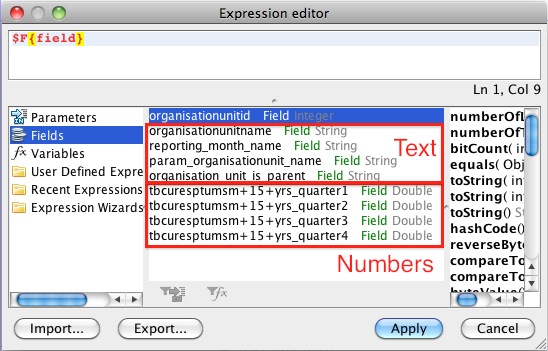
In the default table exported from DHIS2, there are some rows that it might be better to leave out of the table, and some that it would be preferable to have at the end. For example, when making a table based on a report table with the «parent organisation unit» parameter, the default table might have a row with the national level somewhere in between all the regions. In iReport, this can be changed so that the «parent organisation unit» appears at the bottom of the table. This involves two steps that will be explained below. Note that this will not work where there is only one organisation units, and it is therefore most useful when using the «parent organisation unit» or «grand parent organisation unit» parameters in the report table.
We exclude the "parameter organisation unit" from the table by using a property in the Details band called "Print when expression". To set a Print when expression, start by selecting the Detail band in the Report inspector, then edit the Print when expression in the properties panel.

The Expression editor window should now appear. What we must do is to create an expression that checks if the row being generated is the row with the organisation unit given as a parameter. The report table contains a column that we can use for this called organisation_unit_is_parent. To exclude the row with the parameter organisation unit, double click on organisation_unit_is_parent in the list to copy it to the expression area, then add .equals("No") at the end so that the code is:
$F{organisation_unit_is_parent}.equals("No")
This tells the report engine to only print table rows where the organisation unit is not the parent organisation unit.

Instead of removing the "param organisation unit" from the table entirely, it is also possible to put it at the bottom (or top) of the table. This is done by using the sort functionality explained in the next section, and choosing to sort first by "organisation_unit_is_parent". Other sorting options can be added in addition to this, for example to make a list where the param organisation unit is at the bottom of the table, with the other organisation units listed alphabetically above it.
Using the expression editor it is also possible to exclude other rows from the table, in addition to the parent organisation unit as was explained above. In Ghana, for example, all regions have a «fake district» which is the name of the region in square brackets. This can also be excluded from the table using the Print when expression that was introduced above. To to this, follow the instructions above to bring up the Expression editor window. Then, we use Java expressions to test whether or not the row should be hidden.
Exemple - suppression des lignes dont les unités d'organisation commencent par [.
($F{organisationunitname}.charAt( 0 ) != '[')
This makes the report skip any rows where the first character of the organisation unit name is [.
It is also possible to combine several of these expressions. To do this we put the expressions in a parenthesis with the two characters && in between. For example, to make a table that leaves both organisation units whose name starts with [ and the parent organisation unit, we can use the following expression:
($F{organisationunitname}.charAt( 0 ) != '[')&&$F{organisation_unit_is_parent}.equals("No")

Often you will be making reports where the first column is organisation unit names. However, it can be a problem that the list of organisation units are not sorted alphabetically. This can be fixed in iReport through a few simple steps.
In the report inspector, right click on the name of the report (by default this is dpt) and select Edit query.

A Report query window will appear. Click on the Sort options button.

A Sorting window as show below will appear. Here, we can add our sorting options. Click the Add field button. Another small window will show up, with a drop down menu where you can choose Sort by organisationunitname to have the table sorted alphabetically by name.
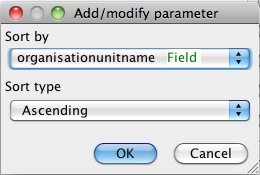
Click OK - Close - OK to close the three windows. The table should now be sorted.
By default, the reports from DHIS2 uses the short names for indicators and data elements in reports and charts. In some cases these are not always very meaningful for third parties, but with some work they can be given custom names through iReport. This is useful for example if you are making a report with indicators as rows and periods as column, or for charts with indicators.

To change the names of an indicator or data element, we have to edit its «expression» or formula, for example by right clicking the text box and choosing Edit expression to bring up the Expression editor.

Next, we have to insert some Java code. In the following example, we will be replacing the shortname of three indicators with their proper names. The code searches for the shortname, and then replaces it with a proper name.

($F{indicatorname}.equals("Bed Util All")) ? "Bed Utilisation - All Wards"
:
($F{indicatorname}.equals("Bed Util Mat")) ? "Bed Utilisation - Maternity"
:
($F{indicatorname}.equals("Bed Util Ped")) ? "Bed Utilisation - Paediatric"
:
$F{indicatorname}
On peut en déduire un modèle réutilisable pour des cas plus généraux.
For each indicator or data element we want to change the name for, we need one line
Chaque ligne est séparée par deux points :
Nous terminons l'expression par une ligne « régulière »
Each line has the same format, where the red text is the shortname, the blue text is what we want to insert instead.

The same expressions can be used for example when having indicator names along the category axis of a chart.
By using the expression editor, it is possible to add a column to the table with totals for each row. In the following example, we will make a table with three months as columns as well as a column with the totals for the three months.
We start by dragging a text label into the table header and changing its text to "Total", and dragging a text field into the details row.
As was discussed in the section on "Text field", we have to change the properties of the new text field so that it can display numbers. To do this, change the "Expressions Class" in the properties panel to "java.lang.Double".
Right click the text field and choose "Edit Expression". This will bring up the "Expressions editor". As the expression, we want to sum up all the columns. In this case we have three value expressions we want to sum up: "September", "October 2010", "November 2010". The name of these fields will vary depending on the crosstab dimension you have chosen in the report table. In our case, the expression we make is
$f{September}+$f{October 2010}+$f{November 2010}
There are cases when it can be useful to have several tables in one report. This can be done using Report groups. Using this functionality, one can for example create a report one table for each indicator, or one table of each organisation unit. In the following, we will go through the steps needed to make a report with three indicators, each represented in one table. It is important that the report table does not crosstab on indicators when we want to make groups of tables based on indicators.
In our example, the .jrxml file downloaded from DHIS2 will by default have one column for organisation unit and on for indicators (assuming we have chosen periods as the only crosstab dimension). We start by removing the indicator column, since this in not needed in our case, and realign the other fields to fit the report.

Next, we create out Report group. Go to the report inspector, right click on the report name (dpt is the default) and choose Add Report Group.

A window will appear, with a report group wizard. Select a name for the group, in this case we choose «Indicator». In the drop down menu, we can select what columns in the report table we want the groups to be based on. So, if we wanted one table for each organisation unit, we would choose organisation unit name as the report object to group according to. However, since we are grouping by indicators in this example, we choose indicatorname. Then click next.

The next step is to select whether or not we want a separate Group header and Group footer band for each report group. In this case, we choose to include both. Click Finish, and the group bands should appear in the report.

If you upload and run the report, it will now create one table for each indicator. However, it will not look very good as there will be no header row over each table - only one header at the top of each page. Also, there is no indication as to which table is showing which indicator. In the following, we will fix this.
Instead of having the title row in the column header, we can instead move it to the Group header. This will make the heading show up above each individual table. Furthermore, we can add a heading to each table with the name of the indicator.
Move the column headers from the Column header band to the Indicator group header band.

Next, add a text field to the Indicator group heading band, and edit it’s expression to display the indicator name.


The report should now have three tables, one for each indicator. Each table will have a heading with the name of the indicator, and also a table header row.

When using grouping, some precautions must be taken with regards to sorting. Notably, when adding sorting parameters, whatever parameter is used as basis for the grouping must come first. Thus if you are grouping the report by indicator, and want sort the organisation units alphabetically, you have to choose to sort first by indicator, then by organisation unit name as shown below. For instructions on how to add sorting, see the sorting section above.

By default, a 3D bar chart is included in the .jrxml file that is downloaded from DHIS 2. This is set up so that only data from the «parameter organisation unit» (often the parent or grand parent) is used. Usually, this is a good solution. Since it is the default, we will start by looking at bar charts, before looking at line charts.

Bar charts are the default chart type in DHIS2. In this section, we will look at how to make a bar charts like the one above, comparing the value of one indicator in several districts. To edit the default chart in iReport, right click on it and choose Chart data.
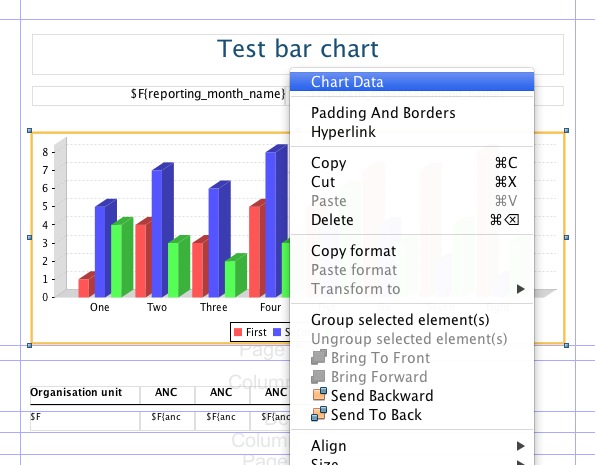
A window will appear. By default, the Filter expression is filled in so that only data for the parent organisation unit will be displayed. If for some reason you do not want this, simply delete the text in the text box. In this case we do NOT want the filter, as we are making a chart showing a comparison across districts. To continue, click the details tab.

Under details, you see the list of series for the chart. By default, one series is created per crosstab column. In this case, we are looking at data for one indicator for the whole of 2010, for a number of districts. The indicator is along the crosstab dimension.

To make changes to a series, select it and click modify. Another window will appear where there are four areas that can be edit. The three first are required, but it is sufficient to add an empty quote («») in one of the first two.

The first box is a text field where the name of the series can be inserted or edited. This is the field that will be used to fill the text in the legend box (shown below).

However, if you want to have the name of each bar along the x-axis of the chart instead of using the legend, this can be done by adding whatever text you want to present in the Category expression field, or by inserting an expression to have it filled automatically when the report is run. In this case, we want to have one bar for each organisation unit. We therefore edit the category expression by clicking on the button to the right.

As the expression, we chose organisationunitname, as shown below.

When we are finished, the series editor should look like below. Click OK, then Close to close the Chart Details window.

If you add a good description in the Category expression area, you can leave out the legend box. This is done in the Report properties panel of iReport, where you can also edit many other details of the chart.

We can also add a title to the chart, for example the name of the indicator. This is also done in the Chart properties panel, under Title expression.

The Expression editor window will appear, where you can enter the title. Note that the title must be in quotes, as shown below.

Le graphique est maintenant prêt.
Line charts can be useful in many circumstances. However, to make line charts the report data (report table) must be suited for it. Thus if you want to make a line chart, it is important that the report table does not have periods in the crosstab dimension. Examples where this is useful is if you are making a report for a single organisation unit with one or more indicators, or if you are making a report with one indicator and one or more organisation units.
Below, we will go though the steps needed to make a report with a line chart showing the development of three indicators over one year, for one organisation unit. We start by making a report table with the choices shown below:


When we open the resulting .jrxml-file in iReport, the default line chart is included. Since we want to make a line chart, we delete this chart and drag a new chart element into the report from the Palette panel.


As soon as we drag the Chart element into the report, a window will appear. We choose the Line chart, as shown below.

A chart wizard will appear. Click next in the first step, then Finish in the next - we will add the data later.

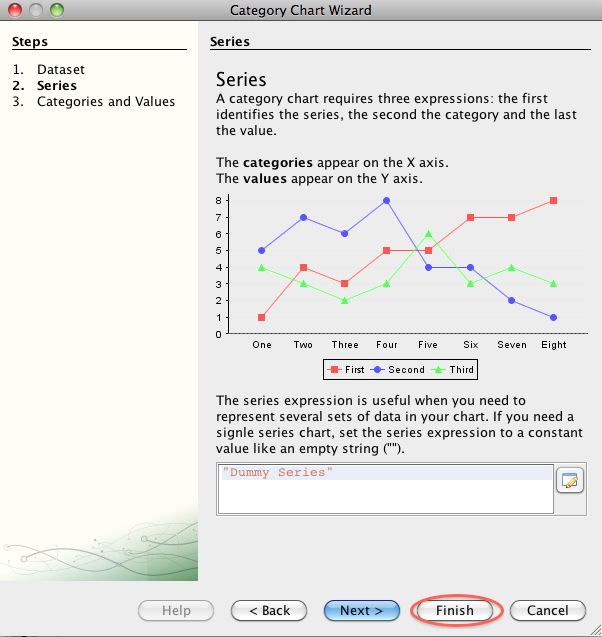
Next, adjust the size and position of the chart in your report. Then, we will add one data series for each of our three indicators. Right-click on the chart and choose Chart data. If you are making a chart with one indicator and several organisation units, you probably want to make a filter expression so that only data from the parameter/parent organisation unit is used in the chart. To do this, add this line to the Filter expression area:
$F{organisation_unit_is_parent}.equals("Yes")
In our example, we only have on organisation unit, so this is not necessary. Next, click the details tab to see a list of the series in the chart. For now, this list is empty, but we will add one series for each of our three indicators. To add a series, click the Add button.


In the window that appears, enter the name of the first of the indicators in the Series expression window. Remember to put the name in quotes. In the category expression (along the x-axis) we want the months, so we use the button next to the field to open the Expression editor and add periodname.


In the value expression, we add the actual data values for our first indicator. Use the Expression editor again to do this. When we are finished, the window should look like the one below, only with different names according to the indicator.

You can then Click OK to close the window. Follow the same steps to add a series for the other indicators.

Close the window, and the data for the line chart should be ready. However, some additional adjustments might be needed - most of these can be found in the Line chart properties panel. For example, when making a month by month chart as we have in example, there is often not enough space for the month names along the category axis. This can be fixed by rotating the labels by for example -40 degrees, by using the property Category Axis Tick Label Rotation.
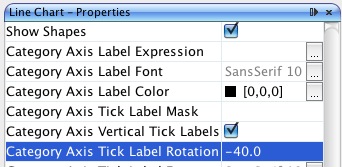
Many other options are available to give the chart the desired look.

We can now switch to DHIS2 and import our report. Go to the Report Module in DHIS2, and select "Standard Report". In the "Standard Report" screen, click "Add new", or edit an existing one.
In the following screen, there are several actions we need to take. First, enter a name for the new "Standard Report". Second, for design, click "Choose File" and find the .jrxml-file you have edited in iReport. Then we select the report table that we used as a basis for the report in iReport. Click add, and it should move to the "Selected report tables" area. Finally, click save.

Le rapport est désormais disponible sous forme de "Rapport standard" dans le système DHIS2 :

Use the same version of iReport and DHIS2's version of Jasper reports. See the About page in DHIS2 for the Jasper version in use.
Use report tables with cross tab dimensions as your data source for your report designs. This will make it a lot easier to design reports where you need to put specific indicators, periods, or orgunits on columns.
Learn from others, there are many DHIS2 report designs for Jasper on launchpad, see http://bazaar.launchpad.net/~DHIS2-devs-core/DHIS2/trunk/files/head:/resources/
A standard report might be based on SQL queries. This is useful when you need to access multiple tables in the DHIS2 database and do custom selects and joins.
- This step is optional, but handy when you need to debug your reports and when you have direct access to the database you want to use. Click on the "report datasources" button, "New", "Database JDBC connection" and click "next". In this window you can give you connection a name and select the JDBC driver. PostgreSQL and MySQL should come included in your iReport. Then enter the JDBC connection URL, username and password. The last three refers to your database and can be retrieved from your DHIS2 configuration file (hibernate.properties). Click "save". You have now connected iReport to your database.
- Go to standard reports and click "add new", then "get report template". Open this template in iReport. This template contains a series of report parameters which can be used to create dynamic SQL statements. These parameters will be substituted based on the report parameters which we will later select and include in the standard report. The parameters are:
periods - string of comma-separated identifiers of the relative periods
period_name - name of the reporting period
unitésd'organisation - identifiant des unités d'organisation sélectionnées
organisationunit_name - name of the reporting organisation unit
organisationunit_level - level of the reporting organisation unit
organisationunit_level_column - name of the corresponding column in the _orgunitstructure resource table
These parameters can be included in SQL statements using the $P\!{periods} syntax, where "periods" represents the parameter.
- To create a SQL query in iReport, click on the "report query" button. Write or paste your query into the textarea. An example SQL query using parameters which will create a report displaying raw data values at the fourth level in the org unit hierarchy is:
    select district.name as district, chiefdom.name as chiefdom, ou.name as facility,
    bcg.value as bcg, yellowfever.value as yellowfever, measles.value as  measles
    from organisationunit ou
    left outer join _orgunitstructure ous
      on (ou.organisationunitid=ous.organisationunitid)
    left outer join organisationunit district
      on (ous.idlevel2=district.organisationunitid)
    left outer join organisationunit chiefdom
      on (ous.idlevel3=chiefdom.organisationunitid)
    left outer join (
      select sourceid, sum(cast(value as double precision)) as value
      from datavalue
      where dataelementid=359706
      and periodid=$P!{periods}
      group by sourceid) as bcg on bcg.sourceid=ou.organisationunitid
    left outer join (
      select sourceid, sum(cast(value as double precision)) as value
      from datavalue
      where dataelementid=35
      and periodid=$P!{periods}
      group by sourceid) as yellowfever on yellowfever.sourceid=ou.organisationunitid
    where ous.level=4
    and ous.$P!{organisationunit_level_column}=$P!{organisationunits}
    order by district.name, chiefdom.name, ou.name;
- Finally, back in the add new report screen, we click on "Use JDBC data source". This enables you to select any relative period and report parameters for your report. Relative periods are relative to today's date. Report parameters will cause a prompt during report creation and makes it possible to dynamically select organisation units and periods to use for your report during runtime. For the example above, we must select "reporting month" under relative periods and both "reporting month" and "organisation unit" under report parameters. Click save. This will redirect you to the list of reports, where you can click the green "create" icon next to your report to render it.
A standard report can be designed using purely HTML and JavaScript. This requires a little bit of development experience in the mentioned subjects. The benefit of HTML based standard reports is that it allows for maximum flexibility. Using HTML you can design exactly the report you want, positioning tables, logos and values on the page according to your design needs. You can write and save your standard report design in a regular text file. To upload your HTML based standard report to DHIS2 do the following:
Naviguez jusqu'aux rapports standard et cliquez sur "Ajouter nouveau".
Donnez un nom au rapport.
Sélectionnez "Rapport HTML" comme type.
If you want to you can download a report template by clicking on "Get HTML report template".
Select desired relative periods - these will be available in JavaScript in your report.
Select report parameters - these will be available in JavaScript in your report.
The report template, which you can download after selecting report type, is a useful starting point for developing HTML based standard reports. It gives you the basic structure and suggests how you can use JavaScript and CSS in the report. JavaScript and CSS can easily be included using standard script and style tags.
If you selected relative periods when creating the standard report you can access these in JavaScript like this:
var périodes = dhis2.report.periods; // Un tableau contenant des identificateurs de périodes
var période = périodes[0];
If you selected the organisation unit report parameter when creating the standard report you can access the selected organisation unit in JavaScript like this:
var orgUnit = dhis2.report.organisationUnit; // Un objet
var id = id.orgUnit ;
var nom = nom.orgUnit ;
var code = code.orgUnit ;
When designing these reports you can utilize the analytics Web API resource in order to retrieve aggregated data in JavaScript. Have a look in the Web API chapter in this guide for a closer description. As a complete, minimal example you can retrieve analytics data after the report has been loaded and use that data to set the inner text of an HTML element like this:
<script type="text/javascript">
$( document ).ready( function() {
    $.get( "../api/analytics?dimension=dx:FnYCr2EAzWS;eTDtyyaSA7f&dimension=pe:THIS_YEAR&filter=ou:ImspTQPwCqd", function( json ) {
        $( "#bcg" ).html( json.rows[0][2] );
        $( "#fic" ).html( json.rows[1][2] );
    } );
} );
</script>

<div>Couverture par le BGG : <span id="bcg"></span></div>
<div>Couverture vaccinale : <span id="fic"></span></div>
A few other tips: To include graphics you can convert an image to SVG and embed that SVG content directly in the report - DHIS2 is based on HTML 5 where SVG tags are valid markup. To include charts and maps in your report you can use the charts and maps resources in the Web API. You can use the full capability of the Web API from JavaScript in your report - it may be useful to read through the Web API chapter to get an overview of all available resources.
Paramètre | Description |
|---|---|
Nombre maximum de dossiers d'analyse | Augmenter ce nombre afin de fournir davantage de données issues de l'analyse. La valeur par défaut est de 50 000.
|
Nombre maximum d'enregistrements de vues SQL | Définir le nombre maximum d'enregistrements dans une vue SQL. La valeur par défaut est Illimitée. |
Indicateurs d'infrastructure | Définit un groupe d'indicateurs dans lequel les indicateurs des membres doivent décrire les données relatives à l'infrastructure des unités d'organisation. Vous pouvez consulter les données relatives à l'infrastructure dans l'application SIG faites un clic droit sur un établissement et cliquez Afficher les informations. |
Éléments de données infrastructurels | Définit un groupe d'éléments de données où les éléments de données des membres doivent décrire les données sur l'infrastructure des unités d'organisation. Les éléments de données infrastructurelles peuvent être la population, les médecins, les lits, la connectivité Internet et le climat. Vous pouvez consulter les données relatives à l'infrastructure dans l'application SIG faites un clic droit sur un établissement et cliquez Afficher les informations. |
Type de période infrastructurel | Définit la fréquence de saisie des éléments de données du groupe d'éléments de données infrastructurels. Ce sera généralement annuel. Lors de la visualisation des données relatives à l'infrastructure, vous pourrez sélectionner la période de la source de données. Vous pouvez consulter les données relatives à l'infrastructure dans l'application SIG aites un clic droit sur un établissement et cliquez Afficher les informations. |
Période relative par défaut pour l'analyse | La définition de cette valeur déterminera quelle période relative est sélectionnée par défaut dans les applications d'analyse. |
Destinataire des retours de l'information | Définit un groupe d'utilisateurs dont les membres recevront tous les messages envoyés via la fonction de retour d'information dans l' application Tableau de bord Il s'agit généralement de membres de l'équipe de super-utilisateurs capable de prendre en charge et de répondre aux questions des utilisateurs finaux. |
Niveaux maximums des unités d'organisation hors ligne | Définit le nombre de niveaux dans la hiérarchie de l'unité d'organisation qui seront disponibles hors ligne dans le widget de l'arbre des unités d'organisation. Dans des circonstances normales, vous pouvez le laisser au niveau le plus bas, qui est le réglage par défaut. Il peut s'avérer utile de le fixer à un niveau supérieur pour réduire le temps de chargement initial dans les cas où vous avez un grand nombre d'unités d'organisation, généralement plus de 30 000. |
Facteur d'écarts type de l'analyse des données | Définit le nombre d'écarts types utilisés dans l'analyse des valeurs aberrantes effectuée sur les données saisies dans l' application Saisie de données La valeur par défaut est 2. Une valeur élevée détectera moins de valeurs aberrantes qu'une valeur faible. |
Indicatif de numéro de téléphone | L'indicatif de la région dans laquelle se trouve votre déploiement. Utilisé pour l'envoi et la réception de SMS. Il s'agit généralement d'un code pays. +260 (code pays de la Zambie) |
Activer les formulaires pour plusieurs unités d'organisationn | Permet de remplir des formulaires de données pour plusieurs unités d'organisation en même temps dans l' application Saisie de données Si vous avez activé ce paramètre, vous pouvez, dans l'application Saisie de données cliquez sur l'unité de l'organisation mère des enfants pour lesquels vous voulez saisir des données, et la liste des ensembles de données comprendra les ensembles de données attribués aux enfants de cette mère |
| Acceptation requise avant l'approbation | Lorsque ce paramètre est sélectionné, l'acceptation des données sera d'abord requise avant que la soumission au niveau d'approbation suivant soit possible. |
Paramètre | Description |
|---|---|
Période relative par défaut pour l'analyse | Définit la période relative à utiliser par défaut dans les applications d'analyse telles que : Visualiseur de données, Rapports d'événements, Visualiseur d'événements, SIG et Tableau croisé dynamique La période relative sera automatiquement sélectionnée lorsque vous ouvrirez ces applications. Paramètre recommandé : la période relative la plus utilisée parmi vos utilisateurs |
Masquer les périodes quotidiennes | Masquer les périodes quotidiennes dans les outils d'analyse |
Masquer les périodes hebdomadairess | Masquer les périodes hebdomadaires dans les outils d'analyse |
Masquer les périodes mensuelles | Masquer les périodes mensuelles dans les outils d'analyse |
Masquer les périodes bimensuelles | Masquer les périodes bimensuelles dans les outils d'analyse |
| Mois relatif de début de l'exercice financier | Définit le mois (avril, juillet ou octobre) où doit commencer l'exercice financier relatif dans les applications d'analyses. |
Capacité de mise en cache | Détermine si les réponses aux données d'analyses doivent être signifiées avec une visibilité publique ou privée. Privée: Tout nœud ou serveur entre le serveur DHIS2 et l'utilisateur final ayant la capacité de mettre en cache ne peut PAS mettre la page web en cache. Ceci est utile si la page servie peut contenir ou contient des informations sensibles. Cela signifie que chaque fois que vous voulez une page web, soit vous obtenez une nouvelle page du serveur DHIS2, soit le serveur DHIS2 met la page en cache. Aucun autre serveur que le serveur DHIS2 n'est autorisé à mettre la page en cache. Publique: Tout nœud ou serveur entre le serveur DHIS2 et l'utilisateur final ayant la capacité de mettre en cache peut mettre la page web en cache. Cela permet de rediriger le trafic vers le serveur DHIS2 et d'accélérer potentiellement la vitesse de chargement de la page suivante. |
Stratégie de mise en cache | Décide de la durée de mise en cache des réponses d'analyses des rapports. Si vous utilisez la mise à jour analytique nocturne programmée, sélectionnez Mettre en cache jusqu'à 6 heures demain matin. En effet, les données des rapports changent à ce moment-là et vous pouvez mettre en cache les données en toute sécurité jusqu'au moment où les tableaux analytiques sont mis à jour. Si vous chargez régulièrement des données dans les tableaux analytiques, sélectionnez Aucune cache. |
Nombre maximum d'années pour masquer des données non approuvées dans les analyses | Détermine si et pendant combien de temps les analyses doivent respecter le niveau d'approbation des données. En règle générale, les données datant de plusieurs années sont considérées comme approuvées par défaut. Afin d'accélérer les requêtes d'analyse, vous pouvez choisir d'ignorer le niveau d'approbation réel des données historiques. Ne jamais vérifier l'approbation: aucune donnée ne sera masquée, quel que soit son statut d'approbation. Vérifier l'approbation pour toutes les données: le statut d'approbation sera toujours vérifié. D'autres options, par exemple Les 3 dernières années: le statut d'approbation sera vérifié pour les données de moins de 3 ans ; les données plus anciennes ne seront pas vérifiées. |
Seuil pour la mise en cache de données analytiques | Permet d'activer ou non la mise en cache des données plus anciennes que le nombre d'années spécifié. Cela permet de renvoyer directement les données les plus récentes sans mise en cache, tout en servant une version en cache des données plus anciennes pour des raisons de performances. |
Respecter la date de début et de fin de l'option de catégorie dans l'exportation de tableaux analytiques | Ce paramètre détermine si les analyses doivent filtrer les données associées à une option de catégorie avec une date de début et de fin, mais qui ne sont pas associées à une période dans l'intervalle de validité des options de catégorie. |
Mettre l'analytique en mode maintenance | Place l'analytique et l'API Web de DHIS2 en mode Maintenance. Cela signifie que "503 Service non disponiblele" ; sera renvoyé pour toutes les requêtes. Ceci est utile lorsque vous devez effectuer une maintenance sur le serveur, par exemple en reconstruisant les index pendant que le serveur fonctionne dans un environnement de production, afin de réduire la charge et d'effectuer la maintenance plus efficacemente. |
Ignorer les valeurs de données nulles dans les tableaux analytiquess | N'inclut pas dans les tableaux analytiques les valeurs de données agrégées qui sont nulles. Cela peut réduire la taille des tableaux analytiques et accélérer la construction et l'accès aux tableaux analytiques, si vous avez des valeurs de données agrégées qui sont nulles et stockées (l'élément de donnée est configuré pour stocker des valeurs nulles). |
Setting | Description |
|---|---|
Number of database server CPUs | Sets the number of CPU cores of your database server. This allows the system to perform optimally when the database is hosted on a different server than the application server, since analytics in DHIS2 scales linearly with the number of available cores. |
System notifications email address | Defines the email address which will receive system notifications. Notifications about failures in processes such as analytics table generation will be sent here. This is useful for application monitoring. |
Google Analytics (Universal Analytics) key | Sets the Google UA key to provide usage analytics for your DHIS2 instance through the Google Analytics platform. It should be noted that currently, not all apps in DHIS2 support Google Analytics, so certain activity of your users may not appear in this platform. You can read more about Google Analytics at http://google.com/analytics. |
Setting | Description |
|---|---|
Select language | Sets the language for which you can then enter translations of the following settings:
|
Application title | Sets the application title on the top menu. |
Application introduction | Sets an introduction of the system which will be visible on the top-left part of the login page. |
Application notification | Sets a notification which will be visible on the front page under the login area. |
Application left-side footer | Sets a text in the left-side footer area of the login page. |
Application right-side footer | Sets a text in the right-side footer area of the login page. |
Style | Sets the style (look-and-feel) of the system. The user can override this setting in the Settings app: User settings > Style.
|
Start page | Sets the page or app which the user will be redirected to after log in. Recommended setting: the Dashboard app. |
Help page link | Defines the URL which users will see when they click Profile >Help. |
Flag | Sets the flag which is displayed in the left menu of the Dashboard app. |
Interface language | Sets the language used in the user interface. The user can override this setting in the Settings app: User settings > Interface language. |
Database language | Sets the language used in the database. The user can override this setting in the Settings app: User settings > Database language. |
Property to display in analysis modules | Sets whether you want to display the metadata objects' names or short names in the analytics apps: Data Visualizer, Event Reports, Event Visualizer, GIS and Pivot Table apps. The user can override this setting in the Settings app: User settings > Property to display in analysis modules. |
Default digit group separator to display in analysis modules | Sets the default digit group separator in the analytics apps: Data Visualizer, Event Reports, Event Visualizer, GIS and Pivot Table apps. |
Require authority to add to view object lists | If you select this option, you'll hide menu and index page items and links to lists of objects if the current user doesn't have the authority to create the type of objects (privately or publicly). |
Custom login page logo | Select this option and upload an image to add your logo to the login page. |
Custom top menu logo | Select this option and upload an image to add your logo to the left in the top menu. |
Paramètre | Description |
|---|---|
Nom d'hôte | Définit le nom d'hôte du serveur SMTP. Lorsque vous utilisez les services SMTP de Google, le nom d'hôte doit être smtp.gmail.com. |
Porte d'accès | Définit le port pour se connecter au serveur SMTP. |
Nom d'utilisateur | Le nom d'utilisateur du compte d'utilisateur sur le serveur SMTP. mail@dhis2.org |
Mot de passe | Le mot de passe du compte d'utilisateur sur le serveur SMTP. |
TLS | Sélectionnez cette option si le serveur SMPT requiert TLS pour les connexions. |
Expéditeur du courriel | L'adresse électronique à utiliser comme expéditeur lors de l'envoi des e-mails. |
M'envoyer un e-mail de test | Envoie un e-mail de test à l'utilisateur actuel connecté au DHIS2. |
Setting | Description |
|---|---|
Enable message email notifications | Defines whether DHIS2 user messages should be delivered to the email address associated with the user by default. This setting can be overridden by user settings. |
Enable message SMS notifications | Defines whether DHIS2 user messages should be delivered as SMS to the mobile phone number associated with the user by default. This setting can be overridden by user settings. |
Setting | Description |
|---|---|
Self registration account user role | Defines which user role should be given to self-registered user accounts. To enable self-registration of users: select any user role from the list. A link to the self-registration form will be displayed on the login page.
To disable self-registration of users: select Disable self registration. |
Self registration account organisation unit | Defines which organisation unit should be associated with self-registered users.
|
Do not require reCAPTCHA for self registration | Defines whether you want to use reCAPTCHA for user self-registration. This is enabled by default. |
Enable user account recovery | Defines whether users can restore their own passwords. When this setting is enabled, a link to the account recovery form will be displayed on the front page.
|
Lock user account temporarily after multiple failed login attempts | Defines whether the system should lock user accounts after five successive failed login attempts over a timespan of 15 minutes. The account will be locked for 15 minutes, then the user can attempt to log in again. |
Allow users to grant own user roles | Defines whether users can grant user roles which they have themselves to others when creating new users. |
Allow assigning object to related objects during add or update | Defines whether users should be allowed to assign an object to a related object when they create or edit metadata objects. You can allow users to assign an organisation unit to data sets and organisation unit group sets when creating or editing the organisation unit. |
Require user account password change | Defines whether users should be forced to change their passwords every 3, 6 or 12 months. If you don't want to force users to change password, select Never. |
| Enable password expiry alerts | When set, users will receive a notification when their password is about to expire. |
Minimum characters in password | Defines the minimum number of characters users must have in their passwords. You can select 8 (default), 10, 12 or 14. |
OpenID provider | Defines the OpenID provider. |
OpenID provider label | Defines the label to display for the specified OpenID provider. |
CORS whitelist | Whitelists a set of URLs which can access the DHIS2 API from another domain. Each URL should be entered on separate lines. Cross-origin resource sharing (CORS) is a mechanism that allows restricted resources (e.g. javascript files) on a web page to be requested from another domain outside the domain from which the first resource was served. |
Google Maps API key | Defines the API key for the Google Maps API. This is used to display maps within DHIS2. |
Paramètre | Description |
|---|---|
Calendrier | Définit le calendrier que le système utilisera. Le système prend en charge les calendriers suivants : Copte, éthiopien, grégorien, islamique (Lunar Hijri), ISO 8601, julien, népalais, persan (Solar Hijri) et thaïlandais.
|
Format de date | Définit le format de date que le système utilisera. |
The data import settings apply to extra controls which can be enabled to validate aggregate data which is imported through the web API. They provide optional constraints on what should be considered a conflict during import. The constraints are applied to each individual data value in the import.
Paramètre | Description |
|---|---|
Exiger que les périodes correspondent au type de période de l'ensemble de données | Exiger que la période de valeur des données soit du même type que les ensembles de données pour lesquels l'élément de donnée de valeur des données est attribué. |
Exiger que les combos d'options de catégories correspondent à la combo de catégories de l'élément de donnée | Exiger que la combinaison d'options de catégories de la valeur des données fasse partie de la combinaison de catégories de l'élément de donnée de la valeur des données. |
Exiger les unités d'organisation correspondent à l'attribution de l'ensemble de données | Exiger que l'unité d'organisation de la valeur des données soit attribuée à un ou plusieurs des ensembles de données auxquels l'élément de donnée de la valeur des données est attribué. |
Exiger que les combos d'options d'attributs correspondent à la combo de catégories de l'ensemble de données | Exiger que la combinaison d'options d'attributs de la valeur des données fasse partie de la combinaison de catégories de l'ensemble de données auquel l'élément de donnée de la valeur des données est attribué. |
Exiger que la combo d'options de catégorie soit précisée | Exiger que la combinaison d'options de catégories de la valeur des données soit spécifiée. Par défaut, elle reviendra à la combinaison d'options de catégories par défaut si elle n'est pas spécifiée. |
Exiger que la combo d'options d'attributs soit spécifiée | Exiger que la combinaison d'options d'attributs de la valeur des données soit spécifiée. Par défaut, elle reviendra à la combinaison d'options d'attributs par défaut si elle n'est pas spécifiée. |
The following settings are used for both data and metadata synchronization.
Note
For more information about how you configure metadata synchronization, refer to Configure metadata synchronizing
Setting | Description |
|---|---|
Remote server URL | Defines the URL of the remote server running DHIS2 to upload data values to. It is recommended to use of SSL/HTTPS since user name and password are sent with the request (using basic authentication). The system will attempt to synchronize data once every minute. The system will use this setting for metadata synchronization too.
|
Remote server user name | The user name of the DHIS2 user account on the remote server to use for data synchronization.
|
Remote server password | The password of the DHIS2 user account on the remote server. The password will be stored encrypted. |
Enable versioning for metadata sync | Defines whether to create versions of metadata when you synchronize metadata between central and local instances. |
Don't sync metadata if DHIS versions differ | The metadata schema changes between versions of DHIS2 which could make different metadata versions incompatible. When enabled, this option will not allow metadata synchronization to occur if the central and local instance(s) have different DHIS2 versions. This apply to metadata synchronization done both via the user interface and the API. The only time it might be valuable to disable this option is when synchronizing basic entities, for example data elements, that have not changed across DHIS2 versions. |
Best effort | A type of metadata version which decides how the importer on local instance(s) will handle the metadata version. Best effort means that if the metadata import encounters missing references (for example missing data elements on a data element group import) it ignores the errors and continues the import. |
Atomic | A type of metadata version which decides how the importer on local instance(s) will handle the metadata version. Atomic means all or nothing - the metadata import will fail if any of the references do not exist. |
You create, edit and delete OAuth2 clients in the System Settings app.
Ouvrez les applications Paramètres du système et cliquez sur Clients OAuth2.
Cliquez sur le bouton d'ajout.
Entrez Nom, Client ID et Client secret.
Sélectionnez Types d'autorisation.
Grant type | Description |
|---|---|
Password | TBA |
Refresh token | TBA |
Authorization code | TBA |
Enter Redirect URIs. If you've multiple URIs, separate them with a line.
The data administration module provides a range of functions to ensure that the data stored in the DHIS2 database is integral and that the database performance is optimised. These functions should be executed on a regular basis by a data administrator to ensure that the quality of the data stored is optimal.
DHIS2 can perform a wide range of data integrity checks on the data contained in the database. Identifying and correcting data integrity issues is extremely important for ensuring that the data used for analysis purposes is valid. Each of the data integrity checks that are performed by the system will be described, along with general procedures that can be performed to resolve these issues.
Each data element must be assigned to a data set. Values for data elements will not be able to be entered into the system if a data element is not assigned to a data set. Choose Maintenance->Datasets->Edit from the main menu and then add the "orphaned" data element to the appropriate data set.
Some Data Elements have been allocated to several Data Element Groups. This is currently not allowed, because it will result in duplication of linked data records in the analytics record sets that provide aggregated data. Go to Maintenance -> Data Element Groups to review each Data Element identified and remove the incorrect Group allocations.
Some data elements have been allocated to several data element groups that are members of the same data element group set. All group sets in DHIS2 are defined as exclusive, which means that a data element can only be allocated to one data element group within that group set. Go to Maintenance -> Data elements and indicators ->Data element groups to review each data element identified in the integrity check. Either remove the data element from all groups except the one that it should be allocated to, or see if one of the groups should be placed in a different group set.
Data elements have been assigned to a data set, but have not been assigned to any sections of the data set forms. All data sets which use section forms, should generally have all data elements in the data set assigned to exactly one section of the dataset.
Data elements should not be assigned to two separate data sets whose period types differ. The recommended approach would be to create two separate data elements (for instance a monthly and yearly data element) and assign these to respective datasets.
Tous les ensembles de données doivent être attribués à au moins une unité organisationnelle.
Data sets which use section forms should only have a single category combination within each section. This violation could result from assigning a data element to a section, but then changing the category combination of this data element at a later point in time.
Although this rule will not affect data quality, it generally does not make sense to have two indicators with the exact same definition. Review the identified indicators and their formulas and delete or modify any indicator that appears to be the duplicate.
All data elements and indicators must be assigned to at least one group, so these Indicators need to be allocated to their correct Data Element and Indicator Group. From the main menu, go to Data elements/Indicators -> Indicator Groups, and allocate each of the `Orphaned` indicators to its correct group.
Violations of this rule may be caused by an incorrect reference to a deleted or modified data element. Review the indicator and make corrections to the numerator definition.
Violations of this rule may be caused by an incorrect reference to a deleted or modified data element. Review the indicator and make corrections to the denominator definition.
Some indicators have been allocated to several indicator groups that are members of the same indicator group set. All group sets in DHIS2 are defined as exclusive, which means that an indicator can only be allocated to one indicator group within that group set. Go to Maintenance -> Data elements and indicators ->Indicator groups to review each indicator identified in the integrity check. Either remove the indicator from all groups except the one that it should be allocated to, or see if one of the groups should be placed in a different group set.
If periods have been imported from external applications, it may be possible that some periods will be duplicated. If you have any periods which appear to be duplicated here, you will need to resolve these directly in the DHIS2 database. All data which has been assigned to the duplicated period, should be moved to the correct period, and the duplicate period should be removed.
Organisation units cannot be both parent and children of each other, directly nor indirectly. If this situation occurs, you will need to resolve the cyclic reference directly in the DHIS2 database in the "organisation unit" table, by reassigning the "parentid" field of the organisation units.
All organisation units must exist within the organisation unit hierarchy. Go to Organisation- units >Hierarchy Operations and move the offending organisation unit into the proper position in the hierarchy.
All organisation units must be allocated to at least one group. The problem might either be that you have not defined any compulsory OrgUnit Group Set at all, or that there are violations of the compulsory rule for some OrgUnits . NOTE: If you have defined no compulsory OrgUnit Group Sets, then you must first define them by going to Organisation units->Organisation unit group sets and define at least one compulsory Group Set (the group set 'Type' are nearly universally relevant). If you have the relevant group sets, go to Maintenance -> OrgUnit Groups to review each OrgUnit identified and add the relevant Group allocation.
These organisation units have not been assigned to the any organisation unit group within one of the compulsory organisation unit group sets. When a group set is defined as compulsory, it means that an organisation unit must be allocated to at least one organisation unit group within that group set. For instance, all organisation units must belong to one of the groups in the 'Type' group set. It might belong to the `Hospital` or the `Clinic` or any other 'type' group - but it must belong to exactly one of them. Go to Organisation units->Organisation unit groups to review each organisation unit identified in the integrity check. Allocate all organisation units to exactly one compulsory group.
Some organisation units have been allocated to several organisation unit groups that are members of the same organisation unit group set. All group sets in DHIS2 are defined as exclusive, which means that an organisation unit can only be allocated to one organisation unit group within that Group Set. For instance, one organisation unit cannot normally belong to the both the 'Hospital' and 'Clinic' groups , but rather to only to one of them. Go to Organisation unit->Organisation unit groups to review each organisation unit identified in the integrity check. Remove the organisation units from all groups except the one that it should be allocated to.
The organisation unit groups listed here have not been allocated to a group set. Go to Maintenance->Organisation unit->Organisation unit group sets and allocate the Organisation unit group to the appropriate group set.
All validation rules must be assigned to a group. Go to Maintenance app > Validation rule group and assign the offending validation rule to a group.
An error exists in the left-side validation rule definition. Go to Maintenance app > Validation rule and click Edit on the offending rule. Click Left side and make the required corrections.
An error exists in the right-side validation rule definition. Go to Maintenance app > Validation rule and click Edit on the offending rule. Click Right side and make the required corrections.
Le rapport mettra en évidence toutes les Règles du programme configurées sans condition. Les règles n'ayant pas de condition sont toujours évaluées comme étant fausses.
Le rapport mettra en évidence toutes les Règles du programme configurées sans Priorité. Ceci est facultatif mais son existence est très importante lorsque le Type d'action de la règle du programme est ASSIGNER. Les règles ayant le type d'action ASSIGNER doivent avoir une priorité plus élevée que le reste des types d'action.
Le rapport mettra en évidence toutes les Règles du programme configurées sans une Action de la règle du programme.
Le rapport mettra en évidence toutes les Variables de règles de programme configurées sans Élément de donnée. Le rapport sera basé sur la configuration Type de source. L'élément de donnée doit être fourni lorsque le type de source de la variable de règles de programme est Élément de donné.
Le rapport mettra en évidence toutes les Variables de règle du programme non configurées avec Attribut de l'entité suivie. Le rapport sera basé sur la configuration Type de source. L'attribut de l'entité suivie doit être fourni lorsque le type de source de la Variable de règle du programmee est Attribut.
Le rapport mettra en évidence toutes les Actions de règle du programme configurées sans objet de données. L'objet de données peut être soit un Elément de donnée soit un Attribut de l'entité suivie. Certaines actions de règle du programme sont chargées d'attribuer des valeurs à l'élément de donnée ou à l'attribut de l'entité suivie.
Le rapport mettra en évidence toutes les Actions de règle du programme dont le Type d'action de régle du programme est défini sur ENVOYER UN MESSAGE/PROGRAMMER UN MESSAGE lorsque la configuration ne prévoit aucun lien avec la notification.
Le rapport mettra en évidence toutes les actions de règle de programme dont le Type d'action de la règle du programme est défini sur MASQUER LA SECTION mais la configuration ne fournit aucun identifiant de section.
Le rapport mettra en évidence toutes les Actions de règle du programme dont le Type d'action de la règle du programme est défini sur MASQUER LE STADE DU PROGRAMME mais la configuration ne fournit aucun identifiant du stade du programme.
Signale toutes les violations dans l'expression de l'indicateur de programme causées par un Elément de donnée invalide ou un Attribut d'entité suivie invalide.
Signale toutes les violations dans l'expression de filtre d'indicateur de programme causées par un Elément de donnée invalide ou un Attribut d'entité suivie invalide.
Fonction | Description |
|---|---|
Effacer les tableaux d'analyse | Vider complètement les tableaux d'analyse. Ces tableaux sont utilisés pour générer des données agrégées pour les tableaux croisés dynamiques, les SIG et les rapports. |
Supprimer les valeurs de données nulles | Supprime les valeurs nulles de la base de données. Les valeurs enregistrées pour les éléments de données avec la moyenne de l'opérateur d'agrégation ne sont pas supprimées, car ces valeurs seront significatives lors de l'agrégation des données, contrairement aux valeurs enregistrées pour les éléments de données avec la somme de l'opérateur d'agrégation. La réduction du nombre de valeurs de données améliorera les performances du système. |
Restauration de données supprimées par logiciel | Lorsque vous supprimez une valeur de donnée de DHIS2, le système marquera la ligne correspondante de la base de données comme supprimée, mais ne supprimera pas réellement la ligne. L'exécution de cette fonction de maintenance supprimera physiquement ces lignes de valeur de données de la base de données. |
Réduire les périodes | Supprime toutes les périodes n'ayant pas de valeurs de données enregistrées. La réduction du nombre de périodes améliorera les performances du système. |
Supprimer les invitations expirées | Supprimera les utilisateurs représentant des invitations de compte d'utilisateur ayant dépassé leur date d'expiration. |
Déposer des vues SQL | DHIS2 vous permet de configurer et de gérer les vues SQL en tant qu'objets système avec les vues SQL correspondantes de la base de données. L'exécution de cette fonction de maintenance supprimera les vues SQL sous-jacentes pour toutes les vues du système. Utilisez la fonction Créer des vues SQL pour recréer ces vues SQL. |
Créer des vues SQL | Recrée toutes les vues SQL dans la base de données. |
Mettre à jour les combinaisons d'options de catégories | Reconstitue les combinaisons d'options de catégories. Cela peut être nécessaire après la modification des options de catégorie appartenant à une catégorie donnée. |
Mettre à jour les chemins des unités d'organisation | Le tableau des unités d'organisation dans la base de données DHIS2 comporte une colonne "chemin" ; contenant une chaîne concaténée de tous les ancêtres dans la hiérarchie pour chaque unité d'organisation. L'exécution de cette fonction de maintenance permettra de mettre à jour et de garantir que ces valeurs sont synchronisées avec la hiérarchie actuelle des unités d'organisation. Cette colonne est gérée par le DHIS2, mais une mise à jour manuelle peut s'avérer utile lors du chargement des données directement dans la base de données. |
Effacer le cache de l'application | Efface le cache du système. |
Recharger les applications | Recharge et détecte manuellement les applications DHIS2 installées. Les applications installées sont également détectées au démarrage du système et lors de l'installation ou de la désinstallation des applications. |
Resource tables are supporting tables that are used during analysis of data. One would typically join the contents of these tables with the data value table when doing queries from third-party applications like Microsoft Excel. They are also used extensively by the analysis modules of DHIS2. Regeneration of the resource tables should only be done once all data integrity issues are resolved. The resource tables are also generated automatically, every time the analytics process is run by the system.
Structure de l'unité d'organisation (_orgunitstructure)
This table should be regenerated any time there have been any changes made to the organisational unit hierarchy. This table provides information about the organisation unit hierarchy. It has one row for each organisation unit, one column for each organisation unit level and the organisation unit identifiers for all parents in the lineage as values.
Structure de l'ensemble des groupes d'éléments de données (_dataelementgroupsetstructure)
This table provides information about which data elements are members of which data element group sets. The table has one row for each data element, one column for each data element group set and the names of the data element group as values.
Structure de l'ensemble de groupes d'indicateurs (_indicatorgroupsetstructure)
This table provides information about which indicators are members of which indicator group sets. The table has one row for each indicator, one column for each indicator group set and the names of the indicator group as values.
Organisation unit group set structure (_organisationunitgroupsetstructure)
This table provides information about which organisation units are members of which organisation unit group sets. The table has one row for each organisation unit, one column for each organisation unit group set and the names of the organisation unit groups as values.
Structure des catégories (_categorystructure)
This table provides information about which data elements are members of which categories. The table has one row for each data element, one column for each category and the names of the category options as values.
Nom de la combo d'options de catégorie de l'élément de donnée (_categoryoptioncomboname)
This table should be regenerated any time there have been changes made to the category combination names. It contains readable names for the various combinations of categories.
Structure des éléments de données (_dataelementstructure)
This table provides information about all data elements and which period type (frequency) they capture data at. The period type is determined through the data set membership and hence relies on data elements to be member of data sets with similar period types to have a defined behaviour.
Structure de la période (_dataperiodstructure)
This table provides information about all periods and which period type they are associated with. For each period type with lower frequency than itself, it contains information about which period it will fall within.
Data element category option combinations (_dataelementcategoryoptioncombo)
This table provides a mapping between data elements and all possible category option combinations.
This function is useful when data has been entered mistakenly for two data elements which represents the same phenomena.
Start by selecting the data element to eliminate from the list and click confirm. Then select the data element to keep and click confirm again. Finally, verify the selection and click merge.
In the situation where data exists for the data element to eliminate and not for the one to keep, the data will be moved to the one to keep. When data exists for both data elements, the data which was updated last will be used. When data exists only for the one to keep, no action will be taken. The data element to eliminate will eventually be deleted, except when it is a multidimensional data element and has other data registered.
The data statistics module provides an overview of the number of objects stored in the DHIS2 database.
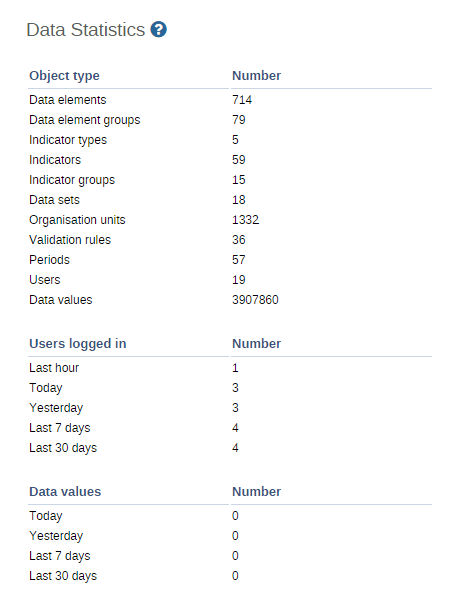
The total number of each type of object is presented in a series of tables with summary statistics of each object.
Lock exceptions provide fine-grained control over exemption from a locked data set. After the expiry of the data set, data entry will be denied by default, unless an exception has been granted through the Lock exception interface. To enable a lock exception, select the desired organization units, data sets, and time period and press "Add". By granting a lock exception, data entry will be enabled even after the expiry period of the data set has passed.
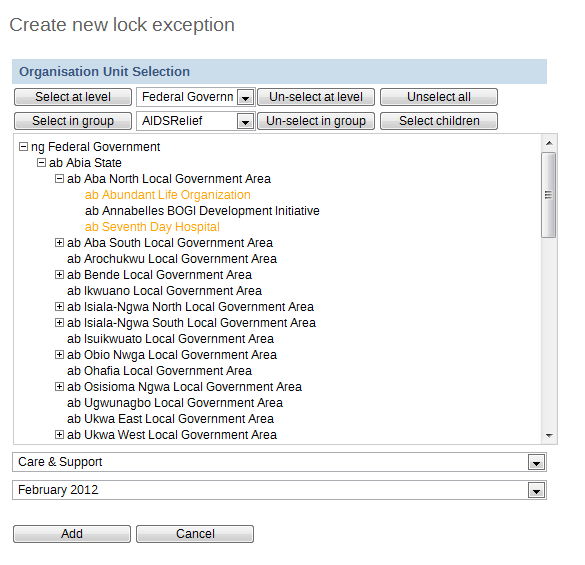
In the example above, a data lock exception would be created for "ab Abundant Life Organization" and "ab Seventh Day Hospital" for the "Care and Support" dataset for "February 2012".
This administrative function can be used to generate min-max values, which are used as part of the data quality and validation process for specific organization units and data sets. Simply select the dataset from the left hand frame, and then select the required organisation units to generate the min-max values for from the organisational units selector on the right. Press the "Generate" button to generate or regenerate all min-max values. Press "Remove" to remove all min-max values which are currently stored in the database.
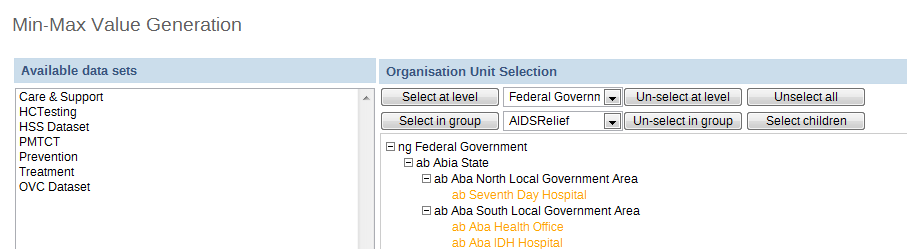
This option is for system administrators only to use. The cache statistics shows the status of the application level cache. The application level cache refers to the objects and query results that the application is caching in order to speed up performance. If the database has been modified directly the application cache needs to be cleared for it to take effect.
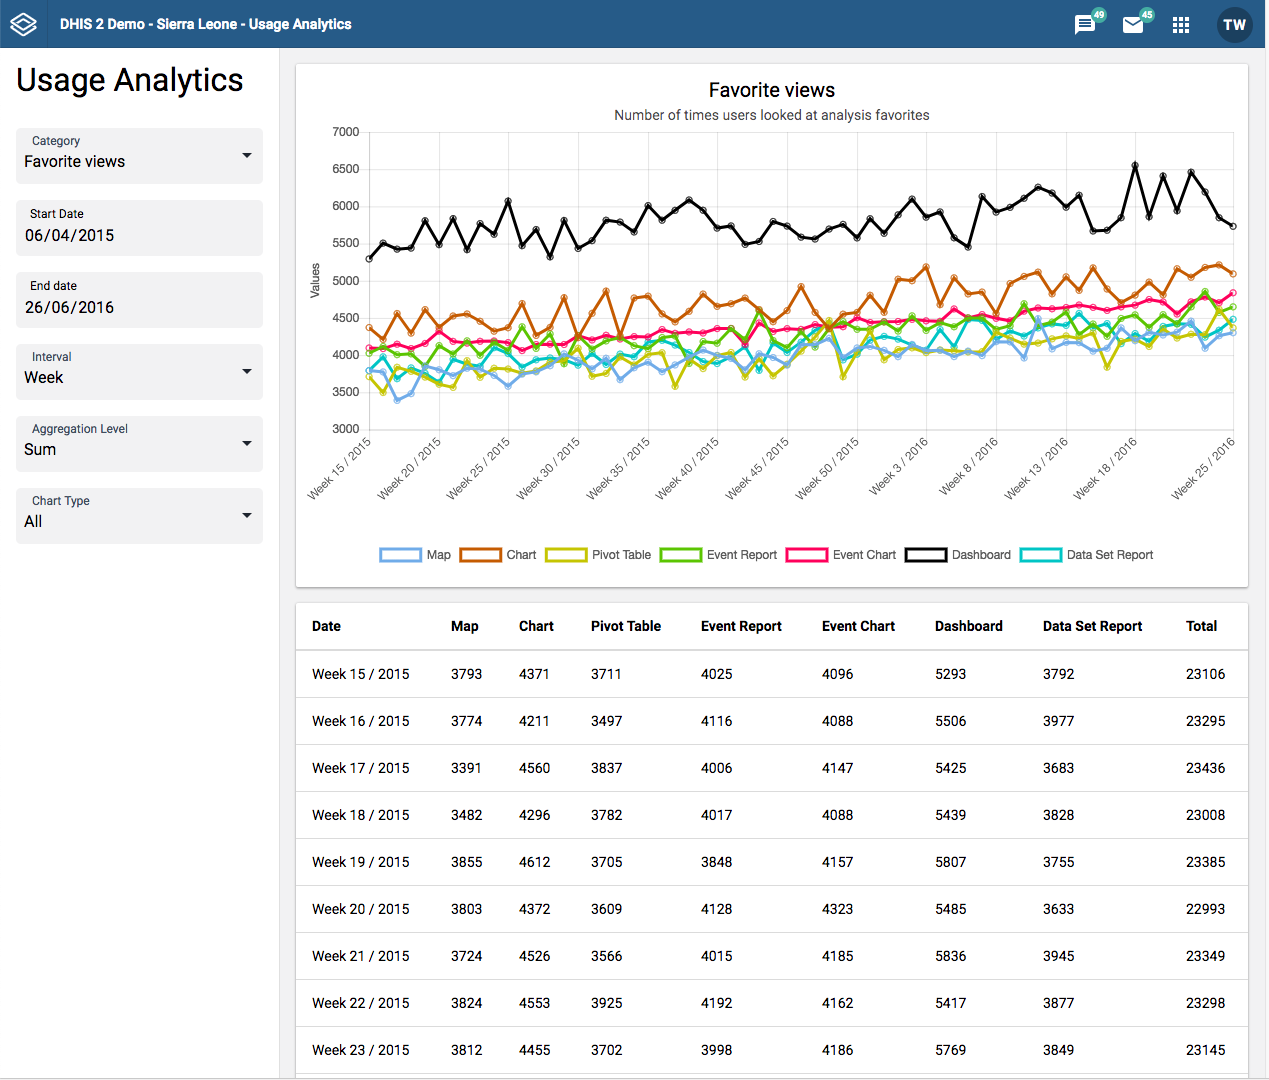
The Usage Analytics app lets you visualize statistics on how users are working with the Dashboard, Pivot Table, GIS, Event Visualizer, Data Visualizer and Event Reports apps within DHIS2. With this statistics you can answers questions such as:
How many times people have loaded charts, pivots tables and dashboards?
Combien de favoris les utilisateurs ont-ils créés ?
Combien d'utilisateurs se connectent par rapport au nombre total d'utilisateurs ?
Quels sont les favoris les plus regardés ?
Ouvrez l'application Analyse de l'utilisation.
Sélectionnez une date de début et une date de fin.
Sélectionnez un intervalle : jour, semaine, mois ou année.
Sélectionnez une Catégorie.
Il existe cinq catégories d'analyse :
Favorite views: Provides the number of times various types of favorites have been viewed, such as charts, pivot tables and dashboards, over time. This analysis lets you switch between all types of favorites, the total across all types and the average number of views.
Favorites: Provides the number of favorites which have been created and stored in the system over time.
Users: Provides the number of active as well as total number of users over time.
Top favorites: Shows the most viewed favorites in the system by type.
Data values: Provides the number of data values stored in the system over time.
Cliquez sur Mettre à jour.
The Datastore Manager is intended for advanced-level DHIS2 users. Before you use the Datastore Manager, you can read more about the Data store here: DHIS2 data store.
The Datastore Manager lets you manage the content of the web API data stores. This is helpful when managing apps and external scripts.
N.B. : Vous devez d'abord créer un espace de noms avant de pouvoir y ajouter une clé.
Cliquez sur Nouveau.
Entrez un nom pour le namespace que vous souhaitez créer.
Enter a key name, and select Create. The new namespace displays in the left pane.
Pour ajouter une nouvelle clé à un espace de noms existant dans le gestionnaire de la base de données,
sélectionnez l'espace de noms auquel vous souhaitez ajouter une clé.
Cliquez sur le menu des options, puis sur Nouvelle clé.

Entrez un nom de clé dans la boîte de dialogue Nouvelle clé.
Click Create. The new key is added to the namespace you selected.
To delete a namespace, or key, click the Options menu, and then click Delete, and then Delete again. Note that if you delete the only key in a namespace, you will also delete the namespace it belongs to.
Use the search tool in the top left corner to search for namespaces and keys as follows:
Enter a namespace name followed by # and the key name to search for a specific key in a namespace.
Enter # followed by the name of a key to search for keys only.

Use the search tool in the workspace toolbar to search your JSON library.

Use the Search tool to find namespaces or keys in your datastore. When you edit your content, you can toggle between the Tree view and the Code view. Use the Tree view to get an overview of the contents of the Datastore. Use the Code view to edit your code directly in the code editor. Remember to save your work by clicking the Save button.
In the Code view, you can edit your code. When you edit a line of code, it is highlighted in yellow.
Any errors are marked by the editor. If you hover over the error icon, you can view a short description of the error.
A data value in DHIS2 is described by at least three dimensions: 1) data element, 2) organisation unit, and 3) period. These dimensions form the core building blocks of the data model.

As an example, if you want to know how many children that were immunised for measles in Gerehun CHC in December 2014, the three dimensions which describe that value are the data element "Measles doses given", the organisation unit "Gerehun CHC", and the period "December 2014". All data values have at least these three dimensions describing what, where, and when.
In addition to the data element, organisation unit, and period dimensions, data values may also be associated with additional data dimensions. A common use of this feature is to describe data values which are reported by multiple partners in the same location for the same data element and time period. In principle, it can be used as a "free-form" dimension, to describe multiple observations of the same phenomena at the same place and time. For more information about this, see Chapter 34: Additional data dimensions.
| Unité d'organisation | Élément de donnée | Période | Valeur |
|---|---|---|---|
| CHC Gerehun | Doses de vaccin anti-rougeoleux administrées | Déc-09 | 22 |
| CPS Tugbebu | Doses de vaccin anti-rougeoleux administrées | Déc-09 | 18 |
The data element mentioned above ,"Measles doses given", can be further disaggregated into by combinations of data element categories. Each system administrator of DHIS2 is free to define any data element category dimensions for data elements. There are however, certain best practices which should generally be followed.
Given the example of Measles vaccination, if you want to know whether these vaccines were given at the facility (fixed) or out in the community as part of the outreach services then you could add a dimension called e.g. "Place of service" with the two possible options "Fixed" and "Outreach". Then all data collected on measles immunisation would have to be disaggregated along these to options. In addition to this you might be interested in knowing how many of these children who were under 1 year or above 1 year of age. If so you can add an Age dimension to the data element with the two possible options "\<1 y" and ">1 y". This implies further detail on the data collection process. You can also apply both categories "Place of service" and "Age" and combine these into a data element category combination e.g. called "EPI disaggregation". You would then be able to look at four different more detailed values in stead of only one as in the example above for the data element "Measles doses given": 1) "Fixed and \<1 y, 2) Fixed and >1 y, 3) Outreach and \<1 y, and 4) Outreach and >1 y. This adds complexity to how data is collected by the health facilities, but at the same time opens up for new possibilities of detailed data analysis of Measles immunisation.
| Unité d'organisation | Élément de donnée | Lieu du service | Âge | Période | Valeur |
|---|---|---|---|---|---|
| CHC Gerehun | Doses de vaccin anti-rougeoleux administrées | Fixe | <1 y | Déc-09 | 12 |
| CHC Gerehun | Doses de vaccin anti-rougeoleux administrées | De proximité | <1 y | Déc-09 | 4 |
| CHC Gerehun | Doses de vaccin anti-rougeoleux administrées | Fixe | >1 y | Déc-09 | 4 |
| CHC Gerehun | Doses de vaccin anti-rougeoleux administrées | De proximité | >1 y | Déc-09 | 2 |
| CPS Tugbebu | Doses de vaccin anti-rougeoleux administrées | Fixe | <1 y | Déc-09 | 10 |
| CPS Tugbebu | Doses de vaccin anti-rougeoleux administrées | De proximité | <1 y | Déc-09 | 4 |
| CPS Tugbebu | Doses de vaccin anti-rougeoleux administrées | Fixe | >1 y | Déc-09 | 3 |
| CPS Tugbebu | Doses de vaccin anti-rougeoleux administrées | De proximité | >1 y | Déc-09 | 1 |
While the data element categories and their options described above provide the level of detail (disaggregation) at the point of data collection and how data values get stored in the database, the data element group sets and groups can be used to add more information to data elements after data collection. As an example, if you are analysing many data elements at the same time in a report, you would want to group these based on some criteria. Instead of looking at all the data captured in a form for immunisation and nutrition, you might want to separate or group data elements along a programme dimension (known as a data element group set in DHIS2) where "Immunisation" (or EPI) and "Nutrition" would be the two groups.
Expanding the report to include data from other programs or larger themes of health data would mean more groups to such a group set dimension, like "Malaria", "Reproductive Health", "Stocks". For this example, you would create a data element group set called "Programme" (or whatever name you find appropriate), and to represent the different programmes in this dimension you would define data elements groups called "EPI", "Nutrition", "Malaria", "Reproductive health" and so on, and add all these groups to the "Programme" group set. To link or tag the data element "Measles doses given" to such a dimension you must (in our example) add it to the "EPI" group. Which groups you add "Measles doses given" to does not affect how health facilities collect the data, but adds more possibilities to your data analysis. So for the group set dimensions there are three levels; the group set (e.g. "Programme"), the group (e.g. "EPI"), and the data element (e.g. "Measles doses given").
Indicators can be grouped into indicator groups and further into indicator group sets (dimensions) in exactly the same way as data elements.
| Unité d'organisation | Élément de donnée | Programme | Période | Valeur |
|---|---|---|---|---|
| CHC Gerehun | Doses de vaccin anti-rougeoleux administrées | PEV | Déc-09 | 22 |
| CHC Gerehun | Vitamine A administrée | Nutrition | Dec-09 | 16 |
| CPS Tugbebu | Doses de vaccin anti-rougeoleux administrées | PEV | Déc-09 | 18 |
| CPS Tugbebu | Vitamine A administrée | Nutrition | Déc-09 | 12 |
| CHC Gerehun | Nouveaux cas de paludisme | Paludisme | Déc-09 | 32 |
| CPS Tugbebu | Nouveaux cas de paludisme | Paludisme | Déc-09 | 23 |
Organisation units in DHIS2 should typically represent a location, such as a Community Health Centre or referral hospitals, or an administrative unit like "MoHS Sierra Leone", "Bo District" or "Baoma Chiefdom". In non-health sector applications, they could be "schools" or "water points". Orgunits are represented in a default hierarchy, usually the default administrative hierarchy of a country or region, and are therefore assigned an organisational level. As an example, Sierra Leone has four organisation unit levels; National, District, Chiefdom, and PHU, and all orgunits are linked to one of these levels. An orgunit hierarchy in DHIS2 can have any number of levels. Normally data is collected at the lowest level, at the health facility, but can be collected at any level within the hierarchy, such as both the districts as well as the facility level.
When designing reports at higher levels with data aggregated at the district or province level, DHIS2 will use the hierarchy structure to aggregate all the health facilities' data for any given unit at any level. The organisation unit level capturing the data always represents the lowest level of detail that is possible to use in data analysis, and the organisational levels define the available levels of aggregation along a geographical dimension.
While facility level is typically the lowest geographical level for disaggregation in DHIS2, there are ways to flexibly group organisation units into any number of dimensions by using the organisation unit groups and group set functionality. As an example, if all facilities are given an official type like "Community health center" or "District Hospital, it is possible to create an organisation unit group set called "Type" and add groups with the names of the types mentioned above. In order for the group sets to function properly in analysis, each organisation unit should be a member of a single group (compulsory and exclusive) within a group set. Stated somewhat differently, a facility should not be both a "Community health center" as well as a "District hospital".
You can improve the completeness of your aggregated data by inheriting the settings of a "parent" organisation unit in your organisation unit hierarchy. This is particularly helpful if you are aggregating the data of more than 100 organisation units. See the Maintenance app documentation for more details.
A more advanced use of organisation unit group sets is to create alternative hierarchies e.g. use administrative borders from other ministries. In Sierra Leone that could mean an alternative hierarchy of 1:MoHS, 2:Districts, and 3: Local councils, instead of the four-level hierarchy with chiefdoms and PHUs. For instance, if all PHUs are linked to a specific local council, it would be possible to look at data aggregated by local council instead of chiefdom. Then you would first need to create a group set called "Local council" and then create one organisation unit group for every local council, and finally link all PHUs to their corresponding local council group.
| District | Type d'OrgUnit | Élément de donnée | Période | Valeur |
|---|---|---|---|---|
| Bo | CHC | Doses de vaccin anti-rougeoleux administrées | Déc-09 | 121 |
| Bo | CPS | Doses de vaccin anti-rougeoleux administrées | Déc-09 | 98 |
| Bo | MCHP | Doses de vaccin anti-rougeoleux administrées | Déc-09 | 87 |
| Bombali | CHC | Doses de vaccin anti-rougeoleux administrées | Déc-09 | 110 |
| Bombali | CPS | Doses de vaccin anti-rougeoleux administrées | Déc-09 | 67 |
| Bombali | MCHP | Doses de vaccin anti-rougeoleux administrées | Déc-09 | 59 |
As mentioned above, all organisation units should be a member of a single group within a group set. If an organisation unit is not present in any group or is present in multiple group members in a group set, this can lead to unexpected results in the analysis modules. DHIS2 has integrity checks to identify organisation units which are not present in any organisation unit group set member, or which is present in multiple groups.
The period dimension becomes an important factor when analysing data over time e.g. when looking at cumulative data, when creating quarterly or annual aggregated reports, or when doing analysis that combines data with different characteristics like monthly routine data, annual census/population data or six-monthly staff data.
In DHIS2, periods are organised according to a set of fixed period types described below. The following list is for the default ISO 8601 calendar type.
Quotidien
Weekly: The system supports various weekly period types, with Monday, Wednesday, Thursday, Saturday and Sunday as the first day of the week. You collect data through data sets configured to use the desired weekly period type. The analytics engine will attribute weekly data to the month which contains four days or more of the week.
Bi-weekly: Two week periods beginning with the first week of the year.
Mensuel : Se réfère aux mois civils standard.
Bimensuel : Périodes de deux mois commençant en janvier.
Trimestriel : Trimestre norme ISO, à partir de janvier.
Semestriel : Périodes de six mois commençant en janvier
Annuel : Il s'agit d'une année civile.
Financial April: Financial year period beginning on April 1st and ending on March 31st of the calendar next year
Financial July: Financial year period beginning on July 1st and ending on June 31st of the calendar next year
Financial Oct: Financial year period beginning on October 1st and ending on September 31st of the calendar next year
Six-monthly April: Six-month periods beginning on April 1st with a duration of six calendar months.
As a general rule, all organisation units should collect the same data using the same frequency or periodicity. A data entry form therefore is associated with a single period type to make sure data is always collected according to the correct and same periodicity across the country.
It is possible however to collect the same data elements using different period types by assigning the same data elements to multiple data sets with different period types, however then it becomes crucial to make sure no organisation unit is collecting data using both data sets/period types as that would create overlap and duplication of data values. If configured correctly the aggregation service in DHIS2 will aggregate the data together, e.g. the monthly data from one part of the country with quarterly data from another part of the country into a national quarterly report. For simplicity and to avoid data duplication it is advised to use the same period type for all organisation units for the same data elements when possible.
In addition to the fixed period types described in the previous section, DHIS2 also support relative periods for use in the analysis modules.
When creating analytical resources within DHIS2 it is possible to make use of the relative periods functionality. The simplest scenario is when you want to design a monthly report that can be reused every month without having to make changes to the report template to accommodate for the changes in period. The relative period called "Last month" allows for this, and the user can at the time of report generation through a report parameter select the month to use in the report.
A slightly more advanced use case is when you want to make a monthly summary report for immunisation and want to look at the data from the current (reporting) month together with a cumulative value for the year so far. The relative period called "This year" provides such a cumulative value relative to the reporting month selecting when running the report. Other relative periods are the last 3,6, or 12 months periods which are cumulative values calculated back from the selected reporting month. If you want to create a report with data aggregated by quarters (the ones that have passed so far in the year) you can select "Last four quarters". Other relative periods are described under the reporting table section of the manual.
| Unité d'organisation | Élément de donnée | Mois de référence | Jusqu'à présent cette année | Nom du mois de référence |
|---|---|---|---|---|
| CHC Gerehun | Doses de vaccin anti-rougeoleux administrées | 15 | 167 | Oct-09 |
| CPS Tugbebu | Doses de vaccin anti-rougeoleux administrées | 17 | 155 | Oct-09 |
While data needs to be collected on a given frequency to standardise data collection and management, this does not put limitations on the period types that can be used in data analysis and reports. Just like data gets aggregated up the organisational hierarchy, data is also aggregated according to a period hierarchy, so you can create quarterly and annual reports based on data that is being collected on a Monthly basis. The defined period type for a data entry form (data set) defines the lowest level of period detail possible in a report.
When aggregating data on the period dimension there are two options for how the calculation is done, namely sum or average. This option is specified on a per data element in DHIS2 through the use of the 'aggregation operator' attribute in the Add/Edit Data Elements dialog.
Most of the data collected on a routinely basis should be aggregated by summing up the months or weeks, for instance to create a quarterly report on Measles immunisation one would sum up the three monthly values for "Measles doses given".
Other types of data that are more permanently valid over time like "Number of staff in the PHU" or an annual population estimate of "Population under 1 year" need to be aggregated differently. These values are static for all months as long as there are valid data. For example, the "Estimated population under 1", calculated from the census data ,is the same for all months of a given year, or the number of nurses working in a given facility is the same for every month in the 6 months period the number is reported for.
This difference becomes important when calculating an annual value for the indicator morbidity service burden for a facility. The monthly head-counts are summed up for the 12 months to get the annual headcount, while the number of staff for the PHU is calculated as the average of the two 6-monthly values reported through the 6-monthly staff report. So in this example the data element "OPD headcount" would have the aggregation operator "SUM" and the data element "Number of staff" would have it set to "AVERAGE".
Another important feature of average data elements is the validity period concept. Average data values are standing values for any period type within the borders of the period they are registered for. For example, an annual population estimate following the calendar year, will have the same value for any period that falls within that year no matter what the period type. If the population under 1 for a given facility is 250 for the year of 2015 that means that the value will be 250 for Jan-15, for Q3-15, for Week 12 of 2015 and for any period within 2015. This has implications for how coverage indicators are calculated, as the full annual population will be used as denominator value even when doing monthly reports. If you want to look at an estimated annual coverage value for a given month, then you will have the option of setting the indicator to "Annualised" which means that a monthly coverage value will be multiplied by a factor of 12, a quarterly value by 4, in order to generate an effective yearly total. The annualised indicator feature can therefore be used to mimic the use of monthly population estimates.
Datasets determine what raw data that is available in the system, as they describe how data is collected in terms of periodicity as well as spatial extent. Data sets define the building blocks of the data to be captured and stored in DHIS2. For each data dimension we decide what level of detail the data should be collected at namely 1) the data element (e.g. diagnosis, vaccine, or any event taking place) and its categories (e.g. age and gender), 2) the period/frequency dimension, and 3) the organisation unit dimension. For any report or data analysis you can never retrieve more detailed data than what is defined in the data sets, so the design of the datasets and their corresponding data entry forms (the data collection tools) dictate what kind of data analysis will be possible.
It is important to understand that the data entry forms or datasets themselves are not intrinsically linked to the underlying data value and that the meaning of data is only described by the data element (and its categories). This makes it perfectly safe to modify datasets and forms without altering the data (as long as the data elements stay the same). This loose coupling between forms and data makes DHIS2 flexible when it comes to designing and changing new forms and in providing exactly the form the users want.
Another benefit of only linking data to data elements and not to forms, is the flexibility of creating indicators and validation rules based on data elements, and also in providing any kind of output report (in pivot tables, charts, maps etc.) that can combine data individually or across forms, e.g. to correlate data from different health programs. Due to this flexibility of enabling integration of data from various programs (forms) and sources (routine and semi permanent (population, staff, equipment)) a DHIS2 database is used as an integrated data repository for many or all parts of the aggregated data in a larger HIS. The figure below illustrates this flexibility.

In this example, we see that data elements from multiple forms can be combined to create a given indicator. As a more concrete example, one might collect "Population under one year of age" in an annual data set by district, and then collect a data element like "Fully immunized children" by month at the facility level. By annualizing the population, we can generate an approximation of the effective monthly population, and combining this with the aggregate total of the number of fully immunized children by month, it would be possible to generate an indicator "Fully immunized coverage", consisting of the aggregated total of children who are fully immunized, divided by the effective monthly population.
The table below combines data element the two group sets Diagnosis (all the diseases) and Morbidity/Mortality (New cases, Follow-ups, Referrals, Deaths) with the data element category PHU/Community. Deaths are captured in a separate form with other dimensions (e.g. the PHU/Community) than morbidity.
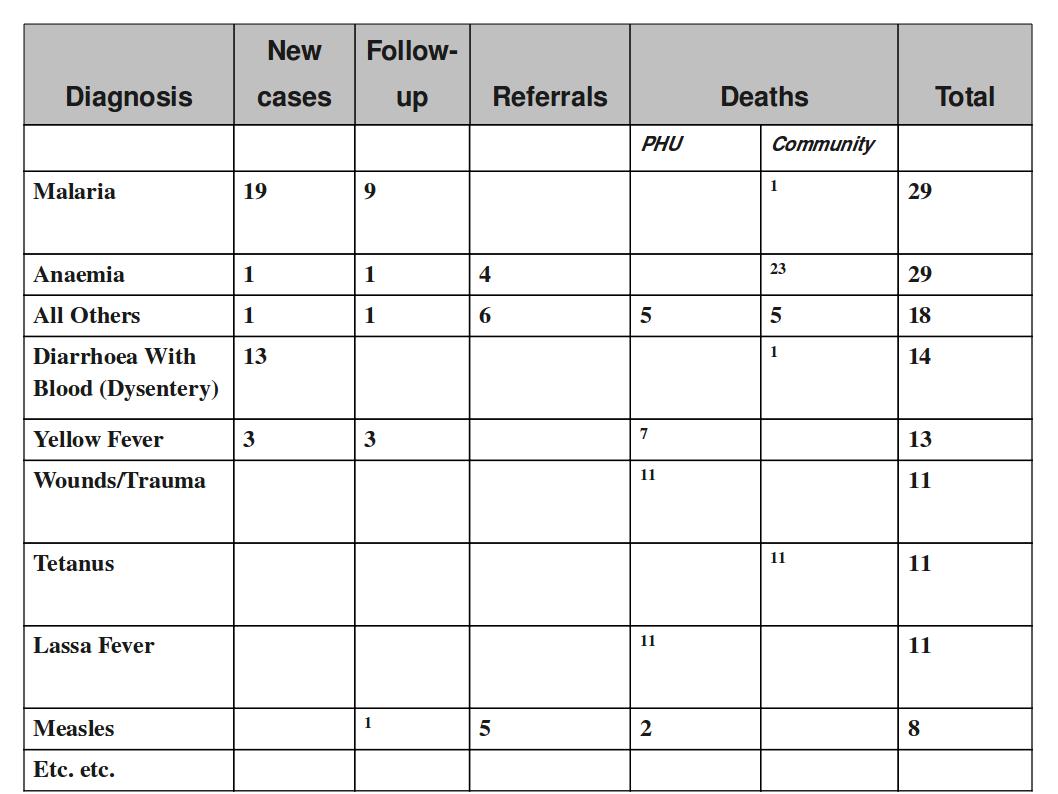
This output table combines the two data element categories HIV_Age and Gender with the data element group set ART Group. The group enables subtotals for staging and entry points summing up the data elements in that group. Subtotals for either age groups and gender would be other possible columns to easily include here.
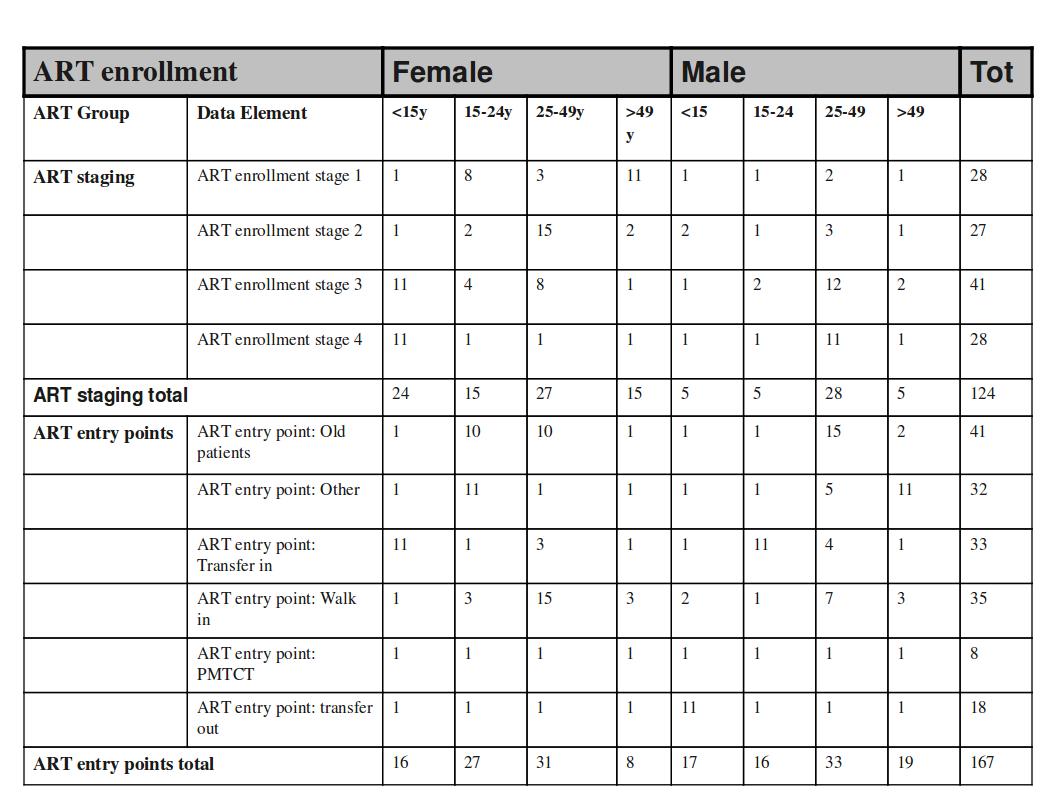
When doing data analysis in Excel pivot tables or any other OLAP based tool the dimensions become extremely powerful in providing many different views into the data. Each data element category or group set become a pivot field, and the options or groups become values within each of these fields. In fact categories and groupsets are treated exactly the same way in pivot tables, and so are orgunits, periods, and data elements. All these become dimensions to the data value that can be used to rearrange, pivot, filter, and to drill down into the data. Here we will show some examples of how the data dimensions are used in pivot tables.
Using the example of morbidity and mortality data, a pivot table can show how the dimensions can be used to view data for different aggregation levels.
The completely aggregated number is viewed when none of the pivot fields are arranged in the table area, as column or row fields, but are listed above the table itself as page field (filter).

Here we have selected to look at the Morbidity total. The various data elements on morbidity have been ordered into the main_de_groups Morbidity (we will get back to Mortality later). The fields above the table itself are all set to "All", meaning that the totals in the table will contain data from all Countries, Districts, Chiefdom, ou_type, year, months, the various categories as listed in the red fields, and all data elements in the Morbidity group.
As we have seen, this is not a very useful representation, as Morbidity is organized into new cases, follow-ups, referrals, and then again in age groups. Also, we do not see the various diagnoses. The first step is to include the diagnoses field (which is a group set), which is done by dragging the "diagnosis" field down to be a row field, as shown in the figure below, and to add the group set called "morbiditymortality" in the column field to display new cases, follow-up, and referrals.
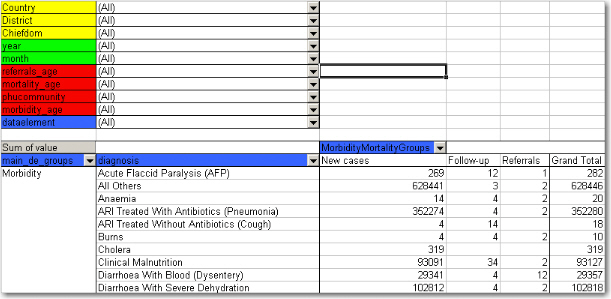
Comparez ce chiffre ci-dessus à celui ci-dessous.
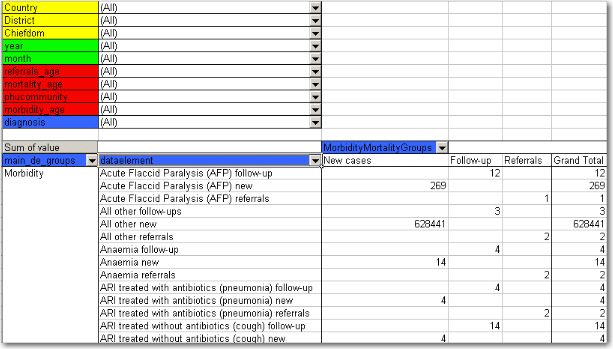
They both show the same data (some of the rows have been cut in the screenshot due to image size), albeit in a different way.
The "dataelement" field, used in the bottom figure, displays each diagnosis as three elements; one follow-up, one new, and one referrals. This is the way the data elements have been defined in DHIS2, as this makes sense for aggregation. You would not like to aggregate follow-ups and new, thus these have not been made as categories, the whole point of is to ease aggregation and disaggregation.
The "diagnosis" group set has instead been made to lump these three (follow-up, new, referrals) together, which can then be split with another group set, namely the one called "morbiditymortality". This allows us to organize the data as in the first of the two figures, where we have the single diagnosis per row, and the groups new, follow-up, referrals as rows.
The idea of using group sets is that you can combine, in any set, different data elements. Thus, if we add the mortality data (by checking it from the drop-down menu of the main_de_groups field, and moving this field out of the table) we can see also the deaths, since the mortality data elements have been included as a "death" group in the "morbiditymortality" group set. The result is shown below.
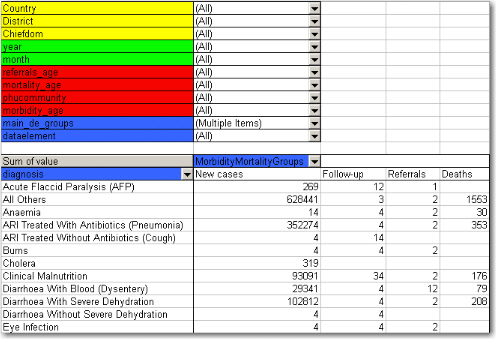
The result is a much more user-friendly pivot table. Now, another figure shows the relationship between the group sets and elements (these are fake data values).
This small detail of the pivot table show how the actual data elements link to the group sets:
The four data elements, as defined in DHIS2, are Measles death, Measles follow-up, Measles new, and Measles referrals
They all belong to the group set "diagnosis", where they have been lumped together in the group Measles
The group set "morbiditymortality" contains the groups New cases, Follow-up, Referrals, and Deaths.
Only the data element Measles deaths has data related to the group Deaths, thus this is where the data value (20) is shown, at the upper right corner. The same for Measles new; the value (224) is shown at the intersection of the data element Measles new and the group New cases (in the group set morbiditymortality)
All the intersections where the data element does not link with the groups in morbiditymortality are left blank. Thus in this case we would get a nice table if we excluded the data element from the table, and just had diagnosis and the group set morbiditymortality, as in the figure shown earlier
Now lets see how the data element categories can be used. In the data entry form for Morbidity the new cases and follow-ups use one age category, the referral data another,, and the mortality data a third age breakup, so these are available as three individual age group fields in the pivot tables called morbidity_age, referrals_age and mortality_age. It doesn't make sense to use these while looking at these data together (as in the examples above), but e.g. if we only want to look at the only the new cases we can put the MobidityMortalityGroups field back up as a page field and there select the New cases group as a filter. Then we can drag the Morbidity_age field down to the column area and we get the following view:
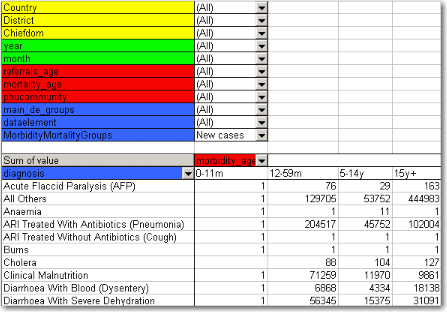
The following table illustrates the benefits of reusing data element categories across datasets and category combinations. The VCCT, ART and PMTCT data are collected in three different datasets, the first two with both gender and age breakdown, and the PMTCT only age (gender is given). All three share the same age groups and therefore it is possible to view data elements from all these three datasets in the same table and use the age dimension. In the previous example with morbidity and mortality data this was not possible since new cases, referrals and deaths all have different age groups.

In the table below PMTCT data has been removed from the table and the gender category added to the column area so that you can analyse the data for VCCT and ART by age and gender. An optional subtotal for gender has also been added, as well as a grand total for all age and gender.

Typically the design of a DHIS2 dataset is based on some requirements from a paper form that is already in use. The logic of paper forms are not the same as the data element and data set model of DHIS2, e.g. often a field in a tabular paper form is described both by column headings and text on each row, and sometimes also with some introductory table heading that provides more context. In the database this is captured in one atomic data element with no reference to a position in a visual table format, so it is important to make sure the data element with the optional data element categories capture the full meaning of each individual field in the paper form.
Another important thing to have in mind while designing datasets is that the dataset and the corresponding data entry form (which is a dataset with layout) is a data collection tool and not a report or analysis tool. There are other far more sophisticated tools for data output and reporting in DHIS2 than the data entry forms. Paper forms are often designed with both data collection and reporting in mind and therefore you might see things such as cumulative values (in addition to the monthly values), repetition of annual data (the same population data reported every month) or even indicator values such as coverage rates in the same form as the monthly raw data. When you store the raw data in DHIS2 every month and have all the processing power you need within the computerised tool there is no need (in fact it would be stupid and most likely cause inconsistency) to register manually calculated values such as the ones mentioned above. You only want to capture the raw data in your datasets/forms and leave the calculations to the computer, and presentation of such values to the reporting tools in DHIS2.
As we have seen in the examples above, data element categories and category options are helpful in representing tabular data, when adding dimensions to a field in a paper form. We have also seen how the data element is one of the required dimensions which describe data in DHIS2. As we will see in the example below there are often more than one way to represent a paper form in DHIS2 , and it can be difficult to know which dimension to represent with a data element name and which to represent as categories, or even as groups as we have seen above. Here are some general lessons learned from working with data element and category combinations:
Design your dimensions with data use in mind, not data collection. This means that disaggregation of data values at collection time should be easily aggregated up along the various dimensions, as in adding up to a meaningful total.
Reuse dimensions as much as possible as this increases the ability to compare disaggregated data (e.g. age groups, fixed/outreach, gender).
Disaggregation dimensions should add up to a total. In certain cases, data elements may be collected a subsets of each other. In this case, use of categories to disaggregate the data element should not be used. As an example, we might collect "Number of confirmed malaria cases" and disaggregate this by "Under 5" and "Over 5". A third data element "Number of confirmed malaria cases under 1" might also exist on the form. It would seem reasonable then to create three age groups : Under 1, Under 5 and Over 5, to describe the disaggregation. However, the Under 1 is actually a subset of the Under 5 group, and when totalled, would result in duplication. Thus, categories should be generally be composed of mutually exclusive category options, such that the sum of individual category options results in a coherent total.
Different levels of dimensions; 1) disaggregation and 2) grouping. Disaggregation dimensions dictate how you collect and how detailed you store your data, so plan these carefully. The group dimension is more flexible and can be changed and added to even after data collection (think of it as tagging).
It is best to think of how the data would be used in an integrated data repository and not how it will actually be collected on forms or by programs when designing the meta-data model. Ideally, the same type of disaggregation should be used across forms and datasets for data elements which will be analysed together, or used to build indicators. Reuse definitions so that the database can integrate even though the forms themselves might be duplicated (which in practice, is often the case).
In order to better explain the approach and the possibilities we present an example paper form and will walk through it step by step and design data elements, categories, category options and category combinations.
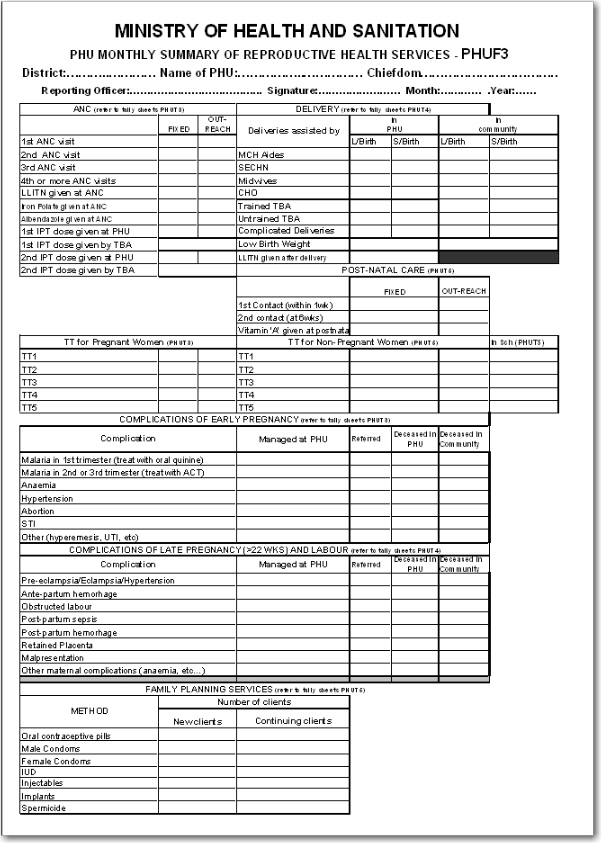
This form has many tables and each of them potentially represent a data element category combination (from now on referred to as a catcombo). As such there is no restriction on a dataset to only have one set of dimensions or catcombo, it can have many and as we see above this is necessary as the dimensions are very different from table to table. In the following paragraphs, we will analyse how to break down this form into its component pieces and suggest an implementation pathway in DHIS2.
ANC table. This table in the top left corner is one the simpler ones in this form. It has two dimensions, the first column with the ANC activity or service (1st visit, IPT 2nd dose etc) and the second and third column which represent the place where the service was given with the two options "Fixed" and "Outreach". Since the ANC service is the key phenomena to analyse here, and often there is a need for looking at the total of "ANC 1st visits" no matter where they actually took placed, it makes a lot of sense to use this dimension as the data element dimension.
Thus, all items on the first column from "1st ANC" visit to "2nd IPT dose given by TBA" are represented as individual data elements. The "where" dimension is represented as a data element category (from now on referred to as category) with the name "fixed/outreach" with the two data element category options (from now on catoptions) "fixed" and "outreach". There is no other dimension here so we add a new catcombo with the name "Fixed/Outreach" with one category "Fixed/Outreach". Strictly speaking there is another dimension in this table, and that is the at PHU or by TBA dimension which is repeated for the two doses of IPT, but since none of the other ANC services listed have this dimension it does not seem like a good idea to separate out two data elements from this table and give them another catcombo with both fixed/outreach and at PHU/by TBA. reusing the same catcombo for all the ANC services makes more sense since it will be easier to look at these together in reports etc. and also the fact that there is not much to lose by repeating the at PHU or by TBA information as part of the data element name when it is only for four data elements in a table of eleven data elements.
DELIVERY table. This table is more tricky as it has a lot of information and you can see that not all the rows have the same columns (some columns are merged and a one field is greyed out/disabled.). If we start by looking at the first column "Deliveries assisted by" that seems to be one dimension, but only down to the "Untrained TBA" row, as the remaining three rows are not related to who assisted the delivery at all. Another dimension is the place of delivery, either In PHU or in Community as stated on the top column headings. These deliveries are further split into the outcome of the delivery, whether it is a live or still birth, which seems to be another dimension. So if we disregard the three bottom rows for a moment there seems to be 3 dimensions here, 1) assisted by, 2) place of delivery, and 3) delivery outcome. The key decision to make is what to use as the data element, the main dimension, the total that you will most often use and want easily available in reports and data analysis.
In this case, the outcome dimension as "Total live births" is a very commonly used value in many indicators (maternal mortality ratio, births attended by skilled health personnel etc.). In this case the "Assisted By" dimension could also have been used without any problem, but the added value of easily getting the total live births information was the decisive point for us. This means that from this table (or sub-table of row 1 to 6) there are only two data elements; "Live births" and "Still births".
Next, there are two more dimensions, the "PHU/Community" with its two options and a "Births attended by" with options ("MCH Aides", "SECHN", "Midwives", "CHO", "Trained TBA", "Untrained TBA"). These two categories make up the catcombo "Births" which is assigned to the two data elements "Live births" and "Still births". Considering the final three rows of the delivery table we can see that "Complicated Deliveries" does not have the assisted by dimension, but has the place and the outcome. "Low birth weight" also does not have the assisted by dimension and not the outcome either. The LLITN given after delivery does not have any additional dimension at all. Since not any of the three rows can share catcombo with any other row we decided to represent these fields as so called flat data elements, meaning data elements with no categories at all, and simply adding the additional information from the column headings to the data element name, and therefore ended up with the following data elements with the default (same as none) catcombo; "Complicated deliveries in PHU live birth", "Complicated deliveries in PHU still births", "Complicated deliveries in community live birth", "Complicated deliveries in community still births", "Low birth weight in PHU", "Low birth weight in community", and "LLITN given after delivery".
POST-NATAL CARE table This table is simple and we used the same approach as for the ANC table. 3 data elements listed in the first column and then link these to the catcombo called "fixed/outreach". Reusing the same category fixed/outreach for these data elements enables analysis on fixed/outreach together with ANC data and other data using the same category.
TT table This table is somewhat more complex than the previous examples.We decided to use "TT1", "TT2" ... "TT5" as data elements which makes it easy to get the total of each one of these. There is fixed/outreach dimension here, but there is also the "In school place" that is only applied to the Non-Pregnant, or more correctly to any of the two as the school immunisation is done whether the girls are pregnant or not. We consulted the program people behind the form and found out that it would be OK to register all school TT immunisations as non-pregnant, which simplifies the model a bit since we can reuse the "TT1" to "TT5" data elements. So we ended up with a new category called "TT place" with the three options (Fixed, Outreach, In School), and another category called "Pregnant/Non-pregnant" with two options. The new catcombo "TT" is then a combination of these two and applied to the 5 TT data elements. Since we agreed to put all In Schools immunisations under Non-pregnant in means that the combination of options (Pregnant+In School) will never be used in any data entry form, and hence become a possible optioncombo, which is OK. As long as the form is custom designed then you can choose which combinations of options to use or not, and therefore it is not a problem to have such passive or unused catoptions. Having school as one option in the TT place category simplifies the model and therefore we thought it was worth it. The alternative would be to create 5 more data elements for "TT1 in school" ... "TT5 in school", but then it would be a bit confusing to add these together with the "TT1" ..."TT5" plus TT catcombo. Having school as a place in the TT place category makes it a lot easier to get the total of TT1.. TT5 vaccines given, which are the most important numbers and most often used values for data analysis.
Complications of early and late pregnancy and labour tables We treat these two tables as one, and will explain why. These two tables are a bit confusing and not the best design. The most important data coming out of these tables are the pregnancy complications and the maternal deaths. These data elements contain further detail on the cause of the complication or death (the first column in both tables), as well as a place of death (in PHU or community), and an outcome of the complication (when its not a death) that can be either "Managed at PHU" or " Referred". We decided to create two data elements for these two tables; "Pregnancy complications", and "Maternal Deaths", and two category combinations, one for each of the data elements. For the Pregnancy Complications data element there are two additional dimensions, the cause of the complication (the combined list of the first column in the two tables) and the outcome (managed at PHU or Referred), so these are the categories and options that make up that category combination. For the "Maternal deaths" data element the same category with the different causes are used and then another category for the place of death (in PHU or In community). This way the two data elements can share one category and it will be easy to derive the total number of pregnancy complications and maternal deaths. While the list of complications on the paper form is divided into two (early and late/labour) you can see that e.g. the malaria in 2nd and 3rd trimester are listed under early, but in fact are for a later phase of the pregnancy. There is no clear divide between early and late complications in the form, and therefore we gave up trying to make this distinction in the database.
Family Planning Services table This table has 2 dimensions, the family planning method (contraceptive) and whether the client is new or continuing. We ended up with one data element only "Family planning clients" and then added two categories "FP method" with all the contraceptives as options, and another category "FP client type" with new or continuing as options. This way it will be easy to get the total number of family planning clients which is the major value to look at in data analysis, and from there you can easily get the details on method or how many new clients there are.
Identify the different tables (or sub datasets) in the paper form that share the same dimensions
Pour chaque tableau, identifiez les dimensions qui décrivent les champs de données
Identify the key dimension, the one that makes most sense to look at in isolation (when the others are collapsed, summed up). This is your data element dimension, the starting point and core of your multidimensional model (sub dataset). The data element dimension can be a merger of two or more dimensions if that makes more sense for data analysis. The key is to identify which total that makes most sense to look at alone when the other dimensions are collapsed.
For all other/additional dimensions identify their options, and come up with explanatory names for dimensions and their options.
Each of these additional dimensions will be a data element category and their options will be category options.
Combine all categories for each sub dataset into one category combination and assign this to all the data elements in your table (or sub dataset if you like).
7. When you are done with all the tables (sub datasets), create a new dataset and add all the data elements you have identified (in the whole paper form) to that dataset.
8. Your dataset will then consist of a set of data elements that are linked to one or more category combinations.
DHIS2 has the ability to add dimensions to data in addition to what was described in the previous chapter. We will call these dimensions "attribute categories" (ACs). The categories described in the previous chapter we will call "disaggregation categories" (DCs) to differentiate them from ACs.
ACs and DCs are quite similar—they work in much the same way, are accessed through the same part of the maintenance interface, and exist in the same part of the database. The main difference between them is what they are connected to: a DC is attached to a data element. An AC, however, is attached to a data set. This means values for all DC options can be entered on the same data entry screen, whereas you must choose the AC option before you begin to enter data.
In setting up a system, you could just use DCs and ignore ACs altogether. However, ACs are a way to simplify data entry screens or reduce the size of the cross-product of category option combos.
When you’re deciding which categories should be DCs and which should be ACs, here’s a good rubric:
Use DCs when you want to use different combinations of categories on different data elements within a data set
Use DCs when you want to enter all the category option combinations on one data entry screen
Use ACs when you want to use the same combination of categories for all the data in a data set
Use ACs when you want to enter only one category option combination on one data entry screen
While we referred to DCs as part of the what dimension for simplicity in the former chapter, it’s actually more complex. Either DCs or ACs can answer any question about a data element, including what (of course), who, why, how, or even a where or a when beyond the organisation unit and period dimensions.
For the process of creating an attribute category as well as options and combinations, see the section of this manual named Manage categories.
A relationship represents a link between two entities in the Tracker-model. A relationship is considered data in DHIS2 and is based on a Relationship Type, similar to how a Tracked Entity Instance is based on a Tracked Entity Type.
Relationships always include two entities, and these entities can include Tracked Entity Instances, Enrollments and Events, and any combination of these. Note that not all of these combinations are available in the current apps.
In addition, relationships can be defined as unidirectional or bidirectional. The only functional difference is currently that these requires different levels of access to create. Unidirectional relationships requires the user to have data write access to the "from" entity and data read access for the "to" entity, while bidirectional relationships require data write access for both sides.
A Relationship Type is the definition of the properties a relationship have. Relationships always consists of two sides, referred to as "from" and "to", and what entities can be contained for each side is determined by the Relationship Type. The properties that determine what each can contain are called constraints, fromConstraint and toConstraint respectively. These constraints are significant when working with the data later, to understand what a relationship can and cannot contain.
Each of the constraints defined in the Relationship Type consists of several properties. The primary property is the relationship entity, which decides what kind of entities the relationship can contain. The entities can be one of the following for each constraint:
Depending on the kind of relationship entity you select, you can choose additional limitations for each constraint. The following table explains the different combinations you can configure:
| Instance d'entité suivie | Inscription | Événement | |
|---|---|---|---|
| Type d'entité suivie | Obligatoire | Facultatif | - |
| Programme | - | Obligatoire | - |
| Étape du programme | - | Obligatoire | Facultatif |
These additional limitations, will require the entity to match the limitation set before it can be created. For example, if your relationship is between a mother and a child, both constraints would have their required Tracked Entity Type set to Person and could optionally set the Enrollment to Maternal Health Program and Child Program respectively. This way, only Tracked Entity Instances who are of type Person and who is enrolled in the required program is allowed to be included in these relationships.
In addition to the constrains a Relationship Type can have, each relationship can be set to bidirectional, true or false. If the property is set to false, the relationships are treated as unidirectional. As previously mentioned, the only functional difference between these relationships are how strict the access is when creating or updating them - bidirectional being the strictest. Relationships are also presented differently in the UI based on whether or not the relationship is bidirectional or unidirectional.
One important thing to note about bidirectional relationships, are that the "from" and "to" sides are still significant in the database, meaning each entity must match the constraint for that side. However, from a user perspective, which side each entity is stored as is insignificant.
Aggregation In the context of DHIS2, aggregation refers to how data elements are combined within a particular hierarchical relationship. As an example, all the health facilities in a particular district would contribute to the total value for the particular district in question. Different aggregation operators are supported within DHIS2, such as SUM, AVERAGE, and COUNT.
Analytics Analytics refers to the process which processes and prepares data which has been entered into DHIS2 into a format which is more suitable for retrieving indicators and aggregated data. When data is entered into DHIS2, it is stored in a format which is optimized for writing the data. However, when data needs to be processed into indicators or aggregated (e.g from months to quarters), it is more efficient to transform and store this data in a different format which is optimized for read-only operations. The analytics system of DHIS2 is used extensively by the analytics apps (GIS, Pivot Table, Event reports, etc.).
It is important to keep in mind that because the data which has been entered into DHIS2 must be processed into the analytics format, the data which appears in the analytics apps only represents the data which was present in the system the last time analytics was run. If data has been entered after that, analytics will need to be run again for this data to appear in the analytics apps.
Aggregate data In the context of DHIS2, aggregate data refers to either data elements or indicators that have been derived from other hierarchical data sources. For instance, aggregate facility data would result from the aggregate totals of all patients that have attended that facility for a particular service. Aggregate district data would result from the aggregate totals of all facilities contained with a particular district.
Application programming interface An application programming interface is a specification of how different software components should interact with each other. The DHIS2 API (or WebAPI) can be used to interface DHIS2 with other software, to build reports or custom data entry forms.
Approvals Approvals can be used to control the visibility and editibility of data. When data is submitted from the lowest reporting level, it can be approved by the next higher level. This approval has two effects:
Data is no longer able to be edited in the data entry screens at the lower level.
Depending on the system settings which have been enabled, the data will become visible at the approval level.
As an example, data is entered at the facility level, and the submitted for approval. Once the data has been approved at the district level, the data will become locked in the data entry screens for the facility level. It will also become visible in the analytics apps to district users.
Category Categories are groups of category options. The are used in combinations to disaggregate data elements. Categories are typically a single type of concept, such as "Age" or "Gender".
Category combinations Category combinations are used to disaggregate data elements. As an example, the data element "Number of confirmed cases of malaria" could be disaggregated subdivided into to categories: "Age" and "Gender". In turn each of these categories, would consist of several category options, such as "Male" and "Female" for the gender category. Category combinations may consist of one or several categories.
Category combination options Category combination options are dynamically composed of all of the different combinations of category options which compose a category combination. As an example, two categories "Gender" and "Age", might have options such as "Male"/"Female" and "\<5 years"/">5 years". The category combination options would then consist of:
(Homme / <5 ans)
(Homme/>5 ans)
(Femme/\<5 ans)
(Femme/>5 ans)
Category option Category options are atomic elements that are grouped into categories.
Comma separated values Comma separated values are series of tabular data stored in a plain-text format. They are commonly used with DHIS2 to export and import data values.
Dictionnaire de données A collection of data elements and indicators, which can be exchanged with other DHIS2 systems. Typically used to define a set of data elements and indicators when setting up the DHIS2 system.
Data exchange format In the context of DHIS2, the "data exchange format" refers to a XML schema that enables the transportation of data and meta-data between disconnected DHIS2 instances, as well as between different applications that support the DXF schema.
Datamart A set of database tables in DHIS2 that contains processed data elements and indicator values that is generated based on aggregation rules and calculated data element and indicator formulae. Datamart tables are used for analysis and report production. Typically, users should not work directly with unaggregated data values, but rather with values that have resulted from a datamart export for analysis.
Data element A data element is the fundamental building block of DHIS2. It is an atomic unit of data with well-defined meaning. Essentially it is a data value that has been actually observed or recorded which is further characterized by a number of dimensions. As an example the data element "Number of fully immunized children" would refer to the number of children that received this particular service. Data elements are always linked to a period as well as an organizational unit. They optionally may be linked to other dimensions.
Data element group Data element groups are used to categorize multiple data elements according to a common theme, such as "Immunization" or "ART". Typically, they are used during reporting and analysis to allow related data elements to be analysed together.
Ensemble de groupes d'éléments de donnée Data element groups are used to categorize multiple data element groups into a common theme.
Dimension A dimension is used to categorize data elements during analysis. Dimensions provide a mechanism to group and filter data based on common characteristics. Typically, related data elements may be aggregated or filtered during analysis with the use of dimensions. Dimensions may be a member of a hierarchy. For instance the "Period" dimension may be broken down into "Day->Month->Quarter->Year".
DXF
Indicateurs The divisor of an indicator. Can be composed of multiple data elements with the use of an indicator formula.
This is obviously a very generalized example. The numerator and indicator themselves can be composed of various data elements, factors, and the four basic operands (addition, multiplication, division and subtraction).
Organisational unit An organisational unit is usually a geographical unit, which exists within a hierarchy. As an example, in the United States, "Georgia" would be considered an organisational unit with in the orgunit level of "State". Organizational units can also be used to specify an administrative unit, such as a ward within a hospital. The organisational unit dimension specifies essentially "where" a particular data value occurs.
Organisational unit level Refers to a level within an organizational hierarchy. Typically, countries are administered at different levels, such as 1) Country 2) States 3) Counties 4) Health facilities. In the context of DHIS2, health facilities typically are the lowest orgunit level. Data is aggregated upwards from the lowest orgunit level to the highest.
Said Salah Eldin Al Said The health information system in Sudan The University of Oslo 2010 http://urn.nb.no/URN:NBN:no-27062
Eivind Anders Berg The challenges of implementing a health information system in Vietnam The University of Oslo 2007 http://urn.nb.no/URN:NBN:no-15021
Jørn Braa Calle Hedberg The Struggle for District-Based Health Information Systems in South Africa Information Society 18 113-127 2002 http://search.ebscohost.com/login.aspx?direct=true&db=aph&AN=6705438&site=ehost-live
Eric;Braa Jørn; Monteiro Sundeep Sahay Networks of Action: Sustainable Health Information Systems Across Developing Countries MIS Quarterly 28 3 2004 http://aisel.aisnet.org/misq/vol28/iss3/3/
Øyvind FBrucker Internationalization and localization - A case study from HISP The University of Oslo 2007 http://urn.nb.no/URN:NBN:no-15774
Hirut Gebrekidan Damitew Netsanet Haile Gebreyesus Sustainability and optimal use of Health Information Systems The University of Oslo 2005 http://urn.nb.no/URN:NBN:no-11506
Ved Anfinsen Edoardo Jacucci Cover Inger S EXPLORING TENSIONS IN INFORMATION SYSTEMS STANDARDIZATION Two Case Studies from Healthcare in Norway and South Africa 2006 http://folk.uio.no/edoardo/MatNatAvh_Jacucci_rettet.pdf
Anders Gjendem Recruitment, training, communication and Open Source The University of Oslo 2008 http://urn.nb.no/URN:NBN:no-19821
Nils Fredrik Gjerull Open Source Software Development in Developing Countries The University of Oslo 2006 http://urn.nb.no/URN:NBN:no-13117
Thor Helge Heldre Study of a Health Information System pilot project in Tanzania The University of Oslo 2006 http://urn.nb.no/URN:NBN:no-12362
Petter Jacobsen Design and development of a global reporting solution for DHIS The University of Oslo 2006 http://urn.nb.no/URN:NBN:no-12659
Arthur Heywood Woishet Mohammed Vincent ShawJørn Braa Ole Hanseth DEVELOPING HEALTH INFORMATION SYSTEMS IN DEVELOPING COUNTRIES: THE FLEXIBLE STANDARDS STRATEGY MIS Q 31 1 2007 http://heim.ifi.uio.no/~vshaw/Files/Published%20Papers%20included%20in%20Kappa/4_Braa_Flexible%20standards.pdf
Sundeep Sahay Jørn Braa Integrated Health Information Architecture - Power to the Users Matrix Publishers 384 2012
John Lewis Design and development of spatial GIS application for primary healthcare sector The University of Oslo 2005 http://urn.nb.no/URN:NBN:no-11504
Lars Mangset DHIS-2 - A Globally Distributed Development Process The University of Oslo 2005 http://urn.nb.no/URN:NBN:no-10640
Caroline Ngoma Cultivation Strategies in the Implementation of Health Management Information System in Zanzibar The University of Oslo 2007 http://urn.nb.no/URN:NBN:no-16911
Thanh Ngoc Nguyen OSS For Health Care in Developing Countries The University of Oslo 2007 http://urn.nb.no/URN:NBN:no-17859
E.K. Golly-Kobrissa R.T. Titlestad O. Braa J.Saeb J. Kossi Integrating health information systems in Sierra Leone 379 - 391 2009
Vincent Shaw A complexity inspired approach to co-evolutionary hospital management information systems development 2009 http://folk.uio.no/vshaw/Files/VShaw%20Kappa%20Final%20Version/2_V_Shaw%20Intro%20Chapter_no%20annex.pdf
Knut Staring O H Titlestad Development as a Free Software: Extending Commons Based Peer Production to the South ICIS 2008 Proceedings 50 2008 http://aisel.aisnet.org/icis2008/50
This paper examines the concept of commons-based peer production (CBPP) in the context of public health information systems in the South. Based on an analysis of the findings from a global network of software development and implementation, an approach to preserve the importance of local user participation in distributed development is presented. Through practical examples, we discuss the applicability of the CBPP model for software production aimed at improving the public health sector in the South, and propose the concept of a snowflake topology.
Margrethe Store Explore the challenges of providing documentation in open source projects The University of Oslo 2007 http://urn.nb.no/URN:NBN:no-15782
Leif Arne Storset Integration of Health Management Information Systems The University of Oslo 2010 http://urn.nb.no/URN:NBN:no-25666
Jorn Braa Vincent Shaw Shegaw Anagaw Mengiste Scaling of Health Information Systems in Nigeria and Ethiopia- Considering the Options 2007 http://heim.ifi.uio.no/~vshaw/Files/Published%20Papers%20included%20in%20Kappa/6_Shaw_IFP9.4%20Scaling%20of%20HIS_Considering%20the%20Options.pdf
Kim Anh ThiVo Challenges of Health Information Systems Programs in Developing Countries: SUCCESS and FAILURE The University of Oslo 2009 http://urn.nb.no/URN:NBN:no-23652
Jan HenrikØverland An Open Source Approach to Improving GIS Implementations in Developing Countries The University of Oslo 2010 http://urn.nb.no/URN:NBN:no-24751
Lars HelgeØverland Global Software Development and Local Capacity Building University of Oslo 2006 http://urn.nb.no/URN:NBN:no-13609
The DHIS2 team maintains a demonstration server at https://play.dhis2.org/demo. This is by far the easiest way to try out DHIS2. Simply open the link in your web browser and login with username = admin and password = district.
Note
All changes on this server are deleted each night, so do not save any important work on this server. It is strictly for demonstration purposes on only!
The DHIS2 Live package is the easiest way to get started with DHIS2 on your local computer. DHIS2 Live is appropriate for a stand-alone installation and demos. Simply download the application from here. Once the file is downloaded, you can simply double-click the downloaded file, and get started using DHIS2.
You must be sure that you have a current version of the Java Runtime installed on your machine. Depending on your operating system, there are different ways of installing Java. The reader is referred to this website for detailed information on getting Java installed.
The live package comes with a demo database just like what you see on the online demo (which is based on the national Sierra Leone HMIS), and if you want to start with a blank system/database and build up your own system then you need to do the following:
1) Stop DHIS2 live if it is already running. Right click on the tray icon and select Exit. The tray icon is the green symbol on the bottom right of your screen (on Windows) which should say' DHIS2 Server running' when you hover your mouse pointer over the icon.
2) Open the folder where the DHIS2 live package is installed and locate the folder called "conf".
3) In conf/ open the file called 'hibernate.properties' in a text editor (notepad or similar) and do the following modification: locate the string 'jdbc:h2:./database/dhis2' and replace the 'dhis2' part with any name that you want to give to your database (e.g. dhis2_test).
4) Enregistrez et quittez le fichier hibernate.properties.
5) Start DHIS2 Live by double-clicking on the file dhis2-live.exe in the DHIS2 Live installation folder or by using a desktop shortcut or menu link that you might have set up.
6) Wait for the browser window to open and the login screen to show, and then log in with username: admin and password: district
7) Now you will see a completely empty DHIS2 system and you should start by adding your users, organisational hierarchy, data elements, and datasets etc. Please refer to the other sections of the user manual for instructions on how to do this.
The latest stable server version can be downloaded from this website. For detailed information on how to install it please refer to the installation chapter in the implementation manual.
Regardless of whether you have installed the server version of the desktop Live version, you will use a web-browser to log on to the application. DHIS2 should be compatible with most modern web-browsers, although you will need to ensure that Java Script is enabled.
To log on to the application just enter http://localhost:8080/dhis if you are using the DHIS2 live package, or replace localhost with the name or IP address of the server where the server version is installed.
Once you have started DHIS2, either on-line or off-line, the displayed screen will prompt you to enter your registered user-name and password. After entering the required information click on log-in button to log into the application. The default user name and password are 'admin' and 'district'. They should be changed immediately upon logging on the first time.
You can select the language which you wish to display DHIS2 in from the "Change language" dialog box at the bottom of the screen. Not all languages may be available.
Should you have forgotten your password, you can click on the "Forgot password?" link. You must have informed DHIS2 of your email address and the server must be properly configured to send emails.
If you want to create your own account (and the server administrator allows this), simply click "Create an account" and follow the directions provided.
Once you have logged into DHIS2, refer to the specific sections in this manual for the different functionality which is available.
Just click on the Profile and the click "Log out" the top-right corner of the DHIS2 menu.
DHIS2 provides a powerful set of tools for data collection, validation, reporting and analysis, but the contents of the database, e.g. what to collect, who should collect it and on what format will depend on the context of use. However, in order to do anything with DHIS2, you must first create meta-data. Meta-data, or data about the data, describes what should be collected (data elements and categories), where it should be collected (organisation units) and how frequently it should be collected (periods). This meta-data needs to be created in the DHIS2 database before it can be used. This can be done through the user interface and requires no programming or in-depth technical skills of the software, but does require a good understanding of the processes which you are trying to collect data form.
This section will provide a very quick and brief introduction to DHIS2 database design and mainly explain the various steps needed to prepare a new DHIS2 system for use. How to do each step is explained in other chapters, and best practices on design choices will be explained in the implementers manual. Here are the steps to follow:
1. Configurez une hiérarchie organisationnelle
2. Définissez les éléments de données
3. Définissez les ensembles de données ainsi que les modèles de saisie de données
4. Définissez les règles de validation
5. Définissez les indicateurs
6. Définissez les tableaux de rapports et concevez les rapports
7. Configurez le module SIG
8. Concevez des graphiques et personnalisez le tableau de bord
The organisational hierarchy defines the organisation using the DHIS2, the health facilities, administrative areas and other geographical areas used in data collection and data analysis. This dimension to the data is defined as a hierarchy with one root unit (e.g. Ministry of Health) and any number of levels and nodes below. Each node in this hierarchy is called an organisational unit in DHIS2.
The design of this hierarchy will determine the geographical units of analysis available to the users as data is collected and aggregated in this structure. There can only be one organisational hierarchy at the same time so its structure needs careful consideration. Additional hierarchies (e.g. parallel administrative groupings such as "Facility ownership") can be modelled using organisational groups and group sets, however the organisational hierarchy is the main vehicle for data aggregation on the geographical dimension. Typically national organisational hierarchies in public health have 4-6 levels, but any number of levels is supported. The hierarchy is built up of parent-child relations, e.g. a Country or MoH unit (the root) might have e.g. 8 parent units (provinces), and each province again ( at level 2) might have 10-15 districts as their children. Normally the health facilities will be located at the lowest level, but they can also be located at higher levels, e.g. national or provincial hospitals, so skewed organisational trees are supported (e.g. a leaf node can be positioned at level 2 while most other leaf nodes are at level 5).
Typically there is a geographical hierarchy defined by the health system. e.g. where the administrative offices are located (e.g. MoH, province, district), but often there are other administrative boundaries in the country that might or might not be added, depending on how its boundaries will improve data analysis. When designing the hierarchy the number of children for any organisational unit may indicate the usefulness of the structure, e.g. having one or more 1-1 relationships between two levels is not very useful as the values will be the same for the child and the parent level. On the other extreme a very high number of children in the middle of the hierarchy (e.g. 50 districts in a province) might call for an extra level to be added in between to increase the usefulness of data analysis. The lowest level, the health facilities will often have a large number of children (10-60), but for other levels higher up in the hierarchy approx. 5-20 children is recommended. Too few or too many children might indicate that a level should be removed or added.
Note that it is quite easy to make changes to the upper levels of the hierarchy at a later stage, the only problem is changing organisational units that collect data (the leaf nodes), e.g. splitting or merging health facilities. Aggregation up the hierarchy is done based on the current hierarchy at any time and will always reflect the most recent changes to the organisational structure. Refer to the chapter on Organisation Units to learn how to create organisational units and to build up the hierarchy.
The Data Element is perhaps the most important building block of a DHIS2 database. It represents the "WHAT" dimension, it explains what is being collected or analysed. In some contexts this is referred to an indicator, but in DHIS2 we call this unit of collection and analysis a data element. The data element often represents a count of something, and its name describes what is being counted, e.g. "BCG doses given" or "Malaria cases". When data is collected, validated, analysed, reported or presented it is the data elements or expressions built upon data elements that describes the WHAT of the data. As such the data elements become important for all aspects of the system and they decide not only how data is collected, but more importantly how the data values are represented in the database, which again decides how data can be analysed and presented.
It is possible to add more details to this "WHAT" dimension through the disaggregation dimension called data element categories. Some common categories are Age and Gender, but any category can be added by the user and linked to specific data elements. The combination of a data element's name and its assigned category defines the smallest unit of collection and analysis available in the system, and hence describes the raw data in the database. Aggregations can be done when zooming out of this dimension, but no further drill-down is possible, so designing data elements and categories define the detail of the analysis available to the system (on the WHAT dimension). Changes to data elements and categories at a later stage in the process might be complicated as these will change the meaning of the data values already captured in the database (if any). So this step is one of the more decisive and careful steps in the database design process.
One best practice when designing data elements is to think of data elements as a unit of data analysis and not just as a field in the data collection form. Each data element lives on its own in the database, completely detached from the collection form, and reports and other outputs are based on data elements and expressions/formulas composed of data elements and not the data collection forms. So the data analysis needs should drive the process, and not the look an feel of the data collection forms. A simple rule of thumb is that the name of the data element must be able to stand on its own and describe the data value also outside the context of its collection form. E.g. a data element name like "Total referrals" makes sense when looking at it in either the "RCH" form or the "OPD" form, but on its own it does not uniquely describe the phenomena (who are being referred?), and should in stead be called "Total referrals from Maternity" or "Total referrals from OPD". Two different data elements with different meanings, although the field on the paper form might only say "Total referrals" since the user of the form will always know where these referrals come from. In a database or a repository of data elements this context is no longer valid and therefore the names of the data elements become so important in describing the data.
Common properties of data elements can be modelled through what is called data element groups. The groups are completely flexible in the sense that they are defined by the user, both their names and their memberships. Groups are useful both for browsing and presenting related data, but can also be used to aggregate data elements together. Groups are loosely coupled to data elements and not tied directly to the data values which means they can be modified and added at any point in time without interfering with the raw data.
All data entry in DHIS2 is organised through the use of Datasets. A Dataset is a collection of data elements grouped together for data collection, and in the case of distributed installs they also define chunks of data for export and import between instances of DHIS2 (e.g. from a district office local installation to a national server). Datasets are not linked directly to the data values, only through their data elements and frequencies, and as such a dataset can be modified, deleted or added at any point in time without affecting the raw data already captured in the system, but such changes will of course affect how new data will be collected.
A dataset has a period type which controls the data collection frequency, which can be daily, weekly, monthly, quarterly, six-monthly, or yearly. Both which data elements to include in the dataset and the period type is defined by the user, together with a name, short name, and code.
In order to use a dataset to collect data for a specific orgunit you must assign the orgunit to the dataset, and this mechanism controls which orgunits that can use which datasets, and at the same time defines the target values for data completeness (e.g. how many health facilities in a district expected to submit RCH data every month).
A data element can belong to multiple datasets, but this requires careful thinking as it may lead to overlapping and inconstant data being collected if e.g. the datasets are given different frequencies and are used by the same orgunits.
Once you have assigned a dataset to an orgunit that dataset will be made available in Data Entry (under Services) for the orgunits you have assigned it to and for the valid periods according to the dataset's period type. A default data entry form will then be shown, which is simply a list of the data elements belonging to the dataset together with a column for inputting the values. If your dataset contains data elements with categories such as age groups or gender, then additional columns will be automatically generated in the default form based on the categories. In addition to the default list-based data entry form there are two more alternatives, the section-based form and the custom form.
Section forms allow for a bit more flexibility when it comes to using tabular forms and are quick and simple to design. Often your data entry form will need multiple tables with subheadings, and sometimes you need to disable (grey out) a few fields in the table (e.g. some categories do not apply to all data elements), both of these functions are supported in section forms. After defining a dataset you can define it's sections with subsets of data elements, a heading and possible grey fields i the section's table. The order of sections in a dataset can also be defined. In Data Entry you can now start using the Section form (should appear automatically when sections are available for the selected dataset). You can switch between default and section forms in the top right corner of the data entry screen. Most tabular data entry forms should be possible to do with sections forms, and the more you can utilise the section forms (or default forms) the easier it is for you. If these two types of forms are not meeting your requirements then the third option is the completely flexible, although more time-consuming, custom data entry forms.
When the form you want to design is too complicated for the default or section forms then your last option is to use a custom form. This takes more time, but gives you full flexibility in term of the design. In DHIS2 there is a built in HTML editor (FcK Editor) for the form designer and you can either design the form in the UI or paste in your HTML directly using the Source window in the editor. In the custom form you can insert static text or data fields (linked to data elements + category) in any position on the form and you have complete freedom to design the layout of the form. Once a custom form has been added to a dataset it will be available in data entry and used automatically. You can switch back to default and section (if exists) forms in the top right corner of the data entry screen.
Elements de Données
Indicators represent perhaps the most powerful data analysis feature of the DHIS2. While data elements represent the raw data (counts) being collected the indicators represent formulas providing coverage rates, incidence rates, ratios and other formula-based units of analysis. An indicator is made up of a factor (e.g. 1, 100, 100, 100 000), a numerator and a denominator, the two latter are both expressions based on one or more data elements. E.g. the indicator "BCG coverage \<1 year" is defined a formula with a factor 100, a numerator ("BCG doses given to children under 1 year") and a denominator ("Target population under 1 year"). The indicator "DPT1 to DPT3 drop out rate" is a formula of 100 % x ("DPT1 doses given"- "DPT3 doses given") / ("DPT1 doses given").
Most report modules in DHIS2 support both data elements and indicators and you can also combine these in custom reports, but the important difference and strength of indicators versus raw data (data element's data values) is the ability to compare data across different geographical areas (e.g. highly populated vs rural areas) as the target population can be used in the denominator.
Toutes les saisies de données dans DHIS 2 se font à travers les ensembles de données. Un ensemble de données est une collection d'éléments de données regroupées pour la collecte de données, et dans le cas d'installations distribuées, ils définissent également des morceaux de données pour l'exportation et l'importation entre instances de DHIS 2 (par exemple exportation d'une installation locale au bureau de district vers l'installation sur le serveur national). Les ensembles de données ne sont pas liés directement aux valeurs de données, mais à travers les éléments de données qui les constituent et les fréquences de collecte; en tant que tel un ensemble de données peut être modifié, supprimé ou ajouté à moment sans affecter les données brutes déjà saisies dans le système. De telles modifications auront toutefois une incidence sur la façon dont les nouvelles données seront collectées.
Standard reports in DHIS2 are a very flexible way of presenting the data that has been collected. Data can be aggregated by any organisational unit or orgunit level, by data element, by indicators, as well as over time (e.g. monthly, quarterly, yearly). The report tables are custom data sources for the standard reports and can be flexibly defined in the user interface and later accessed in external report designers such as iReport or through custom HTML reports. These report designs can then be set up as easily accessible one-click reports with parameters so that the users can run the same reports e.g. every month when new data is entered, and also be relevant to users at all levels as the organisational unit can be selected at the time of running the report.
In the integrated GIS module you can easily display your data on maps, both on polygons (areas) and as points (health facilities), and either as data elements or indicators. By providing the coordinates of your organisational units to the system you can quickly get up to speed with this module. See the GIS section for details on how to get started.
La plupart des modules de rapport dans DHIS 2 supportent à la fois les éléments de données et les indicateurs et vous pouvez également combiner ceux-ci dans des rapports personnalisés; toutefois la différence importante et la force des indicateurs par rapport aux données brutes (les valeurs des éléments de données) est leur capacité de comparer les données entre les différentes zones géographiques (par exemple, zones densément peuplées et zones rurales) par le fait que la population cible peut être utilisée au niveau du dénominateur.
***Scorecards definition:** In public health settings such as Ministries of Health, scorecards offer a useful and standardized method for combining related indicators into one table. A scorecard gives an overall view of the performance of a health program such as a vaccination program, highlighting successes, weaknesses, and areas for improvement Here's what a typical scorecard looks like:*

This tutorial explains how to create a scorecard in the DHIS2 Pivot Table app. There are several advantages to using the Pivot Table to create a scorecard, such as:
Vous pouvez enregistrer la carte de pointage sur le tableau de bord et l'utiliser hors ligne.
Vous pouvez partager la carte de pointage avec d'autres utilisateurs de DHIS2.
Commençons donc !
First, we’ll create a 3-color “traffic light” legend for the scorecard. With three basic colors, the scorecard is easy to scan and easy to understand.
Open the Maintenance app. Click the menu in the top right corner and select Maintenance from the list of apps. You can also type the first letters of the word maintenance in the search field to find the app.

In the Maintenance app, scroll to the bottom of the page right down to the Other section.
Allez sur Legende et cliquez sur le +.

In the Legend Management page, scroll to the bottom of the page and create a new legend by clicking the blue + button.

Enter a name for the legend such as “Traffic light”, a start value and an end value in the fields. The values you enter here depend on the performance ratings you wish to set for the scorecard.
Change Number of legend items to 3 to display three colors in the scorecard. To change the legend item colors, click the blue + button and then edit the colors.
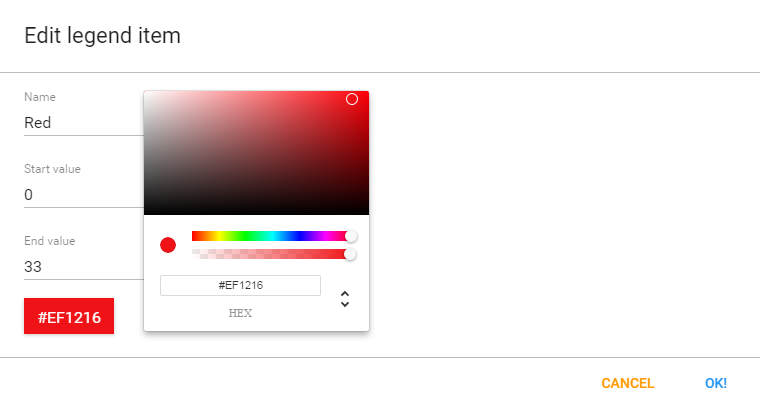
Open the Pivot Table app from the top right menu of the dashboard. You can also enter the first letters of Pivot Table in the search field.
Go to Data in the pane on the left side and select Indicators in the list.
Sélectionnez un groupe d'indicateurs tel que "ANC" dans la deuxième liste.
Using the arrows, select the type of indicators you want to see in your scorecard.

Click Update. This button is in the menu at the top of the workspace
Go to Periods and select a period for which you want to display data. In this “traffic light” example, we’ll use the relative period section. In Quarters, select This quarter**and **Last quarter. Clear any other checkboxes and click Update.

Go to Organisation Units in the same left side pane, and click the arrow next to the gear button.
Sélectionnez Sélectionner les niveaux.

Select District from the list (next to the gear button). Click Update.

As you can see, the scorecard is starting to take shape in the workspace. Now it’s time to fine-tune the look and feel.
Dans l'espace de travail, cliquez sur Disposition.

In Table layout, drag Organisation units down to the Row dimensions section.
Faites glisser Données dans la section Dimensions de la colonne.
In the Column dimensions pane, drag Periods below Data, and click Update.
Dans l'espace de travail, cliquez sur Options.
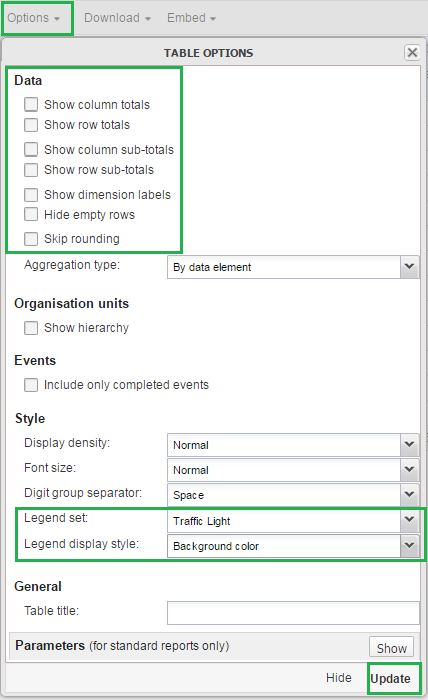
Allez dans Données et décochez toutes les cases.
Go to Style > Legend set and from the list, select the legend you created in the Maintenance app. In this example, we called it Traffic light.
Go to Style > Legend display style and select Background color.
Cliquez sur Mettre à jour.
La carte de pointage est donc prête !
Dans l'espace de travail, allez au menu Favoris.
Cliquez sur Enregistrer sous. Entrez un nom pour votre carte de pointage.
Pour partager votre carte de pointage, sélectionnez Favoris.
Enter the name of a user group name, and click Save. Your scorecard can be viewed by people that you share a dashboard with.
TextPattern was introduced in DHIS2 version 2.29, as a way of defining a pattern that includes variables, generated values and raw text, which then could be generated into a text value. The current use-case for TextPattern is automatically generated attributes for tracked entities, where you want to generate for example unique ids based on a specific pattern.
This guide will cover both basic and advanced topics for working with TextPattern, but is mainly focused on how you can define TextPatterns and which limitations and caveats exists.
A TextPattern is a sequence of segments, joined together by the "+" character. A segment has a specific notation and in most cases a parameter format, which allows for further manipulation of the value.
| Notation des segments | Description | Paramètre (format) | Exemple (segment → valeur d'entrée → résultat) |
|---|---|---|---|
| "Texte simple" ; | Le segment de texte simple restera inchangé dans toutes les valeurs générées. Ce segment spécial est défini en mettant le texte entre deux doubles guillemets. Si votre modèle doit inclure des symboles de séparation comme un tiret, vous devez alors utiliser : "-" ;. Le segment de texte simple permet également de mettre du texte en caractères de remplacement. Cela signifie que vous pouvez spécifier que certaines parties du segment de texte simple doivent être constituées d'un ensemble de caractères. Actuellement, vous pouvez utiliser 4 caractères spéciaux :
| Aucun | "Bonjour le monde" ; → Aucun → Bonjour le monde "Bonjour \x\x\x" ; → "Bonjour à vous" ; → Bonjour à vous "\d\d\d" → "123" → 123 |
| CURRENT_DATE(format) | Le segment de la date du jour sera généré par le serveur au moment de la génération. Ceci est utile si vous voulez que vos modèles aient une contrainte de temps déconnectée du contexte. Vous ne devez pas l'utiliser si vous avez besoin de contrôler la date à injecter dans le modèle. | Format de la date | CURRENT_DATE(aaaa) → 01-01-2018 → 2018 |
| ORG_UNIT_CODE(format) | Ce segment représente le code d'unité d'organisation associé à la génération. | Format du texte | ORG_UNIT_CODE(...) → OSLO → OSL |
| ALÉATOIRE(format) | Les segments aléatoires seront remplacés par une valeur générée de façon aléatoire par le serveur en fonction du format. Les segments générés, comme Aléatoire, fondent leur caractère unique sur le reste du modèle. Cela signifie qu'une valeur aléatoire peut apparaître deux fois, tant que le reste du modèle est différent, ce qui signifie que le texte généré dans son ensemble sera unique. | Format de génération | ALÉATOIRE(X####) → Aucun → A1234 |
| SÉQUENTIEL(format) | Les segments séquentiels seront remplacés par un nombre, basé sur une valeur de comptage sur le serveur. Les segments séquentiels commenceront à la valeur 1, et pour chaque valeur générée, ils seront comptés jusqu'à ce qu'il n'y ait plus de valeurs disponibles, en fonction du format. Comme pour les segments aléatoires, l'unicité est basée sur le reste du modèle, donc chaque version possible du modèle aura son propre compteur séquentiel commençant à 1. | Format de génération | "A"+SÉQUENTIEL(###) → Aucun → A001 "A"-SÉQUENTIEL(###) → Aucun → A002 "B"-SÉQUENTIEL(###) → Aucun → B001 "B"-SÉQUENTIEL(###) → Aucun → B002 |
Most segments has a parameter format, except for the plain text segment. The following table lists the available formats, how they are used and example notations using them.
| Format | Description | Exemple |
|---|---|---|
| Format des dates | Ce format est basé directement sur le SimpleDateFormat de java, ce qui signifie que tout modèle valable pour SimpleDateFormat sera valable comme format de date dans TextPattern | DATE_ACTUELLE(jj-MM-aaaa) → 31-12-2018 DATE_ACTUELLE(MM-aaaa) → 12-2018 |
| Format du texte | Le format du texte permet une manipulation de base du texte. Si vous laissez le format vide, la valeur sera renvoyée sans modification, mais en utilisant "^", "." et "$ ;", vous pouvez modifier la valeur avant qu'elle ne soit renvoyée. Chaque "." représente un caractère, tandis que "^" représente le début du texte et "$ ;" la fin. Lorsque vous utilisez des formats, la valeur saisie doit être au moins de la même longueur que le format format. | CODE_ORG_UNIT(....) → OSLO CODE_ORG_UNIT(..) → OS CODE_ORG_UNIT(..$) → LO CODE_ORG_UNIT(^...$) → OSLO ^....$ exigera que la valeur saisie soit strictement de 4 caractères. |
| Format de production | Le format de production accepte une combinaison d'un ou plusieurs des caractères suivants : "#", "X", "x" et "*". Ils représentent respectivement un nombre (0-9), une lettre majuscule (A-Z), une lettre minuscule (a-z) ou l'un des éléments ci-dessus (0-9,a-z,A-Z). Le segment SÉQUENTIEL n'accepte que "#" ;, puisqu'il ne génère que des nombres. Le nombre de caractères dans le format décide de la taille de la valeur générée. L'utilisation d'un seul "#" ; ne permettra en d'autres termes que 10 valeurs (0-9), tandis que "###" ; permettra 1000 valeurs (000-999). Les valeurs générées de façon SÉQUENTIELLE ont des zéros en tête, de sorte que la longueur de la valeur générée correspondra toujours à la longueur du format. | ALÉATOIRE(X###) → A123 ALÉATOIRE(****) → 1AbC SÉQUENTIEL(###) → 001 SÉQUENTIEL(######) → 000001 |
Quelques points importants à noter concernant les formats :
Date format is very versatile, but be aware of which date or time components you are using. Using components smaller than a day (For example hours or seconds) is not recommended, even though available.
Text format allows for marking both the start and end of the input value, but "^..." and "..." will in reality give exactly the same results. The only time you would want to use "^" is when you want to enforce the length of the input value. For example, "^....$" will accept OSLO, since its 4 characters between the start and end, but PARIS will be rejected, since it has 5 characters.
When text format is used for unique values, like organisation unit code, make sure that the format does not break the uniqueness. (Example: ORG_UNIT_CODE(..) for "PARIS" and "PANAMA CITY" would both return PA, which means these two organisation units would in reality share generated values)
Generation format is the primary way to understanding the capacity of your pattern. Make sure the format is long enough to cover more values than you need.
To finish off the syntax section of the tutorial, here is a couple of example TextPattern:
CODE_D'UNITE_D'ORG(...) + "-" + DATE_ACTUELLE(yyyyww) + "-" + SÉQUENTIEL(#####)
This pattern will have 99999 possible values (based on SEQUENTIAL. 00000 is never used since we start at 1). In addition, the remaining pattern will change for each different organisation unit generating values (ORG_UNIT_CODE) and for each week (CURRENT_DATE(yyyyww) represents year and week). That effectively means every new week, each organisation unit will have 99999 new values they can use.
"ABC_" + ALÉATOIRE(****)
The plain text segment of this pattern, will make no difference in the total capacity of the pattern, however the generated segment (RANDOM) will allow for 14776336 possible values. The reason for this is that * can be any one character of the 62 characters available (0-9, a-z, A-Z). You can read more about understanding pattern capacity further down in the tutorial.
One use-case for TextPattern is to generate unique ids. In this section we will present guidelines and common issues related to designing TextPatterns used for ids.
An id should never contain sensitive information, or information that in combination can identify an individual. TextPattern does not currently support segments that uses these kind of values, but might do so in the future.
The following list highlights some of the TextPattern specific restrictions you need to consider when designing a TextPattern for ids:
Make sure the capacity (number of possible values) of the TextPattern covers your use-case. It's better to have more values than needed than less. Tracked entity attributes using TextPattern will require that a single generated segment is present in the TextPattern.
A TextPattern is unique in the entire system, but only for the object using it. In other words, if you have a single tracked entity attribute with TextPattern, used by multiple Tracked entities (Not to be mistaken for tracked entity instances), all values generated will be shared between all traced entities using the attribute. This also means that if you have two tracked entity attributes with the same TextPattern syntax, each attribute will be able to generate the same value as the other, since uniqueness is based on the attribute.
SEQUENTIAL segments are in the implementation numbers starting from 1, increasing by 1 for each value, sequentially until no more values are available. However, in reality you will most likely end up with gaps when users generate and reserve values that is never used, or if a user sends in a value where the SEQUENTIAL segment has a higher value than recorded on the server.
The current implementation relies on the user-client to send in the values contained in the TextPattern when storing a new value. That means generating a correct id is depending on the user, and user-client, to provide the correct data.
The most important thing to keep in mind when designing a TextPattern, is the capacity - that means the total number of potential values a TextPattern can yield.
With the current implementation of TextPattern, there are three main factors that decides the capacity:
Capacité du segment généré dans le TextPattern
The presence of a CURRENT_DATE segment
The presence of a ORG_UNIT_CODE segment
The presence of a date segment (like CURRENT_DATE) will effectively reset the capacity each time the segment changes. Depending on the date format, it can change anywhere to yearly to daily. Important: If your date format don't contain a year, the pattern will resolve to the same value every year. That means values will already be used. For example, if your TextPattern looks like this:
DATE_ACTUELLE(ww) + "-" + ALEATOIRE(#)
This pattern will give you up to 10 unique values for each week, but after 1 year, CURRENT_DATE(ww) will be the same as last year, and you will have no new values available. If you use "yyyy-ww" instead, it will be unique for every year, every week.
Organisation unit codes will make your values unique for each different organisation unit, which means if you have a text pattern like this:
CODE_D'UNITE_D'ORG() + "-" + ALEATOIRE(#)
This pattern will give you 10 unique values for each different organisation unit.
Understanding how to calculate the capacity of a TextPattern is critical when designing TextPatterns. The generated segments will be the main component of any TextPattern in terms of capacity, then increased based on the presence of ORG_UNIT_CODE or CURRENT_DATE.
Let's start with SEQUENTIAL segments. Each "#" in the format represents a number between 0 and 9. To calculate the total capacity, you multiply the number of possible values for each "#". Since it's always 10 (0-9) the maths is quite straight forward:
SÉQUENTIEL(#) = 10 = 10
SÉQUENTIEL(###) = 10 * 10 * 10 = 1000
SÉQUENTIEL(#####) = 10 * 10 * 10 * 10 * 10 = 100000
Since SEQUENTIAL counters on the server start at 1 and not 0, the actual capacity is 999, but that's insignificant in most cases.
As soon as we involve RANDOM, the calculation becomes a bit more complicated. Similar to SEQUENTIAL, a "#" has 10 possible values, in addition we have "X" and "x" with 26 possible values each, as well as "*" which can be any of the previous, which means 62 (10+26+26) possible values.
To calculate the capacity, you need to take each character in your format and replace with the number of possible values, then multiply them all together like we did for SEQUENTIAL:
ALÉATOIRE(#) = 10 = 10
ALÉATOIRE(X) = 26 = 26
ALÉATOIRE(*) = 62 = 62

ALÉATOIRE(X##) = 26 * 10 * 10 = 2600
ALÉATOIRE(XXxx) = 26 * 26 * 26 * 26 = 456976

ALÉATOIRE(***) = 62 * 62 * 62 = 238328
As you can see, the maths gets a bit more complicated when, but by following this recipe you can see the number of potential values.
There is a hidden cost of using the random segment in TextPattern in the long run, but that does not mean you should never use it. This section will highlight the problems of using the random segment and suggest when it might be more appropriate to use it.
This section is motivated by an issue with the previous generation strategy, where you only had random generation. After while, instances using this feature would actually be unable to generate and reserve new values, since it was taking to long to find available values. This section looks at some of the problems with random generation that created this situation.
Before using the RANDOM segment in your TextPattern, you should consider the following problems connected to the use of RANDOM:
As previously mentioned, the only metadata currently supporting TextPattern is the tracked entity attributes. In this section, we will describe the different ways data entry for TextPattern works, especially for tracked entity attributes.
By default, all values sent to the server for metadata using TextPattern, will be validated. Validation can be skipped if needed, but you should always validate input under normal circumstances. The validation will be based on the TextPattern you have defined and will be as strict as possible:
Date segments must match the same format as specified in the segment parameter
Les segments de texte clair doivent correspondre exactement
Text segments values must be at least as long as the format string. If both "^" and "$" is present, the value must match the exact length.
Generated segment values must match the format exactly, character by character.
When using the server to first generate and reserve values, the server will modify the values used in the TextPattern before injecting them, meaning you will always get a valid value when generating it on the server.
A final exception to TextPattern validation is made for a special case: If you change a TextPattern after reserving values for the original pattern, values sent to the server that are invalid according to the new TextPattern, will still be accepted if it was already reserved.
There is currently 2 ways a client can store values for TextPattern metadata:
Générer et réserver des valeurs (les applications devraient le faire pour vous)
Stockage d'une valeur personnalisée
The preferred way, is to generate and reserve the needed values (The number of values generated and reserved is handled by the app). That means each time you are seeing and storing a value, it has been generated and reserved by the server, and will be valid.
The other way might be useful in specific cases. The user will supply the value themselves and as long as the value supplied is valid for the TextPattern, they can put anything they want. The caveat of doing it this way, is that you might use values that was reserved by someone else and if you have a SEQUENTIAL segment, the counter will not be updated.
Q: I have entered data into a data entry form, but I cannot see the data in any reports (pivot tables, charts, maps). Why does data which is entered not show up immediately in my graphs in DHIS2?
A: Data which is entered into DHIS2 must first be processed with the "analytics". This means that data is not immediately available in the analytics resources (such as reports, pivot tables, data visualizer, GIS, etc.) after it has been entered. If scheduling is active, the analytics process will run automatically at midnight each day. After that, new data which was entered since the last time the analytics process ran, will become visible.
You can trigger the analytics process manually by selecting Reports->Analytics from the main menu and pressing the "Start export" button. Note, the process may take a significant amount of time depending on the amount of data in your database.
D'autres facteurs susceptibles d'affecter la visibilité des données sont :
Data approval: If data has not been approved to a level which corresponds to your users level, the data may not be visible to you.
Sharing of meta-data objects: If certain meta-data objects have not been shared with a user group which you are a member of, the data may not be visible to you.
Caching of analytics: In many cases, server administrators cache analytical objects (such as pivot tables, maps, graphs) on the server. If you have entered data, re-run analytics, and you are still not seeing any (updated) data, be sure that your data is not being cached by the server.
Q: I have downloaded DHIS2 from https://www.dhis2.org/downloads but when i try to enter the system it needs a username and password. Which should I use?
A: By default, the username will be "admin" and the password "district". Usernames and passwords are case sensitive.
Pour obtenir des informations actualisées sur les dernières versions de DHIS 2, veuillez consulter la page téléchargements DHIS 2 de notre site web.