Analytics
Analytics module offers some kind of local analytic data, i.e, some analytic values based on the data stored in the device. Currently, there is no integration with server-analytics although they share basic concepts, like visualizations, relative periods, relative orgunits, etc.
Aggregated analytics
They show analytic values in an aggregated fashion. Values might come from aggregated data or tracker data. If you are familiar with web analytic tools, this module is very similar to Data Visualizer (tables, charts, ...).
Raw analytics
This module follows similar concepts to analytics endpoint in the web API. They are two basic parameters that must provide to the analytics engine to perform a evaluation: dimensions and filters.
For example, a basic query that get the number of "ANC 1st visit" (DataElement "fbfJHSPpUQD") in the last 3 months (RelativePeriod) and filtered by a the orgunit "Ngelehun CHC" (Absolute OrganisationUnit "DiszpKrYNg8") would be like this:
d2.analyticsModule().analytics()
        .withDimension(new DimensionItem.DataItem.DataElementItem("fbfJHSPpUQD"))
        .withDimension(new DimensionItem.PeriodItem.Relative(RelativePeriod.LAST_3_MONTHS))
        .withFilter(new DimensionItem.OrganisationUnitItem.Absolute("DiszpKrYNg8"))
        .evaluate();
The engine will return a Result object containing either a DimensionalResponse or an AnalyticsException. Let's take a look at the structure of the DimensionalResponse. We use the Kotlin representation for convenience, but the Java representation would be very similar:
DimensionalResponse(
        metadata = mapOf(
            "fbfJHSPpUQD" to MetadataItem.DataElementItem,
            "DiszpKrYNg8" to MetadataItem.OrganisationUnitItem,
            "202108" to MetadataItem.PeriodItem,
            "202109" to MetadataItem.PeriodItem,
            "202110" to MetadataItem.PeriodItem
        ),
        dimensions = listOf(
            Dimension.Data,
            Dimension.Period
        ),
        dimensionItems = mapOf(
            Dimension.Data to listOf(
                DimensionItem.DataItem.DataElementItem(uid=fbfJHSPpUQD)
            ),
            Dimension.Period to listOf(
                DimensionItem.PeriodItem.Relative(relative=RelativePeriod.LAST_3_MONTHS)
            ),
            Dimension.OrganisationUnit to listOf(
                DimensionItem.OrganisationUnitItem.Absolute(uid=DiszpKrYNg8)
            )
        ),
        filters = listOf(
            "DiszpKrYNg8"
        ),
        values = listOf(
            DimensionalValue(
                dimensions = listOf("fbfJHSPpUQD", "202108"),
                value = "17"
            ),
            DimensionalValue(
                dimensions = listOf("fbfJHSPpUQD", "202109"),
                value = "112"
            ),
            DimensionalValue(
                dimensions = listOf("fbfJHSPpUQD", "202110"),
                value = "20"
            )
        )
    )
Propiedades incluidas en el objeto DimensionalResponse:
- Metadata: it contains a map of ids to
MetadataItem. The ids are strings that identify dataElements, periods (relative or absolute), orgunits, etc. Some examples of ids are "fbfJHSPpUQD", "202108", "LAST_3_MONTHS", "USER_ORGUNIT",... . The purpose of this map is to quickly obtain a printable representation from any id used in the other properties (dimensionItems, filters or values). TheMetadataIteminterface contains two basic properties,idanddisplayNameand it can be easily matched to the underlying class to get more information about the DataElement, Indicator, Period, etc. - Dimensions: ordered list of dimensions in which the values are disaggregated. In the example above, the first dimension is
Data, which means that the first dimension in thedimensionsproperty in the values belongs to theDatadimension. And the second one is Period. - DimensionItems: it contains a map of items grouped by dimension type. It contains the items originally used to build the query: in the example above, the period was relative, so the Period dimension include the relative period
LAST_3_MONTHS. - Filtros: lista de ids que actúan como filtro en la consulta.
- Values: list of
DimensionalValue. Each value contains an ordered list of ids that define the value. In the example above, the value "17" corresponds to "ANC 1st visit" ("fbfJHSPpUQD") and "August 2021" ("202108"). You can use the metadata map to get more information from those ids.
DimensionItems can be used either as dimensions or as filters. And multiple items of the same dimension can be combined in the same query. For example, this query gets "ANC 1st visit" (DataElement "fbfJHSPpUQD") and "ANC 1-3 Dropout Rate" (Indicator "ReUHfIn0pTQ") disaggregated by the category "Location: Fixed/Outreach" (Category "fMZEcRHuamy") using the options "Fixed" (CategoryOption "qkPbeWaFsnU") and "Outreach" (CategoryOption "wbrDrL2aYEc") within the last 3 months (Relative Period) in the UserOrganisationUnit (Relative OrganisationUnit), classifying the values by data item legendSet and overriding the aggregation type:
d2.analyticsModule().analytics()
        .withDimension(new DimensionItem.DataItem.DataElementItem("fbfJHSPpUQD"))
        .withDimension(new DimensionItem.DataItem.IndicatorItem("ReUHfIn0pTQ"))
        .withDimension(new DimensionItem.CategoryItem("fMZEcRHuamy", "qkPbeWaFsnU"))
        .withDimension(new DimensionItem.CategoryItem("fMZEcRHuamy", "wbrDrL2aYEc"))

        .withFilter(new DimensionItem.PeriodItem.Relative(RelativePeriod.LAST_3_MONTHS))
        .withFilter(new DimensionItem.OrganisationUnitItem.Relative(RelativeOrganisationUnit.USER_ORGUNIT))

        .withLegendStrategy(AnalyticsLegendStrategy.ByDataItem.INSTANCE)

        .withAggregationType(AggregationType.LAST)

        .evaluate();
El evaluador impone algunas restricciones a los parámetros pasados como dimensiones o filtros (son similares a los impuestos por la api web analtyics):
- Al menos un elemento de dimensión debe ser incluido como propiedad de dimensión.
- Al menos un elemento de dimensión de datos debe ser incluido como dimensión o como filtro.
Además, la consulta se evalúa contra los metadatos y datos locales, lo que impone restricciones adicionales:
- DimensionItems (DataElement, Indicator, OrganisationUnit, ...) must be downloaded in the device. By default, the SDK downloads all the dataSets and programs accessible to the user and the related metadata.
- Los datos deben descargarse en el dispositivo. La evaluación solo tiene en cuenta los datos almacenados en la base de datos local.
There are three options to define the legendSet strategy. The class AnalyticsLegendStrategy is a sealed class in Kotlin, so the keyword INSTANCE must be appended at the end of the object values when coding in Java. Code examples:
d2.analyticsModule().analytics()
        .withLegendStrategy(AnalyticsLegendStrategy.ByDataItem.INSTANCE)       // Data items use their own LegendSet
        .withLegendStrategy(AnalyticsLegendStrategy.None.INSTANCE)             // LegendSets are not used
        .withLegendStrategy(new AnalyticsLegendStrategy.Fixed("fqs276KXCXi"))  // The provided LegendSet will be used for all data items
Visualization analytics
The visualization analtyics engine offers handy methods to evaluate Visualization objects. This engine is implemented on top of the raw analtyics engine and it basically fulfill two objectives:
- Para traducir un objeto de visualización en una consulta para motor de Analíticas.
- Para devolver un resultado formateado siguiendo las filas, columnas y filtros definidos en la Visualización.
In order to use the Visualization objects, they must be set in the "Analytics" section of the Android Settings webapp. Currently, it is not possible to download on-demand visualizations from the server, just to downloaded through the Android Settings webapp.
Como ejemplo, supongamos que tenemos una Visualización con los siguientes parámetros:
- Visualización ("SwtkWZFhrFQ").
- Columnas:
- Data: two DataElements (ANC 1st Visit "fbfJHSPpUQD", ANC 2nd Visit "cYeuwXTCPkU").
- Categoría: Ubicación fija/Alcance ("fMZEcRHuamy").
- Filas:
- Periodo: ULTIMOS_3_MESES.
- Filtro:
- Unidad Organizativa: Badja ("YuQRtpLP10I").
La representación esperada de la visualización sería algo como esto:
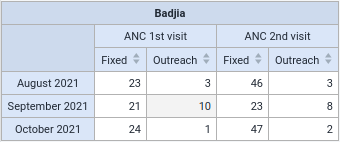
We can get the result of the visualization by calling the "visualizations" repository within the analtyics module. Optionally, we can override the values for Period and OrganisationUnit. This is useful to expose filters in the UI to allow easy modifications of the results.
d2.analyticsModule().visualizations()
        .withVisualization("SwtkWZFhrFQ")
        [.withPeriods()]
        [.withOrganisationUnits()]
        .evaluate();
The method will return a Result with two possible values: a GridAnalyticsResponse and an AnalyticsResponse. Let's take a look at the structure of the GridAnalyticsResponse. We use the Kotlin representation for convenience:
GridAnalyticsResponse(
        metadata = mapOf(
            "fbfJHSPpUQD" to MetadataItem.DataElementItem,
            "cYeuwXTCPkU" to MetadataItem.DataElementItem,
            "fMZEcRHuamy" to MetadataItem.CategoryItem,
            "qkPbeWaFsnU" to MetadataItem.CategoryOptionItem,
            "wbrDrL2aYEc" to MetadataItem.CategoryOptionItem,
            "YuQRtpLP10I" to MetadataItem.OrganisationUnitItem,
            "202108" to MetadataItem.PeriodItem,
            "202109" to MetadataItem.PeriodItem,
            "202110" to MetadataItem.PeriodItem
        ),
        headers = GridHeader(
            columns = listOf(
                listOf(
                    GridHeaderItem(id=fbfJHSPpUQD, weight=2),
                    GridHeaderItem(id=cYeuwXTCPkU, weight=2)
                ),
                listOf(
                    GridHeaderItem(id=qkPbeWaFsnU, weight=1),
                    GridHeaderItem(id=wbrDrL2aYEc, weight=1),
                    GridHeaderItem(id=qkPbeWaFsnU, weight=1),
                    GridHeaderItem(id=wbrDrL2aYEc, weight=1)
                )
            ),
            rows = listOf(
                listOf(
                    GridHeaderItem(id=202108, weight=1),
                    GridHeaderItem(id=202109, weight=1),
                    GridHeaderItem(id=202110, weight=1)
                )
            )
        ),
        dimensions = GridDimension(
            columns = listOf(
                Dimension.Data,
                Dimension.Category(uid=fMZEcRHuamy)
            ),
            rows = listOf(
                Dimension.Period
            )
        ),
        dimensionItems = mapOf(
            Dimension.Data to listOf(
                DimensionItem.DataItem.DataElementItem(uid=fbfJHSPpUQD),
                DimensionItem.DataItem.DataElementItem(uid=cYeuwXTCPkU)
            ),
            Dimension.Period to listOf(
                DimensionItem.PeriodItem.Relative(relative=LAST_3_MONTHS)
            ),
            Dimension.Category(uid=fMZEcRHuamy) to listOf(
                DimensionItem.CategoryItem(uid=fMZEcRHuamy, categoryOption=qkPbeWaFsnU),
                DimensionItem.CategoryItem(uid=fMZEcRHuamy, categoryOption=wbrDrL2aYEc)
            ),
            Dimension.OrganisationUnit to listOf(
                DimensionItem.OrganisationUnitItem.Absolute(uid=YuQRtpLP10I)
            )
        ),
        filters = listOf(
            "YuQRtpLP10I"
        ),
        values = listOf(
            listOf(
                GridResponseValue(
                    columns=[fbfJHSPpUQD, qkPbeWaFsnU],
                    rows=[202108],
                    value=23
                ),
                GridResponseValue(
                    columns=[fbfJHSPpUQD, wbrDrL2aYEc],
                    rows=[202108],
                    value=3
                ),
                GridResponseValue(
                    columns=[cYeuwXTCPkU, qkPbeWaFsnU],
                    rows=[202108],
                    value=46
                ),
                GridResponseValue(
                    columns=[cYeuwXTCPkU, wbrDrL2aYEc],
                    rows=[202108],
                    value=3
                )
            ),
            listOf(
                GridResponseValue(
                    columns=[fbfJHSPpUQD, qkPbeWaFsnU],
                    rows=[202109],
                    value=21
                ),
                GridResponseValue(
                    columns=[fbfJHSPpUQD, wbrDrL2aYEc],
                    rows=[202109],
                    value=10
                ),
                GridResponseValue(
                    columns=[cYeuwXTCPkU, qkPbeWaFsnU],
                    rows=[202109],
                    value=23
                ),
                GridResponseValue(
                    columns=[cYeuwXTCPkU, wbrDrL2aYEc],
                    rows=[202109],
                    value=8
                )
            ),
            listOf(
                GridResponseValue(
                    columns=[fbfJHSPpUQD, qkPbeWaFsnU],
                    rows=[202110],
                    value=24
                ),
                GridResponseValue(
                    columns=[fbfJHSPpUQD, wbrDrL2aYEc],
                    rows=[202110],
                    value=1
                ),
                GridResponseValue(
                    columns=[cYeuwXTCPkU, qkPbeWaFsnU],
                    rows=[202110],
                    value=47
                ),
                GridResponseValue(
                    columns=[cYeuwXTCPkU, wbrDrL2aYEc],
                    rows=[202110],
                    value=2
                )
            )
        )
)
Como podemos ver, GridDimensionalResponse es muy similar aDimensionalResponse con información adicional sobre las columnas y filas definidas en la visualización.
Propiedades incluidas en el objeto GridDimensionalResponse:
- Metadatos: tiene el mismo formato y sigue el propósito que en
DimensionalResponse. - Headers: it defines the structure of the headers in the table. Each entry in columns/rows represents a dimension. The weight represents how many columns/rows it applies to. In the example, the first Dimension in the columns (dataElements) has weight 2, whereas the second dimension (categoryOptions) has weight 1. It can be easily understood looking at the table.
- Dimensiones: tiene el mismo propósito que en
DimensionalResponse, pero las dimensiones están agrupadas por columnas y filas. - DimensionItems: tiene el mismo formato y sigue el propósito que en
DimensionalResponse. - Filtros: tiene el mismo formato y sigue el propósito que en
DimensionalResponse. - Valores: incluye información adicional sobre la representación de los valores. Cada entrada en la matriz de "valores" representa una fila en la tabla. Esta entrada es una lista de
GridResponseValue, que representa una celda en la tabla. CadaGridResponseValuecontiene información de contexto sobre las columnas y filas a las que pertenece el valor. Este formato facilita la impresión del resultado en formato tabular sin procesamiento adicional.
Soporte de dimensión
| Dimensión | Elemento | Soporte |
|---|---|---|
| Datos: | Indicadores | Yes* |
| Elementos de Datos | Sí | |
| Detalles Elementos de Datos | Sí | |
| Event data items | Sí | |
| Indicadores de programa | Yes** | |
| Sets de Datos: Tasa de Informes | No | |
| DataSets: Reporting rate on time | No | |
| Sets de Datos: Informes reales | No | |
| DataSets: Actual reports on time | No | |
| DataSets: Expected reports | No | |
| Periodo: | Fijo | Sí |
| Relativo | Sí | |
| Unidad Organizativa: | Fijo | Sí |
| Relativo | Sí | |
| Nivel | Sí | |
| OU Groups | Sí | |
| Otro: | Categorias (Opciones de categoría) | Yes*** |
| Grupo de opciones de categoría establecido | No | |
| Set de grupos de unidades organizativas | No |
*Check the table Indicator support for details.
**Check the table Program indicator support for details.
***In the case of ProgramIndicators, they are only applied in EVENT ProgramIndicators.
Soporte de indicador
This table shows the functionality supported by the Indicator dimension item compared to the backend analytics.
| Tipo | Elemento | Backend | Android SDK |
|---|---|---|---|
| Matemático: | Paréntesis | Sí | Sí |
| Más (+) | Sí | Sí | |
| Menos (-) | Sí | Sí | |
| Potencia (^) | Sí | No | |
| Multiply (*) | Sí | Sí | |
| Dividir (/) | Sí | Sí | |
| Módulo (%) | Sí | Sí | |
| Lógico: | NOT | Sí | Sí |
| ! | Sí | Sí | |
| AND | Sí | Sí | |
| && | Sí | Sí | |
| OR | Sí | Sí | |
| || | Sí | Sí | |
| Comparación: | Igual a (==) | Sí | Sí |
| No igual a (!=) | Sí | Sí | |
| GT (>) | Sí | Sí | |
| LT (<) | Sí | Sí | |
| GE (>=) | Sí | Sí | |
| LE (<=) | Sí | Sí | |
| Literals: | null | Sí | Sí |
| Funciones: | FirstNonNull | Sí | Sí |
| Greatest | Sí | Sí | |
| If | Sí | Sí | |
| IsNotNull | Sí | Sí | |
| IsNull | Sí | Sí | |
| Least | Sí | Sí | |
| Log | Sí | No | |
| Log10 | Sí | No | |
| Subexpression | Sí | No | |
| .aggregationType | Sí | Sí | |
| .maxDate | Sí | Sí | |
| .minDate | Sí | Sí | |
| .periodOffset | Sí | Sí | |
| .yearToDate | Sí | Sí | |
| Dimensiones: | Constante | Sí | Sí |
| DataElement | Sí | Sí | |
| ProgramAttribute | Sí | Sí | |
| ProgramDataElement | Sí | Sí | |
| ProgramIndicator | Sí | Sí | |
| OrgUnitGroup | Sí | No | |
| ReportingRate | Sí | No | |
| Días | Sí | Sí | |
| PeriodInYear | Sí | Sí | |
| YearlyPeriodCount | Sí | Sí | |
| N_Brace (indicators) | Sí | No |
Program indicator support
This table shows the functionality supported by the ProgramIndicator dimension item compared to the backend analytics.
| Tipo | Elemento | Backend | Android SDK |
|---|---|---|---|
| Matemático: | Paréntesis | Sí | Sí |
| Más (+) | Sí | Sí | |
| Menos (-) | Sí | Sí | |
| Potencia (^) | Sí | No | |
| Multiply (*) | Sí | Sí | |
| Dividir (/) | Sí | Sí | |
| Módulo (%) | Sí | Sí | |
| Lógico: | NOT | Sí | Sí |
| ! | Sí | Sí | |
| AND | Sí | Sí | |
| && | Sí | Sí | |
| OR | Sí | Sí | |
| || | Sí | Sí | |
| Comparación: | Igual a (==) | Sí | Sí |
| No igual a (!=) | Sí | Sí | |
| GT (>) | Sí | Sí | |
| LT (<) | Sí | Sí | |
| GE (>=) | Sí | Sí | |
| LE (<=) | Sí | Sí | |
| Literals: | null | Sí | Sí |
| Funciones: | FirstNonNull | Sí | Sí |
| Greatest | Sí | Sí | |
| If | Sí | Sí | |
| IsNotNull | Sí | Sí | |
| IsNull | Sí | Sí | |
| Least | Sí | Sí | |
| Log | Sí | No | |
| Log10 | Sí | No | |
| PeriodOffset | Sí | No | |
| Contains | Sí | Sí | |
| ContainsItems | Sí | Sí | |
| Funciones D2: | D2AddDays | No | No |
| D2Ceil | No | No | |
| D2Concatenate | No | No | |
| D2Condition | Sí | Sí | |
| D2Count | Sí | Sí | |
| D2CountIfCondition | Sí | Sí | |
| D2CountIfValue | Sí | Sí | |
| D2DaysBetween | Sí | Sí | |
| D2Floor | No | No | |
| D2HasValue | Sí | Sí | |
| D2Left | No | No | |
| D2Length | No | No | |
| D2MaxValue | Sí | Sí | |
| D2MinutesBetween | Sí | Sí | |
| D2MinValue | Sí | Sí | |
| D2Modulus | No | No | |
| D2MonthsBetween | Sí | Sí | |
| D2Oizp | Sí | Sí | |
| D2RelationshipCount | Sí | Sí | |
| D2Right | No | No | |
| D2Round | No | No | |
| D2Split | No | No | |
| D2Substring | No | No | |
| D2ValidatePattern | No | No | |
| D2WeeksBetween | Sí | Sí | |
| D2YearsBetween | Sí | Sí | |
| D2Zing | Sí | Sí | |
| D2Zpvc | Sí | Sí | |
| D2LastEventDate | No | No | |
| D2AddControlDigits | No | No | |
| D2CheckControlDigits | No | No | |
| D2ZScoreWFA | No | No | |
| D2ZScoreWFH | No | No | |
| D2ZScoreHFA | No | No | |
| D2InOrgUnitGroup | No | No | |
| D2HasUserRole | No | No | |
| Funciones de agregación: | avg | Sí | No |
| Conteo | Sí | No | |
| max | Sí | No | |
| min | Sí | No | |
| percentileCont | Sí | No | |
| stddev | Sí | No | |
| stddevPop | Sí | No | |
| stddevSamp | Sí | No | |
| suma | Sí | No | |
| Varianza | Sí | No | |
| Variables: | AnalyticsPeriodEnd | Sí | Sí |
| AnalyticsPeriodStart | Sí | Sí | |
| CreationDate | Sí | Sí | |
| CurrentDate | Sí | Sí | |
| CompletedDate | Sí | Sí | |
| DueDate | Sí | Sí | |
| EnrollmentCount | Sí | Sí | |
| EnrollmentDate | Sí | Sí | |
| EnrollmentStatus | Sí | Sí | |
| EventStatus | Sí | Sí | |
| EventCount | Sí | Sí | |
| ExecutionDate | Sí | Sí | |
| EventDate | Sí | Sí | |
| IncidentDate | Sí | Sí | |
| OrgunitCount | Sí | Sí | |
| ProgramStageId | Sí | Sí | |
| ProgramStageName | Sí | Sí | |
| SyncDate | Sí | Sí | |
| TeiCount | Sí | Sí | |
| ValueCount | Sí | Sí | |
| ZeroPosValueCount | Sí | Sí | |
| Otro: | Constante | Sí | Sí |
| ProgramStageElement | Sí | Sí | |
| ProgramAttribute | Sí | Sí | |
| PS_EVENTDATE | Sí | Sí |
Aggregation type support
| Tipo | Android SDK |
|---|---|
| SUM | Sí |
| AVERAGE | Sí |
| AVERAGE_SUM_ORG_UNIT | Sí |
| LAST | Sí |
| LAST_AVERAGE_ORG_UNIT | Sí |
| LAST_IN_PERIOD | Sí |
| LAST_IN_PERIOD_AVERAGE_ORG_UNIT | Sí |
| LAST_LAST_ORG_UNIT | Sí |
| FIRST | Sí |
| FIRST_AVERAGE_ORG_UNIT | Sí |
| FIRST_FIRST_ORG_UNIT | Sí |
| COUNT | Sí |
| STDDEV | No |
| VARIANCE | No |
| MIN | Sí |
| MIN_SUM_ORG_UNIT | Sí |
| MAX | Sí |
| MAX_SUM_ORG_UNIT | Sí |
| NONE | No |
| CUSTOM | No |
| DEFAULT | No |
Tracker line list
This kind of analytics is similar to those obtained through the Line Listing web app. It allows to generate line lists at event or enrollment level. These line list might include data elements, attributes, program indicators, variables and optionally filter those entries by the values in the their columns.
A common use-case is to generate a list of event or enrollments that meet a certain criteria, such as a value within a particular range, or a certain status, or a certain date range.
For example, a query that contains all the ACTIVE enrollments in the program "fbfJHSPpUQD" whose attribute "p4mRWMtCxtB" has a value between 40 and 50 would look like this. Note that the status is included as a filter, so there is not an explicit column for it.
d2.analyticsModule().trackerLineList()
            .withEnrollmentOutput("fbfJHSPpUQD")
            .withFilter(
                TrackerLineListItem.ProgramStatusItem(
                    filters = listOf(
                        EnumFilter.EqualTo(EnrollmentStatus.ACTIVE.name)
                    )
                )
            )
            .withColumn(TrackerLineListItem.OrganisationUnitItem())
            .withColumn(
                TrackerLineListItem.ProgramAttribute(
                    uid = "p4mRWMtCxtB",
                    filters = listOf(
                        DataFilter.GreaterThan("40"),
                        DataFilter.LowerThan("50"),
                    ),
                ),
            )
            .evaluate()
The response is a Result object of TrackerLineListResponse, which has the following structure:
TrackerLineListResponse(
  metadata = mapOf(
      "p4mRWMtCxtB" to MetadataItem.TrackedEntityAttributeItem
  ),
  headers = listOf(
    TrackerLineListItem.OrganisationUnitItem,
    TrackerLineListItem.ProgramAttribute
  ),
  filters = listOf(
    TrackerLineListItem.ProgramStatusItem
  ),
  rows = listOf(
    listOf(
      TrackerLineListValue(id = "ouItem", value = "Child 1"),
      TrackerLineListValue(id = "p4mRWMtCxtB", value = "45")
    ),
    listOf(
      TrackerLineListValue(id = "ouItem", value = "Child 2"),
      TrackerLineListValue(id = "p4mRWMtCxtB", value = "49")
    ),
    listOf(
      TrackerLineListValue(id = "ouItem", value = "Child 2"),
      TrackerLineListValue(id = "p4mRWMtCxtB", value = "41")
    )
  )
)
Optionally, it is possible to use a TrackerVisualization object (called EventVisualization in the API) to evaluate a predefined line list. The TrackerVisualization must have the type LINE_LIST. It is also possible to override a specific value.
For example, this query uses the configuration in the TrackerVisualization "s85urBIkN0z" and adds or overrides the column ProgramStatusItem filtering by ACTIVE.
d2.analyticsModule().trackerLineList()
  .withTrackerVisualization("s85urBIkN0z")
  .withColumn(
    TrackerLineListItem.ProgramStatusItem(
      filters = listOf(
        EnumFilter.EqualTo(EnrollmentStatus.ACTIVE.name)
      )
    )
  )
  .evaluate()
In order to use the TrackerVisualization objects, they must be set in the "Analytics" section of the Android Settings webapp. Currently, it is not possible to download on-demand visualizations from the server, just to downloaded through the Android Settings webapp.
Event line list
They are event-based analytics. If you are familiar with web analytic tools, it is very similar to Event Reports (line list). It is a simplified case of Tracker Line List.
A common use-case is to generate an event line list of a repeatable stage in the context of a particular TEI in order to show the evolution of a particular value across the events.
For example, let's suppose we have a repeatable stage with two dataElements (height and weight) and one indicator based on those values (BMI, Body Mass Index). We would like to show the evolution of those values across the events
d2.analyticsModule().eventLineList()
        .byProgramStage().eq("stage_id")
        .byTrackedEntityInstance().eq("tei_id")
        .withDataElement("height_id")
        .withDataElement("weight_id")
        .withProgramIndicator("BMI_id")
        .evaluate();
The result would be a list of events with the evaluated values (dataelement and indicators) as well as some handy displayName properties to display the result in a table or chart.