Control data quality
About data quality checks
The Data Quality app contains tools to validate the accuracy and reliability of the data in the system. You can assess different dimensions of data quality as outlined in the table below:
| Dimension | Description |
|---|---|
| Correctness | Data should be within the normal range for data collected at that facility. There should be no gross discrepancies when compared with data from related data elements. |
| Completeness | Data for all data elements for all reporting organisation units should have been submitted. |
| Consistency | Data should be consistent with data entered during earlier months and years while allowing for changes with reorganization, increased work load, etc. and consistent with other similar facilities. |
| Timeliness | All data from all reporting organisation units should be submitted at the appointed time. |
You can verify data quality in different ways, for example:
-
At point of data entry, DHIS 2 can check the data entered to see if it falls within the minimum maximum value ranges of that data element (based on all previous data registered).
-
By defining validation rules, which can be run once the user has finished data entry. The user can also check the entered data for a particular period and organization unit(s) against the validation rules, and display the violations for these validation rules.
-
By analysing data sets, that is, examine gaps in the data.
-
By data triangulation, that is, comparing the same data or indicator from different sources.
Validation rule analysis
About validation rule analysis
A validation rule is based on an expression which defines a numeric relationship between data element values. The expression forms a condition which should assert that certain logical criteria are met.
The expression consist of:
-
a left side
-
a right side
-
an operator
A validation rule could assert that "Suspected malaria cases tested" >= "Confirmed malaria cases".
The left and right sides must return numeric values.
The validation rule analysis tests validation rules against the data registered in the system. Validation violations are reported when the condition defined in the validation rule expression is not met, which means when the condition is false.
You can configure a validation rule analysis to automatically send out information about validation violations to selected user groups. These messages are called validation notifications and you create them in the Maintenance app. Validation notifications are sent via the internal DHIS 2 messaging system.
Workflow
-
In the Maintenance app, create validation rules and validation rule groups.
-
(Optional) In the Maintenance app, create validation notifications.
-
Run the validation rule analysis, either automatically or manually.
-
In the Scheduler app, you schedule the validation rule analysis to run automatically for all validation rules included in one or several validation rule groups. After the system has run the analysis, you'll see the validation violations (if any) in the validation notifications sent via the internal DHIS 2 messaging system.
-
In the Data Quality app, you run the validation rule analysis manually for selected validation rules. After the analysis process has finished, you'll see a list of validation violations (if any).
-
Schedule a validation rule analysis to run automatically
Note
Only validation rules that are included in one or several validation notifications will be a part of the validation rule analysis. If there is no corresponding validation notification for a validation rule, no notification will be sent.
Note
While running validation rule analysis automatically, any results not already persisted, will be persisted during this run. Persisted results can currently only be accessed trough the API. Consult the developers guide for more information about how persisted validation rule violations can be accessed.
-
Verify that you have created all the validation rules, validation rule groups and validation notifications you need.
-
Open the Scheduler app and click the add button in the bottom right corner.
-
Choose a suitable Name for the new job.
-
Select the Monitoring Job type using the drop-down menu.
-
Select a running frequency for the job, i.e. when and how often the job should run.
-
Fill in the Parameters section, including the Validation rule groups.
-
Press the Add job button to confirm the job creation. For more information on adding jobs, see Scheduling.
Run a validation rule analysis manually

-
Verify that you have created all the validation rules, validation rule groups and validation notifications you need.
-
Open the Data Quality app and click Validation rule analysis.
-
Select Start date and End date.
-
Select which Validation rule group you want to include in the analysis.
You can select all validation rules or all validation rules from a single validation rule group.
-
(Optional) Select Send notifications to trigger validation notifications.
Note
If you want to send out validation notifications, you must first create them in the Maintenance app.
-
(Optional) Select Persist new results to persist any non-persisted results found during the analysis
-
Select a Parent organisation unit.
-
Click Validate.
The analysis process duration depends on the amount of data that is being analysed. If there are no violations of the validation rules, you'll see a message saying Validation passed successfully. If there are validation violations, they will be presented in a list.

-
(Optional) Click the show details icon to get more information about a validation violation. In the pop-up window you'll find information about the data elements included in the validation rules and their corresponding data values. You can use this information to identify the source of the validation rule violation.
-
(Optional) Click Download as PDF, Download as Excel or Download as CSV to download the validation violations list in PDF, Excel or CSV formats.
See also
Outlier detection
About outlier detection
The outlier detection tool identifies values which are numerically distant from the rest of the data, potentially indicating that they are outliers. The analysis is based on the standard normal distribution. DHIS 2 calculates the mean of all values for an organisation unit, data element, category option combination and attribute option combination.
Note
As indicated above, this data quality analysis is only appropriate for data which is normally distributed. Data with large seasonal variation, or which may be distributed according to other statistical models (e.g. logistical ) may lead values being flagged which actually should be considered valid. It is therefore recommended to first confirm whether the data actually is normally distributed before running a standard deviation outlier analysis.
Run outlier detection
-
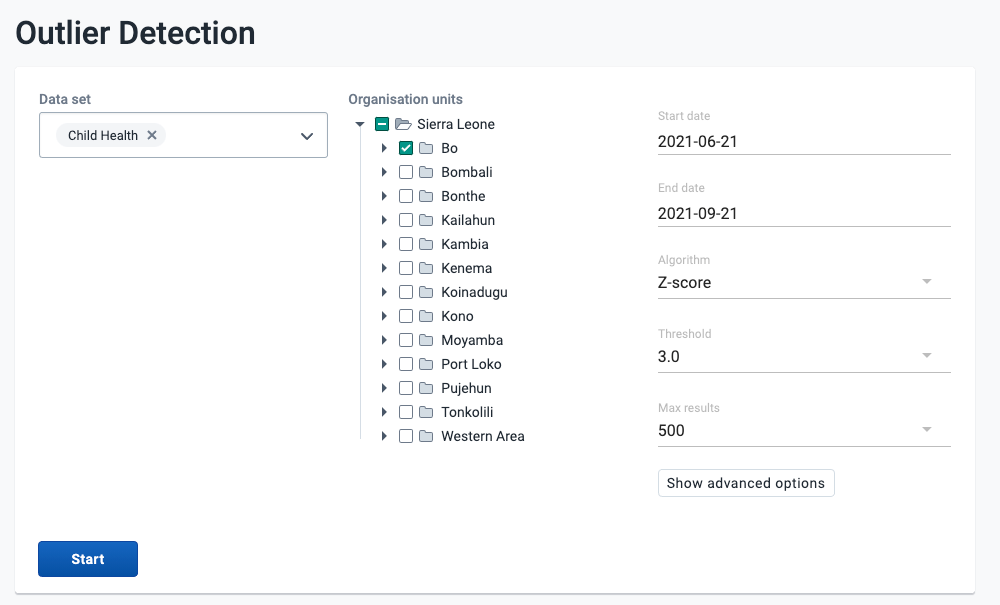
Open the Data Quality app and click Outlier Detection.
-
Select one or multiple data sets.
-
Select Organisation units.
Multiple organisation units can be selected. The analysis is made on raw data for all organisation units in the sub-hierarchy of the selected units, not on aggregated data.
-
Select From date and To date.
-
Set the Algorithm to use.
Z-score (based on the mean of data values), Modified Z-score (based on the median of data values) and Min-max values (based on stored min-max data values) are available algorithms.
-
Select a Threshold.
This refers to the number of standard deviations the data is allowed to deviate from the mean before it is classified as an outlier.
- Select Max results.
This refers to the maximum number of outliers listed in the results.
- (Optional) Select a Data start date and Data end date
These fields can be used to perform outlier detection analysis on a subset of the data within the provided date range. When left blank, the natural start and end date of the dataset will be used (in advanced section).
- (Optional) Select a measure to Sort by.
The outliers can be sorted by Z-score or by Absolute deviation from Mean (in advanced section).
-
Click Start The analysis process duration depends on the amount of data that is being analysed. If there are standard deviations outliers, they will be presented in a list.
 For each outlier, you will see the data element, period, organisation unit, value, z-score, deviation, standard deviation, mean, min, and max. The minimum and maximum values refer to the border values derived from the number of standard deviations selected for the analysis.
 -
(Optional) Click Download as CSV to download the list in CSV format.
Tip
Click the checkbox to mark an outlier value for further follow-up.
Minimum maximum outlier detection
About minimum maximum value based outlier detection
You can verify the data quality at the point of data entry by setting a minimun/maximum value range for each data value. You can define the value ranges manually or generate them automatically.
The auto-generated minimum maximum value range is suitable only for normally distributed data. DHIS2 will determine the arithmetic mean and standard deviation of all values for a given data element, category option, organisation unit and attribute combination. Then the system will calculate the minimum maximum value range based on the Data analysis std dev factor specified in the System Settings app.
For data which is highly-skewed or zero inflated (as is often the case with aggregate data), the values which DHIS2 auto-generates may not provide an accurate minimum maximum value range. This can lead to excessive false violations, for example if you analyse values related to seasonal diseases.
Note
Minimum maximum value ranges are calculated across all attribute combination options for a given data element, category option and organisation unit combination.
Workflow
-
Create a minimum maximum value range, either automatically or manually.
-
In the Data Administration app, you generate value ranges automatically.
-
In the Data Entry app, you may set value ranges manually.
-
-
In the Data Quality app, run the Min-max outlier analysis.
Configure a minimum maximum outlier detection
Create minimum maximum value range automatically
Note
Auto-generated minimum maximum value ranges can be useful for many situations, but it's recommended to verify that the data is actually normally distributed prior to using this function.
You generate minimum maximum value ranges calculated by data set in the Data Administration app. The new value ranges override any value ranges that the system has calculated previously.
-
Set the Data analysis standard deviation (std dev) factor:
-
Open the System Settings app, and click General.
-
In the Data analysis std dev factor field, enter a value.
This sets the number of standard deviations to use in the outlier analysis. The default value is 2. Higher values indicate a broader distribution, which may lead to outliers not being flagged correctly by the analysis.
-
-
Open the Data Administration app and click Min-max value generation.
-
Select data set(s).
-
Select an Organisation unit.
-
Click Generate.
New minimum maximum value ranges for all data elements in the selected data sets for all organisation units (including descendants) of the selected organisation units are generated.
Create minimum/maximum value range manually

-
In the Data Entry app, open a data entry form.
-
Double-click the field for which you want to set the minimum/maximum value range.
-
Enter Min limit and Max limit in the dialog that appears.
-
Click Save.
If values don't fall within the new value range the next time you enter data, the data entry cell will appear with an orange background.
-
(Optional) Type a comment to explain the reason for the discrepancy, for example an event at a facility which may have generated a large number of clients.
-
(Optional) Click Save comment.
Tip
Click the star icon to mark the value for further follow-up.
Delete minimum maximum value range
You can permanently delete all minimum maximum value ranges for selected data sets and organisation units in the Data Administration app.
-
Open the Data Administration app and click Min-max value generation.
-
Select data set(s).
-
Select an Organisation unit. Note, that the selection cascades to descendant organisation units!
-
Click Remove.
Run a minimum maximum outlier detection
-
Verify that you've created minimum maximum value ranges.
-
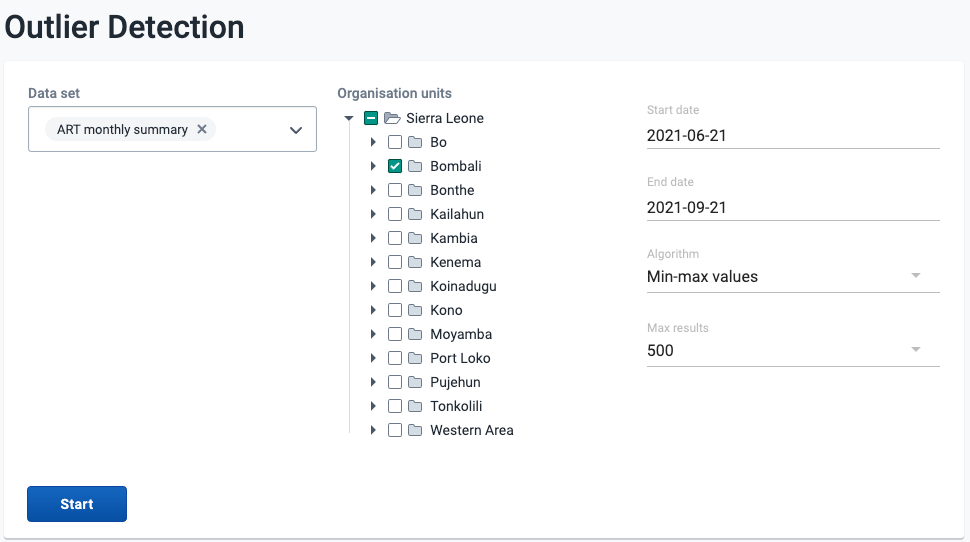
Open the Data Quality app and click Outlier Detection.
-
Select data set(s).
-
Select Parent organisation unit.
Multiple organisation units can be selected. The analysis is made on raw data for all organisation units in the sub-hierarchy of the selected units, not on aggregated data.
-
Select From date and To date.
-
Set Algorithm to Min-max values.
-
Select Max results
This refers to the maximum number of outliers listed in the results.
-
Click Start
The analysis process duration depends on the amount of data that is being analysed. If there are standard deviations outliers, they will be presented in a list.

For each outlier, you will see the data element, period, organisation unit, value, deviation, min, and max.
-
(Optional) Click Download as CSV to download the list in CSV format.
Tip
Click the checkbox to mark the value for further follow-up.
Follow-up analysis
About follow-up analysis
The follow-up analysis creates a list of all data values marked for follow-up. You can mark a data value for follow-up in the Data Entry app and in the result list you get from a standard deviation outlier or minimum maximum outlier analysis.
Create list of data values marked for follow-up
-
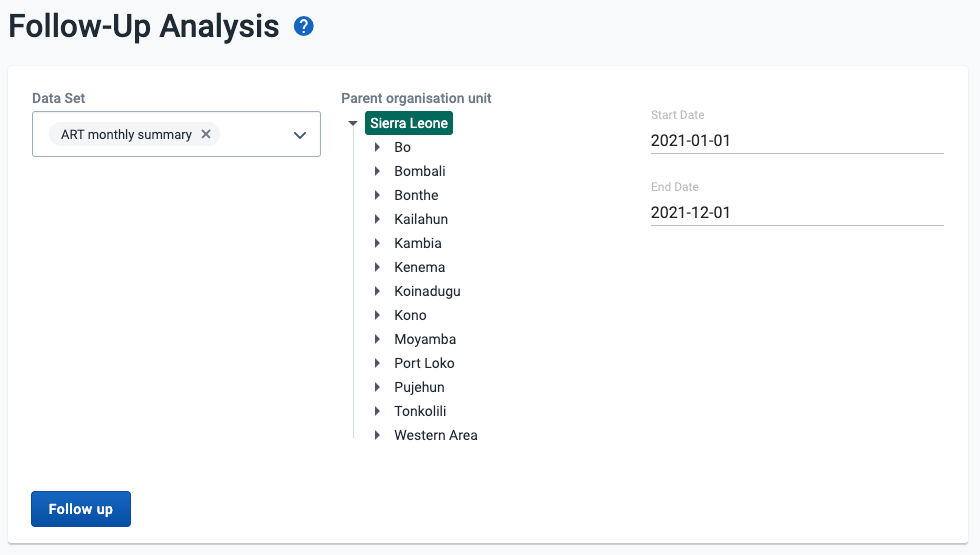
Open the Data Quality app and click Follow-up analysis.
-
Select a data set or multiple data sets.
-
Select Organisation units.
Multiple organisation units can be selected. The analysis is made on raw data “under” the organisation unit, not on aggregated data.
-
Select a Start Date and End Date which defines the periods which you are interested in looking for values which have been marked for follow up.
-
Press Follow up to generate a list of values which have been marked for follow up.
-
(Optional) Click Download as PDF, Download as Excel or Download as CSV to download the validation violations list in PDF, Excel or CSV formats.
Tip
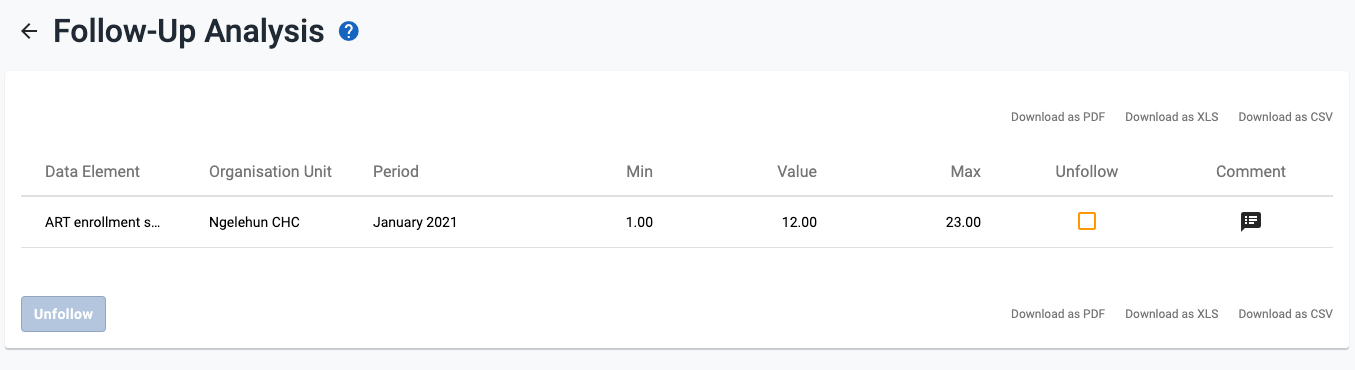
Check the Unfollow checkbox in the list and click the Unfollow-button to remove the follow-up tags from the marked data values. You can also enter a comment in the field to indicate any additional information regarding the value.