Monthly Stock Data Recording / "Aggregate" Data Entry Form
This Default Data Entry Form ("aggregate") allows storekeepers at health care facilities to enter monthly data on demand ("consumption") as well as stock on hand digitally on a on- or off-line on a mobile device and synchronize the data with a central DHIS2 server for analysis, data sharing and integration with national eLMIS systems.
Use case
Monthly stock report - Data recording
At the end of the month, storekeepers will count the quantity of all health care products in the medical store and record the stock on hand. Furthermore, to obtain the total amount of each health care product issued from the medical store from the first to the last day of the month and record the total monthly demand ("consumption") directly on a mobile device. The list of stock items ("Data Elements") can be adapted to each health care facility as needed and user access can be given selectively to individual storekeepers as required.
Monthly stock report - Data recording and calculation
In addition to the above: at the end of the month after the physical stock count and all data has been entered, Predictors automatically calculate the following data:
-
Opening balance: identical with the "Stock on hand" from the end of the previous month
-
Closing balance: Opening balance + Stock received - Stock distributed
-
Stock redistributed - Stock discarded
-
Stock discrepancy: Stock on hand (as counted) - Closing balance
-
Stock on hand Yes/No: calculates whether a stockout occurred at the end of the month (at the time of the physical stock count)
Maintenance Web App - DHIS2 metadata configuration
The configuration of this Default Data Entry form uses "Disaggregation categories" as this is technically the only way to display a table for recording data in the DHIS2 Android Capture App on a mobile device and relies only on basic, native DHIS2 functionality.
Metadata overview
The required metadata settings seetings are presented in the order in which it is presented in the DHIS2 Maintenance Web App.
1 CATEGORY
1.1 Category option
1.2 Category
1.3 Category combination2 DATA ELEMENT
2.1 Data element - "Aggregate"
2.3 Data element group3 DATA SET
3.1 Monthly stock reporting
4 INDICATOR
4.1 Indicator
4.1.1 Indicator type5 OTHER
5.1 Legend
5.2 Predictor
5.3 Predictor group
1 Category
1.1 Category option
1 Appropriate stock
Name (*): "Appropriate stock"
Short name (*): "Appropriate stock"
Organisation units selected: (select as required)2 Coefficient of variation
Name (*): "Coefficient of variation"
Short name (*): "Coefficient of variation"
Organisation units selected: (select as required)3 Excessive stock
Name (*): "Excessive stock"
Short name (*): "Excessive stock"
Organisation units selected: (select as required)4 High variability
Name (*): "High variability"
Short name (*): "High variability"
Organisation units selected: (select as required)5 Low variability
Name (*): "Low variability"
Short name (*): "Low variability"
Organisation units selected: (select as required)6 Medium variability
Name (*): "Medium variability"
Short name (*): "Medium variability"
Organisation units selected: (select as required)7 Overstock
Name (*): "Overstock"
Short name (*): "Overstock"
Organisation units selected: (select as required)8 Stock correction
Name (*): "Stock correction"
Short name (*): "Stock correction"
Organisation units selected: (select as required)9 Stock coverage
Name (*): "Stock coverage"
Short name (*): "Stock coverage"
Organisation units selected: (select as required)10 Stock discard
Name (*): "Stock discard"
Short name (*): "Stock discard"
Organisation units selected: (select as required)11 Stock discrepancy
Name (*): "Stock discrepancy"
Short name (*): "Stock discrepancy"
Organisation units selected: (select as required)12 Stock discrepancy count
Name (*): "Stock discrepancy count"
Short name (*): "Stock discrepancy count"
Organisation units selected: (select as required)13 Stock distribution
Name (*): "Stock distribution"
Short name (*): "Stock distribution"
Organisation units selected: (select as required)14 Stock on hand
Name (*): "Stock on hand"
Short name (*): "Stock on hand"
Organisation units selected: (select as required)15 Stock on hand Yes/No
Name (*): "Stock on hand Yes/No"
Short name (*): "Stock on hand Yes/No"
Organisation units selected: (select as required)16 Stock receipt
Name (*): "Stock receipt"
Short name (*): "Stock receipt"
Organisation units selected: (select as required)17 Stock redistribution
Name (*): "Stock redistribution"
Short name (*): "Stock redistribution"
Organisation units selected: (select as required)18 Stockout Yes/No
Name (*): "Stockout Yes/No"
Short name (*): "Stockout Yes/No"
Organisation units selected: (select as required)19 Understock
Name (*): "Understock"
Short name (*): "Understock"
Organisation units selected: (select as required)
1.2 Category
1 MSR - Monthly stock report
Name (*): "MSR - Monthly stock report - Data recording"
Short name (*): "Monthly stock report - Data recording"
Data dimension type (*): "Disaggregation"
Data dimension: tag (appears as white tick in a blue square)
Category options: note the order of "Category options":"Stock receipt"
"Stock distributed"
"Stock distribution"
"Stock redistribution"
"Stock discard"
"Stock on hand"
"Stock correction"
"Stock discrepancy"
"Stock discrepancy count"
"Stock on hand Yes/No"
"Stock coverage"
"Stockout Yes/No"
"Understock"
"Appropriate stock"
"Overstock"
"Excessive stock"
"Coefficient of variation"
"Low variability"
"Medium variability"
"High variability"
1.3 Category combination
1 MSR Monthly stock report - Data recording
Name (*): Monthly stock report - Data recording
Data dimension type (*): "Disaggregation"
Categories: "Monthly stock report"
2 Data element
2.1 Data element
Data elements represent the items (healthcare products) for which logistics data is recorded and managed. A separate and unique Data element needs to be configured for each item (healthcare product).
1 ATROPINE SULFATE, 1mg/ml, 1ml, amp. - MSR
Name (*): "ATROPINE SULFATE, 1mg/ml, 1ml, amp. - MSR"
Short name (*): "DINJATRO1A"
Code (*): "DINJATRO1A"
Domain Type (*): "Aggregate"
Value type (*): "Integer"
Aggregation type (*): "Sum"
Store zero data values: tag (appears as white tick in a blue square)
Category combination (*): "Monthly stock report - Data collection"[Number] [Item] - MSR
Name (*): "X [Item] - MSR"
Short name (*): "[Item code]"
Code (*): "[Item code]"
Domain Type (*): "Aggregate"
Value type (*): "Integer"
Aggregation type (*): "Sum"
Store zero data values: tag (appears as white tick in a blue square)
Category combination (*): "Monthly stock report - Data collection"
2.2 Data element group
The creation of Data element groups is a DHIS2 best practice but also a precondition for using the "Group Predictor" functionality which allows using a placeholder and the Data element group ID for creating a single Predictor which is automatically applied to all Data elements in the respective Data element group. For example for calculating the stock coverage time.
1 Stock item list - MSR
Name (*): "Stock item list - MSR"
Short name (*): "Stock item list - MSR"
Data elements (*): select all Data elements with the "MSR" suffix"
3 Data set
This Default Data Entry Form ("aggregate") allows storekeepers at health care facilities to enter monthly data on demand ("consumption") as well as stock on hand digitally on a on- or off-line on a mobile device and synchronize the data with a central DHIS2 server for analysis, data sharing and integration with national eLMIS systems.
3.1 Data set
Data sets for each Organisation unit are required for recording and storing monthly stock report data. The sections can be displayed in the Data Entry (beta) Web App as well as in the Capture Android App either in a single table or as separate tabs. The configuration for two Data sets are presented below, but either the one or the other should be used: - "MSR - Monthly stock report - Data recording" - "MSR - Monthly stock report - Data recording and calculation"
1 MSR - Monthly stock report - Data recording
Name (*): "MSR - Monthly stock report - Data recording"
Short name (*): "Monthly stock report - Data recording"
Color: "#00ACC1"
Expiry days: "5"
Open future periods for data entry: "1"
Days after period to qualify for timely submission: "5"
Period type: "Monthly"
Category combination: "None"
Render sections as tabs: tag (appears as white tick in a blue square)
Data elementsAdd all Data elements with the suffix "MSR" required for the respective health facility.
Organisation units selected: (select as for the Tracker Program)
Actions
Manage sections
Name
1 DASD
DASD Data elements
CHLORHEXIDINE DIGLUCONATE 5% , solution, 1L, btl. - MSR
IODINE POVIDONE, 10%, solution, 1L, btl. - MSR2 [Section 2]
[Section 2]
Data elements[Data element]
4 Indicator
4.1 Indicator
Indicators are used for calculating the following logistics metrics:
-
Number of items in stock coverage bins (0-1, 1-2, 2-3 months etc.) for visualizing the stock coverage time distribution
-
Stock coverage time (stock on hand / average monthly demand)
-
Stock availability (percentage of items which are on hand)
-
Stock discrepancy (count and percentage)
-
Stockout rate (percentage of items which are out of stock)
-
Stockouts (number of items which are out of stock and stockout rate in percent)
-
Stock coverage time categories (stockout, Understock, Appropriate stock, Overstock and Excessive stock)
-
Coefficient of variation ranges (Low variability, Medium variability, High variability)
For the "Stock coverage time" indicator it would in principle be preferable to configure the "Stock coverage time" as Predictor (as it would allow using the "Group predictor" function) but because the "Stock coverage time" requires displaying decimals and the Data Entry form only allows a single number format for all Category Options, an indicator is used instead. This approach allows freely setting the number of decimals in the Indicator settings. Note that items will have to be added and removed individually if the stock item list is changed.
1 0-1 months - MSR
For each item the Indicator returns "1" if the item has stock and stock coverage time is less than 1 and otherwise returns "0" and then adds up these results for calculating the number of items with a stock coverage time of 0-1 months.Name (*): "0-1 months - MSR"
Short Name (*): "0-1 months"
Description: "Number of items with a coverage time of 0-1 months"
Decimals in data output: "0"
Indicator type (*): "Number (Factor 1)"
Edit numerator:Description: "O-1 months - MSR - Numerator"
Calculation:
if(#{LNAkkMTxqEW.iIC4YhgrxQY}/#{LNAkkMTxqEW.zogrUrI7Crs}>0 && #{LNAkkMTxqEW.iIC4YhgrxQY}/#{LNAkkMTxqEW.zogrUrI7Crs}<=1,1,0)+ if(#{WyDZKSw82X6.iIC4YhgrxQY}/#{WyDZKSw82X6.zogrUrI7Crs}>0 && #{WyDZKSw82X6.iIC4YhgrxQY}/#{WyDZKSw82X6.zogrUrI7Crs}<=1,1,0)+ if(#{JPccVwAGRq9.iIC4YhgrxQY}/#{JPccVwAGRq9.zogrUrI7Crs}>0 && #{JPccVwAGRq9.iIC4YhgrxQY}/#{JPccVwAGRq9.zogrUrI7Crs}<=1,1,0)+ if(#{smxJz7Mt6ia.iIC4YhgrxQY}/#{smxJz7Mt6ia.zogrUrI7Crs}>0 && #{smxJz7Mt6ia.iIC4YhgrxQY}/#{smxJz7Mt6ia.zogrUrI7Crs}<=1,1,0)+ if(#{AaIApgGQM6t.iIC4YhgrxQY}/#{AaIApgGQM6t.zogrUrI7Crs}>0 && #{AaIApgGQM6t.iIC4YhgrxQY}/#{AaIApgGQM6t.zogrUrI7Crs}<=1,1,0)+ if(#{vCTrmv52APd.iIC4YhgrxQY}/#{vCTrmv52APd.zogrUrI7Crs}>0 && #{vCTrmv52APd.iIC4YhgrxQY}/#{vCTrmv52APd.zogrUrI7Crs}<=1,1,0)+ if(#{SOw2TcuFFH2.iIC4YhgrxQY}/#{SOw2TcuFFH2.zogrUrI7Crs}>0 && #{SOw2TcuFFH2.iIC4YhgrxQY}/#{SOw2TcuFFH2.zogrUrI7Crs}<=1,1,0)+ if(#{RSIOx2u07Ln.iIC4YhgrxQY}/#{RSIOx2u07Ln.zogrUrI7Crs}>0 && #{RSIOx2u07Ln.iIC4YhgrxQY}/#{RSIOx2u07Ln.zogrUrI7Crs}<=1,1,0)+ if(#{JStiDyaPfqy.iIC4YhgrxQY}/#{JStiDyaPfqy.zogrUrI7Crs}>0 && #{JStiDyaPfqy.iIC4YhgrxQY}/#{JStiDyaPfqy.zogrUrI7Crs}<=1,1,0)+ if(#{hZ1YvdcTDQM.iIC4YhgrxQY}/#{hZ1YvdcTDQM.zogrUrI7Crs}>0 && #{hZ1YvdcTDQM.iIC4YhgrxQY}/#{hZ1YvdcTDQM.zogrUrI7Crs}<=1,1,0)+ if(#{tsi32D8HQd5.iIC4YhgrxQY}/#{tsi32D8HQd5.zogrUrI7Crs}>0 && #{tsi32D8HQd5.iIC4YhgrxQY}/#{tsi32D8HQd5.zogrUrI7Crs}<=1,1,0)+ if(#{QWlPF8S0gCc.iIC4YhgrxQY}/#{QWlPF8S0gCc.zogrUrI7Crs}>0 && #{QWlPF8S0gCc.iIC4YhgrxQY}/#{QWlPF8S0gCc.zogrUrI7Crs}<=1,1,0)+ if(#{a5uLTDt12eT.iIC4YhgrxQY}/#{a5uLTDt12eT.zogrUrI7Crs}>0 && #{a5uLTDt12eT.iIC4YhgrxQY}/#{a5uLTDt12eT.zogrUrI7Crs}<=1,1,0)+ if(#{U0AfOOyJMy2.iIC4YhgrxQY}/#{U0AfOOyJMy2.zogrUrI7Crs}>0 && #{U0AfOOyJMy2.iIC4YhgrxQY}/#{U0AfOOyJMy2.zogrUrI7Crs}<=1,1,0)+ if(#{cyf6UdScfFM.iIC4YhgrxQY}/#{cyf6UdScfFM.zogrUrI7Crs}>0 && #{cyf6UdScfFM.iIC4YhgrxQY}/#{cyf6UdScfFM.zogrUrI7Crs}<=1,1,0)+ if(#{FeUTTNHpVzD.iIC4YhgrxQY}/#{FeUTTNHpVzD.zogrUrI7Crs}>0 && #{FeUTTNHpVzD.iIC4YhgrxQY}/#{FeUTTNHpVzD.zogrUrI7Crs}<=1,1,0)+ if(#{mKSICD1rxG4.iIC4YhgrxQY}/#{mKSICD1rxG4.zogrUrI7Crs}>0 && #{mKSICD1rxG4.iIC4YhgrxQY}/#{mKSICD1rxG4.zogrUrI7Crs}<=1,1,0)+ if(#{mVNe1aS1pGl.iIC4YhgrxQY}/#{mVNe1aS1pGl.zogrUrI7Crs}>0 && #{mVNe1aS1pGl.iIC4YhgrxQY}/#{mVNe1aS1pGl.zogrUrI7Crs}<=1,1,0)+ if(#{oLAXTZY6ken.iIC4YhgrxQY}/#{oLAXTZY6ken.zogrUrI7Crs}>0 && #{oLAXTZY6ken.iIC4YhgrxQY}/#{oLAXTZY6ken.zogrUrI7Crs}<=1,1,0)+ if(#{YYaRDUZyH9L.iIC4YhgrxQY}/#{YYaRDUZyH9L.zogrUrI7Crs}>0 && #{YYaRDUZyH9L.iIC4YhgrxQY}/#{YYaRDUZyH9L.zogrUrI7Crs}<=1,1,0)+ if(#{HVteopBt0jr.iIC4YhgrxQY}/#{HVteopBt0jr.zogrUrI7Crs}>0 && #{HVteopBt0jr.iIC4YhgrxQY}/#{HVteopBt0jr.zogrUrI7Crs}<=1,1,0)+ if(#{sWodd2tbjgZ.iIC4YhgrxQY}/#{sWodd2tbjgZ.zogrUrI7Crs}>0 && #{sWodd2tbjgZ.iIC4YhgrxQY}/#{sWodd2tbjgZ.zogrUrI7Crs}<=1,1,0)+ if(#{yVYajDDYUfX.iIC4YhgrxQY}/#{yVYajDDYUfX.zogrUrI7Crs}>0 && #{yVYajDDYUfX.iIC4YhgrxQY}/#{yVYajDDYUfX.zogrUrI7Crs}<=1,1,0)+ if(#{eTJAr4sc83v.iIC4YhgrxQY}/#{eTJAr4sc83v.zogrUrI7Crs}>0 && #{eTJAr4sc83v.iIC4YhgrxQY}/#{eTJAr4sc83v.zogrUrI7Crs}<=1,1,0)+ if(#{U4KSmanl4JP.iIC4YhgrxQY}/#{U4KSmanl4JP.zogrUrI7Crs}>0 && #{U4KSmanl4JP.iIC4YhgrxQY}/#{U4KSmanl4JP.zogrUrI7Crs}<=1,1,0)+ if(#{FXsa5uG3IGn.iIC4YhgrxQY}/#{FXsa5uG3IGn.zogrUrI7Crs}>0 && #{FXsa5uG3IGn.iIC4YhgrxQY}/#{FXsa5uG3IGn.zogrUrI7Crs}<=1,1,0)+ if(#{L34T9YDtCor.iIC4YhgrxQY}/#{L34T9YDtCor.zogrUrI7Crs}>0 && #{L34T9YDtCor.iIC4YhgrxQY}/#{L34T9YDtCor.zogrUrI7Crs}<=1,1,0)+ if(#{W5mHXhSYFfQ.iIC4YhgrxQY}/#{W5mHXhSYFfQ.zogrUrI7Crs}>0 && #{W5mHXhSYFfQ.iIC4YhgrxQY}/#{W5mHXhSYFfQ.zogrUrI7Crs}<=1,1,0)+ if(#{cmSUyJOZwyl.iIC4YhgrxQY}/#{cmSUyJOZwyl.zogrUrI7Crs}>0 && #{cmSUyJOZwyl.iIC4YhgrxQY}/#{cmSUyJOZwyl.zogrUrI7Crs}<=1,1,0)+ if(#{cT8sfosRXvU.iIC4YhgrxQY}/#{cT8sfosRXvU.zogrUrI7Crs}>0 && #{cT8sfosRXvU.iIC4YhgrxQY}/#{cT8sfosRXvU.zogrUrI7Crs}<=1,1,0)+ if(#{OaWKnMS7say.iIC4YhgrxQY}/#{OaWKnMS7say.zogrUrI7Crs}>0 && #{OaWKnMS7say.iIC4YhgrxQY}/#{OaWKnMS7say.zogrUrI7Crs}<=1,1,0)+ if(#{Z4bjHvGS6aH.iIC4YhgrxQY}/#{Z4bjHvGS6aH.zogrUrI7Crs}>0 && #{Z4bjHvGS6aH.iIC4YhgrxQY}/#{Z4bjHvGS6aH.zogrUrI7Crs}<=1,1,0)+ if(#{Nn1L7CNEtC8.iIC4YhgrxQY}/#{Nn1L7CNEtC8.zogrUrI7Crs}>0 && #{Nn1L7CNEtC8.iIC4YhgrxQY}/#{Nn1L7CNEtC8.zogrUrI7Crs}<=1,1,0)+ if(#{RNYKSc3nAUg.iIC4YhgrxQY}/#{RNYKSc3nAUg.zogrUrI7Crs}>0 && #{RNYKSc3nAUg.iIC4YhgrxQY}/#{RNYKSc3nAUg.zogrUrI7Crs}<=1,1,0)+ if(#{PtmZ9XqpPKi.iIC4YhgrxQY}/#{PtmZ9XqpPKi.zogrUrI7Crs}>0 && #{PtmZ9XqpPKi.iIC4YhgrxQY}/#{PtmZ9XqpPKi.zogrUrI7Crs}<=1,1,0)+ if(#{CohlLHi54B0.iIC4YhgrxQY}/#{CohlLHi54B0.zogrUrI7Crs}>0 && #{CohlLHi54B0.iIC4YhgrxQY}/#{CohlLHi54B0.zogrUrI7Crs}<=1,1,0)+ if(#{Gu6u82RD9OW.iIC4YhgrxQY}/#{Gu6u82RD9OW.zogrUrI7Crs}>0 && #{Gu6u82RD9OW.iIC4YhgrxQY}/#{Gu6u82RD9OW.zogrUrI7Crs}<=1,1,0)+ if(#{LiuYzxYr4Pt.iIC4YhgrxQY}/#{LiuYzxYr4Pt.zogrUrI7Crs}>0 && #{LiuYzxYr4Pt.iIC4YhgrxQY}/#{LiuYzxYr4Pt.zogrUrI7Crs}<=1,1,0)+ if(#{Tje33nJAG55.iIC4YhgrxQY}/#{Tje33nJAG55.zogrUrI7Crs}>0 && #{Tje33nJAG55.iIC4YhgrxQY}/#{Tje33nJAG55.zogrUrI7Crs}<=1,1,0)+ if(#{euM2dlqleYH.iIC4YhgrxQY}/#{euM2dlqleYH.zogrUrI7Crs}>0 && #{euM2dlqleYH.iIC4YhgrxQY}/#{euM2dlqleYH.zogrUrI7Crs}<=1,1,0)+ if(#{dASLmBTEehF.iIC4YhgrxQY}/#{dASLmBTEehF.zogrUrI7Crs}>0 && #{dASLmBTEehF.iIC4YhgrxQY}/#{dASLmBTEehF.zogrUrI7Crs}<=1,1,0)+ if(#{qU2LvzoPn1z.iIC4YhgrxQY}/#{qU2LvzoPn1z.zogrUrI7Crs}>0 && #{qU2LvzoPn1z.iIC4YhgrxQY}/#{qU2LvzoPn1z.zogrUrI7Crs}<=1,1,0)+ if(#{OkWaFxdUQY2.iIC4YhgrxQY}/#{OkWaFxdUQY2.zogrUrI7Crs}>0 && #{OkWaFxdUQY2.iIC4YhgrxQY}/#{OkWaFxdUQY2.zogrUrI7Crs}<=1,1,0)+ if(#{YHIv7KQc2e7.iIC4YhgrxQY}/#{YHIv7KQc2e7.zogrUrI7Crs}>0 && #{YHIv7KQc2e7.iIC4YhgrxQY}/#{YHIv7KQc2e7.zogrUrI7Crs}<=1,1,0)+ if(#{rt9D47Inb49.iIC4YhgrxQY}/#{rt9D47Inb49.zogrUrI7Crs}>0 && #{rt9D47Inb49.iIC4YhgrxQY}/#{rt9D47Inb49.zogrUrI7Crs}<=1,1,0)+ if(#{i1iXbquZ5iv.iIC4YhgrxQY}/#{i1iXbquZ5iv.zogrUrI7Crs}>0 && #{i1iXbquZ5iv.iIC4YhgrxQY}/#{i1iXbquZ5iv.zogrUrI7Crs}<=1,1,0)+ if(#{RcE30WBKrXI.iIC4YhgrxQY}/#{RcE30WBKrXI.zogrUrI7Crs}>0 && #{RcE30WBKrXI.iIC4YhgrxQY}/#{RcE30WBKrXI.zogrUrI7Crs}<=1,1,0)+ if(#{EAG0GfdSMAs.iIC4YhgrxQY}/#{EAG0GfdSMAs.zogrUrI7Crs}>0 && #{EAG0GfdSMAs.iIC4YhgrxQY}/#{EAG0GfdSMAs.zogrUrI7Crs}<=1,1,0)+ if(#{N2aXs7VlJdJ.iIC4YhgrxQY}/#{N2aXs7VlJdJ.zogrUrI7Crs}>0 && #{N2aXs7VlJdJ.iIC4YhgrxQY}/#{N2aXs7VlJdJ.zogrUrI7Crs}<=1,1,0)+ if(#{xrjnOtFFTRC.iIC4YhgrxQY}/#{xrjnOtFFTRC.zogrUrI7Crs}>0 && #{xrjnOtFFTRC.iIC4YhgrxQY}/#{xrjnOtFFTRC.zogrUrI7Crs}<1,1,0)Edit denominator:
Description: "O-1 months - MSR - Denominator"
Calculation: "1"2 1-2 months - MSR
For each item the Indicator returns "1" if the stock coverage time is greater than or equal to 1 but less than 2 and otherwise returns 0and then adds up these results for calculating the number of items with a stock coverage time greater of 1-2 months.Name (*): "1-2 months - MSR"
Short Name (*): "1-2 months"
Description: "Number of items with a coverage time of 1-2 months"
Decimals in data output: "0"
Indicator type (*): "Number (Factor 1)"
Edit numerator:Description: "1-2 months - MSR - Numerator"
Calculation:
if(#{LNAkkMTxqEW.iIC4YhgrxQY}/#{LNAkkMTxqEW.zogrUrI7Crs}>1 && #{LNAkkMTxqEW.iIC4YhgrxQY}/#{LNAkkMTxqEW.zogrUrI7Crs}<=2,1,0)+ if(#{WyDZKSw82X6.iIC4YhgrxQY}/#{WyDZKSw82X6.zogrUrI7Crs}>1 && #{WyDZKSw82X6.iIC4YhgrxQY}/#{WyDZKSw82X6.zogrUrI7Crs}<=2,1,0)+ if(#{JPccVwAGRq9.iIC4YhgrxQY}/#{JPccVwAGRq9.zogrUrI7Crs}>1 && #{JPccVwAGRq9.iIC4YhgrxQY}/#{JPccVwAGRq9.zogrUrI7Crs}<=2,1,0)+ if(#{smxJz7Mt6ia.iIC4YhgrxQY}/#{smxJz7Mt6ia.zogrUrI7Crs}>1 && #{smxJz7Mt6ia.iIC4YhgrxQY}/#{smxJz7Mt6ia.zogrUrI7Crs}<=2,1,0)+ if(#{AaIApgGQM6t.iIC4YhgrxQY}/#{AaIApgGQM6t.zogrUrI7Crs}>1 && #{AaIApgGQM6t.iIC4YhgrxQY}/#{AaIApgGQM6t.zogrUrI7Crs}<=2,1,0)+ if(#{vCTrmv52APd.iIC4YhgrxQY}/#{vCTrmv52APd.zogrUrI7Crs}>1 && #{vCTrmv52APd.iIC4YhgrxQY}/#{vCTrmv52APd.zogrUrI7Crs}<=2,1,0)+ if(#{SOw2TcuFFH2.iIC4YhgrxQY}/#{SOw2TcuFFH2.zogrUrI7Crs}>1 && #{SOw2TcuFFH2.iIC4YhgrxQY}/#{SOw2TcuFFH2.zogrUrI7Crs}<=2,1,0)+ if(#{RSIOx2u07Ln.iIC4YhgrxQY}/#{RSIOx2u07Ln.zogrUrI7Crs}>1 && #{RSIOx2u07Ln.iIC4YhgrxQY}/#{RSIOx2u07Ln.zogrUrI7Crs}<=2,1,0)+ if(#{JStiDyaPfqy.iIC4YhgrxQY}/#{JStiDyaPfqy.zogrUrI7Crs}>1 && #{JStiDyaPfqy.iIC4YhgrxQY}/#{JStiDyaPfqy.zogrUrI7Crs}<=2,1,0)+ if(#{hZ1YvdcTDQM.iIC4YhgrxQY}/#{hZ1YvdcTDQM.zogrUrI7Crs}>1 && #{hZ1YvdcTDQM.iIC4YhgrxQY}/#{hZ1YvdcTDQM.zogrUrI7Crs}<=2,1,0)+ if(#{tsi32D8HQd5.iIC4YhgrxQY}/#{tsi32D8HQd5.zogrUrI7Crs}>1 && #{tsi32D8HQd5.iIC4YhgrxQY}/#{tsi32D8HQd5.zogrUrI7Crs}<=2,1,0)+ if(#{QWlPF8S0gCc.iIC4YhgrxQY}/#{QWlPF8S0gCc.zogrUrI7Crs}>1 && #{QWlPF8S0gCc.iIC4YhgrxQY}/#{QWlPF8S0gCc.zogrUrI7Crs}<=2,1,0)+ if(#{a5uLTDt12eT.iIC4YhgrxQY}/#{a5uLTDt12eT.zogrUrI7Crs}>1 && #{a5uLTDt12eT.iIC4YhgrxQY}/#{a5uLTDt12eT.zogrUrI7Crs}<=2,1,0)+ if(#{U0AfOOyJMy2.iIC4YhgrxQY}/#{U0AfOOyJMy2.zogrUrI7Crs}>1 && #{U0AfOOyJMy2.iIC4YhgrxQY}/#{U0AfOOyJMy2.zogrUrI7Crs}<=2,1,0)+ if(#{cyf6UdScfFM.iIC4YhgrxQY}/#{cyf6UdScfFM.zogrUrI7Crs}>1 && #{cyf6UdScfFM.iIC4YhgrxQY}/#{cyf6UdScfFM.zogrUrI7Crs}<=2,1,0)+ if(#{FeUTTNHpVzD.iIC4YhgrxQY}/#{FeUTTNHpVzD.zogrUrI7Crs}>1 && #{FeUTTNHpVzD.iIC4YhgrxQY}/#{FeUTTNHpVzD.zogrUrI7Crs}<=2,1,0)+ if(#{mKSICD1rxG4.iIC4YhgrxQY}/#{mKSICD1rxG4.zogrUrI7Crs}>1 && #{mKSICD1rxG4.iIC4YhgrxQY}/#{mKSICD1rxG4.zogrUrI7Crs}<=2,1,0)+ if(#{mVNe1aS1pGl.iIC4YhgrxQY}/#{mVNe1aS1pGl.zogrUrI7Crs}>1 && #{mVNe1aS1pGl.iIC4YhgrxQY}/#{mVNe1aS1pGl.zogrUrI7Crs}<=2,1,0)+ if(#{oLAXTZY6ken.iIC4YhgrxQY}/#{oLAXTZY6ken.zogrUrI7Crs}>1 && #{oLAXTZY6ken.iIC4YhgrxQY}/#{oLAXTZY6ken.zogrUrI7Crs}<=2,1,0)+ if(#{YYaRDUZyH9L.iIC4YhgrxQY}/#{YYaRDUZyH9L.zogrUrI7Crs}>1 && #{YYaRDUZyH9L.iIC4YhgrxQY}/#{YYaRDUZyH9L.zogrUrI7Crs}<=2,1,0)+ if(#{HVteopBt0jr.iIC4YhgrxQY}/#{HVteopBt0jr.zogrUrI7Crs}>1 && #{HVteopBt0jr.iIC4YhgrxQY}/#{HVteopBt0jr.zogrUrI7Crs}<=2,1,0)+ if(#{sWodd2tbjgZ.iIC4YhgrxQY}/#{sWodd2tbjgZ.zogrUrI7Crs}>1 && #{sWodd2tbjgZ.iIC4YhgrxQY}/#{sWodd2tbjgZ.zogrUrI7Crs}<=2,1,0)+ if(#{yVYajDDYUfX.iIC4YhgrxQY}/#{yVYajDDYUfX.zogrUrI7Crs}>1 && #{yVYajDDYUfX.iIC4YhgrxQY}/#{yVYajDDYUfX.zogrUrI7Crs}<=2,1,0)+ if(#{eTJAr4sc83v.iIC4YhgrxQY}/#{eTJAr4sc83v.zogrUrI7Crs}>1 && #{eTJAr4sc83v.iIC4YhgrxQY}/#{eTJAr4sc83v.zogrUrI7Crs}<=2,1,0)+ if(#{U4KSmanl4JP.iIC4YhgrxQY}/#{U4KSmanl4JP.zogrUrI7Crs}>1 && #{U4KSmanl4JP.iIC4YhgrxQY}/#{U4KSmanl4JP.zogrUrI7Crs}<=2,1,0)+ if(#{FXsa5uG3IGn.iIC4YhgrxQY}/#{FXsa5uG3IGn.zogrUrI7Crs}>1 && #{FXsa5uG3IGn.iIC4YhgrxQY}/#{FXsa5uG3IGn.zogrUrI7Crs}<=2,1,0)+ if(#{L34T9YDtCor.iIC4YhgrxQY}/#{L34T9YDtCor.zogrUrI7Crs}>1 && #{L34T9YDtCor.iIC4YhgrxQY}/#{L34T9YDtCor.zogrUrI7Crs}<=2,1,0)+ if(#{W5mHXhSYFfQ.iIC4YhgrxQY}/#{W5mHXhSYFfQ.zogrUrI7Crs}>1 && #{W5mHXhSYFfQ.iIC4YhgrxQY}/#{W5mHXhSYFfQ.zogrUrI7Crs}<=2,1,0)+ if(#{cmSUyJOZwyl.iIC4YhgrxQY}/#{cmSUyJOZwyl.zogrUrI7Crs}>1 && #{cmSUyJOZwyl.iIC4YhgrxQY}/#{cmSUyJOZwyl.zogrUrI7Crs}<=2,1,0)+ if(#{cT8sfosRXvU.iIC4YhgrxQY}/#{cT8sfosRXvU.zogrUrI7Crs}>1 && #{cT8sfosRXvU.iIC4YhgrxQY}/#{cT8sfosRXvU.zogrUrI7Crs}<=2,1,0)+ if(#{OaWKnMS7say.iIC4YhgrxQY}/#{OaWKnMS7say.zogrUrI7Crs}>1 && #{OaWKnMS7say.iIC4YhgrxQY}/#{OaWKnMS7say.zogrUrI7Crs}<=2,1,0)+ if(#{Z4bjHvGS6aH.iIC4YhgrxQY}/#{Z4bjHvGS6aH.zogrUrI7Crs}>1 && #{Z4bjHvGS6aH.iIC4YhgrxQY}/#{Z4bjHvGS6aH.zogrUrI7Crs}<=2,1,0)+ if(#{Nn1L7CNEtC8.iIC4YhgrxQY}/#{Nn1L7CNEtC8.zogrUrI7Crs}>1 && #{Nn1L7CNEtC8.iIC4YhgrxQY}/#{Nn1L7CNEtC8.zogrUrI7Crs}<=2,1,0)+ if(#{RNYKSc3nAUg.iIC4YhgrxQY}/#{RNYKSc3nAUg.zogrUrI7Crs}>1 && #{RNYKSc3nAUg.iIC4YhgrxQY}/#{RNYKSc3nAUg.zogrUrI7Crs}<=2,1,0)+ if(#{PtmZ9XqpPKi.iIC4YhgrxQY}/#{PtmZ9XqpPKi.zogrUrI7Crs}>1 && #{PtmZ9XqpPKi.iIC4YhgrxQY}/#{PtmZ9XqpPKi.zogrUrI7Crs}<=2,1,0)+ if(#{CohlLHi54B0.iIC4YhgrxQY}/#{CohlLHi54B0.zogrUrI7Crs}>1 && #{CohlLHi54B0.iIC4YhgrxQY}/#{CohlLHi54B0.zogrUrI7Crs}<=2,1,0)+ if(#{Gu6u82RD9OW.iIC4YhgrxQY}/#{Gu6u82RD9OW.zogrUrI7Crs}>1 && #{Gu6u82RD9OW.iIC4YhgrxQY}/#{Gu6u82RD9OW.zogrUrI7Crs}<=2,1,0)+ if(#{LiuYzxYr4Pt.iIC4YhgrxQY}/#{LiuYzxYr4Pt.zogrUrI7Crs}>1 && #{LiuYzxYr4Pt.iIC4YhgrxQY}/#{LiuYzxYr4Pt.zogrUrI7Crs}<=2,1,0)+ if(#{Tje33nJAG55.iIC4YhgrxQY}/#{Tje33nJAG55.zogrUrI7Crs}>1 && #{Tje33nJAG55.iIC4YhgrxQY}/#{Tje33nJAG55.zogrUrI7Crs}<=2,1,0)+ if(#{euM2dlqleYH.iIC4YhgrxQY}/#{euM2dlqleYH.zogrUrI7Crs}>1 && #{euM2dlqleYH.iIC4YhgrxQY}/#{euM2dlqleYH.zogrUrI7Crs}<=2,1,0)+ if(#{dASLmBTEehF.iIC4YhgrxQY}/#{dASLmBTEehF.zogrUrI7Crs}>1 && #{dASLmBTEehF.iIC4YhgrxQY}/#{dASLmBTEehF.zogrUrI7Crs}<=2,1,0)+ if(#{qU2LvzoPn1z.iIC4YhgrxQY}/#{qU2LvzoPn1z.zogrUrI7Crs}>1 && #{qU2LvzoPn1z.iIC4YhgrxQY}/#{qU2LvzoPn1z.zogrUrI7Crs}<=2,1,0)+ if(#{OkWaFxdUQY2.iIC4YhgrxQY}/#{OkWaFxdUQY2.zogrUrI7Crs}>1 && #{OkWaFxdUQY2.iIC4YhgrxQY}/#{OkWaFxdUQY2.zogrUrI7Crs}<=2,1,0)+ if(#{YHIv7KQc2e7.iIC4YhgrxQY}/#{YHIv7KQc2e7.zogrUrI7Crs}>1 && #{YHIv7KQc2e7.iIC4YhgrxQY}/#{YHIv7KQc2e7.zogrUrI7Crs}<=2,1,0)+ if(#{rt9D47Inb49.iIC4YhgrxQY}/#{rt9D47Inb49.zogrUrI7Crs}>1 && #{rt9D47Inb49.iIC4YhgrxQY}/#{rt9D47Inb49.zogrUrI7Crs}<=2,1,0)+ if(#{i1iXbquZ5iv.iIC4YhgrxQY}/#{i1iXbquZ5iv.zogrUrI7Crs}>1 && #{i1iXbquZ5iv.iIC4YhgrxQY}/#{i1iXbquZ5iv.zogrUrI7Crs}<=2,1,0)+ if(#{RcE30WBKrXI.iIC4YhgrxQY}/#{RcE30WBKrXI.zogrUrI7Crs}>1 && #{RcE30WBKrXI.iIC4YhgrxQY}/#{RcE30WBKrXI.zogrUrI7Crs}<=2,1,0)+ if(#{EAG0GfdSMAs.iIC4YhgrxQY}/#{EAG0GfdSMAs.zogrUrI7Crs}>1 && #{EAG0GfdSMAs.iIC4YhgrxQY}/#{EAG0GfdSMAs.zogrUrI7Crs}<=2,1,0)+ if(#{N2aXs7VlJdJ.iIC4YhgrxQY}/#{N2aXs7VlJdJ.zogrUrI7Crs}>1 && #{N2aXs7VlJdJ.iIC4YhgrxQY}/#{N2aXs7VlJdJ.zogrUrI7Crs}<=2,1,0)+ if(#{xrjnOtFFTRC.iIC4YhgrxQY}/#{xrjnOtFFTRC.zogrUrI7Crs}>1 && #{xrjnOtFFTRC.iIC4YhgrxQY}/#{xrjnOtFFTRC.zogrUrI7Crs}<=2,1,0)Edit denominator:
Description: "1-2 months - MSR - Denominator"
Calculation: "1"3 1-2 years - MSR
For each item the Indicator returns "1" if the stock coverage time is greater rhan or equal to 12 but less than 24 and otherwise returns 0and then adds up these results for calculating the number of items with a stock coverage time of 12-24 months.Name (*): "1-2 years - MSR"
Short Name (*): "1-2 years - MSR"
Description: "Number of items with a coverage time of 1-2 years"
Decimals in data output: "0"
Indicator type (*): "Number (Factor 1)"
Edit numerator:Description: "1-2 years - MSR - Numerator"
Calculation:
if(#{LNAkkMTxqEW.iIC4YhgrxQY}/#{LNAkkMTxqEW.zogrUrI7Crs}>12 && #{LNAkkMTxqEW.iIC4YhgrxQY}/#{LNAkkMTxqEW.zogrUrI7Crs}<=24,1,0)+ if(#{WyDZKSw82X6.iIC4YhgrxQY}/#{WyDZKSw82X6.zogrUrI7Crs}>12 && #{WyDZKSw82X6.iIC4YhgrxQY}/#{WyDZKSw82X6.zogrUrI7Crs}<=24,1,0)+ if(#{JPccVwAGRq9.iIC4YhgrxQY}/#{JPccVwAGRq9.zogrUrI7Crs}>12 && #{JPccVwAGRq9.iIC4YhgrxQY}/#{JPccVwAGRq9.zogrUrI7Crs}<=24,1,0)+ if(#{smxJz7Mt6ia.iIC4YhgrxQY}/#{smxJz7Mt6ia.zogrUrI7Crs}>12 && #{smxJz7Mt6ia.iIC4YhgrxQY}/#{smxJz7Mt6ia.zogrUrI7Crs}<=24,1,0)+ if(#{AaIApgGQM6t.iIC4YhgrxQY}/#{AaIApgGQM6t.zogrUrI7Crs}>12 && #{AaIApgGQM6t.iIC4YhgrxQY}/#{AaIApgGQM6t.zogrUrI7Crs}<=24,1,0)+ if(#{vCTrmv52APd.iIC4YhgrxQY}/#{vCTrmv52APd.zogrUrI7Crs}>12 && #{vCTrmv52APd.iIC4YhgrxQY}/#{vCTrmv52APd.zogrUrI7Crs}<=24,1,0)+ if(#{SOw2TcuFFH2.iIC4YhgrxQY}/#{SOw2TcuFFH2.zogrUrI7Crs}>12 && #{SOw2TcuFFH2.iIC4YhgrxQY}/#{SOw2TcuFFH2.zogrUrI7Crs}<=24,1,0)+ if(#{RSIOx2u07Ln.iIC4YhgrxQY}/#{RSIOx2u07Ln.zogrUrI7Crs}>12 && #{RSIOx2u07Ln.iIC4YhgrxQY}/#{RSIOx2u07Ln.zogrUrI7Crs}<=24,1,0)+ if(#{JStiDyaPfqy.iIC4YhgrxQY}/#{JStiDyaPfqy.zogrUrI7Crs}>12 && #{JStiDyaPfqy.iIC4YhgrxQY}/#{JStiDyaPfqy.zogrUrI7Crs}<=24,1,0)+ if(#{hZ1YvdcTDQM.iIC4YhgrxQY}/#{hZ1YvdcTDQM.zogrUrI7Crs}>12 && #{hZ1YvdcTDQM.iIC4YhgrxQY}/#{hZ1YvdcTDQM.zogrUrI7Crs}<=24,1,0)+ if(#{tsi32D8HQd5.iIC4YhgrxQY}/#{tsi32D8HQd5.zogrUrI7Crs}>12 && #{tsi32D8HQd5.iIC4YhgrxQY}/#{tsi32D8HQd5.zogrUrI7Crs}<=24,1,0)+ if(#{QWlPF8S0gCc.iIC4YhgrxQY}/#{QWlPF8S0gCc.zogrUrI7Crs}>12 && #{QWlPF8S0gCc.iIC4YhgrxQY}/#{QWlPF8S0gCc.zogrUrI7Crs}<=24,1,0)+ if(#{a5uLTDt12eT.iIC4YhgrxQY}/#{a5uLTDt12eT.zogrUrI7Crs}>12 && #{a5uLTDt12eT.iIC4YhgrxQY}/#{a5uLTDt12eT.zogrUrI7Crs}<=24,1,0)+ if(#{U0AfOOyJMy2.iIC4YhgrxQY}/#{U0AfOOyJMy2.zogrUrI7Crs}>12 && #{U0AfOOyJMy2.iIC4YhgrxQY}/#{U0AfOOyJMy2.zogrUrI7Crs}<=24,1,0)+ if(#{cyf6UdScfFM.iIC4YhgrxQY}/#{cyf6UdScfFM.zogrUrI7Crs}>12 && #{cyf6UdScfFM.iIC4YhgrxQY}/#{cyf6UdScfFM.zogrUrI7Crs}<=24,1,0)+ if(#{FeUTTNHpVzD.iIC4YhgrxQY}/#{FeUTTNHpVzD.zogrUrI7Crs}>12 && #{FeUTTNHpVzD.iIC4YhgrxQY}/#{FeUTTNHpVzD.zogrUrI7Crs}<=24,1,0)+ if(#{mKSICD1rxG4.iIC4YhgrxQY}/#{mKSICD1rxG4.zogrUrI7Crs}>12 && #{mKSICD1rxG4.iIC4YhgrxQY}/#{mKSICD1rxG4.zogrUrI7Crs}<=24,1,0)+ if(#{mVNe1aS1pGl.iIC4YhgrxQY}/#{mVNe1aS1pGl.zogrUrI7Crs}>12 && #{mVNe1aS1pGl.iIC4YhgrxQY}/#{mVNe1aS1pGl.zogrUrI7Crs}<=24,1,0)+ if(#{oLAXTZY6ken.iIC4YhgrxQY}/#{oLAXTZY6ken.zogrUrI7Crs}>12 && #{oLAXTZY6ken.iIC4YhgrxQY}/#{oLAXTZY6ken.zogrUrI7Crs}<=24,1,0)+ if(#{YYaRDUZyH9L.iIC4YhgrxQY}/#{YYaRDUZyH9L.zogrUrI7Crs}>12 && #{YYaRDUZyH9L.iIC4YhgrxQY}/#{YYaRDUZyH9L.zogrUrI7Crs}<=24,1,0)+ if(#{HVteopBt0jr.iIC4YhgrxQY}/#{HVteopBt0jr.zogrUrI7Crs}>12 && #{HVteopBt0jr.iIC4YhgrxQY}/#{HVteopBt0jr.zogrUrI7Crs}<=24,1,0)+ if(#{sWodd2tbjgZ.iIC4YhgrxQY}/#{sWodd2tbjgZ.zogrUrI7Crs}>12 && #{sWodd2tbjgZ.iIC4YhgrxQY}/#{sWodd2tbjgZ.zogrUrI7Crs}<=24,1,0)+ if(#{yVYajDDYUfX.iIC4YhgrxQY}/#{yVYajDDYUfX.zogrUrI7Crs}>12 && #{yVYajDDYUfX.iIC4YhgrxQY}/#{yVYajDDYUfX.zogrUrI7Crs}<=24,1,0)+ if(#{eTJAr4sc83v.iIC4YhgrxQY}/#{eTJAr4sc83v.zogrUrI7Crs}>12 && #{eTJAr4sc83v.iIC4YhgrxQY}/#{eTJAr4sc83v.zogrUrI7Crs}<=24,1,0)+ if(#{U4KSmanl4JP.iIC4YhgrxQY}/#{U4KSmanl4JP.zogrUrI7Crs}>12 && #{U4KSmanl4JP.iIC4YhgrxQY}/#{U4KSmanl4JP.zogrUrI7Crs}<=24,1,0)+ if(#{FXsa5uG3IGn.iIC4YhgrxQY}/#{FXsa5uG3IGn.zogrUrI7Crs}>12 && #{FXsa5uG3IGn.iIC4YhgrxQY}/#{FXsa5uG3IGn.zogrUrI7Crs}<=24,1,0)+ if(#{L34T9YDtCor.iIC4YhgrxQY}/#{L34T9YDtCor.zogrUrI7Crs}>12 && #{L34T9YDtCor.iIC4YhgrxQY}/#{L34T9YDtCor.zogrUrI7Crs}<=24,1,0)+ if(#{W5mHXhSYFfQ.iIC4YhgrxQY}/#{W5mHXhSYFfQ.zogrUrI7Crs}>12 && #{W5mHXhSYFfQ.iIC4YhgrxQY}/#{W5mHXhSYFfQ.zogrUrI7Crs}<=24,1,0)+ if(#{cmSUyJOZwyl.iIC4YhgrxQY}/#{cmSUyJOZwyl.zogrUrI7Crs}>12 && #{cmSUyJOZwyl.iIC4YhgrxQY}/#{cmSUyJOZwyl.zogrUrI7Crs}<=24,1,0)+ if(#{cT8sfosRXvU.iIC4YhgrxQY}/#{cT8sfosRXvU.zogrUrI7Crs}>12 && #{cT8sfosRXvU.iIC4YhgrxQY}/#{cT8sfosRXvU.zogrUrI7Crs}<=24,1,0)+ if(#{OaWKnMS7say.iIC4YhgrxQY}/#{OaWKnMS7say.zogrUrI7Crs}>12 && #{OaWKnMS7say.iIC4YhgrxQY}/#{OaWKnMS7say.zogrUrI7Crs}<=24,1,0)+ if(#{Z4bjHvGS6aH.iIC4YhgrxQY}/#{Z4bjHvGS6aH.zogrUrI7Crs}>12 && #{Z4bjHvGS6aH.iIC4YhgrxQY}/#{Z4bjHvGS6aH.zogrUrI7Crs}<=24,1,0)+ if(#{Nn1L7CNEtC8.iIC4YhgrxQY}/#{Nn1L7CNEtC8.zogrUrI7Crs}>12 && #{Nn1L7CNEtC8.iIC4YhgrxQY}/#{Nn1L7CNEtC8.zogrUrI7Crs}<=24,1,0)+ if(#{RNYKSc3nAUg.iIC4YhgrxQY}/#{RNYKSc3nAUg.zogrUrI7Crs}>12 && #{RNYKSc3nAUg.iIC4YhgrxQY}/#{RNYKSc3nAUg.zogrUrI7Crs}<=24,1,0)+ if(#{PtmZ9XqpPKi.iIC4YhgrxQY}/#{PtmZ9XqpPKi.zogrUrI7Crs}>12 && #{PtmZ9XqpPKi.iIC4YhgrxQY}/#{PtmZ9XqpPKi.zogrUrI7Crs}<=24,1,0)+ if(#{CohlLHi54B0.iIC4YhgrxQY}/#{CohlLHi54B0.zogrUrI7Crs}>12 && #{CohlLHi54B0.iIC4YhgrxQY}/#{CohlLHi54B0.zogrUrI7Crs}<=24,1,0)+ if(#{Gu6u82RD9OW.iIC4YhgrxQY}/#{Gu6u82RD9OW.zogrUrI7Crs}>12 && #{Gu6u82RD9OW.iIC4YhgrxQY}/#{Gu6u82RD9OW.zogrUrI7Crs}<=24,1,0)+ if(#{LiuYzxYr4Pt.iIC4YhgrxQY}/#{LiuYzxYr4Pt.zogrUrI7Crs}>12 && #{LiuYzxYr4Pt.iIC4YhgrxQY}/#{LiuYzxYr4Pt.zogrUrI7Crs}<=24,1,0)+ if(#{Tje33nJAG55.iIC4YhgrxQY}/#{Tje33nJAG55.zogrUrI7Crs}>12 && #{Tje33nJAG55.iIC4YhgrxQY}/#{Tje33nJAG55.zogrUrI7Crs}<=24,1,0)+ if(#{euM2dlqleYH.iIC4YhgrxQY}/#{euM2dlqleYH.zogrUrI7Crs}>12 && #{euM2dlqleYH.iIC4YhgrxQY}/#{euM2dlqleYH.zogrUrI7Crs}<=24,1,0)+ if(#{dASLmBTEehF.iIC4YhgrxQY}/#{dASLmBTEehF.zogrUrI7Crs}>12 && #{dASLmBTEehF.iIC4YhgrxQY}/#{dASLmBTEehF.zogrUrI7Crs}<=24,1,0)+ if(#{qU2LvzoPn1z.iIC4YhgrxQY}/#{qU2LvzoPn1z.zogrUrI7Crs}>12 && #{qU2LvzoPn1z.iIC4YhgrxQY}/#{qU2LvzoPn1z.zogrUrI7Crs}<=24,1,0)+ if(#{OkWaFxdUQY2.iIC4YhgrxQY}/#{OkWaFxdUQY2.zogrUrI7Crs}>12 && #{OkWaFxdUQY2.iIC4YhgrxQY}/#{OkWaFxdUQY2.zogrUrI7Crs}<=24,1,0)+ if(#{YHIv7KQc2e7.iIC4YhgrxQY}/#{YHIv7KQc2e7.zogrUrI7Crs}>12 && #{YHIv7KQc2e7.iIC4YhgrxQY}/#{YHIv7KQc2e7.zogrUrI7Crs}<=24,1,0)+ if(#{rt9D47Inb49.iIC4YhgrxQY}/#{rt9D47Inb49.zogrUrI7Crs}>12 && #{rt9D47Inb49.iIC4YhgrxQY}/#{rt9D47Inb49.zogrUrI7Crs}<=24,1,0)+ if(#{i1iXbquZ5iv.iIC4YhgrxQY}/#{i1iXbquZ5iv.zogrUrI7Crs}>12 && #{i1iXbquZ5iv.iIC4YhgrxQY}/#{i1iXbquZ5iv.zogrUrI7Crs}<=24,1,0)+ if(#{RcE30WBKrXI.iIC4YhgrxQY}/#{RcE30WBKrXI.zogrUrI7Crs}>12 && #{RcE30WBKrXI.iIC4YhgrxQY}/#{RcE30WBKrXI.zogrUrI7Crs}<=24,1,0)+ if(#{EAG0GfdSMAs.iIC4YhgrxQY}/#{EAG0GfdSMAs.zogrUrI7Crs}>12 && #{EAG0GfdSMAs.iIC4YhgrxQY}/#{EAG0GfdSMAs.zogrUrI7Crs}<=24,1,0)+ if(#{N2aXs7VlJdJ.iIC4YhgrxQY}/#{N2aXs7VlJdJ.zogrUrI7Crs}>12 && #{N2aXs7VlJdJ.iIC4YhgrxQY}/#{N2aXs7VlJdJ.zogrUrI7Crs}<=24,1,0)+ if(#{xrjnOtFFTRC.iIC4YhgrxQY}/#{xrjnOtFFTRC.zogrUrI7Crs}>12 && #{xrjnOtFFTRC.iIC4YhgrxQY}/#{xrjnOtFFTRC.zogrUrI7Crs}<=24,1,0)Edit denominator:
Description: "12-24 months - MSR - Denominator"
Calculation: "1"4 10-11 months - MSR
For each item the Indicator returns "1" if the stock coverage time is greater or equal to 10 but less than 11 and otherwise returns 0 and then adds up these results for calculating the number of items with a stock coverage time of 10-11 months.Name (*): "10-11 months - MSR"
Short Name (*): "10-11 months - MSR"
Description: "Number of items with a coverage time of 10-11 months"
Decimals in data output: "0"
Indicator type (*): "Number (Factor 1)"
Edit numerator:Description: "1O-11 months - MSR - Numerator"
Calculation:
if(#{LNAkkMTxqEW.iIC4YhgrxQY}/#{LNAkkMTxqEW.zogrUrI7Crs}>10 && #{LNAkkMTxqEW.iIC4YhgrxQY}/#{LNAkkMTxqEW.zogrUrI7Crs}<=11,1,0)+ if(#{WyDZKSw82X6.iIC4YhgrxQY}/#{WyDZKSw82X6.zogrUrI7Crs}>10 && #{WyDZKSw82X6.iIC4YhgrxQY}/#{WyDZKSw82X6.zogrUrI7Crs}<=11,1,0)+ if(#{JPccVwAGRq9.iIC4YhgrxQY}/#{JPccVwAGRq9.zogrUrI7Crs}>10 && #{JPccVwAGRq9.iIC4YhgrxQY}/#{JPccVwAGRq9.zogrUrI7Crs}<=11,1,0)+ if(#{smxJz7Mt6ia.iIC4YhgrxQY}/#{smxJz7Mt6ia.zogrUrI7Crs}>10 && #{smxJz7Mt6ia.iIC4YhgrxQY}/#{smxJz7Mt6ia.zogrUrI7Crs}<=11,1,0)+ if(#{AaIApgGQM6t.iIC4YhgrxQY}/#{AaIApgGQM6t.zogrUrI7Crs}>10 && #{AaIApgGQM6t.iIC4YhgrxQY}/#{AaIApgGQM6t.zogrUrI7Crs}<=11,1,0)+ if(#{vCTrmv52APd.iIC4YhgrxQY}/#{vCTrmv52APd.zogrUrI7Crs}>10 && #{vCTrmv52APd.iIC4YhgrxQY}/#{vCTrmv52APd.zogrUrI7Crs}<=11,1,0)+ if(#{SOw2TcuFFH2.iIC4YhgrxQY}/#{SOw2TcuFFH2.zogrUrI7Crs}>10 && #{SOw2TcuFFH2.iIC4YhgrxQY}/#{SOw2TcuFFH2.zogrUrI7Crs}<=11,1,0)+ if(#{RSIOx2u07Ln.iIC4YhgrxQY}/#{RSIOx2u07Ln.zogrUrI7Crs}>10 && #{RSIOx2u07Ln.iIC4YhgrxQY}/#{RSIOx2u07Ln.zogrUrI7Crs}<=11,1,0)+ if(#{JStiDyaPfqy.iIC4YhgrxQY}/#{JStiDyaPfqy.zogrUrI7Crs}>10 && #{JStiDyaPfqy.iIC4YhgrxQY}/#{JStiDyaPfqy.zogrUrI7Crs}<=11,1,0)+ if(#{hZ1YvdcTDQM.iIC4YhgrxQY}/#{hZ1YvdcTDQM.zogrUrI7Crs}>10 && #{hZ1YvdcTDQM.iIC4YhgrxQY}/#{hZ1YvdcTDQM.zogrUrI7Crs}<=11,1,0)+ if(#{tsi32D8HQd5.iIC4YhgrxQY}/#{tsi32D8HQd5.zogrUrI7Crs}>10 && #{tsi32D8HQd5.iIC4YhgrxQY}/#{tsi32D8HQd5.zogrUrI7Crs}<=11,1,0)+ if(#{QWlPF8S0gCc.iIC4YhgrxQY}/#{QWlPF8S0gCc.zogrUrI7Crs}>10 && #{QWlPF8S0gCc.iIC4YhgrxQY}/#{QWlPF8S0gCc.zogrUrI7Crs}<=11,1,0)+ if(#{a5uLTDt12eT.iIC4YhgrxQY}/#{a5uLTDt12eT.zogrUrI7Crs}>10 && #{a5uLTDt12eT.iIC4YhgrxQY}/#{a5uLTDt12eT.zogrUrI7Crs}<=11,1,0)+ if(#{U0AfOOyJMy2.iIC4YhgrxQY}/#{U0AfOOyJMy2.zogrUrI7Crs}>10 && #{U0AfOOyJMy2.iIC4YhgrxQY}/#{U0AfOOyJMy2.zogrUrI7Crs}<=11,1,0)+ if(#{cyf6UdScfFM.iIC4YhgrxQY}/#{cyf6UdScfFM.zogrUrI7Crs}>10 && #{cyf6UdScfFM.iIC4YhgrxQY}/#{cyf6UdScfFM.zogrUrI7Crs}<=11,1,0)+ if(#{FeUTTNHpVzD.iIC4YhgrxQY}/#{FeUTTNHpVzD.zogrUrI7Crs}>10 && #{FeUTTNHpVzD.iIC4YhgrxQY}/#{FeUTTNHpVzD.zogrUrI7Crs}<=11,1,0)+ if(#{mKSICD1rxG4.iIC4YhgrxQY}/#{mKSICD1rxG4.zogrUrI7Crs}>10 && #{mKSICD1rxG4.iIC4YhgrxQY}/#{mKSICD1rxG4.zogrUrI7Crs}<=11,1,0)+ if(#{mVNe1aS1pGl.iIC4YhgrxQY}/#{mVNe1aS1pGl.zogrUrI7Crs}>10 && #{mVNe1aS1pGl.iIC4YhgrxQY}/#{mVNe1aS1pGl.zogrUrI7Crs}<=11,1,0)+ if(#{oLAXTZY6ken.iIC4YhgrxQY}/#{oLAXTZY6ken.zogrUrI7Crs}>10 && #{oLAXTZY6ken.iIC4YhgrxQY}/#{oLAXTZY6ken.zogrUrI7Crs}<=11,1,0)+ if(#{YYaRDUZyH9L.iIC4YhgrxQY}/#{YYaRDUZyH9L.zogrUrI7Crs}>10 && #{YYaRDUZyH9L.iIC4YhgrxQY}/#{YYaRDUZyH9L.zogrUrI7Crs}<=11,1,0)+ if(#{HVteopBt0jr.iIC4YhgrxQY}/#{HVteopBt0jr.zogrUrI7Crs}>10 && #{HVteopBt0jr.iIC4YhgrxQY}/#{HVteopBt0jr.zogrUrI7Crs}<=11,1,0)+ if(#{sWodd2tbjgZ.iIC4YhgrxQY}/#{sWodd2tbjgZ.zogrUrI7Crs}>10 && #{sWodd2tbjgZ.iIC4YhgrxQY}/#{sWodd2tbjgZ.zogrUrI7Crs}<=11,1,0)+ if(#{yVYajDDYUfX.iIC4YhgrxQY}/#{yVYajDDYUfX.zogrUrI7Crs}>10 && #{yVYajDDYUfX.iIC4YhgrxQY}/#{yVYajDDYUfX.zogrUrI7Crs}<=11,1,0)+ if(#{eTJAr4sc83v.iIC4YhgrxQY}/#{eTJAr4sc83v.zogrUrI7Crs}>10 && #{eTJAr4sc83v.iIC4YhgrxQY}/#{eTJAr4sc83v.zogrUrI7Crs}<=11,1,0)+ if(#{U4KSmanl4JP.iIC4YhgrxQY}/#{U4KSmanl4JP.zogrUrI7Crs}>10 && #{U4KSmanl4JP.iIC4YhgrxQY}/#{U4KSmanl4JP.zogrUrI7Crs}<=11,1,0)+ if(#{FXsa5uG3IGn.iIC4YhgrxQY}/#{FXsa5uG3IGn.zogrUrI7Crs}>10 && #{FXsa5uG3IGn.iIC4YhgrxQY}/#{FXsa5uG3IGn.zogrUrI7Crs}<=11,1,0)+ if(#{L34T9YDtCor.iIC4YhgrxQY}/#{L34T9YDtCor.zogrUrI7Crs}>10 && #{L34T9YDtCor.iIC4YhgrxQY}/#{L34T9YDtCor.zogrUrI7Crs}<=11,1,0)+ if(#{W5mHXhSYFfQ.iIC4YhgrxQY}/#{W5mHXhSYFfQ.zogrUrI7Crs}>10 && #{W5mHXhSYFfQ.iIC4YhgrxQY}/#{W5mHXhSYFfQ.zogrUrI7Crs}<=11,1,0)+ if(#{cmSUyJOZwyl.iIC4YhgrxQY}/#{cmSUyJOZwyl.zogrUrI7Crs}>10 && #{cmSUyJOZwyl.iIC4YhgrxQY}/#{cmSUyJOZwyl.zogrUrI7Crs}<=11,1,0)+ if(#{cT8sfosRXvU.iIC4YhgrxQY}/#{cT8sfosRXvU.zogrUrI7Crs}>10 && #{cT8sfosRXvU.iIC4YhgrxQY}/#{cT8sfosRXvU.zogrUrI7Crs}<=11,1,0)+ if(#{OaWKnMS7say.iIC4YhgrxQY}/#{OaWKnMS7say.zogrUrI7Crs}>10 && #{OaWKnMS7say.iIC4YhgrxQY}/#{OaWKnMS7say.zogrUrI7Crs}<=11,1,0)+ if(#{Z4bjHvGS6aH.iIC4YhgrxQY}/#{Z4bjHvGS6aH.zogrUrI7Crs}>10 && #{Z4bjHvGS6aH.iIC4YhgrxQY}/#{Z4bjHvGS6aH.zogrUrI7Crs}<=11,1,0)+ if(#{Nn1L7CNEtC8.iIC4YhgrxQY}/#{Nn1L7CNEtC8.zogrUrI7Crs}>10 && #{Nn1L7CNEtC8.iIC4YhgrxQY}/#{Nn1L7CNEtC8.zogrUrI7Crs}<=11,1,0)+ if(#{RNYKSc3nAUg.iIC4YhgrxQY}/#{RNYKSc3nAUg.zogrUrI7Crs}>10 && #{RNYKSc3nAUg.iIC4YhgrxQY}/#{RNYKSc3nAUg.zogrUrI7Crs}<=11,1,0)+ if(#{PtmZ9XqpPKi.iIC4YhgrxQY}/#{PtmZ9XqpPKi.zogrUrI7Crs}>10 && #{PtmZ9XqpPKi.iIC4YhgrxQY}/#{PtmZ9XqpPKi.zogrUrI7Crs}<=11,1,0)+ if(#{CohlLHi54B0.iIC4YhgrxQY}/#{CohlLHi54B0.zogrUrI7Crs}>10 && #{CohlLHi54B0.iIC4YhgrxQY}/#{CohlLHi54B0.zogrUrI7Crs}<=11,1,0)+ if(#{Gu6u82RD9OW.iIC4YhgrxQY}/#{Gu6u82RD9OW.zogrUrI7Crs}>10 && #{Gu6u82RD9OW.iIC4YhgrxQY}/#{Gu6u82RD9OW.zogrUrI7Crs}<=11,1,0)+ if(#{LiuYzxYr4Pt.iIC4YhgrxQY}/#{LiuYzxYr4Pt.zogrUrI7Crs}>10 && #{LiuYzxYr4Pt.iIC4YhgrxQY}/#{LiuYzxYr4Pt.zogrUrI7Crs}<=11,1,0)+ if(#{Tje33nJAG55.iIC4YhgrxQY}/#{Tje33nJAG55.zogrUrI7Crs}>10 && #{Tje33nJAG55.iIC4YhgrxQY}/#{Tje33nJAG55.zogrUrI7Crs}<=11,1,0)+ if(#{euM2dlqleYH.iIC4YhgrxQY}/#{euM2dlqleYH.zogrUrI7Crs}>10 && #{euM2dlqleYH.iIC4YhgrxQY}/#{euM2dlqleYH.zogrUrI7Crs}<=11,1,0)+ if(#{dASLmBTEehF.iIC4YhgrxQY}/#{dASLmBTEehF.zogrUrI7Crs}>10 && #{dASLmBTEehF.iIC4YhgrxQY}/#{dASLmBTEehF.zogrUrI7Crs}<=11,1,0)+ if(#{qU2LvzoPn1z.iIC4YhgrxQY}/#{qU2LvzoPn1z.zogrUrI7Crs}>10 && #{qU2LvzoPn1z.iIC4YhgrxQY}/#{qU2LvzoPn1z.zogrUrI7Crs}<=11,1,0)+ if(#{OkWaFxdUQY2.iIC4YhgrxQY}/#{OkWaFxdUQY2.zogrUrI7Crs}>10 && #{OkWaFxdUQY2.iIC4YhgrxQY}/#{OkWaFxdUQY2.zogrUrI7Crs}<=11,1,0)+ if(#{YHIv7KQc2e7.iIC4YhgrxQY}/#{YHIv7KQc2e7.zogrUrI7Crs}>10 && #{YHIv7KQc2e7.iIC4YhgrxQY}/#{YHIv7KQc2e7.zogrUrI7Crs}<=11,1,0)+ if(#{rt9D47Inb49.iIC4YhgrxQY}/#{rt9D47Inb49.zogrUrI7Crs}>10 && #{rt9D47Inb49.iIC4YhgrxQY}/#{rt9D47Inb49.zogrUrI7Crs}<=11,1,0)+ if(#{i1iXbquZ5iv.iIC4YhgrxQY}/#{i1iXbquZ5iv.zogrUrI7Crs}>10 && #{i1iXbquZ5iv.iIC4YhgrxQY}/#{i1iXbquZ5iv.zogrUrI7Crs}<=11,1,0)+ if(#{RcE30WBKrXI.iIC4YhgrxQY}/#{RcE30WBKrXI.zogrUrI7Crs}>10 && #{RcE30WBKrXI.iIC4YhgrxQY}/#{RcE30WBKrXI.zogrUrI7Crs}<=11,1,0)+ if(#{EAG0GfdSMAs.iIC4YhgrxQY}/#{EAG0GfdSMAs.zogrUrI7Crs}>10 && #{EAG0GfdSMAs.iIC4YhgrxQY}/#{EAG0GfdSMAs.zogrUrI7Crs}<=11,1,0)+ if(#{N2aXs7VlJdJ.iIC4YhgrxQY}/#{N2aXs7VlJdJ.zogrUrI7Crs}>10 && #{N2aXs7VlJdJ.iIC4YhgrxQY}/#{N2aXs7VlJdJ.zogrUrI7Crs}<=11,1,0)+ if(#{xrjnOtFFTRC.iIC4YhgrxQY}/#{xrjnOtFFTRC.zogrUrI7Crs}>10 && #{xrjnOtFFTRC.iIC4YhgrxQY}/#{xrjnOtFFTRC.zogrUrI7Crs}<=11,1,0)Edit denominator:
Description: "1O-11 months - MSR - Denominator"
Calculation: "1"5 11-12 months - MSR
For each item the Indicator returns "1" if the stock coverage time is greater than or equal to 11 but less than 12 and otherwise returns 0 and then adds up these results for calculating the number of items with a stock coverage time of 11-12 months.Name (*): "11-12 months - MSR"
Short Name (*): "11-12 months - MSR"
Description: "Number of items with a coverage time of 11-12 months"
Decimals in data output: "0"
Indicator type (*): "Number (Factor 1)"
Edit numerator:Description: "11-12 months - MSR - Numerator"
Calculation:
if(#{LNAkkMTxqEW.iIC4YhgrxQY}/#{LNAkkMTxqEW.zogrUrI7Crs}>11 && #{LNAkkMTxqEW.iIC4YhgrxQY}/#{LNAkkMTxqEW.zogrUrI7Crs}<=12,1,0)+ if(#{WyDZKSw82X6.iIC4YhgrxQY}/#{WyDZKSw82X6.zogrUrI7Crs}>11 && #{WyDZKSw82X6.iIC4YhgrxQY}/#{WyDZKSw82X6.zogrUrI7Crs}<=12,1,0)+ if(#{JPccVwAGRq9.iIC4YhgrxQY}/#{JPccVwAGRq9.zogrUrI7Crs}>11 && #{JPccVwAGRq9.iIC4YhgrxQY}/#{JPccVwAGRq9.zogrUrI7Crs}<=12,1,0)+ if(#{smxJz7Mt6ia.iIC4YhgrxQY}/#{smxJz7Mt6ia.zogrUrI7Crs}>11 && #{smxJz7Mt6ia.iIC4YhgrxQY}/#{smxJz7Mt6ia.zogrUrI7Crs}<=12,1,0)+ if(#{AaIApgGQM6t.iIC4YhgrxQY}/#{AaIApgGQM6t.zogrUrI7Crs}>11 && #{AaIApgGQM6t.iIC4YhgrxQY}/#{AaIApgGQM6t.zogrUrI7Crs}<=12,1,0)+ if(#{vCTrmv52APd.iIC4YhgrxQY}/#{vCTrmv52APd.zogrUrI7Crs}>11 && #{vCTrmv52APd.iIC4YhgrxQY}/#{vCTrmv52APd.zogrUrI7Crs}<=12,1,0)+ if(#{SOw2TcuFFH2.iIC4YhgrxQY}/#{SOw2TcuFFH2.zogrUrI7Crs}>11 && #{SOw2TcuFFH2.iIC4YhgrxQY}/#{SOw2TcuFFH2.zogrUrI7Crs}<=12,1,0)+ if(#{RSIOx2u07Ln.iIC4YhgrxQY}/#{RSIOx2u07Ln.zogrUrI7Crs}>11 && #{RSIOx2u07Ln.iIC4YhgrxQY}/#{RSIOx2u07Ln.zogrUrI7Crs}<=12,1,0)+ if(#{JStiDyaPfqy.iIC4YhgrxQY}/#{JStiDyaPfqy.zogrUrI7Crs}>11 && #{JStiDyaPfqy.iIC4YhgrxQY}/#{JStiDyaPfqy.zogrUrI7Crs}<=12,1,0)+ if(#{hZ1YvdcTDQM.iIC4YhgrxQY}/#{hZ1YvdcTDQM.zogrUrI7Crs}>11 && #{hZ1YvdcTDQM.iIC4YhgrxQY}/#{hZ1YvdcTDQM.zogrUrI7Crs}<=12,1,0)+ if(#{tsi32D8HQd5.iIC4YhgrxQY}/#{tsi32D8HQd5.zogrUrI7Crs}>11 && #{tsi32D8HQd5.iIC4YhgrxQY}/#{tsi32D8HQd5.zogrUrI7Crs}<=12,1,0)+ if(#{QWlPF8S0gCc.iIC4YhgrxQY}/#{QWlPF8S0gCc.zogrUrI7Crs}>11 && #{QWlPF8S0gCc.iIC4YhgrxQY}/#{QWlPF8S0gCc.zogrUrI7Crs}<=12,1,0)+ if(#{a5uLTDt12eT.iIC4YhgrxQY}/#{a5uLTDt12eT.zogrUrI7Crs}>11 && #{a5uLTDt12eT.iIC4YhgrxQY}/#{a5uLTDt12eT.zogrUrI7Crs}<=12,1,0)+ if(#{U0AfOOyJMy2.iIC4YhgrxQY}/#{U0AfOOyJMy2.zogrUrI7Crs}>11 && #{U0AfOOyJMy2.iIC4YhgrxQY}/#{U0AfOOyJMy2.zogrUrI7Crs}<=12,1,0)+ if(#{cyf6UdScfFM.iIC4YhgrxQY}/#{cyf6UdScfFM.zogrUrI7Crs}>11 && #{cyf6UdScfFM.iIC4YhgrxQY}/#{cyf6UdScfFM.zogrUrI7Crs}<=12,1,0)+ if(#{FeUTTNHpVzD.iIC4YhgrxQY}/#{FeUTTNHpVzD.zogrUrI7Crs}>11 && #{FeUTTNHpVzD.iIC4YhgrxQY}/#{FeUTTNHpVzD.zogrUrI7Crs}<=12,1,0)+ if(#{mKSICD1rxG4.iIC4YhgrxQY}/#{mKSICD1rxG4.zogrUrI7Crs}>11 && #{mKSICD1rxG4.iIC4YhgrxQY}/#{mKSICD1rxG4.zogrUrI7Crs}<=12,1,0)+ if(#{mVNe1aS1pGl.iIC4YhgrxQY}/#{mVNe1aS1pGl.zogrUrI7Crs}>11 && #{mVNe1aS1pGl.iIC4YhgrxQY}/#{mVNe1aS1pGl.zogrUrI7Crs}<=12,1,0)+ if(#{oLAXTZY6ken.iIC4YhgrxQY}/#{oLAXTZY6ken.zogrUrI7Crs}>11 && #{oLAXTZY6ken.iIC4YhgrxQY}/#{oLAXTZY6ken.zogrUrI7Crs}<=12,1,0)+ if(#{YYaRDUZyH9L.iIC4YhgrxQY}/#{YYaRDUZyH9L.zogrUrI7Crs}>11 && #{YYaRDUZyH9L.iIC4YhgrxQY}/#{YYaRDUZyH9L.zogrUrI7Crs}<=12,1,0)+ if(#{HVteopBt0jr.iIC4YhgrxQY}/#{HVteopBt0jr.zogrUrI7Crs}>11 && #{HVteopBt0jr.iIC4YhgrxQY}/#{HVteopBt0jr.zogrUrI7Crs}<=12,1,0)+ if(#{sWodd2tbjgZ.iIC4YhgrxQY}/#{sWodd2tbjgZ.zogrUrI7Crs}>11 && #{sWodd2tbjgZ.iIC4YhgrxQY}/#{sWodd2tbjgZ.zogrUrI7Crs}<=12,1,0)+ if(#{yVYajDDYUfX.iIC4YhgrxQY}/#{yVYajDDYUfX.zogrUrI7Crs}>11 && #{yVYajDDYUfX.iIC4YhgrxQY}/#{yVYajDDYUfX.zogrUrI7Crs}<=12,1,0)+ if(#{eTJAr4sc83v.iIC4YhgrxQY}/#{eTJAr4sc83v.zogrUrI7Crs}>11 && #{eTJAr4sc83v.iIC4YhgrxQY}/#{eTJAr4sc83v.zogrUrI7Crs}<=12,1,0)+ if(#{U4KSmanl4JP.iIC4YhgrxQY}/#{U4KSmanl4JP.zogrUrI7Crs}>11 && #{U4KSmanl4JP.iIC4YhgrxQY}/#{U4KSmanl4JP.zogrUrI7Crs}<=12,1,0)+ if(#{FXsa5uG3IGn.iIC4YhgrxQY}/#{FXsa5uG3IGn.zogrUrI7Crs}>11 && #{FXsa5uG3IGn.iIC4YhgrxQY}/#{FXsa5uG3IGn.zogrUrI7Crs}<=12,1,0)+ if(#{L34T9YDtCor.iIC4YhgrxQY}/#{L34T9YDtCor.zogrUrI7Crs}>11 && #{L34T9YDtCor.iIC4YhgrxQY}/#{L34T9YDtCor.zogrUrI7Crs}<=12,1,0)+ if(#{W5mHXhSYFfQ.iIC4YhgrxQY}/#{W5mHXhSYFfQ.zogrUrI7Crs}>11 && #{W5mHXhSYFfQ.iIC4YhgrxQY}/#{W5mHXhSYFfQ.zogrUrI7Crs}<=12,1,0)+ if(#{cmSUyJOZwyl.iIC4YhgrxQY}/#{cmSUyJOZwyl.zogrUrI7Crs}>11 && #{cmSUyJOZwyl.iIC4YhgrxQY}/#{cmSUyJOZwyl.zogrUrI7Crs}<=12,1,0)+ if(#{cT8sfosRXvU.iIC4YhgrxQY}/#{cT8sfosRXvU.zogrUrI7Crs}>11 && #{cT8sfosRXvU.iIC4YhgrxQY}/#{cT8sfosRXvU.zogrUrI7Crs}<=12,1,0)+ if(#{OaWKnMS7say.iIC4YhgrxQY}/#{OaWKnMS7say.zogrUrI7Crs}>11 && #{OaWKnMS7say.iIC4YhgrxQY}/#{OaWKnMS7say.zogrUrI7Crs}<=12,1,0)+ if(#{Z4bjHvGS6aH.iIC4YhgrxQY}/#{Z4bjHvGS6aH.zogrUrI7Crs}>11 && #{Z4bjHvGS6aH.iIC4YhgrxQY}/#{Z4bjHvGS6aH.zogrUrI7Crs}<=12,1,0)+ if(#{Nn1L7CNEtC8.iIC4YhgrxQY}/#{Nn1L7CNEtC8.zogrUrI7Crs}>11 && #{Nn1L7CNEtC8.iIC4YhgrxQY}/#{Nn1L7CNEtC8.zogrUrI7Crs}<=12,1,0)+ if(#{RNYKSc3nAUg.iIC4YhgrxQY}/#{RNYKSc3nAUg.zogrUrI7Crs}>11 && #{RNYKSc3nAUg.iIC4YhgrxQY}/#{RNYKSc3nAUg.zogrUrI7Crs}<=12,1,0)+ if(#{PtmZ9XqpPKi.iIC4YhgrxQY}/#{PtmZ9XqpPKi.zogrUrI7Crs}>11 && #{PtmZ9XqpPKi.iIC4YhgrxQY}/#{PtmZ9XqpPKi.zogrUrI7Crs}<=12,1,0)+ if(#{CohlLHi54B0.iIC4YhgrxQY}/#{CohlLHi54B0.zogrUrI7Crs}>11 && #{CohlLHi54B0.iIC4YhgrxQY}/#{CohlLHi54B0.zogrUrI7Crs}<=12,1,0)+ if(#{Gu6u82RD9OW.iIC4YhgrxQY}/#{Gu6u82RD9OW.zogrUrI7Crs}>11 && #{Gu6u82RD9OW.iIC4YhgrxQY}/#{Gu6u82RD9OW.zogrUrI7Crs}<=12,1,0)+ if(#{LiuYzxYr4Pt.iIC4YhgrxQY}/#{LiuYzxYr4Pt.zogrUrI7Crs}>11 && #{LiuYzxYr4Pt.iIC4YhgrxQY}/#{LiuYzxYr4Pt.zogrUrI7Crs}<=12,1,0)+ if(#{Tje33nJAG55.iIC4YhgrxQY}/#{Tje33nJAG55.zogrUrI7Crs}>11 && #{Tje33nJAG55.iIC4YhgrxQY}/#{Tje33nJAG55.zogrUrI7Crs}<=12,1,0)+ if(#{euM2dlqleYH.iIC4YhgrxQY}/#{euM2dlqleYH.zogrUrI7Crs}>11 && #{euM2dlqleYH.iIC4YhgrxQY}/#{euM2dlqleYH.zogrUrI7Crs}<=12,1,0)+ if(#{dASLmBTEehF.iIC4YhgrxQY}/#{dASLmBTEehF.zogrUrI7Crs}>11 && #{dASLmBTEehF.iIC4YhgrxQY}/#{dASLmBTEehF.zogrUrI7Crs}<=12,1,0)+ if(#{qU2LvzoPn1z.iIC4YhgrxQY}/#{qU2LvzoPn1z.zogrUrI7Crs}>11 && #{qU2LvzoPn1z.iIC4YhgrxQY}/#{qU2LvzoPn1z.zogrUrI7Crs}<=12,1,0)+ if(#{OkWaFxdUQY2.iIC4YhgrxQY}/#{OkWaFxdUQY2.zogrUrI7Crs}>11 && #{OkWaFxdUQY2.iIC4YhgrxQY}/#{OkWaFxdUQY2.zogrUrI7Crs}<=12,1,0)+ if(#{YHIv7KQc2e7.iIC4YhgrxQY}/#{YHIv7KQc2e7.zogrUrI7Crs}>11 && #{YHIv7KQc2e7.iIC4YhgrxQY}/#{YHIv7KQc2e7.zogrUrI7Crs}<=12,1,0)+ if(#{rt9D47Inb49.iIC4YhgrxQY}/#{rt9D47Inb49.zogrUrI7Crs}>11 && #{rt9D47Inb49.iIC4YhgrxQY}/#{rt9D47Inb49.zogrUrI7Crs}<=12,1,0)+ if(#{i1iXbquZ5iv.iIC4YhgrxQY}/#{i1iXbquZ5iv.zogrUrI7Crs}>11 && #{i1iXbquZ5iv.iIC4YhgrxQY}/#{i1iXbquZ5iv.zogrUrI7Crs}<=12,1,0)+ if(#{RcE30WBKrXI.iIC4YhgrxQY}/#{RcE30WBKrXI.zogrUrI7Crs}>11 && #{RcE30WBKrXI.iIC4YhgrxQY}/#{RcE30WBKrXI.zogrUrI7Crs}<=12,1,0)+ if(#{EAG0GfdSMAs.iIC4YhgrxQY}/#{EAG0GfdSMAs.zogrUrI7Crs}>11 && #{EAG0GfdSMAs.iIC4YhgrxQY}/#{EAG0GfdSMAs.zogrUrI7Crs}<=12,1,0)+ if(#{N2aXs7VlJdJ.iIC4YhgrxQY}/#{N2aXs7VlJdJ.zogrUrI7Crs}>11 && #{N2aXs7VlJdJ.iIC4YhgrxQY}/#{N2aXs7VlJdJ.zogrUrI7Crs}<=12,1,0)+ if(#{xrjnOtFFTRC.iIC4YhgrxQY}/#{xrjnOtFFTRC.zogrUrI7Crs}>11 && #{xrjnOtFFTRC.iIC4YhgrxQY}/#{xrjnOtFFTRC.zogrUrI7Crs}<=12,1,0)Edit denominator:
Description: "11-12 months - MSR - Denominator"
Calculation: "1"6 2-3 months - MSR
For each item the Indicator returns "1" if the stock coverage time is greater than or equal to 2 but less than 3 and otherwise returns 0and then adds up these results for calculating the number of items with a stock coverage time greater of 2-3 months.Name (*): "2-3 months"
Short Name (*): "2-3 months - MSR"
Description: "Number of items with a coverage time of 2-3 months"
Decimals in data output: "0"
Indicator type (*): "Number (Factor 1)"
Edit numerator:Description: "1-2 months - MSR - Numerator"
Calculation:
if(#{LNAkkMTxqEW.iIC4YhgrxQY}/#{LNAkkMTxqEW.zogrUrI7Crs}>2 && #{LNAkkMTxqEW.iIC4YhgrxQY}/#{LNAkkMTxqEW.zogrUrI7Crs}<=3,1,0)+ if(#{WyDZKSw82X6.iIC4YhgrxQY}/#{WyDZKSw82X6.zogrUrI7Crs}>2 && #{WyDZKSw82X6.iIC4YhgrxQY}/#{WyDZKSw82X6.zogrUrI7Crs}<=3,1,0)+ if(#{JPccVwAGRq9.iIC4YhgrxQY}/#{JPccVwAGRq9.zogrUrI7Crs}>2 && #{JPccVwAGRq9.iIC4YhgrxQY}/#{JPccVwAGRq9.zogrUrI7Crs}<=3,1,0)+ if(#{smxJz7Mt6ia.iIC4YhgrxQY}/#{smxJz7Mt6ia.zogrUrI7Crs}>2 && #{smxJz7Mt6ia.iIC4YhgrxQY}/#{smxJz7Mt6ia.zogrUrI7Crs}<=3,1,0)+ if(#{AaIApgGQM6t.iIC4YhgrxQY}/#{AaIApgGQM6t.zogrUrI7Crs}>2 && #{AaIApgGQM6t.iIC4YhgrxQY}/#{AaIApgGQM6t.zogrUrI7Crs}<=3,1,0)+ if(#{vCTrmv52APd.iIC4YhgrxQY}/#{vCTrmv52APd.zogrUrI7Crs}>2 && #{vCTrmv52APd.iIC4YhgrxQY}/#{vCTrmv52APd.zogrUrI7Crs}<=3,1,0)+ if(#{SOw2TcuFFH2.iIC4YhgrxQY}/#{SOw2TcuFFH2.zogrUrI7Crs}>2 && #{SOw2TcuFFH2.iIC4YhgrxQY}/#{SOw2TcuFFH2.zogrUrI7Crs}<=3,1,0)+ if(#{RSIOx2u07Ln.iIC4YhgrxQY}/#{RSIOx2u07Ln.zogrUrI7Crs}>2 && #{RSIOx2u07Ln.iIC4YhgrxQY}/#{RSIOx2u07Ln.zogrUrI7Crs}<=3,1,0)+ if(#{JStiDyaPfqy.iIC4YhgrxQY}/#{JStiDyaPfqy.zogrUrI7Crs}>2 && #{JStiDyaPfqy.iIC4YhgrxQY}/#{JStiDyaPfqy.zogrUrI7Crs}<=3,1,0)+ if(#{hZ1YvdcTDQM.iIC4YhgrxQY}/#{hZ1YvdcTDQM.zogrUrI7Crs}>2 && #{hZ1YvdcTDQM.iIC4YhgrxQY}/#{hZ1YvdcTDQM.zogrUrI7Crs}<=3,1,0)+ if(#{tsi32D8HQd5.iIC4YhgrxQY}/#{tsi32D8HQd5.zogrUrI7Crs}>2 && #{tsi32D8HQd5.iIC4YhgrxQY}/#{tsi32D8HQd5.zogrUrI7Crs}<=3,1,0)+ if(#{QWlPF8S0gCc.iIC4YhgrxQY}/#{QWlPF8S0gCc.zogrUrI7Crs}>2 && #{QWlPF8S0gCc.iIC4YhgrxQY}/#{QWlPF8S0gCc.zogrUrI7Crs}<=3,1,0)+ if(#{a5uLTDt12eT.iIC4YhgrxQY}/#{a5uLTDt12eT.zogrUrI7Crs}>2 && #{a5uLTDt12eT.iIC4YhgrxQY}/#{a5uLTDt12eT.zogrUrI7Crs}<=3,1,0)+ if(#{U0AfOOyJMy2.iIC4YhgrxQY}/#{U0AfOOyJMy2.zogrUrI7Crs}>2 && #{U0AfOOyJMy2.iIC4YhgrxQY}/#{U0AfOOyJMy2.zogrUrI7Crs}<=3,1,0)+ if(#{cyf6UdScfFM.iIC4YhgrxQY}/#{cyf6UdScfFM.zogrUrI7Crs}>2 && #{cyf6UdScfFM.iIC4YhgrxQY}/#{cyf6UdScfFM.zogrUrI7Crs}<=3,1,0)+ if(#{FeUTTNHpVzD.iIC4YhgrxQY}/#{FeUTTNHpVzD.zogrUrI7Crs}>2 && #{FeUTTNHpVzD.iIC4YhgrxQY}/#{FeUTTNHpVzD.zogrUrI7Crs}<=3,1,0)+ if(#{mKSICD1rxG4.iIC4YhgrxQY}/#{mKSICD1rxG4.zogrUrI7Crs}>2 && #{mKSICD1rxG4.iIC4YhgrxQY}/#{mKSICD1rxG4.zogrUrI7Crs}<=3,1,0)+ if(#{mVNe1aS1pGl.iIC4YhgrxQY}/#{mVNe1aS1pGl.zogrUrI7Crs}>2 && #{mVNe1aS1pGl.iIC4YhgrxQY}/#{mVNe1aS1pGl.zogrUrI7Crs}<=3,1,0)+ if(#{oLAXTZY6ken.iIC4YhgrxQY}/#{oLAXTZY6ken.zogrUrI7Crs}>2 && #{oLAXTZY6ken.iIC4YhgrxQY}/#{oLAXTZY6ken.zogrUrI7Crs}<=3,1,0)+ if(#{YYaRDUZyH9L.iIC4YhgrxQY}/#{YYaRDUZyH9L.zogrUrI7Crs}>2 && #{YYaRDUZyH9L.iIC4YhgrxQY}/#{YYaRDUZyH9L.zogrUrI7Crs}<=3,1,0)+ if(#{HVteopBt0jr.iIC4YhgrxQY}/#{HVteopBt0jr.zogrUrI7Crs}>2 && #{HVteopBt0jr.iIC4YhgrxQY}/#{HVteopBt0jr.zogrUrI7Crs}<=3,1,0)+ if(#{sWodd2tbjgZ.iIC4YhgrxQY}/#{sWodd2tbjgZ.zogrUrI7Crs}>2 && #{sWodd2tbjgZ.iIC4YhgrxQY}/#{sWodd2tbjgZ.zogrUrI7Crs}<=3,1,0)+ if(#{yVYajDDYUfX.iIC4YhgrxQY}/#{yVYajDDYUfX.zogrUrI7Crs}>2 && #{yVYajDDYUfX.iIC4YhgrxQY}/#{yVYajDDYUfX.zogrUrI7Crs}<=3,1,0)+ if(#{eTJAr4sc83v.iIC4YhgrxQY}/#{eTJAr4sc83v.zogrUrI7Crs}>2 && #{eTJAr4sc83v.iIC4YhgrxQY}/#{eTJAr4sc83v.zogrUrI7Crs}<=3,1,0)+ if(#{U4KSmanl4JP.iIC4YhgrxQY}/#{U4KSmanl4JP.zogrUrI7Crs}>2 && #{U4KSmanl4JP.iIC4YhgrxQY}/#{U4KSmanl4JP.zogrUrI7Crs}<=3,1,0)+ if(#{FXsa5uG3IGn.iIC4YhgrxQY}/#{FXsa5uG3IGn.zogrUrI7Crs}>2 && #{FXsa5uG3IGn.iIC4YhgrxQY}/#{FXsa5uG3IGn.zogrUrI7Crs}<=3,1,0)+ if(#{L34T9YDtCor.iIC4YhgrxQY}/#{L34T9YDtCor.zogrUrI7Crs}>2 && #{L34T9YDtCor.iIC4YhgrxQY}/#{L34T9YDtCor.zogrUrI7Crs}<=3,1,0)+ if(#{W5mHXhSYFfQ.iIC4YhgrxQY}/#{W5mHXhSYFfQ.zogrUrI7Crs}>2 && #{W5mHXhSYFfQ.iIC4YhgrxQY}/#{W5mHXhSYFfQ.zogrUrI7Crs}<=3,1,0)+ if(#{cmSUyJOZwyl.iIC4YhgrxQY}/#{cmSUyJOZwyl.zogrUrI7Crs}>2 && #{cmSUyJOZwyl.iIC4YhgrxQY}/#{cmSUyJOZwyl.zogrUrI7Crs}<=3,1,0)+ if(#{cT8sfosRXvU.iIC4YhgrxQY}/#{cT8sfosRXvU.zogrUrI7Crs}>2 && #{cT8sfosRXvU.iIC4YhgrxQY}/#{cT8sfosRXvU.zogrUrI7Crs}<=3,1,0)+ if(#{OaWKnMS7say.iIC4YhgrxQY}/#{OaWKnMS7say.zogrUrI7Crs}>2 && #{OaWKnMS7say.iIC4YhgrxQY}/#{OaWKnMS7say.zogrUrI7Crs}<=3,1,0)+ if(#{Z4bjHvGS6aH.iIC4YhgrxQY}/#{Z4bjHvGS6aH.zogrUrI7Crs}>2 && #{Z4bjHvGS6aH.iIC4YhgrxQY}/#{Z4bjHvGS6aH.zogrUrI7Crs}<=3,1,0)+ if(#{Nn1L7CNEtC8.iIC4YhgrxQY}/#{Nn1L7CNEtC8.zogrUrI7Crs}>2 && #{Nn1L7CNEtC8.iIC4YhgrxQY}/#{Nn1L7CNEtC8.zogrUrI7Crs}<=3,1,0)+ if(#{RNYKSc3nAUg.iIC4YhgrxQY}/#{RNYKSc3nAUg.zogrUrI7Crs}>2 && #{RNYKSc3nAUg.iIC4YhgrxQY}/#{RNYKSc3nAUg.zogrUrI7Crs}<=3,1,0)+ if(#{PtmZ9XqpPKi.iIC4YhgrxQY}/#{PtmZ9XqpPKi.zogrUrI7Crs}>2 && #{PtmZ9XqpPKi.iIC4YhgrxQY}/#{PtmZ9XqpPKi.zogrUrI7Crs}<=3,1,0)+ if(#{CohlLHi54B0.iIC4YhgrxQY}/#{CohlLHi54B0.zogrUrI7Crs}>2 && #{CohlLHi54B0.iIC4YhgrxQY}/#{CohlLHi54B0.zogrUrI7Crs}<=3,1,0)+ if(#{Gu6u82RD9OW.iIC4YhgrxQY}/#{Gu6u82RD9OW.zogrUrI7Crs}>2 && #{Gu6u82RD9OW.iIC4YhgrxQY}/#{Gu6u82RD9OW.zogrUrI7Crs}<=3,1,0)+ if(#{LiuYzxYr4Pt.iIC4YhgrxQY}/#{LiuYzxYr4Pt.zogrUrI7Crs}>2 && #{LiuYzxYr4Pt.iIC4YhgrxQY}/#{LiuYzxYr4Pt.zogrUrI7Crs}<=3,1,0)+ if(#{Tje33nJAG55.iIC4YhgrxQY}/#{Tje33nJAG55.zogrUrI7Crs}>2 && #{Tje33nJAG55.iIC4YhgrxQY}/#{Tje33nJAG55.zogrUrI7Crs}<=3,1,0)+ if(#{euM2dlqleYH.iIC4YhgrxQY}/#{euM2dlqleYH.zogrUrI7Crs}>2 && #{euM2dlqleYH.iIC4YhgrxQY}/#{euM2dlqleYH.zogrUrI7Crs}<=3,1,0)+ if(#{dASLmBTEehF.iIC4YhgrxQY}/#{dASLmBTEehF.zogrUrI7Crs}>2 && #{dASLmBTEehF.iIC4YhgrxQY}/#{dASLmBTEehF.zogrUrI7Crs}<=3,1,0)+ if(#{qU2LvzoPn1z.iIC4YhgrxQY}/#{qU2LvzoPn1z.zogrUrI7Crs}>2 && #{qU2LvzoPn1z.iIC4YhgrxQY}/#{qU2LvzoPn1z.zogrUrI7Crs}<=3,1,0)+ if(#{OkWaFxdUQY2.iIC4YhgrxQY}/#{OkWaFxdUQY2.zogrUrI7Crs}>2 && #{OkWaFxdUQY2.iIC4YhgrxQY}/#{OkWaFxdUQY2.zogrUrI7Crs}<=3,1,0)+ if(#{YHIv7KQc2e7.iIC4YhgrxQY}/#{YHIv7KQc2e7.zogrUrI7Crs}>2 && #{YHIv7KQc2e7.iIC4YhgrxQY}/#{YHIv7KQc2e7.zogrUrI7Crs}<=3,1,0)+ if(#{rt9D47Inb49.iIC4YhgrxQY}/#{rt9D47Inb49.zogrUrI7Crs}>2 && #{rt9D47Inb49.iIC4YhgrxQY}/#{rt9D47Inb49.zogrUrI7Crs}<=3,1,0)+ if(#{i1iXbquZ5iv.iIC4YhgrxQY}/#{i1iXbquZ5iv.zogrUrI7Crs}>2 && #{i1iXbquZ5iv.iIC4YhgrxQY}/#{i1iXbquZ5iv.zogrUrI7Crs}<=3,1,0)+ if(#{RcE30WBKrXI.iIC4YhgrxQY}/#{RcE30WBKrXI.zogrUrI7Crs}>2 && #{RcE30WBKrXI.iIC4YhgrxQY}/#{RcE30WBKrXI.zogrUrI7Crs}<=3,1,0)+ if(#{EAG0GfdSMAs.iIC4YhgrxQY}/#{EAG0GfdSMAs.zogrUrI7Crs}>2 && #{EAG0GfdSMAs.iIC4YhgrxQY}/#{EAG0GfdSMAs.zogrUrI7Crs}<=3,1,0)+ if(#{N2aXs7VlJdJ.iIC4YhgrxQY}/#{N2aXs7VlJdJ.zogrUrI7Crs}>2 && #{N2aXs7VlJdJ.iIC4YhgrxQY}/#{N2aXs7VlJdJ.zogrUrI7Crs}<=3,1,0)+ if(#{xrjnOtFFTRC.iIC4YhgrxQY}/#{xrjnOtFFTRC.zogrUrI7Crs}>2 && #{xrjnOtFFTRC.iIC4YhgrxQY}/#{xrjnOtFFTRC.zogrUrI7Crs}<=3,1,0)Edit denominator:
Description: "2-3 months - MSR - Denominator"
Calculation: "1"7 2-3 years - MSR
For each item the Indicator returns "1" if the stock coverage time is greater than or equal to 24 but less than 36 and otherwise returns 0 and then adds up these results for calculating the number of items with a stock coverage time of 24-36 months.Name (*): "2-3 years - MSR"
Short Name (*): "2-3 years - MSR"
Description: "Number of items with a coverage time of 2-3 years"
Decimals in data output: "0"
Indicator type (*): "Number (Factor 1)"
Edit numerator:Description: "2-3 years - MSR - Numerator"
Calculation:
if(#{LNAkkMTxqEW.iIC4YhgrxQY}/#{LNAkkMTxqEW.zogrUrI7Crs}>24 && #{LNAkkMTxqEW.iIC4YhgrxQY}/#{LNAkkMTxqEW.zogrUrI7Crs}<=36,1,0)+ if(#{WyDZKSw82X6.iIC4YhgrxQY}/#{WyDZKSw82X6.zogrUrI7Crs}>24 && #{WyDZKSw82X6.iIC4YhgrxQY}/#{WyDZKSw82X6.zogrUrI7Crs}<=36,1,0)+ if(#{JPccVwAGRq9.iIC4YhgrxQY}/#{JPccVwAGRq9.zogrUrI7Crs}>24 && #{JPccVwAGRq9.iIC4YhgrxQY}/#{JPccVwAGRq9.zogrUrI7Crs}<=36,1,0)+ if(#{smxJz7Mt6ia.iIC4YhgrxQY}/#{smxJz7Mt6ia.zogrUrI7Crs}>24 && #{smxJz7Mt6ia.iIC4YhgrxQY}/#{smxJz7Mt6ia.zogrUrI7Crs}<=36,1,0)+ if(#{AaIApgGQM6t.iIC4YhgrxQY}/#{AaIApgGQM6t.zogrUrI7Crs}>24 && #{AaIApgGQM6t.iIC4YhgrxQY}/#{AaIApgGQM6t.zogrUrI7Crs}<=36,1,0)+ if(#{vCTrmv52APd.iIC4YhgrxQY}/#{vCTrmv52APd.zogrUrI7Crs}>24 && #{vCTrmv52APd.iIC4YhgrxQY}/#{vCTrmv52APd.zogrUrI7Crs}<=36,1,0)+ if(#{SOw2TcuFFH2.iIC4YhgrxQY}/#{SOw2TcuFFH2.zogrUrI7Crs}>24 && #{SOw2TcuFFH2.iIC4YhgrxQY}/#{SOw2TcuFFH2.zogrUrI7Crs}<=36,1,0)+ if(#{RSIOx2u07Ln.iIC4YhgrxQY}/#{RSIOx2u07Ln.zogrUrI7Crs}>24 && #{RSIOx2u07Ln.iIC4YhgrxQY}/#{RSIOx2u07Ln.zogrUrI7Crs}<=36,1,0)+ if(#{JStiDyaPfqy.iIC4YhgrxQY}/#{JStiDyaPfqy.zogrUrI7Crs}>24 && #{JStiDyaPfqy.iIC4YhgrxQY}/#{JStiDyaPfqy.zogrUrI7Crs}<=36,1,0)+ if(#{hZ1YvdcTDQM.iIC4YhgrxQY}/#{hZ1YvdcTDQM.zogrUrI7Crs}>24 && #{hZ1YvdcTDQM.iIC4YhgrxQY}/#{hZ1YvdcTDQM.zogrUrI7Crs}<=36,1,0)+ if(#{tsi32D8HQd5.iIC4YhgrxQY}/#{tsi32D8HQd5.zogrUrI7Crs}>24 && #{tsi32D8HQd5.iIC4YhgrxQY}/#{tsi32D8HQd5.zogrUrI7Crs}<=36,1,0)+ if(#{QWlPF8S0gCc.iIC4YhgrxQY}/#{QWlPF8S0gCc.zogrUrI7Crs}>24 && #{QWlPF8S0gCc.iIC4YhgrxQY}/#{QWlPF8S0gCc.zogrUrI7Crs}<=36,1,0)+ if(#{a5uLTDt12eT.iIC4YhgrxQY}/#{a5uLTDt12eT.zogrUrI7Crs}>24 && #{a5uLTDt12eT.iIC4YhgrxQY}/#{a5uLTDt12eT.zogrUrI7Crs}<=36,1,0)+ if(#{U0AfOOyJMy2.iIC4YhgrxQY}/#{U0AfOOyJMy2.zogrUrI7Crs}>24 && #{U0AfOOyJMy2.iIC4YhgrxQY}/#{U0AfOOyJMy2.zogrUrI7Crs}<=36,1,0)+ if(#{cyf6UdScfFM.iIC4YhgrxQY}/#{cyf6UdScfFM.zogrUrI7Crs}>24 && #{cyf6UdScfFM.iIC4YhgrxQY}/#{cyf6UdScfFM.zogrUrI7Crs}<=36,1,0)+ if(#{FeUTTNHpVzD.iIC4YhgrxQY}/#{FeUTTNHpVzD.zogrUrI7Crs}>24 && #{FeUTTNHpVzD.iIC4YhgrxQY}/#{FeUTTNHpVzD.zogrUrI7Crs}<=36,1,0)+ if(#{mKSICD1rxG4.iIC4YhgrxQY}/#{mKSICD1rxG4.zogrUrI7Crs}>24 && #{mKSICD1rxG4.iIC4YhgrxQY}/#{mKSICD1rxG4.zogrUrI7Crs}<=36,1,0)+ if(#{mVNe1aS1pGl.iIC4YhgrxQY}/#{mVNe1aS1pGl.zogrUrI7Crs}>24 && #{mVNe1aS1pGl.iIC4YhgrxQY}/#{mVNe1aS1pGl.zogrUrI7Crs}<=36,1,0)+ if(#{oLAXTZY6ken.iIC4YhgrxQY}/#{oLAXTZY6ken.zogrUrI7Crs}>24 && #{oLAXTZY6ken.iIC4YhgrxQY}/#{oLAXTZY6ken.zogrUrI7Crs}<=36,1,0)+ if(#{YYaRDUZyH9L.iIC4YhgrxQY}/#{YYaRDUZyH9L.zogrUrI7Crs}>24 && #{YYaRDUZyH9L.iIC4YhgrxQY}/#{YYaRDUZyH9L.zogrUrI7Crs}<=36,1,0)+ if(#{HVteopBt0jr.iIC4YhgrxQY}/#{HVteopBt0jr.zogrUrI7Crs}>24 && #{HVteopBt0jr.iIC4YhgrxQY}/#{HVteopBt0jr.zogrUrI7Crs}<=36,1,0)+ if(#{sWodd2tbjgZ.iIC4YhgrxQY}/#{sWodd2tbjgZ.zogrUrI7Crs}>24 && #{sWodd2tbjgZ.iIC4YhgrxQY}/#{sWodd2tbjgZ.zogrUrI7Crs}<=36,1,0)+ if(#{yVYajDDYUfX.iIC4YhgrxQY}/#{yVYajDDYUfX.zogrUrI7Crs}>24 && #{yVYajDDYUfX.iIC4YhgrxQY}/#{yVYajDDYUfX.zogrUrI7Crs}<=36,1,0)+ if(#{eTJAr4sc83v.iIC4YhgrxQY}/#{eTJAr4sc83v.zogrUrI7Crs}>24 && #{eTJAr4sc83v.iIC4YhgrxQY}/#{eTJAr4sc83v.zogrUrI7Crs}<=36,1,0)+ if(#{U4KSmanl4JP.iIC4YhgrxQY}/#{U4KSmanl4JP.zogrUrI7Crs}>24 && #{U4KSmanl4JP.iIC4YhgrxQY}/#{U4KSmanl4JP.zogrUrI7Crs}<=36,1,0)+ if(#{FXsa5uG3IGn.iIC4YhgrxQY}/#{FXsa5uG3IGn.zogrUrI7Crs}>24 && #{FXsa5uG3IGn.iIC4YhgrxQY}/#{FXsa5uG3IGn.zogrUrI7Crs}<=36,1,0)+ if(#{L34T9YDtCor.iIC4YhgrxQY}/#{L34T9YDtCor.zogrUrI7Crs}>24 && #{L34T9YDtCor.iIC4YhgrxQY}/#{L34T9YDtCor.zogrUrI7Crs}<=36,1,0)+ if(#{W5mHXhSYFfQ.iIC4YhgrxQY}/#{W5mHXhSYFfQ.zogrUrI7Crs}>24 && #{W5mHXhSYFfQ.iIC4YhgrxQY}/#{W5mHXhSYFfQ.zogrUrI7Crs}<=36,1,0)+ if(#{cmSUyJOZwyl.iIC4YhgrxQY}/#{cmSUyJOZwyl.zogrUrI7Crs}>24 && #{cmSUyJOZwyl.iIC4YhgrxQY}/#{cmSUyJOZwyl.zogrUrI7Crs}<=36,1,0)+ if(#{cT8sfosRXvU.iIC4YhgrxQY}/#{cT8sfosRXvU.zogrUrI7Crs}>24 && #{cT8sfosRXvU.iIC4YhgrxQY}/#{cT8sfosRXvU.zogrUrI7Crs}<=36,1,0)+ if(#{OaWKnMS7say.iIC4YhgrxQY}/#{OaWKnMS7say.zogrUrI7Crs}>24 && #{OaWKnMS7say.iIC4YhgrxQY}/#{OaWKnMS7say.zogrUrI7Crs}<=36,1,0)+ if(#{Z4bjHvGS6aH.iIC4YhgrxQY}/#{Z4bjHvGS6aH.zogrUrI7Crs}>24 && #{Z4bjHvGS6aH.iIC4YhgrxQY}/#{Z4bjHvGS6aH.zogrUrI7Crs}<=36,1,0)+ if(#{Nn1L7CNEtC8.iIC4YhgrxQY}/#{Nn1L7CNEtC8.zogrUrI7Crs}>24 && #{Nn1L7CNEtC8.iIC4YhgrxQY}/#{Nn1L7CNEtC8.zogrUrI7Crs}<=36,1,0)+ if(#{RNYKSc3nAUg.iIC4YhgrxQY}/#{RNYKSc3nAUg.zogrUrI7Crs}>24 && #{RNYKSc3nAUg.iIC4YhgrxQY}/#{RNYKSc3nAUg.zogrUrI7Crs}<=36,1,0)+ if(#{PtmZ9XqpPKi.iIC4YhgrxQY}/#{PtmZ9XqpPKi.zogrUrI7Crs}>24 && #{PtmZ9XqpPKi.iIC4YhgrxQY}/#{PtmZ9XqpPKi.zogrUrI7Crs}<=36,1,0)+ if(#{CohlLHi54B0.iIC4YhgrxQY}/#{CohlLHi54B0.zogrUrI7Crs}>24 && #{CohlLHi54B0.iIC4YhgrxQY}/#{CohlLHi54B0.zogrUrI7Crs}<=36,1,0)+ if(#{Gu6u82RD9OW.iIC4YhgrxQY}/#{Gu6u82RD9OW.zogrUrI7Crs}>24 && #{Gu6u82RD9OW.iIC4YhgrxQY}/#{Gu6u82RD9OW.zogrUrI7Crs}<=36,1,0)+ if(#{LiuYzxYr4Pt.iIC4YhgrxQY}/#{LiuYzxYr4Pt.zogrUrI7Crs}>24 && #{LiuYzxYr4Pt.iIC4YhgrxQY}/#{LiuYzxYr4Pt.zogrUrI7Crs}<=36,1,0)+ if(#{Tje33nJAG55.iIC4YhgrxQY}/#{Tje33nJAG55.zogrUrI7Crs}>24 && #{Tje33nJAG55.iIC4YhgrxQY}/#{Tje33nJAG55.zogrUrI7Crs}<=36,1,0)+ if(#{euM2dlqleYH.iIC4YhgrxQY}/#{euM2dlqleYH.zogrUrI7Crs}>24 && #{euM2dlqleYH.iIC4YhgrxQY}/#{euM2dlqleYH.zogrUrI7Crs}<=36,1,0)+ if(#{dASLmBTEehF.iIC4YhgrxQY}/#{dASLmBTEehF.zogrUrI7Crs}>24 && #{dASLmBTEehF.iIC4YhgrxQY}/#{dASLmBTEehF.zogrUrI7Crs}<=36,1,0)+ if(#{qU2LvzoPn1z.iIC4YhgrxQY}/#{qU2LvzoPn1z.zogrUrI7Crs}>24 && #{qU2LvzoPn1z.iIC4YhgrxQY}/#{qU2LvzoPn1z.zogrUrI7Crs}<=36,1,0)+ if(#{OkWaFxdUQY2.iIC4YhgrxQY}/#{OkWaFxdUQY2.zogrUrI7Crs}>24 && #{OkWaFxdUQY2.iIC4YhgrxQY}/#{OkWaFxdUQY2.zogrUrI7Crs}<=36,1,0)+ if(#{YHIv7KQc2e7.iIC4YhgrxQY}/#{YHIv7KQc2e7.zogrUrI7Crs}>24 && #{YHIv7KQc2e7.iIC4YhgrxQY}/#{YHIv7KQc2e7.zogrUrI7Crs}<=36,1,0)+ if(#{rt9D47Inb49.iIC4YhgrxQY}/#{rt9D47Inb49.zogrUrI7Crs}>24 && #{rt9D47Inb49.iIC4YhgrxQY}/#{rt9D47Inb49.zogrUrI7Crs}<=36,1,0)+ if(#{i1iXbquZ5iv.iIC4YhgrxQY}/#{i1iXbquZ5iv.zogrUrI7Crs}>24 && #{i1iXbquZ5iv.iIC4YhgrxQY}/#{i1iXbquZ5iv.zogrUrI7Crs}<=36,1,0)+ if(#{RcE30WBKrXI.iIC4YhgrxQY}/#{RcE30WBKrXI.zogrUrI7Crs}>24 && #{RcE30WBKrXI.iIC4YhgrxQY}/#{RcE30WBKrXI.zogrUrI7Crs}<=36,1,0)+ if(#{EAG0GfdSMAs.iIC4YhgrxQY}/#{EAG0GfdSMAs.zogrUrI7Crs}>24 && #{EAG0GfdSMAs.iIC4YhgrxQY}/#{EAG0GfdSMAs.zogrUrI7Crs}<=36,1,0)+ if(#{N2aXs7VlJdJ.iIC4YhgrxQY}/#{N2aXs7VlJdJ.zogrUrI7Crs}>24 && #{N2aXs7VlJdJ.iIC4YhgrxQY}/#{N2aXs7VlJdJ.zogrUrI7Crs}<=36,1,0)+ if(#{xrjnOtFFTRC.iIC4YhgrxQY}/#{xrjnOtFFTRC.zogrUrI7Crs}>24 && #{xrjnOtFFTRC.iIC4YhgrxQY}/#{xrjnOtFFTRC.zogrUrI7Crs}<=36,1,0)Edit denominator:
Description: "2-3 years - MSR - Denominator"
Calculation: "1"8 3-4 months - MSR
For each item the Indicator returns "1" if the stock coverage time is greater than or equal to 3 but less than 4 and otherwise returns 0and then adds up these results for calculating the number of items with a stock coverage time of 3-4 months.Name (*): "3-4 months - MSR"
Short Name (*): "3-4 months - MSR"
Description: "Number of items with a coverage time of 3-4 months"
Decimals in data output: "0"
Indicator type (*): "Number (Factor 1)"
Edit numerator:Description: "3-4 months - MSR - Numerator"
Calculation:
if(#{LNAkkMTxqEW.iIC4YhgrxQY}/#{LNAkkMTxqEW.zogrUrI7Crs}>3 && #{LNAkkMTxqEW.iIC4YhgrxQY}/#{LNAkkMTxqEW.zogrUrI7Crs}<=4,1,0)+ if(#{WyDZKSw82X6.iIC4YhgrxQY}/#{WyDZKSw82X6.zogrUrI7Crs}>3 && #{WyDZKSw82X6.iIC4YhgrxQY}/#{WyDZKSw82X6.zogrUrI7Crs}<=4,1,0)+ if(#{JPccVwAGRq9.iIC4YhgrxQY}/#{JPccVwAGRq9.zogrUrI7Crs}>3 && #{JPccVwAGRq9.iIC4YhgrxQY}/#{JPccVwAGRq9.zogrUrI7Crs}<=4,1,0)+ if(#{smxJz7Mt6ia.iIC4YhgrxQY}/#{smxJz7Mt6ia.zogrUrI7Crs}>3 && #{smxJz7Mt6ia.iIC4YhgrxQY}/#{smxJz7Mt6ia.zogrUrI7Crs}<=4,1,0)+ if(#{AaIApgGQM6t.iIC4YhgrxQY}/#{AaIApgGQM6t.zogrUrI7Crs}>3 && #{AaIApgGQM6t.iIC4YhgrxQY}/#{AaIApgGQM6t.zogrUrI7Crs}<=4,1,0)+ if(#{vCTrmv52APd.iIC4YhgrxQY}/#{vCTrmv52APd.zogrUrI7Crs}>3 && #{vCTrmv52APd.iIC4YhgrxQY}/#{vCTrmv52APd.zogrUrI7Crs}<=4,1,0)+ if(#{SOw2TcuFFH2.iIC4YhgrxQY}/#{SOw2TcuFFH2.zogrUrI7Crs}>3 && #{SOw2TcuFFH2.iIC4YhgrxQY}/#{SOw2TcuFFH2.zogrUrI7Crs}<=4,1,0)+ if(#{RSIOx2u07Ln.iIC4YhgrxQY}/#{RSIOx2u07Ln.zogrUrI7Crs}>3 && #{RSIOx2u07Ln.iIC4YhgrxQY}/#{RSIOx2u07Ln.zogrUrI7Crs}<=4,1,0)+ if(#{JStiDyaPfqy.iIC4YhgrxQY}/#{JStiDyaPfqy.zogrUrI7Crs}>3 && #{JStiDyaPfqy.iIC4YhgrxQY}/#{JStiDyaPfqy.zogrUrI7Crs}<=4,1,0)+ if(#{hZ1YvdcTDQM.iIC4YhgrxQY}/#{hZ1YvdcTDQM.zogrUrI7Crs}>3 && #{hZ1YvdcTDQM.iIC4YhgrxQY}/#{hZ1YvdcTDQM.zogrUrI7Crs}<=4,1,0)+ if(#{tsi32D8HQd5.iIC4YhgrxQY}/#{tsi32D8HQd5.zogrUrI7Crs}>3 && #{tsi32D8HQd5.iIC4YhgrxQY}/#{tsi32D8HQd5.zogrUrI7Crs}<=4,1,0)+ if(#{QWlPF8S0gCc.iIC4YhgrxQY}/#{QWlPF8S0gCc.zogrUrI7Crs}>3 && #{QWlPF8S0gCc.iIC4YhgrxQY}/#{QWlPF8S0gCc.zogrUrI7Crs}<=4,1,0)+ if(#{a5uLTDt12eT.iIC4YhgrxQY}/#{a5uLTDt12eT.zogrUrI7Crs}>3 && #{a5uLTDt12eT.iIC4YhgrxQY}/#{a5uLTDt12eT.zogrUrI7Crs}<=4,1,0)+ if(#{U0AfOOyJMy2.iIC4YhgrxQY}/#{U0AfOOyJMy2.zogrUrI7Crs}>3 && #{U0AfOOyJMy2.iIC4YhgrxQY}/#{U0AfOOyJMy2.zogrUrI7Crs}<=4,1,0)+ if(#{cyf6UdScfFM.iIC4YhgrxQY}/#{cyf6UdScfFM.zogrUrI7Crs}>3 && #{cyf6UdScfFM.iIC4YhgrxQY}/#{cyf6UdScfFM.zogrUrI7Crs}<=4,1,0)+ if(#{FeUTTNHpVzD.iIC4YhgrxQY}/#{FeUTTNHpVzD.zogrUrI7Crs}>3 && #{FeUTTNHpVzD.iIC4YhgrxQY}/#{FeUTTNHpVzD.zogrUrI7Crs}<=4,1,0)+ if(#{mKSICD1rxG4.iIC4YhgrxQY}/#{mKSICD1rxG4.zogrUrI7Crs}>3 && #{mKSICD1rxG4.iIC4YhgrxQY}/#{mKSICD1rxG4.zogrUrI7Crs}<=4,1,0)+ if(#{mVNe1aS1pGl.iIC4YhgrxQY}/#{mVNe1aS1pGl.zogrUrI7Crs}>3 && #{mVNe1aS1pGl.iIC4YhgrxQY}/#{mVNe1aS1pGl.zogrUrI7Crs}<=4,1,0)+ if(#{oLAXTZY6ken.iIC4YhgrxQY}/#{oLAXTZY6ken.zogrUrI7Crs}>3 && #{oLAXTZY6ken.iIC4YhgrxQY}/#{oLAXTZY6ken.zogrUrI7Crs}<=4,1,0)+ if(#{YYaRDUZyH9L.iIC4YhgrxQY}/#{YYaRDUZyH9L.zogrUrI7Crs}>3 && #{YYaRDUZyH9L.iIC4YhgrxQY}/#{YYaRDUZyH9L.zogrUrI7Crs}<=4,1,0)+ if(#{HVteopBt0jr.iIC4YhgrxQY}/#{HVteopBt0jr.zogrUrI7Crs}>3 && #{HVteopBt0jr.iIC4YhgrxQY}/#{HVteopBt0jr.zogrUrI7Crs}<=4,1,0)+ if(#{sWodd2tbjgZ.iIC4YhgrxQY}/#{sWodd2tbjgZ.zogrUrI7Crs}>3 && #{sWodd2tbjgZ.iIC4YhgrxQY}/#{sWodd2tbjgZ.zogrUrI7Crs}<=4,1,0)+ if(#{yVYajDDYUfX.iIC4YhgrxQY}/#{yVYajDDYUfX.zogrUrI7Crs}>3 && #{yVYajDDYUfX.iIC4YhgrxQY}/#{yVYajDDYUfX.zogrUrI7Crs}<=4,1,0)+ if(#{eTJAr4sc83v.iIC4YhgrxQY}/#{eTJAr4sc83v.zogrUrI7Crs}>3 && #{eTJAr4sc83v.iIC4YhgrxQY}/#{eTJAr4sc83v.zogrUrI7Crs}<=4,1,0)+ if(#{U4KSmanl4JP.iIC4YhgrxQY}/#{U4KSmanl4JP.zogrUrI7Crs}>3 && #{U4KSmanl4JP.iIC4YhgrxQY}/#{U4KSmanl4JP.zogrUrI7Crs}<=4,1,0)+ if(#{FXsa5uG3IGn.iIC4YhgrxQY}/#{FXsa5uG3IGn.zogrUrI7Crs}>3 && #{FXsa5uG3IGn.iIC4YhgrxQY}/#{FXsa5uG3IGn.zogrUrI7Crs}<=4,1,0)+ if(#{L34T9YDtCor.iIC4YhgrxQY}/#{L34T9YDtCor.zogrUrI7Crs}>3 && #{L34T9YDtCor.iIC4YhgrxQY}/#{L34T9YDtCor.zogrUrI7Crs}<=4,1,0)+ if(#{W5mHXhSYFfQ.iIC4YhgrxQY}/#{W5mHXhSYFfQ.zogrUrI7Crs}>3 && #{W5mHXhSYFfQ.iIC4YhgrxQY}/#{W5mHXhSYFfQ.zogrUrI7Crs}<=4,1,0)+ if(#{cmSUyJOZwyl.iIC4YhgrxQY}/#{cmSUyJOZwyl.zogrUrI7Crs}>3 && #{cmSUyJOZwyl.iIC4YhgrxQY}/#{cmSUyJOZwyl.zogrUrI7Crs}<=4,1,0)+ if(#{cT8sfosRXvU.iIC4YhgrxQY}/#{cT8sfosRXvU.zogrUrI7Crs}>3 && #{cT8sfosRXvU.iIC4YhgrxQY}/#{cT8sfosRXvU.zogrUrI7Crs}<=4,1,0)+ if(#{OaWKnMS7say.iIC4YhgrxQY}/#{OaWKnMS7say.zogrUrI7Crs}>3 && #{OaWKnMS7say.iIC4YhgrxQY}/#{OaWKnMS7say.zogrUrI7Crs}<=4,1,0)+ if(#{Z4bjHvGS6aH.iIC4YhgrxQY}/#{Z4bjHvGS6aH.zogrUrI7Crs}>3 && #{Z4bjHvGS6aH.iIC4YhgrxQY}/#{Z4bjHvGS6aH.zogrUrI7Crs}<=4,1,0)+ if(#{Nn1L7CNEtC8.iIC4YhgrxQY}/#{Nn1L7CNEtC8.zogrUrI7Crs}>3 && #{Nn1L7CNEtC8.iIC4YhgrxQY}/#{Nn1L7CNEtC8.zogrUrI7Crs}<=4,1,0)+ if(#{RNYKSc3nAUg.iIC4YhgrxQY}/#{RNYKSc3nAUg.zogrUrI7Crs}>3 && #{RNYKSc3nAUg.iIC4YhgrxQY}/#{RNYKSc3nAUg.zogrUrI7Crs}<=4,1,0)+ if(#{PtmZ9XqpPKi.iIC4YhgrxQY}/#{PtmZ9XqpPKi.zogrUrI7Crs}>3 && #{PtmZ9XqpPKi.iIC4YhgrxQY}/#{PtmZ9XqpPKi.zogrUrI7Crs}<=4,1,0)+ if(#{CohlLHi54B0.iIC4YhgrxQY}/#{CohlLHi54B0.zogrUrI7Crs}>3 && #{CohlLHi54B0.iIC4YhgrxQY}/#{CohlLHi54B0.zogrUrI7Crs}<=4,1,0)+ if(#{Gu6u82RD9OW.iIC4YhgrxQY}/#{Gu6u82RD9OW.zogrUrI7Crs}>3 && #{Gu6u82RD9OW.iIC4YhgrxQY}/#{Gu6u82RD9OW.zogrUrI7Crs}<=4,1,0)+ if(#{LiuYzxYr4Pt.iIC4YhgrxQY}/#{LiuYzxYr4Pt.zogrUrI7Crs}>3 && #{LiuYzxYr4Pt.iIC4YhgrxQY}/#{LiuYzxYr4Pt.zogrUrI7Crs}<=4,1,0)+ if(#{Tje33nJAG55.iIC4YhgrxQY}/#{Tje33nJAG55.zogrUrI7Crs}>3 && #{Tje33nJAG55.iIC4YhgrxQY}/#{Tje33nJAG55.zogrUrI7Crs}<=4,1,0)+ if(#{euM2dlqleYH.iIC4YhgrxQY}/#{euM2dlqleYH.zogrUrI7Crs}>3 && #{euM2dlqleYH.iIC4YhgrxQY}/#{euM2dlqleYH.zogrUrI7Crs}<=4,1,0)+ if(#{dASLmBTEehF.iIC4YhgrxQY}/#{dASLmBTEehF.zogrUrI7Crs}>3 && #{dASLmBTEehF.iIC4YhgrxQY}/#{dASLmBTEehF.zogrUrI7Crs}<=4,1,0)+ if(#{qU2LvzoPn1z.iIC4YhgrxQY}/#{qU2LvzoPn1z.zogrUrI7Crs}>3 && #{qU2LvzoPn1z.iIC4YhgrxQY}/#{qU2LvzoPn1z.zogrUrI7Crs}<=4,1,0)+ if(#{OkWaFxdUQY2.iIC4YhgrxQY}/#{OkWaFxdUQY2.zogrUrI7Crs}>3 && #{OkWaFxdUQY2.iIC4YhgrxQY}/#{OkWaFxdUQY2.zogrUrI7Crs}<=4,1,0)+ if(#{YHIv7KQc2e7.iIC4YhgrxQY}/#{YHIv7KQc2e7.zogrUrI7Crs}>3 && #{YHIv7KQc2e7.iIC4YhgrxQY}/#{YHIv7KQc2e7.zogrUrI7Crs}<=4,1,0)+ if(#{rt9D47Inb49.iIC4YhgrxQY}/#{rt9D47Inb49.zogrUrI7Crs}>3 && #{rt9D47Inb49.iIC4YhgrxQY}/#{rt9D47Inb49.zogrUrI7Crs}<=4,1,0)+ if(#{i1iXbquZ5iv.iIC4YhgrxQY}/#{i1iXbquZ5iv.zogrUrI7Crs}>3 && #{i1iXbquZ5iv.iIC4YhgrxQY}/#{i1iXbquZ5iv.zogrUrI7Crs}<=4,1,0)+ if(#{RcE30WBKrXI.iIC4YhgrxQY}/#{RcE30WBKrXI.zogrUrI7Crs}>3 && #{RcE30WBKrXI.iIC4YhgrxQY}/#{RcE30WBKrXI.zogrUrI7Crs}<=4,1,0)+ if(#{EAG0GfdSMAs.iIC4YhgrxQY}/#{EAG0GfdSMAs.zogrUrI7Crs}>3 && #{EAG0GfdSMAs.iIC4YhgrxQY}/#{EAG0GfdSMAs.zogrUrI7Crs}<=4,1,0)+ if(#{N2aXs7VlJdJ.iIC4YhgrxQY}/#{N2aXs7VlJdJ.zogrUrI7Crs}>3 && #{N2aXs7VlJdJ.iIC4YhgrxQY}/#{N2aXs7VlJdJ.zogrUrI7Crs}<=4,1,0)+ if(#{xrjnOtFFTRC.iIC4YhgrxQY}/#{xrjnOtFFTRC.zogrUrI7Crs}>3 && #{xrjnOtFFTRC.iIC4YhgrxQY}/#{xrjnOtFFTRC.zogrUrI7Crs}<=4,1,0)>>Edit denominator:
Description: "3-4 months - MSR - Denominator"
Calculation: "1"9 4-5 months - MSR
For each item the Indicator returns "1" if the stock coverage time is greater than or equal to 4 but less than 5 and otherwise returns 0and then adds up these results for calculating the number of items with a stock coverage time greater of 4-5 months.Name (*): "4-5 months - MSR"
Short Name (*): "4-5 months - MSR"
Description: "Number of items with a coverage time of 4-5 months"
Decimals in data output: "0"
Indicator type (*): "Number (Factor 1)"
Edit numerator:Description: "4-5 months - MSR - Numerator"
Calculation:
if(#{LNAkkMTxqEW.iIC4YhgrxQY}/#{LNAkkMTxqEW.zogrUrI7Crs}>4 && #{LNAkkMTxqEW.iIC4YhgrxQY}/#{LNAkkMTxqEW.zogrUrI7Crs}<=5,1,0)+ if(#{WyDZKSw82X6.iIC4YhgrxQY}/#{WyDZKSw82X6.zogrUrI7Crs}>4 && #{WyDZKSw82X6.iIC4YhgrxQY}/#{WyDZKSw82X6.zogrUrI7Crs}<=5,1,0)+ if(#{JPccVwAGRq9.iIC4YhgrxQY}/#{JPccVwAGRq9.zogrUrI7Crs}>4 && #{JPccVwAGRq9.iIC4YhgrxQY}/#{JPccVwAGRq9.zogrUrI7Crs}<=5,1,0)+ if(#{smxJz7Mt6ia.iIC4YhgrxQY}/#{smxJz7Mt6ia.zogrUrI7Crs}>4 && #{smxJz7Mt6ia.iIC4YhgrxQY}/#{smxJz7Mt6ia.zogrUrI7Crs}<=5,1,0)+ if(#{AaIApgGQM6t.iIC4YhgrxQY}/#{AaIApgGQM6t.zogrUrI7Crs}>4 && #{AaIApgGQM6t.iIC4YhgrxQY}/#{AaIApgGQM6t.zogrUrI7Crs}<=5,1,0)+ if(#{vCTrmv52APd.iIC4YhgrxQY}/#{vCTrmv52APd.zogrUrI7Crs}>4 && #{vCTrmv52APd.iIC4YhgrxQY}/#{vCTrmv52APd.zogrUrI7Crs}<=5,1,0)+ if(#{SOw2TcuFFH2.iIC4YhgrxQY}/#{SOw2TcuFFH2.zogrUrI7Crs}>4 && #{SOw2TcuFFH2.iIC4YhgrxQY}/#{SOw2TcuFFH2.zogrUrI7Crs}<=5,1,0)+ if(#{RSIOx2u07Ln.iIC4YhgrxQY}/#{RSIOx2u07Ln.zogrUrI7Crs}>4 && #{RSIOx2u07Ln.iIC4YhgrxQY}/#{RSIOx2u07Ln.zogrUrI7Crs}<=5,1,0)+ if(#{JStiDyaPfqy.iIC4YhgrxQY}/#{JStiDyaPfqy.zogrUrI7Crs}>4 && #{JStiDyaPfqy.iIC4YhgrxQY}/#{JStiDyaPfqy.zogrUrI7Crs}<=5,1,0)+ if(#{hZ1YvdcTDQM.iIC4YhgrxQY}/#{hZ1YvdcTDQM.zogrUrI7Crs}>4 && #{hZ1YvdcTDQM.iIC4YhgrxQY}/#{hZ1YvdcTDQM.zogrUrI7Crs}<=5,1,0)+ if(#{tsi32D8HQd5.iIC4YhgrxQY}/#{tsi32D8HQd5.zogrUrI7Crs}>4 && #{tsi32D8HQd5.iIC4YhgrxQY}/#{tsi32D8HQd5.zogrUrI7Crs}<=5,1,0)+ if(#{QWlPF8S0gCc.iIC4YhgrxQY}/#{QWlPF8S0gCc.zogrUrI7Crs}>4 && #{QWlPF8S0gCc.iIC4YhgrxQY}/#{QWlPF8S0gCc.zogrUrI7Crs}<=5,1,0)+ if(#{a5uLTDt12eT.iIC4YhgrxQY}/#{a5uLTDt12eT.zogrUrI7Crs}>4 && #{a5uLTDt12eT.iIC4YhgrxQY}/#{a5uLTDt12eT.zogrUrI7Crs}<=5,1,0)+ if(#{U0AfOOyJMy2.iIC4YhgrxQY}/#{U0AfOOyJMy2.zogrUrI7Crs}>4 && #{U0AfOOyJMy2.iIC4YhgrxQY}/#{U0AfOOyJMy2.zogrUrI7Crs}<=5,1,0)+ if(#{cyf6UdScfFM.iIC4YhgrxQY}/#{cyf6UdScfFM.zogrUrI7Crs}>4 && #{cyf6UdScfFM.iIC4YhgrxQY}/#{cyf6UdScfFM.zogrUrI7Crs}<=5,1,0)+ if(#{FeUTTNHpVzD.iIC4YhgrxQY}/#{FeUTTNHpVzD.zogrUrI7Crs}>4 && #{FeUTTNHpVzD.iIC4YhgrxQY}/#{FeUTTNHpVzD.zogrUrI7Crs}<=5,1,0)+ if(#{mKSICD1rxG4.iIC4YhgrxQY}/#{mKSICD1rxG4.zogrUrI7Crs}>4 && #{mKSICD1rxG4.iIC4YhgrxQY}/#{mKSICD1rxG4.zogrUrI7Crs}<=5,1,0)+ if(#{mVNe1aS1pGl.iIC4YhgrxQY}/#{mVNe1aS1pGl.zogrUrI7Crs}>4 && #{mVNe1aS1pGl.iIC4YhgrxQY}/#{mVNe1aS1pGl.zogrUrI7Crs}<=5,1,0)+ if(#{oLAXTZY6ken.iIC4YhgrxQY}/#{oLAXTZY6ken.zogrUrI7Crs}>4 && #{oLAXTZY6ken.iIC4YhgrxQY}/#{oLAXTZY6ken.zogrUrI7Crs}<=5,1,0)+ if(#{YYaRDUZyH9L.iIC4YhgrxQY}/#{YYaRDUZyH9L.zogrUrI7Crs}>4 && #{YYaRDUZyH9L.iIC4YhgrxQY}/#{YYaRDUZyH9L.zogrUrI7Crs}<=5,1,0)+ if(#{HVteopBt0jr.iIC4YhgrxQY}/#{HVteopBt0jr.zogrUrI7Crs}>4 && #{HVteopBt0jr.iIC4YhgrxQY}/#{HVteopBt0jr.zogrUrI7Crs}<=5,1,0)+ if(#{sWodd2tbjgZ.iIC4YhgrxQY}/#{sWodd2tbjgZ.zogrUrI7Crs}>4 && #{sWodd2tbjgZ.iIC4YhgrxQY}/#{sWodd2tbjgZ.zogrUrI7Crs}<=5,1,0)+ if(#{yVYajDDYUfX.iIC4YhgrxQY}/#{yVYajDDYUfX.zogrUrI7Crs}>4 && #{yVYajDDYUfX.iIC4YhgrxQY}/#{yVYajDDYUfX.zogrUrI7Crs}<=5,1,0)+ if(#{eTJAr4sc83v.iIC4YhgrxQY}/#{eTJAr4sc83v.zogrUrI7Crs}>4 && #{eTJAr4sc83v.iIC4YhgrxQY}/#{eTJAr4sc83v.zogrUrI7Crs}<=5,1,0)+ if(#{U4KSmanl4JP.iIC4YhgrxQY}/#{U4KSmanl4JP.zogrUrI7Crs}>4 && #{U4KSmanl4JP.iIC4YhgrxQY}/#{U4KSmanl4JP.zogrUrI7Crs}<=5,1,0)+ if(#{FXsa5uG3IGn.iIC4YhgrxQY}/#{FXsa5uG3IGn.zogrUrI7Crs}>4 && #{FXsa5uG3IGn.iIC4YhgrxQY}/#{FXsa5uG3IGn.zogrUrI7Crs}<=5,1,0)+ if(#{L34T9YDtCor.iIC4YhgrxQY}/#{L34T9YDtCor.zogrUrI7Crs}>4 && #{L34T9YDtCor.iIC4YhgrxQY}/#{L34T9YDtCor.zogrUrI7Crs}<=5,1,0)+ if(#{W5mHXhSYFfQ.iIC4YhgrxQY}/#{W5mHXhSYFfQ.zogrUrI7Crs}>4 && #{W5mHXhSYFfQ.iIC4YhgrxQY}/#{W5mHXhSYFfQ.zogrUrI7Crs}<=5,1,0)+ if(#{cmSUyJOZwyl.iIC4YhgrxQY}/#{cmSUyJOZwyl.zogrUrI7Crs}>4 && #{cmSUyJOZwyl.iIC4YhgrxQY}/#{cmSUyJOZwyl.zogrUrI7Crs}<=5,1,0)+ if(#{cT8sfosRXvU.iIC4YhgrxQY}/#{cT8sfosRXvU.zogrUrI7Crs}>4 && #{cT8sfosRXvU.iIC4YhgrxQY}/#{cT8sfosRXvU.zogrUrI7Crs}<=5,1,0)+ if(#{OaWKnMS7say.iIC4YhgrxQY}/#{OaWKnMS7say.zogrUrI7Crs}>4 && #{OaWKnMS7say.iIC4YhgrxQY}/#{OaWKnMS7say.zogrUrI7Crs}<=5,1,0)+ if(#{Z4bjHvGS6aH.iIC4YhgrxQY}/#{Z4bjHvGS6aH.zogrUrI7Crs}>4 && #{Z4bjHvGS6aH.iIC4YhgrxQY}/#{Z4bjHvGS6aH.zogrUrI7Crs}<=5,1,0)+ if(#{Nn1L7CNEtC8.iIC4YhgrxQY}/#{Nn1L7CNEtC8.zogrUrI7Crs}>4 && #{Nn1L7CNEtC8.iIC4YhgrxQY}/#{Nn1L7CNEtC8.zogrUrI7Crs}<=5,1,0)+ if(#{RNYKSc3nAUg.iIC4YhgrxQY}/#{RNYKSc3nAUg.zogrUrI7Crs}>4 && #{RNYKSc3nAUg.iIC4YhgrxQY}/#{RNYKSc3nAUg.zogrUrI7Crs}<=5,1,0)+ if(#{PtmZ9XqpPKi.iIC4YhgrxQY}/#{PtmZ9XqpPKi.zogrUrI7Crs}>4 && #{PtmZ9XqpPKi.iIC4YhgrxQY}/#{PtmZ9XqpPKi.zogrUrI7Crs}<=5,1,0)+ if(#{CohlLHi54B0.iIC4YhgrxQY}/#{CohlLHi54B0.zogrUrI7Crs}>4 && #{CohlLHi54B0.iIC4YhgrxQY}/#{CohlLHi54B0.zogrUrI7Crs}<=5,1,0)+ if(#{Gu6u82RD9OW.iIC4YhgrxQY}/#{Gu6u82RD9OW.zogrUrI7Crs}>4 && #{Gu6u82RD9OW.iIC4YhgrxQY}/#{Gu6u82RD9OW.zogrUrI7Crs}<=5,1,0)+ if(#{LiuYzxYr4Pt.iIC4YhgrxQY}/#{LiuYzxYr4Pt.zogrUrI7Crs}>4 && #{LiuYzxYr4Pt.iIC4YhgrxQY}/#{LiuYzxYr4Pt.zogrUrI7Crs}<=5,1,0)+ if(#{Tje33nJAG55.iIC4YhgrxQY}/#{Tje33nJAG55.zogrUrI7Crs}>4 && #{Tje33nJAG55.iIC4YhgrxQY}/#{Tje33nJAG55.zogrUrI7Crs}<=5,1,0)+ if(#{euM2dlqleYH.iIC4YhgrxQY}/#{euM2dlqleYH.zogrUrI7Crs}>4 && #{euM2dlqleYH.iIC4YhgrxQY}/#{euM2dlqleYH.zogrUrI7Crs}<=5,1,0)+ if(#{dASLmBTEehF.iIC4YhgrxQY}/#{dASLmBTEehF.zogrUrI7Crs}>4 && #{dASLmBTEehF.iIC4YhgrxQY}/#{dASLmBTEehF.zogrUrI7Crs}<=5,1,0)+ if(#{qU2LvzoPn1z.iIC4YhgrxQY}/#{qU2LvzoPn1z.zogrUrI7Crs}>4 && #{qU2LvzoPn1z.iIC4YhgrxQY}/#{qU2LvzoPn1z.zogrUrI7Crs}<=5,1,0)+ if(#{OkWaFxdUQY2.iIC4YhgrxQY}/#{OkWaFxdUQY2.zogrUrI7Crs}>4 && #{OkWaFxdUQY2.iIC4YhgrxQY}/#{OkWaFxdUQY2.zogrUrI7Crs}<=5,1,0)+ if(#{YHIv7KQc2e7.iIC4YhgrxQY}/#{YHIv7KQc2e7.zogrUrI7Crs}>4 && #{YHIv7KQc2e7.iIC4YhgrxQY}/#{YHIv7KQc2e7.zogrUrI7Crs}<=5,1,0)+ if(#{rt9D47Inb49.iIC4YhgrxQY}/#{rt9D47Inb49.zogrUrI7Crs}>4 && #{rt9D47Inb49.iIC4YhgrxQY}/#{rt9D47Inb49.zogrUrI7Crs}<=5,1,0)+ if(#{i1iXbquZ5iv.iIC4YhgrxQY}/#{i1iXbquZ5iv.zogrUrI7Crs}>4 && #{i1iXbquZ5iv.iIC4YhgrxQY}/#{i1iXbquZ5iv.zogrUrI7Crs}<=5,1,0)+ if(#{RcE30WBKrXI.iIC4YhgrxQY}/#{RcE30WBKrXI.zogrUrI7Crs}>4 && #{RcE30WBKrXI.iIC4YhgrxQY}/#{RcE30WBKrXI.zogrUrI7Crs}<=5,1,0)+ if(#{EAG0GfdSMAs.iIC4YhgrxQY}/#{EAG0GfdSMAs.zogrUrI7Crs}>4 && #{EAG0GfdSMAs.iIC4YhgrxQY}/#{EAG0GfdSMAs.zogrUrI7Crs}<=5,1,0)+ if(#{N2aXs7VlJdJ.iIC4YhgrxQY}/#{N2aXs7VlJdJ.zogrUrI7Crs}>4 && #{N2aXs7VlJdJ.iIC4YhgrxQY}/#{N2aXs7VlJdJ.zogrUrI7Crs}<=5,1,0)+ if(#{xrjnOtFFTRC.iIC4YhgrxQY}/#{xrjnOtFFTRC.zogrUrI7Crs}>4 && #{xrjnOtFFTRC.iIC4YhgrxQY}/#{xrjnOtFFTRC.zogrUrI7Crs}<=5,1,0)Edit denominator:
Description: "4-5 months - MSR - Denominator" Calculation: "1"
10 5-6 months - MSR
For each item the Indicator returns "1" if the stock coverage time is greater than or equal to 5 but less than 6 and otherwise returns 0 and then adds up these results for calculating the number of items with a stock coverage of 5-6 months.Name (*): "5-6 months"
Short Name (*): "5-6 months - MSR"
Description: "Number of items with a coverage time of 5-6 months"
Decimals in data output: "0"
Indicator type (*): "Number (Factor 1)"
Edit numerator:Description: "O-1 months - MSR - Numerator"
Calculation:
if(#{LNAkkMTxqEW.iIC4YhgrxQY}/#{LNAkkMTxqEW.zogrUrI7Crs}>5 && #{LNAkkMTxqEW.iIC4YhgrxQY}/#{LNAkkMTxqEW.zogrUrI7Crs}<=6,1,0)+ if(#{WyDZKSw82X6.iIC4YhgrxQY}/#{WyDZKSw82X6.zogrUrI7Crs}>5 && #{WyDZKSw82X6.iIC4YhgrxQY}/#{WyDZKSw82X6.zogrUrI7Crs}<=6,1,0)+ if(#{JPccVwAGRq9.iIC4YhgrxQY}/#{JPccVwAGRq9.zogrUrI7Crs}>5 && #{JPccVwAGRq9.iIC4YhgrxQY}/#{JPccVwAGRq9.zogrUrI7Crs}<=6,1,0)+ if(#{smxJz7Mt6ia.iIC4YhgrxQY}/#{smxJz7Mt6ia.zogrUrI7Crs}>5 && #{smxJz7Mt6ia.iIC4YhgrxQY}/#{smxJz7Mt6ia.zogrUrI7Crs}<=6,1,0)+ if(#{AaIApgGQM6t.iIC4YhgrxQY}/#{AaIApgGQM6t.zogrUrI7Crs}>5 && #{AaIApgGQM6t.iIC4YhgrxQY}/#{AaIApgGQM6t.zogrUrI7Crs}<=6,1,0)+ if(#{vCTrmv52APd.iIC4YhgrxQY}/#{vCTrmv52APd.zogrUrI7Crs}>5 && #{vCTrmv52APd.iIC4YhgrxQY}/#{vCTrmv52APd.zogrUrI7Crs}<=6,1,0)+ if(#{SOw2TcuFFH2.iIC4YhgrxQY}/#{SOw2TcuFFH2.zogrUrI7Crs}>5 && #{SOw2TcuFFH2.iIC4YhgrxQY}/#{SOw2TcuFFH2.zogrUrI7Crs}<=6,1,0)+ if(#{RSIOx2u07Ln.iIC4YhgrxQY}/#{RSIOx2u07Ln.zogrUrI7Crs}>5 && #{RSIOx2u07Ln.iIC4YhgrxQY}/#{RSIOx2u07Ln.zogrUrI7Crs}<=6,1,0)+ if(#{JStiDyaPfqy.iIC4YhgrxQY}/#{JStiDyaPfqy.zogrUrI7Crs}>5 && #{JStiDyaPfqy.iIC4YhgrxQY}/#{JStiDyaPfqy.zogrUrI7Crs}<=6,1,0)+ if(#{hZ1YvdcTDQM.iIC4YhgrxQY}/#{hZ1YvdcTDQM.zogrUrI7Crs}>5 && #{hZ1YvdcTDQM.iIC4YhgrxQY}/#{hZ1YvdcTDQM.zogrUrI7Crs}<=6,1,0)+ if(#{tsi32D8HQd5.iIC4YhgrxQY}/#{tsi32D8HQd5.zogrUrI7Crs}>5 && #{tsi32D8HQd5.iIC4YhgrxQY}/#{tsi32D8HQd5.zogrUrI7Crs}<=6,1,0)+ if(#{QWlPF8S0gCc.iIC4YhgrxQY}/#{QWlPF8S0gCc.zogrUrI7Crs}>5 && #{QWlPF8S0gCc.iIC4YhgrxQY}/#{QWlPF8S0gCc.zogrUrI7Crs}<=6,1,0)+ if(#{a5uLTDt12eT.iIC4YhgrxQY}/#{a5uLTDt12eT.zogrUrI7Crs}>5 && #{a5uLTDt12eT.iIC4YhgrxQY}/#{a5uLTDt12eT.zogrUrI7Crs}<=6,1,0)+ if(#{U0AfOOyJMy2.iIC4YhgrxQY}/#{U0AfOOyJMy2.zogrUrI7Crs}>5 && #{U0AfOOyJMy2.iIC4YhgrxQY}/#{U0AfOOyJMy2.zogrUrI7Crs}<=6,1,0)+ if(#{cyf6UdScfFM.iIC4YhgrxQY}/#{cyf6UdScfFM.zogrUrI7Crs}>5 && #{cyf6UdScfFM.iIC4YhgrxQY}/#{cyf6UdScfFM.zogrUrI7Crs}<=6,1,0)+ if(#{FeUTTNHpVzD.iIC4YhgrxQY}/#{FeUTTNHpVzD.zogrUrI7Crs}>5 && #{FeUTTNHpVzD.iIC4YhgrxQY}/#{FeUTTNHpVzD.zogrUrI7Crs}<=6,1,0)+ if(#{mKSICD1rxG4.iIC4YhgrxQY}/#{mKSICD1rxG4.zogrUrI7Crs}>5 && #{mKSICD1rxG4.iIC4YhgrxQY}/#{mKSICD1rxG4.zogrUrI7Crs}<=6,1,0)+ if(#{mVNe1aS1pGl.iIC4YhgrxQY}/#{mVNe1aS1pGl.zogrUrI7Crs}>5 && #{mVNe1aS1pGl.iIC4YhgrxQY}/#{mVNe1aS1pGl.zogrUrI7Crs}<=6,1,0)+ if(#{oLAXTZY6ken.iIC4YhgrxQY}/#{oLAXTZY6ken.zogrUrI7Crs}>5 && #{oLAXTZY6ken.iIC4YhgrxQY}/#{oLAXTZY6ken.zogrUrI7Crs}<=6,1,0)+ if(#{YYaRDUZyH9L.iIC4YhgrxQY}/#{YYaRDUZyH9L.zogrUrI7Crs}>5 && #{YYaRDUZyH9L.iIC4YhgrxQY}/#{YYaRDUZyH9L.zogrUrI7Crs}<=6,1,0)+ if(#{HVteopBt0jr.iIC4YhgrxQY}/#{HVteopBt0jr.zogrUrI7Crs}>5 && #{HVteopBt0jr.iIC4YhgrxQY}/#{HVteopBt0jr.zogrUrI7Crs}<=6,1,0)+ if(#{sWodd2tbjgZ.iIC4YhgrxQY}/#{sWodd2tbjgZ.zogrUrI7Crs}>5 && #{sWodd2tbjgZ.iIC4YhgrxQY}/#{sWodd2tbjgZ.zogrUrI7Crs}<=6,1,0)+ if(#{yVYajDDYUfX.iIC4YhgrxQY}/#{yVYajDDYUfX.zogrUrI7Crs}>5 && #{yVYajDDYUfX.iIC4YhgrxQY}/#{yVYajDDYUfX.zogrUrI7Crs}<=6,1,0)+ if(#{eTJAr4sc83v.iIC4YhgrxQY}/#{eTJAr4sc83v.zogrUrI7Crs}>5 && #{eTJAr4sc83v.iIC4YhgrxQY}/#{eTJAr4sc83v.zogrUrI7Crs}<=6,1,0)+ if(#{U4KSmanl4JP.iIC4YhgrxQY}/#{U4KSmanl4JP.zogrUrI7Crs}>5 && #{U4KSmanl4JP.iIC4YhgrxQY}/#{U4KSmanl4JP.zogrUrI7Crs}<=6,1,0)+ if(#{FXsa5uG3IGn.iIC4YhgrxQY}/#{FXsa5uG3IGn.zogrUrI7Crs}>5 && #{FXsa5uG3IGn.iIC4YhgrxQY}/#{FXsa5uG3IGn.zogrUrI7Crs}<=6,1,0)+ if(#{L34T9YDtCor.iIC4YhgrxQY}/#{L34T9YDtCor.zogrUrI7Crs}>5 && #{L34T9YDtCor.iIC4YhgrxQY}/#{L34T9YDtCor.zogrUrI7Crs}<=6,1,0)+ if(#{W5mHXhSYFfQ.iIC4YhgrxQY}/#{W5mHXhSYFfQ.zogrUrI7Crs}>5 && #{W5mHXhSYFfQ.iIC4YhgrxQY}/#{W5mHXhSYFfQ.zogrUrI7Crs}<=6,1,0)+ if(#{cmSUyJOZwyl.iIC4YhgrxQY}/#{cmSUyJOZwyl.zogrUrI7Crs}>5 && #{cmSUyJOZwyl.iIC4YhgrxQY}/#{cmSUyJOZwyl.zogrUrI7Crs}<=6,1,0)+ if(#{cT8sfosRXvU.iIC4YhgrxQY}/#{cT8sfosRXvU.zogrUrI7Crs}>5 && #{cT8sfosRXvU.iIC4YhgrxQY}/#{cT8sfosRXvU.zogrUrI7Crs}<=6,1,0)+ if(#{OaWKnMS7say.iIC4YhgrxQY}/#{OaWKnMS7say.zogrUrI7Crs}>5 && #{OaWKnMS7say.iIC4YhgrxQY}/#{OaWKnMS7say.zogrUrI7Crs}<=6,1,0)+ if(#{Z4bjHvGS6aH.iIC4YhgrxQY}/#{Z4bjHvGS6aH.zogrUrI7Crs}>5 && #{Z4bjHvGS6aH.iIC4YhgrxQY}/#{Z4bjHvGS6aH.zogrUrI7Crs}<=6,1,0)+ if(#{Nn1L7CNEtC8.iIC4YhgrxQY}/#{Nn1L7CNEtC8.zogrUrI7Crs}>5 && #{Nn1L7CNEtC8.iIC4YhgrxQY}/#{Nn1L7CNEtC8.zogrUrI7Crs}<=6,1,0)+ if(#{RNYKSc3nAUg.iIC4YhgrxQY}/#{RNYKSc3nAUg.zogrUrI7Crs}>5 && #{RNYKSc3nAUg.iIC4YhgrxQY}/#{RNYKSc3nAUg.zogrUrI7Crs}<=6,1,0)+ if(#{PtmZ9XqpPKi.iIC4YhgrxQY}/#{PtmZ9XqpPKi.zogrUrI7Crs}>5 && #{PtmZ9XqpPKi.iIC4YhgrxQY}/#{PtmZ9XqpPKi.zogrUrI7Crs}<=6,1,0)+ if(#{CohlLHi54B0.iIC4YhgrxQY}/#{CohlLHi54B0.zogrUrI7Crs}>5 && #{CohlLHi54B0.iIC4YhgrxQY}/#{CohlLHi54B0.zogrUrI7Crs}<=6,1,0)+ if(#{Gu6u82RD9OW.iIC4YhgrxQY}/#{Gu6u82RD9OW.zogrUrI7Crs}>5 && #{Gu6u82RD9OW.iIC4YhgrxQY}/#{Gu6u82RD9OW.zogrUrI7Crs}<=6,1,0)+ if(#{LiuYzxYr4Pt.iIC4YhgrxQY}/#{LiuYzxYr4Pt.zogrUrI7Crs}>5 && #{LiuYzxYr4Pt.iIC4YhgrxQY}/#{LiuYzxYr4Pt.zogrUrI7Crs}<=6,1,0)+ if(#{Tje33nJAG55.iIC4YhgrxQY}/#{Tje33nJAG55.zogrUrI7Crs}>5 && #{Tje33nJAG55.iIC4YhgrxQY}/#{Tje33nJAG55.zogrUrI7Crs}<=6,1,0)+ if(#{euM2dlqleYH.iIC4YhgrxQY}/#{euM2dlqleYH.zogrUrI7Crs}>5 && #{euM2dlqleYH.iIC4YhgrxQY}/#{euM2dlqleYH.zogrUrI7Crs}<=6,1,0)+ if(#{dASLmBTEehF.iIC4YhgrxQY}/#{dASLmBTEehF.zogrUrI7Crs}>5 && #{dASLmBTEehF.iIC4YhgrxQY}/#{dASLmBTEehF.zogrUrI7Crs}<=6,1,0)+ if(#{qU2LvzoPn1z.iIC4YhgrxQY}/#{qU2LvzoPn1z.zogrUrI7Crs}>5 && #{qU2LvzoPn1z.iIC4YhgrxQY}/#{qU2LvzoPn1z.zogrUrI7Crs}<=6,1,0)+ if(#{OkWaFxdUQY2.iIC4YhgrxQY}/#{OkWaFxdUQY2.zogrUrI7Crs}>5 && #{OkWaFxdUQY2.iIC4YhgrxQY}/#{OkWaFxdUQY2.zogrUrI7Crs}<=6,1,0)+ if(#{YHIv7KQc2e7.iIC4YhgrxQY}/#{YHIv7KQc2e7.zogrUrI7Crs}>5 && #{YHIv7KQc2e7.iIC4YhgrxQY}/#{YHIv7KQc2e7.zogrUrI7Crs}<=6,1,0)+ if(#{rt9D47Inb49.iIC4YhgrxQY}/#{rt9D47Inb49.zogrUrI7Crs}>5 && #{rt9D47Inb49.iIC4YhgrxQY}/#{rt9D47Inb49.zogrUrI7Crs}<=6,1,0)+ if(#{i1iXbquZ5iv.iIC4YhgrxQY}/#{i1iXbquZ5iv.zogrUrI7Crs}>5 && #{i1iXbquZ5iv.iIC4YhgrxQY}/#{i1iXbquZ5iv.zogrUrI7Crs}<=6,1,0)+ if(#{RcE30WBKrXI.iIC4YhgrxQY}/#{RcE30WBKrXI.zogrUrI7Crs}>5 && #{RcE30WBKrXI.iIC4YhgrxQY}/#{RcE30WBKrXI.zogrUrI7Crs}<=6,1,0)+ if(#{EAG0GfdSMAs.iIC4YhgrxQY}/#{EAG0GfdSMAs.zogrUrI7Crs}>5 && #{EAG0GfdSMAs.iIC4YhgrxQY}/#{EAG0GfdSMAs.zogrUrI7Crs}<=6,1,0)+ if(#{N2aXs7VlJdJ.iIC4YhgrxQY}/#{N2aXs7VlJdJ.zogrUrI7Crs}>5 && #{N2aXs7VlJdJ.iIC4YhgrxQY}/#{N2aXs7VlJdJ.zogrUrI7Crs}<=6,1,0)+ if(#{xrjnOtFFTRC.iIC4YhgrxQY}/#{xrjnOtFFTRC.zogrUrI7Crs}>5 && #{xrjnOtFFTRC.iIC4YhgrxQY}/#{xrjnOtFFTRC.zogrUrI7Crs}<=6,1,0)Edit denominator:
Description: "5-6 months - MSR - Denominator"
Calculation: "1"11 6-7 months - MSR
For each item the Indicator returns "1" if the stock coverage time is greater than or equal to 6 but less than 7 and otherwise returns 0and then adds up these results for calculating the number of items with a stock coverage time of 6-7 months.Name (*): "6-7 months - MSR"
Short Name (*): "6-7 months - MSR"
Description: "Number of items with a coverage time of 6-7 months"
Decimals in data output: "0"
Indicator type (*): "Number (Factor 1)"
Edit numerator:Description: "6-7 months - MSR - Numerator"
Calculation:
if(#{LNAkkMTxqEW.iIC4YhgrxQY}/#{LNAkkMTxqEW.zogrUrI7Crs}>6 && #{LNAkkMTxqEW.iIC4YhgrxQY}/#{LNAkkMTxqEW.zogrUrI7Crs}<=7,1,0)+ if(#{WyDZKSw82X6.iIC4YhgrxQY}/#{WyDZKSw82X6.zogrUrI7Crs}>6 && #{WyDZKSw82X6.iIC4YhgrxQY}/#{WyDZKSw82X6.zogrUrI7Crs}<=7,1,0)+ if(#{JPccVwAGRq9.iIC4YhgrxQY}/#{JPccVwAGRq9.zogrUrI7Crs}>6 && #{JPccVwAGRq9.iIC4YhgrxQY}/#{JPccVwAGRq9.zogrUrI7Crs}<=7,1,0)+ if(#{smxJz7Mt6ia.iIC4YhgrxQY}/#{smxJz7Mt6ia.zogrUrI7Crs}>6 && #{smxJz7Mt6ia.iIC4YhgrxQY}/#{smxJz7Mt6ia.zogrUrI7Crs}<=7,1,0)+ if(#{AaIApgGQM6t.iIC4YhgrxQY}/#{AaIApgGQM6t.zogrUrI7Crs}>6 && #{AaIApgGQM6t.iIC4YhgrxQY}/#{AaIApgGQM6t.zogrUrI7Crs}<=7,1,0)+ if(#{vCTrmv52APd.iIC4YhgrxQY}/#{vCTrmv52APd.zogrUrI7Crs}>6 && #{vCTrmv52APd.iIC4YhgrxQY}/#{vCTrmv52APd.zogrUrI7Crs}<=7,1,0)+ if(#{SOw2TcuFFH2.iIC4YhgrxQY}/#{SOw2TcuFFH2.zogrUrI7Crs}>6 && #{SOw2TcuFFH2.iIC4YhgrxQY}/#{SOw2TcuFFH2.zogrUrI7Crs}<=7,1,0)+ if(#{RSIOx2u07Ln.iIC4YhgrxQY}/#{RSIOx2u07Ln.zogrUrI7Crs}>6 && #{RSIOx2u07Ln.iIC4YhgrxQY}/#{RSIOx2u07Ln.zogrUrI7Crs}<=7,1,0)+ if(#{JStiDyaPfqy.iIC4YhgrxQY}/#{JStiDyaPfqy.zogrUrI7Crs}>6 && #{JStiDyaPfqy.iIC4YhgrxQY}/#{JStiDyaPfqy.zogrUrI7Crs}<=7,1,0)+ if(#{hZ1YvdcTDQM.iIC4YhgrxQY}/#{hZ1YvdcTDQM.zogrUrI7Crs}>6 && #{hZ1YvdcTDQM.iIC4YhgrxQY}/#{hZ1YvdcTDQM.zogrUrI7Crs}<=7,1,0)+ if(#{tsi32D8HQd5.iIC4YhgrxQY}/#{tsi32D8HQd5.zogrUrI7Crs}>6 && #{tsi32D8HQd5.iIC4YhgrxQY}/#{tsi32D8HQd5.zogrUrI7Crs}<=7,1,0)+ if(#{QWlPF8S0gCc.iIC4YhgrxQY}/#{QWlPF8S0gCc.zogrUrI7Crs}>6 && #{QWlPF8S0gCc.iIC4YhgrxQY}/#{QWlPF8S0gCc.zogrUrI7Crs}<=7,1,0)+ if(#{a5uLTDt12eT.iIC4YhgrxQY}/#{a5uLTDt12eT.zogrUrI7Crs}>6 && #{a5uLTDt12eT.iIC4YhgrxQY}/#{a5uLTDt12eT.zogrUrI7Crs}<=7,1,0)+ if(#{U0AfOOyJMy2.iIC4YhgrxQY}/#{U0AfOOyJMy2.zogrUrI7Crs}>6 && #{U0AfOOyJMy2.iIC4YhgrxQY}/#{U0AfOOyJMy2.zogrUrI7Crs}<=7,1,0)+ if(#{cyf6UdScfFM.iIC4YhgrxQY}/#{cyf6UdScfFM.zogrUrI7Crs}>6 && #{cyf6UdScfFM.iIC4YhgrxQY}/#{cyf6UdScfFM.zogrUrI7Crs}<=7,1,0)+ if(#{FeUTTNHpVzD.iIC4YhgrxQY}/#{FeUTTNHpVzD.zogrUrI7Crs}>6 && #{FeUTTNHpVzD.iIC4YhgrxQY}/#{FeUTTNHpVzD.zogrUrI7Crs}<=7,1,0)+ if(#{mKSICD1rxG4.iIC4YhgrxQY}/#{mKSICD1rxG4.zogrUrI7Crs}>6 && #{mKSICD1rxG4.iIC4YhgrxQY}/#{mKSICD1rxG4.zogrUrI7Crs}<=7,1,0)+ if(#{mVNe1aS1pGl.iIC4YhgrxQY}/#{mVNe1aS1pGl.zogrUrI7Crs}>6 && #{mVNe1aS1pGl.iIC4YhgrxQY}/#{mVNe1aS1pGl.zogrUrI7Crs}<=7,1,0)+ if(#{oLAXTZY6ken.iIC4YhgrxQY}/#{oLAXTZY6ken.zogrUrI7Crs}>6 && #{oLAXTZY6ken.iIC4YhgrxQY}/#{oLAXTZY6ken.zogrUrI7Crs}<=7,1,0)+ if(#{YYaRDUZyH9L.iIC4YhgrxQY}/#{YYaRDUZyH9L.zogrUrI7Crs}>6 && #{YYaRDUZyH9L.iIC4YhgrxQY}/#{YYaRDUZyH9L.zogrUrI7Crs}<=7,1,0)+ if(#{HVteopBt0jr.iIC4YhgrxQY}/#{HVteopBt0jr.zogrUrI7Crs}>6 && #{HVteopBt0jr.iIC4YhgrxQY}/#{HVteopBt0jr.zogrUrI7Crs}<=7,1,0)+ if(#{sWodd2tbjgZ.iIC4YhgrxQY}/#{sWodd2tbjgZ.zogrUrI7Crs}>6 && #{sWodd2tbjgZ.iIC4YhgrxQY}/#{sWodd2tbjgZ.zogrUrI7Crs}<=7,1,0)+ if(#{yVYajDDYUfX.iIC4YhgrxQY}/#{yVYajDDYUfX.zogrUrI7Crs}>6 && #{yVYajDDYUfX.iIC4YhgrxQY}/#{yVYajDDYUfX.zogrUrI7Crs}<=7,1,0)+ if(#{eTJAr4sc83v.iIC4YhgrxQY}/#{eTJAr4sc83v.zogrUrI7Crs}>6 && #{eTJAr4sc83v.iIC4YhgrxQY}/#{eTJAr4sc83v.zogrUrI7Crs}<=7,1,0)+ if(#{U4KSmanl4JP.iIC4YhgrxQY}/#{U4KSmanl4JP.zogrUrI7Crs}>6 && #{U4KSmanl4JP.iIC4YhgrxQY}/#{U4KSmanl4JP.zogrUrI7Crs}<=7,1,0)+ if(#{FXsa5uG3IGn.iIC4YhgrxQY}/#{FXsa5uG3IGn.zogrUrI7Crs}>6 && #{FXsa5uG3IGn.iIC4YhgrxQY}/#{FXsa5uG3IGn.zogrUrI7Crs}<=7,1,0)+ if(#{L34T9YDtCor.iIC4YhgrxQY}/#{L34T9YDtCor.zogrUrI7Crs}>6 && #{L34T9YDtCor.iIC4YhgrxQY}/#{L34T9YDtCor.zogrUrI7Crs}<=7,1,0)+ if(#{W5mHXhSYFfQ.iIC4YhgrxQY}/#{W5mHXhSYFfQ.zogrUrI7Crs}>6 && #{W5mHXhSYFfQ.iIC4YhgrxQY}/#{W5mHXhSYFfQ.zogrUrI7Crs}<=7,1,0)+ if(#{cmSUyJOZwyl.iIC4YhgrxQY}/#{cmSUyJOZwyl.zogrUrI7Crs}>6 && #{cmSUyJOZwyl.iIC4YhgrxQY}/#{cmSUyJOZwyl.zogrUrI7Crs}<=7,1,0)+ if(#{cT8sfosRXvU.iIC4YhgrxQY}/#{cT8sfosRXvU.zogrUrI7Crs}>6 && #{cT8sfosRXvU.iIC4YhgrxQY}/#{cT8sfosRXvU.zogrUrI7Crs}<=7,1,0)+ if(#{OaWKnMS7say.iIC4YhgrxQY}/#{OaWKnMS7say.zogrUrI7Crs}>6 && #{OaWKnMS7say.iIC4YhgrxQY}/#{OaWKnMS7say.zogrUrI7Crs}<=7,1,0)+ if(#{Z4bjHvGS6aH.iIC4YhgrxQY}/#{Z4bjHvGS6aH.zogrUrI7Crs}>6 && #{Z4bjHvGS6aH.iIC4YhgrxQY}/#{Z4bjHvGS6aH.zogrUrI7Crs}<=7,1,0)+ if(#{Nn1L7CNEtC8.iIC4YhgrxQY}/#{Nn1L7CNEtC8.zogrUrI7Crs}>6 && #{Nn1L7CNEtC8.iIC4YhgrxQY}/#{Nn1L7CNEtC8.zogrUrI7Crs}<=7,1,0)+ if(#{RNYKSc3nAUg.iIC4YhgrxQY}/#{RNYKSc3nAUg.zogrUrI7Crs}>6 && #{RNYKSc3nAUg.iIC4YhgrxQY}/#{RNYKSc3nAUg.zogrUrI7Crs}<=7,1,0)+ if(#{PtmZ9XqpPKi.iIC4YhgrxQY}/#{PtmZ9XqpPKi.zogrUrI7Crs}>6 && #{PtmZ9XqpPKi.iIC4YhgrxQY}/#{PtmZ9XqpPKi.zogrUrI7Crs}<=7,1,0)+ if(#{CohlLHi54B0.iIC4YhgrxQY}/#{CohlLHi54B0.zogrUrI7Crs}>6 && #{CohlLHi54B0.iIC4YhgrxQY}/#{CohlLHi54B0.zogrUrI7Crs}<=7,1,0)+ if(#{Gu6u82RD9OW.iIC4YhgrxQY}/#{Gu6u82RD9OW.zogrUrI7Crs}>6 && #{Gu6u82RD9OW.iIC4YhgrxQY}/#{Gu6u82RD9OW.zogrUrI7Crs}<=7,1,0)+ if(#{LiuYzxYr4Pt.iIC4YhgrxQY}/#{LiuYzxYr4Pt.zogrUrI7Crs}>6 && #{LiuYzxYr4Pt.iIC4YhgrxQY}/#{LiuYzxYr4Pt.zogrUrI7Crs}<=7,1,0)+ if(#{Tje33nJAG55.iIC4YhgrxQY}/#{Tje33nJAG55.zogrUrI7Crs}>6 && #{Tje33nJAG55.iIC4YhgrxQY}/#{Tje33nJAG55.zogrUrI7Crs}<=7,1,0)+ if(#{euM2dlqleYH.iIC4YhgrxQY}/#{euM2dlqleYH.zogrUrI7Crs}>6 && #{euM2dlqleYH.iIC4YhgrxQY}/#{euM2dlqleYH.zogrUrI7Crs}<=7,1,0)+ if(#{dASLmBTEehF.iIC4YhgrxQY}/#{dASLmBTEehF.zogrUrI7Crs}>6 && #{dASLmBTEehF.iIC4YhgrxQY}/#{dASLmBTEehF.zogrUrI7Crs}<=7,1,0)+ if(#{qU2LvzoPn1z.iIC4YhgrxQY}/#{qU2LvzoPn1z.zogrUrI7Crs}>6 && #{qU2LvzoPn1z.iIC4YhgrxQY}/#{qU2LvzoPn1z.zogrUrI7Crs}<=7,1,0)+ if(#{OkWaFxdUQY2.iIC4YhgrxQY}/#{OkWaFxdUQY2.zogrUrI7Crs}>6 && #{OkWaFxdUQY2.iIC4YhgrxQY}/#{OkWaFxdUQY2.zogrUrI7Crs}<=7,1,0)+ if(#{YHIv7KQc2e7.iIC4YhgrxQY}/#{YHIv7KQc2e7.zogrUrI7Crs}>6 && #{YHIv7KQc2e7.iIC4YhgrxQY}/#{YHIv7KQc2e7.zogrUrI7Crs}<=7,1,0)+ if(#{rt9D47Inb49.iIC4YhgrxQY}/#{rt9D47Inb49.zogrUrI7Crs}>6 && #{rt9D47Inb49.iIC4YhgrxQY}/#{rt9D47Inb49.zogrUrI7Crs}<=7,1,0)+ if(#{i1iXbquZ5iv.iIC4YhgrxQY}/#{i1iXbquZ5iv.zogrUrI7Crs}>6 && #{i1iXbquZ5iv.iIC4YhgrxQY}/#{i1iXbquZ5iv.zogrUrI7Crs}<=7,1,0)+ if(#{RcE30WBKrXI.iIC4YhgrxQY}/#{RcE30WBKrXI.zogrUrI7Crs}>6 && #{RcE30WBKrXI.iIC4YhgrxQY}/#{RcE30WBKrXI.zogrUrI7Crs}<=7,1,0)+ if(#{EAG0GfdSMAs.iIC4YhgrxQY}/#{EAG0GfdSMAs.zogrUrI7Crs}>6 && #{EAG0GfdSMAs.iIC4YhgrxQY}/#{EAG0GfdSMAs.zogrUrI7Crs}<=7,1,0)+ if(#{N2aXs7VlJdJ.iIC4YhgrxQY}/#{N2aXs7VlJdJ.zogrUrI7Crs}>6 && #{N2aXs7VlJdJ.iIC4YhgrxQY}/#{N2aXs7VlJdJ.zogrUrI7Crs}<=7,1,0)+ if(#{xrjnOtFFTRC.iIC4YhgrxQY}/#{xrjnOtFFTRC.zogrUrI7Crs}>6 && #{xrjnOtFFTRC.iIC4YhgrxQY}/#{xrjnOtFFTRC.zogrUrI7Crs}<=7,1,0)Edit denominator:
Description: "6-7 months - MSR - Denominator"
Calculation: "1"12 7-8 months - MSR
For each item the Indicator returns "1" if the stock coverage time is greater than or equal to 1 but less than 2 and otherwise returns 0and then adds up these results for calculating the number of items with a stock coverage time of 7-8 months.Name (*): "7-8 months - MSR"
Short Name (*): "7-8 months - MSR"
Description: "Number of items with a coverage time of 7-8 months"
Decimals in data output: "0"
Indicator type (*): "Number (Factor 1)"
Edit numerator:Description: "7-8 months - MSR - Numerator"
Calculation:
if(#{LNAkkMTxqEW.iIC4YhgrxQY}/#{LNAkkMTxqEW.zogrUrI7Crs}>7 && #{LNAkkMTxqEW.iIC4YhgrxQY}/#{LNAkkMTxqEW.zogrUrI7Crs}<=8,1,0)+ if(#{WyDZKSw82X6.iIC4YhgrxQY}/#{WyDZKSw82X6.zogrUrI7Crs}>7 && #{WyDZKSw82X6.iIC4YhgrxQY}/#{WyDZKSw82X6.zogrUrI7Crs}<=8,1,0)+ if(#{JPccVwAGRq9.iIC4YhgrxQY}/#{JPccVwAGRq9.zogrUrI7Crs}>7 && #{JPccVwAGRq9.iIC4YhgrxQY}/#{JPccVwAGRq9.zogrUrI7Crs}<=8,1,0)+ if(#{smxJz7Mt6ia.iIC4YhgrxQY}/#{smxJz7Mt6ia.zogrUrI7Crs}>7 && #{smxJz7Mt6ia.iIC4YhgrxQY}/#{smxJz7Mt6ia.zogrUrI7Crs}<=8,1,0)+ if(#{AaIApgGQM6t.iIC4YhgrxQY}/#{AaIApgGQM6t.zogrUrI7Crs}>7 && #{AaIApgGQM6t.iIC4YhgrxQY}/#{AaIApgGQM6t.zogrUrI7Crs}<=8,1,0)+ if(#{vCTrmv52APd.iIC4YhgrxQY}/#{vCTrmv52APd.zogrUrI7Crs}>7 && #{vCTrmv52APd.iIC4YhgrxQY}/#{vCTrmv52APd.zogrUrI7Crs}<=8,1,0)+ if(#{SOw2TcuFFH2.iIC4YhgrxQY}/#{SOw2TcuFFH2.zogrUrI7Crs}>7 && #{SOw2TcuFFH2.iIC4YhgrxQY}/#{SOw2TcuFFH2.zogrUrI7Crs}<=8,1,0)+ if(#{RSIOx2u07Ln.iIC4YhgrxQY}/#{RSIOx2u07Ln.zogrUrI7Crs}>7 && #{RSIOx2u07Ln.iIC4YhgrxQY}/#{RSIOx2u07Ln.zogrUrI7Crs}<=8,1,0)+ if(#{JStiDyaPfqy.iIC4YhgrxQY}/#{JStiDyaPfqy.zogrUrI7Crs}>7 && #{JStiDyaPfqy.iIC4YhgrxQY}/#{JStiDyaPfqy.zogrUrI7Crs}<=8,1,0)+ if(#{hZ1YvdcTDQM.iIC4YhgrxQY}/#{hZ1YvdcTDQM.zogrUrI7Crs}>7 && #{hZ1YvdcTDQM.iIC4YhgrxQY}/#{hZ1YvdcTDQM.zogrUrI7Crs}<=8,1,0)+ if(#{tsi32D8HQd5.iIC4YhgrxQY}/#{tsi32D8HQd5.zogrUrI7Crs}>7 && #{tsi32D8HQd5.iIC4YhgrxQY}/#{tsi32D8HQd5.zogrUrI7Crs}<=8,1,0)+ if(#{QWlPF8S0gCc.iIC4YhgrxQY}/#{QWlPF8S0gCc.zogrUrI7Crs}>7 && #{QWlPF8S0gCc.iIC4YhgrxQY}/#{QWlPF8S0gCc.zogrUrI7Crs}<=8,1,0)+ if(#{a5uLTDt12eT.iIC4YhgrxQY}/#{a5uLTDt12eT.zogrUrI7Crs}>7 && #{a5uLTDt12eT.iIC4YhgrxQY}/#{a5uLTDt12eT.zogrUrI7Crs}<=8,1,0)+ if(#{U0AfOOyJMy2.iIC4YhgrxQY}/#{U0AfOOyJMy2.zogrUrI7Crs}>7 && #{U0AfOOyJMy2.iIC4YhgrxQY}/#{U0AfOOyJMy2.zogrUrI7Crs}<=8,1,0)+ if(#{cyf6UdScfFM.iIC4YhgrxQY}/#{cyf6UdScfFM.zogrUrI7Crs}>7 && #{cyf6UdScfFM.iIC4YhgrxQY}/#{cyf6UdScfFM.zogrUrI7Crs}<=8,1,0)+ if(#{FeUTTNHpVzD.iIC4YhgrxQY}/#{FeUTTNHpVzD.zogrUrI7Crs}>7 && #{FeUTTNHpVzD.iIC4YhgrxQY}/#{FeUTTNHpVzD.zogrUrI7Crs}<=8,1,0)+ if(#{mKSICD1rxG4.iIC4YhgrxQY}/#{mKSICD1rxG4.zogrUrI7Crs}>7 && #{mKSICD1rxG4.iIC4YhgrxQY}/#{mKSICD1rxG4.zogrUrI7Crs}<=8,1,0)+ if(#{mVNe1aS1pGl.iIC4YhgrxQY}/#{mVNe1aS1pGl.zogrUrI7Crs}>7 && #{mVNe1aS1pGl.iIC4YhgrxQY}/#{mVNe1aS1pGl.zogrUrI7Crs}<=8,1,0)+ if(#{oLAXTZY6ken.iIC4YhgrxQY}/#{oLAXTZY6ken.zogrUrI7Crs}>7 && #{oLAXTZY6ken.iIC4YhgrxQY}/#{oLAXTZY6ken.zogrUrI7Crs}<=8,1,0)+ if(#{YYaRDUZyH9L.iIC4YhgrxQY}/#{YYaRDUZyH9L.zogrUrI7Crs}>7 && #{YYaRDUZyH9L.iIC4YhgrxQY}/#{YYaRDUZyH9L.zogrUrI7Crs}<=8,1,0)+ if(#{HVteopBt0jr.iIC4YhgrxQY}/#{HVteopBt0jr.zogrUrI7Crs}>7 && #{HVteopBt0jr.iIC4YhgrxQY}/#{HVteopBt0jr.zogrUrI7Crs}<=8,1,0)+ if(#{sWodd2tbjgZ.iIC4YhgrxQY}/#{sWodd2tbjgZ.zogrUrI7Crs}>7 && #{sWodd2tbjgZ.iIC4YhgrxQY}/#{sWodd2tbjgZ.zogrUrI7Crs}<=8,1,0)+ if(#{yVYajDDYUfX.iIC4YhgrxQY}/#{yVYajDDYUfX.zogrUrI7Crs}>7 && #{yVYajDDYUfX.iIC4YhgrxQY}/#{yVYajDDYUfX.zogrUrI7Crs}<=8,1,0)+ if(#{eTJAr4sc83v.iIC4YhgrxQY}/#{eTJAr4sc83v.zogrUrI7Crs}>7 && #{eTJAr4sc83v.iIC4YhgrxQY}/#{eTJAr4sc83v.zogrUrI7Crs}<=8,1,0)+ if(#{U4KSmanl4JP.iIC4YhgrxQY}/#{U4KSmanl4JP.zogrUrI7Crs}>7 && #{U4KSmanl4JP.iIC4YhgrxQY}/#{U4KSmanl4JP.zogrUrI7Crs}<=8,1,0)+ if(#{FXsa5uG3IGn.iIC4YhgrxQY}/#{FXsa5uG3IGn.zogrUrI7Crs}>7 && #{FXsa5uG3IGn.iIC4YhgrxQY}/#{FXsa5uG3IGn.zogrUrI7Crs}<=8,1,0)+ if(#{L34T9YDtCor.iIC4YhgrxQY}/#{L34T9YDtCor.zogrUrI7Crs}>7 && #{L34T9YDtCor.iIC4YhgrxQY}/#{L34T9YDtCor.zogrUrI7Crs}<=8,1,0)+ if(#{W5mHXhSYFfQ.iIC4YhgrxQY}/#{W5mHXhSYFfQ.zogrUrI7Crs}>7 && #{W5mHXhSYFfQ.iIC4YhgrxQY}/#{W5mHXhSYFfQ.zogrUrI7Crs}<=8,1,0)+ if(#{cmSUyJOZwyl.iIC4YhgrxQY}/#{cmSUyJOZwyl.zogrUrI7Crs}>7 && #{cmSUyJOZwyl.iIC4YhgrxQY}/#{cmSUyJOZwyl.zogrUrI7Crs}<=8,1,0)+ if(#{cT8sfosRXvU.iIC4YhgrxQY}/#{cT8sfosRXvU.zogrUrI7Crs}>7 && #{cT8sfosRXvU.iIC4YhgrxQY}/#{cT8sfosRXvU.zogrUrI7Crs}<=8,1,0)+ if(#{OaWKnMS7say.iIC4YhgrxQY}/#{OaWKnMS7say.zogrUrI7Crs}>7 && #{OaWKnMS7say.iIC4YhgrxQY}/#{OaWKnMS7say.zogrUrI7Crs}<=8,1,0)+ if(#{Z4bjHvGS6aH.iIC4YhgrxQY}/#{Z4bjHvGS6aH.zogrUrI7Crs}>7 && #{Z4bjHvGS6aH.iIC4YhgrxQY}/#{Z4bjHvGS6aH.zogrUrI7Crs}<=8,1,0)+ if(#{Nn1L7CNEtC8.iIC4YhgrxQY}/#{Nn1L7CNEtC8.zogrUrI7Crs}>7 && #{Nn1L7CNEtC8.iIC4YhgrxQY}/#{Nn1L7CNEtC8.zogrUrI7Crs}<=8,1,0)+ if(#{RNYKSc3nAUg.iIC4YhgrxQY}/#{RNYKSc3nAUg.zogrUrI7Crs}>7 && #{RNYKSc3nAUg.iIC4YhgrxQY}/#{RNYKSc3nAUg.zogrUrI7Crs}<=8,1,0)+ if(#{PtmZ9XqpPKi.iIC4YhgrxQY}/#{PtmZ9XqpPKi.zogrUrI7Crs}>7 && #{PtmZ9XqpPKi.iIC4YhgrxQY}/#{PtmZ9XqpPKi.zogrUrI7Crs}<=8,1,0)+ if(#{CohlLHi54B0.iIC4YhgrxQY}/#{CohlLHi54B0.zogrUrI7Crs}>7 && #{CohlLHi54B0.iIC4YhgrxQY}/#{CohlLHi54B0.zogrUrI7Crs}<=8,1,0)+ if(#{Gu6u82RD9OW.iIC4YhgrxQY}/#{Gu6u82RD9OW.zogrUrI7Crs}>7 && #{Gu6u82RD9OW.iIC4YhgrxQY}/#{Gu6u82RD9OW.zogrUrI7Crs}<=8,1,0)+ if(#{LiuYzxYr4Pt.iIC4YhgrxQY}/#{LiuYzxYr4Pt.zogrUrI7Crs}>7 && #{LiuYzxYr4Pt.iIC4YhgrxQY}/#{LiuYzxYr4Pt.zogrUrI7Crs}<=8,1,0)+ if(#{Tje33nJAG55.iIC4YhgrxQY}/#{Tje33nJAG55.zogrUrI7Crs}>7 && #{Tje33nJAG55.iIC4YhgrxQY}/#{Tje33nJAG55.zogrUrI7Crs}<=8,1,0)+ if(#{euM2dlqleYH.iIC4YhgrxQY}/#{euM2dlqleYH.zogrUrI7Crs}>7 && #{euM2dlqleYH.iIC4YhgrxQY}/#{euM2dlqleYH.zogrUrI7Crs}<=8,1,0)+ if(#{dASLmBTEehF.iIC4YhgrxQY}/#{dASLmBTEehF.zogrUrI7Crs}>7 && #{dASLmBTEehF.iIC4YhgrxQY}/#{dASLmBTEehF.zogrUrI7Crs}<=8,1,0)+ if(#{qU2LvzoPn1z.iIC4YhgrxQY}/#{qU2LvzoPn1z.zogrUrI7Crs}>7 && #{qU2LvzoPn1z.iIC4YhgrxQY}/#{qU2LvzoPn1z.zogrUrI7Crs}<=8,1,0)+ if(#{OkWaFxdUQY2.iIC4YhgrxQY}/#{OkWaFxdUQY2.zogrUrI7Crs}>7 && #{OkWaFxdUQY2.iIC4YhgrxQY}/#{OkWaFxdUQY2.zogrUrI7Crs}<=8,1,0)+ if(#{YHIv7KQc2e7.iIC4YhgrxQY}/#{YHIv7KQc2e7.zogrUrI7Crs}>7 && #{YHIv7KQc2e7.iIC4YhgrxQY}/#{YHIv7KQc2e7.zogrUrI7Crs}<=8,1,0)+ if(#{rt9D47Inb49.iIC4YhgrxQY}/#{rt9D47Inb49.zogrUrI7Crs}>7 && #{rt9D47Inb49.iIC4YhgrxQY}/#{rt9D47Inb49.zogrUrI7Crs}<=8,1,0)+ if(#{i1iXbquZ5iv.iIC4YhgrxQY}/#{i1iXbquZ5iv.zogrUrI7Crs}>7 && #{i1iXbquZ5iv.iIC4YhgrxQY}/#{i1iXbquZ5iv.zogrUrI7Crs}<=8,1,0)+ if(#{RcE30WBKrXI.iIC4YhgrxQY}/#{RcE30WBKrXI.zogrUrI7Crs}>7 && #{RcE30WBKrXI.iIC4YhgrxQY}/#{RcE30WBKrXI.zogrUrI7Crs}<=8,1,0)+ if(#{EAG0GfdSMAs.iIC4YhgrxQY}/#{EAG0GfdSMAs.zogrUrI7Crs}>7 && #{EAG0GfdSMAs.iIC4YhgrxQY}/#{EAG0GfdSMAs.zogrUrI7Crs}<=8,1,0)+ if(#{N2aXs7VlJdJ.iIC4YhgrxQY}/#{N2aXs7VlJdJ.zogrUrI7Crs}>7 && #{N2aXs7VlJdJ.iIC4YhgrxQY}/#{N2aXs7VlJdJ.zogrUrI7Crs}<=8,1,0)+ if(#{xrjnOtFFTRC.iIC4YhgrxQY}/#{xrjnOtFFTRC.zogrUrI7Crs}>7 && #{xrjnOtFFTRC.iIC4YhgrxQY}/#{xrjnOtFFTRC.zogrUrI7Crs}<=8,1,0)Edit denominator:
Description: "7-8 months - MSR - Denominator"
Calculation: "1"13 8-9 months - MSR
For each item the Indicator returns "1" if the stock coverage time is greater than or equal to 8 but less than 9 and otherwise returns 0and then adds up these results for calculating the number of items with a stock coverage time of 8-9 months.Name (*): "8-9 months - MSR"
Short Name (*): "8-9 months - MSR"
Description: "Number of items with a coverage time of 8-9 months"
Decimals in data output: "0"
Indicator type (*): "Number (Factor 1)"
Edit numerator:Description: "8-9 months - MSR - Numerator"
Calculation:
if(#{LNAkkMTxqEW.iIC4YhgrxQY}/#{LNAkkMTxqEW.zogrUrI7Crs}>7 && #{LNAkkMTxqEW.iIC4YhgrxQY}/#{LNAkkMTxqEW.zogrUrI7Crs}<=8,1,0)+ if(#{WyDZKSw82X6.iIC4YhgrxQY}/#{WyDZKSw82X6.zogrUrI7Crs}>7 && #{WyDZKSw82X6.iIC4YhgrxQY}/#{WyDZKSw82X6.zogrUrI7Crs}<=8,1,0)+ if(#{JPccVwAGRq9.iIC4YhgrxQY}/#{JPccVwAGRq9.zogrUrI7Crs}>7 && #{JPccVwAGRq9.iIC4YhgrxQY}/#{JPccVwAGRq9.zogrUrI7Crs}<=8,1,0)+ if(#{smxJz7Mt6ia.iIC4YhgrxQY}/#{smxJz7Mt6ia.zogrUrI7Crs}>7 && #{smxJz7Mt6ia.iIC4YhgrxQY}/#{smxJz7Mt6ia.zogrUrI7Crs}<=8,1,0)+ if(#{AaIApgGQM6t.iIC4YhgrxQY}/#{AaIApgGQM6t.zogrUrI7Crs}>7 && #{AaIApgGQM6t.iIC4YhgrxQY}/#{AaIApgGQM6t.zogrUrI7Crs}<=8,1,0)+ if(#{vCTrmv52APd.iIC4YhgrxQY}/#{vCTrmv52APd.zogrUrI7Crs}>7 && #{vCTrmv52APd.iIC4YhgrxQY}/#{vCTrmv52APd.zogrUrI7Crs}<=8,1,0)+ if(#{SOw2TcuFFH2.iIC4YhgrxQY}/#{SOw2TcuFFH2.zogrUrI7Crs}>7 && #{SOw2TcuFFH2.iIC4YhgrxQY}/#{SOw2TcuFFH2.zogrUrI7Crs}<=8,1,0)+ if(#{RSIOx2u07Ln.iIC4YhgrxQY}/#{RSIOx2u07Ln.zogrUrI7Crs}>7 && #{RSIOx2u07Ln.iIC4YhgrxQY}/#{RSIOx2u07Ln.zogrUrI7Crs}<=8,1,0)+ if(#{JStiDyaPfqy.iIC4YhgrxQY}/#{JStiDyaPfqy.zogrUrI7Crs}>7 && #{JStiDyaPfqy.iIC4YhgrxQY}/#{JStiDyaPfqy.zogrUrI7Crs}<=8,1,0)+ if(#{hZ1YvdcTDQM.iIC4YhgrxQY}/#{hZ1YvdcTDQM.zogrUrI7Crs}>7 && #{hZ1YvdcTDQM.iIC4YhgrxQY}/#{hZ1YvdcTDQM.zogrUrI7Crs}<=8,1,0)+ if(#{tsi32D8HQd5.iIC4YhgrxQY}/#{tsi32D8HQd5.zogrUrI7Crs}>7 && #{tsi32D8HQd5.iIC4YhgrxQY}/#{tsi32D8HQd5.zogrUrI7Crs}<=8,1,0)+ if(#{QWlPF8S0gCc.iIC4YhgrxQY}/#{QWlPF8S0gCc.zogrUrI7Crs}>7 && #{QWlPF8S0gCc.iIC4YhgrxQY}/#{QWlPF8S0gCc.zogrUrI7Crs}<=8,1,0)+ if(#{a5uLTDt12eT.iIC4YhgrxQY}/#{a5uLTDt12eT.zogrUrI7Crs}>7 && #{a5uLTDt12eT.iIC4YhgrxQY}/#{a5uLTDt12eT.zogrUrI7Crs}<=8,1,0)+ if(#{U0AfOOyJMy2.iIC4YhgrxQY}/#{U0AfOOyJMy2.zogrUrI7Crs}>7 && #{U0AfOOyJMy2.iIC4YhgrxQY}/#{U0AfOOyJMy2.zogrUrI7Crs}<=8,1,0)+ if(#{cyf6UdScfFM.iIC4YhgrxQY}/#{cyf6UdScfFM.zogrUrI7Crs}>7 && #{cyf6UdScfFM.iIC4YhgrxQY}/#{cyf6UdScfFM.zogrUrI7Crs}<=8,1,0)+ if(#{FeUTTNHpVzD.iIC4YhgrxQY}/#{FeUTTNHpVzD.zogrUrI7Crs}>7 && #{FeUTTNHpVzD.iIC4YhgrxQY}/#{FeUTTNHpVzD.zogrUrI7Crs}<=8,1,0)+ if(#{mKSICD1rxG4.iIC4YhgrxQY}/#{mKSICD1rxG4.zogrUrI7Crs}>7 && #{mKSICD1rxG4.iIC4YhgrxQY}/#{mKSICD1rxG4.zogrUrI7Crs}<=8,1,0)+ if(#{mVNe1aS1pGl.iIC4YhgrxQY}/#{mVNe1aS1pGl.zogrUrI7Crs}>7 && #{mVNe1aS1pGl.iIC4YhgrxQY}/#{mVNe1aS1pGl.zogrUrI7Crs}<=8,1,0)+ if(#{oLAXTZY6ken.iIC4YhgrxQY}/#{oLAXTZY6ken.zogrUrI7Crs}>7 && #{oLAXTZY6ken.iIC4YhgrxQY}/#{oLAXTZY6ken.zogrUrI7Crs}<=8,1,0)+ if(#{YYaRDUZyH9L.iIC4YhgrxQY}/#{YYaRDUZyH9L.zogrUrI7Crs}>7 && #{YYaRDUZyH9L.iIC4YhgrxQY}/#{YYaRDUZyH9L.zogrUrI7Crs}<=8,1,0)+ if(#{HVteopBt0jr.iIC4YhgrxQY}/#{HVteopBt0jr.zogrUrI7Crs}>7 && #{HVteopBt0jr.iIC4YhgrxQY}/#{HVteopBt0jr.zogrUrI7Crs}<=8,1,0)+ if(#{sWodd2tbjgZ.iIC4YhgrxQY}/#{sWodd2tbjgZ.zogrUrI7Crs}>7 && #{sWodd2tbjgZ.iIC4YhgrxQY}/#{sWodd2tbjgZ.zogrUrI7Crs}<=8,1,0)+ if(#{yVYajDDYUfX.iIC4YhgrxQY}/#{yVYajDDYUfX.zogrUrI7Crs}>7 && #{yVYajDDYUfX.iIC4YhgrxQY}/#{yVYajDDYUfX.zogrUrI7Crs}<=8,1,0)+ if(#{eTJAr4sc83v.iIC4YhgrxQY}/#{eTJAr4sc83v.zogrUrI7Crs}>7 && #{eTJAr4sc83v.iIC4YhgrxQY}/#{eTJAr4sc83v.zogrUrI7Crs}<=8,1,0)+ if(#{U4KSmanl4JP.iIC4YhgrxQY}/#{U4KSmanl4JP.zogrUrI7Crs}>7 && #{U4KSmanl4JP.iIC4YhgrxQY}/#{U4KSmanl4JP.zogrUrI7Crs}<=8,1,0)+ if(#{FXsa5uG3IGn.iIC4YhgrxQY}/#{FXsa5uG3IGn.zogrUrI7Crs}>7 && #{FXsa5uG3IGn.iIC4YhgrxQY}/#{FXsa5uG3IGn.zogrUrI7Crs}<=8,1,0)+ if(#{L34T9YDtCor.iIC4YhgrxQY}/#{L34T9YDtCor.zogrUrI7Crs}>7 && #{L34T9YDtCor.iIC4YhgrxQY}/#{L34T9YDtCor.zogrUrI7Crs}<=8,1,0)+ if(#{W5mHXhSYFfQ.iIC4YhgrxQY}/#{W5mHXhSYFfQ.zogrUrI7Crs}>7 && #{W5mHXhSYFfQ.iIC4YhgrxQY}/#{W5mHXhSYFfQ.zogrUrI7Crs}<=8,1,0)+ if(#{cmSUyJOZwyl.iIC4YhgrxQY}/#{cmSUyJOZwyl.zogrUrI7Crs}>7 && #{cmSUyJOZwyl.iIC4YhgrxQY}/#{cmSUyJOZwyl.zogrUrI7Crs}<=8,1,0)+ if(#{cT8sfosRXvU.iIC4YhgrxQY}/#{cT8sfosRXvU.zogrUrI7Crs}>7 && #{cT8sfosRXvU.iIC4YhgrxQY}/#{cT8sfosRXvU.zogrUrI7Crs}<=8,1,0)+ if(#{OaWKnMS7say.iIC4YhgrxQY}/#{OaWKnMS7say.zogrUrI7Crs}>7 && #{OaWKnMS7say.iIC4YhgrxQY}/#{OaWKnMS7say.zogrUrI7Crs}<=8,1,0)+ if(#{Z4bjHvGS6aH.iIC4YhgrxQY}/#{Z4bjHvGS6aH.zogrUrI7Crs}>7 && #{Z4bjHvGS6aH.iIC4YhgrxQY}/#{Z4bjHvGS6aH.zogrUrI7Crs}<=8,1,0)+ if(#{Nn1L7CNEtC8.iIC4YhgrxQY}/#{Nn1L7CNEtC8.zogrUrI7Crs}>7 && #{Nn1L7CNEtC8.iIC4YhgrxQY}/#{Nn1L7CNEtC8.zogrUrI7Crs}<=8,1,0)+ if(#{RNYKSc3nAUg.iIC4YhgrxQY}/#{RNYKSc3nAUg.zogrUrI7Crs}>7 && #{RNYKSc3nAUg.iIC4YhgrxQY}/#{RNYKSc3nAUg.zogrUrI7Crs}<=8,1,0)+ if(#{PtmZ9XqpPKi.iIC4YhgrxQY}/#{PtmZ9XqpPKi.zogrUrI7Crs}>7 && #{PtmZ9XqpPKi.iIC4YhgrxQY}/#{PtmZ9XqpPKi.zogrUrI7Crs}<=8,1,0)+ if(#{CohlLHi54B0.iIC4YhgrxQY}/#{CohlLHi54B0.zogrUrI7Crs}>7 && #{CohlLHi54B0.iIC4YhgrxQY}/#{CohlLHi54B0.zogrUrI7Crs}<=8,1,0)+ if(#{Gu6u82RD9OW.iIC4YhgrxQY}/#{Gu6u82RD9OW.zogrUrI7Crs}>7 && #{Gu6u82RD9OW.iIC4YhgrxQY}/#{Gu6u82RD9OW.zogrUrI7Crs}<=8,1,0)+ if(#{LiuYzxYr4Pt.iIC4YhgrxQY}/#{LiuYzxYr4Pt.zogrUrI7Crs}>7 && #{LiuYzxYr4Pt.iIC4YhgrxQY}/#{LiuYzxYr4Pt.zogrUrI7Crs}<=8,1,0)+ if(#{Tje33nJAG55.iIC4YhgrxQY}/#{Tje33nJAG55.zogrUrI7Crs}>7 && #{Tje33nJAG55.iIC4YhgrxQY}/#{Tje33nJAG55.zogrUrI7Crs}<=8,1,0)+ if(#{euM2dlqleYH.iIC4YhgrxQY}/#{euM2dlqleYH.zogrUrI7Crs}>7 && #{euM2dlqleYH.iIC4YhgrxQY}/#{euM2dlqleYH.zogrUrI7Crs}<=8,1,0)+ if(#{dASLmBTEehF.iIC4YhgrxQY}/#{dASLmBTEehF.zogrUrI7Crs}>7 && #{dASLmBTEehF.iIC4YhgrxQY}/#{dASLmBTEehF.zogrUrI7Crs}<=8,1,0)+ if(#{qU2LvzoPn1z.iIC4YhgrxQY}/#{qU2LvzoPn1z.zogrUrI7Crs}>7 && #{qU2LvzoPn1z.iIC4YhgrxQY}/#{qU2LvzoPn1z.zogrUrI7Crs}<=8,1,0)+ if(#{OkWaFxdUQY2.iIC4YhgrxQY}/#{OkWaFxdUQY2.zogrUrI7Crs}>7 && #{OkWaFxdUQY2.iIC4YhgrxQY}/#{OkWaFxdUQY2.zogrUrI7Crs}<=8,1,0)+ if(#{YHIv7KQc2e7.iIC4YhgrxQY}/#{YHIv7KQc2e7.zogrUrI7Crs}>7 && #{YHIv7KQc2e7.iIC4YhgrxQY}/#{YHIv7KQc2e7.zogrUrI7Crs}<=8,1,0)+ if(#{rt9D47Inb49.iIC4YhgrxQY}/#{rt9D47Inb49.zogrUrI7Crs}>7 && #{rt9D47Inb49.iIC4YhgrxQY}/#{rt9D47Inb49.zogrUrI7Crs}<=8,1,0)+ if(#{i1iXbquZ5iv.iIC4YhgrxQY}/#{i1iXbquZ5iv.zogrUrI7Crs}>7 && #{i1iXbquZ5iv.iIC4YhgrxQY}/#{i1iXbquZ5iv.zogrUrI7Crs}<=8,1,0)+ if(#{RcE30WBKrXI.iIC4YhgrxQY}/#{RcE30WBKrXI.zogrUrI7Crs}>7 && #{RcE30WBKrXI.iIC4YhgrxQY}/#{RcE30WBKrXI.zogrUrI7Crs}<=8,1,0)+ if(#{EAG0GfdSMAs.iIC4YhgrxQY}/#{EAG0GfdSMAs.zogrUrI7Crs}>7 && #{EAG0GfdSMAs.iIC4YhgrxQY}/#{EAG0GfdSMAs.zogrUrI7Crs}<=8,1,0)+ if(#{N2aXs7VlJdJ.iIC4YhgrxQY}/#{N2aXs7VlJdJ.zogrUrI7Crs}>7 && #{N2aXs7VlJdJ.iIC4YhgrxQY}/#{N2aXs7VlJdJ.zogrUrI7Crs}<=8,1,0)+ if(#{xrjnOtFFTRC.iIC4YhgrxQY}/#{xrjnOtFFTRC.zogrUrI7Crs}>7 && #{xrjnOtFFTRC.iIC4YhgrxQY}/#{xrjnOtFFTRC.zogrUrI7Crs}<=8,1,0)Edit denominator:
Description: "8-9 months - MSR - Denominator"
Calculation: "1"14 9-10 months - MSR
For each item the Indicator returns "1" if the stock coverage time is greater than or equal to 9 but less than 10 and otherwise returns 0 and then adds up these results for calculating the number of items with a stock coverage time of 9-10 months.Name (*): "9-10 months - MSR"
Short Name (*): "9-10 months - MSR"
Description: "Number of items with a coverage time of 9-10 months"
Decimals in data output: "0"
Indicator type (*): "Number (Factor 1)"
Edit numerator:Description: "9-10 months - MSR - Numerator"
Calculation:
if(#{LNAkkMTxqEW.iIC4YhgrxQY}/#{LNAkkMTxqEW.zogrUrI7Crs}>9 && #{LNAkkMTxqEW.iIC4YhgrxQY}/#{LNAkkMTxqEW.zogrUrI7Crs}<=10,1,0)+ if(#{WyDZKSw82X6.iIC4YhgrxQY}/#{WyDZKSw82X6.zogrUrI7Crs}>9 && #{WyDZKSw82X6.iIC4YhgrxQY}/#{WyDZKSw82X6.zogrUrI7Crs}<=10,1,0)+ if(#{JPccVwAGRq9.iIC4YhgrxQY}/#{JPccVwAGRq9.zogrUrI7Crs}>9 && #{JPccVwAGRq9.iIC4YhgrxQY}/#{JPccVwAGRq9.zogrUrI7Crs}<=10,1,0)+ if(#{smxJz7Mt6ia.iIC4YhgrxQY}/#{smxJz7Mt6ia.zogrUrI7Crs}>9 && #{smxJz7Mt6ia.iIC4YhgrxQY}/#{smxJz7Mt6ia.zogrUrI7Crs}<=10,1,0)+ if(#{AaIApgGQM6t.iIC4YhgrxQY}/#{AaIApgGQM6t.zogrUrI7Crs}>9 && #{AaIApgGQM6t.iIC4YhgrxQY}/#{AaIApgGQM6t.zogrUrI7Crs}<=10,1,0)+ if(#{vCTrmv52APd.iIC4YhgrxQY}/#{vCTrmv52APd.zogrUrI7Crs}>9 && #{vCTrmv52APd.iIC4YhgrxQY}/#{vCTrmv52APd.zogrUrI7Crs}<=10,1,0)+ if(#{SOw2TcuFFH2.iIC4YhgrxQY}/#{SOw2TcuFFH2.zogrUrI7Crs}>9 && #{SOw2TcuFFH2.iIC4YhgrxQY}/#{SOw2TcuFFH2.zogrUrI7Crs}<=10,1,0)+ if(#{RSIOx2u07Ln.iIC4YhgrxQY}/#{RSIOx2u07Ln.zogrUrI7Crs}>9 && #{RSIOx2u07Ln.iIC4YhgrxQY}/#{RSIOx2u07Ln.zogrUrI7Crs}<=10,1,0)+ if(#{JStiDyaPfqy.iIC4YhgrxQY}/#{JStiDyaPfqy.zogrUrI7Crs}>9 && #{JStiDyaPfqy.iIC4YhgrxQY}/#{JStiDyaPfqy.zogrUrI7Crs}<=10,1,0)+ if(#{hZ1YvdcTDQM.iIC4YhgrxQY}/#{hZ1YvdcTDQM.zogrUrI7Crs}>9 && #{hZ1YvdcTDQM.iIC4YhgrxQY}/#{hZ1YvdcTDQM.zogrUrI7Crs}<=10,1,0)+ if(#{tsi32D8HQd5.iIC4YhgrxQY}/#{tsi32D8HQd5.zogrUrI7Crs}>9 && #{tsi32D8HQd5.iIC4YhgrxQY}/#{tsi32D8HQd5.zogrUrI7Crs}<=10,1,0)+ if(#{QWlPF8S0gCc.iIC4YhgrxQY}/#{QWlPF8S0gCc.zogrUrI7Crs}>9 && #{QWlPF8S0gCc.iIC4YhgrxQY}/#{QWlPF8S0gCc.zogrUrI7Crs}<=10,1,0)+ if(#{a5uLTDt12eT.iIC4YhgrxQY}/#{a5uLTDt12eT.zogrUrI7Crs}>9 && #{a5uLTDt12eT.iIC4YhgrxQY}/#{a5uLTDt12eT.zogrUrI7Crs}<=10,1,0)+ if(#{U0AfOOyJMy2.iIC4YhgrxQY}/#{U0AfOOyJMy2.zogrUrI7Crs}>9 && #{U0AfOOyJMy2.iIC4YhgrxQY}/#{U0AfOOyJMy2.zogrUrI7Crs}<=10,1,0)+ if(#{cyf6UdScfFM.iIC4YhgrxQY}/#{cyf6UdScfFM.zogrUrI7Crs}>9 && #{cyf6UdScfFM.iIC4YhgrxQY}/#{cyf6UdScfFM.zogrUrI7Crs}<=10,1,0)+ if(#{FeUTTNHpVzD.iIC4YhgrxQY}/#{FeUTTNHpVzD.zogrUrI7Crs}>9 && #{FeUTTNHpVzD.iIC4YhgrxQY}/#{FeUTTNHpVzD.zogrUrI7Crs}<=10,1,0)+ if(#{mKSICD1rxG4.iIC4YhgrxQY}/#{mKSICD1rxG4.zogrUrI7Crs}>9 && #{mKSICD1rxG4.iIC4YhgrxQY}/#{mKSICD1rxG4.zogrUrI7Crs}<=10,1,0)+ if(#{mVNe1aS1pGl.iIC4YhgrxQY}/#{mVNe1aS1pGl.zogrUrI7Crs}>9 && #{mVNe1aS1pGl.iIC4YhgrxQY}/#{mVNe1aS1pGl.zogrUrI7Crs}<=10,1,0)+ if(#{oLAXTZY6ken.iIC4YhgrxQY}/#{oLAXTZY6ken.zogrUrI7Crs}>9 && #{oLAXTZY6ken.iIC4YhgrxQY}/#{oLAXTZY6ken.zogrUrI7Crs}<=10,1,0)+ if(#{YYaRDUZyH9L.iIC4YhgrxQY}/#{YYaRDUZyH9L.zogrUrI7Crs}>9 && #{YYaRDUZyH9L.iIC4YhgrxQY}/#{YYaRDUZyH9L.zogrUrI7Crs}<=10,1,0)+ if(#{HVteopBt0jr.iIC4YhgrxQY}/#{HVteopBt0jr.zogrUrI7Crs}>9 && #{HVteopBt0jr.iIC4YhgrxQY}/#{HVteopBt0jr.zogrUrI7Crs}<=10,1,0)+ if(#{sWodd2tbjgZ.iIC4YhgrxQY}/#{sWodd2tbjgZ.zogrUrI7Crs}>9 && #{sWodd2tbjgZ.iIC4YhgrxQY}/#{sWodd2tbjgZ.zogrUrI7Crs}<=10,1,0)+ if(#{yVYajDDYUfX.iIC4YhgrxQY}/#{yVYajDDYUfX.zogrUrI7Crs}>9 && #{yVYajDDYUfX.iIC4YhgrxQY}/#{yVYajDDYUfX.zogrUrI7Crs}<=10,1,0)+ if(#{eTJAr4sc83v.iIC4YhgrxQY}/#{eTJAr4sc83v.zogrUrI7Crs}>9 && #{eTJAr4sc83v.iIC4YhgrxQY}/#{eTJAr4sc83v.zogrUrI7Crs}<=10,1,0)+ if(#{U4KSmanl4JP.iIC4YhgrxQY}/#{U4KSmanl4JP.zogrUrI7Crs}>9 && #{U4KSmanl4JP.iIC4YhgrxQY}/#{U4KSmanl4JP.zogrUrI7Crs}<=10,1,0)+ if(#{FXsa5uG3IGn.iIC4YhgrxQY}/#{FXsa5uG3IGn.zogrUrI7Crs}>9 && #{FXsa5uG3IGn.iIC4YhgrxQY}/#{FXsa5uG3IGn.zogrUrI7Crs}<=10,1,0)+ if(#{L34T9YDtCor.iIC4YhgrxQY}/#{L34T9YDtCor.zogrUrI7Crs}>9 && #{L34T9YDtCor.iIC4YhgrxQY}/#{L34T9YDtCor.zogrUrI7Crs}<=10,1,0)+ if(#{W5mHXhSYFfQ.iIC4YhgrxQY}/#{W5mHXhSYFfQ.zogrUrI7Crs}>9 && #{W5mHXhSYFfQ.iIC4YhgrxQY}/#{W5mHXhSYFfQ.zogrUrI7Crs}<=10,1,0)+ if(#{cmSUyJOZwyl.iIC4YhgrxQY}/#{cmSUyJOZwyl.zogrUrI7Crs}>9 && #{cmSUyJOZwyl.iIC4YhgrxQY}/#{cmSUyJOZwyl.zogrUrI7Crs}<=10,1,0)+ if(#{cT8sfosRXvU.iIC4YhgrxQY}/#{cT8sfosRXvU.zogrUrI7Crs}>9 && #{cT8sfosRXvU.iIC4YhgrxQY}/#{cT8sfosRXvU.zogrUrI7Crs}<=10,1,0)+ if(#{OaWKnMS7say.iIC4YhgrxQY}/#{OaWKnMS7say.zogrUrI7Crs}>9 && #{OaWKnMS7say.iIC4YhgrxQY}/#{OaWKnMS7say.zogrUrI7Crs}<=10,1,0)+ if(#{Z4bjHvGS6aH.iIC4YhgrxQY}/#{Z4bjHvGS6aH.zogrUrI7Crs}>9 && #{Z4bjHvGS6aH.iIC4YhgrxQY}/#{Z4bjHvGS6aH.zogrUrI7Crs}<=10,1,0)+ if(#{Nn1L7CNEtC8.iIC4YhgrxQY}/#{Nn1L7CNEtC8.zogrUrI7Crs}>9 && #{Nn1L7CNEtC8.iIC4YhgrxQY}/#{Nn1L7CNEtC8.zogrUrI7Crs}<=10,1,0)+ if(#{RNYKSc3nAUg.iIC4YhgrxQY}/#{RNYKSc3nAUg.zogrUrI7Crs}>9 && #{RNYKSc3nAUg.iIC4YhgrxQY}/#{RNYKSc3nAUg.zogrUrI7Crs}<=10,1,0)+ if(#{PtmZ9XqpPKi.iIC4YhgrxQY}/#{PtmZ9XqpPKi.zogrUrI7Crs}>9 && #{PtmZ9XqpPKi.iIC4YhgrxQY}/#{PtmZ9XqpPKi.zogrUrI7Crs}<=10,1,0)+ if(#{CohlLHi54B0.iIC4YhgrxQY}/#{CohlLHi54B0.zogrUrI7Crs}>9 && #{CohlLHi54B0.iIC4YhgrxQY}/#{CohlLHi54B0.zogrUrI7Crs}<=10,1,0)+ if(#{Gu6u82RD9OW.iIC4YhgrxQY}/#{Gu6u82RD9OW.zogrUrI7Crs}>9 && #{Gu6u82RD9OW.iIC4YhgrxQY}/#{Gu6u82RD9OW.zogrUrI7Crs}<=10,1,0)+ if(#{LiuYzxYr4Pt.iIC4YhgrxQY}/#{LiuYzxYr4Pt.zogrUrI7Crs}>9 && #{LiuYzxYr4Pt.iIC4YhgrxQY}/#{LiuYzxYr4Pt.zogrUrI7Crs}<=10,1,0)+ if(#{Tje33nJAG55.iIC4YhgrxQY}/#{Tje33nJAG55.zogrUrI7Crs}>9 && #{Tje33nJAG55.iIC4YhgrxQY}/#{Tje33nJAG55.zogrUrI7Crs}<=10,1,0)+ if(#{euM2dlqleYH.iIC4YhgrxQY}/#{euM2dlqleYH.zogrUrI7Crs}>9 && #{euM2dlqleYH.iIC4YhgrxQY}/#{euM2dlqleYH.zogrUrI7Crs}<=10,1,0)+ if(#{dASLmBTEehF.iIC4YhgrxQY}/#{dASLmBTEehF.zogrUrI7Crs}>9 && #{dASLmBTEehF.iIC4YhgrxQY}/#{dASLmBTEehF.zogrUrI7Crs}<=10,1,0)+ if(#{qU2LvzoPn1z.iIC4YhgrxQY}/#{qU2LvzoPn1z.zogrUrI7Crs}>9 && #{qU2LvzoPn1z.iIC4YhgrxQY}/#{qU2LvzoPn1z.zogrUrI7Crs}<=10,1,0)+ if(#{OkWaFxdUQY2.iIC4YhgrxQY}/#{OkWaFxdUQY2.zogrUrI7Crs}>9 && #{OkWaFxdUQY2.iIC4YhgrxQY}/#{OkWaFxdUQY2.zogrUrI7Crs}<=10,1,0)+ if(#{YHIv7KQc2e7.iIC4YhgrxQY}/#{YHIv7KQc2e7.zogrUrI7Crs}>9 && #{YHIv7KQc2e7.iIC4YhgrxQY}/#{YHIv7KQc2e7.zogrUrI7Crs}<=10,1,0)+ if(#{rt9D47Inb49.iIC4YhgrxQY}/#{rt9D47Inb49.zogrUrI7Crs}>9 && #{rt9D47Inb49.iIC4YhgrxQY}/#{rt9D47Inb49.zogrUrI7Crs}<=10,1,0)+ if(#{i1iXbquZ5iv.iIC4YhgrxQY}/#{i1iXbquZ5iv.zogrUrI7Crs}>9 && #{i1iXbquZ5iv.iIC4YhgrxQY}/#{i1iXbquZ5iv.zogrUrI7Crs}<=10,1,0)+ if(#{RcE30WBKrXI.iIC4YhgrxQY}/#{RcE30WBKrXI.zogrUrI7Crs}>9 && #{RcE30WBKrXI.iIC4YhgrxQY}/#{RcE30WBKrXI.zogrUrI7Crs}<=10,1,0)+ if(#{EAG0GfdSMAs.iIC4YhgrxQY}/#{EAG0GfdSMAs.zogrUrI7Crs}>9 && #{EAG0GfdSMAs.iIC4YhgrxQY}/#{EAG0GfdSMAs.zogrUrI7Crs}<=10,1,0)+ if(#{N2aXs7VlJdJ.iIC4YhgrxQY}/#{N2aXs7VlJdJ.zogrUrI7Crs}>9 && #{N2aXs7VlJdJ.iIC4YhgrxQY}/#{N2aXs7VlJdJ.zogrUrI7Crs}<=10,1,0)+ if(#{xrjnOtFFTRC.iIC4YhgrxQY}/#{xrjnOtFFTRC.zogrUrI7Crs}>9 && #{xrjnOtFFTRC.iIC4YhgrxQY}/#{xrjnOtFFTRC.zogrUrI7Crs}<=10,1,0)Edit denominator:
Description: "9-10 months - MSR - Denominator"
Calculation: "1"15 >=3 years
For each item the Indicator returns "1" if the stock coverage time is greater than 36 and otherwise returns 0 and then adds up these results for calculating the number of items with a stock coverage time of 36 months or greater.Name (*): ">=3 years"
Short Name (*): ">=3 years - MSR"
Description: "Number of items with a coverage time greater than 3 years"
Decimals in data output: "0"
Indicator type (*): "Number (Factor 1)"
Edit numerator:Description: ">03 years - MSR - Numerator"
Calculation:
if(#{LNAkkMTxqEW.iIC4YhgrxQY}/#{LNAkkMTxqEW.zogrUrI7Crs}>36,1,0)+ if(#{WyDZKSw82X6.iIC4YhgrxQY}/#{WyDZKSw82X6.zogrUrI7Crs}>36,1,0)+ if(#{JPccVwAGRq9.iIC4YhgrxQY}/#{JPccVwAGRq9.zogrUrI7Crs}>36,1,0)+ if(#{smxJz7Mt6ia.iIC4YhgrxQY}/#{smxJz7Mt6ia.zogrUrI7Crs}>36,1,0)+ if(#{AaIApgGQM6t.iIC4YhgrxQY}/#{AaIApgGQM6t.zogrUrI7Crs}>36,1,0)+ if(#{vCTrmv52APd.iIC4YhgrxQY}/#{vCTrmv52APd.zogrUrI7Crs}>36,1,0)+ if(#{SOw2TcuFFH2.iIC4YhgrxQY}/#{SOw2TcuFFH2.zogrUrI7Crs}>36,1,0)+ if(#{RSIOx2u07Ln.iIC4YhgrxQY}/#{RSIOx2u07Ln.zogrUrI7Crs}>36,1,0)+ if(#{JStiDyaPfqy.iIC4YhgrxQY}/#{JStiDyaPfqy.zogrUrI7Crs}>36,1,0)+ if(#{hZ1YvdcTDQM.iIC4YhgrxQY}/#{hZ1YvdcTDQM.zogrUrI7Crs}>36,1,0)+ if(#{tsi32D8HQd5.iIC4YhgrxQY}/#{tsi32D8HQd5.zogrUrI7Crs}>36,1,0)+ if(#{QWlPF8S0gCc.iIC4YhgrxQY}/#{QWlPF8S0gCc.zogrUrI7Crs}>36,1,0)+ if(#{a5uLTDt12eT.iIC4YhgrxQY}/#{a5uLTDt12eT.zogrUrI7Crs}>36,1,0)+ if(#{U0AfOOyJMy2.iIC4YhgrxQY}/#{U0AfOOyJMy2.zogrUrI7Crs}>36,1,0)+ if(#{cyf6UdScfFM.iIC4YhgrxQY}/#{cyf6UdScfFM.zogrUrI7Crs}>36,1,0)+ if(#{FeUTTNHpVzD.iIC4YhgrxQY}/#{FeUTTNHpVzD.zogrUrI7Crs}>36,1,0)+ if(#{mKSICD1rxG4.iIC4YhgrxQY}/#{mKSICD1rxG4.zogrUrI7Crs}>36,1,0)+ if(#{mVNe1aS1pGl.iIC4YhgrxQY}/#{mVNe1aS1pGl.zogrUrI7Crs}>36,1,0)+ if(#{oLAXTZY6ken.iIC4YhgrxQY}/#{oLAXTZY6ken.zogrUrI7Crs}>36,1,0)+ if(#{YYaRDUZyH9L.iIC4YhgrxQY}/#{YYaRDUZyH9L.zogrUrI7Crs}>36,1,0)+ if(#{HVteopBt0jr.iIC4YhgrxQY}/#{HVteopBt0jr.zogrUrI7Crs}>36,1,0)+ if(#{sWodd2tbjgZ.iIC4YhgrxQY}/#{sWodd2tbjgZ.zogrUrI7Crs}>36,1,0)+ if(#{yVYajDDYUfX.iIC4YhgrxQY}/#{yVYajDDYUfX.zogrUrI7Crs}>36,1,0)+ if(#{eTJAr4sc83v.iIC4YhgrxQY}/#{eTJAr4sc83v.zogrUrI7Crs}>36,1,0)+ if(#{U4KSmanl4JP.iIC4YhgrxQY}/#{U4KSmanl4JP.zogrUrI7Crs}>36,1,0)+ if(#{FXsa5uG3IGn.iIC4YhgrxQY}/#{FXsa5uG3IGn.zogrUrI7Crs}>36,1,0)+ if(#{L34T9YDtCor.iIC4YhgrxQY}/#{L34T9YDtCor.zogrUrI7Crs}>36,1,0)+ if(#{W5mHXhSYFfQ.iIC4YhgrxQY}/#{W5mHXhSYFfQ.zogrUrI7Crs}>36,1,0)+ if(#{cmSUyJOZwyl.iIC4YhgrxQY}/#{cmSUyJOZwyl.zogrUrI7Crs}>36,1,0)+ if(#{cT8sfosRXvU.iIC4YhgrxQY}/#{cT8sfosRXvU.zogrUrI7Crs}>36,1,0)+ if(#{OaWKnMS7say.iIC4YhgrxQY}/#{OaWKnMS7say.zogrUrI7Crs}>36,1,0)+ if(#{Z4bjHvGS6aH.iIC4YhgrxQY}/#{Z4bjHvGS6aH.zogrUrI7Crs}>36,1,0)+ if(#{Nn1L7CNEtC8.iIC4YhgrxQY}/#{Nn1L7CNEtC8.zogrUrI7Crs}>36,1,0)+ if(#{RNYKSc3nAUg.iIC4YhgrxQY}/#{RNYKSc3nAUg.zogrUrI7Crs}>36,1,0)+ if(#{PtmZ9XqpPKi.iIC4YhgrxQY}/#{PtmZ9XqpPKi.zogrUrI7Crs}>36,1,0)+ if(#{CohlLHi54B0.iIC4YhgrxQY}/#{CohlLHi54B0.zogrUrI7Crs}>36,1,0)+ if(#{Gu6u82RD9OW.iIC4YhgrxQY}/#{Gu6u82RD9OW.zogrUrI7Crs}>36,1,0)+ if(#{LiuYzxYr4Pt.iIC4YhgrxQY}/#{LiuYzxYr4Pt.zogrUrI7Crs}>36,1,0)+ if(#{Tje33nJAG55.iIC4YhgrxQY}/#{Tje33nJAG55.zogrUrI7Crs}>36,1,0)+ if(#{euM2dlqleYH.iIC4YhgrxQY}/#{euM2dlqleYH.zogrUrI7Crs}>36,1,0)+ if(#{dASLmBTEehF.iIC4YhgrxQY}/#{dASLmBTEehF.zogrUrI7Crs}>36,1,0)+ if(#{qU2LvzoPn1z.iIC4YhgrxQY}/#{qU2LvzoPn1z.zogrUrI7Crs}>36,1,0)+ if(#{OkWaFxdUQY2.iIC4YhgrxQY}/#{OkWaFxdUQY2.zogrUrI7Crs}>36,1,0)+ if(#{YHIv7KQc2e7.iIC4YhgrxQY}/#{YHIv7KQc2e7.zogrUrI7Crs}>36,1,0)+ if(#{rt9D47Inb49.iIC4YhgrxQY}/#{rt9D47Inb49.zogrUrI7Crs}>36,1,0)+ if(#{i1iXbquZ5iv.iIC4YhgrxQY}/#{i1iXbquZ5iv.zogrUrI7Crs}>36,1,0)+ if(#{RcE30WBKrXI.iIC4YhgrxQY}/#{RcE30WBKrXI.zogrUrI7Crs}>36,1,0)+ if(#{EAG0GfdSMAs.iIC4YhgrxQY}/#{EAG0GfdSMAs.zogrUrI7Crs}>36,1,0)+ if(#{N2aXs7VlJdJ.iIC4YhgrxQY}/#{N2aXs7VlJdJ.zogrUrI7Crs}>36,1,0)+ if(#{xrjnOtFFTRC.iIC4YhgrxQY}/#{xrjnOtFFTRC.zogrUrI7Crs}>36,1,0)Edit denominator:
Description: ">= 3 years - MSR - Denominator"
Calculation: "1"16 Appropriate stock
The Indicator adds up the values in the data field "Appropriate stock" for calculating the number of items with appropriate stock coverage times.Name (*): "Appropriate stock"
Short Name (*): "Appropriate stock - MSR"
Description: "Number of items with an appropriate stock"
Decimals in data output: "0"
Indicator type (*): "Number (Factor 1)"
Edit numerator:Description: "Appropriate stock - MSR - Numerator"
Calculation:
#{LNAkkMTxqEW.pXfWqU8b96D}+ #{WyDZKSw82X6.pXfWqU8b96D}+ #{JPccVwAGRq9.pXfWqU8b96D}+ #{smxJz7Mt6ia.pXfWqU8b96D}+ #{AaIApgGQM6t.pXfWqU8b96D}+ #{vCTrmv52APd.pXfWqU8b96D}+ #{SOw2TcuFFH2.pXfWqU8b96D}+ #{RSIOx2u07Ln.pXfWqU8b96D}+ #{JStiDyaPfqy.pXfWqU8b96D}+ #{hZ1YvdcTDQM.pXfWqU8b96D}+ #{tsi32D8HQd5.pXfWqU8b96D}+ #{QWlPF8S0gCc.pXfWqU8b96D}+ #{a5uLTDt12eT.pXfWqU8b96D}+ #{U0AfOOyJMy2.pXfWqU8b96D}+ #{cyf6UdScfFM.pXfWqU8b96D}+ #{FeUTTNHpVzD.pXfWqU8b96D}+ #{mKSICD1rxG4.pXfWqU8b96D}+ #{mVNe1aS1pGl.pXfWqU8b96D}+ #{oLAXTZY6ken.pXfWqU8b96D}+ #{YYaRDUZyH9L.pXfWqU8b96D}+ #{HVteopBt0jr.pXfWqU8b96D}+ #{sWodd2tbjgZ.pXfWqU8b96D}+ #{yVYajDDYUfX.pXfWqU8b96D}+ #{eTJAr4sc83v.pXfWqU8b96D}+ #{U4KSmanl4JP.pXfWqU8b96D}+ #{FXsa5uG3IGn.pXfWqU8b96D}+ #{L34T9YDtCor.pXfWqU8b96D}+ #{W5mHXhSYFfQ.pXfWqU8b96D}+ #{cmSUyJOZwyl.pXfWqU8b96D}+ #{cT8sfosRXvU.pXfWqU8b96D}+ #{OaWKnMS7say.pXfWqU8b96D}+ #{Z4bjHvGS6aH.pXfWqU8b96D}+ #{Nn1L7CNEtC8.pXfWqU8b96D}+ #{RNYKSc3nAUg.pXfWqU8b96D}+ #{PtmZ9XqpPKi.pXfWqU8b96D}+ #{CohlLHi54B0.pXfWqU8b96D}+ #{Gu6u82RD9OW.pXfWqU8b96D}+ #{LiuYzxYr4Pt.pXfWqU8b96D}+ #{Tje33nJAG55.pXfWqU8b96D}+ #{euM2dlqleYH.pXfWqU8b96D}+ #{dASLmBTEehF.pXfWqU8b96D}+ #{qU2LvzoPn1z.pXfWqU8b96D}+ #{OkWaFxdUQY2.pXfWqU8b96D}+ #{YHIv7KQc2e7.pXfWqU8b96D}+ #{rt9D47Inb49.pXfWqU8b96D}+ #{i1iXbquZ5iv.pXfWqU8b96D}+ #{RcE30WBKrXI.pXfWqU8b96D}+ #{EAG0GfdSMAs.pXfWqU8b96D}+ #{N2aXs7VlJdJ.pXfWqU8b96D}+ #{xrjnOtFFTRC.pXfWqU8b96D}Edit denominator:
Description: "Appropriate stock - MSR - Denominator"
Calculation: "1"17 Excessive stock
The Indicator adds up the values in the data field "Appropriate stock" for calculating the number of items with excesssive stock coverage times.Name (*): "Excessive stock"
Short Name (*): "Excessive stock - MSR"
Description: "Number of items with excessive stock"
Decimals in data output: "0"
Indicator type (*): "Number (Factor 1)"
Edit numerator:Description: "Excessive stock - MSR - Numerator"
Calculation:
#{LNAkkMTxqEW.CVWVNV7y93Q}+ #{WyDZKSw82X6.CVWVNV7y93Q}+ #{JPccVwAGRq9.CVWVNV7y93Q}+ #{smxJz7Mt6ia.CVWVNV7y93Q}+ #{AaIApgGQM6t.CVWVNV7y93Q}+ #{vCTrmv52APd.CVWVNV7y93Q}+ #{SOw2TcuFFH2.CVWVNV7y93Q}+ #{RSIOx2u07Ln.CVWVNV7y93Q}+ #{JStiDyaPfqy.CVWVNV7y93Q}+ #{hZ1YvdcTDQM.CVWVNV7y93Q}+ #{tsi32D8HQd5.CVWVNV7y93Q}+ #{QWlPF8S0gCc.CVWVNV7y93Q}+ #{a5uLTDt12eT.CVWVNV7y93Q}+ #{U0AfOOyJMy2.CVWVNV7y93Q}+ #{cyf6UdScfFM.CVWVNV7y93Q}+ #{FeUTTNHpVzD.CVWVNV7y93Q}+ #{mKSICD1rxG4.CVWVNV7y93Q}+ #{mVNe1aS1pGl.CVWVNV7y93Q}+ #{oLAXTZY6ken.CVWVNV7y93Q}+ #{YYaRDUZyH9L.CVWVNV7y93Q}+ #{HVteopBt0jr.CVWVNV7y93Q}+ #{sWodd2tbjgZ.CVWVNV7y93Q}+ #{yVYajDDYUfX.CVWVNV7y93Q}+ #{eTJAr4sc83v.CVWVNV7y93Q}+ #{U4KSmanl4JP.CVWVNV7y93Q}+ #{FXsa5uG3IGn.CVWVNV7y93Q}+ #{L34T9YDtCor.CVWVNV7y93Q}+ #{W5mHXhSYFfQ.CVWVNV7y93Q}+ #{cmSUyJOZwyl.CVWVNV7y93Q}+ #{cT8sfosRXvU.CVWVNV7y93Q}+ #{OaWKnMS7say.CVWVNV7y93Q}+ #{Z4bjHvGS6aH.CVWVNV7y93Q}+ #{Nn1L7CNEtC8.CVWVNV7y93Q}+ #{RNYKSc3nAUg.CVWVNV7y93Q}+ #{PtmZ9XqpPKi.CVWVNV7y93Q}+ #{CohlLHi54B0.CVWVNV7y93Q}+ #{Gu6u82RD9OW.CVWVNV7y93Q}+ #{LiuYzxYr4Pt.CVWVNV7y93Q}+ #{Tje33nJAG55.CVWVNV7y93Q}+ #{euM2dlqleYH.CVWVNV7y93Q}+ #{dASLmBTEehF.CVWVNV7y93Q}+ #{qU2LvzoPn1z.CVWVNV7y93Q}+ #{OkWaFxdUQY2.CVWVNV7y93Q}+ #{YHIv7KQc2e7.CVWVNV7y93Q}+ #{rt9D47Inb49.CVWVNV7y93Q}+ #{i1iXbquZ5iv.CVWVNV7y93Q}+ #{RcE30WBKrXI.CVWVNV7y93Q}+ #{EAG0GfdSMAs.CVWVNV7y93Q}+ #{N2aXs7VlJdJ.CVWVNV7y93Q}+ #{xrjnOtFFTRC.CVWVNV7y93Q}Edit denominator:
Description: "Excessive stock - MSR - Denominator"
Calculation: "1"18 High variability
For each item the Indicator returns "1" if the coefficient of variation is greater than 10 and otherwise returns 0 and then adds up these results for calculating the number of items with a coefficient of variation of more than 10 (high variability). Note that the actual coefficient of variation is multiplied by 10.Name (*): "High variability"
Short Name (*): "High variability - MSR"
Description: "Number of items with a coefficient of variation between 0 and 5."
Decimals in data output: "0"
Indicator type (*): "Number (Factor 1)"
Edit numerator:Description: "High variability - Numerator"
Calculation:
if(#{LNAkkMTxqEW.U2tBADVisKH}>10,1,0)+ if(#{WyDZKSw82X6.U2tBADVisKH}>10,1,0)+ if(#{JPccVwAGRq9.U2tBADVisKH}>10,1,0)+ if(#{smxJz7Mt6ia.U2tBADVisKH}>10,1,0)+ if(#{AaIApgGQM6t.U2tBADVisKH}>10,1,0)+ if(#{vCTrmv52APd.U2tBADVisKH}>10,1,0)+ if(#{SOw2TcuFFH2.U2tBADVisKH}>10,1,0)+ if(#{RSIOx2u07Ln.U2tBADVisKH}>10,1,0)+ if(#{JStiDyaPfqy.U2tBADVisKH}>10,1,0)+ if(#{hZ1YvdcTDQM.U2tBADVisKH}>10,1,0)+ if(#{tsi32D8HQd5.U2tBADVisKH}>10,1,0)+ if(#{QWlPF8S0gCc.U2tBADVisKH}>10,1,0)+ if(#{a5uLTDt12eT.U2tBADVisKH}>10,1,0)+ if(#{U0AfOOyJMy2.U2tBADVisKH}>10,1,0)+ if(#{cyf6UdScfFM.U2tBADVisKH}>10,1,0)+ if(#{FeUTTNHpVzD.U2tBADVisKH}>10,1,0)+ if(#{mKSICD1rxG4.U2tBADVisKH}>10,1,0)+ if(#{mVNe1aS1pGl.U2tBADVisKH}>10,1,0)+ if(#{oLAXTZY6ken.U2tBADVisKH}>10,1,0)+ if(#{YYaRDUZyH9L.U2tBADVisKH}>10,1,0)+ if(#{HVteopBt0jr.U2tBADVisKH}>10,1,0)+ if(#{sWodd2tbjgZ.U2tBADVisKH}>10,1,0)+ if(#{yVYajDDYUfX.U2tBADVisKH}>10,1,0)+ if(#{eTJAr4sc83v.U2tBADVisKH}>10,1,0)+ if(#{U4KSmanl4JP.U2tBADVisKH}>10,1,0)+ if(#{FXsa5uG3IGn.U2tBADVisKH}>10,1,0)+ if(#{L34T9YDtCor.U2tBADVisKH}>10,1,0)+ if(#{W5mHXhSYFfQ.U2tBADVisKH}>10,1,0)+ if(#{cmSUyJOZwyl.U2tBADVisKH}>10,1,0)+ if(#{cT8sfosRXvU.U2tBADVisKH}>10,1,0)+ if(#{OaWKnMS7say.U2tBADVisKH}>10,1,0)+ if(#{Z4bjHvGS6aH.U2tBADVisKH}>10,1,0)+ if(#{Nn1L7CNEtC8.U2tBADVisKH}>10,1,0)+ if(#{RNYKSc3nAUg.U2tBADVisKH}>10,1,0)+ if(#{PtmZ9XqpPKi.U2tBADVisKH}>10,1,0)+ if(#{CohlLHi54B0.U2tBADVisKH}>10,1,0)+ if(#{Gu6u82RD9OW.U2tBADVisKH}>10,1,0)+ if(#{LiuYzxYr4Pt.U2tBADVisKH}>10,1,0)+ if(#{Tje33nJAG55.U2tBADVisKH}>10,1,0)+ if(#{euM2dlqleYH.U2tBADVisKH}>10,1,0)+ if(#{dASLmBTEehF.U2tBADVisKH}>10,1,0)+ if(#{qU2LvzoPn1z.U2tBADVisKH}>10,1,0)+ if(#{OkWaFxdUQY2.U2tBADVisKH}>10,1,0)+ if(#{YHIv7KQc2e7.U2tBADVisKH}>10,1,0)+ if(#{rt9D47Inb49.U2tBADVisKH}>10,1,0)+ if(#{i1iXbquZ5iv.U2tBADVisKH}>10,1,0)+ if(#{RcE30WBKrXI.U2tBADVisKH}>10,1,0)+ if(#{EAG0GfdSMAs.U2tBADVisKH}>10,1,0)+ if(#{N2aXs7VlJdJ.U2tBADVisKH}>10,1,0)+ if(#{xrjnOtFFTRC.U2tBADVisKH}>10,1,0)19 Low variability
For each item the Indicator returns "1" if the coefficient of variation is less than 5 and otherwise returns 0 and then adds up these results for calculating the number of items with a coefficient of variation of less than 5 (low variability). Note that the actual coefficient of variation is multiplied by 10.Name (*): "Low variability"
Short Name (*): "Low variability - MSR"
Description: "Number of items with a coefficient of variation between 0 and 5."
Decimals in data output: "0"
Indicator type (*): "Number (Factor 1)"
Edit numerator:Description: "High variability - Numerator"
Calculation:
if(#{LNAkkMTxqEW.U2tBADVisKH}<5,1,0)+ if(#{WyDZKSw82X6.U2tBADVisKH}<5,1,0)+ if(#{JPccVwAGRq9.U2tBADVisKH}<5,1,0)+ if(#{smxJz7Mt6ia.U2tBADVisKH}<5,1,0)+ if(#{AaIApgGQM6t.U2tBADVisKH}<5,1,0)+ if(#{vCTrmv52APd.U2tBADVisKH}<5,1,0)+ if(#{SOw2TcuFFH2.U2tBADVisKH}<5,1,0)+ if(#{RSIOx2u07Ln.U2tBADVisKH}<5,1,0)+ if(#{JStiDyaPfqy.U2tBADVisKH}<5,1,0)+ if(#{hZ1YvdcTDQM.U2tBADVisKH}<5,1,0)+ if(#{tsi32D8HQd5.U2tBADVisKH}<5,1,0)+ if(#{QWlPF8S0gCc.U2tBADVisKH}<5,1,0)+ if(#{a5uLTDt12eT.U2tBADVisKH}<5,1,0)+ if(#{U0AfOOyJMy2.U2tBADVisKH}<5,1,0)+ if(#{cyf6UdScfFM.U2tBADVisKH}<5,1,0)+ if(#{FeUTTNHpVzD.U2tBADVisKH}<5,1,0)+ if(#{mKSICD1rxG4.U2tBADVisKH}<5,1,0)+ if(#{mVNe1aS1pGl.U2tBADVisKH}<5,1,0)+ if(#{oLAXTZY6ken.U2tBADVisKH}<5,1,0)+ if(#{YYaRDUZyH9L.U2tBADVisKH}<5,1,0)+ if(#{HVteopBt0jr.U2tBADVisKH}<5,1,0)+ if(#{sWodd2tbjgZ.U2tBADVisKH}<5,1,0)+ if(#{yVYajDDYUfX.U2tBADVisKH}<5,1,0)+ if(#{eTJAr4sc83v.U2tBADVisKH}<5,1,0)+ if(#{U4KSmanl4JP.U2tBADVisKH}<5,1,0)+ if(#{FXsa5uG3IGn.U2tBADVisKH}<5,1,0)+ if(#{L34T9YDtCor.U2tBADVisKH}<5,1,0)+ if(#{W5mHXhSYFfQ.U2tBADVisKH}<5,1,0)+ if(#{cmSUyJOZwyl.U2tBADVisKH}<5,1,0)+ if(#{cT8sfosRXvU.U2tBADVisKH}<5,1,0)+ if(#{OaWKnMS7say.U2tBADVisKH}<5,1,0)+ if(#{Z4bjHvGS6aH.U2tBADVisKH}<5,1,0)+ if(#{Nn1L7CNEtC8.U2tBADVisKH}<5,1,0)+ if(#{RNYKSc3nAUg.U2tBADVisKH}<5,1,0)+ if(#{PtmZ9XqpPKi.U2tBADVisKH}<5,1,0)+ if(#{CohlLHi54B0.U2tBADVisKH}<5,1,0)+ if(#{Gu6u82RD9OW.U2tBADVisKH}<5,1,0)+ if(#{LiuYzxYr4Pt.U2tBADVisKH}<5,1,0)+ if(#{Tje33nJAG55.U2tBADVisKH}<5,1,0)+ if(#{euM2dlqleYH.U2tBADVisKH}<5,1,0)+ if(#{dASLmBTEehF.U2tBADVisKH}<5,1,0)+ if(#{qU2LvzoPn1z.U2tBADVisKH}<5,1,0)+ if(#{OkWaFxdUQY2.U2tBADVisKH}<5,1,0)+ if(#{YHIv7KQc2e7.U2tBADVisKH}<5,1,0)+ if(#{rt9D47Inb49.U2tBADVisKH}<5,1,0)+ if(#{i1iXbquZ5iv.U2tBADVisKH}<5,1,0)+ if(#{RcE30WBKrXI.U2tBADVisKH}<5,1,0)+ if(#{EAG0GfdSMAs.U2tBADVisKH}<5,1,0)+ if(#{N2aXs7VlJdJ.U2tBADVisKH}<5,1,0)+ if(#{xrjnOtFFTRC.U2tBADVisKH}<5,1,0)20 Medium variability
For each item the Indicator returns "1" if the coefficient of variation is greater than 5 but less or equal to 10 and otherwise returns 0 and then adds up these results for calculating the number of items with a coefficient of between 5 and 10 (medium variability). Note that the actual coefficient of variation is multiplied by 10.Name (*): "Medium variability"
Short Name (*): "Medium variability - MSR"
Description: "Number of items with a coefficient of variation between 5 and 10."
Decimals in data output: "0"
Indicator type (*): "Number (Factor 1)"
Edit numerator:Description: "Medium variability - Numerator"
Calculation:
if(#{LNAkkMTxqEW.U2tBADVisKH}<5,1,0)+ if(#{WyDZKSw82X6.U2tBADVisKH}<5,1,0)+ if(#{JPccVwAGRq9.U2tBADVisKH}<5,1,0)+ if(#{smxJz7Mt6ia.U2tBADVisKH}<5,1,0)+ if(#{AaIApgGQM6t.U2tBADVisKH}<5,1,0)+ if(#{vCTrmv52APd.U2tBADVisKH}<5,1,0)+ if(#{SOw2TcuFFH2.U2tBADVisKH}<5,1,0)+ if(#{RSIOx2u07Ln.U2tBADVisKH}<5,1,0)+ if(#{JStiDyaPfqy.U2tBADVisKH}<5,1,0)+ if(#{hZ1YvdcTDQM.U2tBADVisKH}<5,1,0)+ if(#{tsi32D8HQd5.U2tBADVisKH}<5,1,0)+ if(#{QWlPF8S0gCc.U2tBADVisKH}<5,1,0)+ if(#{a5uLTDt12eT.U2tBADVisKH}<5,1,0)+ if(#{U0AfOOyJMy2.U2tBADVisKH}<5,1,0)+ if(#{cyf6UdScfFM.U2tBADVisKH}<5,1,0)+ if(#{FeUTTNHpVzD.U2tBADVisKH}<5,1,0)+ if(#{mKSICD1rxG4.U2tBADVisKH}<5,1,0)+ if(#{mVNe1aS1pGl.U2tBADVisKH}<5,1,0)+ if(#{oLAXTZY6ken.U2tBADVisKH}<5,1,0)+ if(#{YYaRDUZyH9L.U2tBADVisKH}<5,1,0)+ if(#{HVteopBt0jr.U2tBADVisKH}<5,1,0)+ if(#{sWodd2tbjgZ.U2tBADVisKH}<5,1,0)+ if(#{yVYajDDYUfX.U2tBADVisKH}<5,1,0)+ if(#{eTJAr4sc83v.U2tBADVisKH}<5,1,0)+ if(#{U4KSmanl4JP.U2tBADVisKH}<5,1,0)+ if(#{FXsa5uG3IGn.U2tBADVisKH}<5,1,0)+ if(#{L34T9YDtCor.U2tBADVisKH}<5,1,0)+ if(#{W5mHXhSYFfQ.U2tBADVisKH}<5,1,0)+ if(#{cmSUyJOZwyl.U2tBADVisKH}<5,1,0)+ if(#{cT8sfosRXvU.U2tBADVisKH}<5,1,0)+ if(#{OaWKnMS7say.U2tBADVisKH}<5,1,0)+ if(#{Z4bjHvGS6aH.U2tBADVisKH}<5,1,0)+ if(#{Nn1L7CNEtC8.U2tBADVisKH}<5,1,0)+ if(#{RNYKSc3nAUg.U2tBADVisKH}<5,1,0)+ if(#{PtmZ9XqpPKi.U2tBADVisKH}<5,1,0)+ if(#{CohlLHi54B0.U2tBADVisKH}<5,1,0)+ if(#{Gu6u82RD9OW.U2tBADVisKH}<5,1,0)+ if(#{LiuYzxYr4Pt.U2tBADVisKH}<5,1,0)+ if(#{Tje33nJAG55.U2tBADVisKH}<5,1,0)+ if(#{euM2dlqleYH.U2tBADVisKH}<5,1,0)+ if(#{dASLmBTEehF.U2tBADVisKH}<5,1,0)+ if(#{qU2LvzoPn1z.U2tBADVisKH}<5,1,0)+ if(#{OkWaFxdUQY2.U2tBADVisKH}<5,1,0)+ if(#{YHIv7KQc2e7.U2tBADVisKH}<5,1,0)+ if(#{rt9D47Inb49.U2tBADVisKH}<5,1,0)+ if(#{i1iXbquZ5iv.U2tBADVisKH}<5,1,0)+ if(#{RcE30WBKrXI.U2tBADVisKH}<5,1,0)+ if(#{EAG0GfdSMAs.U2tBADVisKH}<5,1,0)+ if(#{N2aXs7VlJdJ.U2tBADVisKH}<5,1,0)+ if(#{xrjnOtFFTRC.U2tBADVisKH}<5,1,0)21 Overstock
The Indicator adds up the values in the data field "Overstock" for calculating the number of items with overstocks.Name (*): "Overstock"
Short Name (*): "Overstock - MSR"
Description: "Number of items with overstock"
Decimals in data output: "0"
Indicator type (*): "Number (Factor 1)"
Edit numerator:Description: "Overstock - MSR - Numerator"
Calculation:
#{LNAkkMTxqEW.EnrDpXZVNq2}+ #{WyDZKSw82X6.EnrDpXZVNq2}+ #{JPccVwAGRq9.EnrDpXZVNq2}+ #{smxJz7Mt6ia.EnrDpXZVNq2}+ #{AaIApgGQM6t.EnrDpXZVNq2}+ #{vCTrmv52APd.EnrDpXZVNq2}+ #{SOw2TcuFFH2.EnrDpXZVNq2}+ #{RSIOx2u07Ln.EnrDpXZVNq2}+ #{JStiDyaPfqy.EnrDpXZVNq2}+ #{hZ1YvdcTDQM.EnrDpXZVNq2}+ #{tsi32D8HQd5.EnrDpXZVNq2}+ #{QWlPF8S0gCc.EnrDpXZVNq2}+ #{a5uLTDt12eT.EnrDpXZVNq2}+ #{U0AfOOyJMy2.EnrDpXZVNq2}+ #{cyf6UdScfFM.EnrDpXZVNq2}+ #{FeUTTNHpVzD.EnrDpXZVNq2}+ #{mKSICD1rxG4.EnrDpXZVNq2}+ #{mVNe1aS1pGl.EnrDpXZVNq2}+ #{oLAXTZY6ken.EnrDpXZVNq2}+ #{YYaRDUZyH9L.EnrDpXZVNq2}+ #{HVteopBt0jr.EnrDpXZVNq2}+ #{sWodd2tbjgZ.EnrDpXZVNq2}+ #{yVYajDDYUfX.EnrDpXZVNq2}+ #{eTJAr4sc83v.EnrDpXZVNq2}+ #{U4KSmanl4JP.EnrDpXZVNq2}+ #{FXsa5uG3IGn.EnrDpXZVNq2}+ #{L34T9YDtCor.EnrDpXZVNq2}+ #{W5mHXhSYFfQ.EnrDpXZVNq2}+ #{cmSUyJOZwyl.EnrDpXZVNq2}+ #{cT8sfosRXvU.EnrDpXZVNq2}+ #{OaWKnMS7say.EnrDpXZVNq2}+ #{Z4bjHvGS6aH.EnrDpXZVNq2}+ #{Nn1L7CNEtC8.EnrDpXZVNq2}+ #{RNYKSc3nAUg.EnrDpXZVNq2}+ #{PtmZ9XqpPKi.EnrDpXZVNq2}+ #{CohlLHi54B0.EnrDpXZVNq2}+ #{Gu6u82RD9OW.EnrDpXZVNq2}+ #{LiuYzxYr4Pt.EnrDpXZVNq2}+ #{Tje33nJAG55.EnrDpXZVNq2}+ #{euM2dlqleYH.EnrDpXZVNq2}+ #{dASLmBTEehF.EnrDpXZVNq2}+ #{qU2LvzoPn1z.EnrDpXZVNq2}+ #{OkWaFxdUQY2.EnrDpXZVNq2}+ #{YHIv7KQc2e7.EnrDpXZVNq2}+ #{rt9D47Inb49.EnrDpXZVNq2}+ #{i1iXbquZ5iv.EnrDpXZVNq2}+ #{RcE30WBKrXI.EnrDpXZVNq2}+ #{EAG0GfdSMAs.EnrDpXZVNq2}+ #{N2aXs7VlJdJ.EnrDpXZVNq2}+ #{xrjnOtFFTRC.EnrDpXZVNq2}Edit denominator:
Description: "Overstock - MSR - Denominator"
Calculation: "1"22 Stock availability / %
This indicator counts the number of items with non-zero stock, divides them by the number of items and multiplies the result by 100 in order to present the result as percentage. Note that items have to be added and removed manually when the stock item list is changed and the denominator also has to be adjusted accordingly.Name (*): "Stock availability / %"
Short Name (*): "Stock availability / % - MSR"
Description: "Percentage of items with non-zero stock"
Decimals in data output: "0"
Indicator type (*): "Number (Factor 1)"
Edit numerator:Description: "Stock availability - MSR - Numerator"
Calculation:
#{LNAkkMTxqEW.vRsIAIjzyfn}+ #{WyDZKSw82X6.vRsIAIjzyfn}+ #{JPccVwAGRq9.vRsIAIjzyfn}+ #{smxJz7Mt6ia.vRsIAIjzyfn}+ #{AaIApgGQM6t.vRsIAIjzyfn}+ #{vCTrmv52APd.vRsIAIjzyfn}+ #{SOw2TcuFFH2.vRsIAIjzyfn}+ #{RSIOx2u07Ln.vRsIAIjzyfn}+ #{JStiDyaPfqy.vRsIAIjzyfn}+ #{hZ1YvdcTDQM.vRsIAIjzyfn}+ #{tsi32D8HQd5.vRsIAIjzyfn}+ #{QWlPF8S0gCc.vRsIAIjzyfn}+ #{a5uLTDt12eT.vRsIAIjzyfn}+ #{U0AfOOyJMy2.vRsIAIjzyfn}+ #{cyf6UdScfFM.vRsIAIjzyfn}+ #{FeUTTNHpVzD.vRsIAIjzyfn}+ #{mKSICD1rxG4.vRsIAIjzyfn}+ #{mVNe1aS1pGl.vRsIAIjzyfn}+ #{oLAXTZY6ken.vRsIAIjzyfn}+ #{YYaRDUZyH9L.vRsIAIjzyfn}+ #{HVteopBt0jr.vRsIAIjzyfn}+ #{sWodd2tbjgZ.vRsIAIjzyfn}+ #{yVYajDDYUfX.vRsIAIjzyfn}+ #{eTJAr4sc83v.vRsIAIjzyfn}+ #{U4KSmanl4JP.vRsIAIjzyfn}+ #{FXsa5uG3IGn.vRsIAIjzyfn}+ #{L34T9YDtCor.vRsIAIjzyfn}+ #{W5mHXhSYFfQ.vRsIAIjzyfn}+ #{cmSUyJOZwyl.vRsIAIjzyfn}+ #{cT8sfosRXvU.vRsIAIjzyfn}+ #{OaWKnMS7say.vRsIAIjzyfn}+ #{Z4bjHvGS6aH.vRsIAIjzyfn}+ #{Nn1L7CNEtC8.vRsIAIjzyfn}+ #{RNYKSc3nAUg.vRsIAIjzyfn}+ #{PtmZ9XqpPKi.vRsIAIjzyfn}+ #{CohlLHi54B0.vRsIAIjzyfn}+ #{Gu6u82RD9OW.vRsIAIjzyfn}+ #{LiuYzxYr4Pt.vRsIAIjzyfn}+ #{Tje33nJAG55.vRsIAIjzyfn}+ #{euM2dlqleYH.vRsIAIjzyfn}+ #{dASLmBTEehF.vRsIAIjzyfn}+ #{qU2LvzoPn1z.vRsIAIjzyfn}+ #{OkWaFxdUQY2.vRsIAIjzyfn}+ #{YHIv7KQc2e7.vRsIAIjzyfn}+ #{rt9D47Inb49.vRsIAIjzyfn}+ #{i1iXbquZ5iv.vRsIAIjzyfn}+ #{RcE30WBKrXI.vRsIAIjzyfn}+ #{EAG0GfdSMAs.vRsIAIjzyfn}+ #{N2aXs7VlJdJ.vRsIAIjzyfn}+ #{xrjnOtFFTRC.vRsIAIjzyfn}Edit denominator:
Description: "Stock availability - MSR - Denominator"
Calculation: "0.5"23 Stock discrepancy count
This indicator counts the number of items which have a stock discrepancy which is not zero.Name (*): "Stock discrepancy count"
Short Name (*): "Stock discrepancy count - MSR"
Description: "Number of items with a stock discrepancy"
Decimals in data output: "0"
Indicator type (*): "Number (Factor 1)"
Edit numerator:Description: "Stock discrepancy count - MSR - Numerator"
Calculation:
#{LNAkkMTxqEW.cD8WZyjlq9C}+ #{WyDZKSw82X6.cD8WZyjlq9C}+ #{JPccVwAGRq9.cD8WZyjlq9C}+ #{smxJz7Mt6ia.cD8WZyjlq9C}+ #{AaIApgGQM6t.cD8WZyjlq9C}+ #{vCTrmv52APd.cD8WZyjlq9C}+ #{SOw2TcuFFH2.cD8WZyjlq9C}+ #{RSIOx2u07Ln.cD8WZyjlq9C}+ #{JStiDyaPfqy.cD8WZyjlq9C}+ #{hZ1YvdcTDQM.cD8WZyjlq9C}+ #{tsi32D8HQd5.cD8WZyjlq9C}+ #{QWlPF8S0gCc.cD8WZyjlq9C}+ #{a5uLTDt12eT.cD8WZyjlq9C}+ #{U0AfOOyJMy2.cD8WZyjlq9C}+ #{cyf6UdScfFM.cD8WZyjlq9C}+ #{FeUTTNHpVzD.cD8WZyjlq9C}+ #{mKSICD1rxG4.cD8WZyjlq9C}+ #{mVNe1aS1pGl.cD8WZyjlq9C}+ #{oLAXTZY6ken.cD8WZyjlq9C}+ #{YYaRDUZyH9L.cD8WZyjlq9C}+ #{HVteopBt0jr.cD8WZyjlq9C}+ #{sWodd2tbjgZ.cD8WZyjlq9C}+ #{yVYajDDYUfX.cD8WZyjlq9C}+ #{eTJAr4sc83v.cD8WZyjlq9C}+ #{U4KSmanl4JP.cD8WZyjlq9C}+ #{FXsa5uG3IGn.cD8WZyjlq9C}+ #{L34T9YDtCor.cD8WZyjlq9C}+ #{W5mHXhSYFfQ.cD8WZyjlq9C}+ #{cmSUyJOZwyl.cD8WZyjlq9C}+ #{cT8sfosRXvU.cD8WZyjlq9C}+ #{OaWKnMS7say.cD8WZyjlq9C}+ #{Z4bjHvGS6aH.cD8WZyjlq9C}+ #{Nn1L7CNEtC8.cD8WZyjlq9C}+ #{RNYKSc3nAUg.cD8WZyjlq9C}+ #{PtmZ9XqpPKi.cD8WZyjlq9C}+ #{CohlLHi54B0.cD8WZyjlq9C}+ #{Gu6u82RD9OW.cD8WZyjlq9C}+ #{LiuYzxYr4Pt.cD8WZyjlq9C}+ #{Tje33nJAG55.cD8WZyjlq9C}+ #{euM2dlqleYH.cD8WZyjlq9C}+ #{dASLmBTEehF.cD8WZyjlq9C}+ #{qU2LvzoPn1z.cD8WZyjlq9C}+ #{OkWaFxdUQY2.cD8WZyjlq9C}+ #{YHIv7KQc2e7.cD8WZyjlq9C}+ #{rt9D47Inb49.cD8WZyjlq9C}+ #{i1iXbquZ5iv.cD8WZyjlq9C}+ #{RcE30WBKrXI.cD8WZyjlq9C}+ #{EAG0GfdSMAs.cD8WZyjlq9C}+ #{N2aXs7VlJdJ.cD8WZyjlq9C}+ #{xrjnOtFFTRC.cD8WZyjlq9C}24 Stock discrepancy percentage
This indicator divides the number of items which have a stock discrepancy which is not zero by the total number of items.Name (*): "Stock discrepancy percentage"
Short Name (*): "Stock discrepancy percentage - MSR"
Description: "Percentage of items with a stock discrepancy"
Decimals in data output: "0"
Indicator type (*): "Number (Factor 1)"
Edit numerator:Description: "Stock discrepancy percentage - MSR - Numerator"
Calculation:
#{LNAkkMTxqEW.cD8WZyjlq9C}+ #{WyDZKSw82X6.cD8WZyjlq9C}+ #{JPccVwAGRq9.cD8WZyjlq9C}+ #{smxJz7Mt6ia.cD8WZyjlq9C}+ #{AaIApgGQM6t.cD8WZyjlq9C}+ #{vCTrmv52APd.cD8WZyjlq9C}+ #{SOw2TcuFFH2.cD8WZyjlq9C}+ #{RSIOx2u07Ln.cD8WZyjlq9C}+ #{JStiDyaPfqy.cD8WZyjlq9C}+ #{hZ1YvdcTDQM.cD8WZyjlq9C}+ #{tsi32D8HQd5.cD8WZyjlq9C}+ #{QWlPF8S0gCc.cD8WZyjlq9C}+ #{a5uLTDt12eT.cD8WZyjlq9C}+ #{U0AfOOyJMy2.cD8WZyjlq9C}+ #{cyf6UdScfFM.cD8WZyjlq9C}+ #{FeUTTNHpVzD.cD8WZyjlq9C}+ #{mKSICD1rxG4.cD8WZyjlq9C}+ #{mVNe1aS1pGl.cD8WZyjlq9C}+ #{oLAXTZY6ken.cD8WZyjlq9C}+ #{YYaRDUZyH9L.cD8WZyjlq9C}+ #{HVteopBt0jr.cD8WZyjlq9C}+ #{sWodd2tbjgZ.cD8WZyjlq9C}+ #{yVYajDDYUfX.cD8WZyjlq9C}+ #{eTJAr4sc83v.cD8WZyjlq9C}+ #{U4KSmanl4JP.cD8WZyjlq9C}+ #{FXsa5uG3IGn.cD8WZyjlq9C}+ #{L34T9YDtCor.cD8WZyjlq9C}+ #{W5mHXhSYFfQ.cD8WZyjlq9C}+ #{cmSUyJOZwyl.cD8WZyjlq9C}+ #{cT8sfosRXvU.cD8WZyjlq9C}+ #{OaWKnMS7say.cD8WZyjlq9C}+ #{Z4bjHvGS6aH.cD8WZyjlq9C}+ #{Nn1L7CNEtC8.cD8WZyjlq9C}+ #{RNYKSc3nAUg.cD8WZyjlq9C}+ #{PtmZ9XqpPKi.cD8WZyjlq9C}+ #{CohlLHi54B0.cD8WZyjlq9C}+ #{Gu6u82RD9OW.cD8WZyjlq9C}+ #{LiuYzxYr4Pt.cD8WZyjlq9C}+ #{Tje33nJAG55.cD8WZyjlq9C}+ #{euM2dlqleYH.cD8WZyjlq9C}+ #{dASLmBTEehF.cD8WZyjlq9C}+ #{qU2LvzoPn1z.cD8WZyjlq9C}+ #{OkWaFxdUQY2.cD8WZyjlq9C}+ #{YHIv7KQc2e7.cD8WZyjlq9C}+ #{rt9D47Inb49.cD8WZyjlq9C}+ #{i1iXbquZ5iv.cD8WZyjlq9C}+ #{RcE30WBKrXI.cD8WZyjlq9C}+ #{EAG0GfdSMAs.cD8WZyjlq9C}+ #{N2aXs7VlJdJ.cD8WZyjlq9C}+ #{xrjnOtFFTRC.cD8WZyjlq9C}25 Stockout count
This indicator counts the number of items with a stockout.Name (*): "Stockout count"
Short Name (*): "Stockout count - MSR"
Description: "Number of items with at stockout"
Decimals in data output: "0"
Indicator type (*): "Number (Factor 1)"
Edit numerator:Description: "Stockout count - MSR"
Calculation:
if(#{LNAkkMTxqEW.iIC4YhgrxQY}==0,1,0)+ if(#{WyDZKSw82X6.iIC4YhgrxQY}==0,1,0)+ if(#{JPccVwAGRq9.iIC4YhgrxQY}==0,1,0)+ if(#{smxJz7Mt6ia.iIC4YhgrxQY}==0,1,0)+ if(#{AaIApgGQM6t.iIC4YhgrxQY}==0,1,0)+ if(#{vCTrmv52APd.iIC4YhgrxQY}==0,1,0)+ if(#{SOw2TcuFFH2.iIC4YhgrxQY}==0,1,0)+ if(#{RSIOx2u07Ln.iIC4YhgrxQY}==0,1,0)+ if(#{JStiDyaPfqy.iIC4YhgrxQY}==0,1,0)+ if(#{hZ1YvdcTDQM.iIC4YhgrxQY}==0,1,0)+ if(#{tsi32D8HQd5.iIC4YhgrxQY}==0,1,0)+ if(#{QWlPF8S0gCc.iIC4YhgrxQY}==0,1,0)+ if(#{a5uLTDt12eT.iIC4YhgrxQY}==0,1,0)+ if(#{U0AfOOyJMy2.iIC4YhgrxQY}==0,1,0)+ if(#{cyf6UdScfFM.iIC4YhgrxQY}==0,1,0)+ if(#{FeUTTNHpVzD.iIC4YhgrxQY}==0,1,0)+ if(#{mKSICD1rxG4.iIC4YhgrxQY}==0,1,0)+ if(#{mVNe1aS1pGl.iIC4YhgrxQY}==0,1,0)+ if(#{oLAXTZY6ken.iIC4YhgrxQY}==0,1,0)+ if(#{YYaRDUZyH9L.iIC4YhgrxQY}==0,1,0)+ if(#{HVteopBt0jr.iIC4YhgrxQY}==0,1,0)+ if(#{sWodd2tbjgZ.iIC4YhgrxQY}==0,1,0)+ if(#{yVYajDDYUfX.iIC4YhgrxQY}==0,1,0)+ if(#{eTJAr4sc83v.iIC4YhgrxQY}==0,1,0)+ if(#{U4KSmanl4JP.iIC4YhgrxQY}==0,1,0)+ if(#{FXsa5uG3IGn.iIC4YhgrxQY}==0,1,0)+ if(#{L34T9YDtCor.iIC4YhgrxQY}==0,1,0)+ if(#{W5mHXhSYFfQ.iIC4YhgrxQY}==0,1,0)+ if(#{cmSUyJOZwyl.iIC4YhgrxQY}==0,1,0)+ if(#{cT8sfosRXvU.iIC4YhgrxQY}==0,1,0)+ if(#{OaWKnMS7say.iIC4YhgrxQY}==0,1,0)+ if(#{Z4bjHvGS6aH.iIC4YhgrxQY}==0,1,0)+ if(#{Nn1L7CNEtC8.iIC4YhgrxQY}==0,1,0)+ if(#{RNYKSc3nAUg.iIC4YhgrxQY}==0,1,0)+ if(#{PtmZ9XqpPKi.iIC4YhgrxQY}==0,1,0)+ if(#{CohlLHi54B0.iIC4YhgrxQY}==0,1,0)+ if(#{Gu6u82RD9OW.iIC4YhgrxQY}==0,1,0)+ if(#{LiuYzxYr4Pt.iIC4YhgrxQY}==0,1,0)+ if(#{Tje33nJAG55.iIC4YhgrxQY}==0,1,0)+ if(#{euM2dlqleYH.iIC4YhgrxQY}==0,1,0)+ if(#{dASLmBTEehF.iIC4YhgrxQY}==0,1,0)+ if(#{qU2LvzoPn1z.iIC4YhgrxQY}==0,1,0)+ if(#{OkWaFxdUQY2.iIC4YhgrxQY}==0,1,0)+ if(#{YHIv7KQc2e7.iIC4YhgrxQY}==0,1,0)+ if(#{rt9D47Inb49.iIC4YhgrxQY}==0,1,0)+ if(#{i1iXbquZ5iv.iIC4YhgrxQY}==0,1,0)+ if(#{RcE30WBKrXI.iIC4YhgrxQY}==0,1,0)+ if(#{EAG0GfdSMAs.iIC4YhgrxQY}==0,1,0)+ if(#{N2aXs7VlJdJ.iIC4YhgrxQY}==0,1,0)+ if(#{xrjnOtFFTRC.iIC4YhgrxQY}==0,1,0)Edit denominator:
Description: "Stockouts - MSR - Denominator"
Calculation: "1"26 Stockout rate / %
This indicator counts the number of items with stockouts (zero stock), divides them by the number of items and multiplies the result by 100 in order to present the result as percentage. Note that items have to be added and removed manually when the stock item list is changed and the denominator also has to be adjusted accordingly.Name (*): "Stockout rate / %"
Short Name (*): "Stockout rate / % - MSR"
Description: "Percentage of items with zero stock"
Decimals in data output: "0"
Indicator type (*): "Number (Factor 1)"
Edit numerator:Description: "Stockout rate - MSR - Numerator"
Calculation:
#{LNAkkMTxqEW.e7d6Th5WLEM}+ #{WyDZKSw82X6.e7d6Th5WLEM}+ #{JPccVwAGRq9.e7d6Th5WLEM}+ #{smxJz7Mt6ia.e7d6Th5WLEM}+ #{AaIApgGQM6t.e7d6Th5WLEM}+ #{vCTrmv52APd.e7d6Th5WLEM}+ #{SOw2TcuFFH2.e7d6Th5WLEM}+ #{RSIOx2u07Ln.e7d6Th5WLEM}+ #{JStiDyaPfqy.e7d6Th5WLEM}+ #{hZ1YvdcTDQM.e7d6Th5WLEM}+ #{tsi32D8HQd5.e7d6Th5WLEM}+ #{QWlPF8S0gCc.e7d6Th5WLEM}+ #{a5uLTDt12eT.e7d6Th5WLEM}+ #{U0AfOOyJMy2.e7d6Th5WLEM}+ #{cyf6UdScfFM.e7d6Th5WLEM}+ #{FeUTTNHpVzD.e7d6Th5WLEM}+ #{mKSICD1rxG4.e7d6Th5WLEM}+ #{mVNe1aS1pGl.e7d6Th5WLEM}+ #{oLAXTZY6ken.e7d6Th5WLEM}+ #{YYaRDUZyH9L.e7d6Th5WLEM}+ #{HVteopBt0jr.e7d6Th5WLEM}+ #{sWodd2tbjgZ.e7d6Th5WLEM}+ #{yVYajDDYUfX.e7d6Th5WLEM}+ #{eTJAr4sc83v.e7d6Th5WLEM}+ #{U4KSmanl4JP.e7d6Th5WLEM}+ #{FXsa5uG3IGn.e7d6Th5WLEM}+ #{L34T9YDtCor.e7d6Th5WLEM}+ #{W5mHXhSYFfQ.e7d6Th5WLEM}+ #{cmSUyJOZwyl.e7d6Th5WLEM}+ #{cT8sfosRXvU.e7d6Th5WLEM}+ #{OaWKnMS7say.e7d6Th5WLEM}+ #{Z4bjHvGS6aH.e7d6Th5WLEM}+ #{Nn1L7CNEtC8.e7d6Th5WLEM}+ #{RNYKSc3nAUg.e7d6Th5WLEM}+ #{PtmZ9XqpPKi.e7d6Th5WLEM}+ #{CohlLHi54B0.e7d6Th5WLEM}+ #{Gu6u82RD9OW.e7d6Th5WLEM}+ #{LiuYzxYr4Pt.e7d6Th5WLEM}+ #{Tje33nJAG55.e7d6Th5WLEM}+ #{euM2dlqleYH.e7d6Th5WLEM}+ #{dASLmBTEehF.e7d6Th5WLEM}+ #{qU2LvzoPn1z.e7d6Th5WLEM}+ #{OkWaFxdUQY2.e7d6Th5WLEM}+ #{YHIv7KQc2e7.e7d6Th5WLEM}+ #{rt9D47Inb49.e7d6Th5WLEM}+ #{i1iXbquZ5iv.e7d6Th5WLEM}+ #{RcE30WBKrXI.e7d6Th5WLEM}+ #{EAG0GfdSMAs.e7d6Th5WLEM}+ #{N2aXs7VlJdJ.e7d6Th5WLEM}+ #{xrjnOtFFTRC.e7d6Th5WLEM}Edit denominator:
Description: "Stockout rate / % - MSR"
Calculation: "0.5"27 Understock
The Indicator adds up the values in the data field "Understock" for calculating the number of items with understocks.Name (*): "Understock"
Short Name (*): "Understock - MSR"
Description: "Number of items with overstock"
Decimals in data output: "0"
Indicator type (*): "Number (Factor 1)"
Edit numerator:Description: "Understock - MSR - Numerator"
Calculation:
#{LNAkkMTxqEW.jJeAB3Dcibl}+ #{WyDZKSw82X6.jJeAB3Dcibl}+ #{JPccVwAGRq9.jJeAB3Dcibl}+ #{smxJz7Mt6ia.jJeAB3Dcibl}+ #{AaIApgGQM6t.jJeAB3Dcibl}+ #{vCTrmv52APd.jJeAB3Dcibl}+ #{SOw2TcuFFH2.jJeAB3Dcibl}+ #{RSIOx2u07Ln.jJeAB3Dcibl}+ #{JStiDyaPfqy.jJeAB3Dcibl}+ #{hZ1YvdcTDQM.jJeAB3Dcibl}+ #{tsi32D8HQd5.jJeAB3Dcibl}+ #{QWlPF8S0gCc.jJeAB3Dcibl}+ #{a5uLTDt12eT.jJeAB3Dcibl}+ #{U0AfOOyJMy2.jJeAB3Dcibl}+ #{cyf6UdScfFM.jJeAB3Dcibl}+ #{FeUTTNHpVzD.jJeAB3Dcibl}+ #{mKSICD1rxG4.jJeAB3Dcibl}+ #{mVNe1aS1pGl.jJeAB3Dcibl}+ #{oLAXTZY6ken.jJeAB3Dcibl}+ #{YYaRDUZyH9L.jJeAB3Dcibl}+ #{HVteopBt0jr.jJeAB3Dcibl}+ #{sWodd2tbjgZ.jJeAB3Dcibl}+ #{yVYajDDYUfX.jJeAB3Dcibl}+ #{eTJAr4sc83v.jJeAB3Dcibl}+ #{U4KSmanl4JP.jJeAB3Dcibl}+ #{FXsa5uG3IGn.jJeAB3Dcibl}+ #{L34T9YDtCor.jJeAB3Dcibl}+ #{W5mHXhSYFfQ.jJeAB3Dcibl}+ #{cmSUyJOZwyl.jJeAB3Dcibl}+ #{cT8sfosRXvU.jJeAB3Dcibl}+ #{OaWKnMS7say.jJeAB3Dcibl}+ #{Z4bjHvGS6aH.jJeAB3Dcibl}+ #{Nn1L7CNEtC8.jJeAB3Dcibl}+ #{RNYKSc3nAUg.jJeAB3Dcibl}+ #{PtmZ9XqpPKi.jJeAB3Dcibl}+ #{CohlLHi54B0.jJeAB3Dcibl}+ #{Gu6u82RD9OW.jJeAB3Dcibl}+ #{LiuYzxYr4Pt.jJeAB3Dcibl}+ #{Tje33nJAG55.jJeAB3Dcibl}+ #{euM2dlqleYH.jJeAB3Dcibl}+ #{dASLmBTEehF.jJeAB3Dcibl}+ #{qU2LvzoPn1z.jJeAB3Dcibl}+ #{OkWaFxdUQY2.jJeAB3Dcibl}+ #{YHIv7KQc2e7.jJeAB3Dcibl}+ #{rt9D47Inb49.jJeAB3Dcibl}+ #{i1iXbquZ5iv.jJeAB3Dcibl}+ #{RcE30WBKrXI.jJeAB3Dcibl}+ #{EAG0GfdSMAs.jJeAB3Dcibl}+ #{N2aXs7VlJdJ.jJeAB3Dcibl}+ #{xrjnOtFFTRC.jJeAB3Dcibl}Edit denominator:
Description: "Understock - MSR - Denominator"
Calculation: "1"
4.2 Indicator type
The "Indicator type" is a precondition for configuring any "Indicator".
1 Number (Factor 1)
Name (*): "Number (Factor 1)"
Factor (*): "1"
5 Other
5.1 Legend
The following legends are applied to some visualizations:
-
Stock coverage time: indicates stockouts, shortages, appropriate and overstocks
-
Stock discrepancy: indicates correct stocks, positive or negative discrepancies
1 Coefficient of variation
Name (*): "Coefficient of variation**
Code: "COEFFICIENT_OF_VARIATIONS"
NameName: "Low variability"
Start value: "0
End value: "5"
Color code: "#41F80E" (Green)Name: "Medium variability"
Start value: "5"
End value: "10"
Color code: "#FEB24C" (yellow)Name: "Erratic variability"
Start value: "10"
End value: "25"
Color code: "#F03B20" (red)2 Stock availability - default colour green
Name (*): "Stock availability - default colour green**
Code: "STOCK_AVAILABILITY_DEFAULT"
NameName: "Stock available"
Start value: "0
End value: "999999"
Color code: "#19GG00" (Green)3 Stock availability / %
Name (*): "Stock availability / %
**Code: "STOCK_AVAILABILITY"
NameName: "Low"
Start value: "0
End value: "90"
Color code: "#FF2700" (Red)Name: "Medium"
Start value: "90"
End value: "95"
Color code: "#FFA500" (Orange)Name: "High"
Start value: "95"
End value: "101"
Color code: "#00FF0E" (Green)4 Stock coverage time
Name (*): "Stock coverage time**
Code: "STOCK_COVERAGE_TIME"
NameName: "Stockout"
Start value: "0
End value: "0.0001"
Color code: "#EE391E" (Red)Name: "Understock"
Start value: "0.0001"
End value: "3"
Color code: "#FEFB08" (Yellow)Name: "Adequate stock"
Start value: "3"
End value: "4" Color code: "#0BFF00" (Green)Name: "Overstock"
Start value: "4"
End value: "12"
Color code: "#0011FF" (Blue)Name: "Excessive stock"
Start value: "12"
End value: "1000" Color code: "#DC00FF" (purple)5 Stock discrepancy
Name (*):"Stock discrepancy"
Code: "STOCK_DISCREPANCY"
NameName: "Negative"
Start value: "-999999"
End value: "0"
Color code: "#8411D7" (purple)Name: "Correct stock"
Start value: "0"
End value: "1"
Color code: "#68FE4C" (green)Name: "Positive"
Start value: "1"
End value: "999999"
Color code: "#FF2000" (red)6 Stockout
Name (*):"Stockout"
Code: "STOCKOUT"
NameName: "Stockout"
Start value: "0"
End value: "1"
Color code: "#F74432" (Red)Name: "Stock"
Start value: "1"
End value: "999999"
Color code: "#F9E6BB" (Light yellow)7 Stockout - default colour red
Name (*): "Stockout - default colour red**
Code: "STOCK_DEFAULT"
NameName: "Stockout"
Start value: "0
End value: "999999"
Color code: "#FF1D00" (Red)8 Stockout count This "Legend" is created for selecting a specific colour for column charts instead of a colour scheme being automatically assigned by the system.
Name (*): "Stockout count"
Code: "STOCKOUT_COUNT"
NameName: "No stockouts"
Start value: "0"
End value: "0.5"
Color code: "#2CFF00" (green)
Name: "Stockouts"
Start value: "0.5"
End value: "999999"
Color code: "#F31812" (red)
5.2 Predictor
1 [Stock list] - Appropriate stock - MSR
This Group Predictor assigns a "1" to the data field "Appropriate stock" if the stock coverage time lies between 3 and 6 months.Name (*): "[Stock list] - Appropriate stock - MSR"
Short name (*): "[Stock list] - Appropriate stock - MSR" Output data element (*): "[Item]" (select any item from the Data set)
Output category option combo "Apprpriate stock"
Period type (*): "Monthly"
Organisation unit levels "Facility"
Organisation units providing data (*) "At selected level(s) only"
THIS IS ABSOLUTELY CRITICAL and the lowest level in the hierarchy must be selected (and not "Country") otherwise Predictors are generated but the values are blank
Generator (*)Description: "[Stock list] - Appropriate stock - MSR"
Expression: "forEach ?de in :DEG:rDRgmw0sBWn → if((#{?de.iIC4YhgrxQY}/#{?de.zogrUrI7Crs})>3 && (#{?de.iIC4YhgrxQY}/#{?de.zogrUrI7Crs})<=6,1,0)"Sequential sample count (*): "6"
Annual sample count (*): "0"2 [Stock list] - Coefficient of variation - MSR
This Group Predictor assigns the coefficient of variation (standard deviation of stock distribution divided by the average stock distribution) calculated from the past 6 months of data to the data field "Coefficient of variation.Name (*): "[Stock list] - Coefficient of variation - MSR"
Short name (*): "[Stock list] - Coefficient of variation - MSR" Output data element (*): "[Item]" (select any item from the Data set)
Output category option combo "Coefficient of variation"
Period type (*): "Monthly"
Organisation unit levels "Facility"
Organisation units providing data (*) "At selected level(s) only"
THIS IS ABSOLUTELY CRITICAL and the lowest level in the hierarchy must be selected (and not "Country") otherwise Predictors are generated but the values are blank
Generator (*)Description: "[Stock list] - Coefficient of variation - MSR"
Expression: "forEach ?de in :DEG:rDRgmw0sBWn → stddevSamp(#{?de.zogrUrI7Crs})/avg(#{?de.zogrUrI7Crs})*10"Sequential sample count (*): "6"
Annual sample count (*): "0"3 [Stock list] - Excessive stock - MSR
This Group Predictor assigns a "1" to the data field "Excessive stock" if the stock coverage time is greater than 12 months.Name (*): "[Stock list] - Excessive stock - MSR"
Short name (*): "[Stock list] - Excessive stock - MSR" Output data element (*): "[Item]" (select any item from the Data set)
Output category option combo "Excessive stock"
Period type (*): "Monthly"
Organisation unit levels "Facility"
Organisation units providing data (*) "At selected level(s) only"
THIS IS ABSOLUTELY CRITICAL and the lowest level in the hierarchy must be selected (and not "Country") otherwise Predictors are generated but the values are blank
Generator (*)Description: "[Stock list] - Excessive stock - MSR"
Expression: "forEach ?de in :DEG:rDRgmw0sBWn → if((#{?de.iIC4YhgrxQY}/#{?de.zogrUrI7Crs})>12,1,0)"Sequential sample count (*): "6"
Annual sample count (*): "0"4 [Stock list] - High variability - MSR
This Group Predictor assigns a "1" to the data field "High variability" if the coefficient of variation (standard deviation of stock distribution divided by the average stock distribution) calculated from the past 6 months is greater than 10.Name (*): "[Stock list] - High variability - MSR"
Short name (*): "[Stock list] - High variability - MSR" Output data element (*): "[Item]" (select any item from the Data set)
Output category option combo "High variability"
Period type (*): "Monthly"
Organisation unit levels "Facility"
Organisation units providing data (*) "At selected level(s) only"
THIS IS ABSOLUTELY CRITICAL and the lowest level in the hierarchy must be selected (and not "Country") otherwise Predictors are generated but the values are blank
Generator (*)Description: "[Stock list] - High variability - MSR"
Expression: "forEach ?de in :DEG:rDRgmw0sBWn → if(stddevSamp(#{?de.zogrUrI7Crs})/avg(#{?de.zogrUrI7Crs})*10>10,1,0)"Sequential sample count (*): "6"
Annual sample count (*): "0"5 [Stock list] - Low variability - MSR
This Group Predictor assigns a "1" to the data field "Low variability" if the coefficient of variation (standard deviation of stock distribution divided by the average stock distribution) calculated from the past 6 months is less than or equal to 5.Name (*): "[Stock list] - Low variability - MSR"
Short name (*): "[Stock list] - Low variability - MSR" Output data element (*): "[Item]" (select any item from the Data set)
Output category option combo "Low variability"
Period type (*): "Monthly"
Organisation unit levels "Facility"
Organisation units providing data (*) "At selected level(s) only"
THIS IS ABSOLUTELY CRITICAL and the lowest level in the hierarchy must be selected (and not "Country") otherwise Predictors are generated but the values are blank
Generator (*)Description: "[Stock list] - Low variability - MSR"
Expression: "forEach ?de in :DEG:rDRgmw0sBWn → if(stddevSamp(#{?de.zogrUrI7Crs})/avg(#{?de.zogrUrI7Crs})*10<=5,1,0)"Sequential sample count (*): "6"
Annual sample count (*): "0"6 [Stock list] - Medium variability - MSR
This Group Predictor assigns a "1" to the data field "Low variability" if the coefficient of variation (standard deviation of stock distribution divided by the average stock distribution) calculated from the past 6 months is grater than 5 and less than or equal to 10.Name (*): "[Stock list] - Medium variability - MSR"
Short name (*): "[Stock list] - Medium variability - MSR" Output data element (*): "[Item]" (select any item from the Data set)
Output category option combo "Medium variability"
Period type (*): "Monthly"
Organisation unit levels "Facility"
Organisation units providing data (*) "At selected level(s) only"
THIS IS ABSOLUTELY CRITICAL and the lowest level in the hierarchy must be selected (and not "Country") otherwise Predictors are generated but the values are blank
Generator (*)Description: "[Stock list] - Medium variability - MSR"
Expression: "forEach ?de in :DEG:rDRgmw0sBWn → if(stddevSamp(#{?de.zogrUrI7Crs})/avg(#{?de.zogrUrI7Crs})*10>5 && stddevSamp(#{?de.zogrUrI7Crs})/avg(#{?de.zogrUrI7Crs})*10<=10,1,0)"Sequential sample count (*): "6"
Annual sample count (*): "0"7 [Stock list] - Overstock - MSR
This Group Predictor assigns a "1" to the data field "Overstock" if the stock is greater than 6 but less than or equal to 12 months.Name (*): "[Stock list] - Excessive stock - MSR"
Short name (*): "[Stock list] - Excessive stock - MSR" Output data element (*): "[Item]" (select any item from the Data set)
Output category option combo "Apprpriate stock"
Period type (*): "Monthly"
Organisation unit levels "Facility"
Organisation units providing data (*) "At selected level(s) only"
THIS IS ABSOLUTELY CRITICAL and the lowest level in the hierarchy must be selected (and not "Country") otherwise Predictors are generated but the values are blank
Generator (*)Description: "[Stock list] - Excessive stock - MSR"
Expression: "forEach ?de in :DEG:rDRgmw0sBWn → if((#{?de.iIC4YhgrxQY}/#{?de.zogrUrI7Crs})>12,1,0)"Sequential sample count (*): "6"
Annual sample count (*): "0"8 [Stock list] - Stock coverage time - MSR
Name (*): "[Stock list] - Stock coverage - MSR"
Short name (*): "[Stock list] - Stock coverage - MSR"
Output data element (*): "[Item]" (select any item from the Data set)
Output category option combo "Stock coverage"
Period type (*): "Monthly"
Organisation unit levels "Facility"
Organisation units providing data (*) "At selected level(s) only"
THIS IS ABSOLUTELY CRITICAL and the lowest level in the hierarchy must be selected (and not "Country") otherwise Predictors are generated but the values are blank
Generator (*)Description: "[Stock list] - Stock coverage time - MSR"
Expression: "forEach ?de in :DEG:rDRgmw0sBWn → #{?de.iIC4YhgrxQY}/#{?de.zogrUrI7Crs}"Sequential sample count (*): "0"
Annual sample count (*): "0"9 [Stock list] - Stock discrepancy - MSR
This Group Predictor assigns the result of the following calculation to the data field "Stock discrepancy": Stock on hand from the previous month + Stock receipt - Stock distribution - Stock redistribution - Stock discard - Stock correction - Stock on hand.Name (*): "[Stock list] - Stock discrepancy - MSR"
Short name (*): "[Stock list] - Stock discrepancy - MSR"
Output data element (*): "[Item]" (select any item from the Data set)
Output category option combo "Stock discrepancy"
Period type (*): "Monthly"
Organisation unit levels "Facility"
Organisation units providing data (*) "At selected level(s) only"
THIS IS ABSOLUTELY CRITICAL and the lowest level in the hierarchy must be selected (and not "Country") otherwise Predictors are generated but the values are blank
Generator (*)Description: "[Stock list] - Stock discrepancy - MSR"
Expression: "forEach ?de in :DEG:rDRgmw0sBWn → avg(#{?de.iIC4YhgrxQY}) +#{?de.PnxWz4HI5V0} -#{?de.zogrUrI7Crs} -#{?de.Q1Wh1szjrkC} -#{?de.CE1WL7cxNry} -#{?de.ERgIsOh37NR} -#{?de.iIC4YhgrxQY}"Sequential sample count (*): "1"
Annual sample count (*): "0"10 [Stock list] - Stock discrepancy count - MSR
This Group Predictor assigns "1" to the "Stock discrepancy count" if the stock discrepancy is greater than zero and otherwise assigns a zero.Name (*): "[Stock list] - Stock discrepancy count - MSR"
Short name (*): "[Stock list] - Stock discrepancy count - MSR"
Output data element (*): "[Item]" (select any item from the Data set)
Output category option combo "Stock discrepancy count"
Period type (*): "Monthly"
Organisation unit levels "Facility"
Organisation units providing data (*) "At selected level(s) only"
THIS IS ABSOLUTELY CRITICAL and the lowest level in the hierarchy must be selected (and not "Country") otherwise Predictors are generated but the values are blank
Generator (*)Description: "[Stock list] - Stock discrepancy count - MSR"
Expression: "forEach ?de in :DEG:rDRgmw0sBWn → if((avg(#{?de.iIC4YhgrxQY}) +#{?de.PnxWz4HI5V0} -#{?de.zogrUrI7Crs} -#{?de.Q1Wh1szjrkC} -#{?de.CE1WL7cxNry} -#{?de.ERgIsOh37NR} -#{?de.iIC4YhgrxQY})==0,0,1)"Sequential sample count (*): "1"
Annual sample count (*): "0"11 [Stock list] - Stock on hand Yes/No - MSR
This Group Predictor assigns "1" to the "Stock on hand Yes/No" data field if the stock on hand is greater than zero and otherwise assigns a zero.Name (*): "[Stock list] - Stock on hand Yes/No - MSR"
Short name (*): "[Stock list] - Stock on hand Yes/No - MSR"
Output data element (*): "[Item]" (select any item from the Data set)
Output category option combo "Stock on hand Yes/No"
Period type (*): "Monthly"
Organisation unit levels "Facility"
Organisation units providing data (*) "At selected level(s) only"
THIS IS ABSOLUTELY CRITICAL and the lowest level in the hierarchy must be selected (and not "Country") otherwise Predictors are generated but the values are blank
Generator (*)Description: "[Stock list] - Stock on hand Yes/No - MSR"
Expression: "forEach ?de in :DEG:rDRgmw0sBWn → if(#{?de.iIC4YhgrxQY}==0,0,1)"Sequential sample count (*): "0"
Annual sample count (*): "0"12 [Stock list] - Stockout Yes/No - MSR
This Group Predictor assigns "1" to the "Stockout Yes/No" data field if the stock on hand is zero and otherwise assigns a zero.Name (*): "[Stock list] - Stockout Yes/No - MSR"
Short name (*): "[Stock list] - Stockout Yes/No - MSR"
Output data element (*): "[Item]" (select any item from the Data set)
Output category option combo "Stockout Yes/No"
Period type (*): "Monthly"
Organisation unit levels "Facility"
Organisation units providing data (*) "At selected level(s) only"
THIS IS ABSOLUTELY CRITICAL and the lowest level in the hierarchy must be selected (and not "Country") otherwise Predictors are generated but the values are blank
Generator (*)Description: "[Stock list] - Stockout Yes/No"
Expression: "forEach ?de in :DEG:nYcQWVqVsjx → if(#{?de.iIC4YhgrxQY}==0,1,0)"Sequential sample count (*): "0"
Annual sample count (*): "0"13 [Stock list] - Understock - MSR
This Group Predictor assigns a "1" to the data field "Understock" if the stock is greater than 0 but less than or equal to 3 months.Name (*): "[Stock list] - Understock - MSR"
Short name (*): "[Stock list] - Understock - MSR" Output data element (*): "[Item]" (select any item from the Data set)
Output category option combo "Apprpriate stock"
Period type (*): "Monthly"
Organisation unit levels "Facility"
Organisation units providing data (*) "At selected level(s) only"
THIS IS ABSOLUTELY CRITICAL and the lowest level in the hierarchy must be selected (and not "Country") otherwise Predictors are generated but the values are blank
Generator (*)Description: "[Stock list] - Understock - MSR"
Expression: "forEach ?de in :DEG:rDRgmw0sBWn → if((#{?de.iIC4YhgrxQY}/#{?de.zogrUrI7Crs})>0 && (#{?de.iIC4YhgrxQY}/#{?de.zogrUrI7Crs})<=3,1,0)"Sequential sample count (*): "6"
Annual sample count (*): "0"
5.3 Predictor group
The "Predictor group" is required in order to allow running all Predictors periodically and together by the "Scheduler" rather than having to prompt them one by one. All Predictors required for the DHIS2-RTS can be grouped together and be run together in the Scheduler App.
1 Monthly stock report - Stock calculations
Name (*): "Monthly stock report - Stock calculations - MSR"
Predictors"[Item - MSR] - Closing balance"
"[Item - MSR] - Opening balance"
"[Item - MSR] - Stock discrepancy"
Android Settings Web App - Offline Analytics
[To be completed]
Data Entry (Beta) App - Data entry
[Explanation]
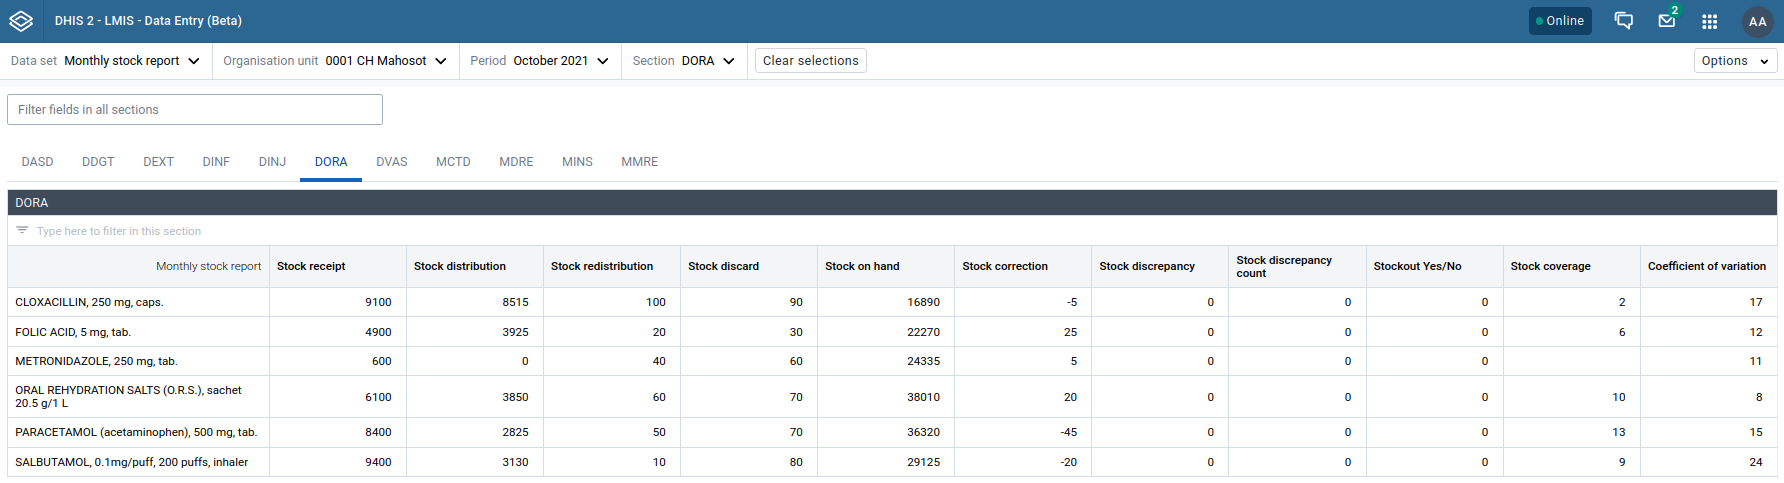
Capture Android App - Data entry
Xx [Screenshot]
Data Visualizer App - Analytics
1 Health facility level
1.1 Statistics
- 1 MSR - Stock receipt
- 2 MSR - Stock distribution
- 3 MSR - Stock redistribution
- 4 MSR - Stock discard
- 5 MSR - Stock on hand
- 6 MSR - Stock correction
- 7 MSR - Stock report complete - Last 3 months
- 8 MSR - Stock report complete - Last 12 months
- 9 MSR - Stock report complete
1.2 Indicators
- 10 MSR - Coefficient of Variation x 10
- 11 MSR - Coefficient of Variation x 10
- 12 MSR - Coefficient of Variation x 10
- 13 MSR - Coefficient of Variation x 10 distribution
- 14 MSR - Coefficient of Variation x 10 distribution
- 15 MSR - Coefficient of Variation x 10 distribution
- 16 MSR - Stock availability
- 17 MSR - Stock availability
- 18 MSR - Stock availability
- 19 MSR - Stock availability
- 20 MSR - Stockout rate
- 21 MSR - Stock availability and stockout rate
- 22 MSR - Stockouts
- 23 MSR - Stockout count
- 24 MSR - Stockout count
- 25 MSR - Stockout count
- 26 MSR - Stockout duration
- 27 MSR - Stockout duration
- 28 MSR - Stock coverage time
- 29 MSR - Stock coverage time distribution
- 30 MSR - Stock coverage time distribution - Last 12 months
- 31 MSR - Stock coverage time distribution - Last month
- 32 MSR - Stock coverage time categories
- 33 MSR - Stock coverage time categories
- 34 MSR - Stock discrepancy
- 35 MSR - Stock discrepancy count
- 36 MSR - Stock discrepancy count
- 37 MSR - Stock discrepancy count - Percentage
- 38 MSR - Report completeness
- 39 MSR - Report completeness
- 40 MSR - Reporting rate
- 41 MSR - Reporting rate on time
2 District level
2.1 Statistics
- 42 MSR - Stock receipt - District
- 43 MSR - Stock distribution - District
- 44 MSR - Stock redistribution - District
- 45 MSR - Stock discard - District
- 46 MSR - Stock on hand - District
- 47 MSR - Stock correction - District
- 48 MSR - Stock report complete - District
2.2 Indicators
- 49 MSR - Coefficient of Variation x 10 - District
- 50 MSR - Coefficient of Variation x 10 - District
- 51 MSR - Coefficient of Variation x 10 - District
- 52 MSR - Coefficient of Variation x 10 distribution - District
- 53 MSR - Coefficient of Variation x 10 distribution - District
- 54 MSR - Coefficient of Variation x 10 distribution - District
- 55 MSR - Stock availability - District
- 56 MSR - Stock availability - District - Last 12 months
- 57 MSR - Stock availability - District - Last month
- 58 MSR - Stockout rate / % - District
- 59 MSR - Stock availability and stockout rate - District
- 60 MSR - Stockouts - District
- 61 MSR - Stockout count - District
- 62 MSR - Stockout count - District
- 63 MSR - Stockout count - District
- 64 MSR - Stockout duration - District
- 65 MSR - Stockout duration - District
- 66 MSR - Stock coverage time - District
- 67 MSR - Stock coverage time distribution - District
- 68 MSR - Stock coverage time distribution - District - Last 12 months
- 69 MSR - Stock coverage time distribution - District - Last month
- 70 MSR - Stock coverage time categories - District
- 71 MSR - Stock coverage time categories - District
- 72 MSR - Stock discrepancy - District
- 73 MSR - Stock discrepancy count - District
- 74 MSR - Stock discrepancy count - District
- 75 MSR - Report completeness - District
- 76 MSR - Reporting rate - District
- 77 MSR - Reporting rate - District
- 78 MSR - Reporting rate on time - District
3 Province level
3.1 Statistics
- 79 MSR - Stock receipt - Province
- 80 MSR - Stock distribution - Province
- 81 MSR - Stock redistribution - Province
- 82 MSR - Stock discard - Province
- 83 MSR - Stock on hand - Province
- 84 MSR - Stock correction - Province
- 85 MSR - Stock report complete - Province
3.2 Indicators
- 86 MSR - Coefficient of Variation x 10 - Province
- 87 MSR - Coefficient of Variation x 10 distribution - Province
- 88 MSR - Coefficient of Variation x 10 distribution - Province
- 89 MSR - Coefficient of Variation x 10 distribution - Province
- 90 MSR - Stock availability - Province
- 91 MSR - Stock availability - Province
- 92 MSR - Stockout rate - Province
- 93 MSR - Stock availability and stockout rate - Province
- 94 MSR - Stockouts - Province
- 95 MSR - Stockout count - Province
- 96 MSR - Stockout count - Province
- 97 MSR - Stockout count - Province
- 98 MSR - Stockout duration - Province
- 99 MSR - Stockout duration - Province
- 100 MSR - Stock coverage time - Province
- 101 MSR - Stock coverage time distribution- Province
- 102 MSR - Stock coverage time categories - Province
- 103 MSR - Stock coverage time categories - Province
- 104 MSR - Stock discrepancy - Province
- 105 MSR - Stock discrepancy count - Province
- 106 MSR - Stock discrepancy count - Province
- 107 MSR - Report completeness - Province
- 108 MSR - Reporting rate - Province
- 109 MSR - Reporting rate on time - Province
4 Country level
4.1 Statistics
- 110 MSR - Stock receipt - Country
- 111 MSR - Stock distribution - Country
- 112 MSR - Stock redistribution - Country
- 113 MSR - Stock discard - Country
- 114 MSR - Stock on hand - Country
- 115 MSR - Stock correction - Country
- 116 MSR - Stock report complete - Country
4.2 Indicators
- 117 MSR - Coefficient of Variation x 10 distribution - Country
- 118 MSR - Coefficient of Variation x 10 distribution - Country
- 119 MSR - Coefficient of Variation x 10 distribution - Country
- 120 MSR - Stock availability - Country
- 121 MSR - Stock availability - Country
- 122 MSR - Stockout rate / % - Country
- 123 MSR - Stock availability and stockout rate - Country
- 124 MSR - Stockouts - Country
- 125 MSR - Stockout count - Country
- 126 MSR - Stockout count - Country
- 127 MSR - Stockout count - Country
- 128 MSR - Stockout duration - Country
- 129 MSR - Stockout duration - Country
- 130 MSR - Stock coverage time distribution - Country
- 131 MSR - Stock coverage time categories - Country
- 132 MSR - Stock coverage time categories - Country
- 133 MSR - Stock discrepancy count - Country
- 134 MSR - Stock discrepancy count - Country
- 135 MSR - Report completeness - Country
- 136 MSR - Reporting rate - Country
- 137 MSR - Reporting rate on time - Country
5 Visualization overview
Visualization Facility District Region Country Visualiations Offline INDICATORS Stock distribution / Coefficient of Variation Calculation - - - Pivot, Bar, Stacked bar Stock distribution / Coefficient of Variation / distribution Count Count Count Count Pivot Column Stockout count Count Count Count Count Pivot, Column, Single value Stockout duration Count Count Count Count Pivot, Bar Stock coverage time Calculation Stock coverage time / Range Calculation, Count Count Count Count Pivot Stock coverage time / distribution Count Count Count Count Pivot, Column Stock discrepancy Count Count Count Count Pivot, Column
By default, all the visualizations above are shown as time series (by month/by day)
Health facility level
Statistics
1 MSR - Stock receipt - Pivot table
Visualization type: select "Pivot table"
Name (*): "MSR - Stock receipt - Pivot table"
Description: "MSR DV 1 - Monthly Stock Reporting / Stock receipt / Last 12 months / Health facility / By item / Pivot table
This report provides the monthly stock receipts as reported at the end of every month."Columns
Period: "Relative periods"
Period type: "Months"
Selected Periods: "Last 12 months"Rows
Data
Data Type: "Data elements"
Data element group: select "[Stock item list] - MSR Disaggregation: "Totals only" Selected items: select all (->>)Filter:
Organisation unit: "User organisation unit"
YOUR DIMENIONSName: "Monthly stock report"
Selected Items: "Stock receipt"Options
Data
Totals
Row totals: tag (appears as a white tick in a green field)
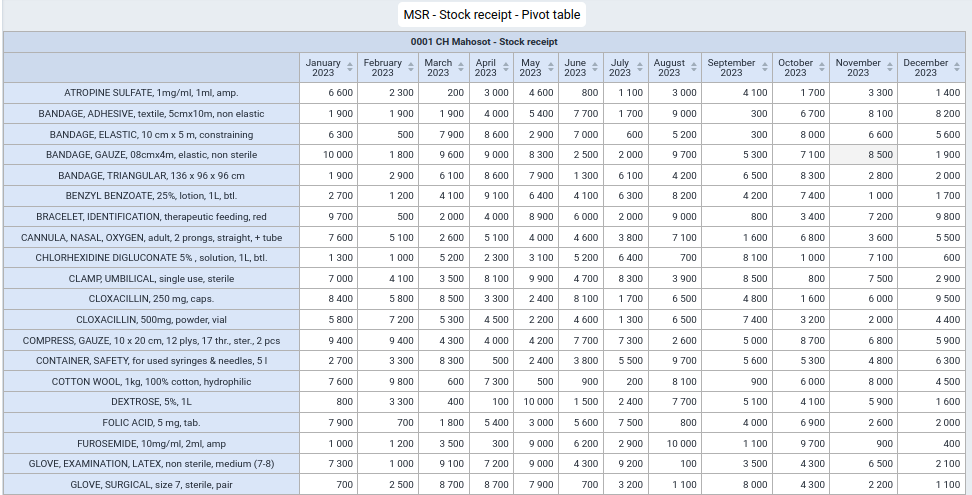
2 MSR - Stock distribution - Pivot table
Visualization type: select "Pivot table"
Name (*): "MSR - Stock distribution - Pivot table"
Description: "MSR DV 2 - Monthly Stock Reporting / Stock distribution / Last 12 months / Health facility / By item / Pivot table
This report provides the monthly stock distributions as reported at the end of every month."Columns
Period: "Relative periods"
Period type: "Months"
Selected Periods: "Last 12 months"Rows
Data
Data Type: "Data elements"
Data element group: select "[Stock item list] - MSR Disaggregation: "Totals only" Selected items: select all (->>)Filter: "Relative periods"
Organisation unit: "User organisation unit"
Selected Periods: "Last 12 months"
YOUR DIMENIONS Name: "Monthly stock report"
Selected Items: "Stock distribution"Options
Data
Totals
Row totals: tag (appears as a white tick in a green field)

3 MSR - Stock redistribution - Pivot table
Visualization type: select "Pivot table"
Name (*): "MSR - Stock redistribution - Pivot table"
Description: "MSR DV 3 - Monthly Stock Reporting / Stock redistribution / Last 12 months / Health facility / By item / Pivot table.
This report provides the monthly stock redistributions as reported at the end of every month."Columns
Period: "Relative periods"
Period type: "Months"
Selected Periods: "Last 12 months"Rows
Data
Data Type: "Data elements"
Data element group: select "[Stock item list] - MSR
Disaggregation: "Totals only" Selected items: select all (->>)Filter: "Relative periods"
Organisation unit: "User organisation unit"
Selected Periods: "Last 12 months"
YOUR DIMENIONS Name: "Monthly stock report"
Selected Items: "Stock redistribution"Options
Data
Totals
Column sub-totals: tag (appears as a white tick in a green field)
Row totals: tag (appears as a white tick in a green field)

4 MSR - Stock discard - Pivot table
Visualization type: select "Pivot table" Name (*): "MSR - Stock discard - Pivot table"
Description: "MSR DV 4 - Monthly Stock Reporting / Stock discard / Last 12 months / Health facility / By item / Pivot table
This report provides the monthly stock discards as reported at the end of every month."Columns
Period: "Relative periods"
Period type: "Months"
Selected Periods: "Last 12 months"Rows
Data
Data Type: "Data elements"
Data element group: select "[Stock item list] - MSR
Disaggregation: "Totals only"
Selected items: select all (->>)Filter: "Relative periods"
Organisation unit: "User organisation unit"
Selected Periods: "Last 12 months"
YOUR DIMENIONS Name: "Monthly stock report"
Selected Items: "Stock discard"Options
Data
Totals
Row totals: tag (appears as a white tick in a green field)

5 MSR - Stock on hand - Pivot table
Visualization type: select "Pivot table"
Name (*): "MSR - Stock on hand - Pivot table"
Description: "MSR DV 5 - Monthly Stock Reporting / Stock on hand / Last 12 months / Health facility / By item / Pivot table
This report provides the monthly stock on hand as reported at the end of every month.Columns
Period: "Relative periods"
Period type: "Months"
Selected Periods: "Last 12 months"Rows
Data
Data Type: "Data elements"
Data element group: select "[Stock item list] - MSR
Disaggregation: "Totals only"
Selected items: select all (->>)Filter: "Relative periods"
Organisation unit: "User organisation unit"
Selected Periods: "Last 12 months"
YOUR DIMENIONS Name: "Monthly stock report"
Selected Items: "Stock on hand"Options
Data
Totals
Column sub-totals: tag (appears as a white tick in a green field)
Row totals: tag (appears as a white tick in a green field)

6 MSR - Stock correction - Pivot table
Visualization type: select "Pivot table"
Name (*): "MSR - Stock correction - Pivot table"
Description: "MSR DV 6 - Monthly Stock Reporting / Stock correction / Last 12 months / Health facility / By item / Pivot table This report provides the monthly stock corrections as reported at the end of every month."Columns
Period: "Relative periods"
Period type: "Months"
Selected Periods: "Last 12 months"Rows
Data
Data Type: "Data elements"
Data element group: select "[Stock item list] - MSR
Disaggregation: "Totals only"
Selected items: select all (->>)Filter: "Relative periods"
Organisation unit: "User organisation unit"
Selected Periods: "Last 12 months"
YOUR DIMENIONS Name: "Monthly stock report"
Selected Items: "Stock correction"Options
Data
Totals
Row totals: tag (appears as a white tick in a green field)

7 MSR - Stock report complete - Pivot table - Last 3 months
Visualization type: select "Pivot table"
Name (*): "MSR - Stock report complete - Pivot table - Last 3 months"
Description: "MSR DV 7 - Monthly Stock Reporting / Stock report complete / Last 3 month / Health facility / By item / Pivot table This report provides an overview of all stock data from the last month."Columns
Period: "Relative periods"
Period type: "Months"
Selected Periods: "Last month"
YOUR DIMENIONS
Name: "Monthly stock report"
Selected Items:
- "Stock receipt"
- "Stock distribution"
- "Stock redistribution"
- "Stock discard"
- "Stock on hand"
- "Stock correction"
Rows
Data
Data Type: "Data elements"
Data element group: select "[Stock item list] - MSR
Disaggregation: "Totals only"
Selected items: select all (->>)Filter: "Relative periods"
Organisation unit: "User organisation unit"
Selected Periods: "Last 12 months"
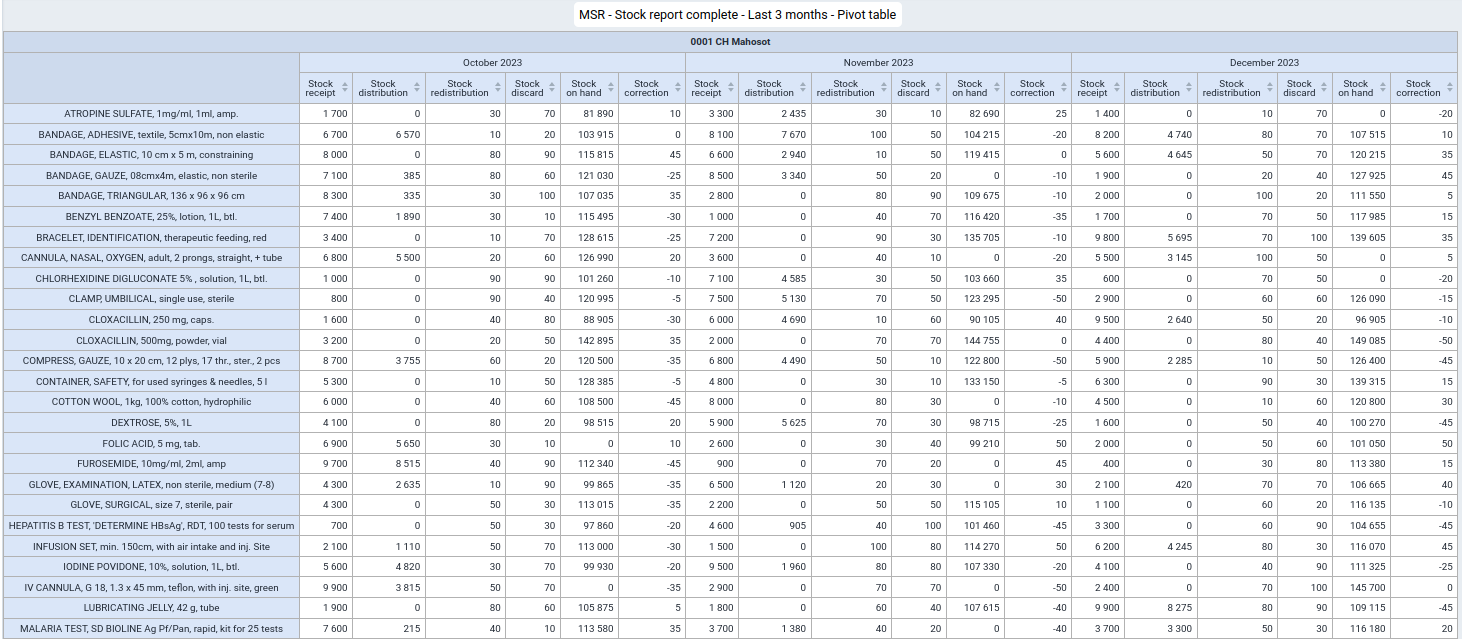
8 MSR - Stock report complete - Last 12 months - Pivot table
Visualization type: select "Pivot table"
Name (*): "MSR - Stock report complete - Last 12 months - Pivot table"
Description: "MSR DV 8 - Monthly Stock Reporting / Stock report complete / Last 12 months / Health facility / By item / Pivot table This report provides the an overview of all stock data from the previous 12 months."Columns
Period: "Relative periods"
Period type: "Months"
Selected Periods: "Last 12 months"Rows
Data
Data Type: "Data elements"
Data element group: select "[Stock item list] - MSR
Disaggregation: "Totals only"
Selected items: select all (->>)
YOUR DIMENIONS
Name: "Monthly stock report"
Selected Items:
- "Stock receipt"
- "Stock distribution"
- "Stock redistribution"
- "Stock discard"
- "Stock on hand"
- "Stock correction"
Filter
Organisation unit: "User organisation unit"Options
Data
Totals
Column sub-totals: tag (appears as a white tick in a green field)
Row totals: tag (appears as a white tick in a green field)

9 MSR - Stock report complete - Column chart
Visualization type: select "Pivot table"
Name (*): MSR - Stock report complete - Column chart
Description: "MSR DV 9 - Monthly Stock Reporting / Stock report complete / Last 12 month / Health facility / Individual item / Column chart This report provides an overview of all stock data from the past 12 months represented as a bar chart for each of the transactions only for a single item."Series
YOUR DIMENIONS
Name: "Monthly stock report"
Selected Items:
- "Stock receipt"
- "Stock distribution"
- "Stock redistribution"
- "Stock discard"
- "Stock on hand"
- "Stock correction"Category
Period: "Relative periods"
Period type: "Months"
Selected Periods: "Last 12 months"Filter
Organisation unit: "User organisation unit"
DataData Type: "Data elements"
Data element group: select "[Stock item list] - MSR
Disaggregation: "Totals only"
Selected items: select all (->>)

Indicators
10 MSR - Coefficient of Variation x 10 - Pivot table
Visualization type: select "Pivot table"
Name (*): "MSR - Coefficient of Variation x 10 - Pivot table"
Description: "MSR DV 10 - Monthly Stock Reporting / Stock distribution / Coefficient of Variation x 10 / Last 12 months / Health facility / By item / Pivot table This report provides the coefficient of variation (standard deviation of stock distribution divided by the average stock distribution) which is based on the previous six months for each of the twelve month as a Pivot table. Since decimals cannot be displayed in this report, the result of the actual calculation is multiplied by 10 and rounded to the next integer."Columns
Period: "Relative periods"
Period type: "Months"
Selected Periods: "Last 12 months"Rows
Data
Data Type: "Data elements"
Data element group: select "[Stock item list] - MSR
Disaggregation: "Totals only"
Selected items: select all (->>)Filter: "Relative periods"
Organisation unit: "User organisation unit"
YOUR DIMENIONSName: "Monthly stock report"
Selected Items: "Coefficient of variation"Options
Data
Totals
Row totals: tag (appears as a white tick in a green field)
Legend
Use legend for chart colors: tag (appears as a white tick in a green field)
Legend type
Select a legend: tag (appears as a white tick in a green field)
Legend: "Coefficient of variation"
Show legend key tag (appears as a white tick in a green field)
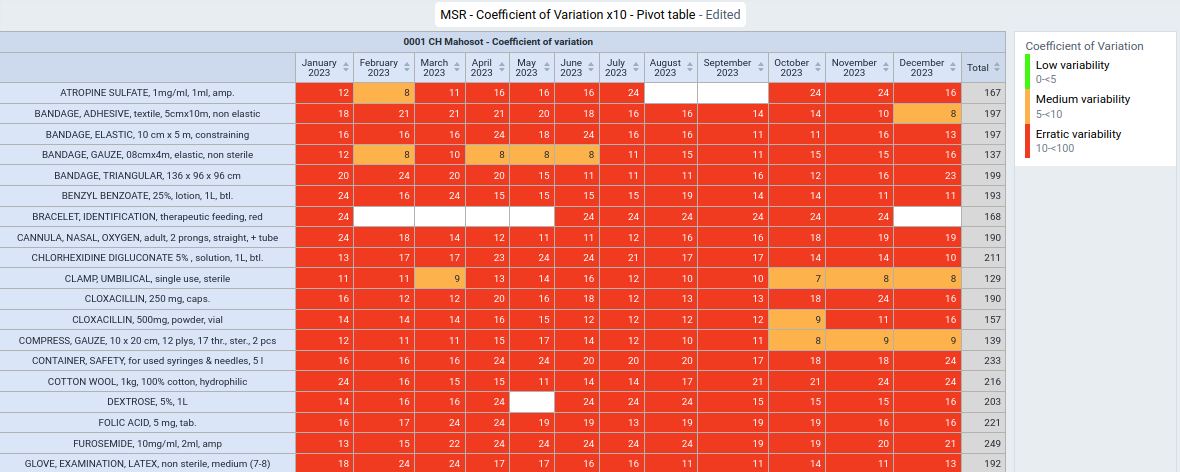
11 MSR - Coefficient of Variation x 10 - Stacked bar chart
Visualization type: select "Stacked bar"
Name (*): "MSR - Coefficient of Variation x 10 - Stacked bar chart"
Description: "MSR DV 11 - Monthly Stock Reporting / Stock distribution / Coefficient of Variation x 10 / Last 12 months / Health facility / Across items / Stacked bar chart This report provides the coefficient of variation (standard deviation of stock distribution divided by the average stock distribution) which is based on the previous six months as a group of column charts for each of the twelve months. Since decimals cannot be displayed in this report the result of the actual calculation is multiplied by 10 and rounded to the next integer."Series
Period: "Relative periods"
Period type: "Months"
Selected Periods: "Last 12 months"Category
Data
Data Type: "Data elements"
Data element group: select "[Stock item list] - MSR
Disaggregation: "Totals only"
Selected items: select all (->>)Filter: "Relative periods"
Organisation unit: "User organisation unit"
YOUR DIMENIONSName: "Monthly stock report"
Selected Items: "Coefficient of variation"Options
Legend
Use legend for chart colors: tag (appears as a white tick in a green field)
Legend type
Select a legend: tag (appears as a white tick in a green field)
Legend: "Coefficient of variation"
Show legend key tag (appears as a white tick in a green field)
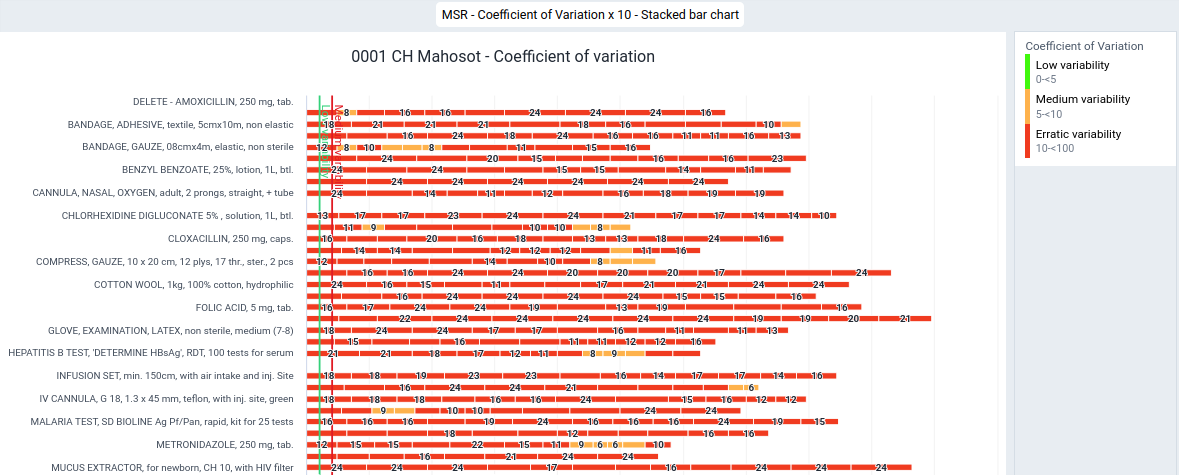
12 MSR - Coefficient of Variation x 10 - Column chart
Visualization type: select "Column"
Name (*): "MSR - Coefficient of Variation x 10 - Column chart"
Description "MSR DV 12 - Monthly Stock Reporting / Stock distribution / Coefficient of Variation x 10 / Last 12 months / Health facility / By item / Bar chart This report provides the coefficient of variation (standard deviation of stock distribution divided by the average stock distribution) which is based on the previous six months as a group of column charts for each of the twelve months. Since decimals cannot be displayed in this report the result of the actual calculation is multiplied by 10 and rounded to the next integer."Series
Period: "Relative periods"
Period type: "Months"
Selected Periods: "Last 12 months"Category
Data
Data Type: "Data elements"
Data element group: select "[Stock item list] - MSR
Disaggregation: "Totals only"
Selected items: select all (->>)Filter: "Relative periods"
Organisation unit: "User organisation unit"
YOUR DIMENIONSName: "Monthly stock report"
Selected Items: "Coefficient of variation"Options
Data
Lines
Target line
Value: "10"
Title: "Medium variability"
Size: "Regular"
Position: "Left"
Colour: select red
Base line
Value: "5"
Title: "Low variability"
Size: "Regular"
Position: "Left"
Colour: select greenLegend
Use legend for chart colors: tag (appears as a white tick in a green field)
Legend type
Select a legend: tag (appears as a white tick in a green field)
Legend: "Coefficient of variation"
Show legend key tag (appears as a white tick in a green field)
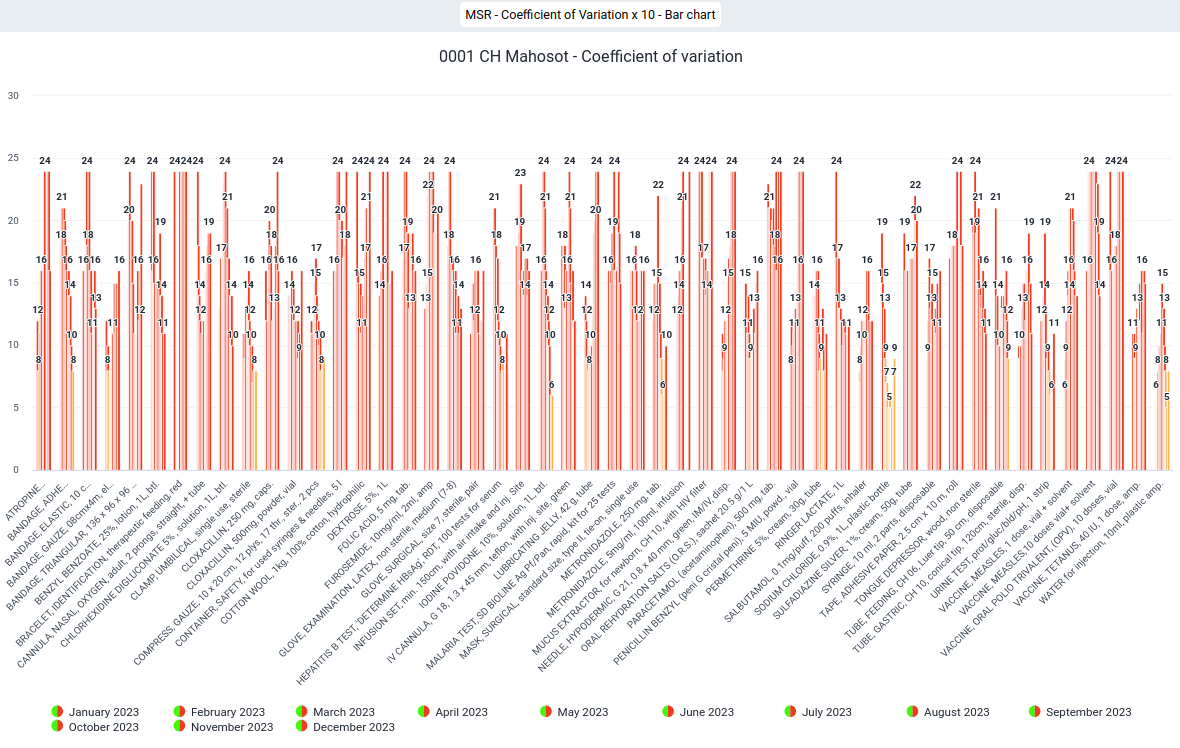
13 MSR - Coefficient of Variation x 10 distribution - Pivot table
Visualization type: select "Pivot table"
Name (*): "13 MSR - Coefficient of Variation x 10 distribution - Pivot table"
Description: "MSR DV 13 - Monthly Stock Reporting / Coefficient of Variation x 10 distribution / Last 12 months / Health facility / By item / Pivot table This report provides the coefficient of variation (standard deviation of stock distribution divided by average stock distribution) for each item at a health facility over the last 12 months with a colour legend."Columns
Data
Data Type: "Indicators"
Indicator group: "Coefficient of variation"
Selected items: select the following items in the following order:
- Low variability
- Medium variability
- High variability
Rows
Period: "Relative periods"
Period type: "Months"
Selected Periods: "Last 12 months"Filter: "Relative periods"
Organisation unit: "User organisation unit"
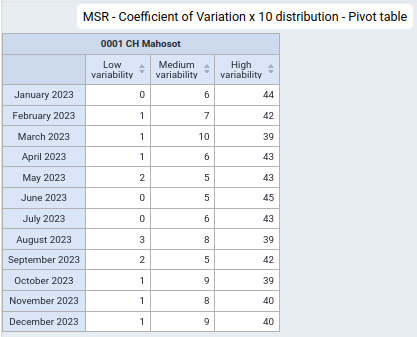
14 MSR - Coefficient of Variation x 10 distribution - Stacked column chart
Visualization type: select "Pivot table"
Name (*): "14 MSR - Coefficient of Variation x 10 distribution - Last 12 months - Stacked column chart"
Description: "MSR DV 14 - Monthly Stock Reporting / Coefficient of Variation x 10 distribution / Last 12 months / Health facility / By item / Stacked column chart This report provides the number of items which fall into the respective coefficient of variation (standard deviation of stock distribution divided by average stock distribution) ranges (low, medium and high) across all items at a health facility over the last 12 months."Series
Data
Data Type: "Indicators"
Indicator group: "Coefficient of variation"
Selected items: select the following items in the following order:
- Low variability
- Medium variability
- High variabilityCategory
Period: "Relative periods"
Period type: "Months"
Selected Periods: "Last 12 months"Filter
Organisation unit: "User organisation unit"
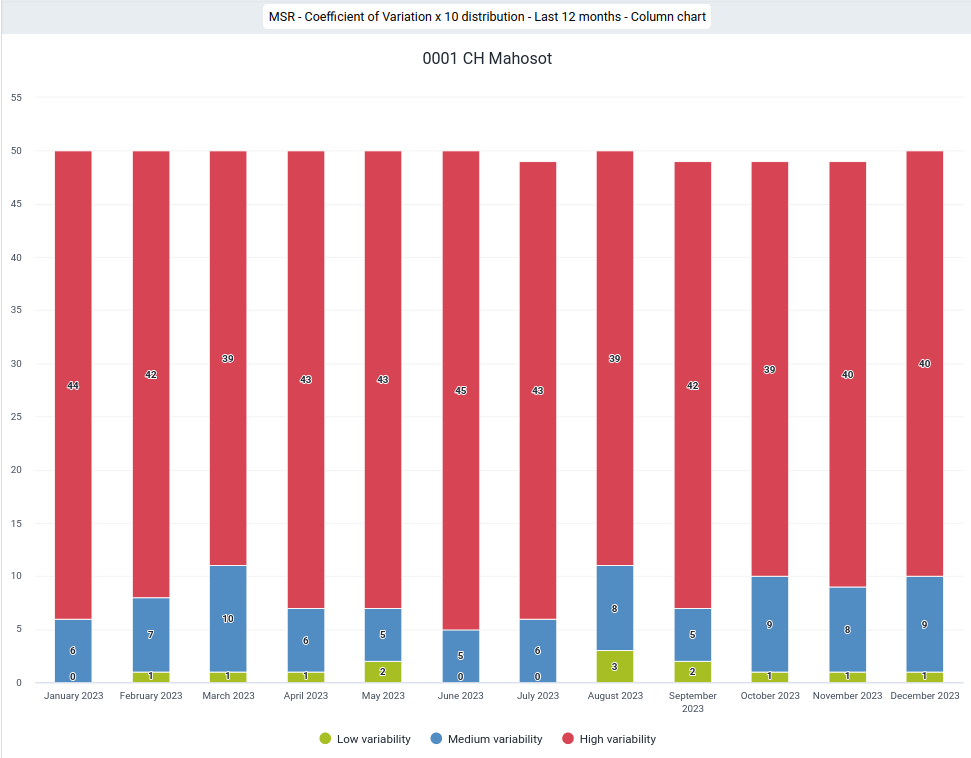
15 MSR - Coefficient of Variation x 10 distribution - Column chart
Visualization type: select "Pivot table"
Name (*): "MSR - Coefficient of Variation x 10 distribution - Last month - Column chart"
Description: "MSR DV 15 - Monthly Stock Reporting / Coefficient of Variation x 10 distribution / Last month / Health facility / By item / Column chart This report provides the number of items which fall into the respective coefficient of variation (standard deviation of stock distribution divided by average stock distribution) ranges (low, medium and high) across all items at a health facility for the last month."Series
Data
Data Type: "Indicators"
Indicator group: "Coefficient of variation"
Selected items: select the following items in the following order:
- Low variability
- Medium variability
- High variabilityCategory
Period: "Relative periods"
Period type: "Months"
Selected Periods: "Last month"Filter
Organisation unit: "User organisation unit"
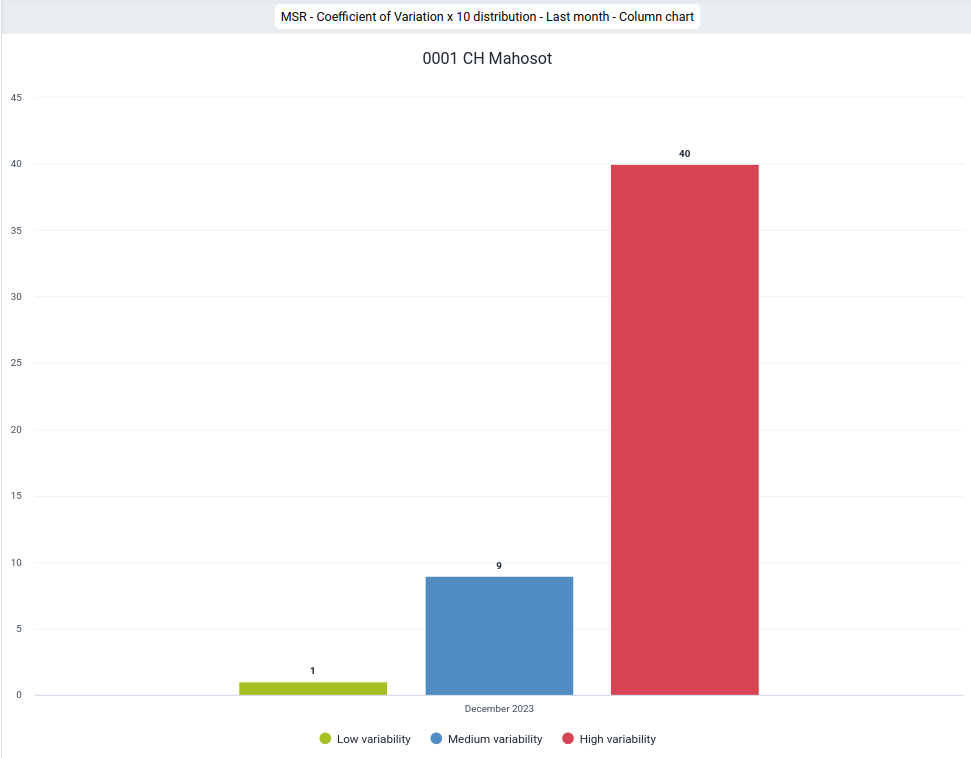
16 MSR - Stock availability - Pivot table
Visualization type: select "Pivot table"
Name (*): "MSR - Stock availability - Pivot table"
Description: "MSR DV 16 - Monthly Stock Reporting / Stock availability / Last 12 months / Health facility / By item / Pivot table This report provides the stock availability across all stock items for an individual health facility over the last 12 months with a colour legend."Columns
Period: "Relative periods"
Period type: "Months"
Selected Periods: "Last 12 months"Rows
Organisation unit: "User organisation unit"
Filter
Data
Data Type: "Indicators"
Selected items: select "Stock availability / %"Options
Legend
Use legend for chart colors: tag (appears as a white tick in a green field)
Legend type
Select a legend: tag (appears as a white tick in a green field)
Legend: "Stock availability / %"
Show legend key tag (appears as a white tick in a green field)

17 MSR - Stock availability - Column chart
Visualization type: select "Bar"
Name (*): "MSR - Stock availability - Column chart"
Description: "MSR DV 17 - Monthly Stock Reporting / Stock availability / Last 12 months / Health facility / Bar chart This report displays the stock availability (number of items with non-zero stock on hand divided by the total number of stock items) as percentage for the past 12 months as column charts with a legend."Series
Data
Data Type: "Indicators"
Selected items: select "Stock availability / %"Category
Period: "Relative periods"
Period type: "Months"
Selected Periods: "Last 12 months"Filter: "Relative periods"
Organisation unit: "User organisation unit"
Options
Legend
Use legend for chart colors: tag (appears as a white tick in a green field)
Legend type
Select a legend: tag (appears as a white tick in a green field)
Legend: "Stock availability / %"
Show legend key tag (appears as a white tick in a green field)
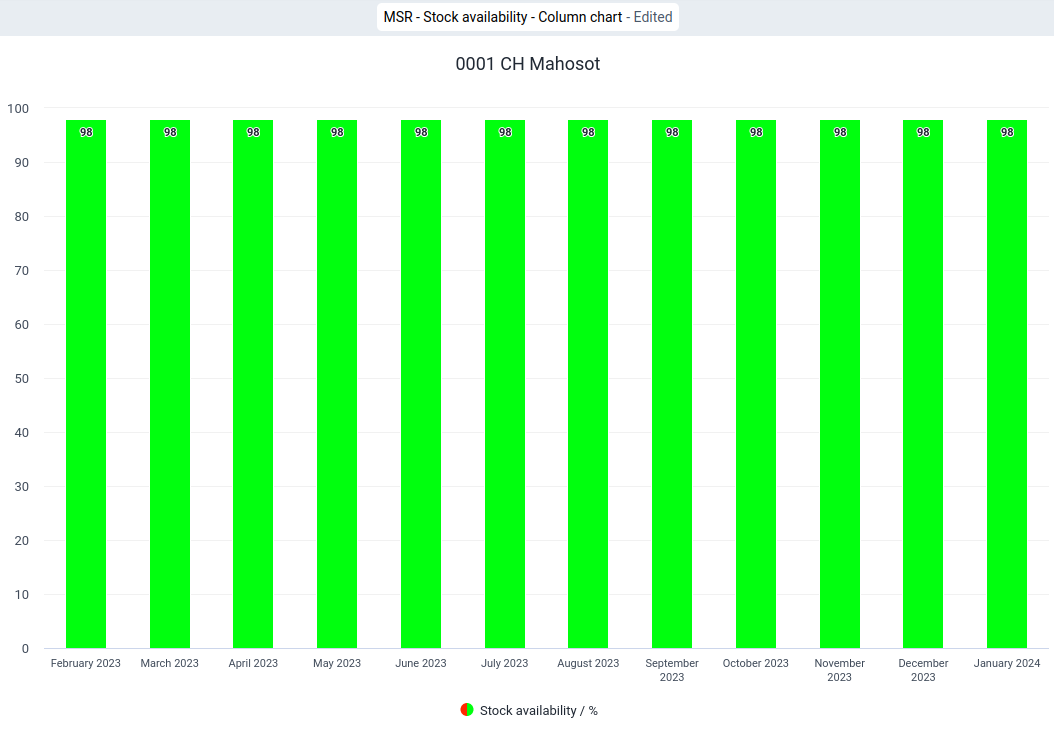
18 MSR - Stock availability - Single value chart
Visualization type: select "Single value"
Name (*): "MSR - Stock availability - Single value chart"
Description: "MSR DV 18 - Monthly Stock Reporting / Stock availability / Last month / Health facility / Single value chart This report displays the stock availability (number of items with non-zero stock on hand divided by the total number of stock items) as percentage for the last month as a single value chart with a legend."Series
Data
Data Type: "Indicators"
Selected items: select "Stock availability / %"Filter: "Relative periods"
Organisation unit: "User organisation unit"
Period: "Relative periods"Period type: "Months"
Selected Periods: "Last month"Options
Legend
Use legend for chart colors: tag (appears as a white tick in a green field)
Legend style
Legend changes background color: tag (appears as a white tick in a green field)
Legend type
Select a legend: tag (appears as a white tick in a green field)
Legend: "Stock availability / %"
Show legend key tag (appears as a white tick in a green field)
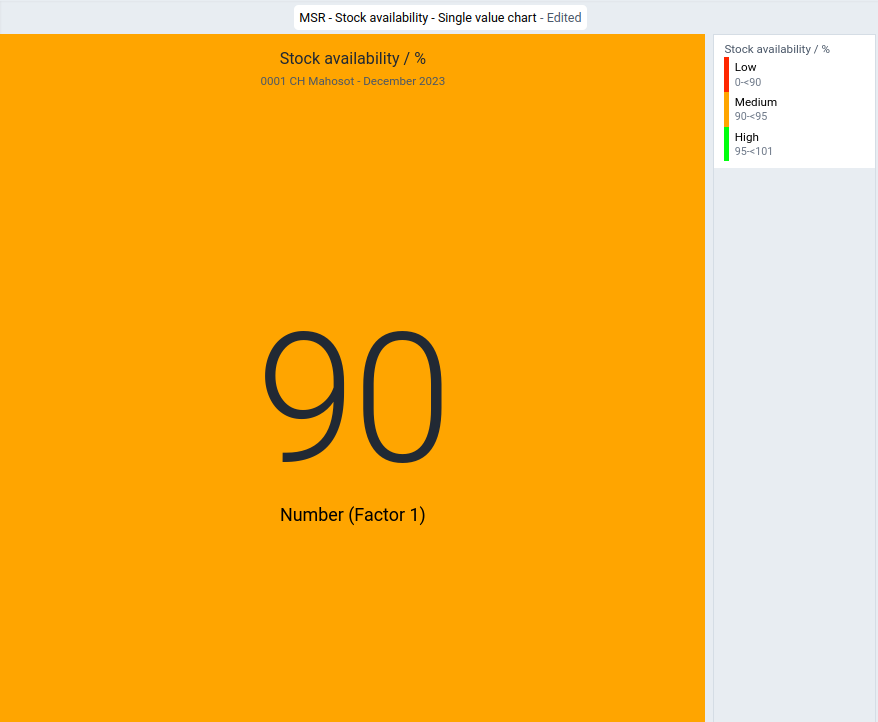
19 MSR - Stock availability - Gauge chart
Visualization type: select "Gauge"
Name (*): "MSR - Stock availability - Gauge chart"
Description: "MSR DV 19 - Monthly Stock Reporting / Stock availability / Last month / Health facility / Gauge chart This report displays the stock availability (number of items with non-zero stock on hand divided by the total number of stock items) as percentage for the last month as a gauge chart with a legend."Series
Data
Data Type: "Indicators"
Selected items: select "Stock availability / %"Filter: "Relative periods"
Organisation unit: "User organisation unit"
Period: "Relative periods"Period type: "Months"
Selected Periods: "Last month"Options
Legend
Use legend for chart colors: tag (appears as a white tick in a green field)
Legend style
Legend changes background color: tag (appears as a white tick in a green field)
Legend type
Select a legend: tag (appears as a white tick in a green field)
Legend: "Stock availability / %"
Show legend key tag (appears as a white tick in a green field)
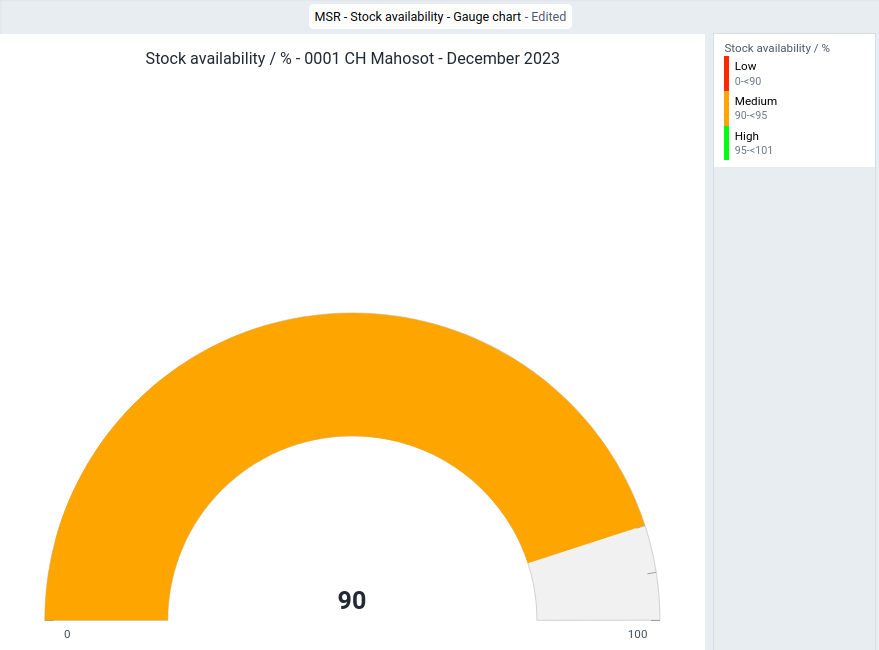
20 MSR - Stockout rate - Column chart
Visualization type: select "Column"
Name (*): "MSR - Stockout rate - Column chart"
Description: "MSR DV 20 - Monthly Stock Reporting / Stockout rate / Last 12 months / Health facility / Column chart This report displays a column chart with the percentage of items with a stockout for the past 12 months."Series
Data Type: "Indicators"
Indicator group: "Stock availability"
Selected items: "Stockout rate / %"
Category
Period: "Relative periods"
Period type: "Months"
Selected Periods: "Last 12 month"Filter
Organisation unit: "User organisation unit"
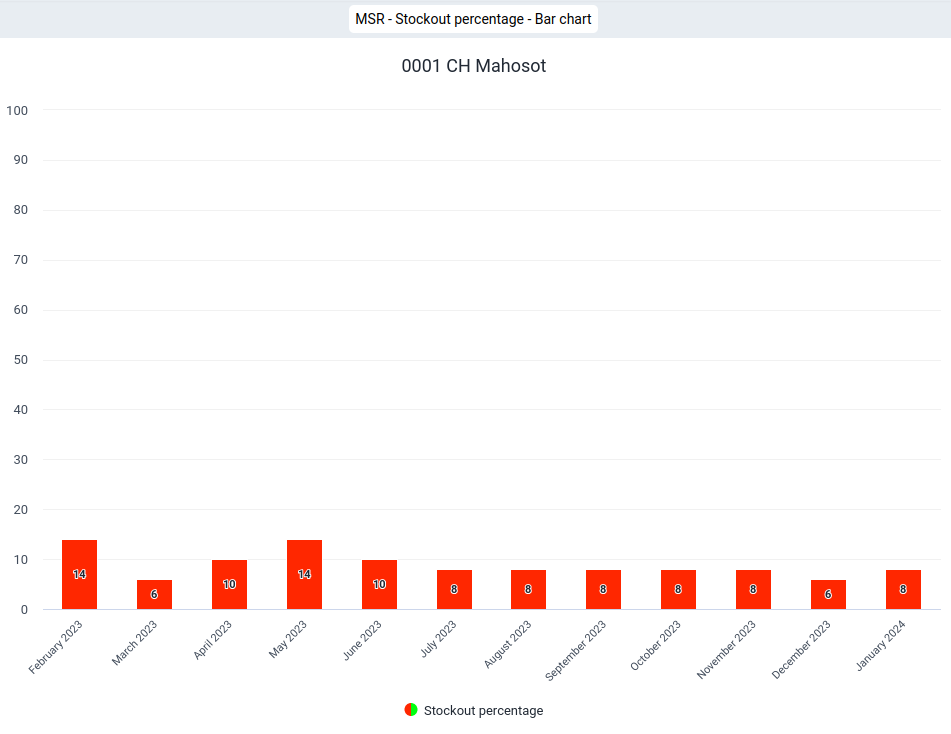
21 MSR - Stock availability and stockout rate - Stacked column chart
Visualization type: select "Stacked column"
Name (*): "MSR - Stock availability and stockout rate - Stacked column chart"
Description: "MSR DV 21 - Monthly Stock Reporting / Stock availability and stockout rate / Last 12 months / Health facility / Stacked column chart This report displays the stock availability (as percentage) and the stockout rate (which by definition must add up to 100%) as a Stacked column chart."Series
Data Type: "Indicators"
Indicator group: "Stockout count"
Selected items:
- "Stock availability / %"
- "Stockout rate / %"
Category
Period: "Relative periods"
Period type: "Months"
Selected Periods: "Last 12 month"Filter
Organisation unit: "User organisation unit"
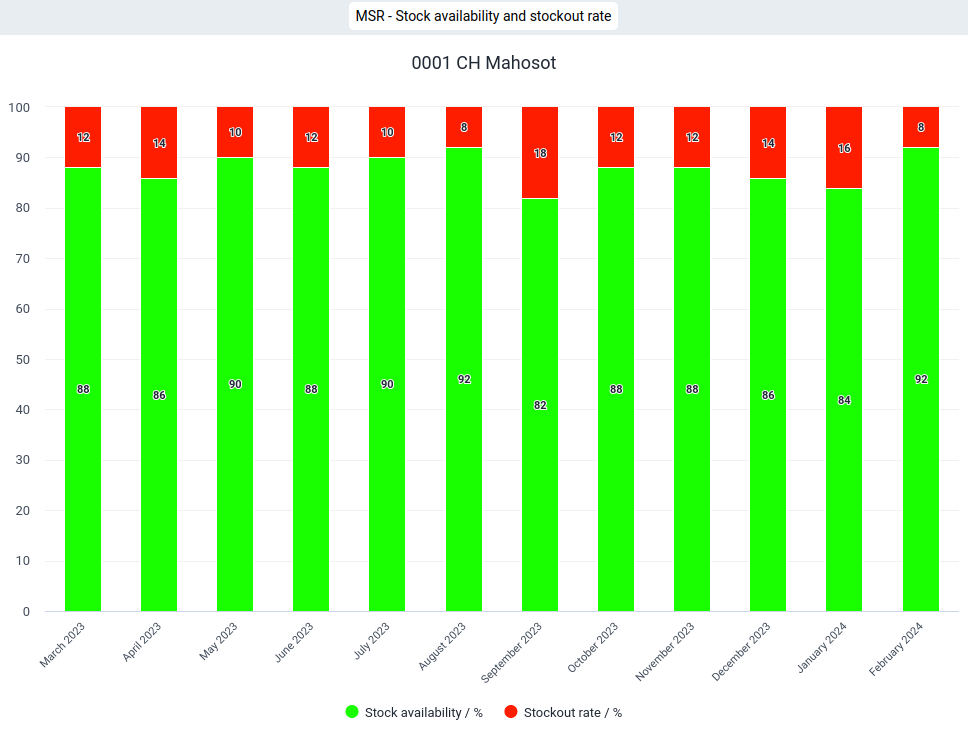
22 MSR - Stockouts - Stacked column chart
Visualization type: select "Stacked column"
Name (*): "MSR - Stockouts - Stacked column chart"
Description: "MSR DV 22 - Monthly Stock Reporting / Stockout by item / Last 12 months / Health facility / By item / Stacked column chart For each of the last 12 months, this report displays a separate stacked column chart with all items which had a stockout."Series
Data
Data Type: "Data elements"
Data element group: select "[Stock item list] - MSR
Disaggregation: "Totals only"
Selected items: select all (->>)Category
Period: "Relative periods"
Period type: "Months"
Selected Periods: "Last 12 months"Filter: "Relative periods"
Organisation unit: "User organisation unit"
YOUR DIMENIONSName: "Monthly stock report"
Selected Items: "Stockout Yes/No"
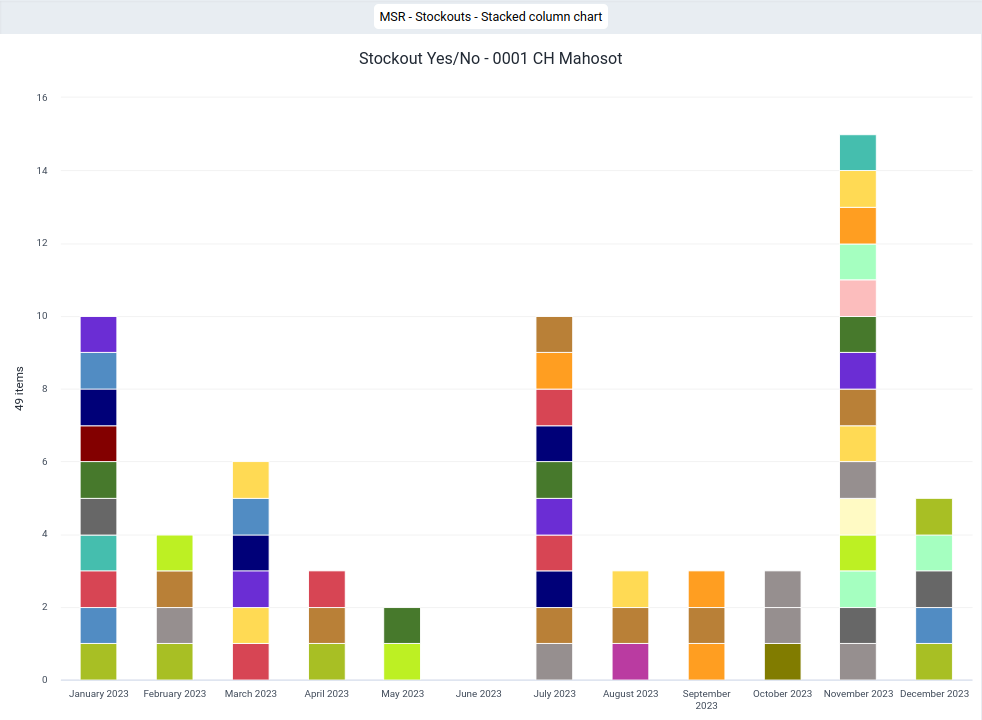
23 MSR - Stockout count - Pivot table
Visualization type: select "Pivot table"
Name (*): "MSR - Stockout count - Pivot table"
Description: "MSR DV 23 - Monthly Stock Reporting / Stockout count / Last 12 months / Health facility / Pivot table This report displays the number of stockouts for all items across a health facility for each of the past 12 months as a Pivot table."Columns
Period: "Relative periods"
Period type: "Months"
Selected Periods: "Last 12 months"Filter
Organisation unit: "User organisation unit"
DataData Type: "Indicators"
Indicator group: select "Stockout count"
Selected items: select "Stockout count"Options
Data
Totals
Row totals: tag (appears as a white tick in a green field)
Options
Legend
Use legend for chart colors: tag (appears as a white tick in a green field)
Legend style
Legend changes background color: tag (appears as a white tick in a green field)
Legend type
Select a legend: tag (appears as a white tick in a green field)
Legend: "Stockout count"

24 MSR - Stockout count - Column chart
Visualization type: select "Column"
Name (*): "MSR DV 24 - Monthly Stock Reporting / Stockout count / Last 12 months / Health facility / Column chart This report displays the number of stockouts for each of the past 12 months as a column chart."Series
YOUR DIMENIONS
Name: "Monthly stock report"
Selected Items: "Stockout Yes/No"Category
Period: "Relative periods"
Period type: "Months"
Selected Periods: "Last 12 months"Filter
Organisation unit: "User organisation unit"
DataData Type: "Indicators"
Indicator group: select "Stockout count"
Selected items: select "Stockout count"Options
Legend
Use legend for chart colors: tag (appears as a white tick in a green field)
Legend type
Legend changes background color: tag (appears as a white tick in a green field)
Select a legend: "Stockout count"
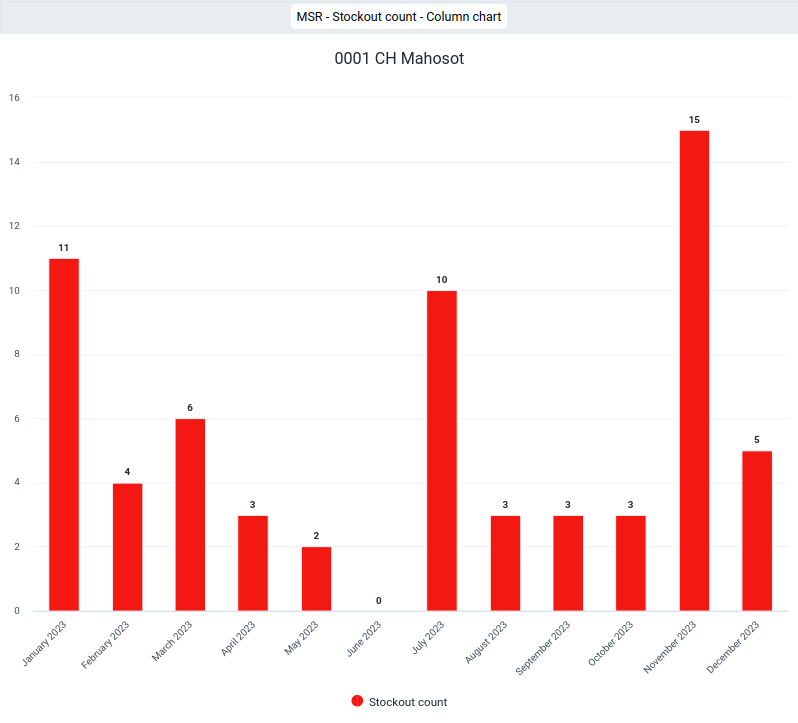
25 MSR - Stockout count - Single value chart
Visualization type: select "Single value"
Name (*): "MSR - Stockout count - Single value chart"
Description: "MSR DV 25 - Monthly Stock Reporting / Stockout count / Last month / Health facility / Single value chart This report displays the number of stockouts during the last month as a single value chart."Series
Data
Data Type: "Indicators"
Selected items: select "Stockout count"Filter: "Relative periods"
Organisation unit: "User organisation unit"
Period: "Relative periods"Period type: "Months"
Selected Periods: "Last month"Options
Legend
Use legend for chart colors: tag (appears as a white tick in a green field)
Legend style
Legend changes background color: tag (appears as a white tick in a green field)
Legend type
Select a legend: tag (appears as a white tick in a green field)
Legend: "Stockout count"
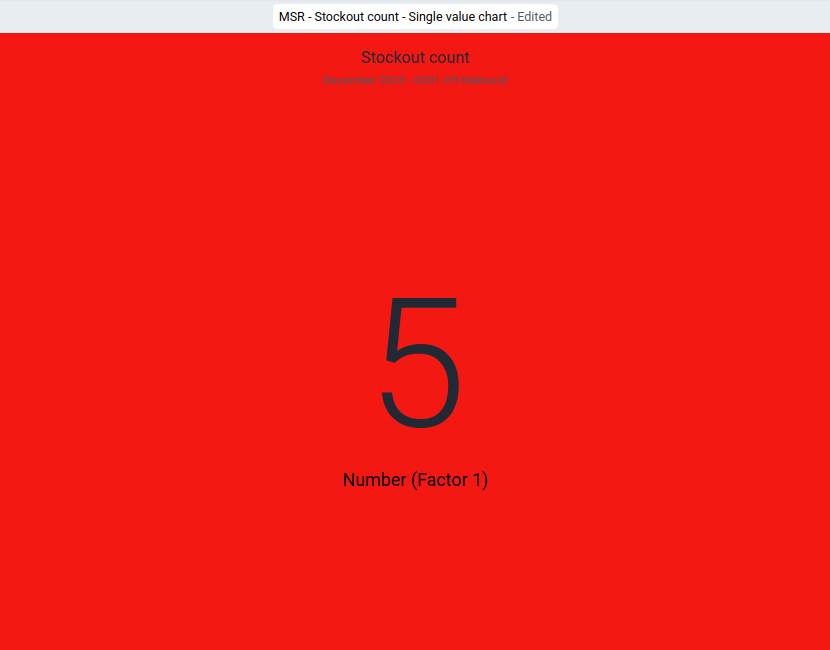
26 MSR - Stockout duration - Pivot table
Visualization type: select "Pivot table"
Name (*): "MSR - Stockout duration - Pivot table"
Descriptions: "MSR DV 26 - Monthly Stock Reporting / Stockout duration / Last 12 months / Health facility / Pivot table This report displays a Pivot table by item with a "1" indicating a stockout (and "0" indicating stock was available) with a total for the past 12 months."Columns
YOUR DIMENIONS
Name: "Monthly stock report"
Selected Items: "Stockout Yes/No"
Period: "Relative periods"
Period type: "Months"
Selected Periods: "Last 12 month"Rows
Data
Data Type: "Data elements"
Data element group: select "[Stock item list] - MSR
Disaggregation: "Totals only"
Selected items: select all (->>)Filter
Organisation unit: "User organisation unit"
Options
Data
Totals
Row totals: tag (appears as a white tick in a green field)
Legend
Use legend for chart colors: tag (appears as a white tick in a green field)
Legend style
Legend changes background color: tag (appears as a white tick in a green field)
Legend type
Select a legend: tag (appears as a white tick in a green field)
Legend: "Stockout count"
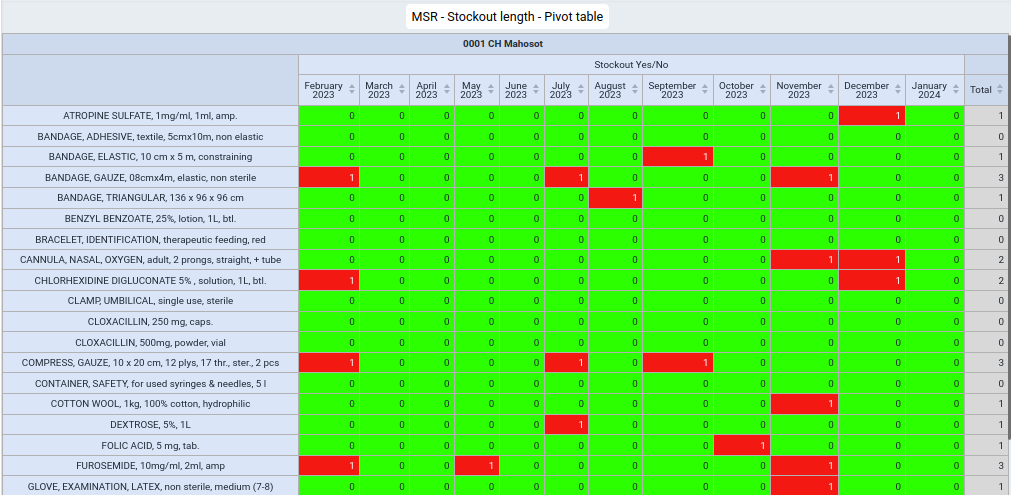
27 MSR - Stockout duration - Bar chart
Visualization type: select "Pivot table"
Name (*): "MSR - Stockout duration - Bar chart"
Description: "MSR DV 27 - Monthly Stock Reporting / Stockout duration / Last 12 months / Health facility / Bar chart This report displays a bar chart with the number of stockouts for each item during the past 12 months."Series
YOUR DIMENIONS
Name: "Monthly stock report"
Selected Items: "Stockout Yes/No"Category
Data
Data Type: "Data elements"
Data element group: select "[Stock item list] - MSR
Disaggregation: "Totals only"
Selected items: select all (->>)Filter
Organisation unit: "User organisation unit"
Period: "Relative periods"Period type: "Months"
Selected Periods: "Last 12 month"Options
Legend
Legend type
Select a legend: tag (appears as a white tick in a green field)
Legend: "Stockout count"Data
Hide empty categories: "All"
Limit values
Minimum data value: "> 0"
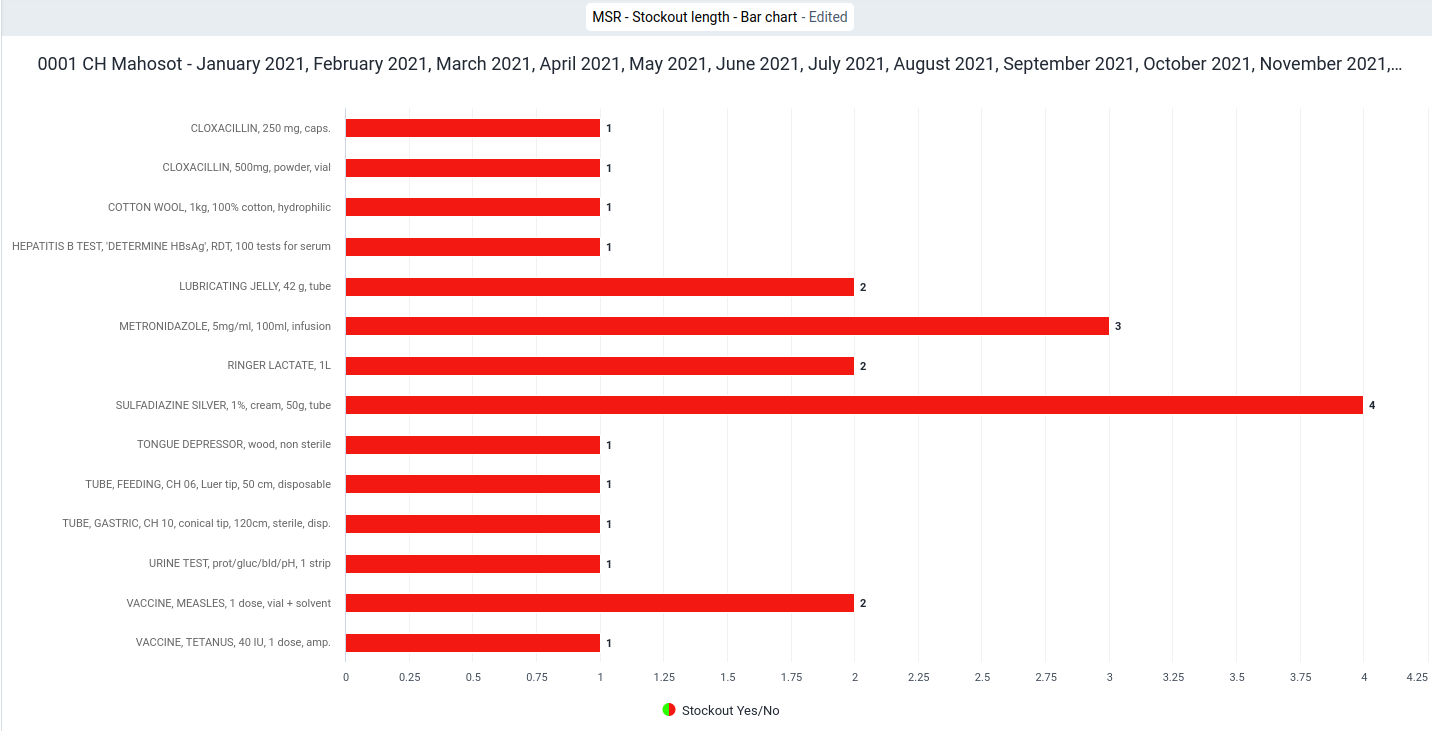
28 MSR - Stock coverage time - Pivot table
Visualization type: select "Pivot table"
Name (*): "MSR - Stock coverage time - Pivot table"
Description: "MSR DV 28 - Monthly Stock Reporting / Stock coverage time / absolute / Last 12 months / Health facility / Pivot table
This report displays a Pivot table by item with the coverage time (stock on hand divided by stock distributed during the last month) for the past 12 months. A blank field is shown, if either the stock on hand or the stock distribution for a month is zero."Columns
Period: "Relative periods"
Period type: "Months"
Selected Periods: "Last 12 month"Rows
Data
Data Type: "Data elements"
Data element group: select "[Stock item list] - MSR
Disaggregation: "Totals only"
Selected items: select all (->>)Filter
Organisation unit: "User organisation unit"
Level: "Facility"
YOUR DIMENIONS
Name: "Monthly stock report"
Selected Items: "Stockout coverage"Options
Legend
Use legend for chart colors: tag (appears as a white tick in a green field)
Legend style
Legend changes background color: tag (appears as a white tick in a green field)
Legend type
Select a legend: tag (appears as a white tick in a green field)
Legend: "Stock coverage time"
Show legend key tag (appears as a white tick in a green field)
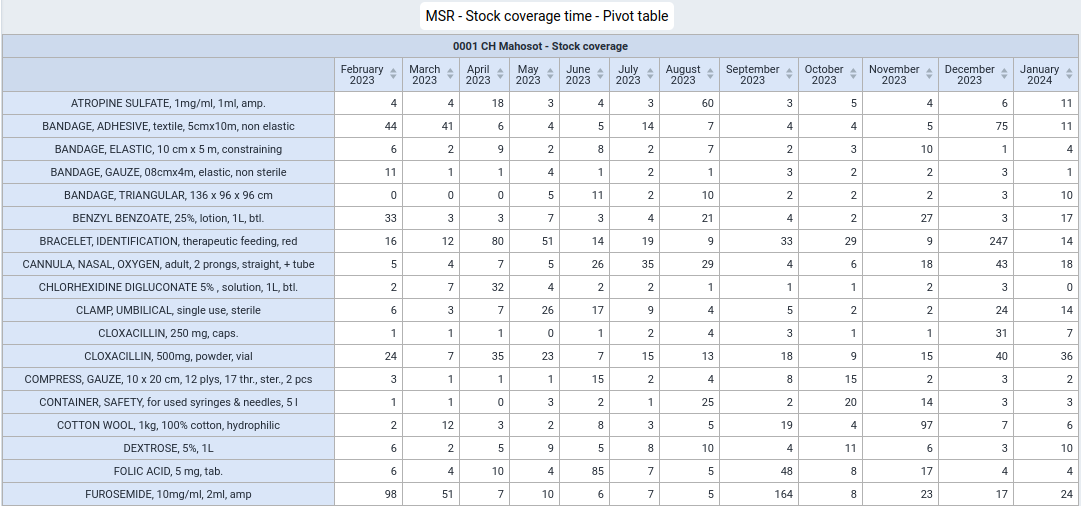
29 MSR - Stock coverage time distribution - Pivot table
Visualization type: select "Pivot table"
Name (*): "MSR - Stock coverage time distribution - Pivot table"
Description: "MSR DV 29 - Monthly Stock Reporting / Stock coverage time / distribution / Last 12 months / Health facility / Column chart This report displays a Pivot table with the number of items for which the coverage time fell into the respective coverage time bins (stockout, 1 to 12 months, 1-2 and 2-3 years or greater than or equal to 3 years) for each of the past 12 months."Columns
Data
Data Type: "Indicators"
Indicator group: select "Stock coverage time"
Selected items: select the following indicators in the following order:
- "Stockout count"
- "0-1 months"
- "1-2 months"
- "2-3 months"
- "3-4 months"
- "4-5 months"
- "5-6 months"
- "6-7 months"
- "7-8 months"
- "8-9 months"
- "9-10 months"
- "10-11 months"
- "11-12 months"
- "1-2 years"
- "2-3 years"
- ">=3 years"Rows
Period: "Relative periods"
Period type: "Months"
Selected Periods: "Last 12 month"Filter
Organisation unit: "User organisation unit"
Options
Data
Totals
Columns totals: tag (appears as a white tick in a green field)
Row totals: tag (appears as a white tick in a green field)
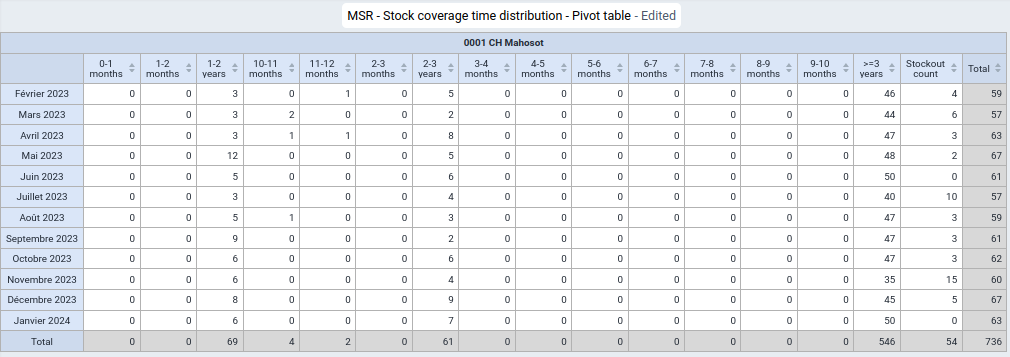
30 MSR - Stock coverage time distribution - Column chart - Last 12 months
Visualization type: select "Column"
Name (*): "MSR - Stock coverage time distribution - Column chart - Last 12 months"
Description: "MSR DV 30 - Monthly Stock Reporting / Stock coverage time / distribution / Last 12 months / Health facility / Column chart This report displays a group of column charts representing the number of items for each stock coverage time bin (in months and years) for the past 12 months."Series
Data
Data Type: "Indicators"
Indicator group: select "Stock coverage time"
Selected items: select the following indicators in the following order:
- "Stockout count"
- "0-1 months"
- "1-2 months"
- "2-3 months"
- "3-4 months"
- "4-5 months"
- "5-6 months"
- "6-7 months"
- "7-8 months"
- "8-9 months"
- "9-10 months"
- "10-11 months"
- "11-12 months"
- "1-2 years"
- "2-3 years"
- ">=3 years"Category
Period: "Relative periods"
Period type: "Months"
Selected Periods: "Last 12 month"Filter
Organisation unit: "User organisation unit"
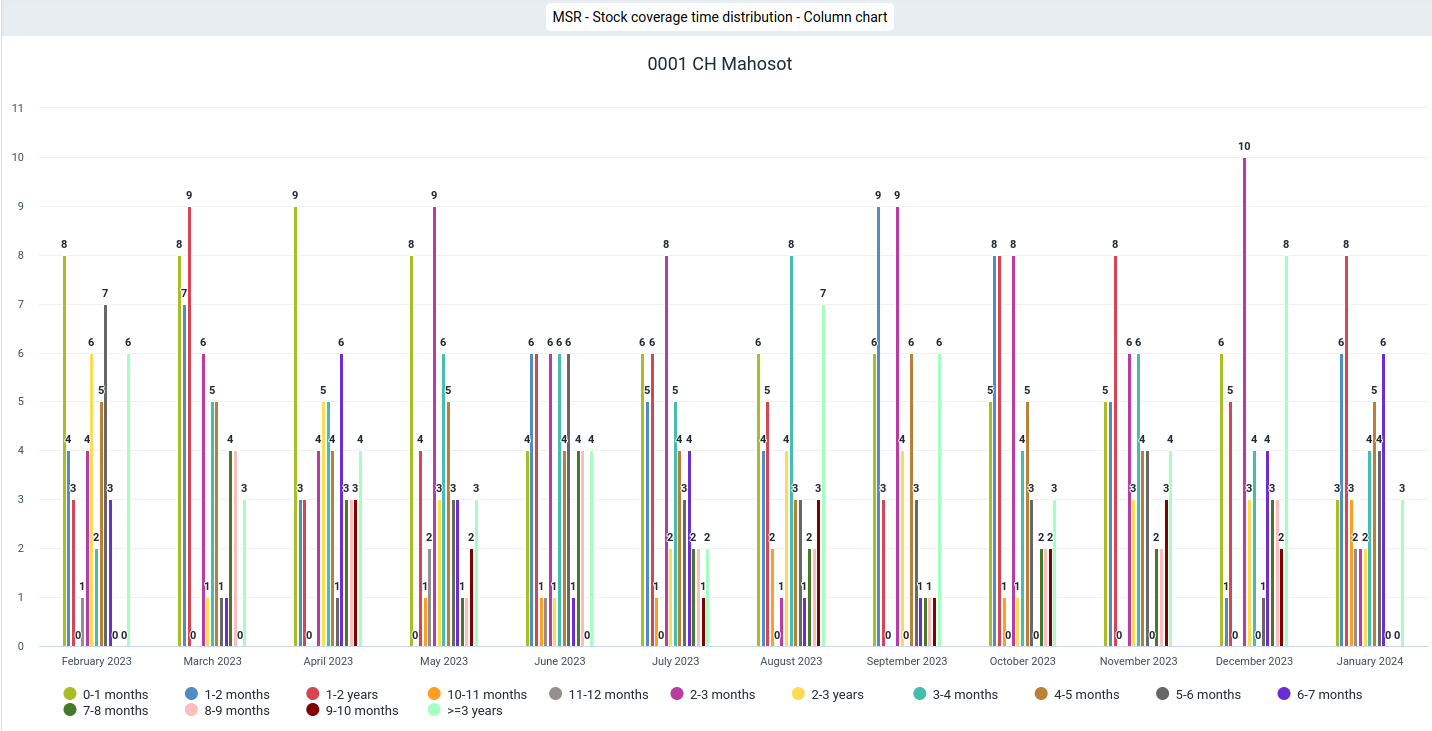
31 MSR - Stock coverage time distribution - Column chart - Last month
Visualization type: select "Column"
Name (*): "MSR - Stock coverage time distribution - Column chart - Last month"
Description: "MSR DV 31 - Monthly Stock Reporting / Stock coverage time / distribution / Last month / Health facility / Column chart This report displays a group of column charts representing the stock coverage time distribution (in months and years) for the last month."Series
Data
Data Type: "Indicators"
Indicator group: select "Stock coverage time"
Selected items: select the following indicators in the following order:
- "Stockout count"
- "0-1 months"
- "1-2 months"
- "2-3 months"
- "3-4 months"
- "4-5 months"
- "5-6 months"
- "6-7 months"
- "7-8 months"
- "8-9 months"
- "9-10 months"
- "10-11 months"
- "11-12 months"
- "1-2 years"
- "2-3 years"
- ">=3 years"Category
Period: "Relative periods"
Period type: "Months"
Selected Periods: "Last month"Filter
Organisation unit: "User organisation unit"
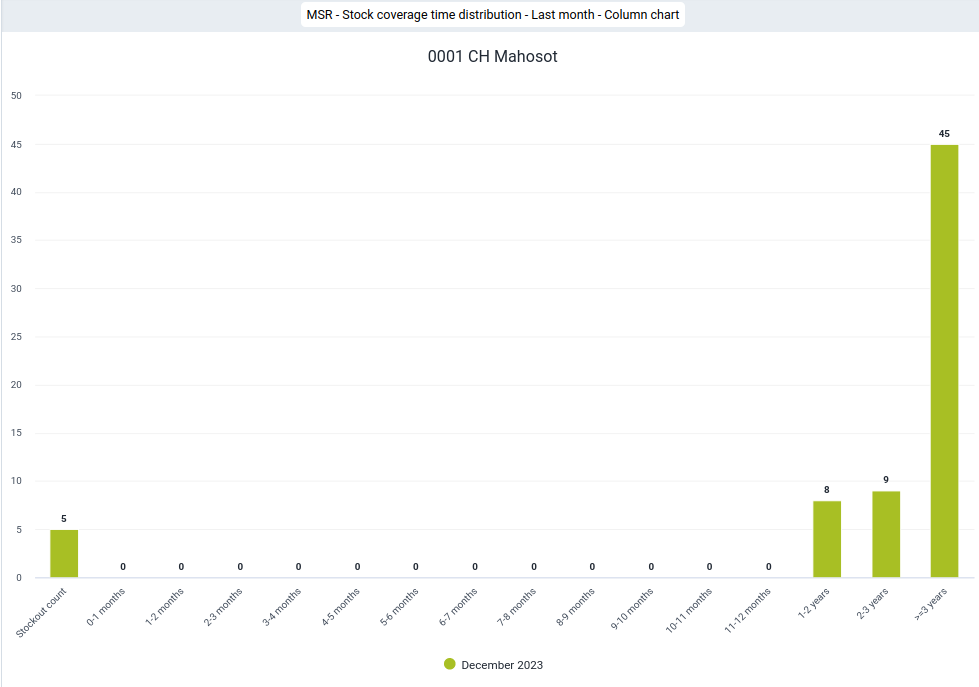
32 MSR - Stock coverage time categories
Visualization type: select "Column"
Description: "MSR - Stock coverage time categories"
Name (*): "MSR DV 32 - Monthly Stock Reporting / Stock coverage time categories / Last month / Health facility / Stacked column chart
For the last month, this report displays a stacked column chart with the number of items for each stock coverage time category (stockout, understock, appropriate stock, overstock and excessive stock) for the health facility."Series
Data
Data Type: "Indicators"
Indicator group: select "Stock coverage time"
Selected items: select the following indicators in the following order:
- "Stockout count"
- "Understock (0-3 months)"
- "Appropriate stock (3-6 months)"
- "Overstock (6-12 months)"
- "Excessive stock (> 12 months)"Category
Period: "Relative periods"
Period type: "Months"
Selected Periods: "Last month"Filter
Organisation unit: "User organisation unit"
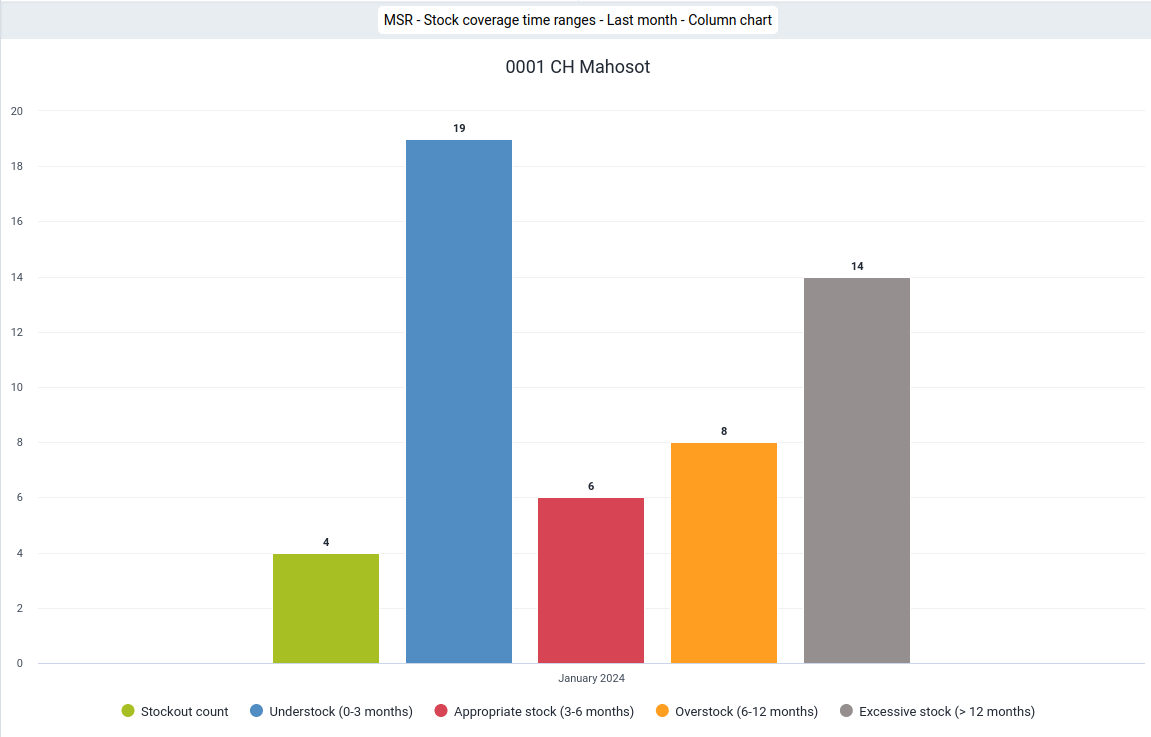
33 MSR - Stock coverage time categories
Visualization type: select "Stacked column"
Name (*): "MSR - Stock coverage time categories"
Description: "MSR DV 33 - Monthly Stock Reporting / Stock coverage time categories / Last 12 months / Health facility / Stacked column chart For each of the 12 past months, this report displays a stacked column chart with the number of items for each stock coverage time category (stockout, understock, appropriate stock, overstock and excessive stock) for the health facility."Series
Data
Data Type: "Indicators"
Indicator group: select "Stock coverage time"
Selected items: select the following indicators in the following order:
- "Stockout count"
- "Understock (0-3 months)"
- "Appropriate stock (3-6 months)"
- "Overstock (6-12 months)"
- "Excessive stock (> 12 months)"Category
Period: "Relative periods"
Period type: "Months"
Selected Periods: "Last 12 months"Filter
Organisation unit: "User organisation unit"
Options
Data
Display
Stacked values add up to 100%
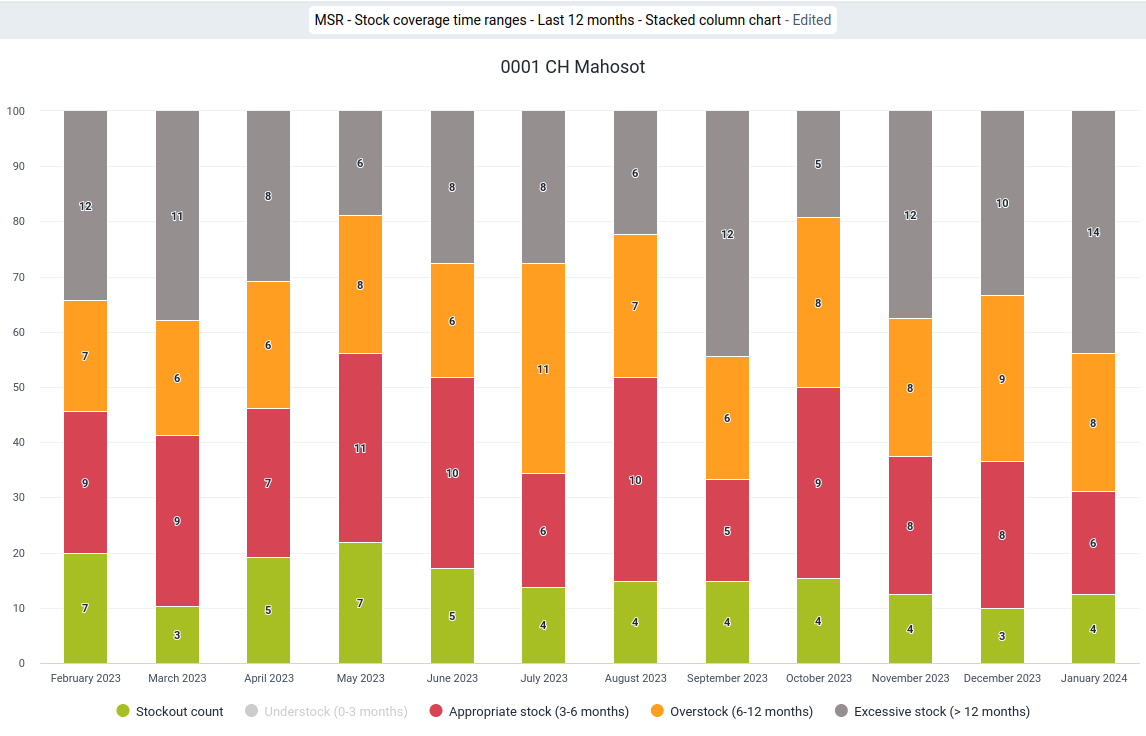
34 MSR - Stock discrepancy - Pivot table
Visualization type: select "Pivot table"
Name (*): "MSR - Stock discrepancy - Pivot table"
Description: "MSR DV 34 - Monthly Stock Reporting / Stock discrepancy / list / Last 12 months / Health facility / Pivot table
This report displays a list with the positive and negative stock discrepancy of the past 12 months. The stock discrepancy is calculated as follows
Stock on hand from the previous month (final stock on hand)
+ Stock receipt
- Stock distributed
- Stock redistributed
- Stock discard
- Stock correction
- Stock on hand."Columns
Period: "Relative periods"
Period type: "Months"
Selected Periods: "Last 12 month"Rows
Data
Data Type: "Data elements"
Data element group: select "[Stock item list] - MSR
Disaggregation: "Totals only"
Selected items: select all (->>)Filter
Organisation unit: "User organisation unit"
YOUR DIMENIONSName: "Monthly stock report"
Selected Items: "Stock discrepancy count"Options
Data
Totals
Row totals: tag (appears as a white tick in a green field)
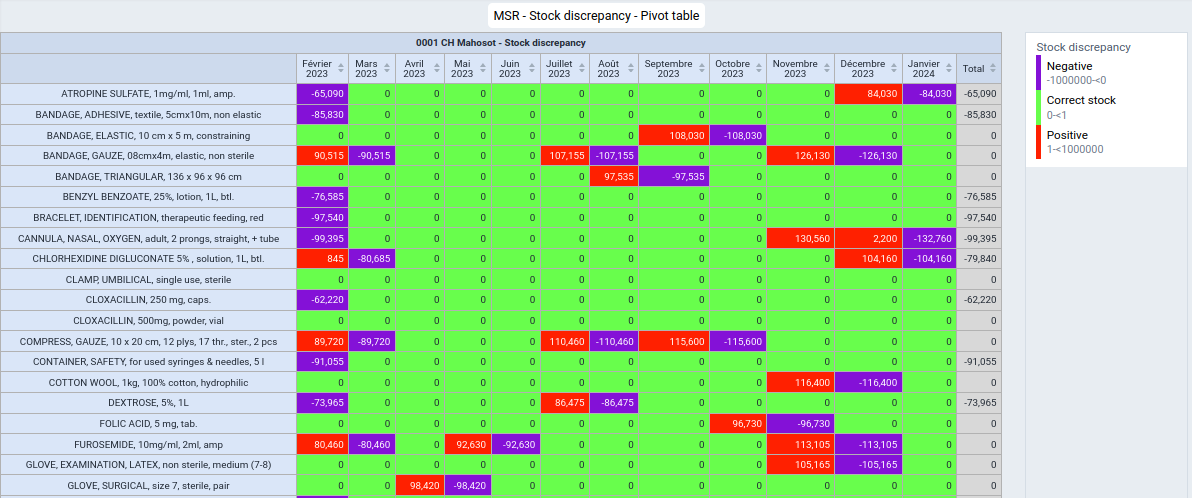
35 MSR - Stock discrepancy count - Column chart
Visualization type: select "Column"
Name (*): "MSR - Stock discrepancy count - Column chart"
Visualization type: "MSR DV 35 - Monthly Stock Reporting / Stock discrepancy / count / Last 12 months / Health facility / Column chart This report displays the number of stock discrepancies for the past 12 months."Series
YOUR DIMENIONS
Name: "Monthly stock report"
Selected Items: "Stock discrepancy count"Category
Period: "Relative periods"
Period type: "Months"
Selected Periods: "Last 12 month"Filter
Organisation unit: "User organisation unit"
DataData Type: "Data elements"
Data element group: select "[Stock item list] - MSR
Disaggregation: "Totals only"
Selected items: select all (->>)
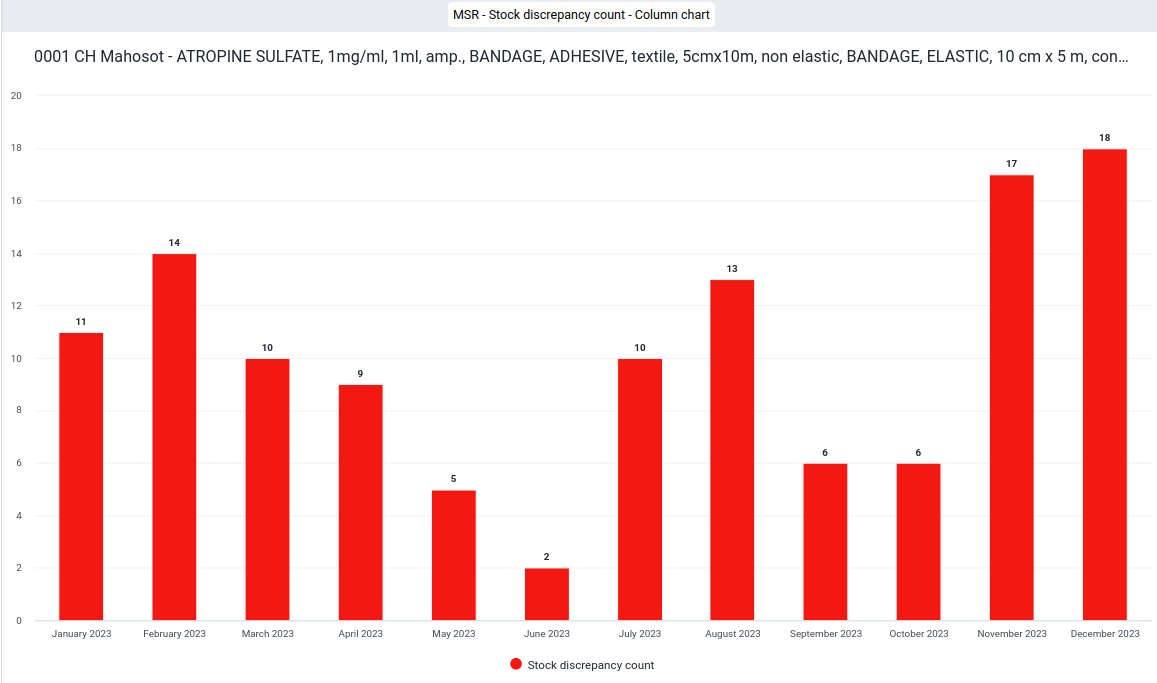
36 MSR - Stock discrepancy count - Single value chart
Visualization type: select "Single value"
Name (*): "MSR - Stock discrepancy count - Single value chart"
Visualization type: "MSR DV 36 - Monthly Stock Reporting / Stock discrepancy / count / Last month / Health facility / Single value chart This report displays the number of stock discrepancies for the last month as a single value chart."Series
Data
Data Type: "Indicators"
Indicator group: select "Stockout discrepancy"
Selected items: "Stock discrepancy count"Filter
Organisation unit: "User organisation unit"
Period: "Relative periods"Period type: "Months"
Selected Periods: "Last month"
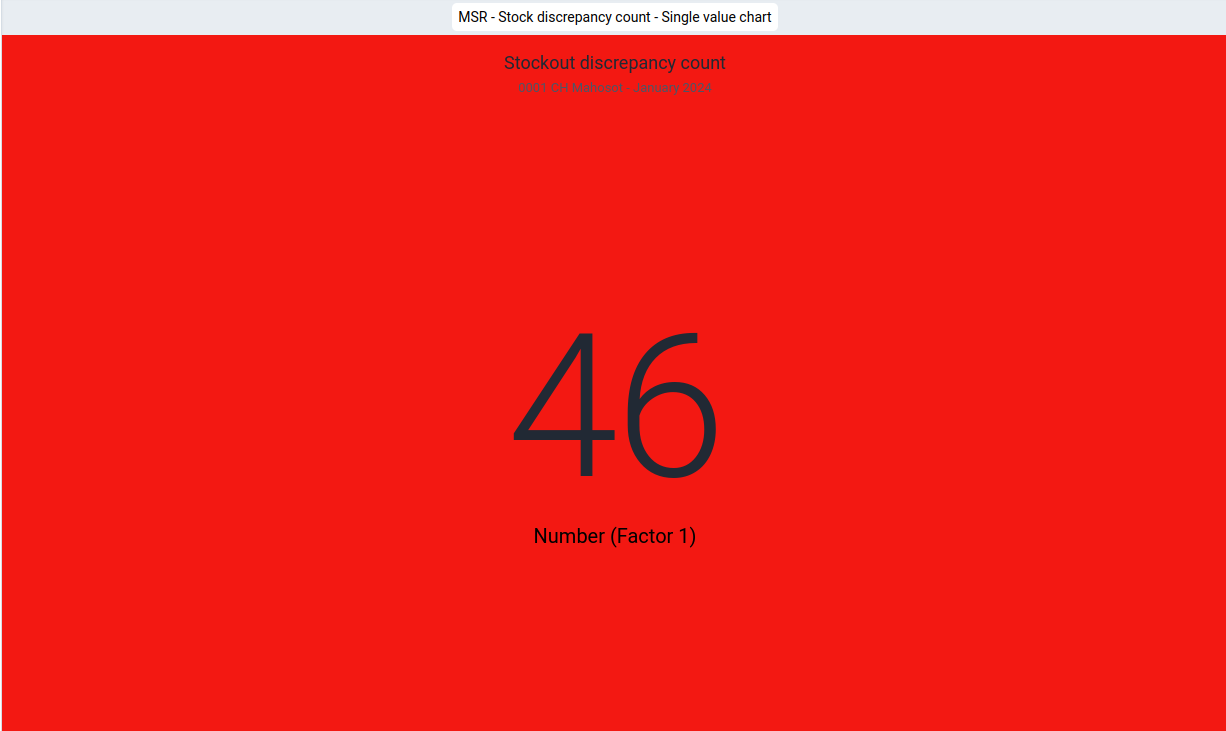
37 MSR - Stock discrepancy count - Percentage - Column chart
Visualization type: select "Column"
Name (*): "MSR - Stock discrepancy count - Percentage - Column chart"
Visualization type: "MSR DV 37 - Monthly Stock Reporting / Stock discrepancy / Percentage / Last 12 months / Health facility / Column chart This report displays the percentage of all items with a stock discrepancies for the past 12 months."Series
Data
Data Type: "Indicators"
Indicator group: select "Stockout discrepancy"
Selected items: "Stock discrepancy percentage"Category
Period: "Relative periods"
Period type: "Months"
Selected Periods: "Last 12 month"Filter
Organisation unit: "User organisation unit"
Options
Axes
Axis ranges
Max: "100"
Legend
Use legend for chart colors: tag (appears as a white tick in a green field)
Select a legend: tag (appears as a white tick in a green field)
Legend: "Stockout count"
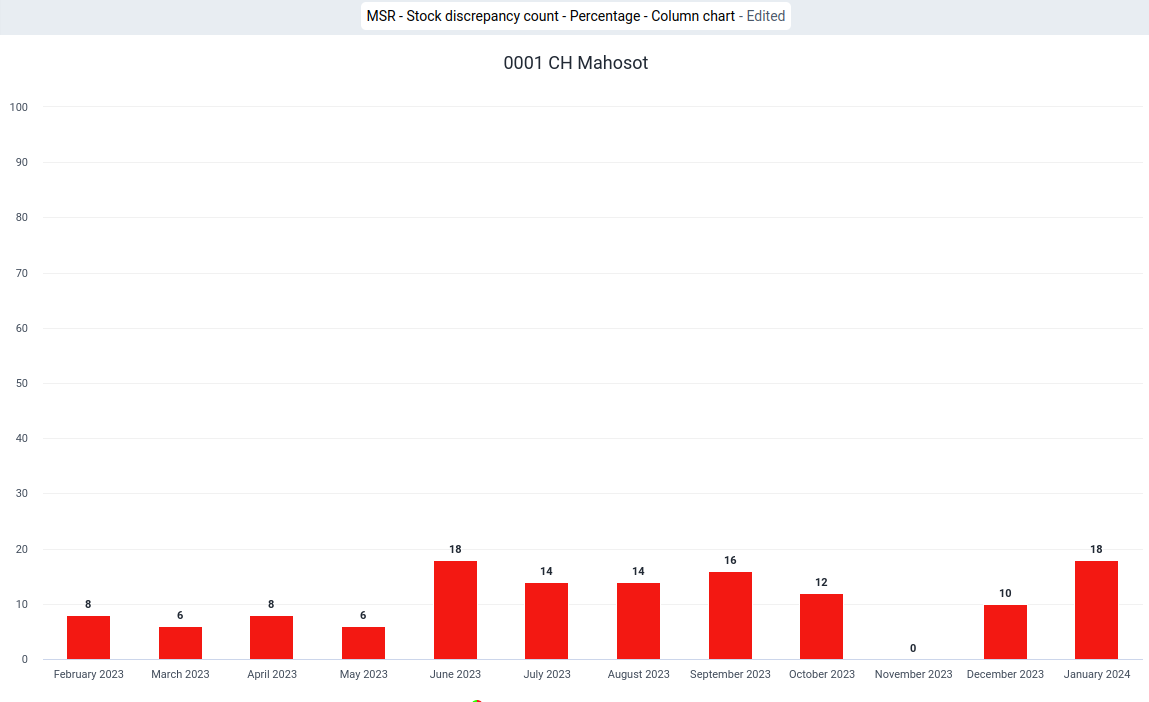
38 MSR - Report completeness - Pivot table chart
Visualization type: select "Pivot"
Name (*): "MSR - Report completeness - Pivot table"
Visualization type: "MSR DV 38 - Monthly Stock Reporting / Report completeness / Last 12 months / Health facility / Pivot table This report provides the "Reporting rate", "Reporting rate on time", "Actual reports", "Actual reports on time" as well as the "Expected reports" for the last 12 months as a Pivot table."Columns
Period: "Relative periods"
Period type: "Months"
Selected Periods: "Last 12 month"Rows
Data
Data Type: "Data sets"
Data set: select "Monthly stock report"
Metric type:
- "Monthly stock report - Reporting rate"
- "Monthly stock report - Reporting rate on time"
- "Monthly stock report - Actual reports"
- "Monthly stock report - Actual reports on time"
- "Monthly stock report - Expected reports"
Filter
Organisation unit: "User organisation unit"

39 MSR - Report completeness
Visualization type: select "Line"
Name (*): "MSR - Report completeness"
Visualization type: "MSR DV 39 - Monthly Stock Reporting / Report completeness / Last 12 months / Health facility / Line chart This report provides the "Reporting rate", "Reporting rate on time", "Actual reports", "Actual reports on time" as well as the "Expected reports" for the last 12 months as a line chart."Series
Data
Data Type: "Data sets"
Data set: select "Monthly stock report"
Metric type:
- "Monthly stock report - Reporting rate"
- "Monthly stock report - Reporting rate on time"
- "Monthly stock report - Actual reports"
- "Monthly stock report - Actual reports on time"
- "Monthly stock report - Expected reports"
Category
Period: "Relative periods"
Period type: "Months"
Selected Periods: "Last 12 month"Filter
Organisation unit: "User organisation unit"
Options
Axes
Vertical (y) axis 1
Axis title: select "Custom" and "Report count" Axis range:
Min: 0
Max: 1
Steps: "5"Vertical (y) axis 2
Axis title: select "Custom" and "Report rate / %" Axis range:
Min: 0
Max: 100
Steps: "5"Series
Data item: select
- "Monthly stock report - Reporting rate"
- "Monthly stock report - Reporting rate on time"
Visualization type: Column chart icon
Axis 2: select
- "Monthly stock report - Reporting rate"
- "Monthly stock report - Reporting rate on time"
Data item: select
- "Monthly stock report - Actual reports"
- "Monthly stock report - Actual reports on time"
- "Monthly stock report - Expected reports"
Visualization type: Line chart icon
Axis 1: select
- "Monthly stock report - Actual reports"
- "Monthly stock report - Actual reports on time"
- "Monthly stock report - Expected reports"
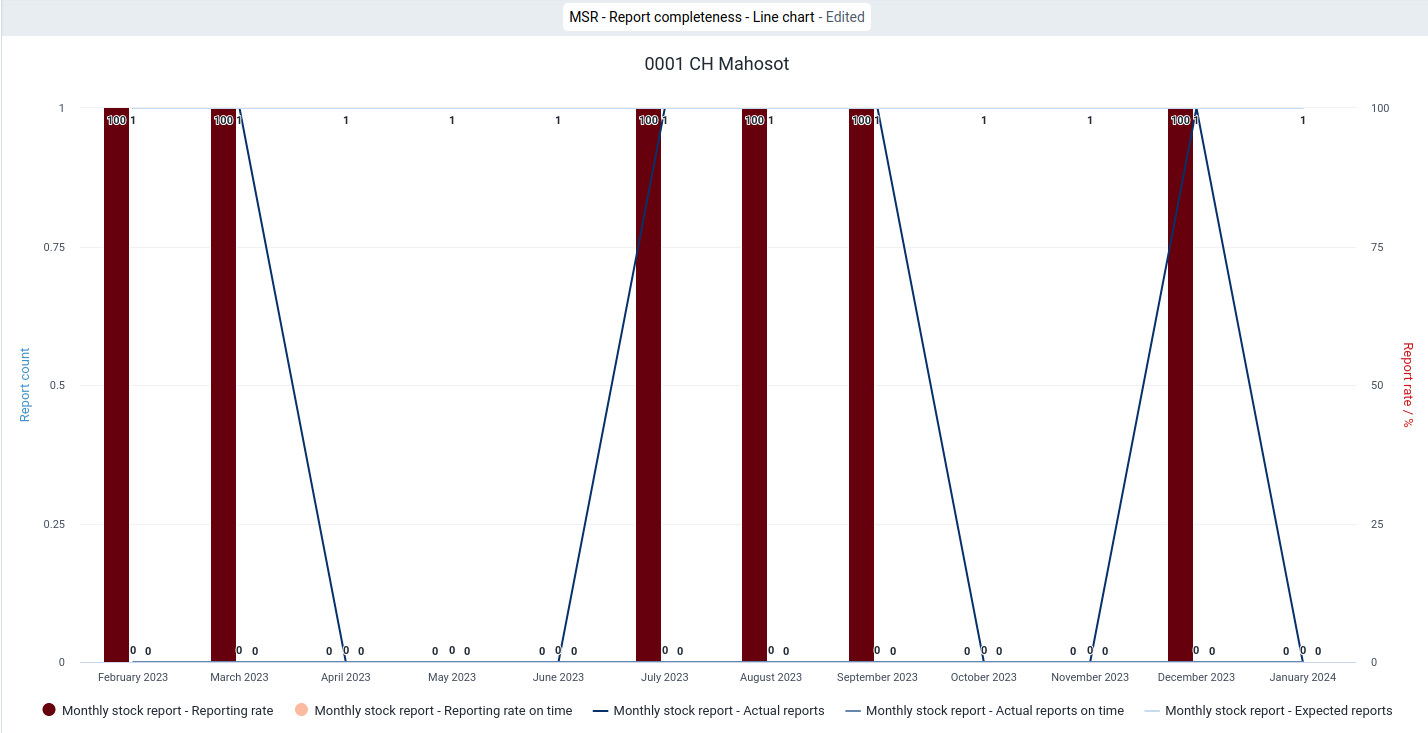
40 MSR - Reporting rate
Visualization type: select "Single value"
Name (*): "MSR - Reporting rate"
Visualization type: "MSR DV 40 - Monthly Stock Reporting / Reporting rate / Last 12 months / Health facility / Single value chart This report provides the "Reporting rate" for the last 12 months for the health facility as single value chart."Series
Data
Data Type: "Indicators"
Data set: select "Monthly stock report"
Metric type: "Reporting rate" Selected Items: "Monthly stock report - Reporting rate"Filter
Organisation unit: "User organisation unit"
Period: "Relative periods"Period type: "Months"
Selected Periods: "Last 12 months"Options*
LegendUse legend for chart colors: tag (appears as a white tick in a green field)
Legend type
Select a legend: tag (appears as a white tick in a green field)
Legend: "Stock availability / %"
Show legend key tag (appears as a white tick in a green field)
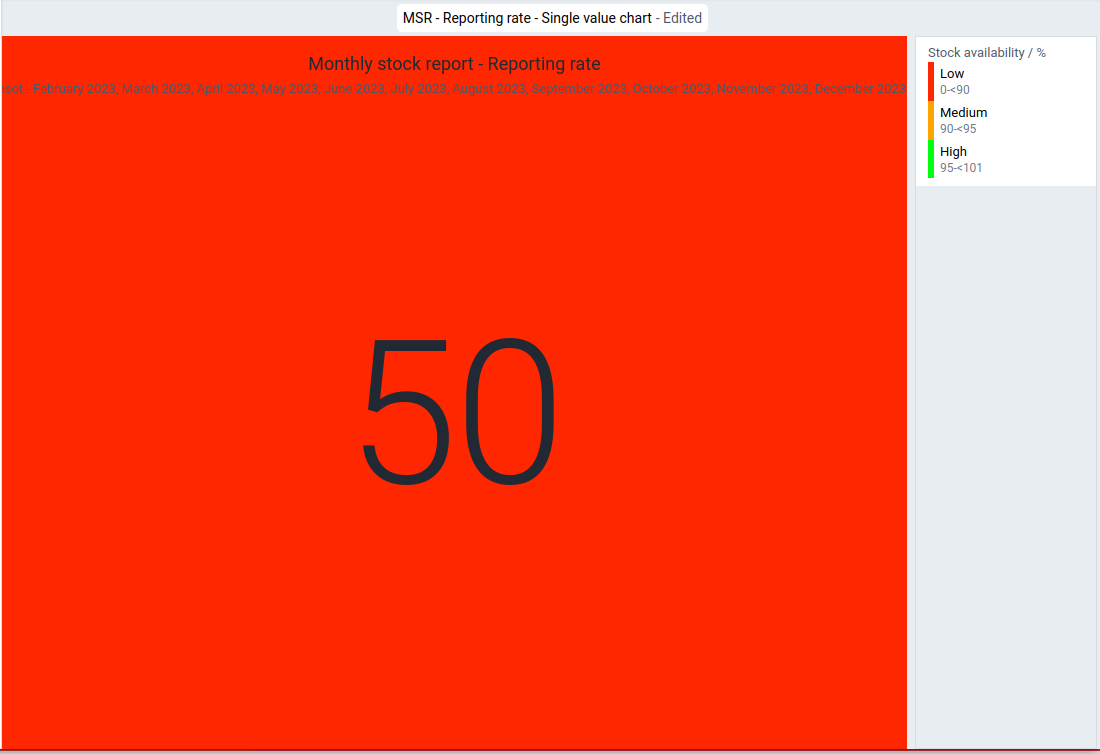
41 MSR - Reporting rate on time
Visualization type: select "Single value"
Name (*): "MSR - Reporting rate on time"
Visualization type: "MSR DV 41 - Monthly Stock Reporting / Reporting rate on time / Last 12 months / Health facility / Single value chart This report provides the "Reporting rate" for the last 12 months for the health facility as single value chart."Series
Data
Data Type: "Indicators"
Data set: select "Monthly stock report"
Metric type: "Reporting rate" Selected Items: "Monthly stock report - Reporting rate on time"Filter
Organisation unit: "User organisation unit"
Period: "Relative periods"Period type: "Months"
Selected Periods: "Last 12 months"Options*
LegendUse legend for chart colors: tag (appears as a white tick in a green field)
Legend type
Select a legend: tag (appears as a white tick in a green field)
Legend: "Stock availability / %"
Show legend key tag (appears as a white tick in a green field)
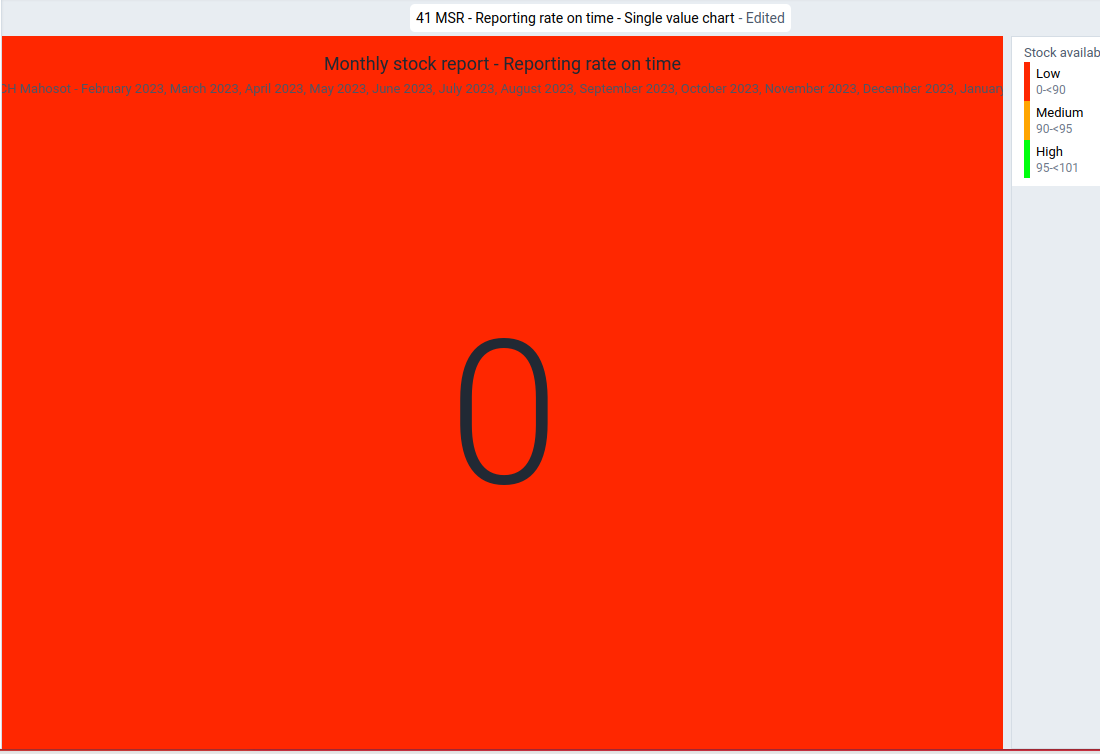
District level
Statistics
42 MSR - Stock receipt - District
Visualization type: select "Pivot table"
Name (*): "MSR - Stock receipt"
Description: "MSR DV 42 - Monthly Stock Reporting / Stock receipt / Last 12 months / District / By item / Pivot table
This report provides the monthly stock receipts as reported at the end of every month."Columns
Period: "Relative periods"
Period type: "Months"
Selected Periods: "Last 12 months"Rows
Data
Data Type: "Data elements"
Data element group: select "[Stock item list] - MSR
Disaggregation: "Totals only"
Selected items: select all (->>)Organisation unit: "User organisation unit"
Filter:
YOUR DIMENIONS
Name: "Monthly stock report"
Selected Items: "Stock receipt"Options
Data
Totals
Column sub-totals: tag (appears as a white tick in a green field)
Row totals: tag (appears as a white tick in a green field)
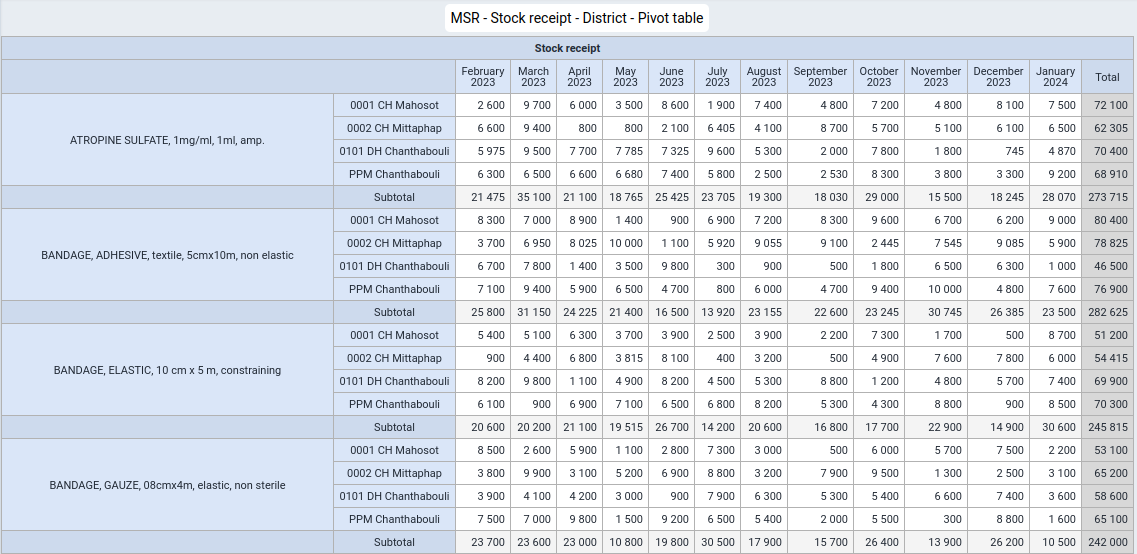
43 MSR - Stock distribution - District
Visualization type: select "Pivot table"
Name (*): "MSR - Stock distribution - District"
Description: "MSR DV 43 - Monthly Stock Reporting / Stock distribution / Last 12 months / District / By item / Pivot table
This report provides the monthly stock distributions by health facility in a district as reported at the end of every month."Columns
Period: "Relative periods"
Period type: "Months"
Selected Periods: "Last 12 months"Rows
Data
Data Type: "Data elements"
Data element group: select "[Stock item list] - MSR
Disaggregation: "Totals only"
Selected items: select all (->>)Filter: "Relative periods"
Organisation unit: "User organisation unit"
Selected Periods: "Last 12 months"
YOUR DIMENIONS
Name: "Monthly stock report"
Selected Items: "Stock distribution"Options
Data
Totals
Column sub-totals: tag (appears as a white tick in a green field)
Row totals: tag (appears as a white tick in a green field)
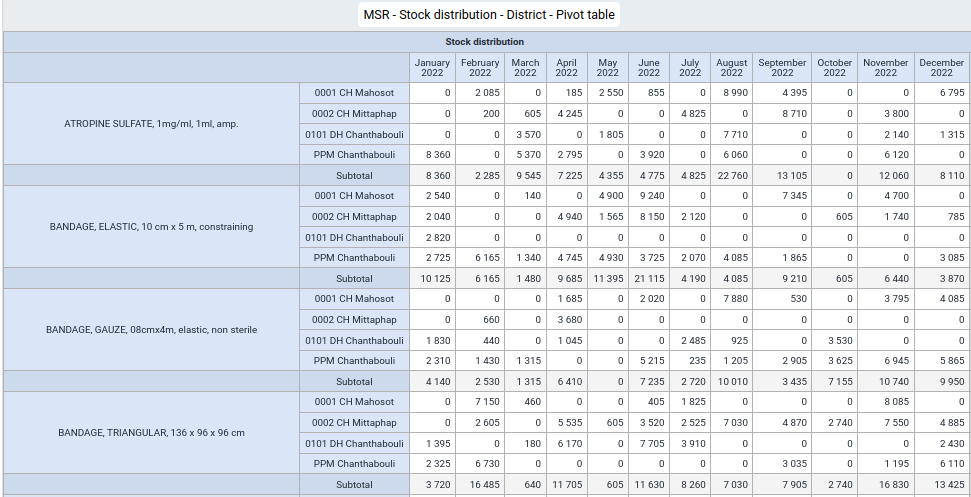
44 MSR - Stock redistribution - District
Visualization type: select "Pivot table"
Name (*): "MSR - Stock redistribution - District"
Description: "MSR DV 44 - Monthly Stock Reporting / Stock redistribution / Last 12 months / District / By item / Pivot table.
This report provides the monthly stock redistributions by district facility in a district as reported at the end of every month."Columns
Period: "Relative periods"
Period type: "Months"
Selected Periods: "Last 12 months"Rows
Data
Data Type: "Data elements"
Data element group: select "[Stock item list] - MSR
Disaggregation: "Totals only"
Selected items: select all (->>)
Organisation unit: "User organisation unit"Filter: "Relative periods"
Selected Periods: "Last 12 months"
YOUR DIMENIONS
Name: "Monthly stock report"
Selected Items: "Stock redistribution"Options
Data
Totals
Column sub-totals: tag (appears as a white tick in a green field)
Row totals: tag (appears as a white tick in a green field)
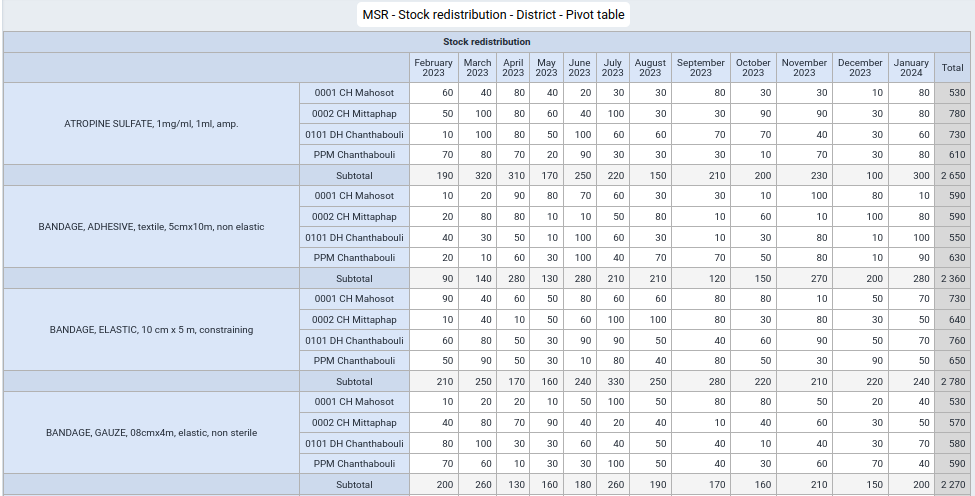
45 MSR - Stock discard - District
Visualization type: select "Pivot table"
Name (*): "45 MSR - Stock discard - District"
Description: "MSR DV 45 - Monthly Stock Reporting / Stock discard / Last 12 months / District / By item / Pivot table
This report provides the monthly stock discards by health facility in a district as reported at the end of every month."Columns
Period: "Relative periods"
Period type: "Months"
Selected Periods: "Last 12 months"Rows
Data
Data Type: "Data elements"
Data element group: select "[Stock item list] - MSR
Disaggregation: "Totals only"
Selected items: select all (->>)
Organisation unit: "User organisation unit"Filter: "Relative periods"
Selected Periods: "Last 12 months"
YOUR DIMENIONS
Name: "Monthly stock report"
Selected Items: "Stock discard"Options
Data
Totals
Column sub-totals: tag (appears as a white tick in a green field)
Row totals: tag (appears as a white tick in a green field)
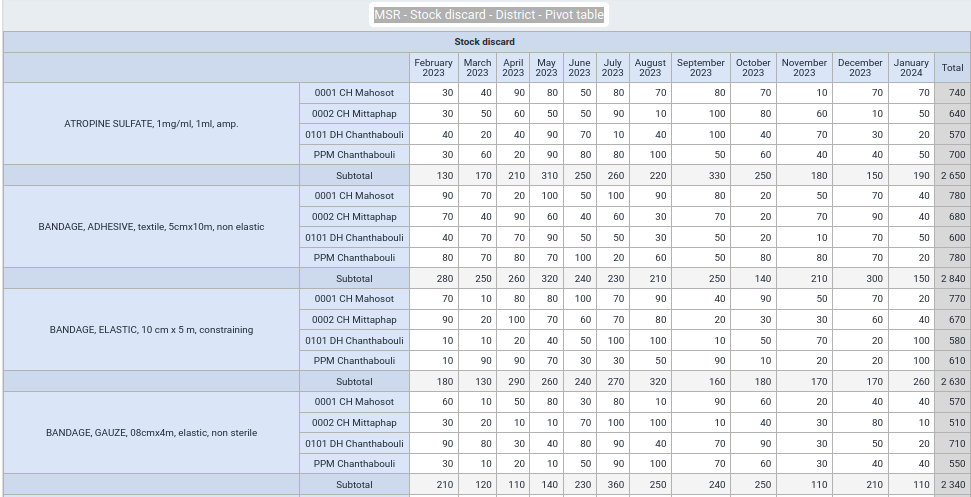
46 MSR - Stock on hand - District
Visualization type: select "Pivot table"
Name (*): "MSR - Stock on hand - District"
Description: "MSR DV 46 - Monthly Stock Reporting / Stock on hand / Last 12 months / District / By item / Pivot table
This report provides the monthly stock on hand by health facility in a district as reported at the end of every month for the past 12 months."Columns
Period: "Relative periods"
Period type: "Months"
Selected Periods: "Last 12 months"Rows
Data
Data Type: "Data elements"
Data element group: select "[Stock item list] - MSR
Disaggregation: "Totals only"
Selected items: select all (->>)
Organisation unit: "User organisation unit"Filter: "Relative periods"
Selected Periods: "Last 12 months"
YOUR DIMENIONS
Name: "Monthly stock report"
Selected Items: "Stock on hand"Options
Data
Totals
Column sub-totals: tag (appears as a white tick in a green field)
Row totals: tag (appears as a white tick in a green field)
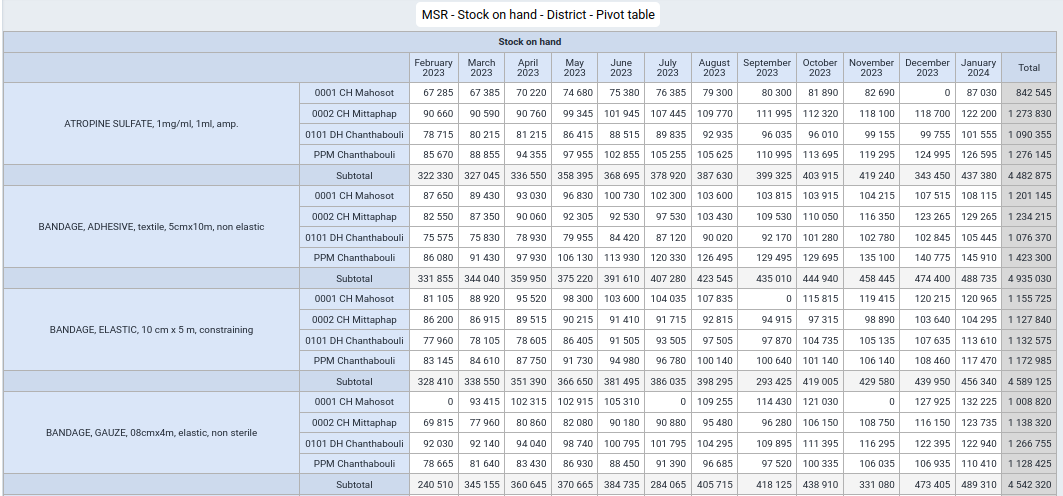
47 MSR - Stock correction - District
Visualization type: select "Pivot table"
Name (*): "MSR - Stock correction - District"
Description: "MSR DV 47 - Monthly Stock Reporting / Stock correction / Last 12 months / District / By item / Pivot table This report provides the monthly stock corrections by health facility in a district as reported at the end of every month for the past 12 months."Columns
Period: "Relative periods"
Period type: "Months"
Selected Periods: "Last 12 months"Rows
Data
Data Type: "Data elements"
Data element group: select "[Stock item list] - MSR
Disaggregation: "Totals only"
Selected items: select all (->>)
Organisation unit: "User organisation unit"Filter: "Relative periods"
Selected Periods: "Last 12 months"
YOUR DIMENIONS
Name: "Monthly stock report"
Selected Items: "Stock correction"Options
Data
Totals
Column sub-totals: tag (appears as a white tick in a green field)
Row totals: tag (appears as a white tick in a green
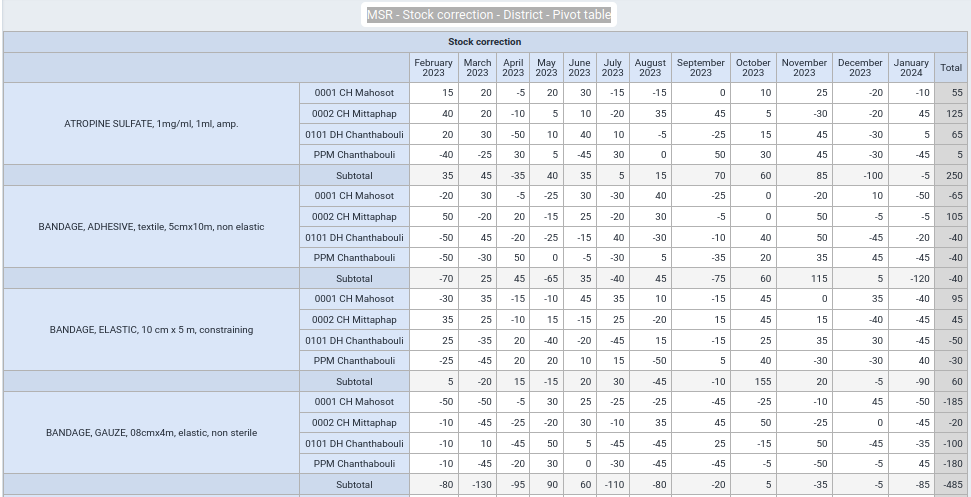
48 MSR - Stock report complete- District
Visualization type: select "Pivot table"
Name (*): "MSR - Stock report complete - District"
Description: "MSR DV 48 - Monthly Stock Reporting / Stock report complete / Last 3 month / District / By item / Pivot table This report provides an overview of all stock data by health facility in a district from the last 3 months."Columns
Period: "Relative periods"
Period type: "Months"
Selected Periods: "Last month"
YOUR DIMENIONS
Name: "Monthly stock report"
Selected Items: "Stock distribution"Rows
Data
Data Type: "Data elements"
Data element group: select "[Stock item list] - MSR
Disaggregation: "Totals only"
Selected items: select all (->>)
Organisation unit: "User organisation unit"Options
Data
Totals
Column sub-totals: tag (appears as a white tick in a green field)
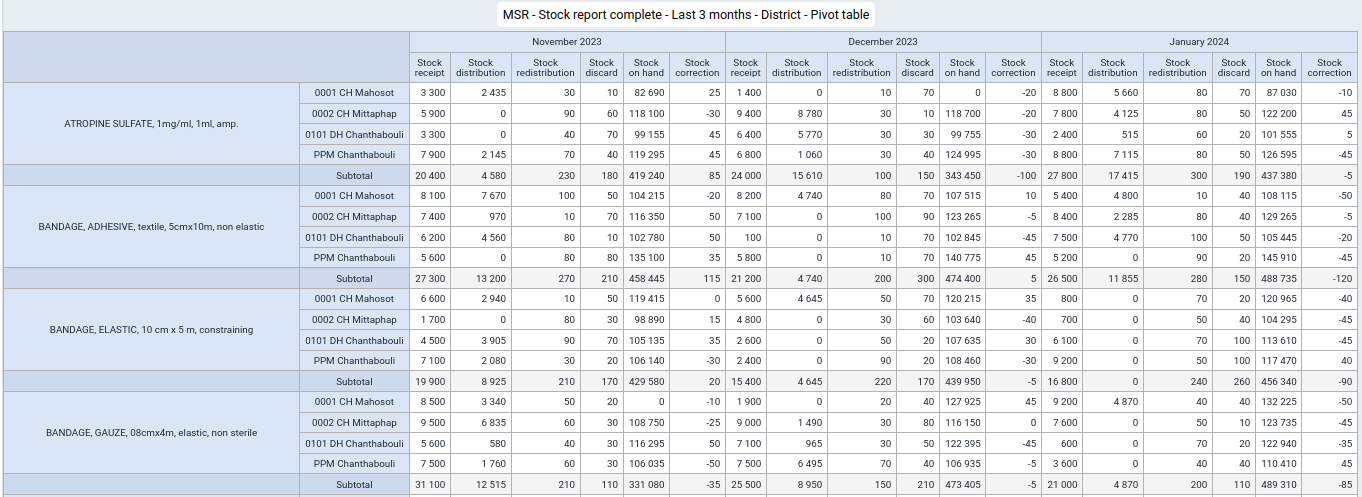
Indicators
49 MSR - Coefficient of Variation x 10 - District
Visualization type: select "Pivot table"
Name (*): "MSR - Coefficient of Variation x 10 - District"
Description: "MSR DV 49 - Monthly Stock Reporting / Stock distribution / Coefficient of Variation x 10 / Last 12 months / District / By item / Pivot table This report provides the coefficient of variation (standard deviation of stock distribution divided by the average stock distribution) which is based on the previous six months for each of the twelve month as a Pivot table for each item and by health facilities in a district. Since decimals cannot be displayed in this report, the result of the actual calculation is multiplied by 10 and rounded to the next integer."Columns
Period: "Relative periods"
Period type: "Months"
Selected Periods: "Last 12 months"Rows
Data
Data Type: "Data elements"
Data element group: select "[Stock item list] - MSR
Disaggregation: "Totals only"
Selected items: select all (->>)
Organisation unit: "User organisation unit"Filter: "Relative periods"
YOUR DIMENIONS
Name: "Monthly stock report"
Selected Items: "Coefficient of variation"Options
Data
Totals
Column sub-totals: tag (appears as a white tick in a green field)
Row totals: tag (appears as a white tick in a green field)Legend
Use legend for chart colors: tag (appears as a white tick in a green field)
Legend type
Select a legend: tag (appears as a white tick in a green field)
Legend: "Coefficient of variation"
Show legend key tag (appears as a white tick in a green field)
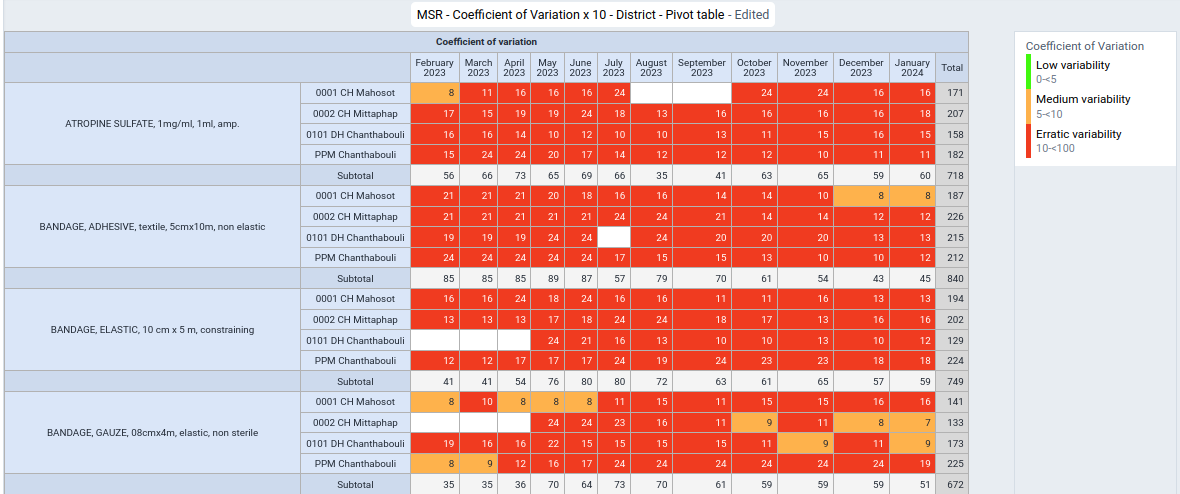
50 MSR - Coefficient of Variation x 10 - District
Visualization type: select "Stacked bar"
Name (*): "MSR - Coefficient of Variation x 10 - District"
Description: "MSR DV 50 - Monthly Stock Reporting / Stock distribution / Coefficient of Variation x 10 / Last month / District / Across items / Stacked bar chart This report provides the coefficient of variation (standard deviation of stock distribution divided by the average stock distribution) which is based on the previous six months as a group of column charts for the last month and by health facilities in a district. Since decimals cannot be displayed in this report the result of the actual calculation is multiplied by 10 and rounded to the next integer."Series
Organisation unit: "User organisation unit"
Category
Data
Data Type: "Data elements"
Data element group: select "[Stock item list] - MSR
Disaggregation: "Totals only"
Selected items: select all (->>)Filter: "Relative periods"
Period: "Relative periods"
Period type: "Months"
Selected Periods: "Last 12 months"YOUR DIMENIONS
Name: "Monthly stock report"
Selected Items: "Coefficient of variation"Legend
Use legend for chart colors: tag (appears as a white tick in a green field)
Legend type
Select a legend: tag (appears as a white tick in a green field)
Legend: "Coefficient of variation"
Show legend key tag (appears as a white tick in a green field)
51 MSR - Coefficient of Variation x 10 - District
Visualization type: select "Stacked bar"
Name (*): "MSR - Coefficient of Variation x 10 - District"
Description "MSR DV 51 - Monthly Stock Reporting / Stock distribution / Coefficient of Variation x 10 / Last month / District / By item / Column chart This report provides the coefficient of variation (standard deviation of stock distribution divided by the average stock distribution) which is based on the previous six months as a group of column charts for each of the twelve months by health facility in the district. Since decimals cannot be displayed in this report the result of the actual calculation is multiplied by 10 and rounded to the next integer."Series
YOUR DIMENIONS
Name: "Monthly stock report"
Selected Items: "Coefficient of variation"Category
Data
Data Type: "Data elements"
Data element group: select "[Stock item list] - MSR
Disaggregation: "Totals only"
Selected items: select all (->>)
Organisation unit: "User organisation unit"Filter: "Relative periods"
Period: "Relative periods"
Period type: "Months"
Selected Periods: "Last months"Options
Data
Lines
Target line
Value: "10"
Title: "Medium variability"
Size: "Regular"
Position: "Left"
Colour: select red
Base line
Value: "5"
Title: "Low variability"
Size: "Regular"
Position: "Left"
Colour: select greenLegend
Use legend for chart colors: tag (appears as a white tick in a green field)
Legend type
Select a legend: tag (appears as a white tick in a green field)
Legend: "Coefficient of variation"
Show legend key tag (appears as a white tick in a green field)
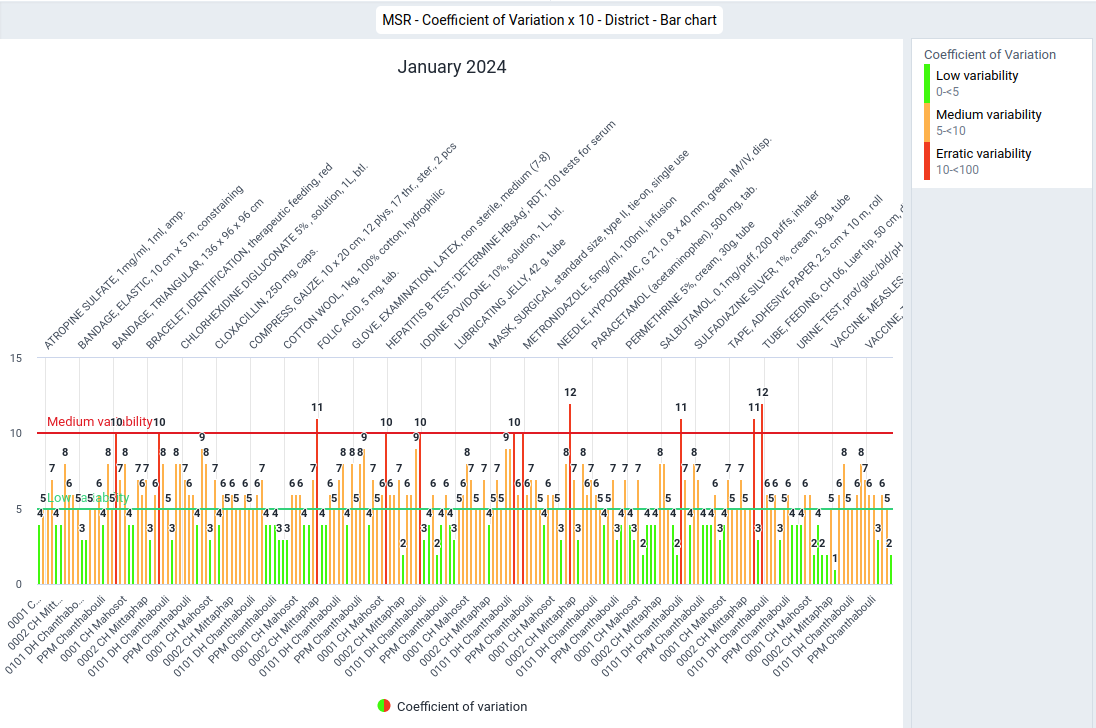
52 MSR - Coefficient of Variation x 10 distribution - District
Visualization type: select "Pivot table"
Name (*): "52 MSR - Coefficient of Variation x 10 distribution - District"
Description: "MSR DV 52 - Monthly Stock Reporting / Coefficient of Variation x 10 distribution / Last 12 months / District / By item / Pivot table This report provides the coefficient of variation (standard deviation of stock distribution divided by average stock distribution) by health facilities in the district over the last 12 months with a colour legend."Columns
Data
Data Type: "Indicators"
Indicator group: "Coefficient of variation"
Selected items: select the following items in the following order:
- Low variability
- Medium variability
- High variability
Rows
Period: "Relative periods"
Period type: "Months"
Selected Periods: "Last 12 months"
Organisation unit: "User organisation unit"Options
Data
Totals
Column sub-totals: tag (appears as a white tick in a green field)
Row totals: tag (appears as a white tick in a green field)

53 MSR - Coefficient of Variation x 10 distribution - District
Visualization type: select "Pivot table"
Name (*): "53 MSR - Coefficient of Variation x 10 distribution - District"
Description: "MSR DV 53 - Monthly Stock Reporting / Coefficient of Variation x 10 distribution / Last 12 months / District / By item / Stacked column chart This report provides the number of items which fall into the respective coefficient of variation (standard deviation of stock distribution divided by average stock distribution) ranges (low, medium and high) across all items at a health facility for all health facilities in a district over the last 12 months."Series
Data
Data Type: "Indicators"
Indicator group: "Coefficient of variation"
Selected items: select the following items in the following order:
- Low variability
- Medium variability
- High variabilityCategory
Period: "Relative periods"
Period type: "Months"
Selected Periods: "Last 12 months"
Organisation unit: "User organisation unit"
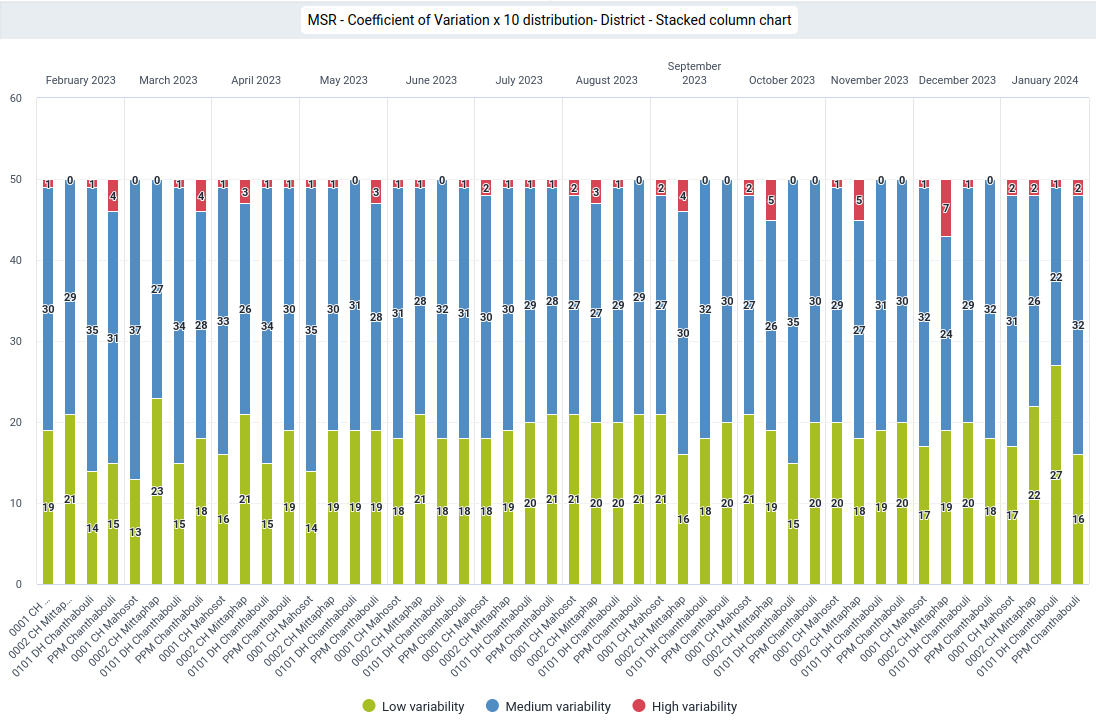
54 MSR - Coefficient of Variation x 10 distribution - District
Visualization type: select "Pivot table"
Name (*): "MSR - Coefficient of Variation x 10 distribution - District"
Description: "MSR DV 54 - Monthly Stock Reporting / Coefficient of Variation x 10 distribution / Last month / District / By item / Column chart This report provides the number of items which fall into the respective coefficient of variation (standard deviation of stock distribution divided by average stock distribution) ranges (low, medium and high) across all items at a health facility for the last month by health facilities in the district."Series
Data
Data Type: "Indicators"
Indicator group: "Coefficient of variation"
Selected items: select the following items in the following order:
- Low variability
- Medium variability
- High variabilityCategory
Period: "Relative periods"
Period type: "Months"
Selected Periods: "Last month"
Organisation unit: "User organisation unit"
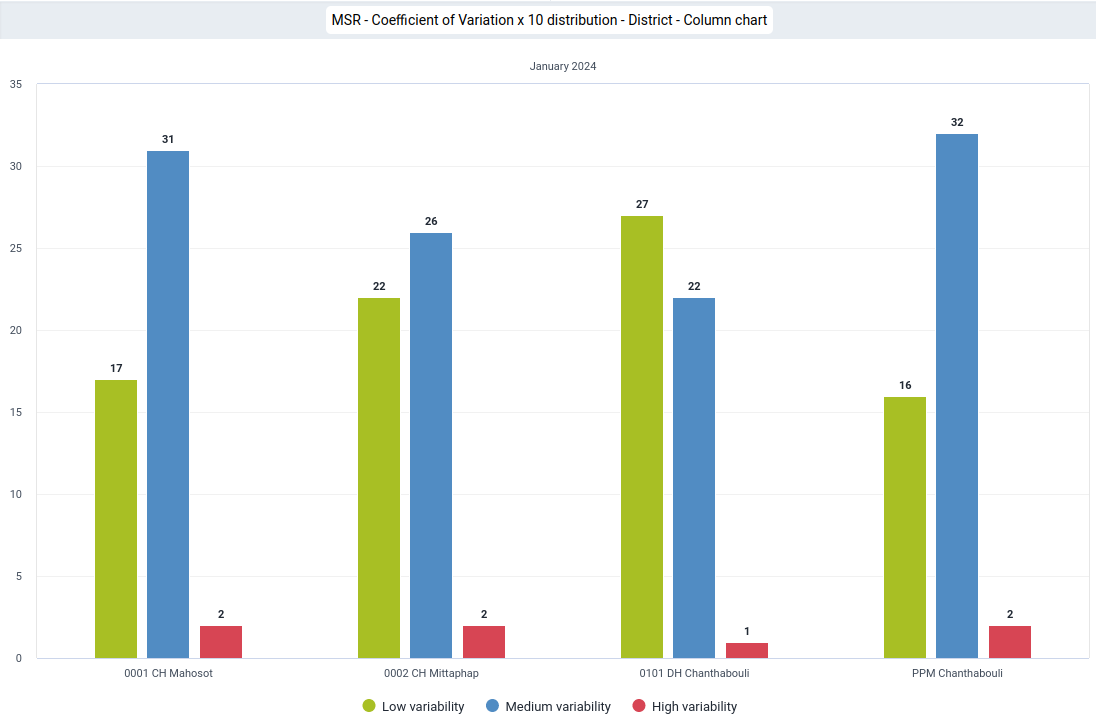
55 MSR - Stock availability - District
Visualization type: select "Pivot table"
Name (*): "MSR - Stock availability - District"
Description: "MSR DV 55 - Monthly Stock Reporting / Stock availability / Last 12 months / District / By item / Pivot table This report provides the stock availability across all stock items for all health facilities in a district over the last 12 months with a colour legend."Columns
Period: "Relative periods"
Period type: "Months"
Selected Periods: "Last 12 months"Rows
Organisation unit: "User organisation unit"
Filter
Data
Data Type: "Indicators"
Selected items: select "Stock availability / %"Options
Legend
Use legend for chart colors: tag (appears as a white tick in a green field)
Legend type
Select a legend: tag (appears as a white tick in a green field)
Legend: "Stock availability / %"
Show legend key tag (appears as a white tick in a green field)

56 MSR - Stock availability - District - Column chart
Visualization type: select "Bar"
Name (*): "MSR - Stock availability - District - Last 12 months"
Description: "MSR DV 56 - Monthly Stock Reporting / Stock availability / Last 12 months / District / Column chart This report displays the stock availability (number of items with non-zero stock on hand divided by the total number of stock items) as percentage for the past 12 months for all health facilities in a district as column charts with a legend."Series
Data
Data Type: "Indicators"
Selected items: select "Stock availability / %"Category
Period: "Relative periods"
Period type: "Months"
Selected Periods: "Last 12 months"Filter: "Relative periods"
Organisation unit: "User organisation unit"
Options
Legend
Use legend for chart colors: tag (appears as a white tick in a green field)
Legend type
Select a legend: tag (appears as a white tick in a green field)
Legend: "Stock availability / %"
Show legend key tag (appears as a white tick in a green field)
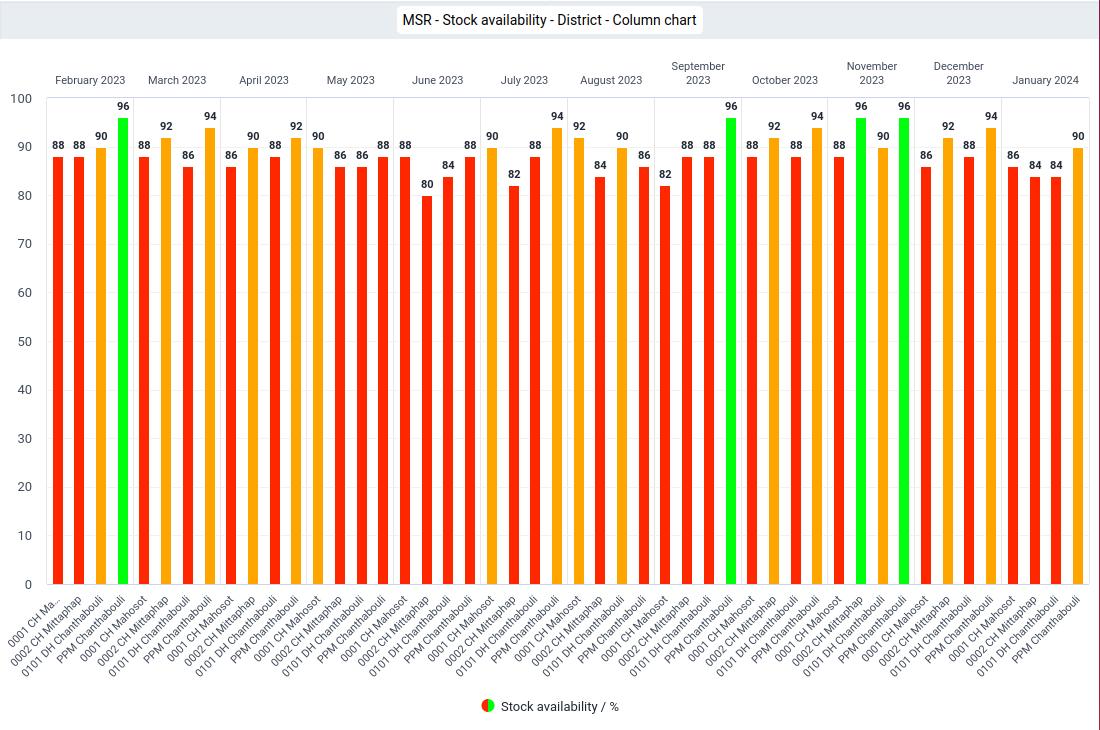
57 MSR - Stock availability - District - Last month
Visualization type: select "Single value"
Name (*): "MSR - Stock availability - District - Last month"
Description: "MSR DV 57 - Monthly Stock Reporting / Stock availability / Last month / Health facility / Column chart This report displays the stock availability (number of items with non-zero stock on hand divided by the total number of stock items) as percentage for the last month for all health facilities in a district as a Column chart with a legend."Series
Data
Data Type: "Indicators"
Selected items: select "Stock availability / %"Filter: "Relative periods"
Organisation unit: "User organisation unit"
Period: "Relative periods"Period type: "Months"
Selected Periods: "Last month"Options
Legend
Use legend for chart colors: tag (appears as a white tick in a green field)
Legend style
Legend changes background color: tag (appears as a white tick in a green field)
Legend type
Select a legend: tag (appears as a white tick in a green field)
Legend: "Stock availability / %"
Show legend key tag (appears as a white tick in a green field)
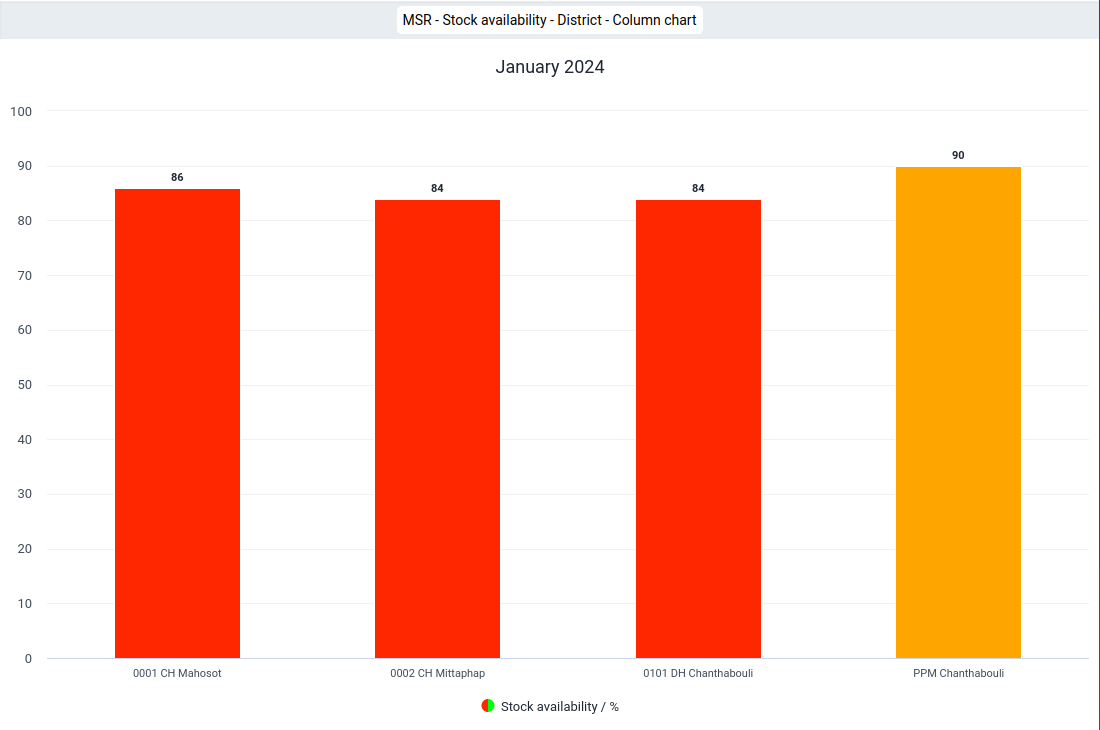
58 MSR - Stockout rate / % - District
Visualization type: select "Column"
Name (*): "MSR - Stockout rate & - District"
Description: "MSR DV 58 - Monthly Stock Reporting / Stockout rate / % / Last month / District / Column chart This report displays a column chart with the percentage of items with a stockout for the last month by health facility."Series
Data Type: "Indicators"
Selected items: "Stockout rate"Category
Period: "Relative periods"
Period type: "Months"
Selected Periods: "Last 12 month"
Organisation unit: "User organisation unit"
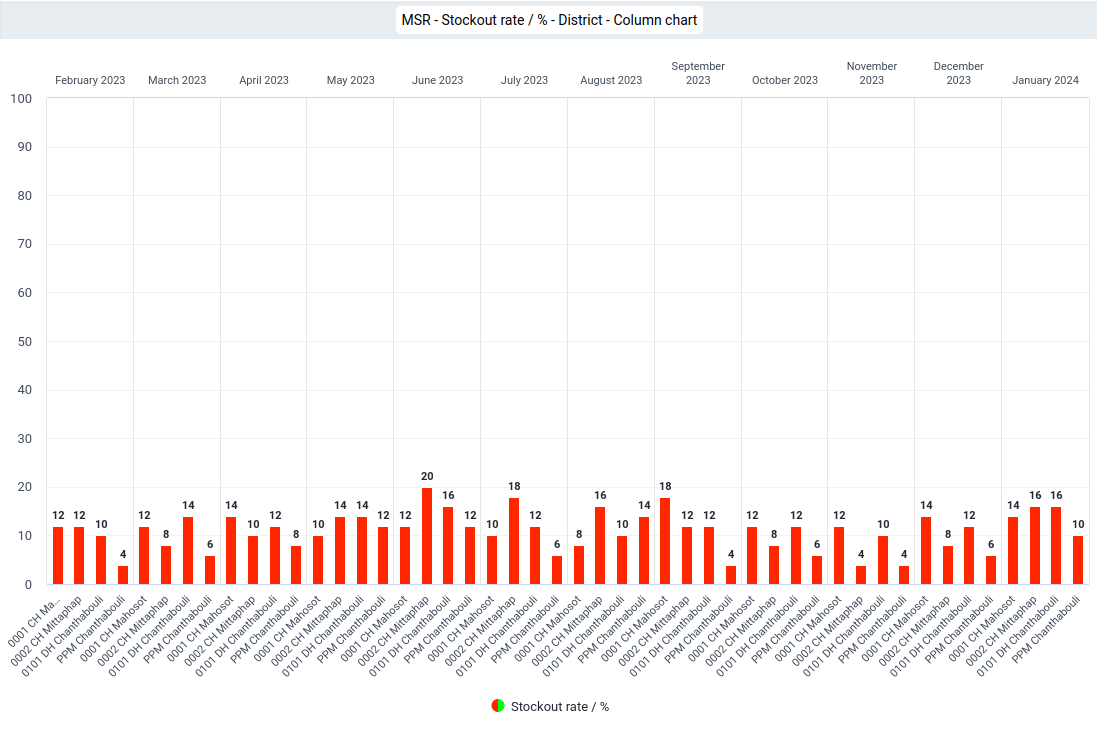
59 MSR - Stock availability and stockout rate - District
Visualization type: select "Stacked column"
Name (*): "MSR - Stock availability and stockout rate - District"
Description: "MSR DV 59 - Monthly Stock Reporting / Stock availability and stockout rate / Last 12 months / Health facility / Stacked column chart This report displays the stock availability (as percentage) and the stockout rate (which by definition must add up to 100%) as a Stacked column chart for all health facilities in a district for the past month."Series
Data Type: "Indicators"
Indicator group: "Stockout count"
Selected items:
- "Stock availability / %"
- "Stockout rate"
Category
Period: "Relative periods"
Period type: "Months"
Selected Periods: "Last 12 month"
Organisation unit: "User organisation unit"
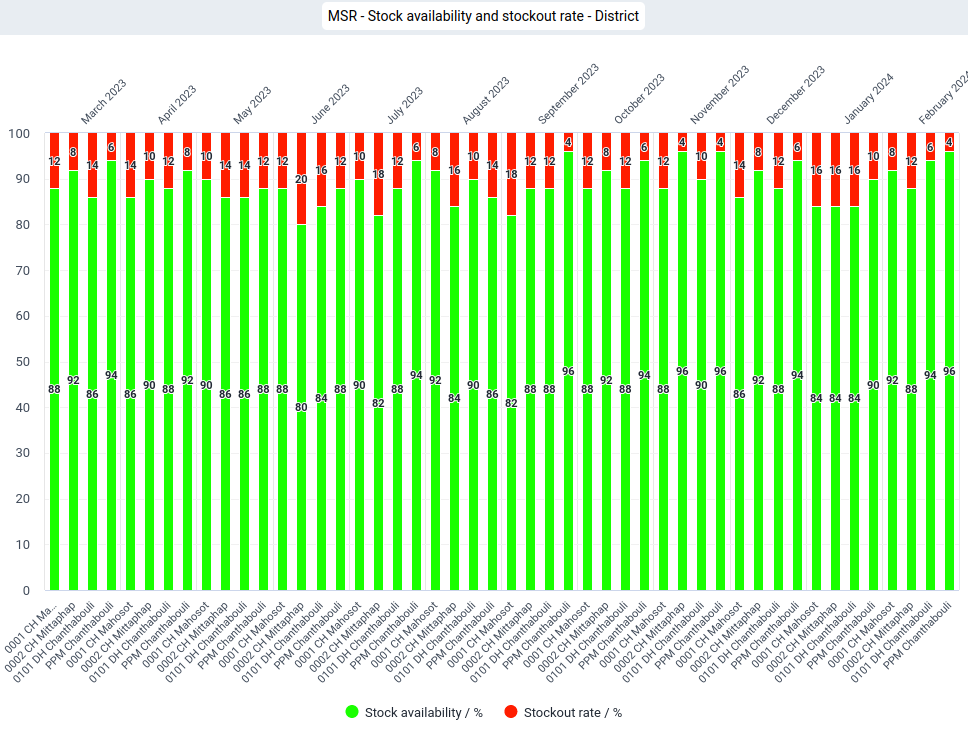
60 MSR - Stockouts - District
Visualization type: select "Pivot table"
Name (*): "MSR - Stockouts - District"
Description: "MSR DV 60 - Monthly Stock Reporting / Stockout by item / Last 12 months / District / By item / Pivot table This report displays a Pivot table with all items and indicating for each item whether it was out of stock for all health facilities in a district for the last 12 months."Columns
Period: "Relative periods"
Period type: "Months"
Selected Periods: "Last 12 months"Rows
Data
Data Type: "Data elements"
Data element group: select "[Stock item list] - MSR
Disaggregation: "Totals only"
Selected items: select all (->>)
Organisation unit: "User organisation unit"Filter: "Relative periods"
YOUR DIMENIONS
Name: "Monthly stock report"
Selected Items: "Stockout Yes/No"
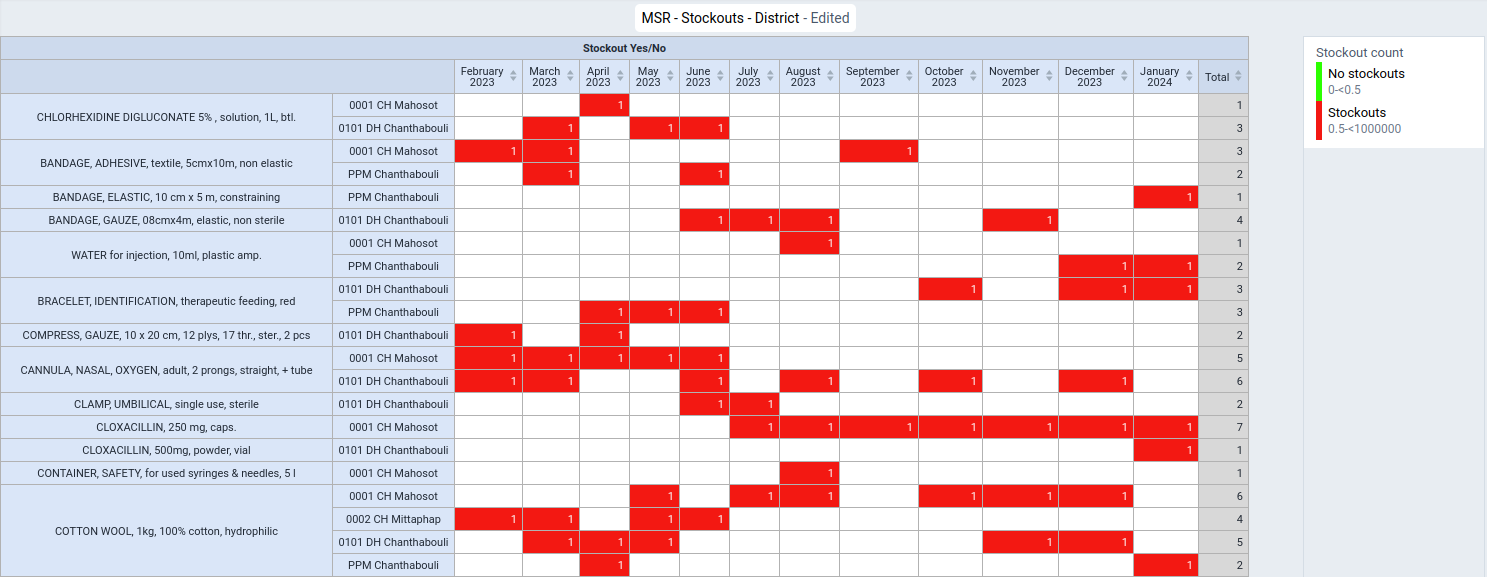
61 MSR - Stockout count - District
Visualization type: select "Pivot table"
Name (*): "MSR - Stockout count - District"
Description: "MSR DV 61 - Monthly Stock Reporting / Stockout count / Last 12 months / District / Pivot table This report displays the number of stockouts for all items for each of the past 12 months for all health facilities in a district as a Pivot table."Columns
Period: "Relative periods"
Period type: "Months"
Selected Periods: "Last 12 months"Rows
Organisation unit: "User organisation unit"
Filter
Data
Data Type: "Data elements"
Data element group: select "[Stock item list] - MSR
Disaggregation: "Totals only"
Selected items: select all (->>)YOUR DIMENIONS
Name: "Monthly stock report"
Selected Items: "Stockout Yes/No"Options
Legend
Use legend for chart colors: tag (appears as a white tick in a green field)
Legend style
Legend changes background color: tag (appears as a white tick in a green field)
Legend type
Select a legend: tag (appears as a white tick in a green field)
Legend: "Stockout count"

62 MSR - Stockout count - District
Visualization type: select "Column"
Name (*): "MSR - Stockout count - District"
Description: "MSR DV 62 - Monthly Stock Reporting / Stockout count / Last 12 months / District / Stacked column chart This report displays the number of stockouts for each of the past 12 months for all health facilities in a district as a column chart."Series
YOUR DIMENIONS
Name: "Monthly stock report"
Selected Items: "Stockout Yes/No"Category
Period: "Relative periods"
Period type: "Months"
Selected Periods: "Last 12 months"
Organisation unit: "User organisation unit"Filter
Data Type: "Data elements"
Data element group: select "[Stock item list] - MSR
Disaggregation: "Totals only"
Selected items: select all (->>)
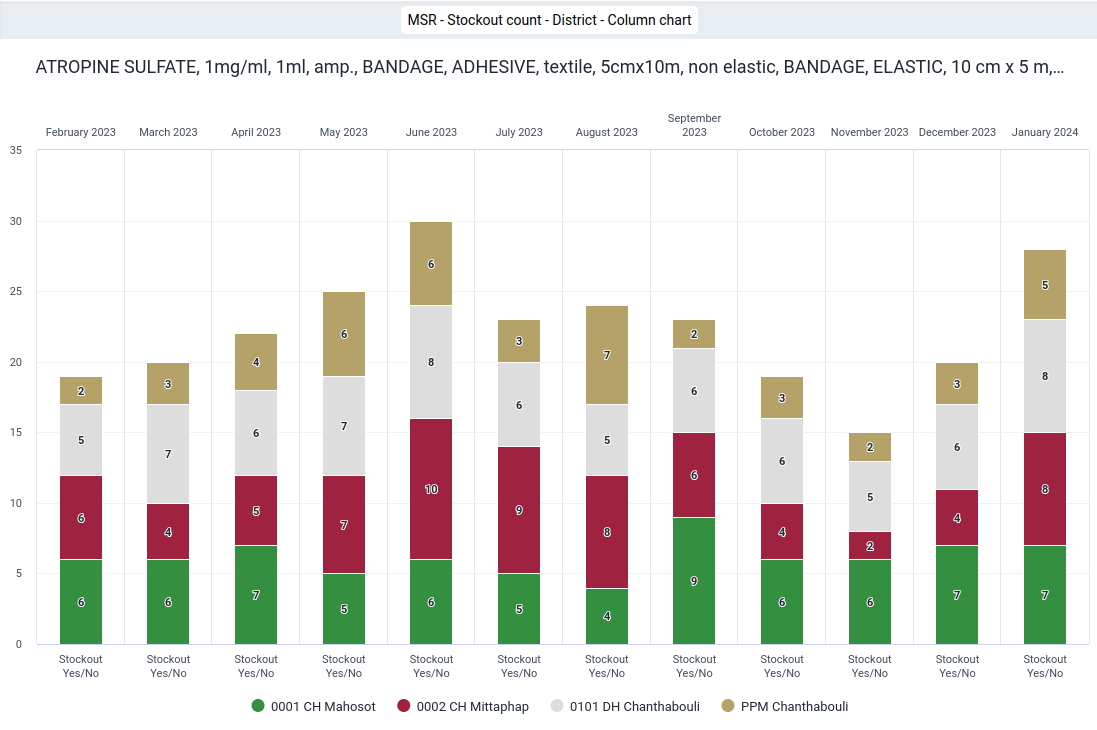
63 MSR - Stockout count - District
Visualization type: select "Single value"
Name (*): "MSR - Stockout count - District"
Description: "MSR DV 63 - Monthly Stock Reporting / Stockout count / Last month / District / Single value chart This report displays the total number of stockouts in all health facilities of a district during the last month as a single value chart."Series
Data
Data Type: "Indicators"
Selected items: select "Stockout count"Filter: "Relative periods"
Organisation unit: "User organisation unit"
Period: "Relative periods"Period type: "Months"
Selected Periods: "Last month"Options
Legend
Use legend for chart colors: tag (appears as a white tick in a green field)
Legend style
Legend changes background color: tag (appears as a white tick in a green field)
Legend type
Select a legend: tag (appears as a white tick in a green field)
Legend: "Stockout count"
64 MSR - Stockout duration - District
Visualization type: select "Pivot table"
Name (*): "MSR - Stockout duration - District"
Descriptions: "MSR DV 64 - Monthly Stock Reporting / Stockout duration / Last 12 months / District / Pivot table This report displays a Pivot table by item with a "1" indicating a stockout (and "0" indicating stock was available) with a total for the past 12 months which represents the number of months during which a stockout occurred for all health facilities in the district."Columns
YOUR DIMENIONS
Name: "Monthly stock report"
Selected Items: "Stockout Yes/No"
Period: "Relative periods"
Period type: "Months"
Selected Periods: "Last 12 month"Rows
Data
Data Type: "Data elements"
Data element group: select "[Stock item list] - MSR
Disaggregation: "Totals only"
Selected items: select all (->>)
Organisation unit: "User organisation unit"Options
Data
Totals
Column totals: tag (appears as a white tick in a green field)
Column sub-totals: tag (appears as a white tick in a green field)
Row totals: tag (appears as a white tick in a green field)Legend
Use legend for chart colors: tag (appears as a white tick in a green field)
Legend style
Legend changes background color: tag (appears as a white tick in a green field)
Legend type
Select a legend: tag (appears as a white tick in a green field)
Legend: "Stockout count"
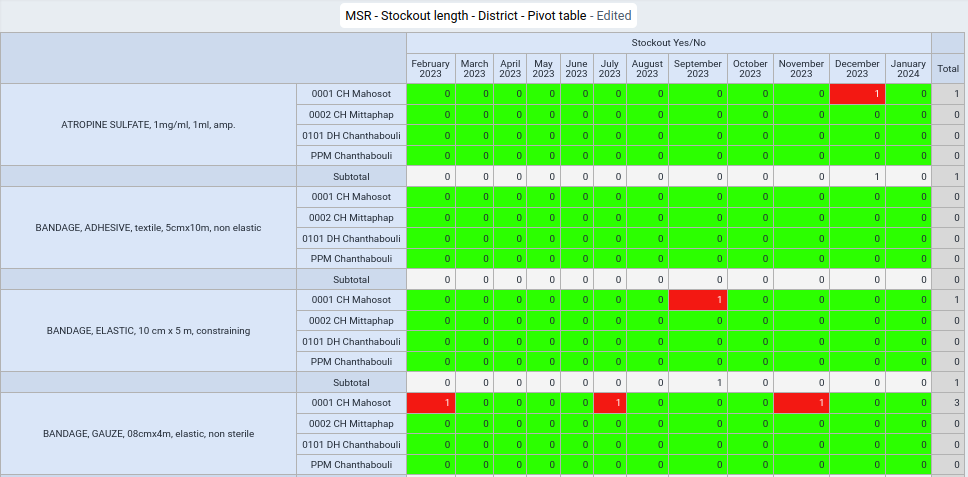
65 MSR - Stockout duration - District
Visualization type: select "Stacked bar chart"
Name (*): "MSR - Stockout duration - District"
Description: "MSR DV 65 - Monthly Stock Reporting / Stockout duration / Last 12 months / District / Stacked bar chart This report displays a stacked bar chart with the number of stockouts for each item by health facilities in the district during the past 12 months."Series
YOUR DIMENIONS
Name: "Monthly stock report"
Selected Items: "Stockout Yes/No"Category
Data
Data Type: "Data elements"
Data element group: select "[Stock item list] - MSR
Disaggregation: "Totals only"
Selected items: select all (->>)Filter
Organisation unit: "User organisation unit"
Period: "Relative periods"Period type: "Months"
Selected Periods: "Last 12 month"Options
Data
Hide empty categories: tag (appears as a white tick in a green field)
Dropdown menu: select "All"
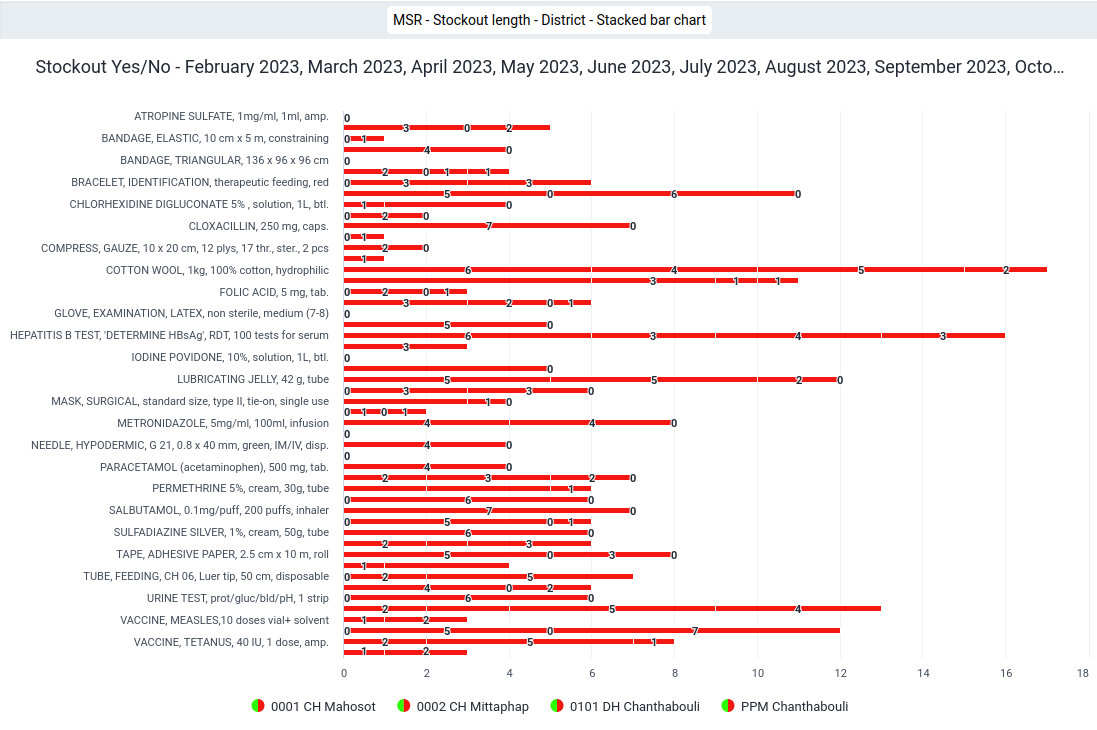
66 MSR - Stock coverage time - District
Visualization type: select "Pivot table"
Name (*): "MSR - Stock coverage time - District"
Description: "MSR DV 66 - Monthly Stock Reporting / Stock coverage time / absolute / Last 12 months / District / Pivot table This report displays a Pivot table by item with the coverage time (stock on hand divided by stock distributed during the last month) for the past 12 months for each health facility in a district. A blank field is shown, if either the stock on hand or the stock distribution for a month is zero."Columns
Period: "Relative periods"
Period type: "Months"
Selected Periods: "Last 12 month"Rows
Data
Data Type: "Data elements"
Data element group: select "[Stock item list] - MSR
Disaggregation: "Totals only"
Selected items: select all (->>)
Organisation unit: "User organisation unit"
Level: "Facility"Filter
YOUR DIMENIONS
Name: "Monthly stock report"
Selected Items: "Stockout coverage"Options
Legend
Use legend for chart colors: tag (appears as a white tick in a green field)
Legend style
Legend changes background color: tag (appears as a white tick in a green field)
Legend type
Select a legend: tag (appears as a white tick in a green field)
Legend: "Stock coverage time"
Show legend key tag (appears as a white tick in a green field)
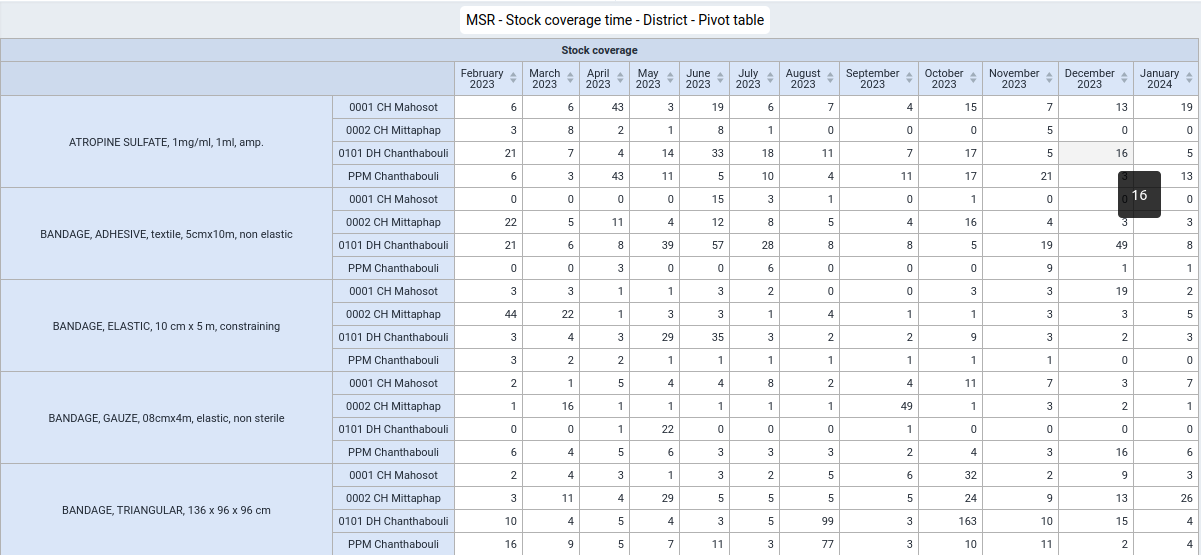
67 MSR - Stock coverage time distribution - District
Visualization type: select "Pivot table"
Name (*): "MSR - Stock coverage time distribution - District"
Description: "MSR DV 67 - Monthly Stock Reporting / Stock coverage time / distribution / Last 12 months / District / Column chart This report displays a Pivot table with the number of items for which the coverage time fell into the respective coverage time bins (stockout, 1 to 12 months, 1-2 and 2-3 years or greater than or equal to 3 years) for all health facilities in a district for each of the past 12 months."Columns
Data
Data Type: "Indicators"
Indicator group: select "Stock coverage time"
Selected items: select the following indicators in the following order:
- "Stockout count"
- "0-1 months"
- "1-2 months"
- "2-3 months"
- "3-4 months"
- "4-5 months"
- "5-6 months"
- "6-7 months"
- "7-8 months"
- "8-9 months"
- "9-10 months"
- "10-11 months"
- "11-12 months"
- "1-2 years"
- "2-3 years"
- ">=3 years"Rows
Period: "Relative periods"
Period type: "Months"
Selected Periods: "Last 12 month"
Organisation unit: "User organisation unit"Options
Data
Totals
Columns totals: tag (appears as a white tick in a green field)
Columns sub-totals: tag (appears as a white tick in a green field)
Row totals: tag (appears as a white tick in a green field)
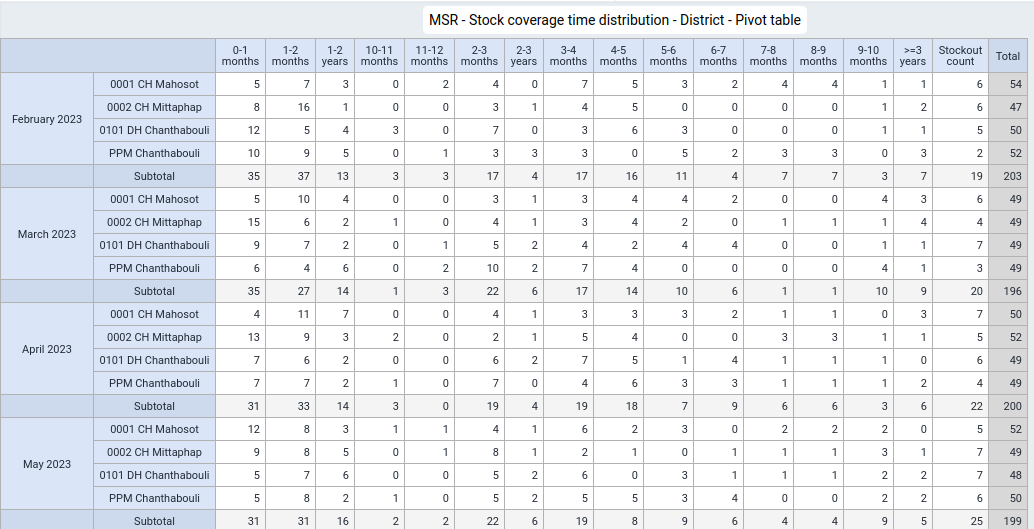
68 MSR - Stock coverage time distribution- District - Last 12 months
Visualization type: select "Stacked column"
Name (*): "MSR - Stock coverage time distribution - District - Last 12 months"
Description: "MSR DV 68 - Monthly Stock Reporting / Stock coverage time / distribution / Last 12 months / District / Stacked column chart For each of the 12 past months, this report displays a stacked column chart with the number of items for each stock coverage time bin (in months and years) separately for each health facility in the district."Series
Organisation unit: "User organisation unit"
Category
Period: "Relative periods"
Period type: "Months"
Selected Periods: "Last 12 month"
Data
Data Type: "Indicators"
Indicator group: select "Stock coverage time"
Selected items: select the following indicators in the following order:
- "Stockout count"
- "0-1 months"
- "1-2 months"
- "2-3 months"
- "3-4 months"
- "4-5 months"
- "5-6 months"
- "6-7 months"
- "7-8 months"
- "8-9 months"
- "9-10 months"
- "10-11 months"
- "11-12 months"
- "1-2 years"
- "2-3 years"
- ">=3 years"
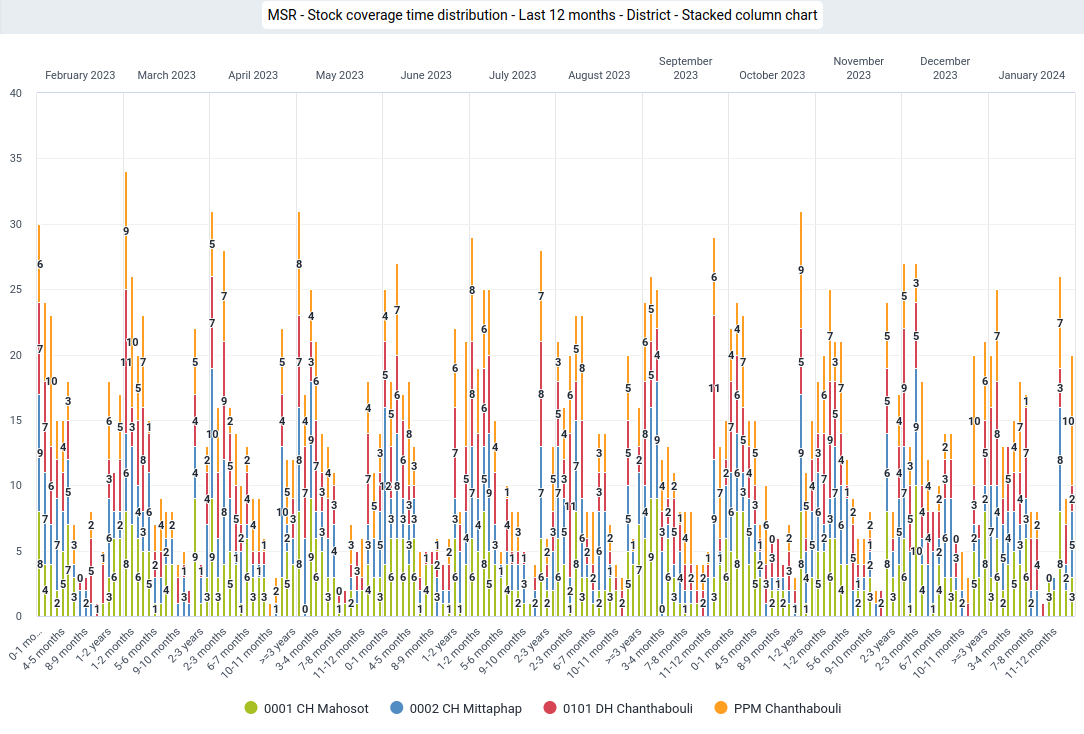
69 MSR - Stock coverage time distribution- District - Last month
Visualization type: select "Stacked column"
Name (*): "MSR - Stock coverage time distribution - District - Last month"
Description: "MSR DV 69 - Monthly Stock Reporting / Stock coverage time / distribution / Last month / District / Stacked column chart For the last month, this report displays a stacked column chart with the number of items for each stock coverage time bin (in months and years) separately for each health facility in the district."Series
Organisation unit: "User organisation unit"
Category
Data
Data Type: "Indicators"
Indicator group: select "Stock coverage time"
Selected items: select the following indicators in the following order:
- "Stockout count"
- "0-1 months"
- "1-2 months"
- "2-3 months"
- "3-4 months"
- "4-5 months"
- "5-6 months"
- "6-7 months"
- "7-8 months"
- "8-9 months"
- "9-10 months"
- "10-11 months"
- "11-12 months"
- "1-2 years"
- "2-3 years"
- ">=3 years"Filter
Period: "Relative periods"
Period type: "Months"
Selected Periods: "Last month"
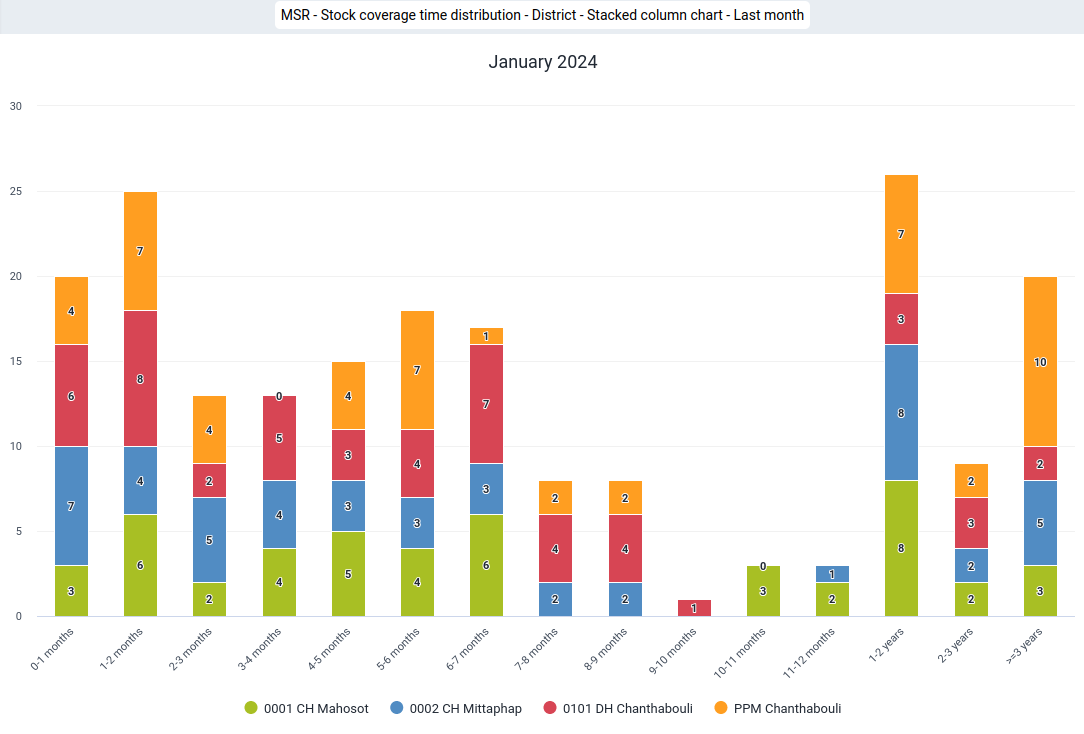
70 MSR - Stock coverage time categories - District
Visualization type: select "Column"
Name (*): "MSR - Stock coverage time categories - District"
Description: "MSR DV 70 - Monthly Stock Reporting / Stock coverage time / Categories / District / Column chart / Last month For the last month, this report displays a stacked column chart with the number of items for each coverage category (stockout, understock, appropriate stock, overstock and excessive stock) for each health facility in the district."Series
Organisation unit: "User organisation unit"
Category
Data
Data Type: "Indicators"
Indicator group: select "Stock coverage time"
Selected items: select the following indicators in the following order:
- "Stockout count"
- "Understock (0-3 months)"
- "Appropriate stock (3-6 months)"
- "Overstock (6-12 months)"
- "Excessive stock (> 12 months)"Filter
Period: "Relative periods"
Period type: "Months"
Selected Periods: "Last month"
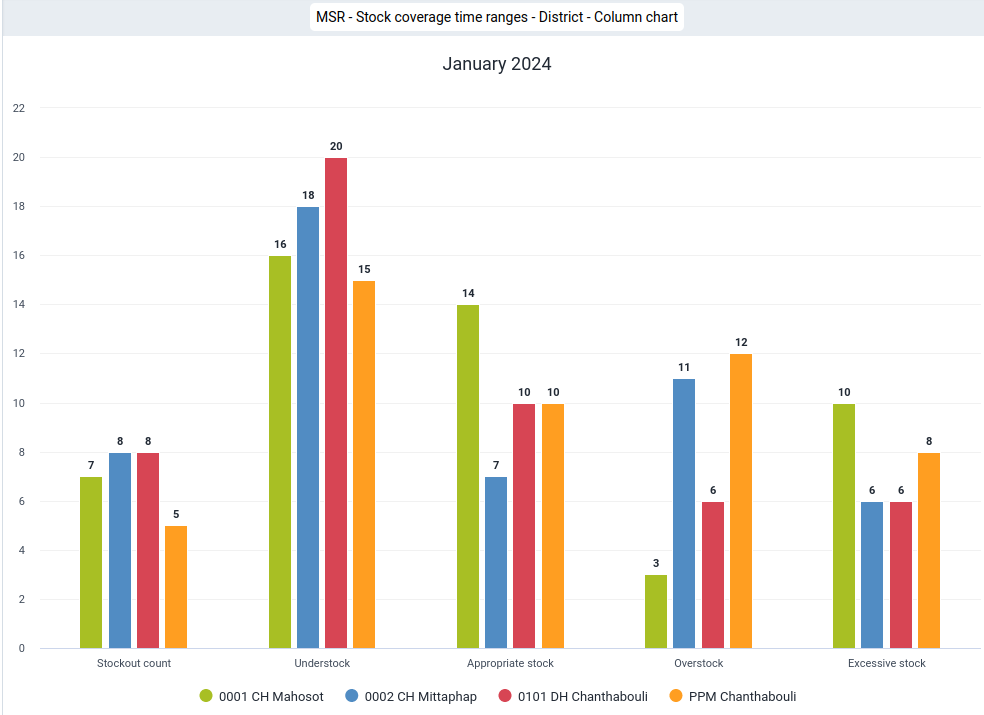
71 MSR - Stock coverage time categories - District
Visualization type: select "Stacked column"
Name (*): "MSR - Stock coverage time categories - District"
Description: "MSR DV 71 - Monthly Stock Reporting / Stock coverage time / Categories / District / Stacked column chart / Last 12 months For the 12 last months, this report displays a stacked column chart with the number of items for each stock coverage category (stockout, understock, appropriate stock, overstock and excessive stock) for each health facility in the district."Series
Organisation unit: "User organisation unit"
Category
Period: "Relative periods"
Period type: "Months"
Selected Periods: "Last 12 months"Data
Data Type: "Indicators"
Indicator group: select "Stock coverage time"
Selected items: select the following indicators in the following order:
- "Stockout count"
- "Understock (0-3 months)"
- "Appropriate stock (3-6 months)"
- "Overstock (6-12 months)"
- "Excessive stock (> 12 months)"
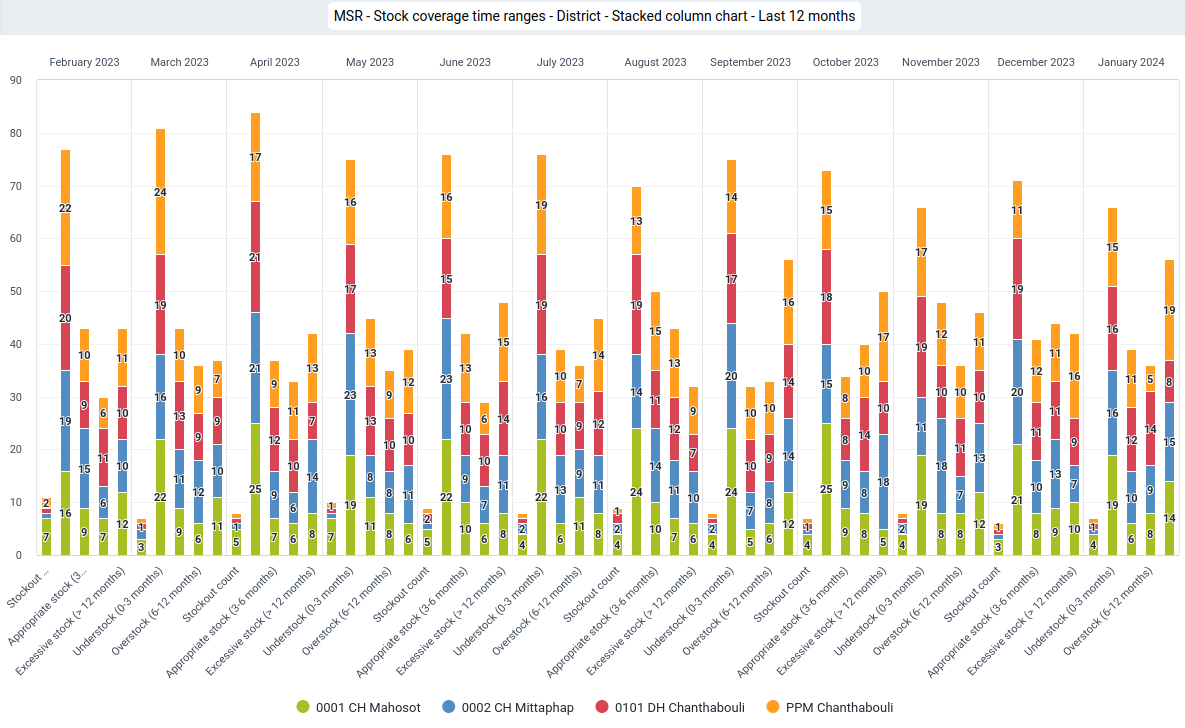
72 MSR - Stock discrepancy - District
Visualization type: select "Pivot table"
Name (*): "MSR - Stock discrepancy - District"
Description: "MSR DV 72 - Monthly Stock Reporting / Stock discrepancy / list / Last 12 months / District / Pivot table This report displays a list with the positive and negative stock discrepancy of the past 12 months by item for all health facilities in a district.
+ Stock on hand from the previous month (final stock on hand)
+ Stock receipt
- Stock distributed
- Stock redistributed
- Stock discard
- Stock correction
- Stock on hand."Columns
Period: "Relative periods"
Period type: "Months"
Selected Periods: "Last 12 month"Rows
Data
Data Type: "Data elements"
Data element group: select "[Stock item list] - MSR
Disaggregation: "Totals only"
Selected items: select all (->>)
Organisation unit: "User organisation unit"Filter
YOUR DIMENIONS
Name: "Monthly stock report"
Selected Items: "Stock discrepancy count"Options
Data
Totals
Row totals: tag (appears as a white tick in a green field)
73 MSR - Stock discrepancy count - District
Visualization type: select "Column"
Name (*): "MSR - Stock discrepancy count - District"
Visualization type: "MSR DV 73 - Monthly Stock Reporting / Stock discrepancy / count / Last 12 months / District / Stacked column chart This report displays the number of stock discrepancies for the past 12 months separately for each health facility in a district."Series
YOUR DIMENIONS
Name: "Monthly stock report"
Selected Items: "Stock discrepancy count"Category
Period: "Relative periods"
Period type: "Months"
Selected Periods: "Last 12 month"Filter
Organisation unit: "User organisation unit"
DataData Type: "Data elements"
Data element group: select "[Stock item list] - MSR
Disaggregation: "Totals only"
Selected items: select all (->>)
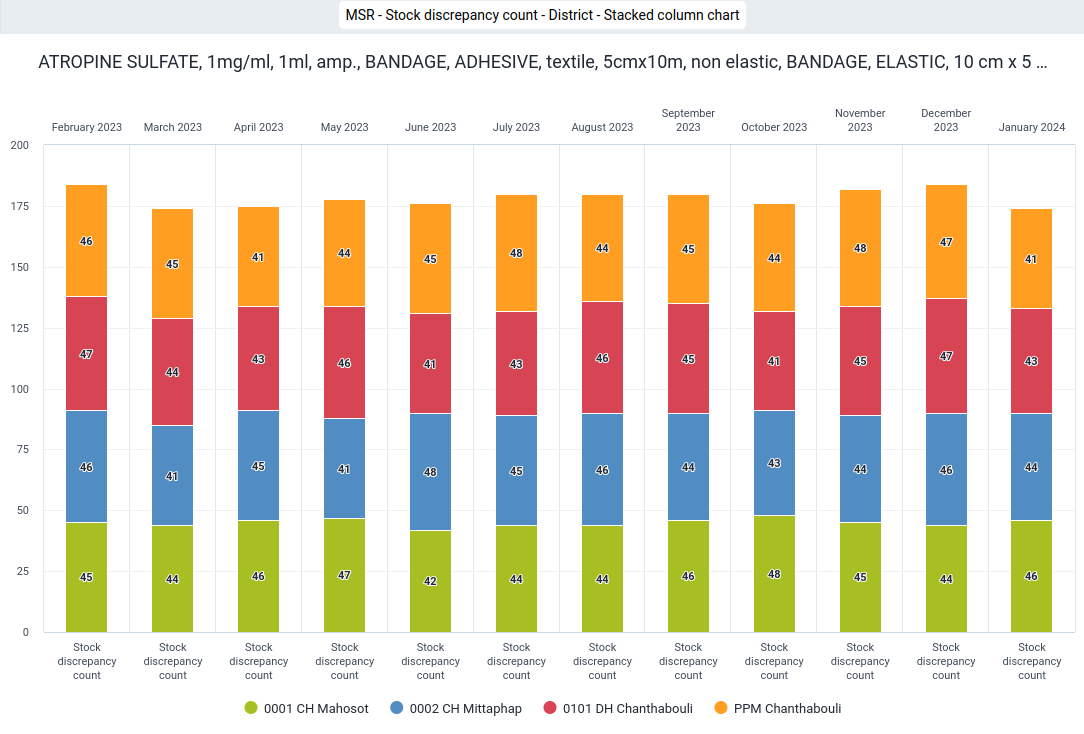
74 MSR - Stock discrepancy count - District
Visualization type: select "Single value"
Name (*): "MSR - Stock discrepancy count - District"
Visualization type: "MSR DV 74 - Monthly Stock Reporting / Stock discrepancy / count / Last month / District / Single value chart This report displays the number of stock discrepancies for the last month as a single value chart."Series
Data
Data Type: "Indicators"
Indicator group: select "Stockout discrepancy"
Selected items: "Stock discrepancy count"Filter
Organisation unit: "User organisation unit"
Period: "Relative periods"Period type: "Months"
Selected Periods: "Last month"
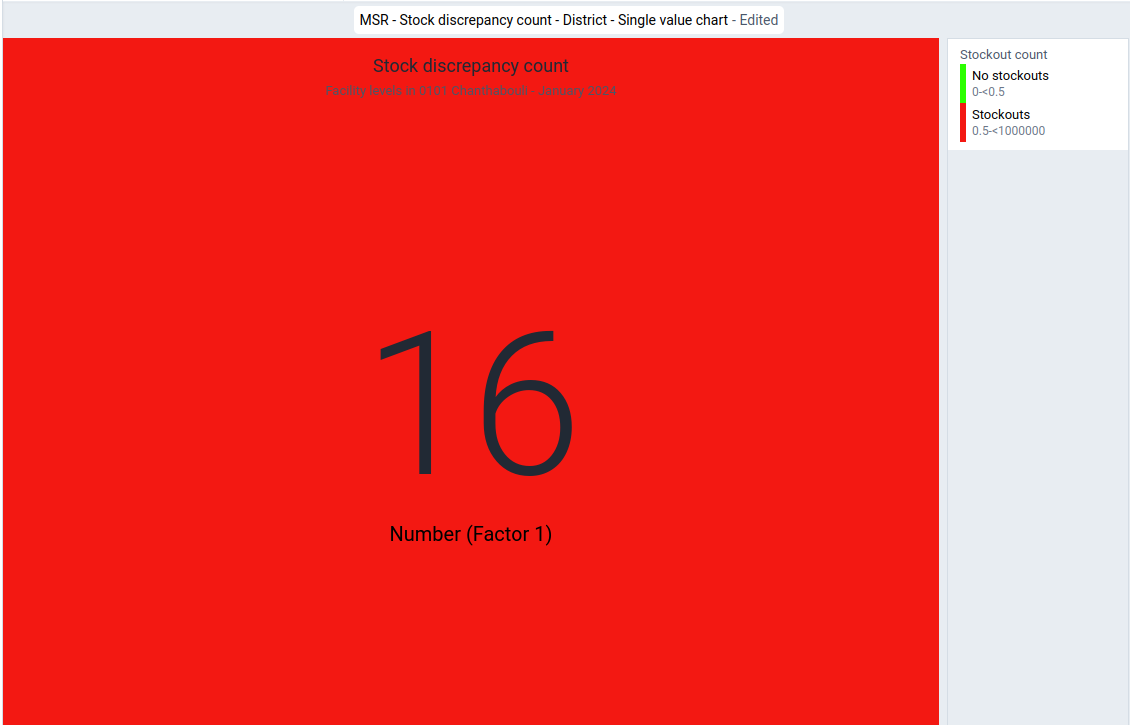
75 MSR - Report completeness - District
Visualization type: select "Pivot"
Name (*): "MSR - Report completeness - District"
Visualization type: "MSR DV 75 - Monthly Stock Reporting / Stock reporting complete / Last 12 months / District / Pivot table This report provides the "Reporting rate", "Reporting rate on time", "Actual reports", "Actual reports on time" as well as the "Expected reports" for the last 12 months for all health facilities in the district as a Pivot table."Columns
Period: "Relative periods"
Period type: "Months"
Selected Periods: "Last 12 month"Rows
Data
Data Type: "Data sets"
Data set: select "Monthly stock report"
Metric type:
- "Monthly stock report - Reporting rate"
- "Monthly stock report - Reporting rate on time"
- "Monthly stock report - Actual reports"
- "Monthly stock report - Actual reports on time"
- "Monthly stock report - Expected reports"
Organisation unit: "User organisation unit"
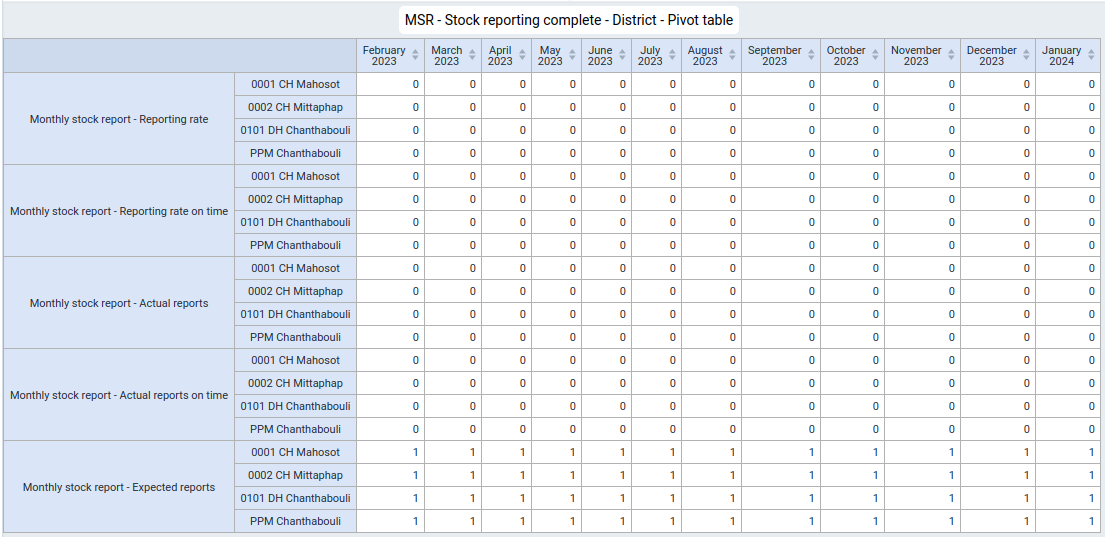
76 MSR - Reporting rate - District
Visualization type: select "Column"
Name (*): "MSR - Reporting rate - District"
Description: "MSR DV 76 - Monthly Stock Reporting / Reporting rate / Last 12 months / District / Column chart This report provides the "Reporting rate" for the last 12 months for all health facilities in a district as a Column chart."Series
Organisation unit: "User organisation unit"
Category
Period: "Relative periods"
Period type: "Months"
Selected Periods: "Last 12 month"Filter
Data
Data Type: "Data sets"
Data set: select "Monthly stock report"
Metric type:
- "Monthly stock report - Reporting rate"
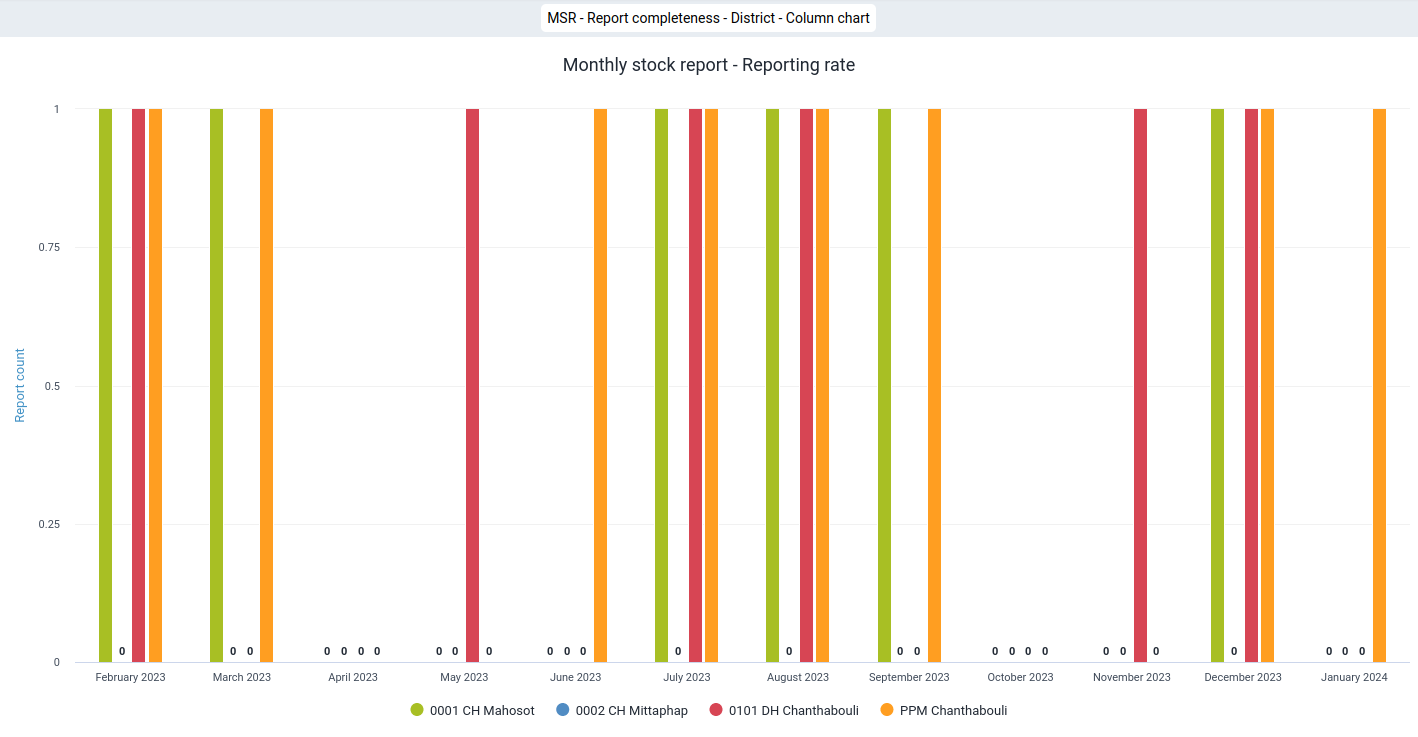
77 MSR - Reporting rate - District
Visualization type: select "Single value"
Name (*): "MSR - Reporting rate - District"
Visualization type: "MSR DV 77 - Monthly Stock Reporting / Reporting rate / Last month / District / Single value chart This report provides the "Reporting rate" for the last month across all the health facilities in a district as single value chart."Series
Data
Data Type: "Indicators"
Data set: select "Monthly stock report"
Metric type: "Reporting rate" Selected Items: "Monthly stock report - Reporting rate"Filter
Organisation unit: "User organisation unit"
Period: "Relative periods"Period type: "Months"
Selected Periods: "Last month"Options*
LegendUse legend for chart colors: tag (appears as a white tick in a green field)
Legend type
Select a legend: tag (appears as a white tick in a green field)
Legend: "Stock availability / %"
Show legend key tag (appears as a white tick in a green field)
78 MSR - Reporting rate on time - District
Visualization type: select "Single value"
Name (*): "78 MSR - Reporting rate on time - District"
Visualization type: "MSR DV 78 - Monthly Stock Reporting / Reporting rate on time / Last month / District / Single value chart This report provides the "Reporting rate on time" for the last month across all health facilities in a district as single value chart."Series
Data
Data Type: "Indicators"
Data set: select "Monthly stock report"
Metric type: "Reporting rate" Selected Items: "Monthly stock report - Reporting rate on time"Filter
Organisation unit: "User organisation unit"
Period: "Relative periods"Period type: "Months"
Selected Periods: "Last 12 months"Options*
LegendUse legend for chart colors: tag (appears as a white tick in a green field)
Legend type
Select a legend: tag (appears as a white tick in a green field)
Legend: "Stock availability / %"
Show legend key tag (appears as a white tick in a green field)
Province level
Statistics
79 MSR - Stock receipt - Province
Visualization type: select "Pivot table"
Name (*): "MSR - Stock receipt - Province"
Description: "MSR DV 79 - Monthly Stock Reporting / Stock receipt / Last 12 months / Province / By item / Pivot table This report provides the monthly stock receipts by district in a province as reported at the end of every month."Columns
Period: "Relative periods"
Period type: "Months"
Selected Periods: "Last 12 months"Rows
Data
Data Type: "Data elements"
Data element group: select "[Stock item list] - MSR
Disaggregation: "Totals only"
Selected items: select all (->>)
Organisation unit: "User organisation unit"
Legend: "District"Filter: "Relative periods"
YOUR DIMENIONS
Name: "Monthly stock report"
Selected Items: "Stock receipt"Options
Data
Totals
Column sub-totals: tag (appears as a white tick in a green field)
Row totals: tag (appears as a white tick in a green field)
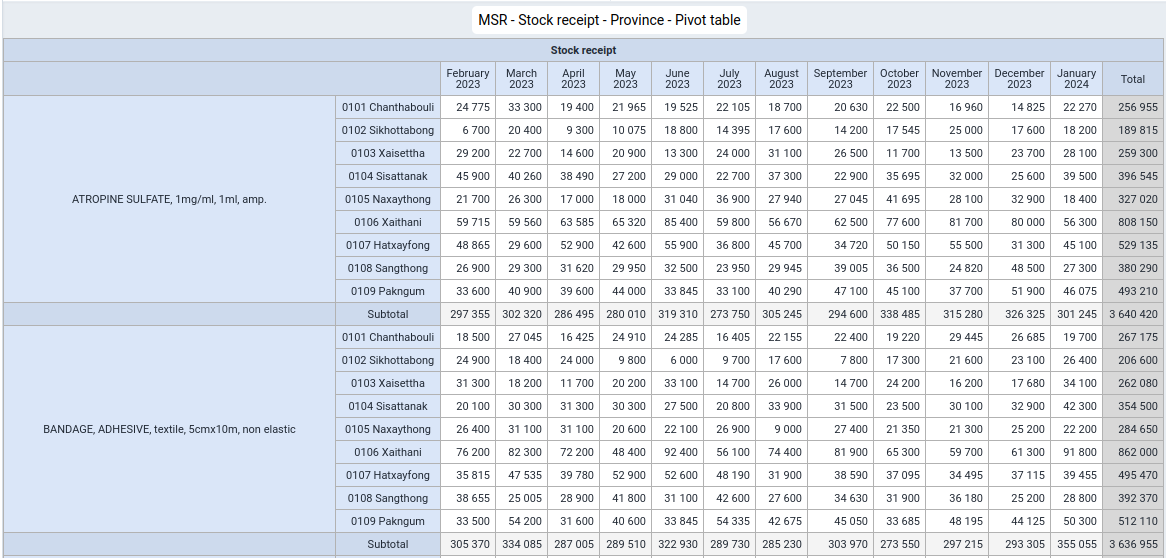
80 MSR - Stock distribution - Province
Visualization type: select "Pivot table"
Name (*): "MSR - Stock distribution - Province"
Description: "MSR DV 80 - Monthly Stock Reporting / Stock distribution / Last 12 months / Province / By item / Pivot table
This report provides the monthly stock distributions by district in a province as reported at the end of every month."Columns
Period: "Relative periods"
Period type: "Months"
Selected Periods: "Last 12 months"Rows
Data
Data Type: "Data elements"
Data element group: select "[Stock item list] - MSR
Disaggregation: "Totals only"
Selected items: select all (->>)Organisation unit: "User organisation unit"
Level: "District" Selected Periods: "Last 12 months"
Filter: "Relative periods"
YOUR DIMENIONS
Name: "Monthly stock report"
Selected Items: "Stock distribution"Options
Data
Totals
Column sub-totals: tag (appears as a white tick in a green field)
Row totals: tag (appears as a white tick in a green field)
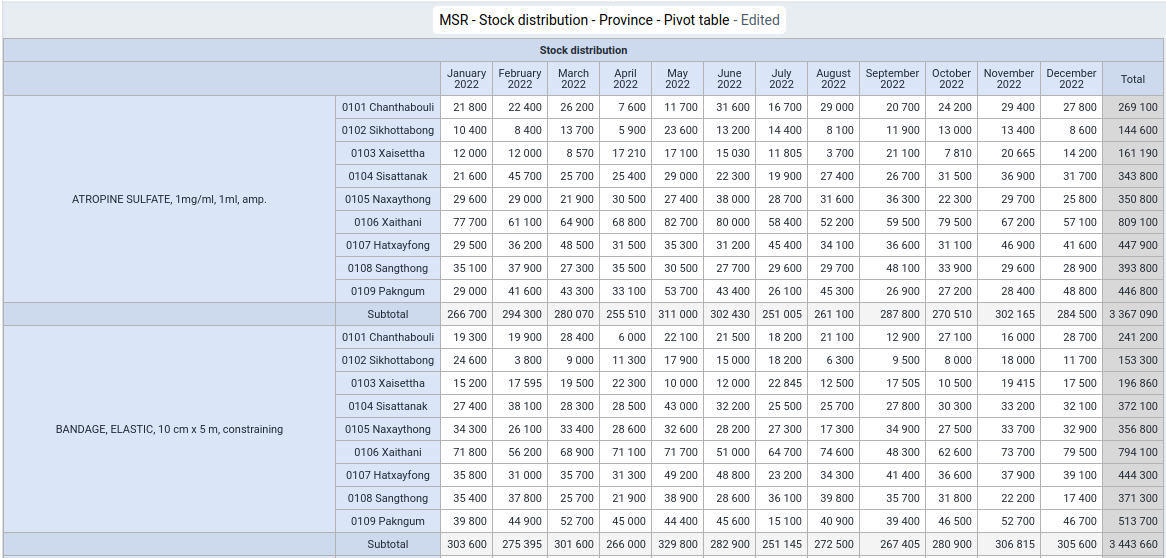
81 MSR - Stock redistribution - Province
Visualization type: select "Pivot table"
Name (*): "MSR - Stock redistribution - Province"
Description: "MSR DV 81 - Monthly Stock Reporting / Stock redistribution / Last 12 months / Province / By item / Pivot table.
This report provides the monthly stock redistributions by districts in a province as reported at the end of every month."Columns
Period: "Relative periods"
Period type: "Months"
Selected Periods: "Last 12 months"Rows
Data
Data Type: "Data elements"
Data element group: select "[Stock item list] - MSR
Disaggregation: "Totals only"
Selected items: select all (->>)
Organisation unit: "User organisation unit" Level: "District"Filter: "Relative periods"
Selected Periods: "Last 12 months"
YOUR DIMENIONS
Name: "Monthly stock report"
Selected Items: "Stock redistribution"Options
Data
Totals
Column sub-totals: tag (appears as a white tick in a green field)
Row totals: tag (appears as a white tick in a green field)
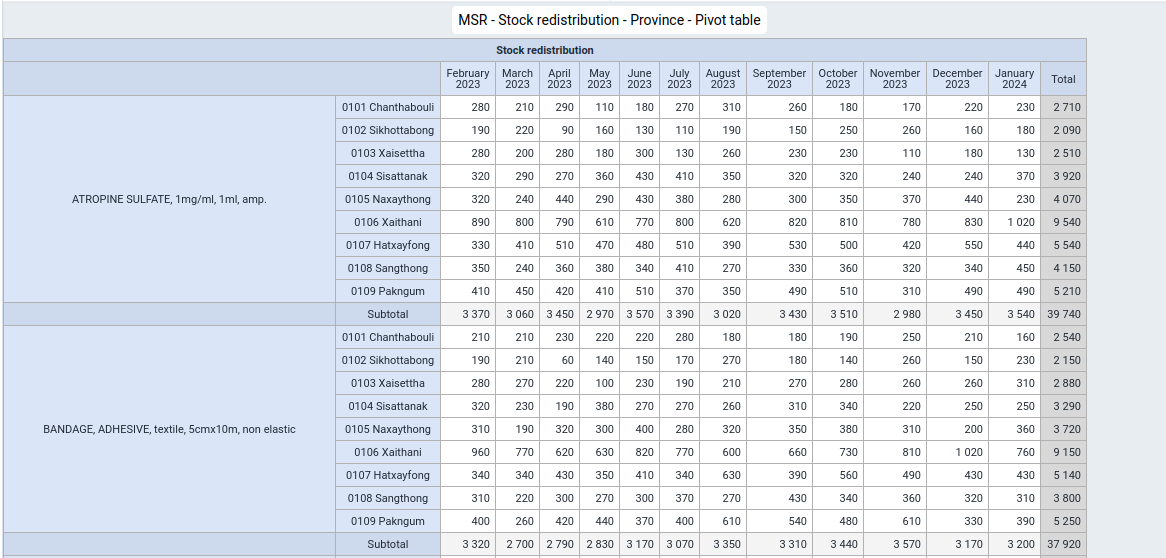
82 MSR - Stock discard - Province
Visualization type: select "Pivot table"
Name (*): "MSR - Stock discard - Province"
Description: "MSR DV 82 - Monthly Stock Reporting / Stock discard / Last 12 months / Province / By item / Pivot table
This report provides the monthly stock discards by districts in a province as reported at the end of every month."Columns
Period: "Relative periods"
Period type: "Months"
Selected Periods: "Last 12 months"Rows
Data
Data Type: "Data elements"
Data element group: select "[Stock item list] - MSR
Disaggregation: "Totals only"
Selected items: select all (->>)
Organisation unit: "User organisation unit" (Level set to "District")Filter: "Relative periods"
Selected Periods: "Last 12 months"
YOUR DIMENIONS
Name: "Monthly stock report"
Selected Items: "Stock discard"Options
Data
Totals
Column sub-totals: tag (appears as a white tick in a green field)
Row totals: tag (appears as a white tick in a green field)
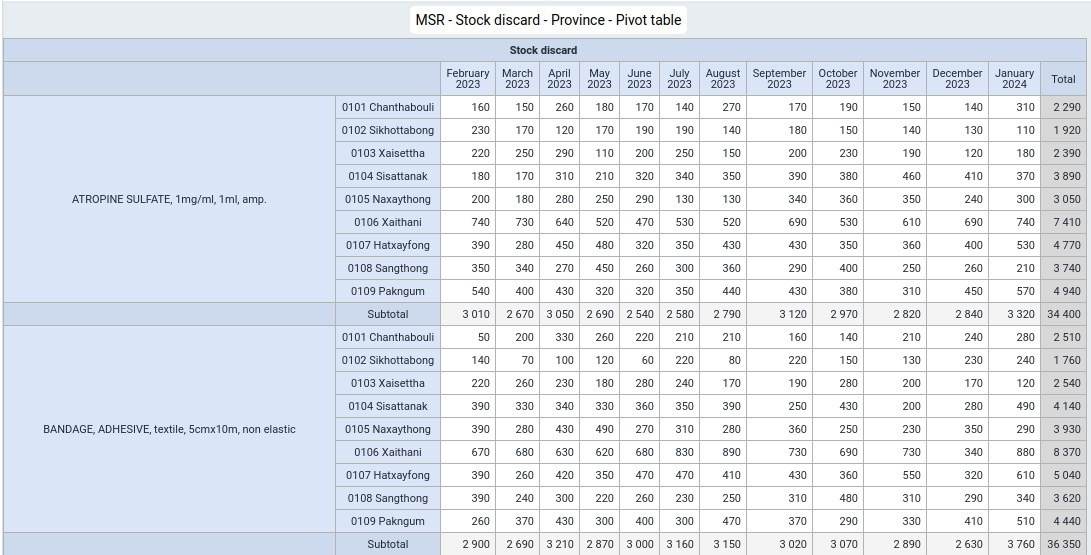
83 MSR - Stock on hand - Province
Visualization type: select "Pivot table"
Name (*): "MSR - Stock on hand - Province - Pivot table"
Description: "MSR DV 83 - Monthly Stock Reporting / Stock on hand / Last 12 months / Province / By item / Pivot table
This report provides the monthly stock on hand by district in a province as reported at the end of every month."Columns
Period: "Relative periods"
Period type: "Months"
Selected Periods: "Last 12 months"Rows
Data
Data Type: "Data elements"
Data element group: select "[Stock item list] - MSR
Disaggregation: "Totals only"
Selected items: select all (->>)
Organisation unit: "User organisation unit" Level: "District"Filter: "Relative periods"
Selected Periods: "Last 12 months"
YOUR DIMENIONS
Name: "Monthly stock report"
Selected Items: "Stock on hand"Options
Data
Totals
Column sub-totals: tag (appears as a white tick in a green field)
Row totals: tag (appears as a white tick in a green field)
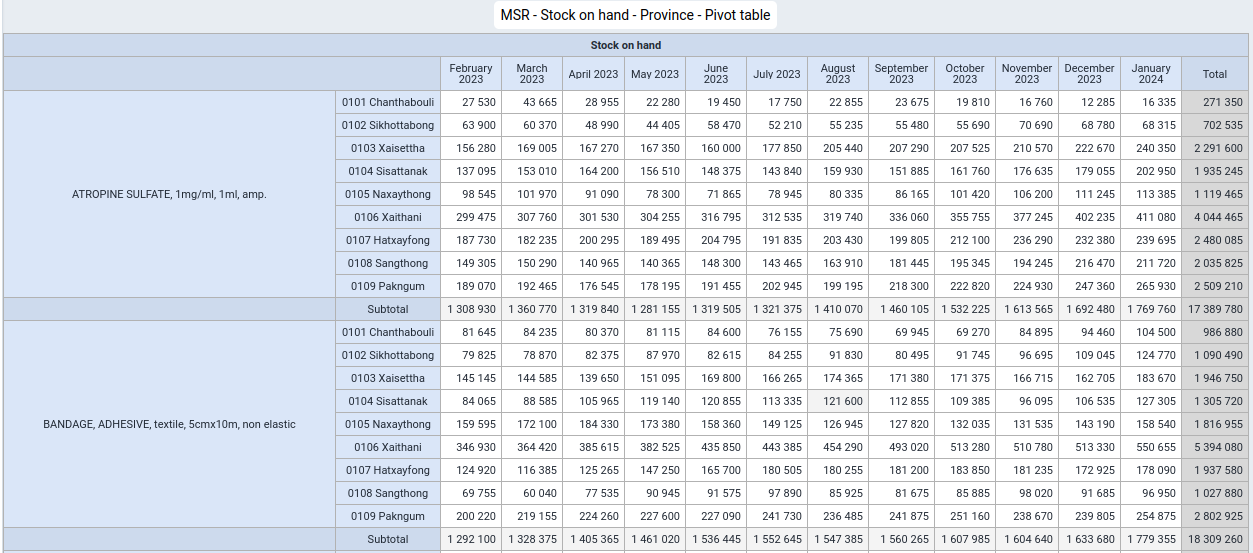
84 MSR - Stock correction - Province
Visualization type: select "Pivot table"
Name (*): "MSR - Stock correction - Province - Pivot table"
Description: "MSR DV 84 - Monthly Stock Reporting / Stock correction / Last 12 months / Province / By item / Pivot table This report provides the monthly stock corrections by district in a province as reported at the end of every month."Columns
Period: "Relative periods"
Period type: "Months"
Selected Periods: "Last 12 months"Rows
Data
Data Type: "Data elements"
Data element group: select "[Stock item list] - MSR
Disaggregation: "Totals only"
Selected items: select all (->>)
Organisation unit: "User organisation unit" (Level set to "District")Filter: "Relative periods"
Selected Periods: "Last 12 months"
YOUR DIMENIONS
Name: "Monthly stock report"
Selected Items: "Stock correction"Options
Data
Totals
Column sub-totals: tag (appears as a white tick in a green field)
Row totals: tag (appears as a white tick in a green
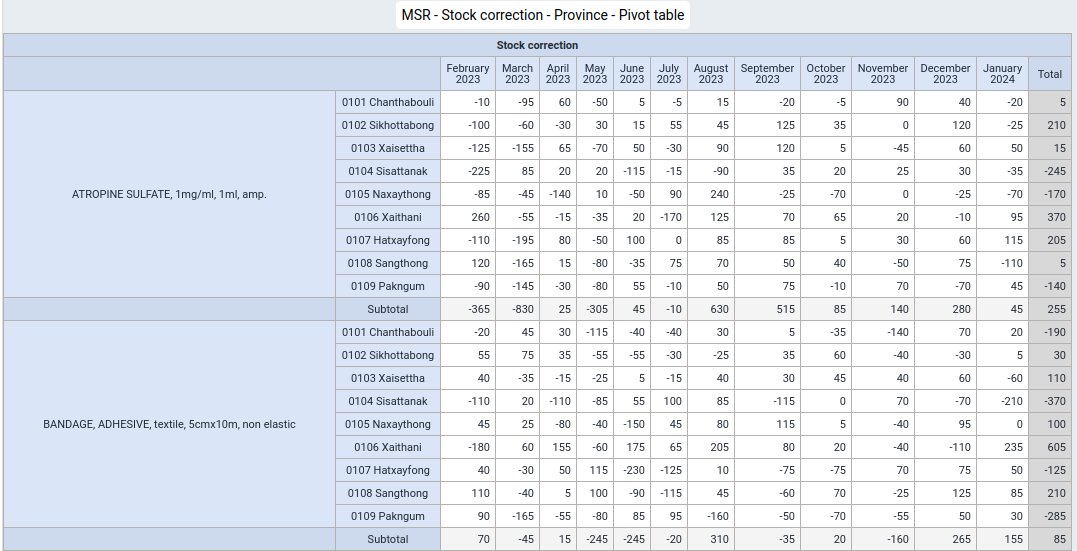
85 MSR - Stock report complete - Province
Visualization type: select "Pivot table"
Name (*): "MSR - Stock report complete - Province"
Description: "MSR DV 85 - Monthly Stock Reporting / Stock report complete / Last 3 months / Province / By item / Pivot table This report provides an overview of all stock data by district in a province from the last 3 months."Columns
Period: "Relative periods"
Period type: "Months"
Selected Periods: "Last month"
YOUR DIMENIONS
Name: "Monthly stock report"
Selected Items: "Stock distribution"Rows
Data
Data Type: "Data elements"
Data element group: select "[Stock item list] - MSR
Disaggregation: "Totals only"
Selected items: select all (->>)
Organisation unit: "User organisation unit"
Level: "District"Options
Data
Totals
Column sub-totals: tag (appears as a white tick in a green field)
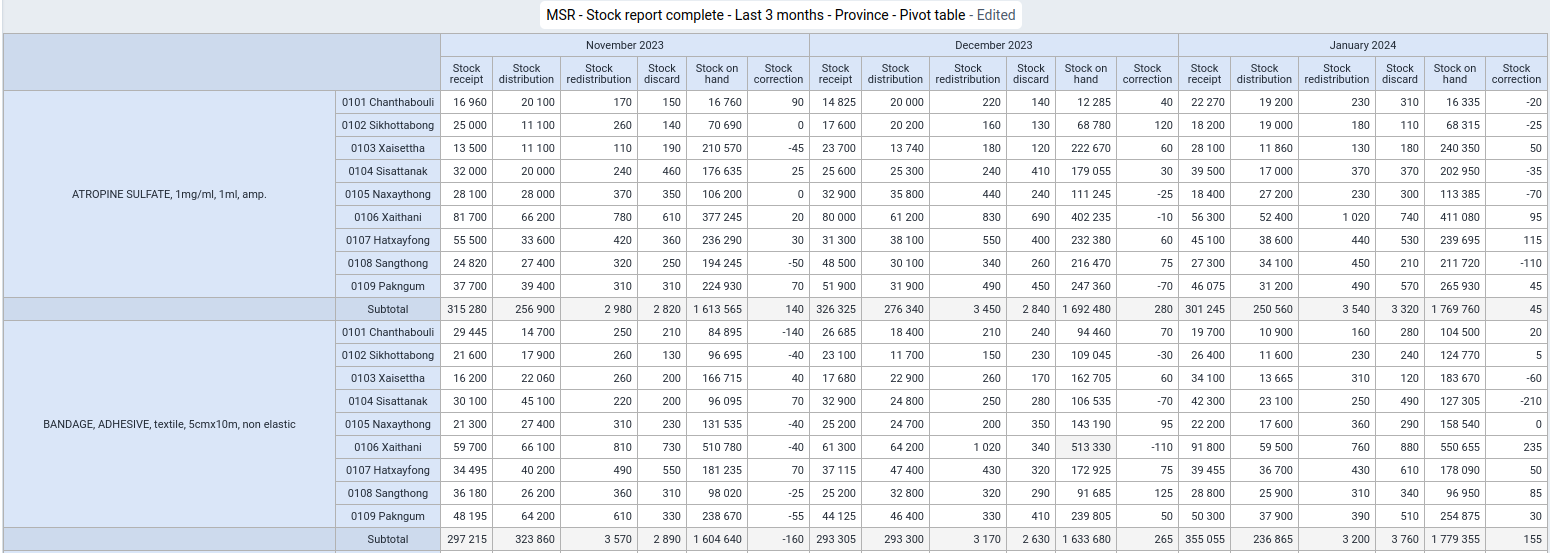
Indicators
86 MSR - Coefficient of Variation x 10 - Province
Visualization type: select "Stacked bar"
Name (*): "MSR - Coefficient of Variation x 10 - Province"
Description: "MSR DV 86 - Monthly Stock Reporting / Stock distribution / Coefficient of Variation x 10 / Last month / Province / By item / Stacked bar chart This report provides the coefficient of variation (standard deviation of stock distribution divided by the average stock distribution) which is based on the previous six months as a group of column charts for the last month and by health facilities in a province. Since decimals cannot be displayed in this report the result of the actual calculation is multiplied by 10 and rounded to the next integer."Series
Organisation unit: "User organisation unit"
Level: "Province"
Category
Data
Data Type: "Data elements"
Data element group: select "[Stock item list] - MSR
Disaggregation: "Totals only"
Selected items: select all (->>)Filter: "Relative periods"
Period: "Relative periods"
Period type: "Months"
Selected Periods: "Last month"YOUR DIMENIONS
Name: "Monthly stock report"
Selected Items: "Coefficient of variation"Legend
Use legend for chart colors: tag (appears as a white tick in a green field)
Legend type
Select a legend: tag (appears as a white tick in a green field)
Legend: "Coefficient of variation"
Show legend key tag (appears as a white tick in a green field)

87 MSR - Coefficient of Variation x 10 distribution - Province
Visualization type: select "Pivot table"
Name (*): "87 MSR - Coefficient of Variation x 10 distribution - Province"
Description: "MSR DV 87 - Monthly Stock Reporting / Coefficient of Variation x 10 distribution / Last 12 months / Province / Across items / Pivot table This report provides the coefficient of variation (standard deviation of stock distribution divided by average stock distribution) distribution by health facilities in the province over the last 12 months with a colour legend."Columns
Period: "Relative periods"
Period type: "Months"
Selected Periods: "Last months"Data
Data Type: "Indicators"
Indicator group: "Coefficient of variation"
Selected items: select the following items in the following order:
- Low variability
- Medium variability
- High variabilityRows
Organisation unit: "User organisation unit"
Level: "District"
Options
Data
Totals
Row totals: tag (appears as a white tick in a green field)
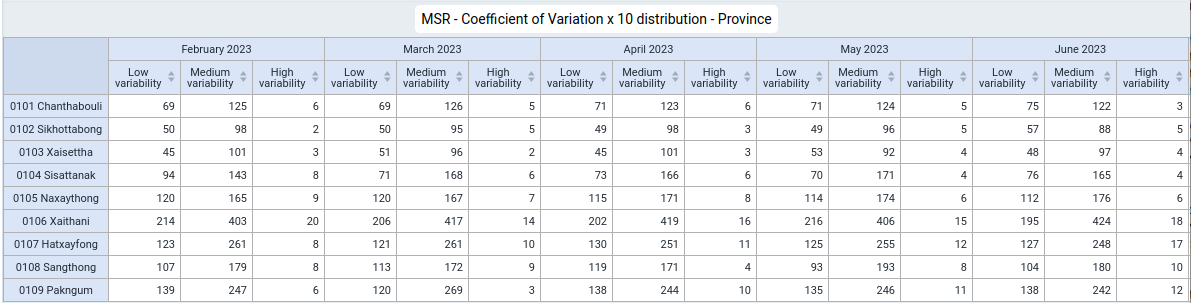
88 MSR - Coefficient of Variation x 10 distribution - Province
Visualization type: select "Stacked column"
Name (*): "MSR - Coefficient of Variation x 10 distribution - Province"
Description: "MSR DV 88 - Monthly Stock Reporting / Coefficient of Variation x 10 distribution / Last 12 months / District / By item / Stacked column chart This report provides the number of items which fall into the respective coefficient of variation (standard deviation of stock distribution divided by average stock distribution) ranges (low, medium and high) across all items at a health facility for all health facilities in a province for the last month."Series
Data
Data Type: "Indicators"
Indicator group: "Coefficient of variation"
Selected items: select the following items in the following order:
- Low variability
- Medium variability
- High variabilityCategory
Period: "Relative periods"
Period type: "Months"
Selected Periods: "Last 12 months"
Organisation unit: "User organisation unit"
Level: "District"
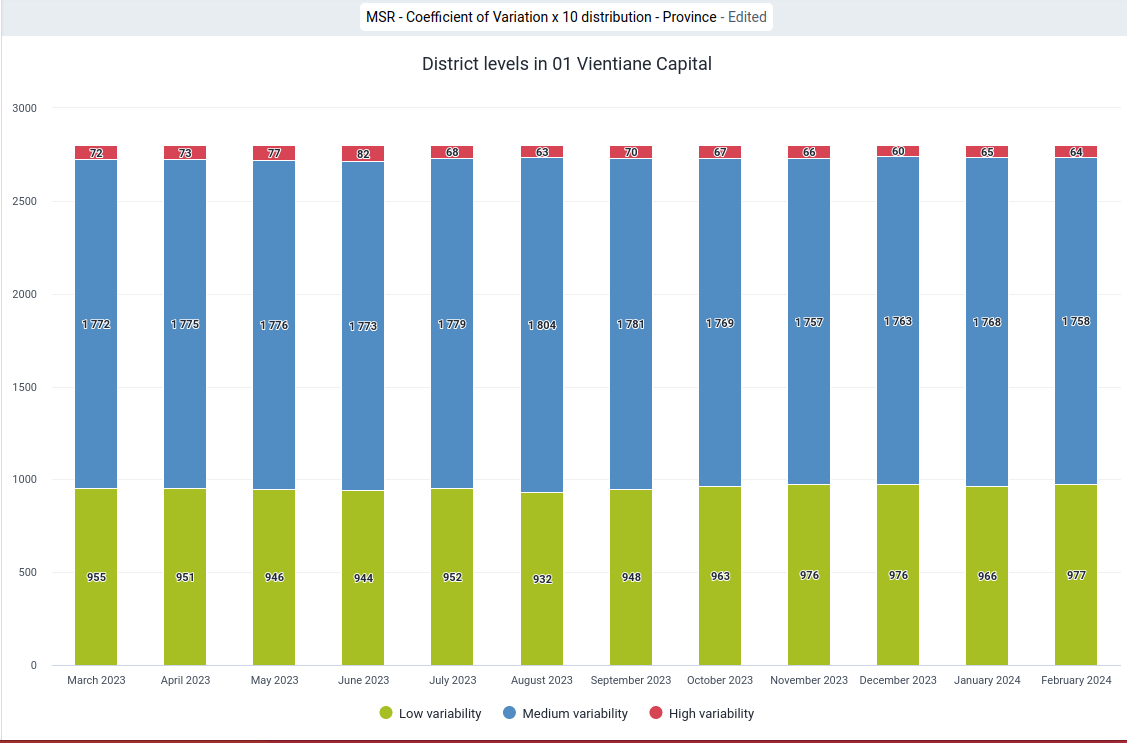
89 MSR - Coefficient of Variation x 10 distribution - Province
Visualization type: select "Column chart"
Name (*): "MSR - Coefficient of Variation x 10 distribution - Province"
Description: "MSR DV 89 - Monthly Stock Reporting / Coefficient of Variation x 10 distribution / Last 3 months / Province / Column chart This report provides the number of items which fall into the respective coefficient of variation (standard deviation of stock distribution divided by average stock distribution) ranges (low, medium and high) across all items at a health facility for the last 3 months for all health facilities in the province."Series
Data
Data Type: "Indicators"
Indicator group: "Coefficient of variation"
Selected items: select the following items in the following order:
- Low variability
- Medium variability
- High variabilityCategory
Period: "Relative periods"
Period type: "Months"
Selected Periods: "Last 3 months"
Organisation unit: "User organisation unit"
Level: "District"
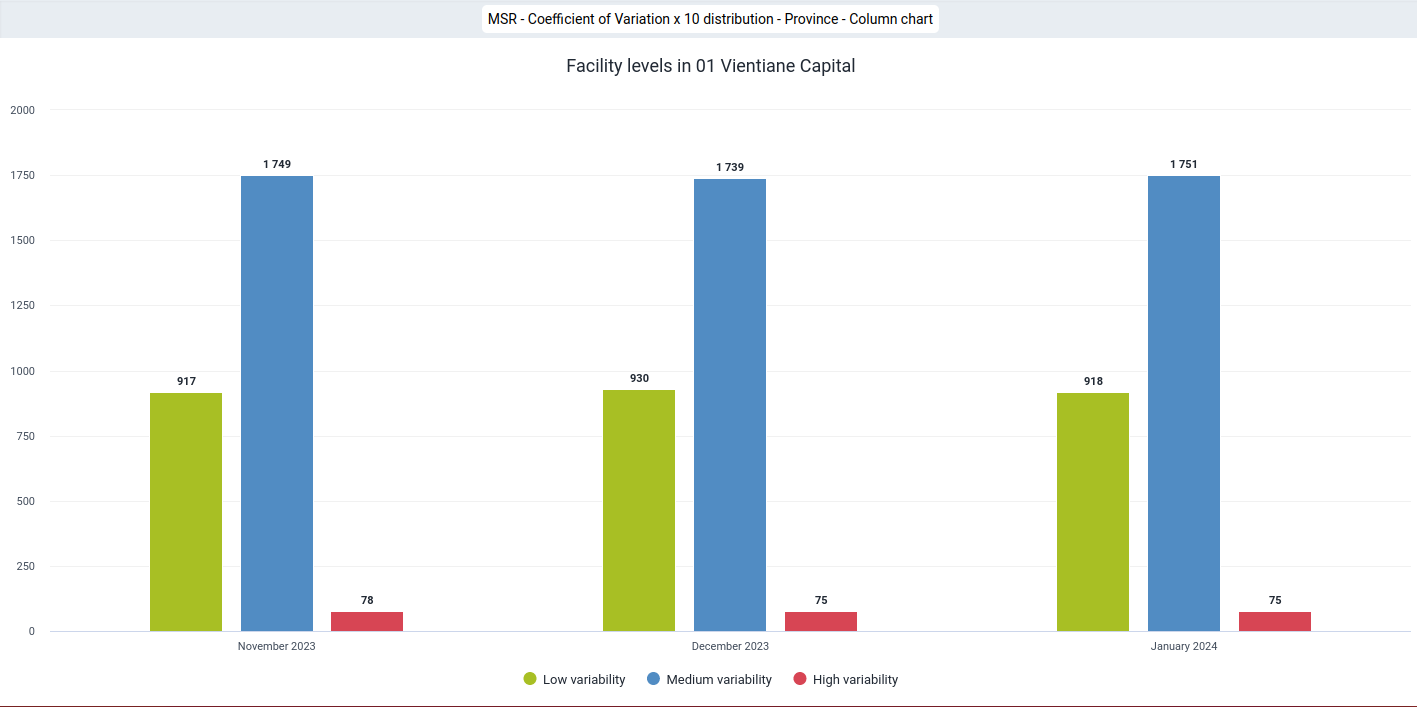
90 MSR - Stock availability - Province
Visualization type: select "Pivot table"
Name (*): "MSR - Stock availability - Province"
Description: "MSR DV 90 - Monthly Stock Reporting / Stock availability / Last 12 months / Province / By health facility / Pivot table This report provides the stock availability across all stock items for all health facilities in a province over the last 12 months with a colour legend."Columns
Period: "Relative periods"
Period type: "Months"
Selected Periods: "Last 12 months"Rows
Organisation unit: "User organisation unit"
Filter
Data
Data Type: "Indicators"
Selected items: select "Stock availability / %"Options
Legend
Use legend for chart colors: tag (appears as a white tick in a green field)
Legend type
Select a legend: tag (appears as a white tick in a green field)
Legend: "Stock availability / %"Show legend key tag (appears as a white tick in a green field)
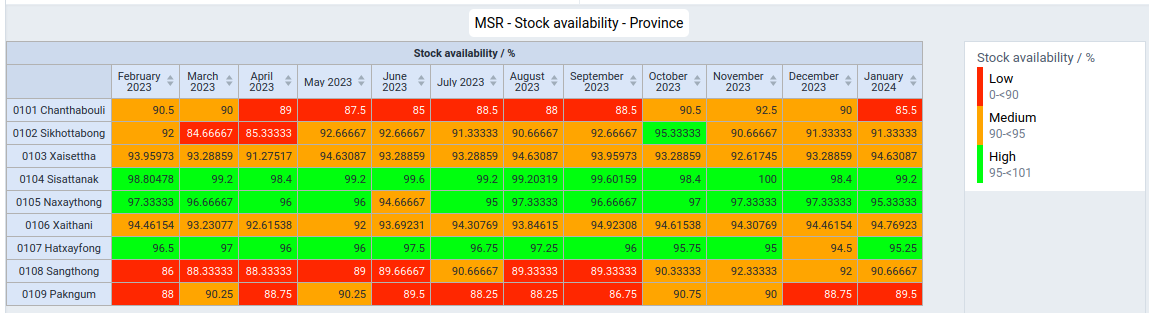
91 MSR - Stock availability - Province
Visualization type: select "Column"
Name (*): "MSR - Stock availability - Provincet"
Description: "MSR DV 91 - Monthly Stock Reporting / Stock availability / Last 12 months / Province / Across items / Column chart This report provides the stock availability across all stock items for all health facilities in a province for the last month with a colour legend."Series
Period: "Relative periods"
Period type: "Months"
Selected Periods: "Last month"Category
Organisation unit: "User organisation unit"
Level: "District"
Filter
Data
Data Type: "Indicators"
Selected items: select "Stock availability / %"Options
Legend
Use legend for chart colors: tag (appears as a white tick in a green field)
Legend type
Select a legend: tag (appears as a white tick in a green field)
Legend: "Stock availability / %"
Show legend key tag (appears as a white tick in a green field)
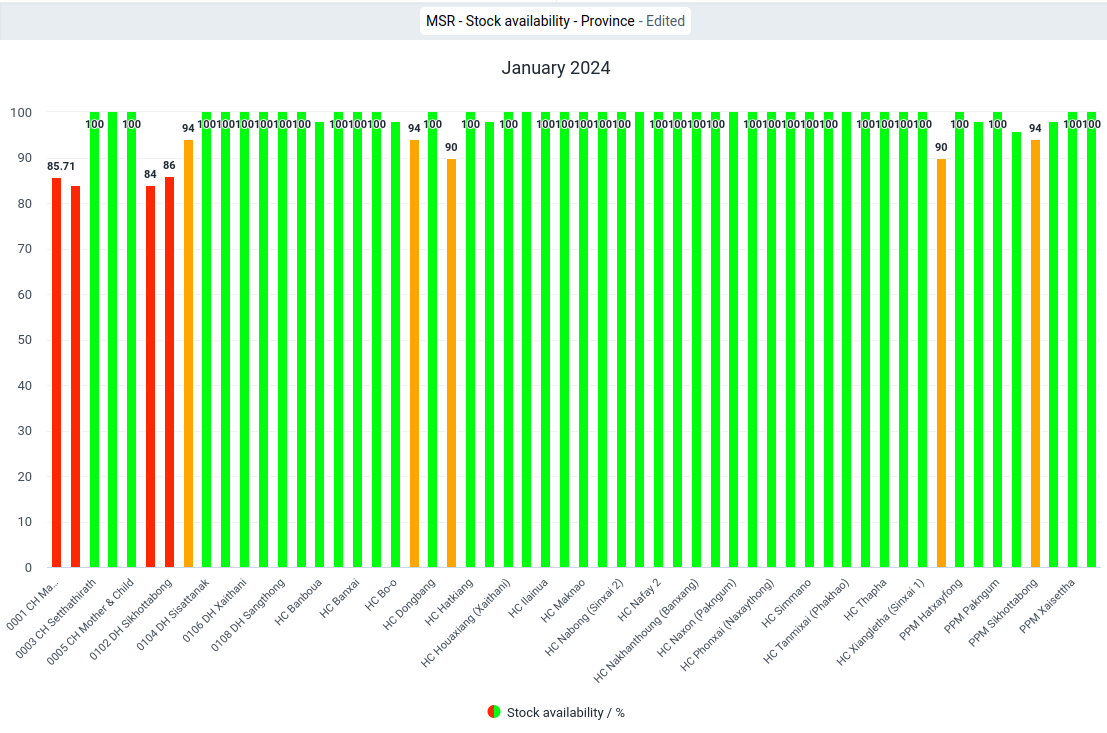
92 MSR - Stockout rate / % - Province
Visualization type: select "Column"
Name (*): "MSR DV 92 - Monthly Stock Reporting / Stockout rate / % / Last month / Province / Column chart This report displays a column chart with the percentage of items with a stockout for the last month across health facilities in a province."Series
Data Type: "Indicators"
Selected items: "Stockout rate / %"Category
Organisation unit: "User organisation unit"
Level: "District"
Filter
Period: "Relative periods"
Period type: "Months"
Selected Periods: "Last month"
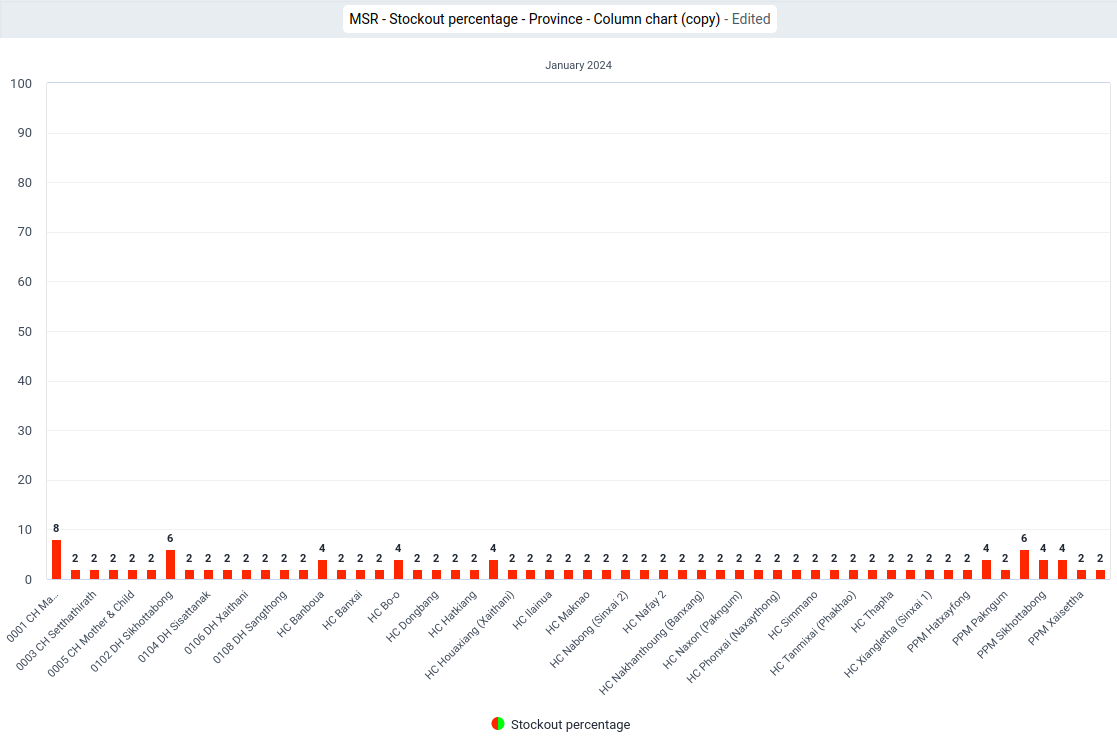
93 MSR - Stock availability and stockout rate - Province
Visualization type: select "Stacked column"
Name (*): "MSR - Stock availability and stockout rate - District - Stacked column chart"
Description: "MSR DV 93 - Monthly Stock Reporting / Stock availability and stockout rate / Last month / Province / Stacked column chart This report displays the stock availability (number of items with non-zero stock on hand divided by the total number of stock items) as percentage for the last month for all health facilities in a province as stacked column chart with a legend."Series
Data Type: "Indicators"
Indicator group: "Stockout count"
Selected items:
- "Stock availability / %"
- "Stockout rate / %"
Category
Period: "Relative periods"
Period type: "Months"
Selected Periods: "Last Month"
Organisation unit: "User organisation unit"
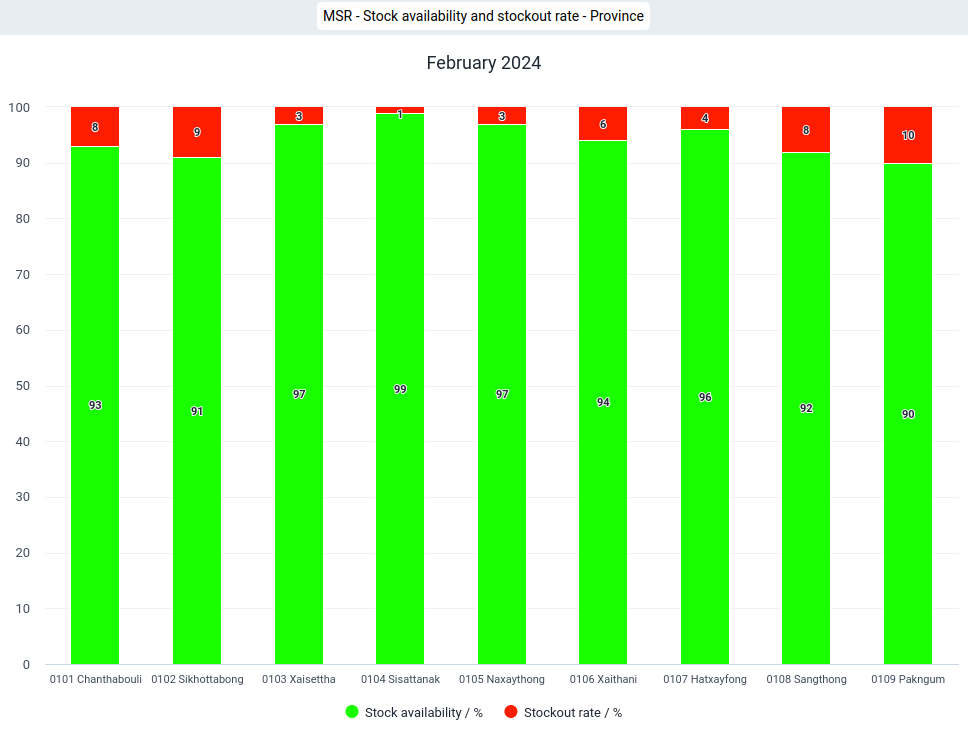
94 MSR - Stockouts - Province
Visualization type: select "Pivot table"
Name (*): "MSR - Stockouts - Province"
Description: "MSR DV 94 - Monthly Stock Reporting / Stockout by item / Last 12 months / Province / By item / Pivot table This report displays a Pivot table with all items and indicating for each item whether it was out of stock for all health facilities in a province for the last 12 months."Columns
Period: "Relative periods"
Period type: "Months"
Selected Periods: "Last 12 months"Rows
Data
Data Type: "Data elements"
Data element group: select "[Stock item list] - MSR
Disaggregation: "Totals only"
Selected items: select all (->>)Organisation unit: "User organisation unit"
Level: "Facility"
Filter: "Relative periods"
YOUR DIMENIONS
Name: "Monthly stock report"
Selected Items: "Stockout Yes/No"Options
Data
Totals
Column totals: tag (appears as a white tick in a green field)
Column sub-totals: tag (appears as a white tick in a green field)
Row totals: tag (appears as a white tick in a green field)Empty data
Hide empty rows: tag (appears as a white tick in a green field)
Legend
Use legend for chart colors: tag (appears as a white tick in a green field)
Legend style
Legend changes background color: tag (appears as a white tick in a green field)
Legend type
Select a legend: tag (appears as a white tick in a green field)
Legend: "Stockout count"
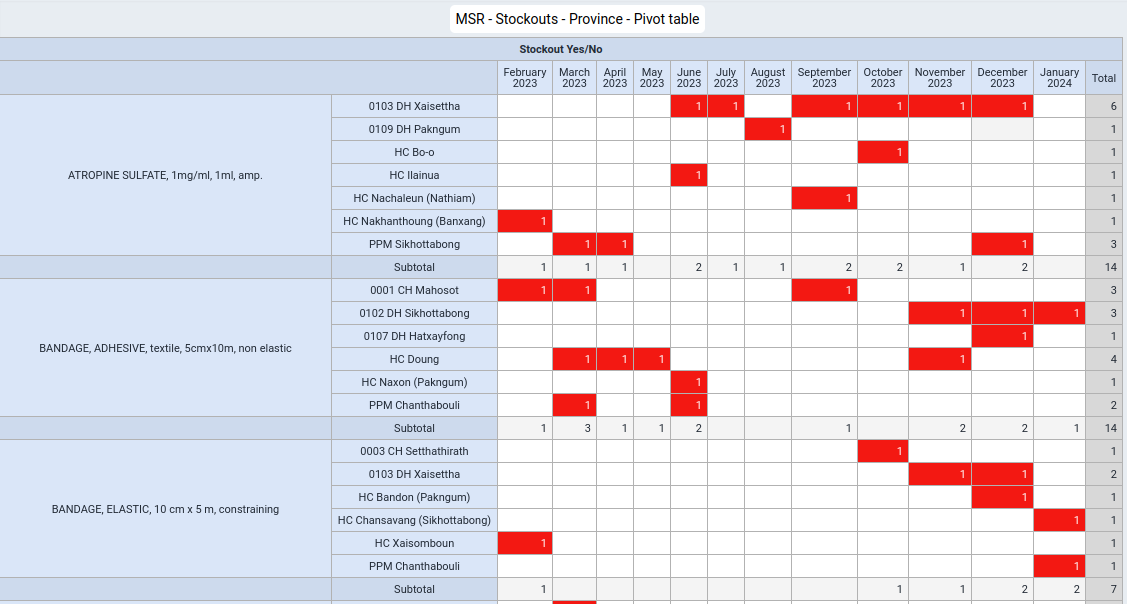
95 MSR - Stockout count - Province
Visualization type: select "Pivot table"
Name (*): "MSR - Stockout count - Province"
Description: "MSR DV 95 - Monthly Stock Reporting / Stockout count / Last 12 months / Province / Pivot table This report displays the number of stockouts for all items across a health facility for each of the past 12 months for all health facilities in a district as a Pivot table."Columns
Period: "Relative periods"
Period type: "Months"
Selected Periods: "Last 12 months"Rows
Organisation unit: "User organisation unit"
Level: "District"
Filter
Data
Data Type: "Data elements"
Data element group: select "[Stock item list] - MSR
Disaggregation: "Totals only"
Selected items: select all (->>)YOUR DIMENIONS
Name: "Monthly stock report"
Selected Items: "Stockout Yes/No"Options
Legend
Use legend for chart colors: tag (appears as a white tick in a green field)
Legend style
Legend changes background color: tag (appears as a white tick in a green field)
Legend type
Select a legend: tag (appears as a white tick in a green field)
Legend: "Stockout count"

96 MSR - Stockout count - Province
Visualization type: select "Stacked column"
Name (*): "MSR - Stockout count - Province"
Description: "MSR DV 96 - Monthly Stock Reporting / Stockout count / Last 12 months / Province / Stacked column chart This report displays the number of stockouts for each of the past 12 months for each facility in a province as a Stacked column chart."Series
Organisation unit: "User organisation unit"
Level: "District"
Category
Period: "Relative periods"
Period type: "Months"
Selected Periods: "Last 12 months"Filter
YOUR DIMENIONSName: "Monthly stock report"
Selected Items: "Stockout Yes/No"Data
Data Type: "Data elements"
Data element group: select "[Stock item list] - MSR
Disaggregation: "Totals only"
Selected items: select all (->>)

97 MSR - Stockout count - Province
Visualization type: select "Single value"
Name (*): "MSR - Stockout count - Province"
Description: "MSR DV 97 - Monthly Stock Reporting / Stockout count / Last month / Province / Single value chart This report displays the number of stockouts for all items across districts in a province for the last month as a Single value chart."Series
Period: "Relative periods"
Period type: "Months"
Selected Periods: "Last month"Category
YOUR DIMENIONS
Name: "Monthly stock report"
Selected Items: "Stockout Yes/No"Filter
Organisation unit: "User organisation unit"
DataData Type: "Data elements"
Data element group: select "[Stock item list] - MSR
Disaggregation: "Totals only"
Selected items: select all (->>)Options
Legend
Use legend for chart colors: tag (appears as a white tick in a green field)
Legend style
Legend changes background color: tag (appears as a white tick in a green field)
Legend type
Select a legend: tag (appears as a white tick in a green field)
Legend: "Stockout count"
98 MSR - Stockout duration - Province
Visualization type: select "Pivot table"
Name (*): "MSR - Stockout duration - Province"
Descriptions: "MSR DV 98 - Monthly Stock Reporting / Stockout duration / Last 12 months / Province / Pivot table This report displays a Pivot table with a count of the number of months (during the past 12 months) during which and item was out of stock at each of the health facilities in a province."Columns
YOUR DIMENIONS
Name: "Monthly stock report"
Selected Items: "Stockout Yes/No"Organisation unit: "User organisation unit"
Level: "District"
Rows
Data
Data Type: "Data elements"
Data element group: select "[Stock item list] - MSR
Disaggregation: "Totals only"
Selected items: select all (->>)Filter
Period: "Relative periods"
Period type: "Months"
Selected Periods: "Last 12 month"Options
Data
Totals
Column totals: tag (appears as a white tick in a green field)
Column sub-totals: tag (appears as a white tick in a green field)
Row totals: tag (appears as a white tick in a green field)Empty data
Hide empty columns: tag (appears as a white tick in a green field)
Hide empty rows: tag (appears as a white tick in a green field)Legend
Use legend for chart colors: tag (appears as a white tick in a green field)
Legend style
Legend changes background color: tag (appears as a white tick in a green field)
Legend type
Select a legend: tag (appears as a white tick in a green field)
Legend: "Stockout count"
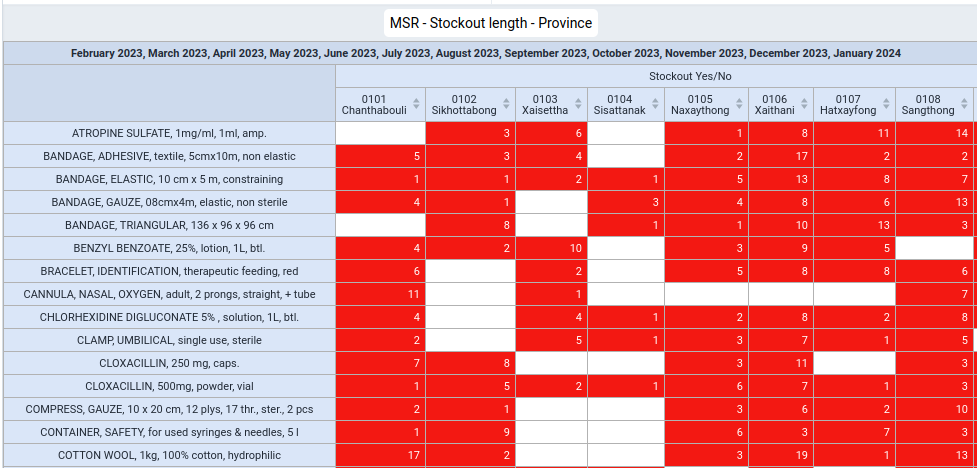
99 MSR - Stockout duration - Province
Visualization type: select "Stacked bar chart table"
Name (*): "MSR - Stockout duration - Province"
Description: "MSR DV 99 - Monthly Stock Reporting / Stockout duration / Last 12 months / Province / Stacked bar chart This report displays a stacked bar chart with the number of stockouts for each item by health facilities in the province during the past 12 months."Series
Organisation unit: "User organisation unit"
Level: "District"
Category
Data
Data Type: "Data elements"
Data element group: select "[Stock item list] - MSR
Disaggregation: "Totals only"
Selected items: select all (->>)Filter
Period: "Relative periods"
Period type: "Months"
Selected Periods: "Last 12 month"YOUR DIMENIONS
Name: "Monthly stock report"
Selected Items: "Stockout Yes/No"
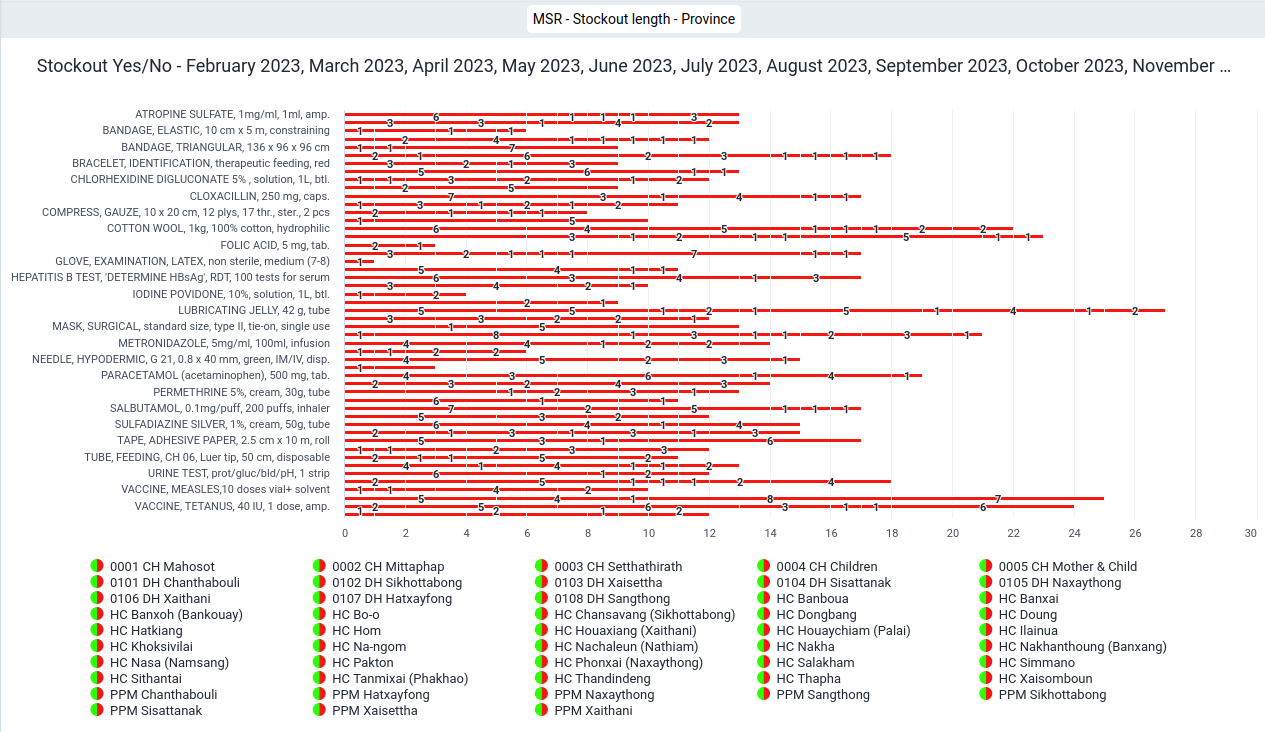
100 MSR - Stock coverage time - Province
Visualization type: select "Pivot table"
Name (*): "MSR - Stock coverage time - Province"
Description: "MSR DV 100 - Monthly Stock Reporting / Stock coverage time / absolute / Last month / Province / Pivot table This report displays a Pivot table by item with the coverage time (stock on hand divided by stock distributed during the last month) for the last month for each health facility in a province. A blank field is shown, if either the stock on hand or the stock distribution for a month is zero."Columns
Period: "Relative periods"
Period type: "Months"
Selected Periods: "Last month"Rows
Data
Data Type: "Data elements"
Data element group: select "[Stock item list] - MSR
Disaggregation: "Totals only"
Selected items: select all (->>)
Organisation unit: "User organisation unit"
Level: "Facility"Filter
YOUR DIMENIONS
Name: "Monthly stock report"
Selected Items: "Stockout coverage"
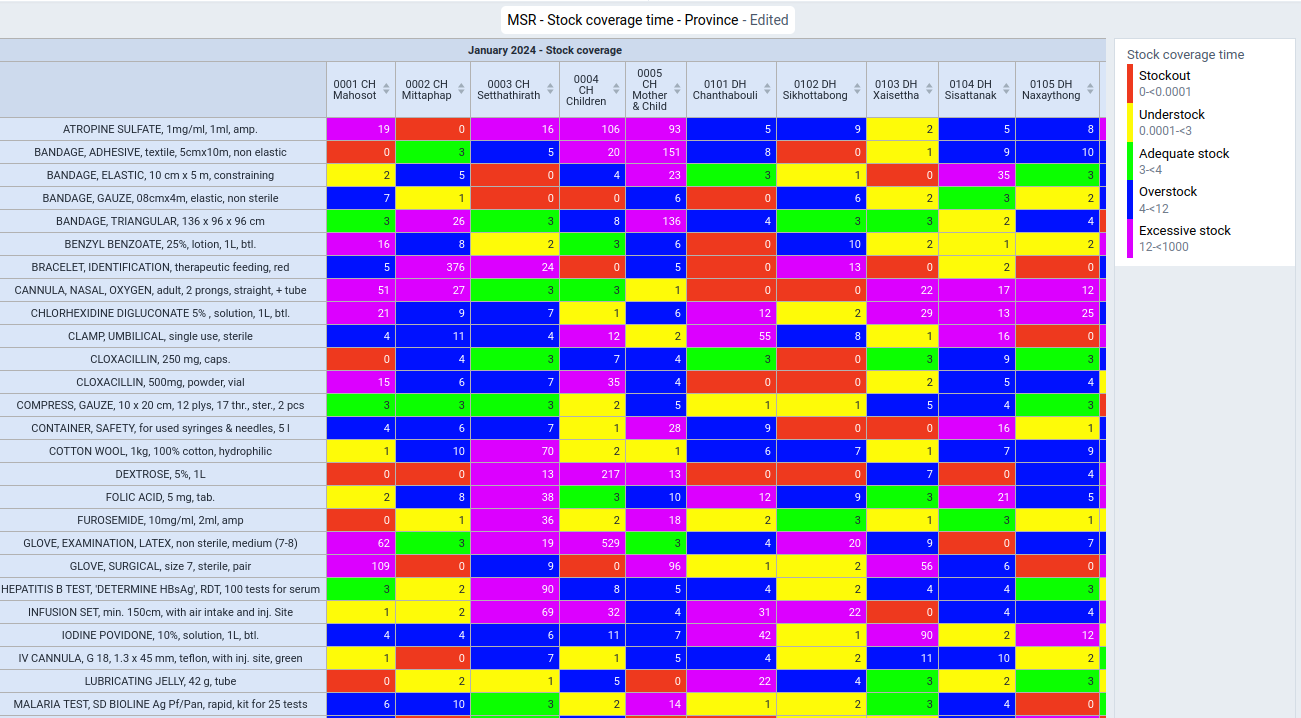
101 MSR - Stock coverage time distribution - Province
Visualization type: select "Pivot table"
Name (*): "MSR - Stock coverage time distribution - Province"
Description: "MSR DV 101 - Monthly Stock Reporting / Stock coverage time / distribution / Last month / District / Column chart This report displays a Pivot table with the number of items for which the coverage time fell into the respective coverage time bins (stockout, 1 to 12 months, 1-2 and 2-3 years or greater than or equal to 3 years) for all health facilities in a district for the last months."Columns
Data
Data Type: "Indicators"
Indicator group: select "Stock coverage time"
Selected items: select the following indicators in the following order:
- "Stockout count"
- "0-1 months"
- "1-2 months"
- "2-3 months"
- "3-4 months"
- "4-5 months"
- "5-6 months"
- "6-7 months"
- "7-8 months"
- "8-9 months"
- "9-10 months"
- "10-11 months"
- "11-12 months"
- "1-2 years"
- "2-3 years"
- ">=3 years"Rows
Period: "Relative periods"
Period type: "Months"
Selected Periods: "Last 12 months"
Organisation unit: "User organisation unit"
Level: "District"Options
Data
Totals
Columns totals: tag (appears as a white tick in a green field)
Columns sub-totals: tag (appears as a white tick in a green field)
Row totals: tag (appears as a white tick in a green field)
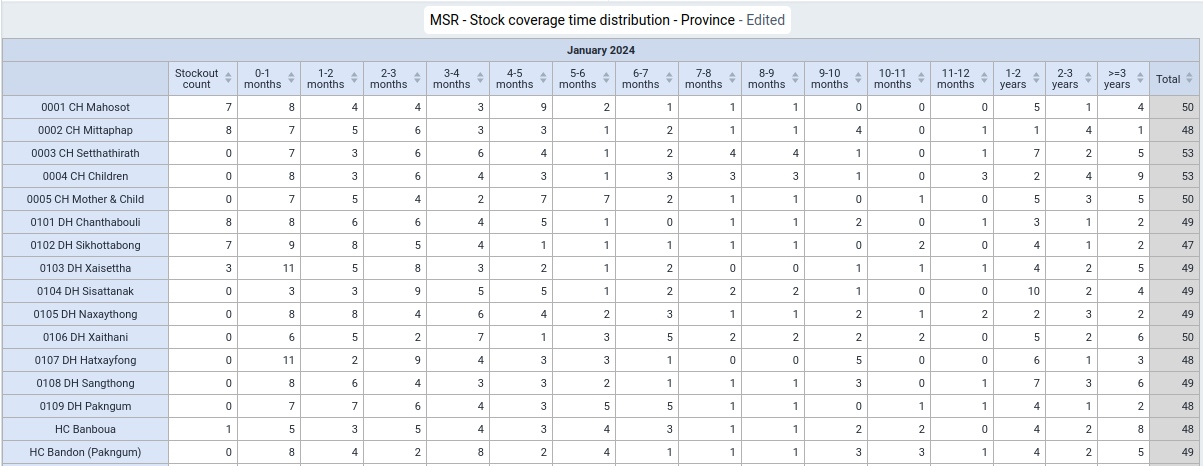
102 MSR - Stock coverage time categories - Province
Visualization type: select "Column"
Name (*): "MSR - Stock coverage time categories - Province"
Description: "MSR DV 102 - Monthly Stock Reporting / Stock coverage time / Categories / Province / Column chart / Last month For the last month, this report displays a stacked column chart with the number of items for each stock coverage category (stockout, understock, appropriate stock, overstock and excessive stock) for each health facility in the district."Series
Organisation unit: "User organisation unit"
Level: "District"
Category
Data
Data Type: "Indicators"
Indicator group: select "Stock coverage time"
Selected items: select the following indicators in the following order:
- "Stockout count"
- "Understock (0-3 months)"
- "Appropriate stock (3-6 months)"
- "Overstock (6-12 months)"
- "Excessive stock (> 12 months)"Filter
Period: "Relative periods"
Period type: "Months"
Selected Periods: "Last month"
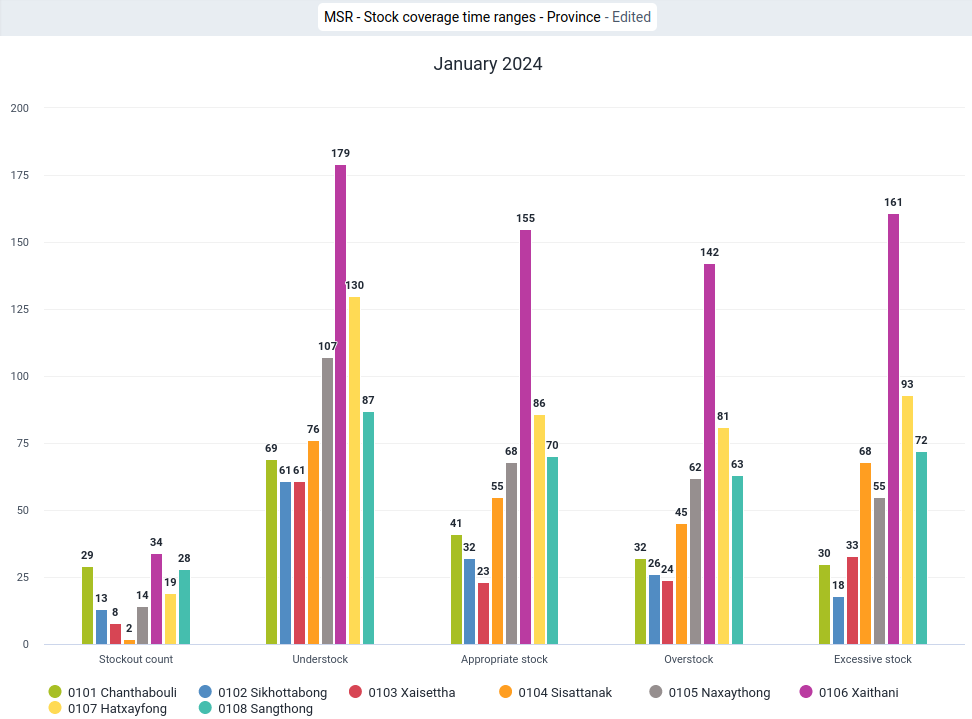
103 MSR - Stock coverage time categories - Province
Visualization type: select "Stacked column"
Name (*): "MSR - Stock coverage time categories - Province"
Description: "MSR DV 103 - Monthly Stock Reporting / Stock coverage time / Categories / Province / Stacked column chart / Last month For the last month, this report displays a stacked column chart with the number of items for each stock coverage category (stockout, understock, appropriate stock, overstock and excessive stock) for each health facility in the province."Series
Organisation unit: "User organisation unit"
Level: "District"
Category
Period: "Relative periods"
Period type: "Months"
Selected Periods: "Last month"Data
Data Type: "Indicators"
Indicator group: select "Stock coverage time"
Selected items: select the following indicators in the following order:
- "Stockout count"
- "Understock (0-3 months)"
- "Appropriate stock (3-6 months)"
- "Overstock (6-12 months)"
- "Excessive stock (> 12 months)"
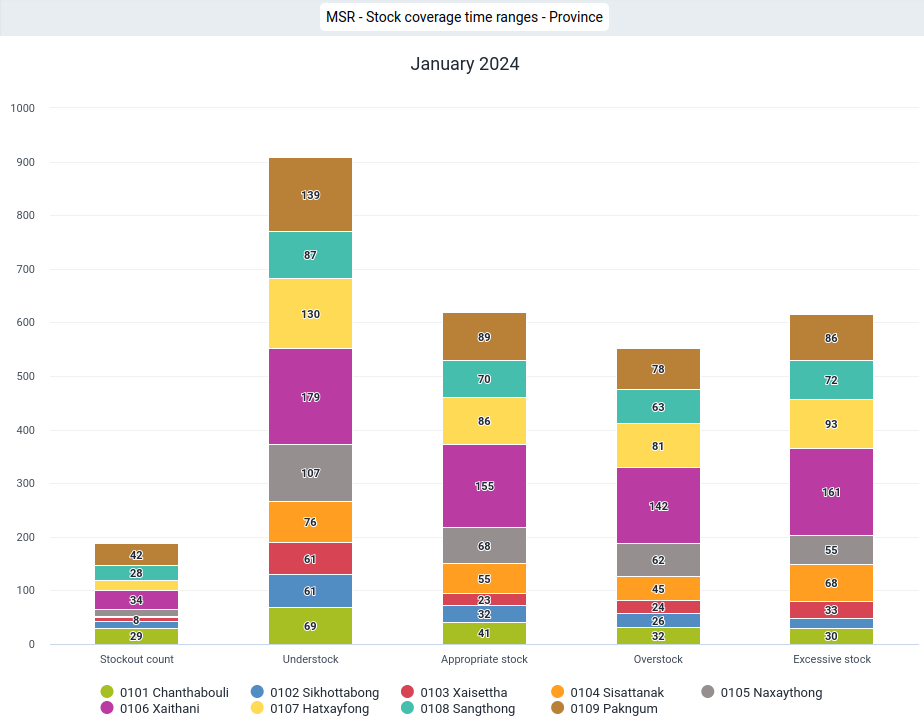
104 MSR - Stock discrepancy - Province
Visualization type: select "Pivot table"
Name (*): "MSR - Stock discrepancy - Province"
Description: "MSR DV 104 - Monthly Stock Reporting / Stock discrepancy / list / Last month / Province / Pivot table This report displays a list with the positive and negative stock discrepancy of the last month by item for all health facilities in a district.
+ Stock on hand from the previous month (final stock on hand)
+ Stock receipt
- Stock distributed
- Stock redistributed
- Stock discard
- Stock correction
- Stock on hand."Columns
Organisation unit: "User organisation unit"
Level: "Facility"
Rows
Data
Data Type: "Data elements"
Data element group: select "[Stock item list] - MSR
Disaggregation: "Totals only"
Selected items: select all (->>)Filter
Period: "Relative periods"
Period type: "Months"
Selected Periods: "Last month"YOUR DIMENIONS
Name: "Monthly stock report"
Selected Items: "Stock discrepancy count"Options
Data
Totals
Row totals: tag (appears as a white tick in a green field)
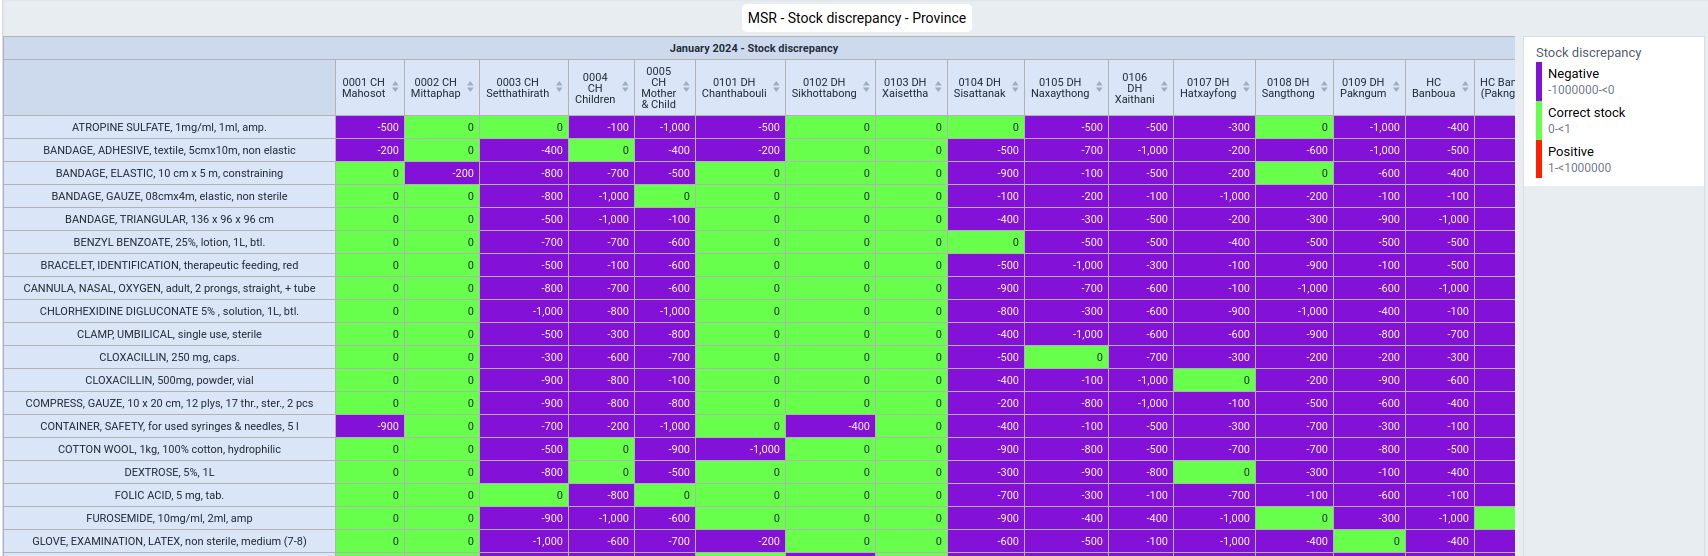
105 MSR - Stock discrepancy count - Province
Visualization type: select "Stacked column"
Name (*): "MSR - Stock discrepancy count - Province"
Visualization type: "MSR DV 105 - Monthly Stock Reporting / Stock discrepancy / count / Last 12 months / District / Stacked column chart This report displays the number of stock discrepancies for the past 12 months separately for each health facility in a district."Series
Organisation unit: "User organisation unit"
Level: "District"Category
Period: "Relative periods"
Period type: "Months"
Selected Periods: "Last 12 months"YOUR DIMENIONS
Name: "Monthly stock report"
Selected Items: "Stock discrepancy count"Filter
Data
Data Type: "Data elements"
Data element group: select "[Stock item list] - MSR
Disaggregation: "Totals only"
Selected items: select all (->>)

106 MSR - Stock discrepancy count - Province
Visualization type: select "Single value"
Name (*): "MSR - Stock discrepancy count - Province"
Visualization type: "MSR DV 106 - Monthly Stock Reporting / Stock discrepancy / count / Last month / Province / Single value chart This report displays the number of stock discrepancies across the province for the last month as a single value chart."Series
Data
Data Type: "Indicators"
Indicator group: select "Stockout discrepancy"
Selected items: "Stock discrepancy count"Filter
Organisation unit: "User organisation unit"
Period: "Relative periods"Period type: "Months"
Selected Periods: "Last month"
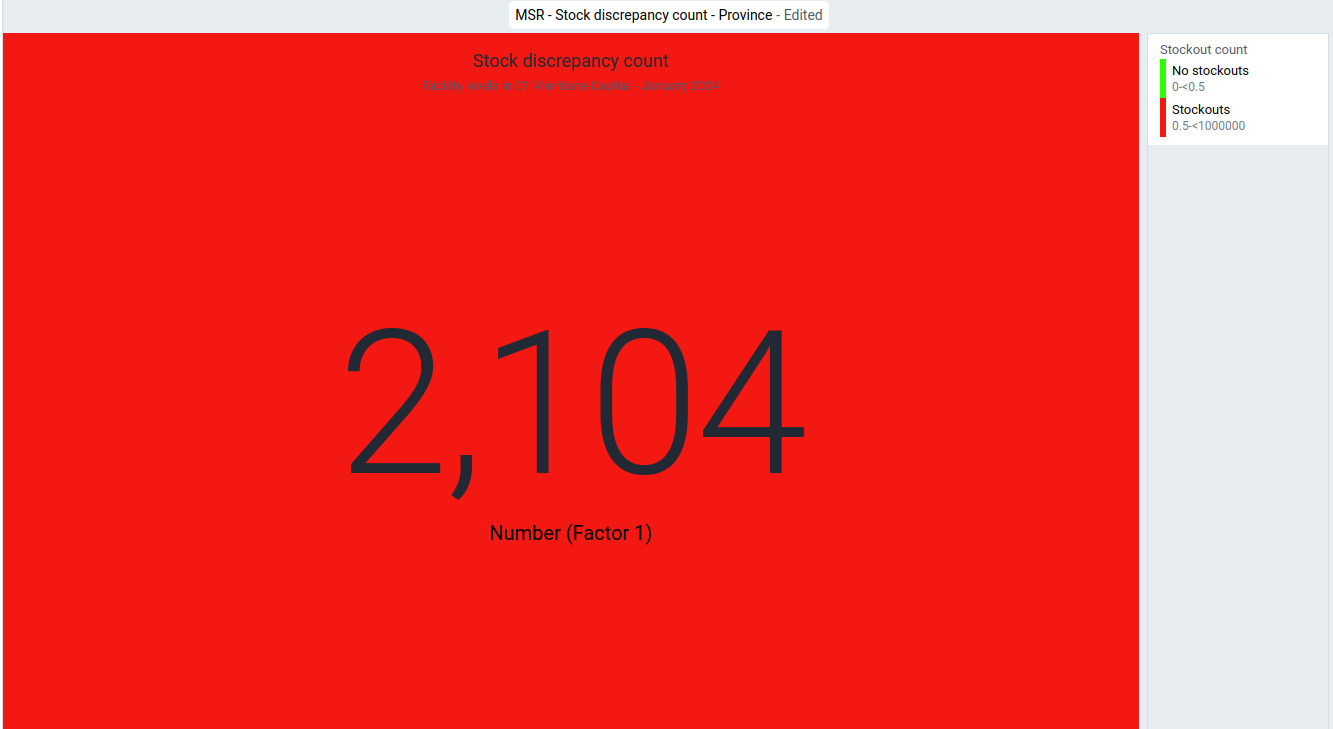
107 MSR - Report completeness - Province
Visualization type: select "Pivot"
Name (*): "MSR - Report completeness - Province"
Visualization type: "MSR DV 107 - Monthly Stock Reporting / Stock reporting complete / Last month / Province / Pivot table." This report provides the "Reporting rate", "Reporting rate on time", "Actual reports", "Actual reports on time" as well as the "Expected reports" for the last month for all health facilities in the province as a Pivot table."Columns
Period: "Relative periods"
Period type: "Months"
Selected Periods: "Last 12 month"Rows
Data
Data Type: "Data sets"
Data set: select "Monthly stock report"
Metric type:
- "Monthly stock report - Reporting rate"
- "Monthly stock report - Reporting rate on time"
- "Monthly stock report - Actual reports"
- "Monthly stock report - Actual reports on time"
- "Monthly stock report - Expected reports"
Organisation unit: "User organisation unit"
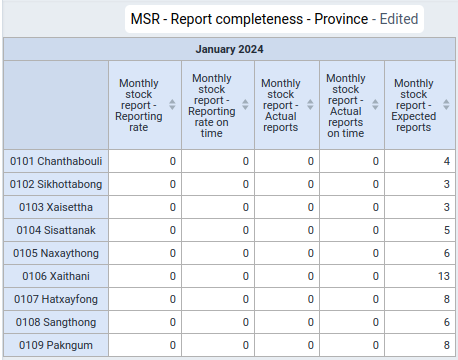
108 MSR - Reporting rate - Province
Visualization type: select "Single value"
Name (*): "MSR - Reporting rate - Province"
Visualization type: "MSR DV 108 - Monthly Stock Reporting / Reporting rate / Last month / Province / Single value chart This report provides the "Reporting rate" for the last month across all the health facilities in a province as single value chart."Series
Data
Data Type: "Indicators"
Data set: select "Monthly stock report"
Metric type: "Reporting rate" Selected Items: "Monthly stock report - Reporting rate"Filter
Organisation unit: "User organisation unit"
Period: "Relative periods"Period type: "Months"
Selected Periods: "Last month"Options*
LegendUse legend for chart colors: tag (appears as a white tick in a green field)
Legend type
Select a legend: tag (appears as a white tick in a green field)
Legend: "Stock availability / %"
Show legend key tag (appears as a white tick in a green field)
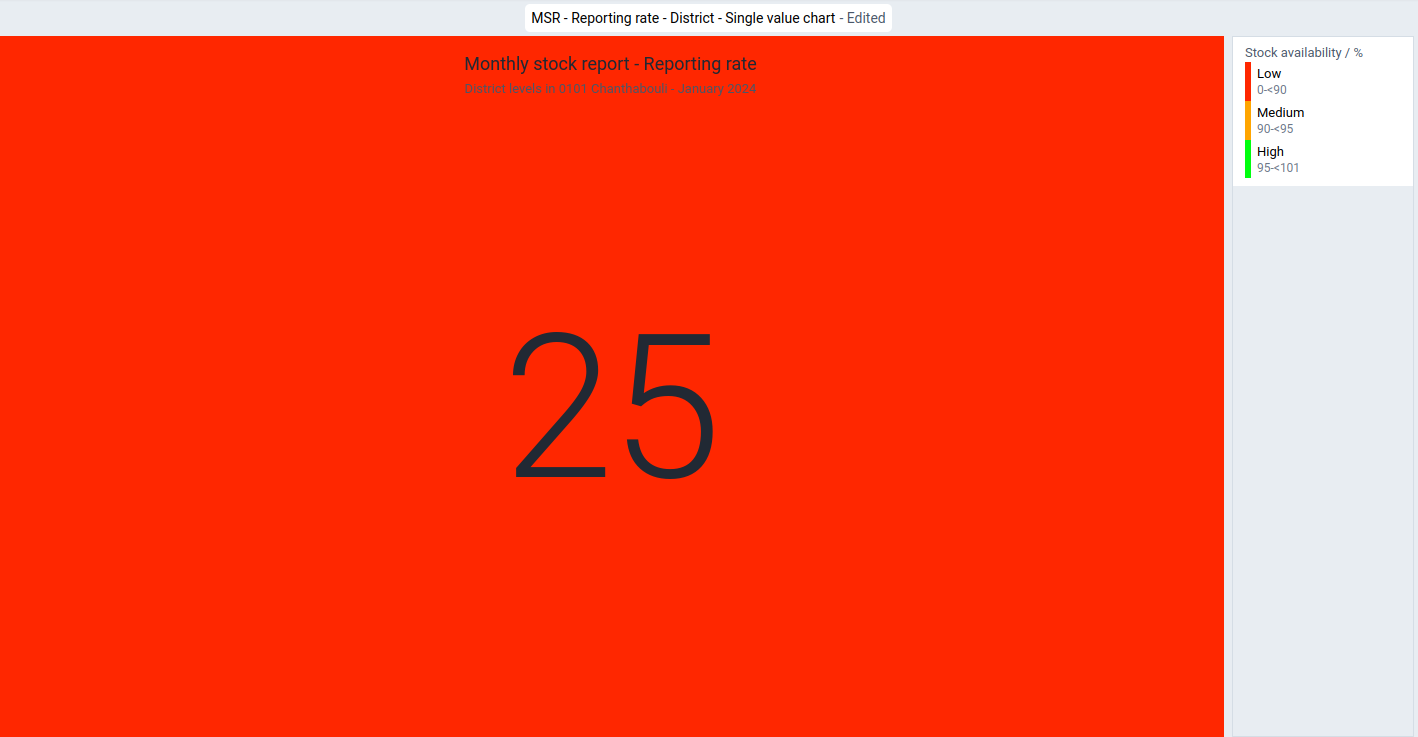
109 MSR - Reporting rate on time - Province
Visualization type: select "Single value"
Name (*): "MSR - Reporting rate on time - Province"
Visualization type: "MSR DV 109 - Monthly Stock Reporting / Reporting rate on time / Last month / Province / Single value chart This report provides the "Reporting rate on time" for the last month across all health facilities in a province as single value chart."Series
Data
Data Type: "Indicators"
Data set: select "Monthly stock report"
Metric type: "Reporting rate"
Selected Items: "Monthly stock report - Reporting rate on time"Filter
Organisation unit: "User organisation unit"
Period: "Relative periods"Period type: "Months"
Selected Periods: "Last 12 months"Options*
LegendUse legend for chart colors: tag (appears as a white tick in a green field)
Legend type
Select a legend: tag (appears as a white tick in a green field)
Legend: "Stock availability / %"
Show legend key tag (appears as a white tick in a green field)
Country level
Statistics
110 MSR - Stock receipt - Country
Visualization type: select "Pivot table"
Name (*): "MSR - Stock receipt - Country"
Description: "MSR DV 110 - Monthly Stock Reporting / Stock receipt / Last 12 months / District / By item / Pivot table This report provides the monthly stock receipts by provinces in a country as reported at the end of every month."Columns
Period: "Relative periods"
Period type: "Months"
Selected Periods: "Last 12 months"Rows
Data
Data Type: "Data elements"
Data element group: select "[Stock item list] - MSR
Disaggregation: "Totals only"
Selected items: select all (->>)
Organisation unit: "User organisation unit"
Level: "Province"Filter: "Relative periods"
YOUR DIMENIONS
Name: "Monthly stock report"
Selected Items: "Stock receipt"Options
Data
Totals
Column sub-totals: tag (appears as a white tick in a green field)
Row totals: tag (appears as a white tick in a green field)
111 MSR - Stock distribution - Country
Visualization type: select "Pivot table"
Name (*): "MSR - Stock distribution - Country"
Description: "MSR DV 111 - Monthly Stock Reporting / Stock distribution / Last 12 months / Province / By item / Pivot table
This report provides the monthly stock distributions by district in a province as reported at the end of every month."Columns
Period: "Relative periods"
Period type: "Months"
Selected Periods: "Last 12 months"Rows
Data
Data Type: "Data elements"
Data element group: select "[Stock item list] - MSR
Disaggregation: "Totals only"
Selected items: select all (->>)Filter: "Relative periods"
Organisation unit: "User organisation unit"
Level: "Province"
Level: "Country"
YOUR DIMENIONSName: "Monthly stock report"
Selected Items: "Stock distribution"Options
Data
Totals
Column sub-totals: tag (appears as a white tick in a green field)
Row totals: tag (appears as a white tick in a green field)
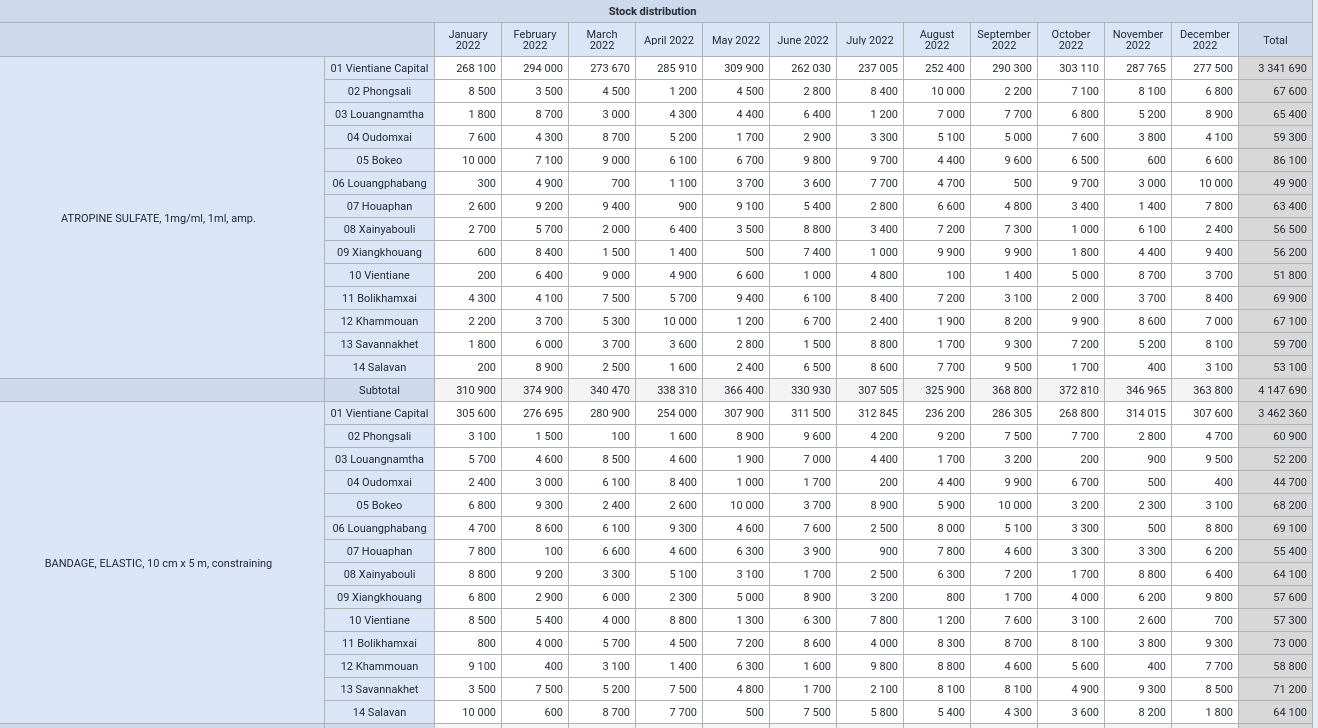
112 MSR - Stock redistribution - Country
Visualization type: select "Pivot table"
Name (*): "MSR - Stock redistribution - Country"
Description: "MSR DV 112 - Monthly Stock Reporting / Stock redistribution / Last 12 months / Country / By item / Pivot table.
This report provides the monthly stock redistributions by provinces in a country as reported at the end of every month."Columns
Period: "Relative periods"
Period type: "Months"
Selected Periods: "Last 12 months"Rows
Data
Data Type: "Data elements"
Data element group: select "[Stock item list] - MSR
Disaggregation: "Totals only"
Selected items: select all (->>)
Organisation unit: "User organisation unit"
Level: "Province"Filter: "Relative periods"
YOUR DIMENIONS
Name: "Monthly stock report"
Selected Items: "Stock redistribution"Options
Data
Totals
Column sub-totals: tag (appears as a white tick in a green field)
Row totals: tag (appears as a white tick in a green field)
113 MSR - Stock discard - Country
Visualization type: select "Pivot table"
Name (*): "MSR - Stock discard - Province"
Description: "MSR DV 113 - Monthly Stock Reporting / Stock discard / Last 12 months / Country / By item / Pivot table
This report provides the monthly stock discards by provinces in a country as reported at the end of every month."Columns
Period: "Relative periods"
Period type: "Months"
Selected Periods: "Last 12 months"Rows
Data
Data Type: "Data elements"
Data element group: select "[Stock item list] - MSR
Disaggregation: "Totals only"
Selected items: select all (->>)
Organisation unit: "User organisation unit"
Level: "Province"
Level: "Province"Filter: "Relative periods"
YOUR DIMENIONSName: "Monthly stock report"
Selected Items: "Stock discard"Options
Data
Totals
Column sub-totals: tag (appears as a white tick in a green field)
Row totals: tag (appears as a white tick in a green field)
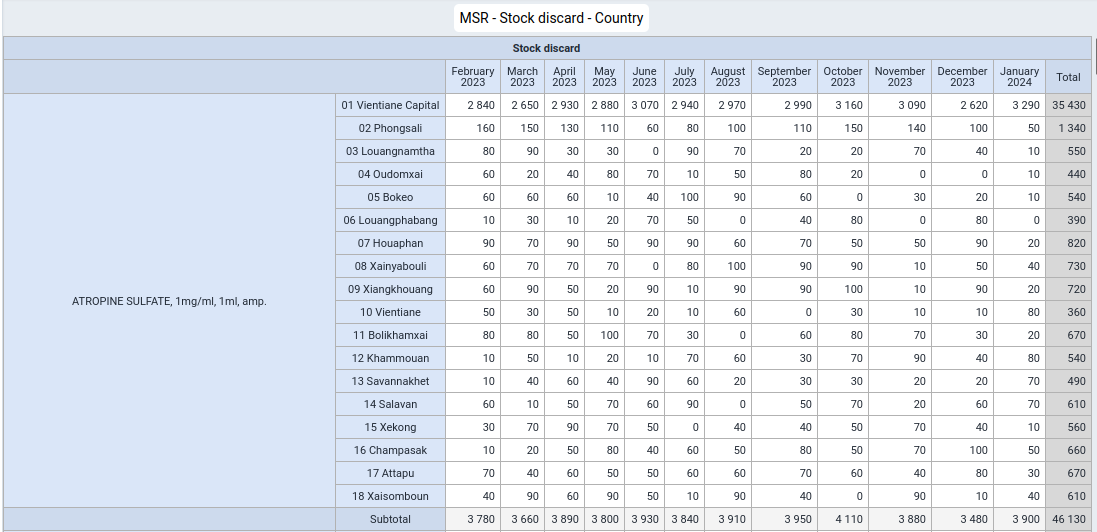
114 MSR - Stock on hand - Country
Visualization type: select "Pivot table"
Name (*): "MSR - Stock on hand - Province - Pivot table"
Description: "MSR DV 83 - Monthly Stock Reporting / Stock on hand / Last 12 months / Province / By item / Pivot table
This report provides the monthly stock on hand by district in a province as reported at the end of every month."Columns
Period: "Relative periods"
Period type: "Months"
Selected Periods: "Last 12 months"Rows
Data
Data Type: "Data elements"
Data element group: select "[Stock item list] - MSR
Disaggregation: "Totals only"
Selected items: select all (->>)
Organisation unit: "User organisation unit"
Level: "Province"Filter: "Relative periods"
Selected Periods: "Last 12 months"
YOUR DIMENIONS
Name: "Monthly stock report"
Selected Items: "Stock on hand"Options
Data
Totals
Column sub-totals: tag (appears as a white tick in a green field)
Row totals: tag (appears as a white tick in a green field)
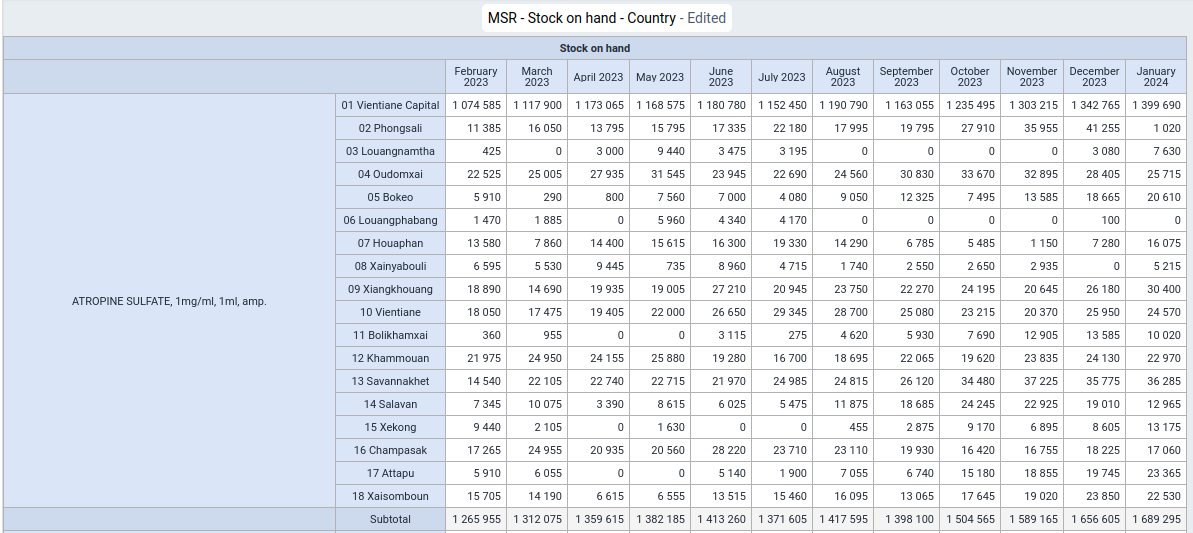
115 MSR - Stock correction - Country
Visualization type: select "Pivot table"
Name (*): "MSR - Stock correction - Country"
Description: "MSR DV 115 - Monthly Stock Reporting / Stock correction / Last 12 months / Country / By item / Pivot table This report provides the monthly stock corrections by provinces in a country as reported at the end of every month."Columns
Period: "Relative periods"
Period type: "Months"
Selected Periods: "Last 12 months"Rows
Data
Data Type: "Data elements"
Data element group: select "[Stock item list] - MSR
Disaggregation: "Totals only"
Selected items: select all (->>)
Organisation unit: "User organisation unit"
Level: "Province"Filter
YOUR DIMENIONS
Name: "Monthly stock report"
Selected Items: "Stock correction"Options
Data
Totals
Column sub-totals: tag (appears as a white tick in a green field)
Row totals: tag (appears as a white tick in a green
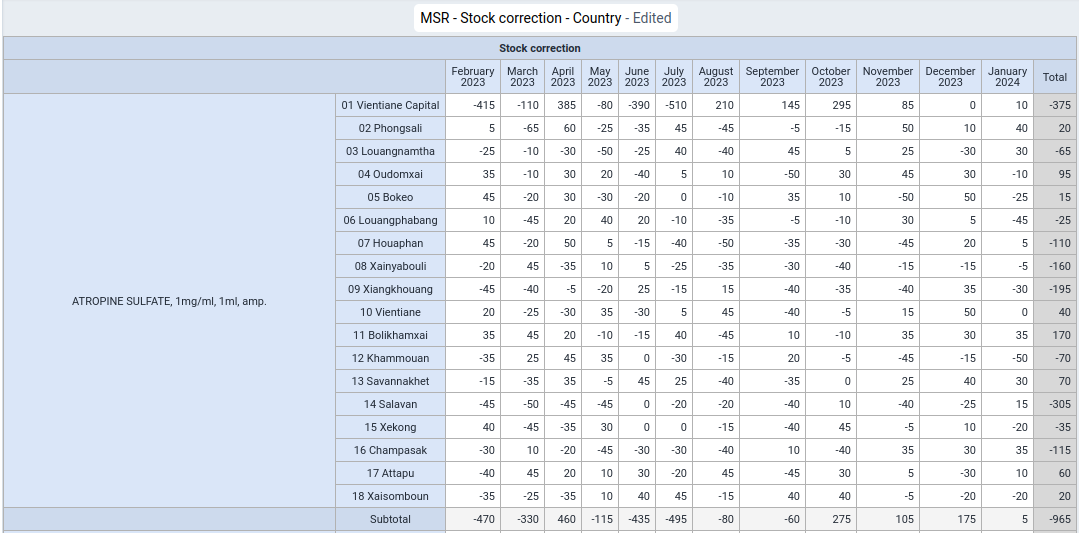
116 MSR - Stock report complete - Country
Visualization type: select "Pivot table"
Name (*): "MSR - Stock report complete - Country - Last 3 months"
Description: "MSR DV 85 - Monthly Stock Reporting / Stock report complete / Last 3 months / Province / By item / Pivot table This report provides an overview of all stock data by provinces in a country from the last 3 months."Columns
Period: "Relative periods"
Period type: "Months"
Selected Periods: "Last month"
YOUR DIMENIONS
Name: "Monthly stock report"
Selected Items: "Stock distribution"Rows
Data
Data Type: "Data elements"
Data element group: select "[Stock item list] - MSR
Disaggregation: "Totals only"
Selected items: select all (->>)
Organisation unit: "User organisation unit"
Level: "Province"Options
Data
Totals
Column sub-totals: tag (appears as a white tick in a green field)
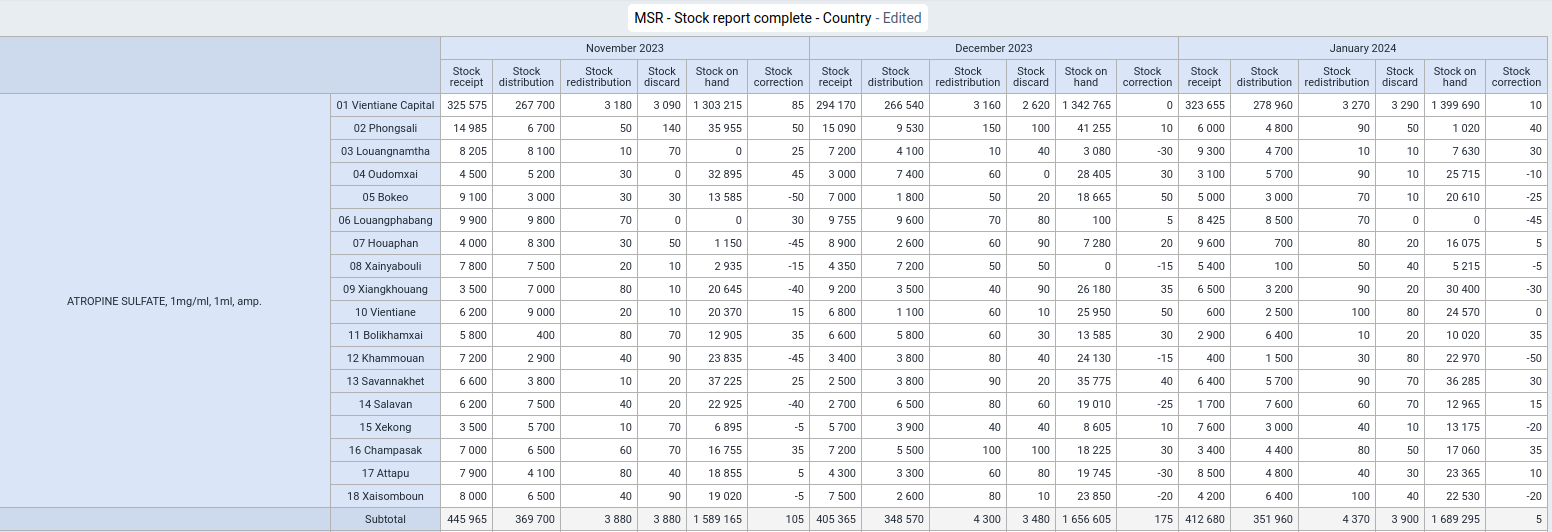
Indicators
117 MSR - Coefficient of Variation x 10 distribution - Country
Visualization type: select "Pivot table"
Name (*): "MSR - Coefficient of Variation x 10 distribution - Country"
Description: "MSR DV 117 - Monthly Stock Reporting / Coefficient of Variation x 10 distribution / Last 12 months / Country / Across items / Pivot table This report provides the coefficient of variation (standard deviation of stock distribution divided by average stock distribution) distribution by provinces in the country over the last 12 months with a colour legend."Columns
Period: "Relative periods"
Period type: "Months"
Selected Periods: "Last months"Data
Data Type: "Indicators"
Indicator group: "Coefficient of variation"
Selected items: select the following items in the following order:
- Low variability
- Medium variability
- High variabilityRows
Organisation unit: "User organisation unit"
Level: "Province"Options
Data
Totals
Row totals: tag (appears as a white tick in a green field)

118 MSR - Coefficient of Variation x 10 distribution - Country
Visualization type: select "Stacked column"
Name (*): "MSR - Coefficient of Variation x 10 distribution - Country"
Description: "MSR DV 118 - Monthly Stock Reporting / Coefficient of Variation x 10 distribution / Last 12 months / Country / Across items / Stacked column chart This report provides the number of items which fall into the respective coefficient of variation (standard deviation of stock distribution divided by average stock distribution) ranges (low, medium and high) across all items at a health facility for all provinces in a country for the last month."Series
Data
Data Type: "Indicators"
Indicator group: "Coefficient of variation"
Selected items: select the following items in the following order:
- Low variability
- Medium variability
- High variabilityCategory
Period: "Relative periods"
Period type: "Months"
Selected Periods: "Last 12 months"
Organisation unit: "User organisation unit"
Level: "Province"
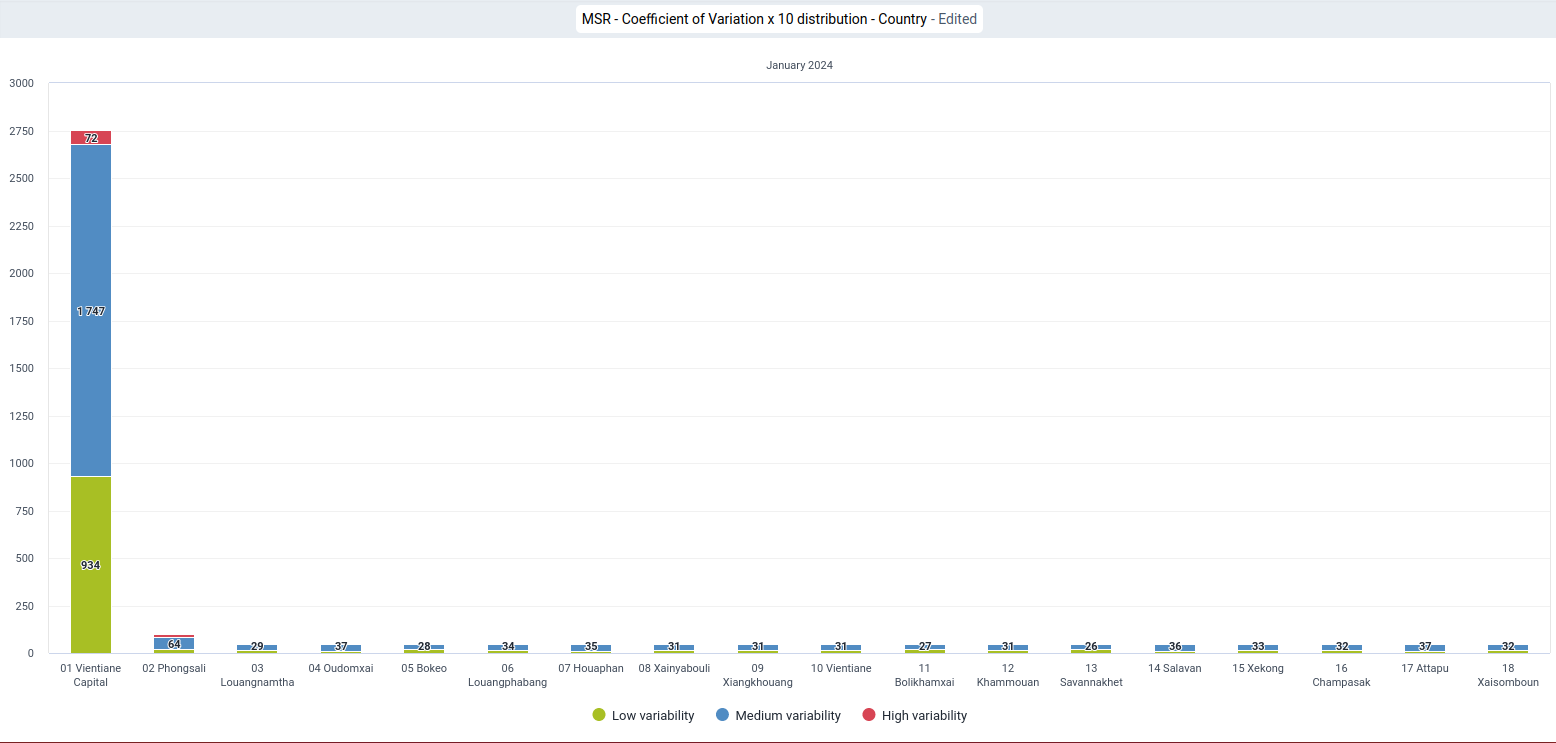
119 MSR - Coefficient of Variation x 10 distribution - Country
Visualization type: select "Column chart"
Name (*): "MSR - Coefficient of Variation x 10 distribution - Country"
Description: "MSR DV 119 - Monthly Stock Reporting / Coefficient of Variation x 10 distribution / Last 3 months / Country / Column chart This report provides the number of items which fall into the respective coefficient of variation (standard deviation of stock distribution divided by average stock distribution) ranges (low, medium and high) across all items at a health facility for the last 3 months for all health facilities in the countries."Series
Data
Data Type: "Indicators"
Indicator group: "Coefficient of variation"
Selected items: select the following items in the following order:
- Low variability
- Medium variability
- High variabilityCategory
Period: "Relative periods"
Period type: "Months"
Selected Periods: "Last 3 months"
Organisation unit: "User organisation unit"
Level: "Province"
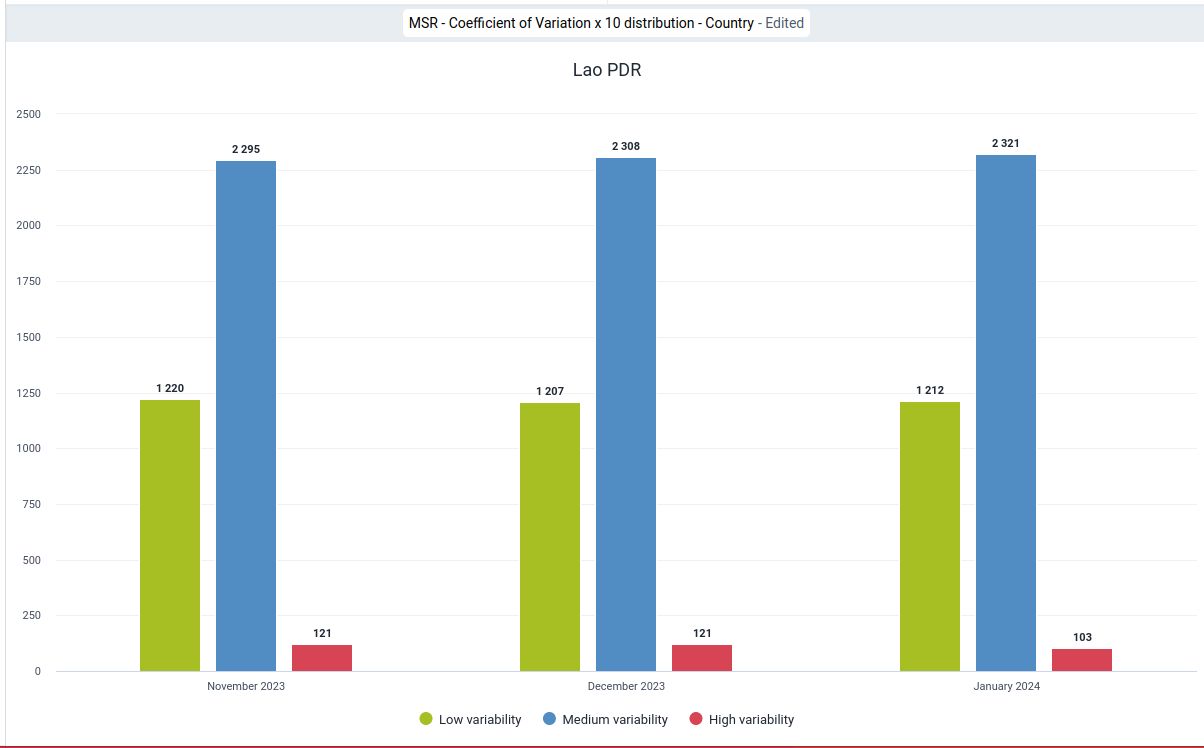
120 MSR - Stock availability - Country
Visualization type: select "Pivot table"
Name (*): "MSR - Stock availability - Country"
Description: "MSR DV 120 - Monthly Stock Reporting / Stock availability / Last 12 months / Province / By health facility / Pivot table This report provides the stock availability across all stock items for all health facilities in a province over the last 12 months with a colour legend."Columns
Period: "Relative periods"
Period type: "Months"
Selected Periods: "Last 12 months"Rows
Organisation unit: "User organisation unit"
Level: "Province"Filter
Data
Data Type: "Indicators"
Selected items: select "Stock availability / %"Options
Legend
Use legend for chart colors: tag (appears as a white tick in a green field)
Legend type
Select a legend: tag (appears as a white tick in a green field)
Legend: "Stock availability / %"Show legend key tag (appears as a white tick in a green field)
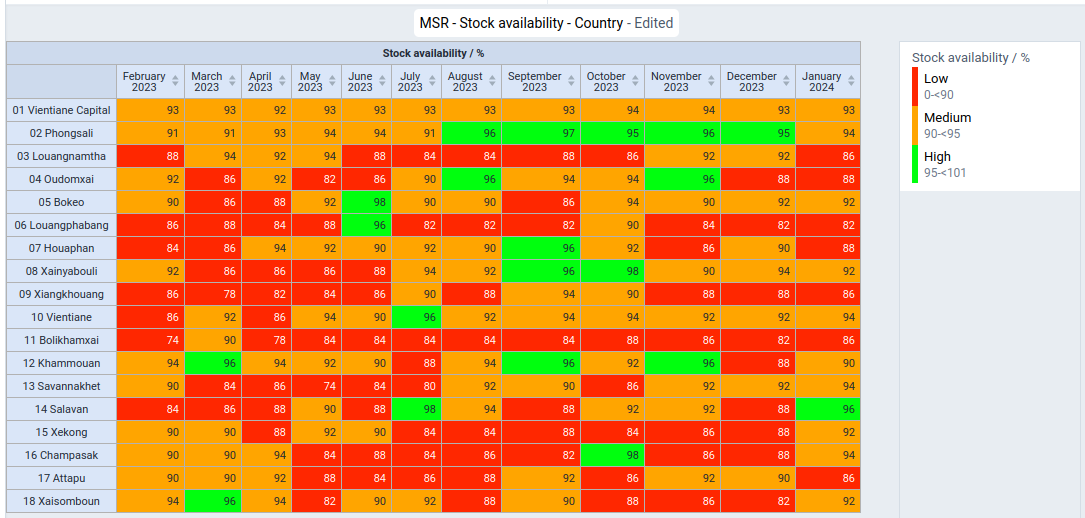
121 MSR - Stock availability - Country
Visualization type: select "Column"
Name (*): "MSR - Stock availability - Country"
Description: "MSR DV 121 - Monthly Stock Reporting / Stock availability / Last 12 months / Country / Across items / Column chart This report provides the stock availability across all stock items for all health facilities in a Country for the last month with a colour legend."Series
Period: "Relative periods"
Period type: "Months"
Selected Periods: "Last month"Category
Organisation unit: "User organisation unit"
Level: "Province"Filter
Data
Data Type: "Indicators"
Selected items: select "Stock availability / %"Options
Legend
Use legend for chart colors: tag (appears as a white tick in a green field)
Legend type
Select a legend: tag (appears as a white tick in a green field)
Legend: "Stock availability / %"
Show legend key tag (appears as a white tick in a green field)
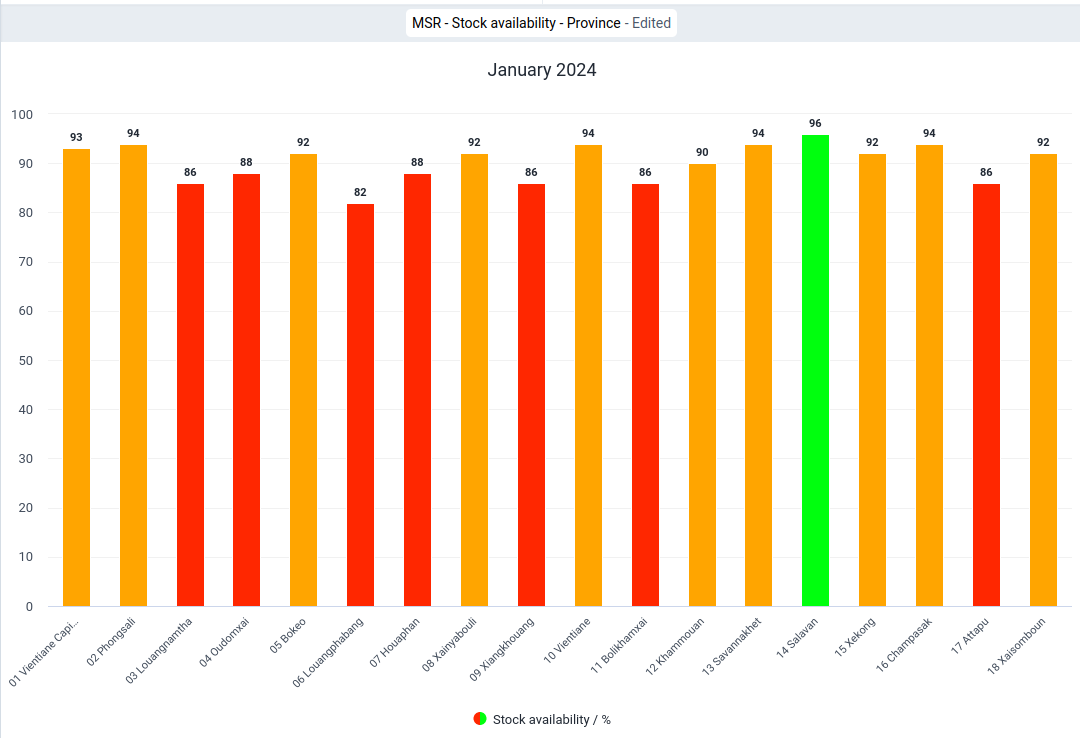
122 MSR - Stockout rate / % - Country
Visualization type: select "Column"
Name (*): "MSR - Stockout rate / % - Country" Description: "MSR DV 122 - Monthly Stock Reporting / Stockout rate / % / Last month / Country / Column chart This report displays a column chart with the percentage of items with a stockout for the last month across health facilities in a country."Series
Data Type: "Indicators"
Selected items: "Stockout rate / %"Category
Period: "Relative periods"
Period type: "Months"
Selected Periods: "Last month"
Organisation unit: "User organisation unit"
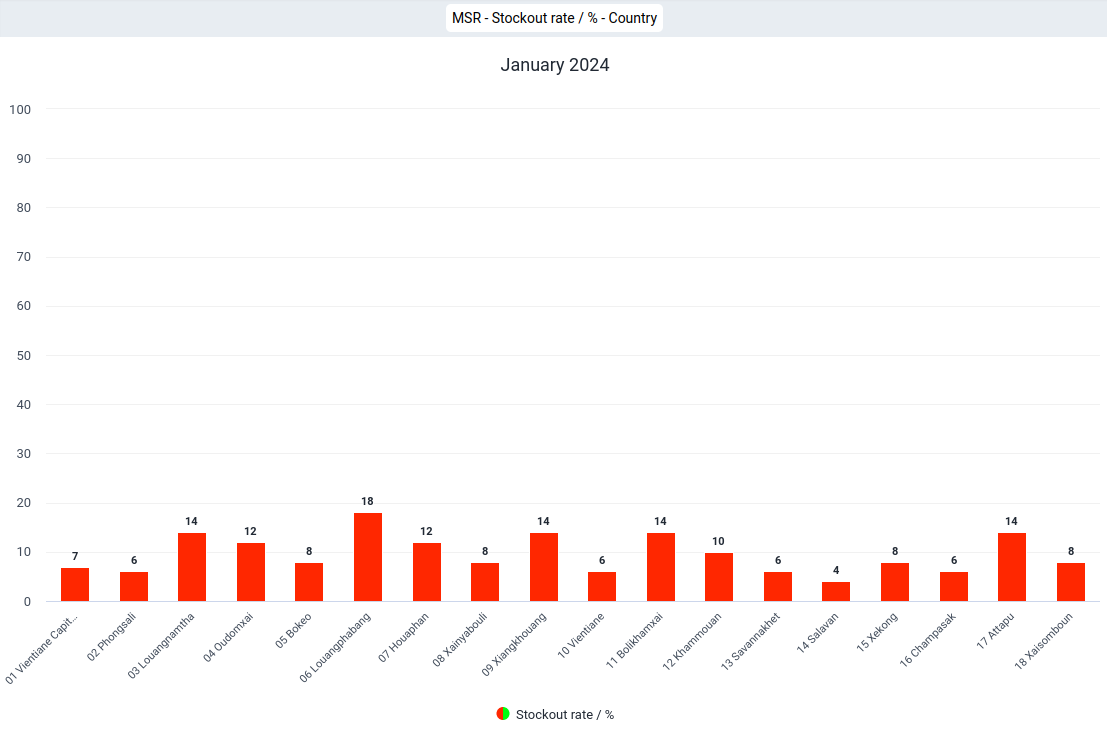
123 MSR - Stock availability and stockout rate - Country
Visualization type: select "Stacked column"
Name (*): "MSR - Stock availability and stockout rate - Country"
Description: "MSR DV 123 - Monthly Stock Reporting / Stock availability and stockout rate / Last month / Province / Stacked column chart This report displays the stock availability (number of items with non-zero stock on hand divided by the total number of stock items) as percentage for the last month for all provinces in a country as stacked column chart with a legend."Series
Data Type: "Indicators"
Indicator group: "Stockout count"
Selected items:
- "Stock availability / %"
- "Stockout rate / %"
Category
Period: "Relative periods"
Period type: "Months"
Selected Periods: "Last Month"
Organisation unit: "User organisation unit"
Level: "DistrictProvince"
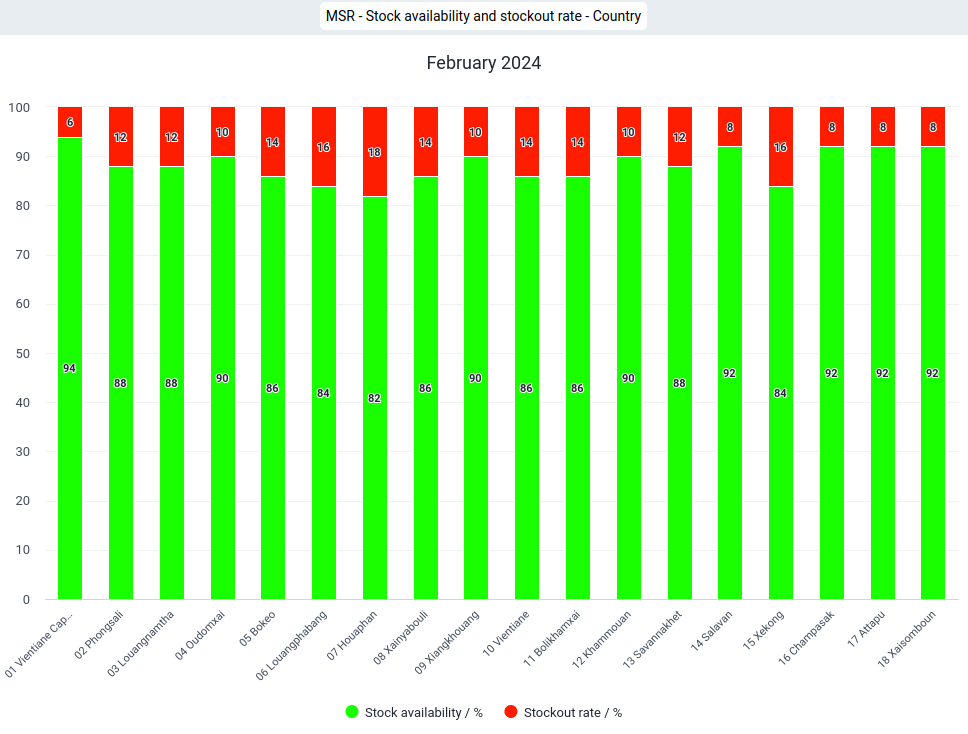
124 MSR - Stockouts - Country
Visualization type: select "Pivot table"
Name (*): "MSR - Stockouts - Country"
Description: "MSR DV 124 - Monthly Stock Reporting / Stockout by item / Last 12 months / Country / By item / Pivot table This report displays a Pivot table with all items and indicating for each item whether it was out of stock for each of the health facilities in a country for the last 12 months."Columns
Period: "Relative periods"
Period type: "Months"
Selected Periods: "Last 12 months"Rows
Data
Data Type: "Data elements"
Data element group: select "[Stock item list] - MSR
Disaggregation: "Totals only"
Selected items: select all (->>)
Organisation unit: "User organisation unit"
Level: "Province"Filter: "Relative periods"
YOUR DIMENIONS
Name: "Monthly stock report"
Selected Items: "Stockout Yes/No"Options
Data
Totals
Column totals: tag (appears as a white tick in a green field)
Column sub-totals: tag (appears as a white tick in a green field)
Row totals: tag (appears as a white tick in a green field)Empty data
Hide empty rows: tag (appears as a white tick in a green field)
Legend
Use legend for chart colors: tag (appears as a white tick in a green field)
Legend style
Legend changes background color: tag (appears as a white tick in a green field)
Legend type
Select a legend: tag (appears as a white tick in a green field)
Legend: "Stockout count"
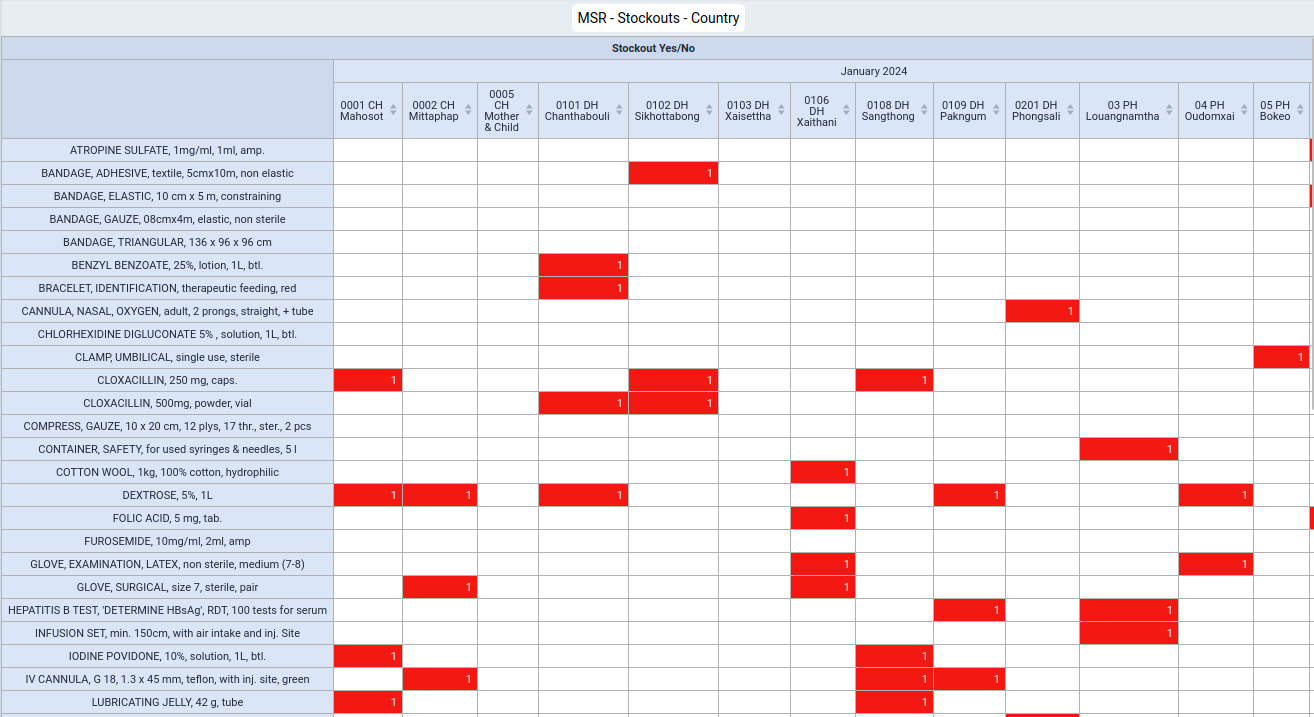
125 MSR - Stockout count - Country
Visualization type: select "Pivot table"
Name (*): "MSR - Stockout count - Country"
Description: "MSR DV 125 - Monthly Stock Reporting / Stockout count / Last 12 months / Province / Pivot table This report displays the number of stockouts for all items across a health facility for each of the past 12 months for all health facilities in each district in a country as a Pivot table."Columns
Period: "Relative periods"
Period type: "Months"
Selected Periods: "Last 12 months"Rows
Organisation unit: "User organisation unit"
Level: "Province"Filter
Data
Data Type: "Data elements"
Data element group: select "[Stock item list] - MSR
Disaggregation: "Totals only"
Selected items: select all (->>)YOUR DIMENIONS
Name: "Monthly stock report"
Selected Items: "Stockout Yes/No"Options
Legend
Use legend for chart colors: tag (appears as a white tick in a green field)
Legend style
Legend changes background color: tag (appears as a white tick in a green field)
Legend type
Select a legend: tag (appears as a white tick in a green field)
Legend: "Stockout count"
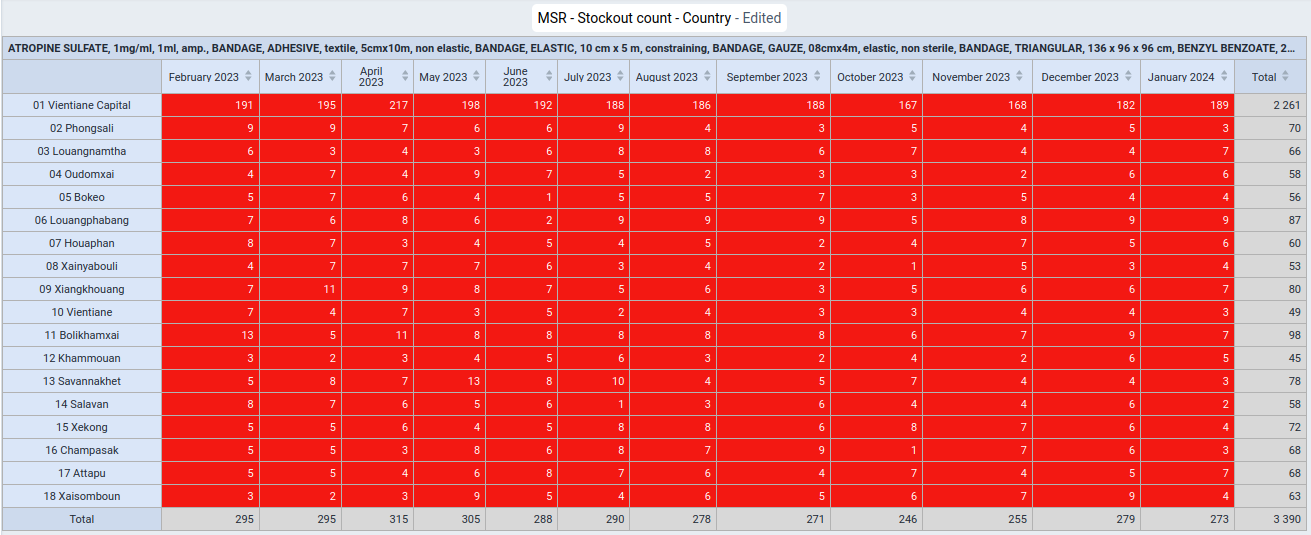
126 MSR - Stockout count - Country
Visualization type: select "Stacked column"
Name (*): "MSR - Stockout count - Country"
Description: "MSR DV 126 - Monthly Stock Reporting / Stockout count / Last 12 months / Country / Stacked column chart This report displays the number of stockouts for each of the past 12 months for each province in a country as a Stacked column chart."Series
Organisation unit: "User organisation unit"
Level: "Province"Category
Period: "Relative periods"
Period type: "Months"
Selected Periods: "Last 12 months"Filter
YOUR DIMENIONS
Name: "Monthly stock report"
Selected Items: "Stockout Yes/No"Data
Data Type: "Data elements"
Data element group: select "[Stock item list] - MSR
Disaggregation: "Totals only"
Selected items: select all (->>)
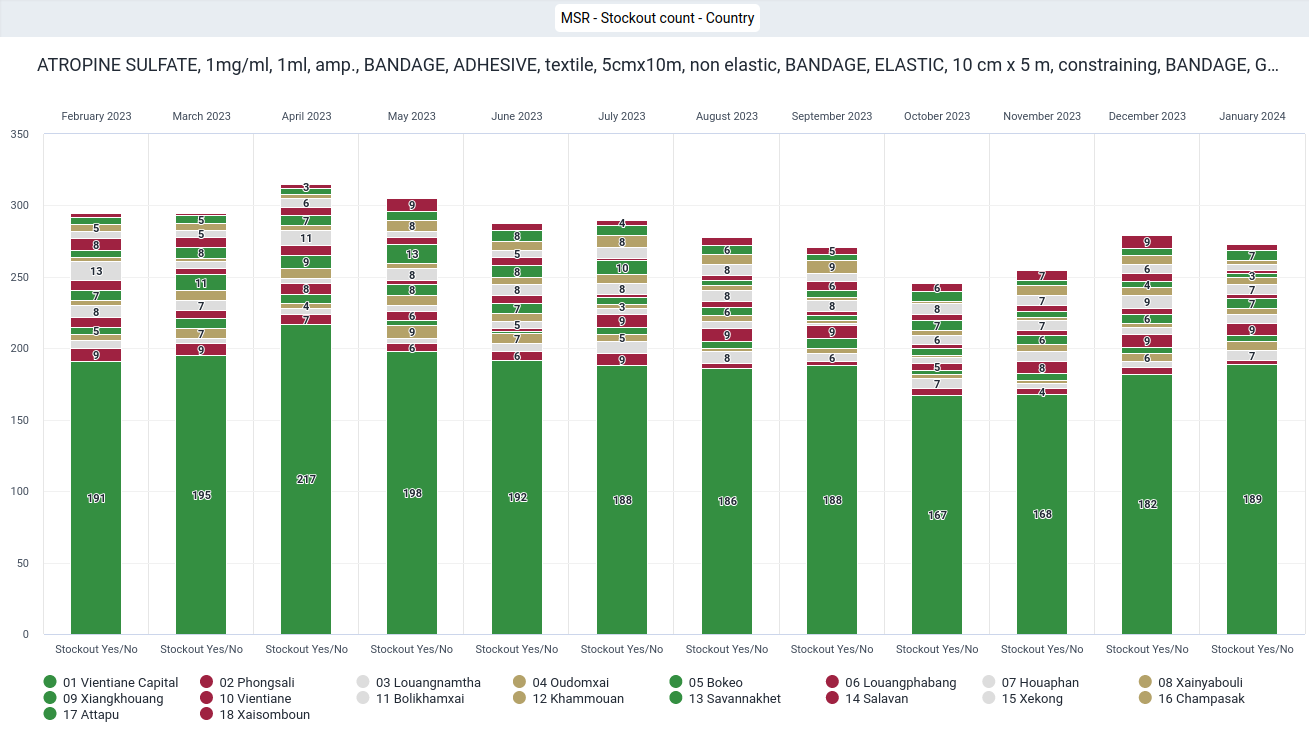
127 MSR - Stockout count - Country
Visualization type: select "Single value"
Name (*): "MSR - Stockout count - Country"
Description: "MSR DV 127 - Monthly Stock Reporting / Stockout count / Last month / Country / Single value chart This report displays the number of stockouts for all items across provinces in a country for the last month as a Single value chart."Series
Period: "Relative periods"
Period type: "Months"
Selected Periods: "Last month"Category
YOUR DIMENIONS
Name: "Monthly stock report"
Selected Items: "Stockout Yes/No"Filter
Organisation unit: "User organisation unit"
Level: "Province"
Data:Data Type: "Data elements"
Data element group: select "[Stock item list] - MSR
Disaggregation: "Totals only"
Selected items: select all (->>)Options
Legend
Use legend for chart colors: tag (appears as a white tick in a green field)
Legend style
Legend changes background color: tag (appears as a white tick in a green field)
Legend type
Select a legend: tag (appears as a white tick in a green field)
Legend: "Stockout count"
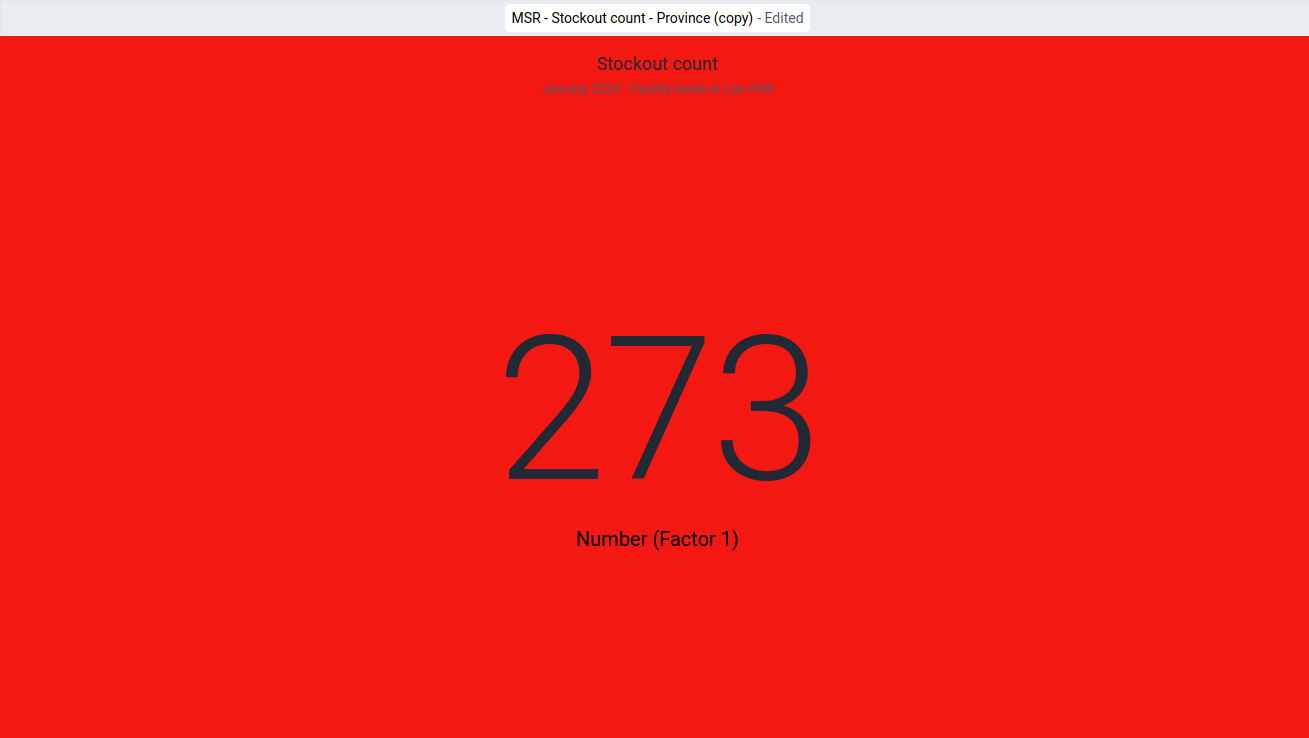
128 MSR - Stockout duration - Country
Visualization type: select "Pivot table"
Name (*): "MSR - Stockout duration - Country"
Descriptions: "MSR DV 128 - Monthly Stock Reporting / Stockout duration / Last 12 months / Country / Pivot table This report displays a Pivot table with a count of the number of months (during the past 12 months) during which and item was out of stock at all health facilities in each of the provinces in a country."Columns
YOUR DIMENIONS
Name: "Monthly stock report"
Selected Items: "Stockout Yes/No"
Organisation unit: "User organisation unit"
Level: "Province"Rows
Data
Data Type: "Data elements"
Data element group: select "[Stock item list] - MSR
Disaggregation: "Totals only"
Selected items: select all (->>)Filter
Period: "Relative periods"
Period type: "Months"
Selected Periods: "Last 12 month"Options
Data
Totals
Column totals: tag (appears as a white tick in a green field)
Column sub-totals: tag (appears as a white tick in a green field)
Row totals: tag (appears as a white tick in a green field)Empty data
Hide empty columns: tag (appears as a white tick in a green field)
Hide empty rows: tag (appears as a white tick in a green field)Legend
Use legend for chart colors: tag (appears as a white tick in a green field)
Legend style
Legend changes background color: tag (appears as a white tick in a green field)
Legend type
Select a legend: tag (appears as a white tick in a green field)
Legend: "Stockout count"
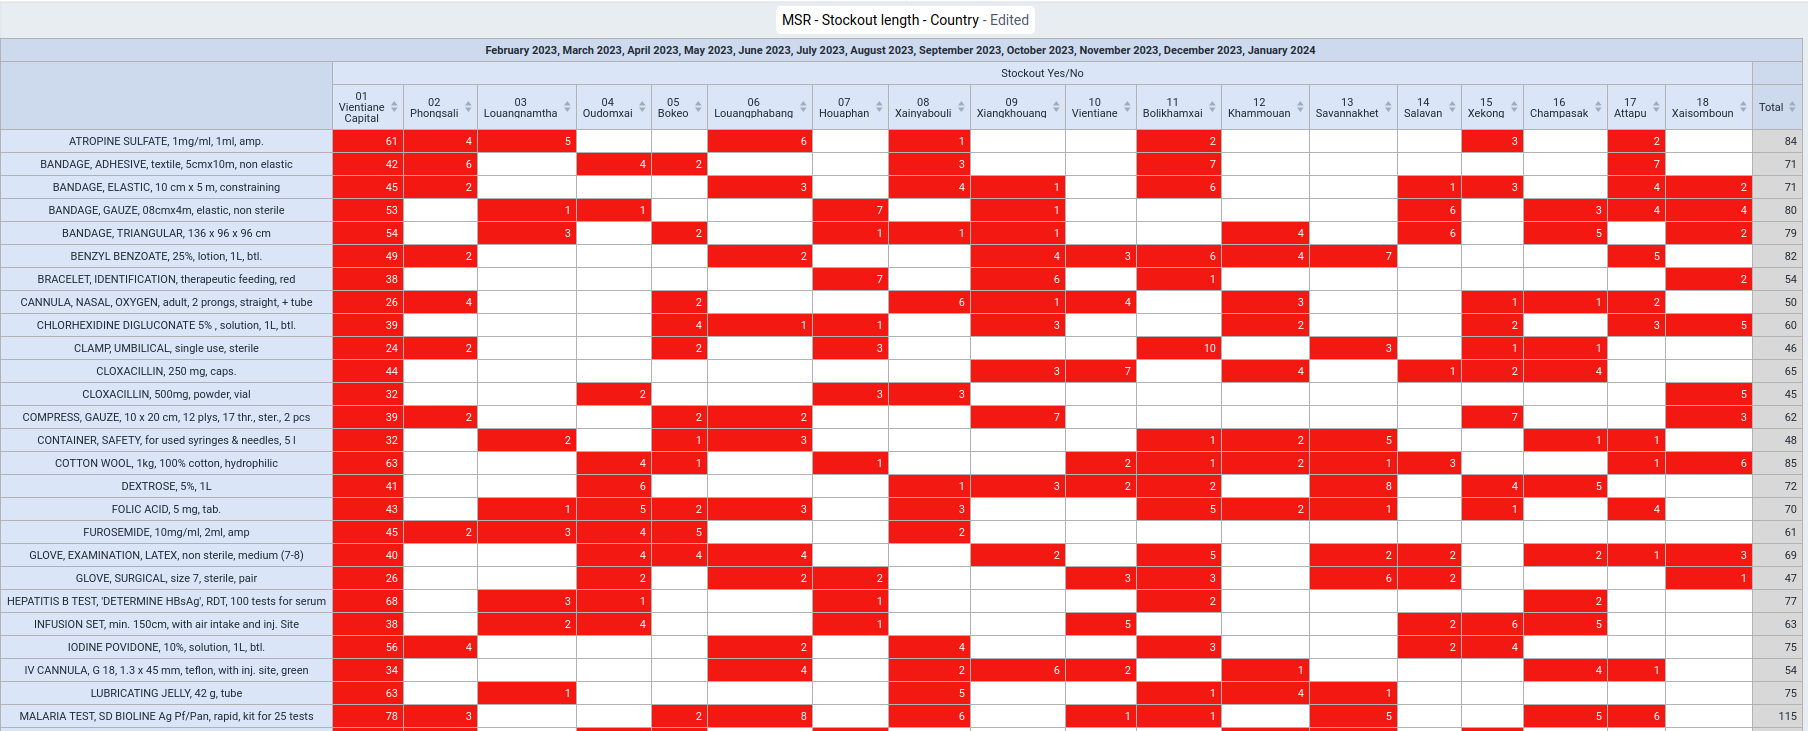
129 MSR - Stockout duration - Country
Visualization type: select "Stacked bar chart table"
Name (*): "MSR - Stockout duration - Country"
Description: "MSR DV 129 - Monthly Stock Reporting / Stockout duration / Last 12 months / Country / Stacked bar chart This report displays a stacked bar chart with the number of stockouts for each item by provinces in the country during the past 12 months."Series
YOUR DIMENIONS
Name: "Monthly stock report"
Selected Items: "Stockout Yes/No"Category
Data
Data Type: "Data elements"
Data element group: select "[Stock item list] - MSR
Disaggregation: "Totals only"
Selected items: select all (->>)Filter
Organisation unit: "User organisation unit"
Level: "Province"
Period: "Relative periods"Period type: "Months"
Selected Periods: "Last 12 month"
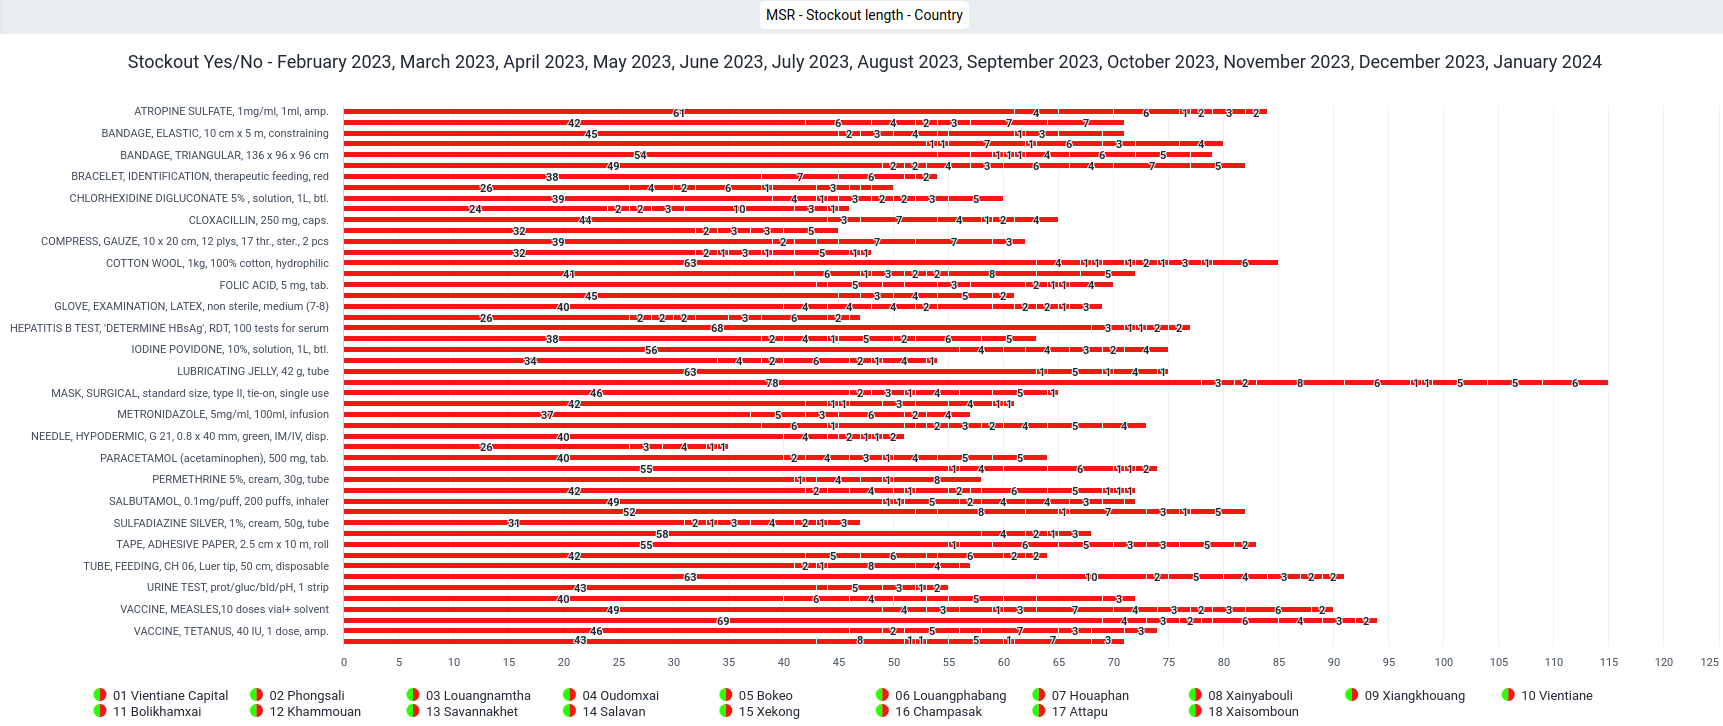
130 MSR - Stock coverage time distribution - Country
Visualization type: select "Pivot table"
Name (*): "MSR - Stock coverage time distribution - Country"
Description: "MSR DV 130 - Monthly Stock Reporting / Stock coverage time / distribution / Last month / Country / Column chart This report displays a Pivot table with the number of items for which the coverage time fell into the respective coverage time bins (stockout, 1 to 12 months, 1-2 and 2-3 years or greater than or equal to 3 years) across all provinces in a country for the last months."Columns
Data
Data Type: "Indicators"
Indicator group: select "Stock coverage time"
Selected items: select the following indicators in the following order:
- "Stockout count"
- "0-1 months"
- "1-2 months"
- "2-3 months"
- "3-4 months"
- "4-5 months"
- "5-6 months"
- "6-7 months"
- "7-8 months"
- "8-9 months"
- "9-10 months"
- "10-11 months"
- "11-12 months"
- "1-2 years"
- "2-3 years"
- ">=3 years"Rows
Period: "Relative periods"
Period type: "Months"
Selected Periods: "Last 12 months"
Organisation unit: "User organisation unit"
Level: "Province"Options
Data
Totals
Columns totals: tag (appears as a white tick in a green field)
Columns sub-totals: tag (appears as a white tick in a green field)
Row totals: tag (appears as a white tick in a green field)
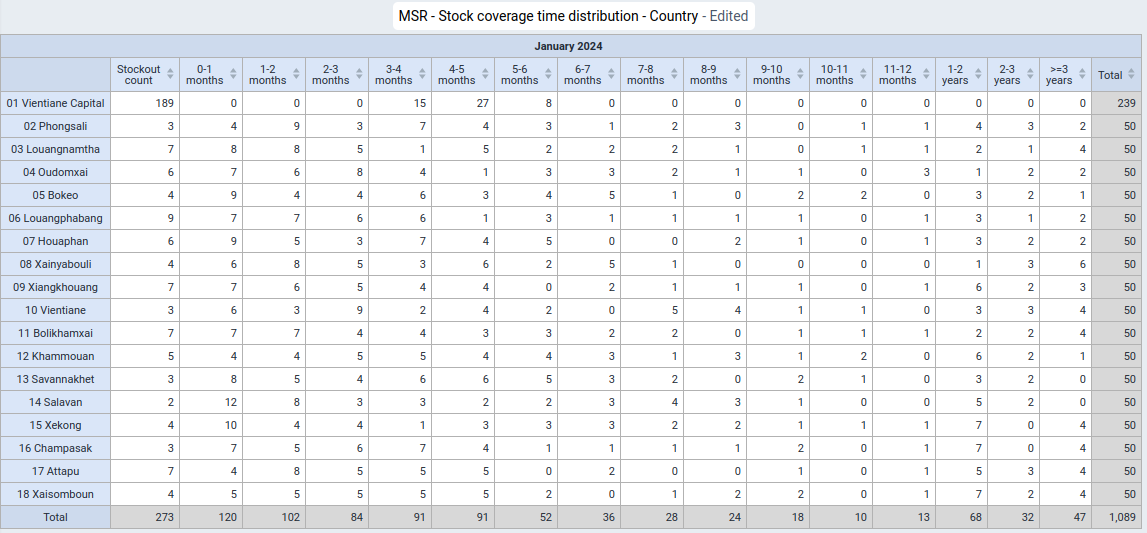
131 MSR - Stock coverage time categories - Country
Visualization type: select "Column"
Name (*): "MSR - Stock coverage time categories - Country"
Description: "MSR DV 131 - Monthly Stock Reporting / Stock coverage time / Categories / Country / Column chart / Last month For the last month, this report displays a stacked column chart with the number of items for each stock coverage time category (stockout, understock, appropriate stock, overstock and excessive stock) across provinces in the district."Series
Organisation unit: "User organisation unit"
Level: "Province"
Category
Data
Data Type: "Indicators"
Indicator group: select "Stock coverage time"
Selected items: select the following indicators in the following order:
- "Stockout count"
- "Understock (0-3 months)"
- "Appropriate stock (3-6 months)"
- "Overstock (6-12 months)"
- "Excessive stock (> 12 months)"Filter
Period: "Relative periods"
Period type: "Months"
Selected Periods: "Last month"
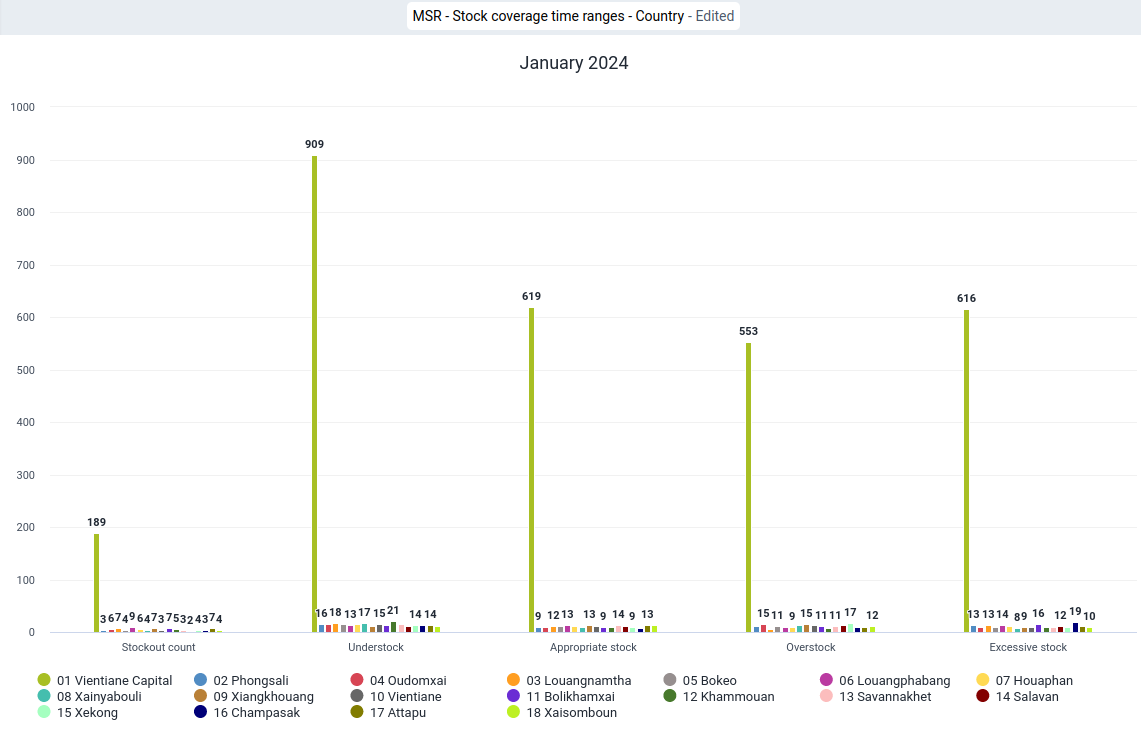
132 MSR - Stock coverage time categories - Country
Visualization type: select "Stacked column"
Name (*): "MSR - Stock coverage time categories - Country"
Description: "MSR DV 132 - Monthly Stock Reporting / Stock coverage time / Categories / Province / Stacked column chart / Last month For the last month, this report displays a stacked column chart with the number of items for each stock coverage time category (stockout, understock, appropriate stock, overstock and excessive stock) for each health facility in the province."Series
Organisation unit: "User organisation unit"
Level: "Province"
Category
Period: "Relative periods"
Period type: "Months"
Selected Periods: "Last month"Data
Data Type: "Indicators"
Indicator group: select "Stock coverage time"
Selected items: select the following indicators in the following order:
- "Stockout count"
- "Understock (0-3 months)"
- "Appropriate stock (3-6 months)"
- "Overstock (6-12 months)"
- "Excessive stock (> 12 months)"
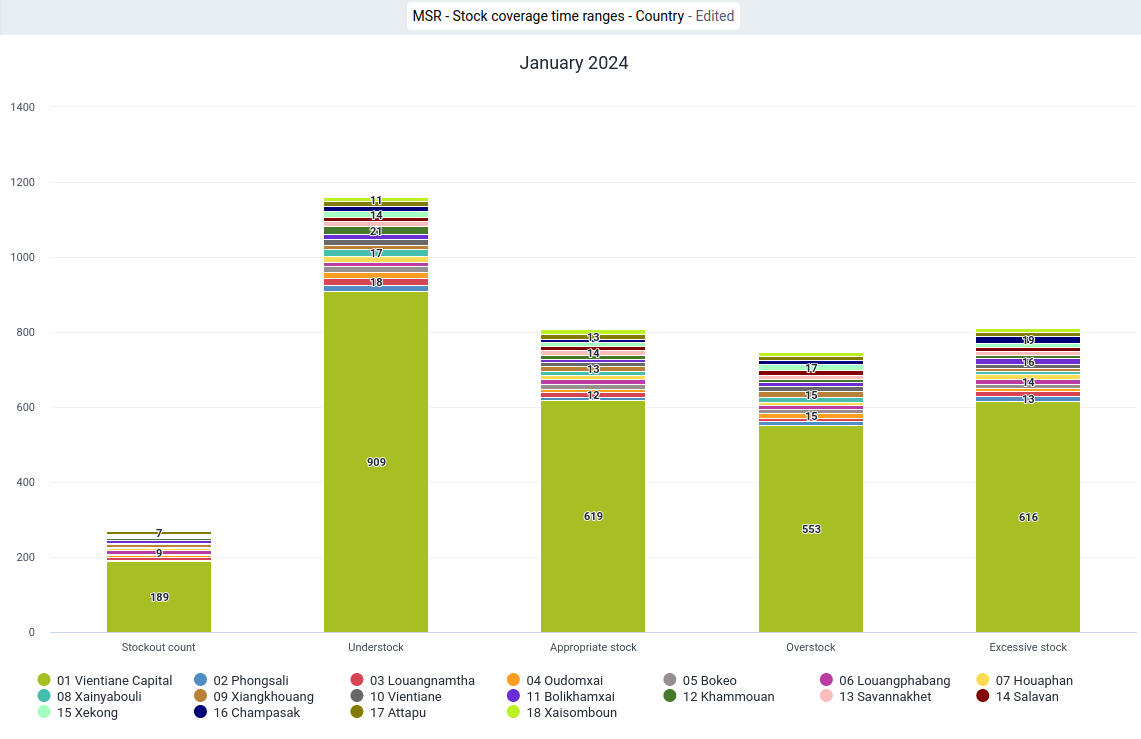
133 MSR - Stock discrepancy count - Country
Visualization type: select "Stacked column"
Name (*): "MSR - Stock discrepancy count - Country"
Visualization type: "MSR DV 133 - Monthly Stock Reporting / Stock discrepancy / count / Last 12 months / Country / Stacked column chart This report displays the number of stock discrepancies for the past 12 months across provinces in the country."Series
YOUR DIMENIONS
Name: "Monthly stock report"
Selected Items: "Stock discrepancy count"Category
Period: "Relative periods"
Period type: "Months"
Selected Periods: "Last 12 months"Filter
Organisation unit: "User organisation unit"
Level: "Province"
Data
Data Type: "Data elements"
Data element group: select "[Stock item list] - MSR
Disaggregation: "Totals only"
Selected items: select all (->>)
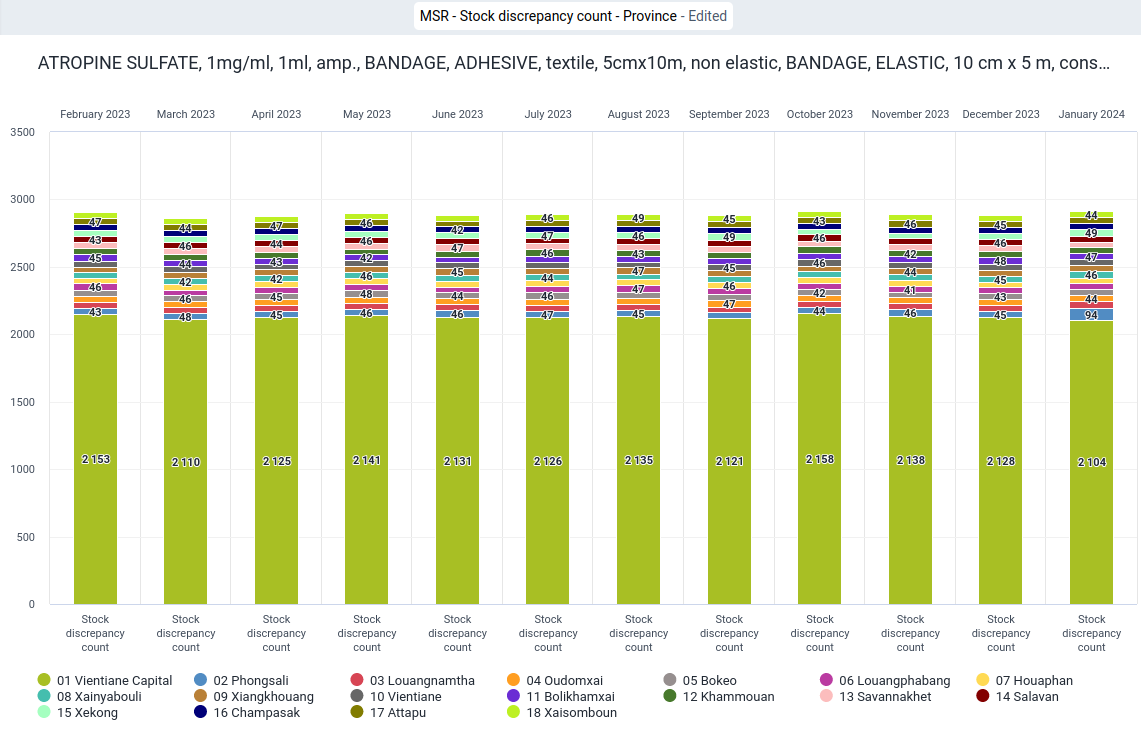
134 MSR - Stock discrepancy count - Country
Visualization type: select "Single value"
Name (*): "MSR - Stock discrepancy count - Country"
Visualization type: "MSR DV 134 - Monthly Stock Reporting / Stock discrepancy / count / Last month / Country / Single value chart This report displays the number of stock discrepancies across the country for the last month as a single value chart."Series
Data
Data Type: "Indicators"
Indicator group: select "Stockout discrepancy"
Selected items: "Stock discrepancy count"Filter
Organisation unit: "User organisation unit"
Level: "Province"
Period: "Relative periods"
Period type: "Months"
Selected Periods: "Last month"
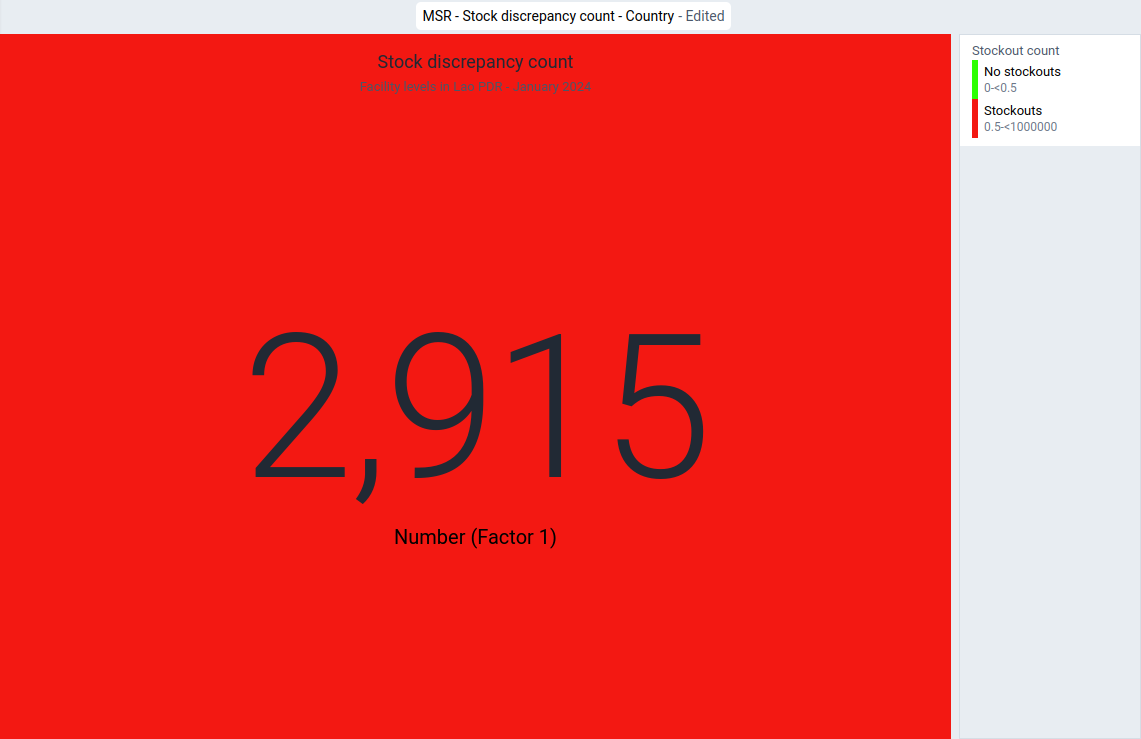
135 MSR - Report completeness - Country
Visualization type: select "Pivot"
Name (*): "MSR - Report completeness - Country"
Visualization type: "MSR DV 135 - Monthly Stock Reporting / Stock reporting complete / Last month / Country / Pivot table." This report provides the "Reporting rate", "Reporting rate on time", "Actual reports", "Actual reports on time" as well as the "Expected reports" for the last month across all health facilities in all the provinces in a country as a Pivot table."Columns
Period: "Relative periods"
Period type: "Months"
Selected Periods: "Last 12 month"Rows
Data
Data Type: "Data sets"
Data set: select "Monthly stock report"
Metric type:
- "Monthly stock report - Reporting rate"
- "Monthly stock report - Reporting rate on time"
- "Monthly stock report - Actual reports"
- "Monthly stock report - Actual reports on time"
- "Monthly stock report - Expected reports"
Organisation unit: "User organisation unit"
Level: "Province"
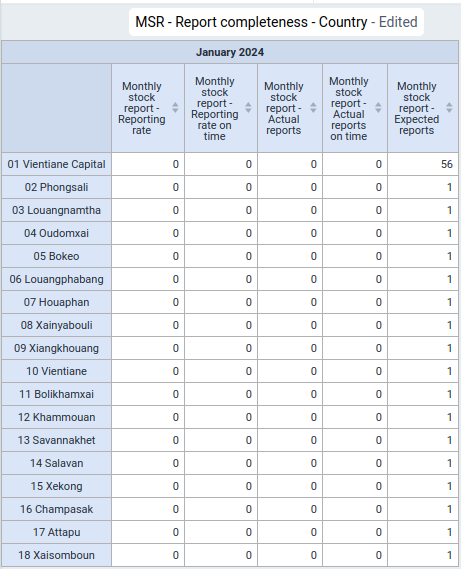
136 MSR - Reporting rate - Country
Visualization type: select "Single value"
Name (*): "MSR - Reporting rate - Country"
Visualization type: "MSR DV 136 - Monthly Stock Reporting / Reporting rate / Last month / Country / Single value chart This report provides the "Reporting rate" for the last month across all the health facilities across all provinces in a country as single value chart."Series
Data
Data Type: "Indicators"
Data set: select "Monthly stock report"
Metric type: "Reporting rate" Selected Items: "Monthly stock report - Reporting rate"Filter
Organisation unit: "User organisation unit"
Level: "Province"
Period: "Relative periods"
Period type: "Months"
Selected Periods: "Last month"Options*
LegendUse legend for chart colors: tag (appears as a white tick in a green field)
Legend type
Select a legend: tag (appears as a white tick in a green field)
Legend: "Stock availability / %"
Show legend key tag (appears as a white tick in a green field)
137 MSR - Reporting rate on time - Country
Visualization type: select "Single value"
Name (*): "MSR - Reporting rate on time - Country"
Visualization type: "MSR DV 137 - Monthly Stock Reporting / Reporting rate on time / Last month / Country / Single value chart This report provides the "Reporting rate on time" for the last month across all health facilities across all provinces in a country."Series
Data
Data Type: "Indicators"
Data set: select "Monthly stock report"
Metric type: "Reporting rate"
Selected Items: "Monthly stock report - Reporting rate on time"Filter
Organisation unit: "User organisation unit"
Level: "Province"
Period: "Relative periods"
Period type: "Months"
Selected Periods: "Last 12 months"Options*
LegendUse legend for chart colors: tag (appears as a white tick in a green field)
Legend type
Select a legend: tag (appears as a white tick in a green field)
Legend: "Stock availability / %"
Show legend key tag (appears as a white tick in a green field)
Maps App - Analytics
1 Health facility
- 1 MSR - Health facility
2 District level
2.1 Statistics
- 2 MSR - Health facilities - District
2.2 Indicators
- 3 MSR - Stock availability - District
- 4 MSR - Stock discrepancy count - District
- 5 MSR - Stockout count - District
3 Province level
3.1 Statistics
- 6 MSR - Health facilities - Province
3.2 Indicators
- 7 MSR - Stock availability- Province
- 8 MSR - Stock discrepancy count - Province
- 9 MSR - Stockout count - Province
4 Country
4.1 Statistics
- 10 MSR - Health facilities - Country
4.2 Indicators
- 11 MSR - Stock availability- Country
- 12 MSR - Stock discrepancy count - Country
- 13 MSR - Stockout count - Country
Health facility level
Statistics
1 MSR - Health facility
Name (*): "MSR - Health facility"
Decription: "This map displays the location of a health facility together with the administrative district boundary on a map."Add layer
1 Facilities
Organisation Units
Selection: "User organisation unit"
Level: "Facility"Style
Labels
Size: "15"
Colour: select black
Point color: select preferred colour
Point radius: "10"2 Organisation units
Organisation Units
Selection: "User organisation unit"
Level: "District"Style
Labels: tag (appears as a white tick in a green square)
Size: "20"
Colour: select red
Boundary colour: select preferred colour
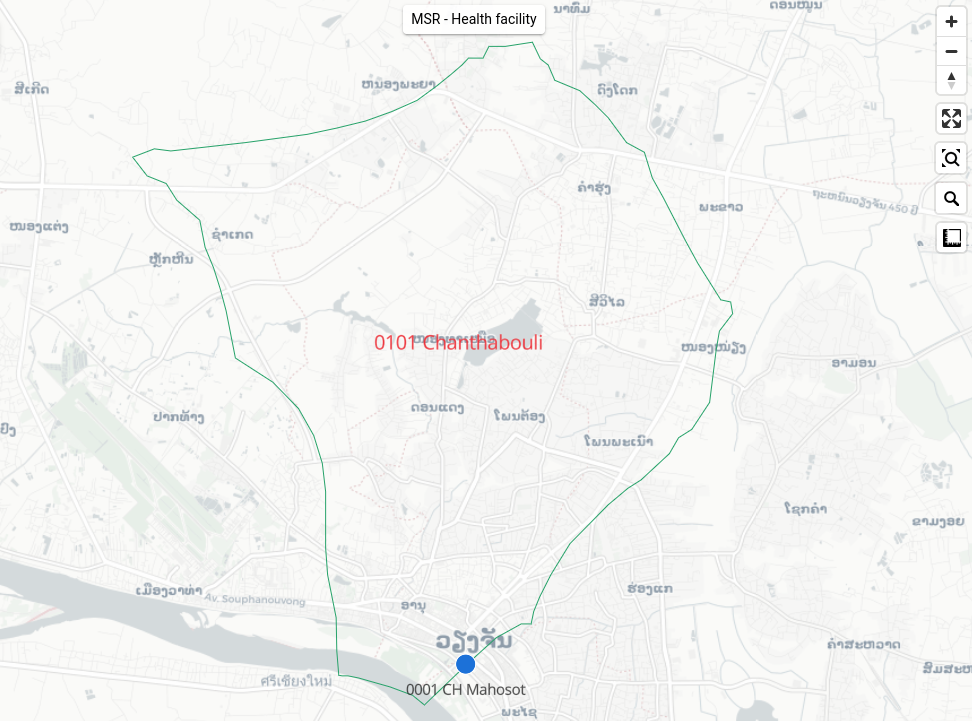
District level
Statistics
2 MSR - Health facilities - District
Name (*): "MSR - Health facilities - District"
Decription: "This map displays the location of all health facilities in a district together with the administrative district boundary on a map."Add layer
1 Facilities
Organisation Units
Selection: "User organisation unit"
Level: "Facility"Style
Labels
Size: "15"
Colour: select black
Point color: select preferred colour
Point radius: "10"2 Organisation units
Organisation Units
Selection: "User organisation unit"
Level: "District"Style
Labels: tag (appears as a white tick in a green square)
Size: "20"
Colour: select red
Boundary colour: select preferred colour
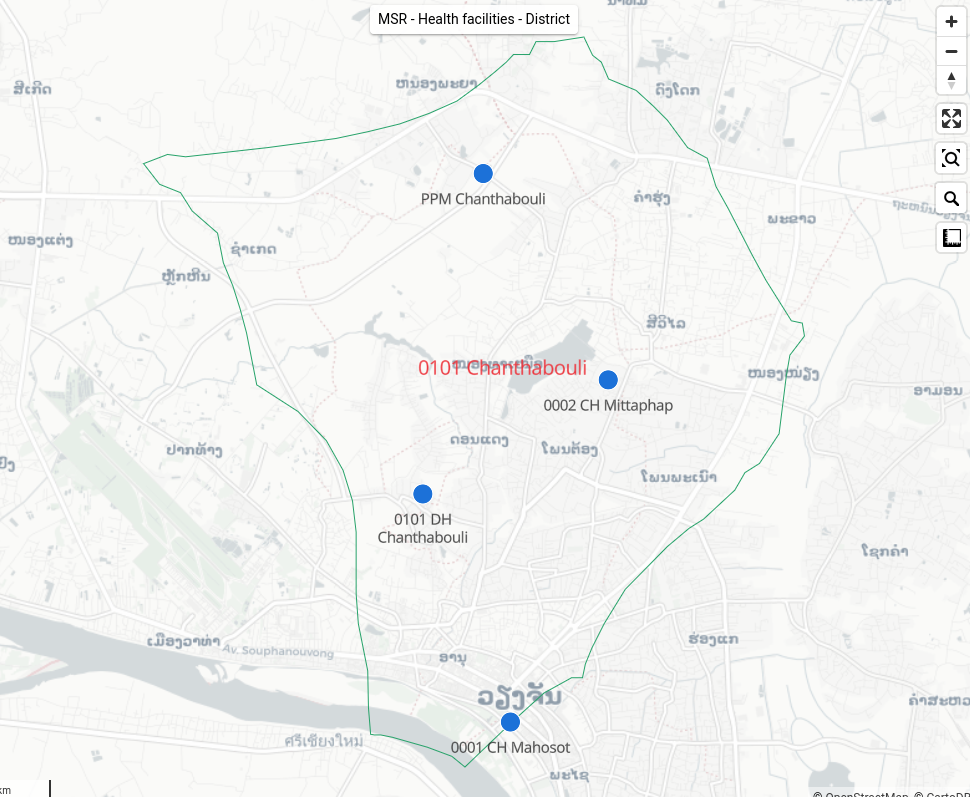
Indicators
3 MSR - Stock availability - District
Name (*): "MSR - Stock availability - District"
Decription: "This map displays the stock availability for all health facilities in a district with the administrative district boundary as a timeline for the past 12 months on a map."Add layer
1 Stock availability / %
Data
Item type: "Indicator"
Indicator group: "Stock availability / %"
Indicator: "Stock availability / %"
Aggregation type: "By data element"Period
Period type: "Relative"
Period: "Last 12 months"
Display periods: "Timeline"Organisation Units
Selection: "User organisation unit"
Style
Bubble map
High radius: "15"
Colour: select blackAutomatic color legend: tag
Classification: "Equal intervals"
Classes: "5"2 Organisation units
Organisation Units
Selection: "User organisation unit"
Level: "District"Style
Labels: tag (appears as a white tick in a green square)
Size: "20"
Colour: select redBoundary colour: select preferred colour
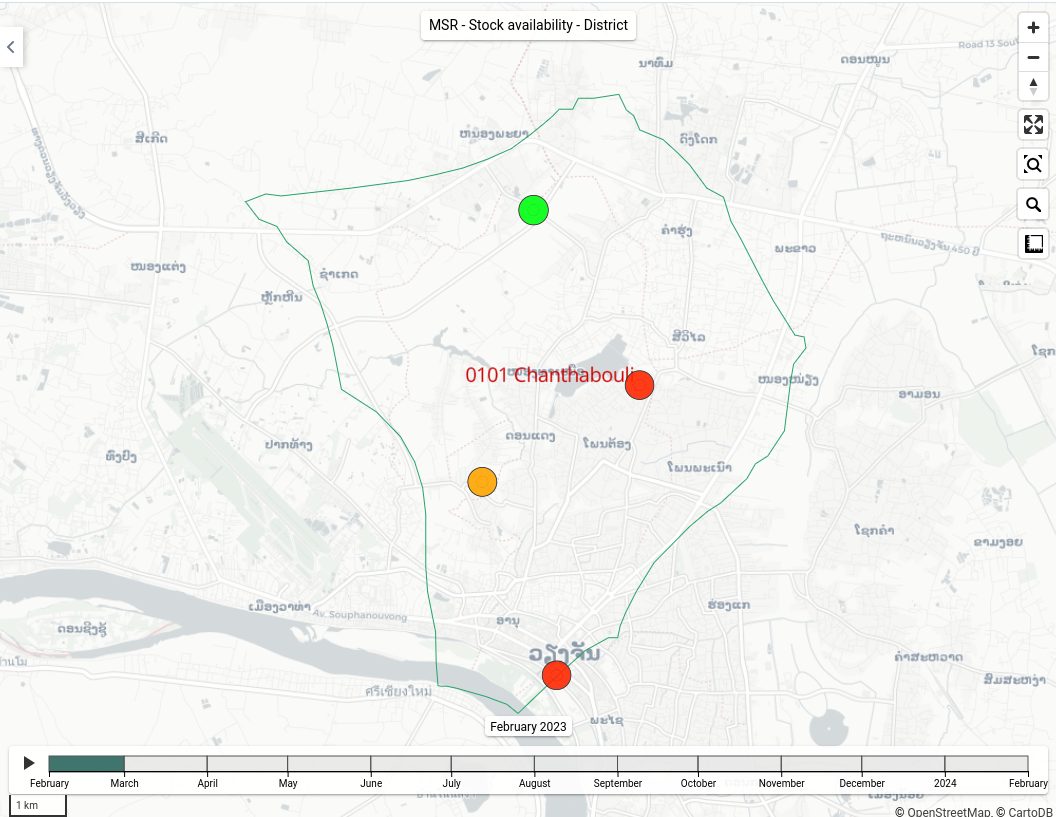
4 MSR - Stock discrepancy count - District
Name (*): "MSR - Stock discrepancy count - District"
Decription: "This map displays the stock discrepancy count for all health facilities in a district with the administrative district boundary as a timeline for the past 12 months on a map."Add layer
1 Stock discrepancy count
Data
Item type: "Indicator"
Indicator group: "Stock discrepancy count"
Indicator: "Stock discrepancy count"
Aggregation type: "By data element"Period
Period type: "Relative"
Period: "Last 12 months"
Display periods: "Timeline"Organisation Units
Selection: "User organisation unit"
Style
Bubble map
High radius: "15"
Colour: select blackAutomatic color legend: tag
Classification: "Equal intervals"
Classes: "5"2 Stock discrepancy count
Data
Item type: "Indicator"
Indicator group: "Stock discrepancy count"
Indicator: "Stock discrepancy count"
Aggregation type: "By data element"Period
Period type: "Relative"
Period: "Last 12 months"
Display periods: "Timeline"Organisation Units
Selection: "User organisation unit"
Level: "District"Style
Bubble map
High radius: "15"
Colour: select blackAutomatic color legend: tag
Classification: "Equal intervals"
Classes: "5"3 Organisation units
Organisation Units
Selection: "User organisation unit"
Level: "District"Style
Labels: tag (appears as a white tick in a green square)
Size: "20"
Colour: select red
Boundary colour: select preferred colour
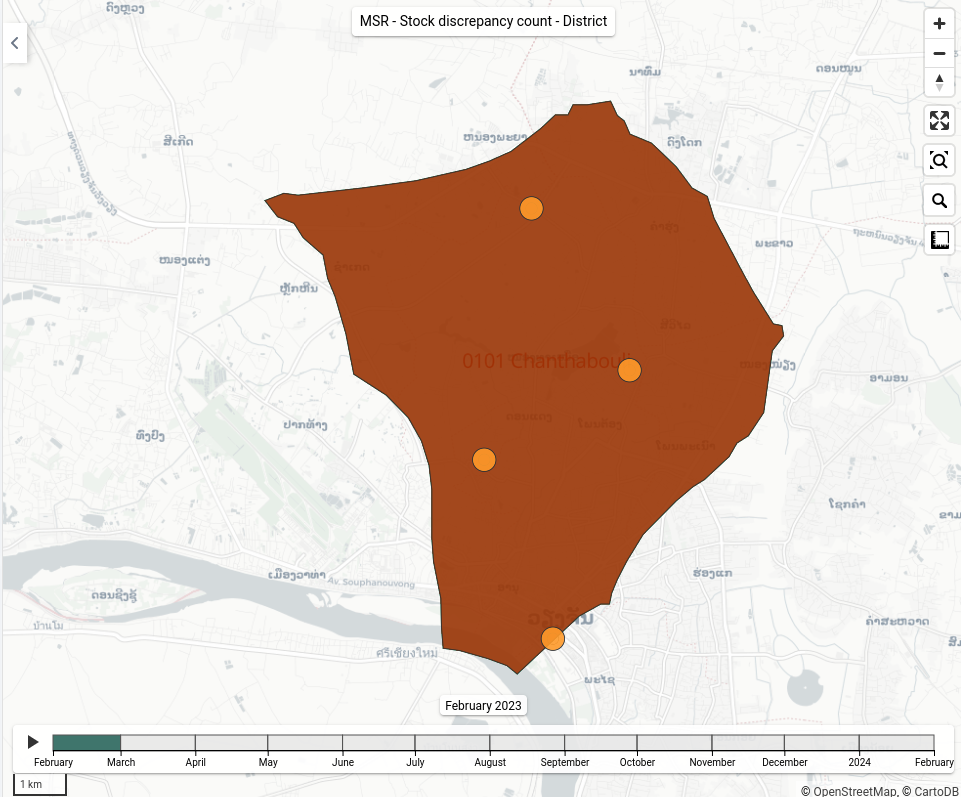
5 MSR - Stockout count - District
Name (*): "MSR - Stockout count - District"
Decription: "This map displays the stockout count for all health facilities in a district with the administrative district boundary on a map as a timeline for the past 12 months."Add layer
1 Stockout count
Data
Item type: "Indicator"
Indicator group: "Stockout count"
Indicator: "Stockout count"
Aggregation type: "By data element"Period
Period type: "Relative"
Period: "Last 12 months"
Display periods: "Timeline"Organisation Units
Selection: "User organisation unit"
Style
Bubble map
High radius: "15"
Colour: select blackAutomatic color legend: tag
Classification: "Equal intervals"
Classes: "5"2 Organisation units
Organisation Units
Selection: "User organisation unit"
Level: "District"Style
Labels: tag (appears as a white tick in a green square)
Size: "20"
Colour: select red
Boundary colour: select preferred colour
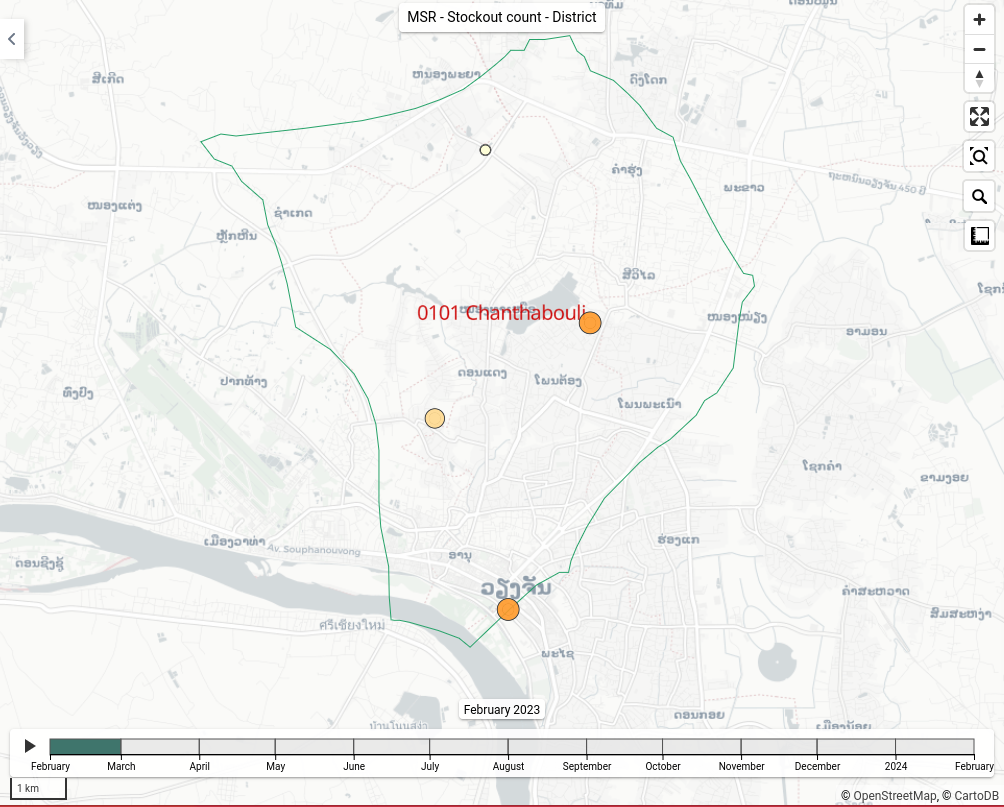
Province level
Statistics
6 MSR - Health facilities - Province
Name (*): "MSR - Health facilities - Province"
Decription: "This map displays the location of all health facilities in a province together with the administrative district boundary on a map."Add layer
1 Facilities
Organisation Units
Selection: "User organisation unit"
Level: "Facility"
Style
LabelsSize: "15"
Colour: select black
Point color: select preferred colour
Point radius: "10"2 Organisation units
Organisation Units
Selection: "User organisation unit"
Level: "District"
Style
Labels: tag (appears as a white tick in a green square)Size: "20"
Colour: select red
Boundary colour: select preferred colour3 Organisation units
Organisation Units
Selection: "User organisation unit"
Level: "Province"
Style
Labels: tag (appears as a white tick in a green square)Size: "20"
Colour: select blue
Boundary colour: select preferred colour
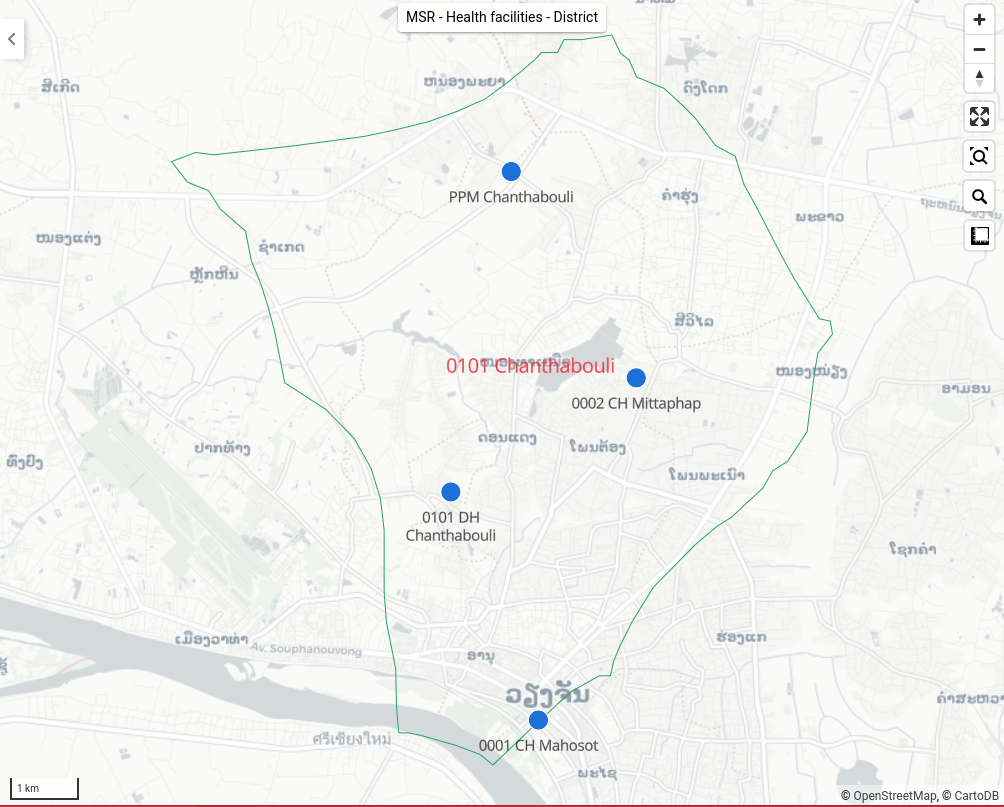
Indicators
7 MSR - Stock availability - Province
Name (*): "MSR - Health facilities - Province"
Decription: "This map displays the stock availability for all health facilities in a province with the administrative district and province boundaries as a timeline for the past 12 months on a map."Add layer
1 Stock availability / %
Data
Item type: "Indicator"
Indicator group: "Stock availability / %"
Indicator: "Stock availability / %"
Aggregation type: "By data element"Period
Period type: "Relative"
Period: "Last 12 months"
Display periods: "Timeline"
Organisation Units
Selection: "User organisation unit"Style
Bubble map
High radius: "15"
Colour: select blackAutomatic color legend: tag
Classification: "Equal intervals"
Classes: "5"2 Organisation units
Organisation Units
Selection: "User organisation unit"
Level: "District"Style
Labels: tag (appears as a white tick in a green square)
Size: "20"
Colour: select red
Boundary colour: select preferred colour3 Organisation units
Organisation Units
Selection: "User organisation unit"
Level: "Province"Style
Labels: tag (appears as a white tick in a green square)
Size: "20"
Colour: select blue
Boundary colour: select preferred colour
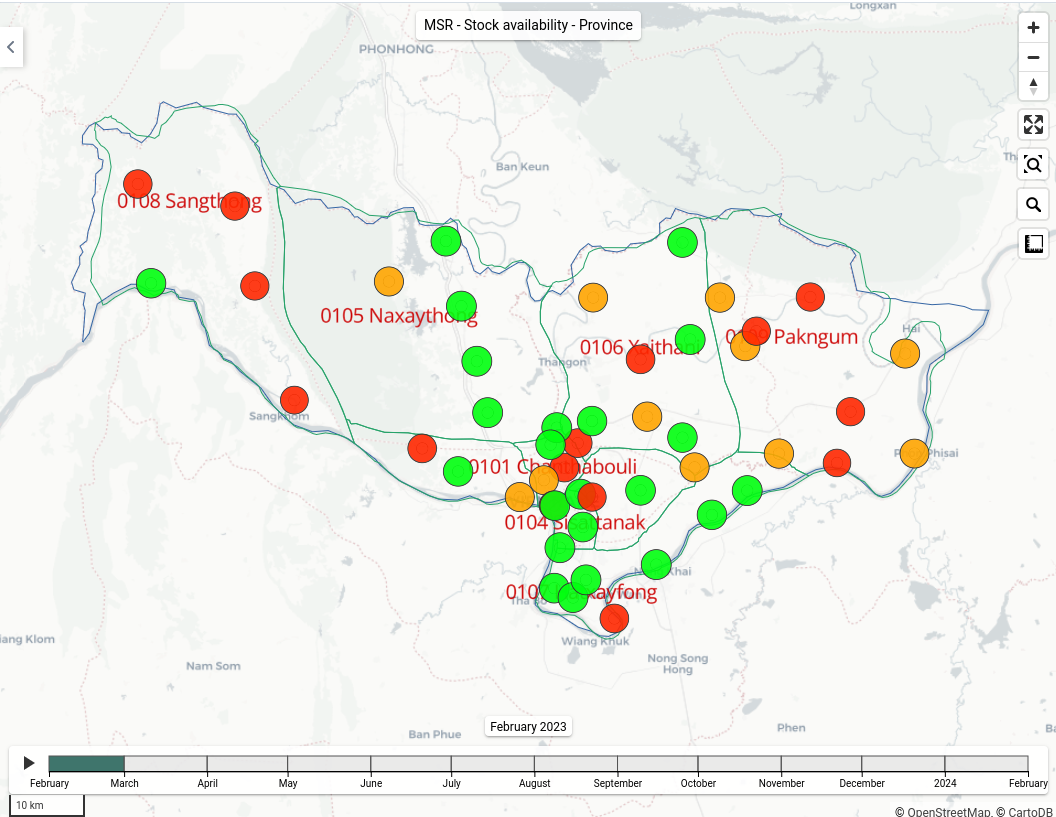
8 MSR - Stock discrepancy count - Province
Name (*): "MSR - Stock discrepancy count - Province"
Decription: "This map displays the stock discrepancy count for all health facilities in a province with the administrative district and province boundaries as a timeline for the past 12 months on a map."Add layer
1 Stock discrepancy count
Data
Item type: "Indicator"
Indicator group: "Stock discrepancy count"
Indicator: "Stock discrepancy count"
Aggregation type: "By data element"Period
Period type: "Relative"
Period: "Last 12 months"
Display periods: "Timeline"Organisation Units
Selection: "User organisation unit"
Style
Bubble map
High radius: "15"
Colour: select blackAutomatic color legend: tag
Classification: "Equal intervals"
Classes: "5"2 Stock discrepancy count
Data
Item type: "Indicator"
Indicator group: "Stock discrepancy count"
Indicator: "Stock discrepancy count"
Aggregation type: "By data element"Period
Period type: "Relative"
Period: "Last 12 months"
Display periods: "Timeline"Organisation Units
Selection: "User organisation unit"
Level: "District"Style
Bubble map
High radius: "15"
Colour: select blackAutomatic color legend: tag
Classification: "Equal intervals"
Classes: "5"3 Organisation units
Organisation Units
Selection: "User organisation unit"
Level: "District"Style
Labels: tag (appears as a white tick in a green square)
Size: "20"
Colour: select red
Boundary colour: select preferred colour4 Organisation units
Organisation Units
Selection: "User organisation unit"
Level: "Province"Style
Labels: tag (appears as a white tick in a green square)
Size: "20"
Colour: select blue
Boundary colour: select preferred colour
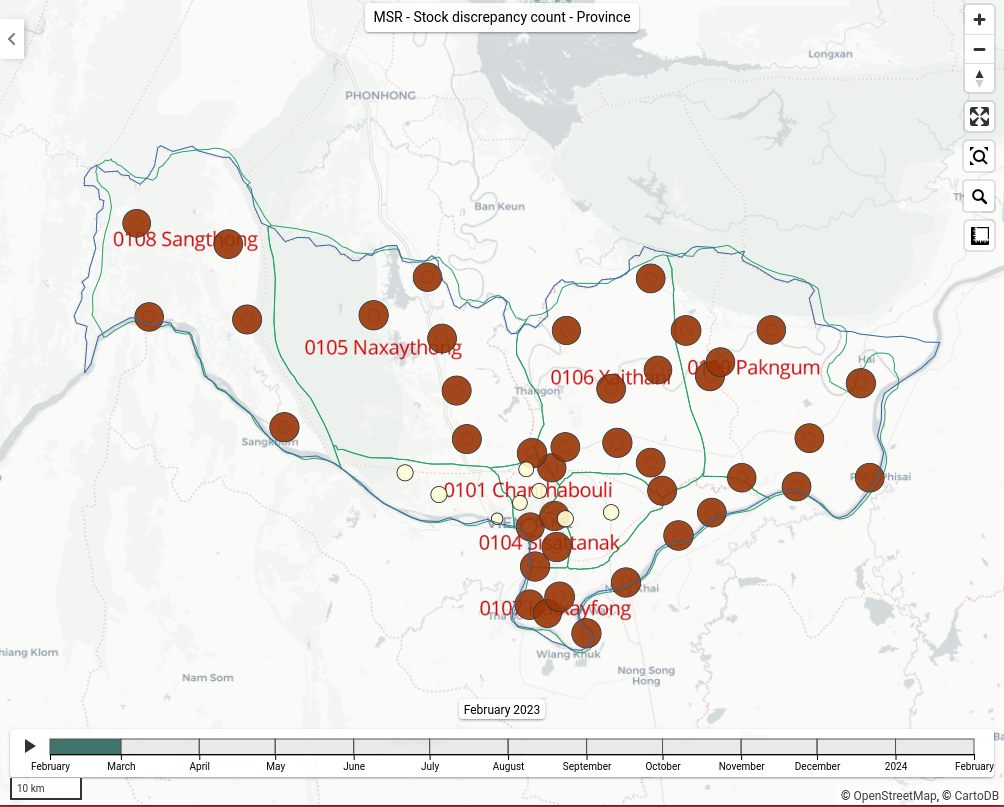
9 MSR - Stockout count - Province
Name (*): "MSR - Stockout count - Province"
Decription: "This map displays the stockout count for all health facilities in a province with the administrative district and province boundaries on a map as a timeline for the past 12 months."
Add layer1 Stockout count
Data
Item type: "Indicator"
Indicator group: "Stockout count"
Indicator: "Stockout count"
Aggregation type: "By data element"Period
Period type: "Relative"
Period: "Last 12 months"
Display periods: "Timeline"Organisation Units
Selection: "User organisation unit"
Style
Bubble map
High radius: "15"
Colour: select blackAutomatic color legend: tag
Classification: "Equal intervals"
Classes: "5"2 Organisation units
Organisation Units
Selection: "User organisation unit"
Level: "District"Style
Labels: tag (appears as a white tick in a green square)
Size: "20"
Colour: select red
Boundary colour: select preferred colour3 Organisation units
Organisation Units
Selection: "User organisation unit"
Level: "Province"Style
Labels: tag (appears as a white tick in a green square)
Size: "20"
Colour: select blue
Boundary colour: select preferred colour
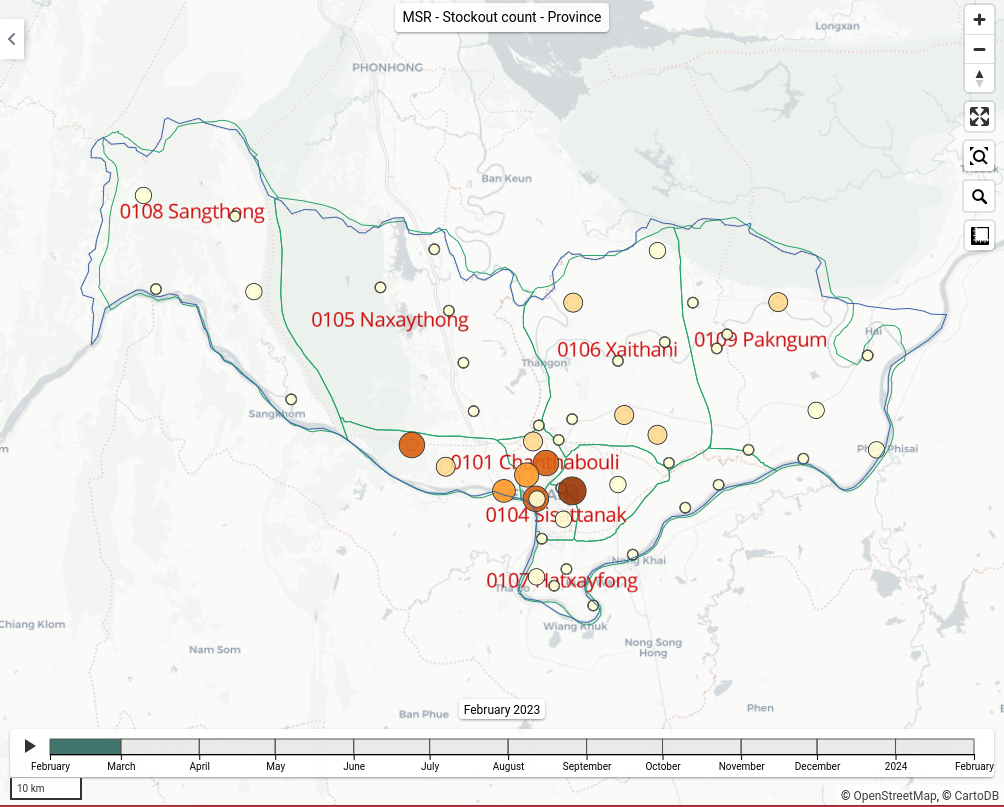
Country level
Statistics
10 MSR - Health facilities - Country
Name (*): "MSR - Health facilities - Country"
Decription: "This map displays the location of all health facilities in a country together with the administrative, district, provincial and national boundaries on a map."Add layer
1 Facilities
Organisation Units
Selection: "User organisation unit"
Level: "Facility"
StyleLabels
Size: "15"
Colour: select blackPoint color: select preferred colour
Point radius: "4"2 Organisation units
Organisation Units
Selection: "User organisation unit"
Level: "District"Style
Labels: tag (appears as a white tick in a green square)
Size: "20"
Colour: select redBoundary colour: select preferred colour
2 Organisation units
Organisation Units
Selection: "User organisation unit"
Level: "Region"Style
Labels: tag (appears as a white tick in a green square)
Size: "20"
Boundary color: select blue
Point radius: "6"
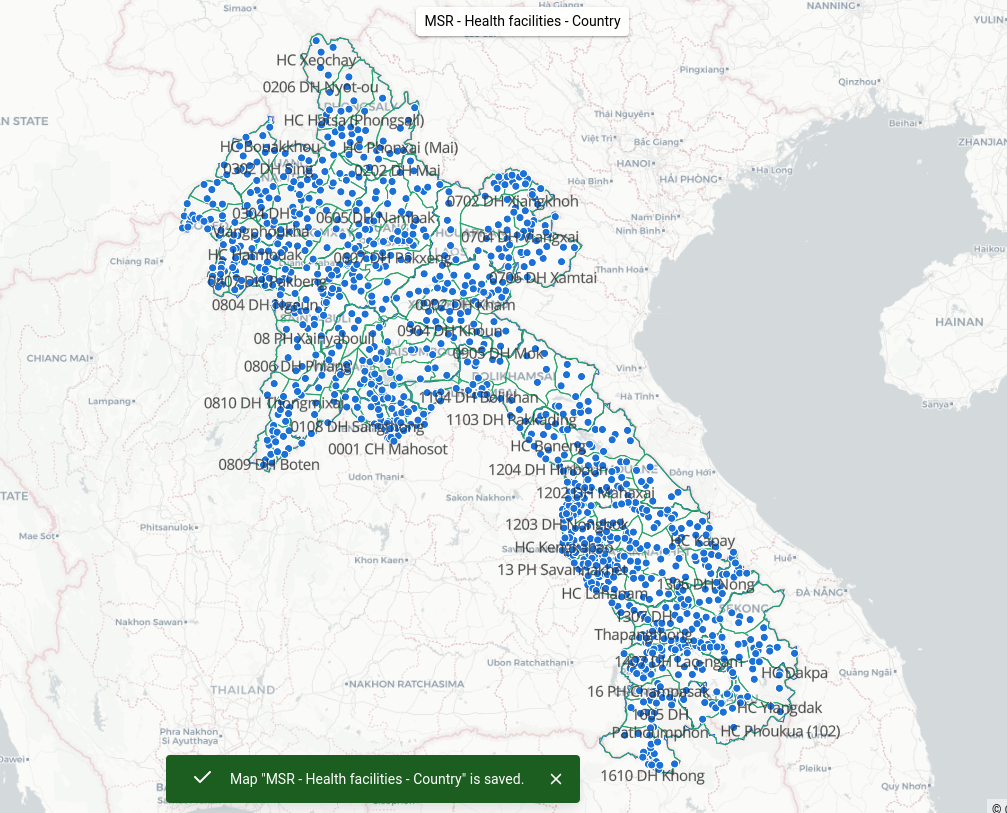
Indicators
11 MSR - Stock availability - Country
Name (*): "MSR - Health facility"
Decription: "This map displays the stock availability for all health facilities in a country with the administrative district and province boundaries as a timeline for the past 12 months on a map."Add layer
1 Stock availability / %
Data
Item type: "Indicator"
Indicator group: "Stock availability / %"
Indicator: "Stock availability / %"
Aggregation type: "By data element"Period
Period type: "Relative"
Period: "Last 12 months"
Display periods: "Timeline"Organisation Units
Selection: "User organisation unit"
Style
Bubble map
High radius: "15"
Colour: select blackAutomatic color legend: tag
Classification: "Equal intervals"
Classes: "5"2 Organisation units
Organisation Units
Selection: "User organisation unit"
Level: "District"Style
Labels: tag (appears as a white tick in a green square)
Size: "20"
Colour: select redBoundary colour: select preferred colour
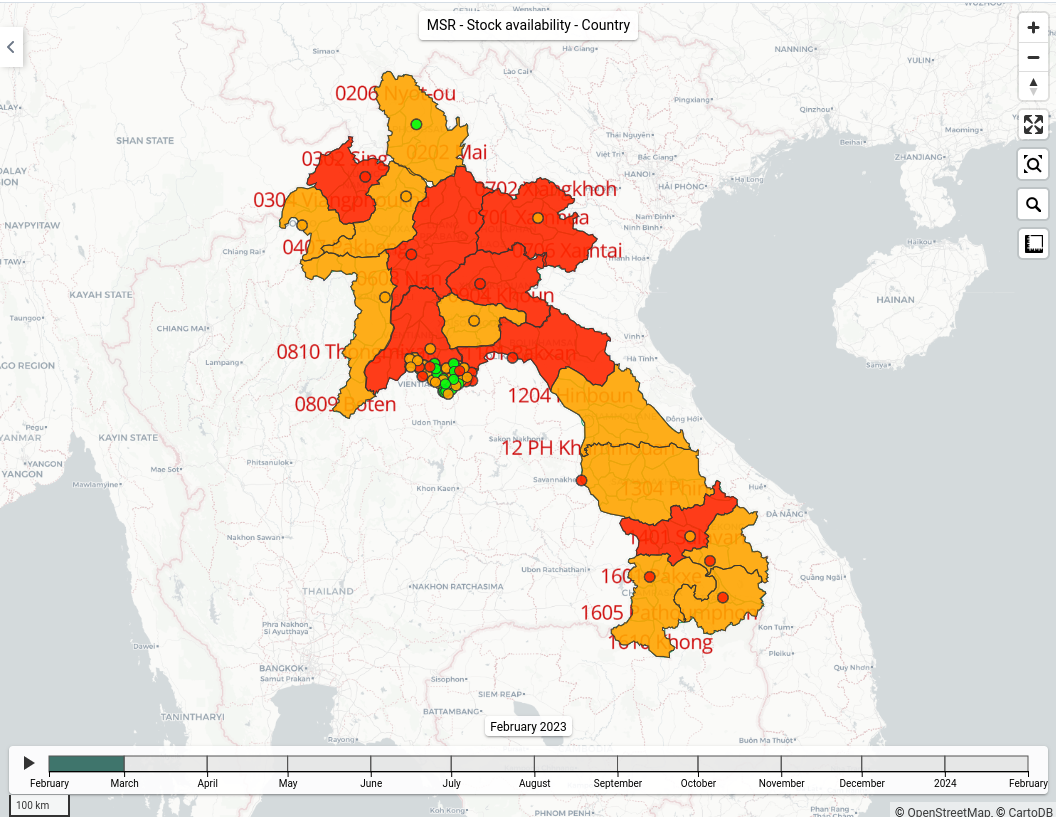
12 MSR - Stock discrepancy count - Country
Name (*): "MSR - Stock discrepancy count - Country"
Decription: "This map displays the stock discrepancy count for all health facilities in a district with the administrative district and province boundaries as a timeline for the past 12 months on a map."Add layer
1 Stock discrepancy count
Data
Item type: "Indicator"
Indicator group: "Stock discrepancy count"
Indicator: "Stock discrepancy count"
Aggregation type: "By data element"Period
Period type: "Relative"
Period: "Last 12 months"
Display periods: "Timeline"2 Stock discrepancy count
Data
Item type: "Indicator"
Indicator group: "Stock discrepancy count"
Indicator: "Stock discrepancy count"
Aggregation type: "By data element"Period
Period type: "Relative"
Period: "Last 12 months"
Display periods: "Timeline"3 Organisation units
Organisation Units
Selection: "User organisation unit"
Level: "Region"Style
Boundary colour: select blue
Point radius: "6"4 Organisation units
Organisation Units
Selection: "User organisation unit"
Level: "District"Style
Labels: tag (appears as a white tick in a green square)
Size: "20"
Colour: select redBoundary colour: select preferred colour
Point radius: "6"
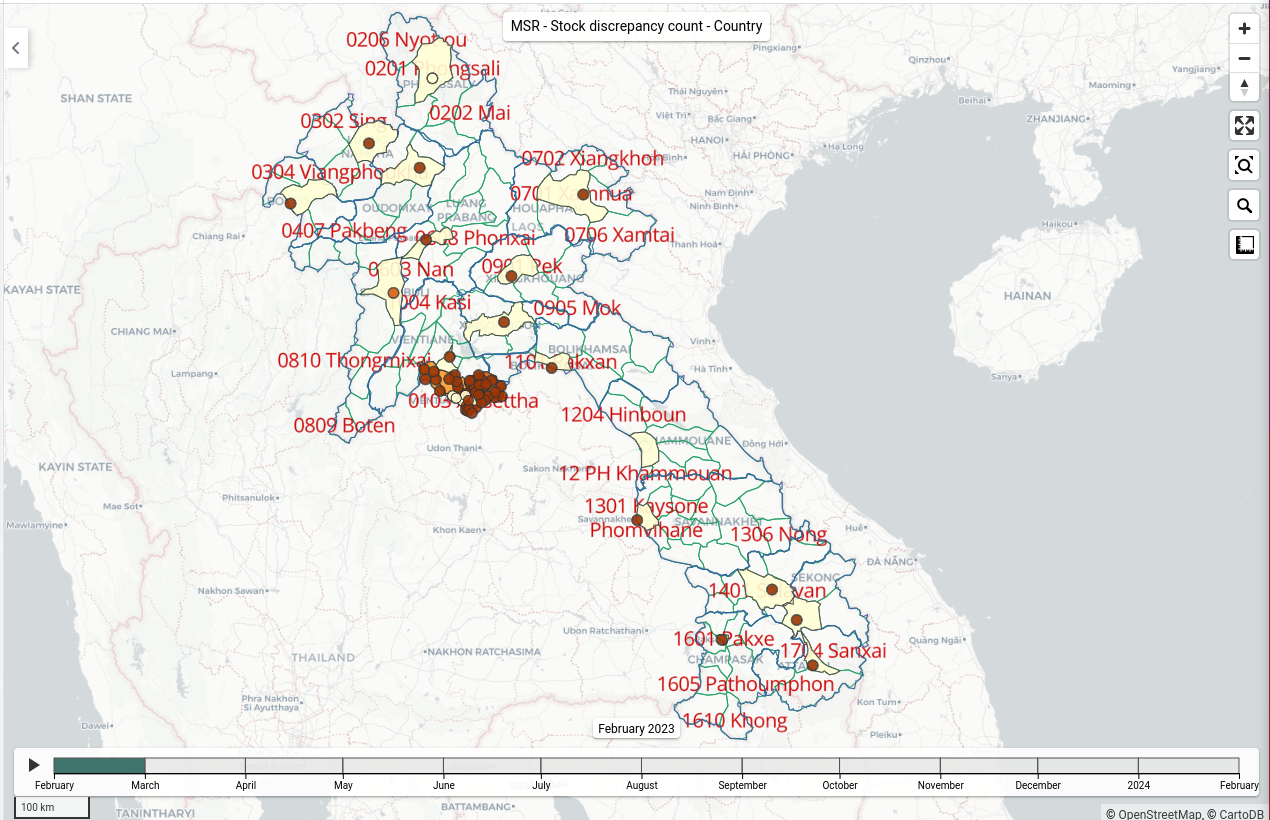
13 MSR - Stockout count - Country
Name (*): "MSR - Stockout count - Country"
Decription: "This map displays the stockout count for all health facilities and by provinces in a country with the administrative district and province boundaries on a map as a timeline for the past 12 months."Add layer
1 Stockout count
Data
Item type: "Indicator"
Indicator group: "Stockout count - MSR"
Indicator: "Stockout count"
Aggregation type: "By data element"Period
Period type: "Relative"
Period: "Last 12 months"
Display periods: "Timeline"Organisation Units
Selection: "User organisation unit"
Level: "Facility"Style
Bubble map
High radius: "5"
Automatic color legend: tag
Classification: "Equal intervals"
Classes: "5"2 Stockout count
Data
Item type: "Indicator"
Indicator group: "Stockout discrepancy - MSR"
Indicator: "Stockout discrepancy count"
Aggregation type: "By data element"Period
Period type: "Relative"
Period: "Last 12 months"
Display periods: "Timeline"Organisation Units
Selection: "User organisation unit"
Level: "Region"Style
Choropletz map
Low radius: "5"
Automatic color legend: tag
Classification: "Equal intervals"
Classes: "5"3 Organisation units
Organisation Units
Selection: "User organisation unit"
Level: "District"Style
Labels: tag (appears as a white tick in a green square)
Size: "20"
Colour: select redBoundary colour: select preferred colour
4 Organisation units
Organisation Units
Selection: "User organisation unit"
Level: "Province"Style
Labels: tag (appears as a white tick in a green square)
Size: "20"
Colour: select redBoundary colour: select preferred colour
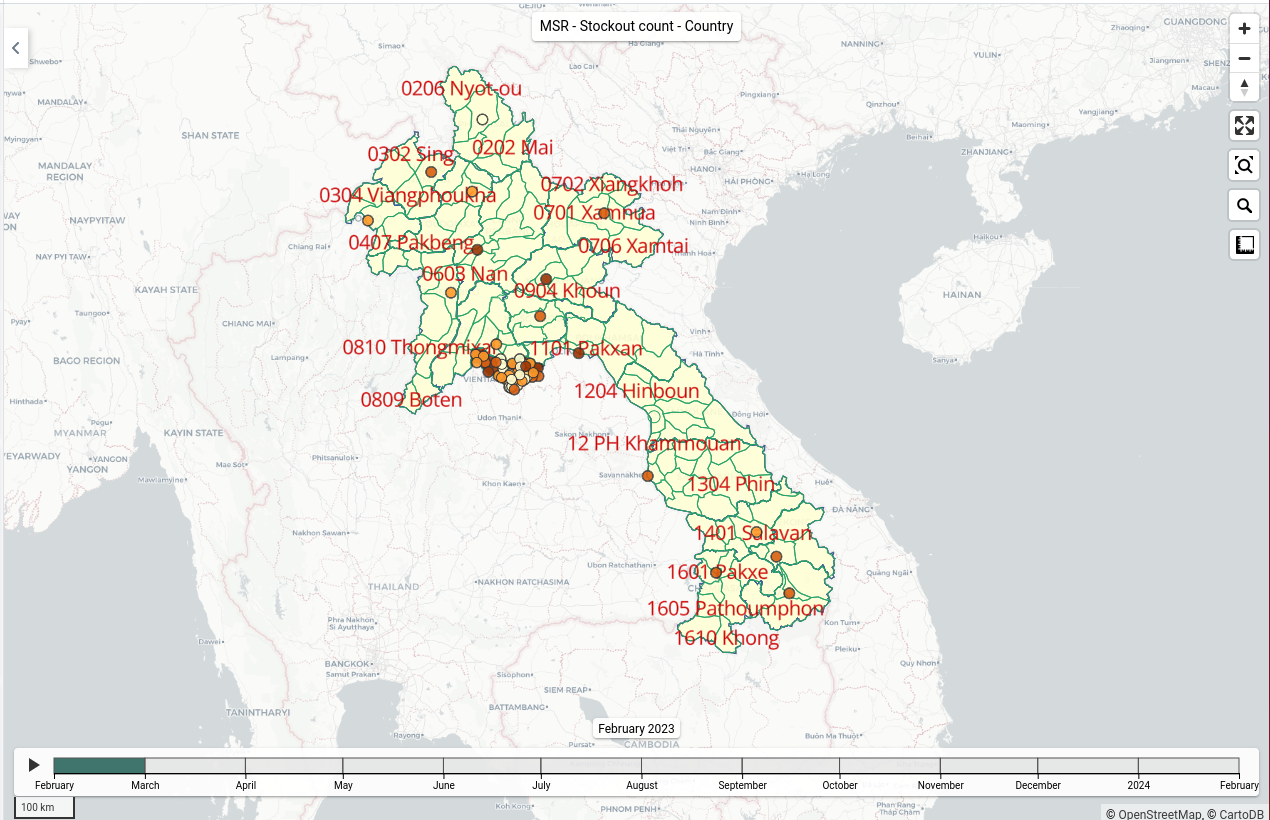
Dashboard App - Analytics
1 Health facility level
- 1 MSR - Visualization library - Health facility level
- 2 MSR - Health facility level - Analytics
2 District level
- 3 MSR - Visualization library - District level
- 4 MSR - District level - Analytics
3 Regional level
- 5 MSR - Visualization library - Province level
- 6 MSR - Regional level - Analytics
4 National level
- 7 MSR - Visualization library - Country level
- 8 MSR - Country level - Analytics
5 Thematic dashboards
- Essential LMIS KPIs
- Xx
Health facility level
1 MSR - Visualization library - Health facility level
Dashboard title: "MSR - Visualization library - Health facility level"
Dashboard description: "Library of all available LMIS visualizations for the health facility level in the order of their documentation. These are intended for immediate use or adapting to national policies and requirements."
Search for visualizations, reports and more
- MSR - Stock receipt - Pivot table
- MSR - Stock distribution - Pivot table
- MSR - Stock redistribution - Pivot table
- MSR - Stock discard - Pivot table
- MSR - Stock on hand - Pivot table
- MSR - Stock correction - Pivot table
- MSR - Stock report complete - Pivot table - Last 3 months
- MSR - Stock report complete - Pivot table - Last 12 months
- MSR - Stock report complete - Column chart
- MSR - Coefficient of Variation x 10 - Pivot table
- MSR - Coefficient of Variation x 10 - Stacked bar chart
- MSR - Coefficient of Variation x 10 - Column chart
- MSR - Coefficient of Variation x 10 distribution - Pivot table
- MSR - Coefficient of Variation x 10 distribution - Stacked Column chart
- MSR - Coefficient of Variation x 10 distribution - Column chart
- MSR - Stock availability - Pivot table
- MSR - Stock availability - Column chart
- MSR - Stock availability - Single value chart
- MSR - Stock availability - Gauge chart
- MSR - Stockout rate - Column chart
- MSR - Stock availability and stockout rate - Stacked column chart
- MSR - Stockouts - Stacked column chart
- MSR - Stockout count - Pivot table
- MSR - Stockout count - Column chart
- MSR - Stockout count - Single value chart
- MSR - Stockout duration - Pivot table
- MSR - Stockout duration - Bar chart
- MSR - Stock coverage time - Pivot table
- MSR - Stock coverage time distribution - Pivot table
- MSR - Stock coverage time distribution - Column chart - Last 12 months
- MSR - Stock coverage time distribution - Column chart - Last month
- MSR - Stock coverage time categories - Column chart
- MSR - Stock coverage time categories - Stacked column chart
- MSR - Stock discrepancy - Pivot table
- MSR - Stock discrepancy count - Column chart
- MSR - Stock discrepancy count - Single value chart
- MSR - Stock discrepancy count - Percentage - Column chart
- MSR - Report completeness - Pivot table chart
- MSR - Report completeness - Line chart
- MSR - Reporting rate - Single value chart
- MSR - Reporting rate on time - Single value chart
2 MSR - Health facility level - Analytics
Dashboard title: "MSR - Monthly Stock Reporting - Health facility level"
Dashboard description: "This dashboard presents a selection of the DHIS2-LMIS Visualization library - MSR - Health facility level and is intended as a suggestion for customizing dashboards to national policies and requirements."
Search for visualizations, reports and more
- MSR - Stock availability - Single value chart
- MSR - Stock availability - Bar chart
- MSR - Stockout count - Single value chart
- MSR - Health facility
- MSR - Stockouts - Stacked column chart
- MSR - Stockout duration - Bar chart
- MSR - Stock coverage time distribution - Last month - Column chart
- MSR - Coefficient of Variation x 10 - Bar chart
- MSR - Stock report complete - Last 3 months - Pivot table
- MSR - Stock discrepancy count - Column chart
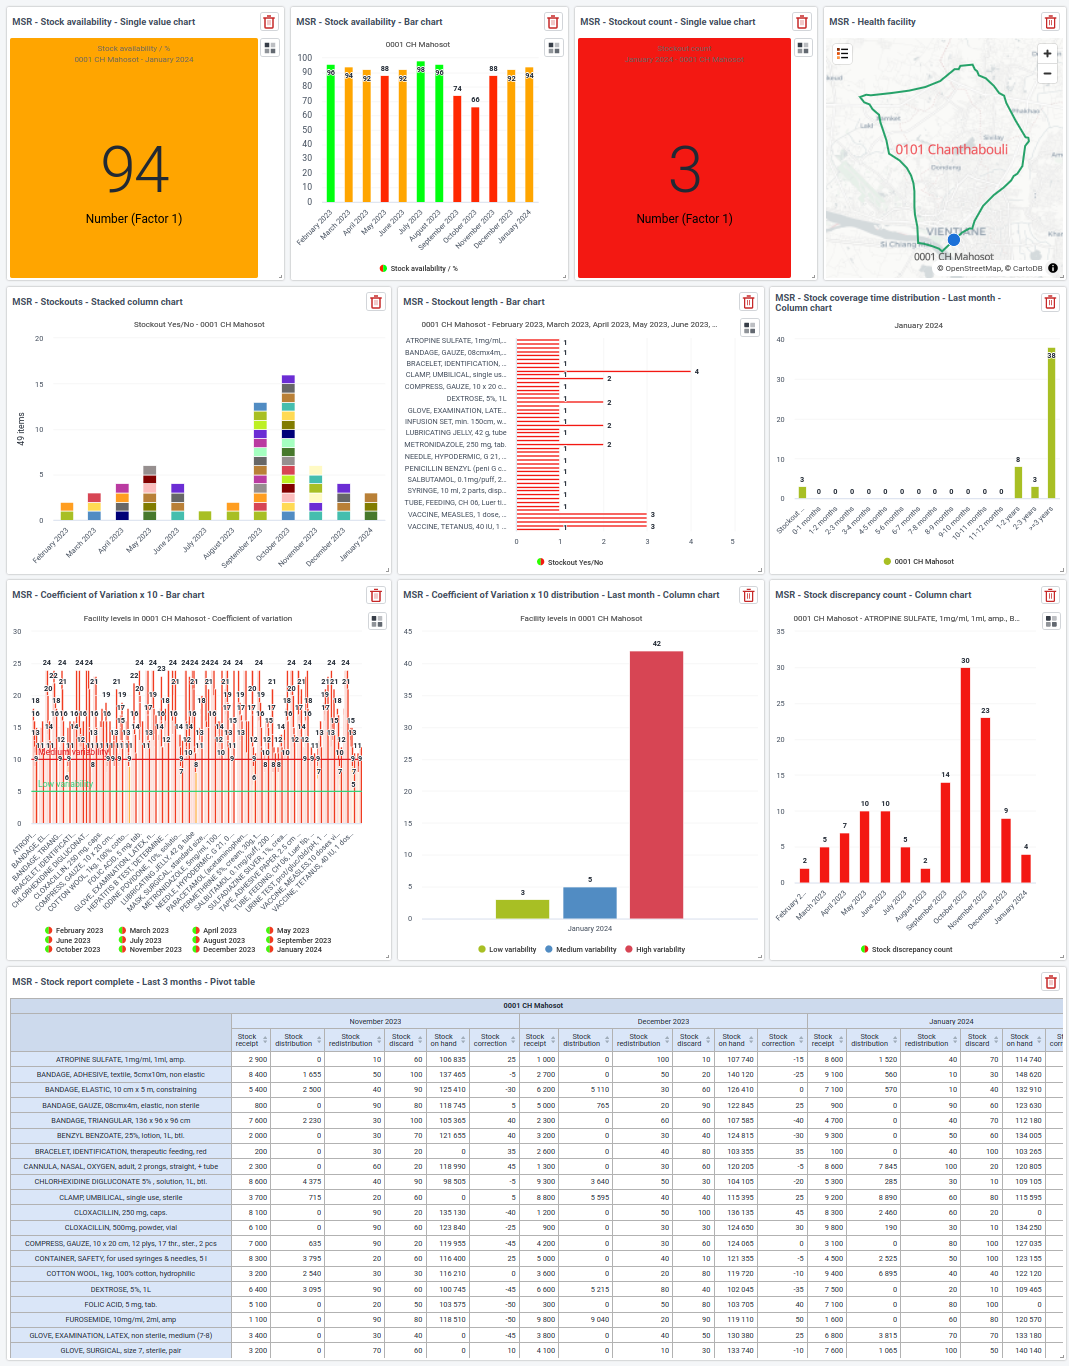
District level
3 MSR - Visualization library - District level
Dashboard title: "MSR - Visualization library - District level"
Dashboard description: "Library of all available LMIS visualizations for the district in the order of their documentation. These are intended for immediate use or adapting to national policies and requirements."
Search for visualizations, reports and more
- MSR - Stock receipt - District - Pivot table
- MSR - Stock distribution - District - Pivot table
- MSR - Stock redistribution - District - Pivot table
- MSR - Stock discard - District - Pivot table
- MSR - Stock on hand - District - Pivot table
- MSR - Stock correction - District - Pivot table
- MSR - Stock report complete - District - Pivot table
- MSR - Coefficient of Variation x 10 - District - Pivot table
- MSR - Coefficient of Variation x 10 - District - Stacked bar chart
- MSR - Coefficient of Variation x 10 - District - Column chart
- MSR - Coefficient of Variation x 10 distribution - District - Pivot table
- MSR - Coefficient of Variation x 10 distribution - District - Stacked Column chart
- MSR - Coefficient of Variation x 10 distribution - District - Column chart
- MSR - Stock availability - District - Pivot table
- MSR - Stock availability - District - Column chart - Last 12 months
- MSR - Stock availability - District - Column chart - Last month
- MSR - Stockout rate / % - District - Column chart
- MSR - Stock availability and stockout rate - District - Stacked column chart
- MSR - Stockouts - District - Pivot table
- MSR - Stockout count - District - Pivot table
- MSR - Stockout count - District - Column chart
- MSR - Stockout count - District - Single value chart
- MSR - Stockout duration - District - Pivot table
- MSR - Stockout duration - District - Stacked bar chart
- MSR - Stock coverage time - District - Pivot table
- MSR - Stock coverage time distribution - District - Pivot table
- MSR - Stock coverage time distribution - District - Stacked column chart- Last 12 months
- MSR - Stock coverage time distribution - District - Stacked column chart - Last month
- MSR - Stock coverage time categories - District - Last month
- MSR - Stock coverage time categories - District - Last 12 months
- MSR - Stock discrepancy - District - Pivot table
- MSR - Stock discrepancy count - District - Stacked column chart
- MSR - Stock discrepancy count - District - Single value chart
- MSR - Report completeness - District - Pivot table chart
- MSR - Reporting rate - District - Column chart
- MSR - Reporting rate - District - Single value chart
- MSR - Reporting rate on time - District - Single value chart
- MSR - Health facilities - District
- MSR - Stock availability - District
- MSR - Stock discrepancy count - District
- MSR - Stockout count - District
4 MSR - District level - Analytics
Dashboard title: "MSR - District level - Analytics"
Dashboard description: "This dashboard presents a selection of the MSR - Visualization library - District level and is intended as a suggestion for customizing dashboards to national policies and requirements."
Search for visualizations, reports and more
- MSR - Stockout count - District - Single value chart
- MSR - Stock availability - District - Column chart
- MSR - Stock coverage time distribution - Last month - District - Stacked column chart
- MSR - Health facilities - District
- MSR - Stock availability- District
- MSR - Stock discrepancy count - District
- MSR - Stockout count - District
- MSR - Stock availability - District - Bar chart
- MSR - Stockout count - District - Column chart
- MSR - Stockout duration - District - Stacked bar chart
- MSR - Stock coverage time distribution - Last 12 months - District - Stacked column chart
- MSR - Coefficient of Variation x 10 - District - Stacked bar chart
- MSR - Coefficient of Variation x 10 distribution - Last month - District - Column chart
- MSR - Coefficient of Variation x 10 - District - Stacked bar chart
- MSR - Stock report complete - District - Pivot table - Last 3 months
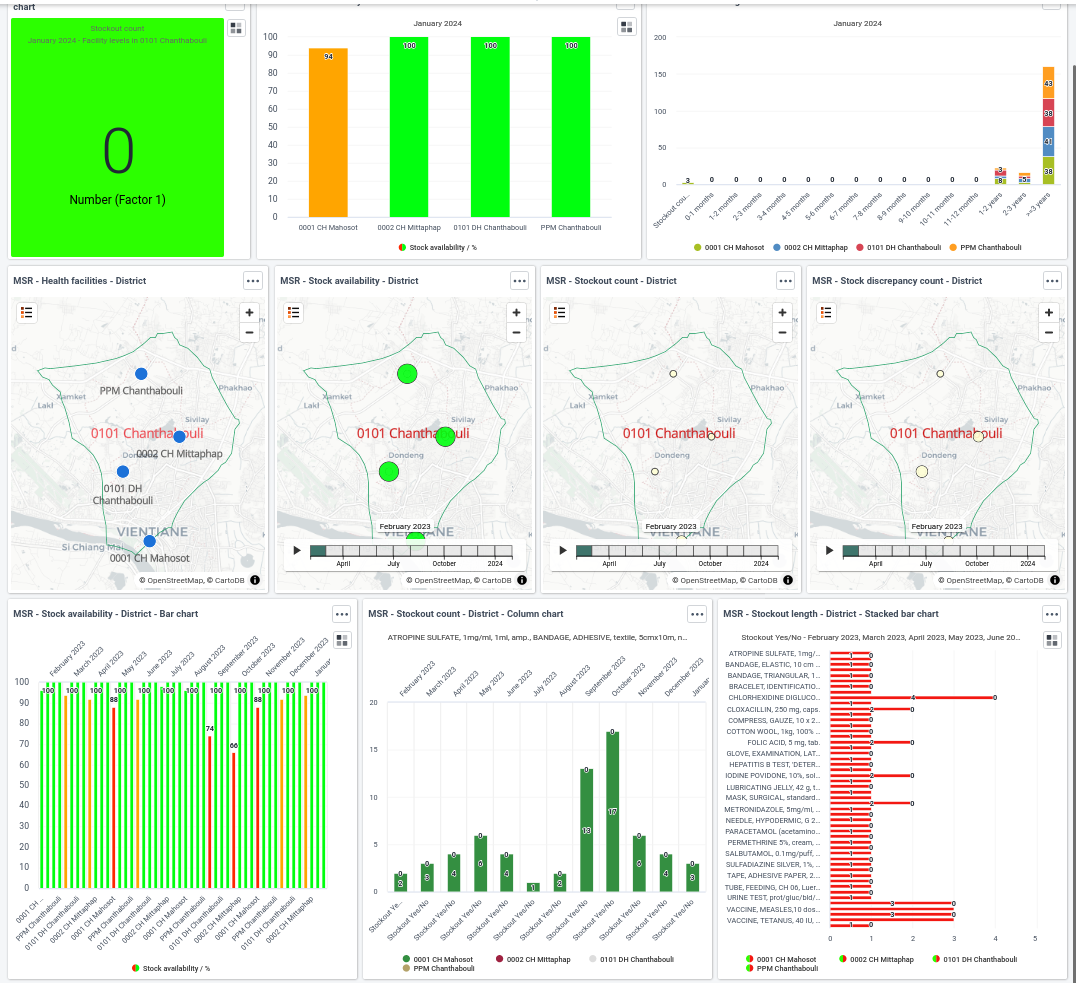
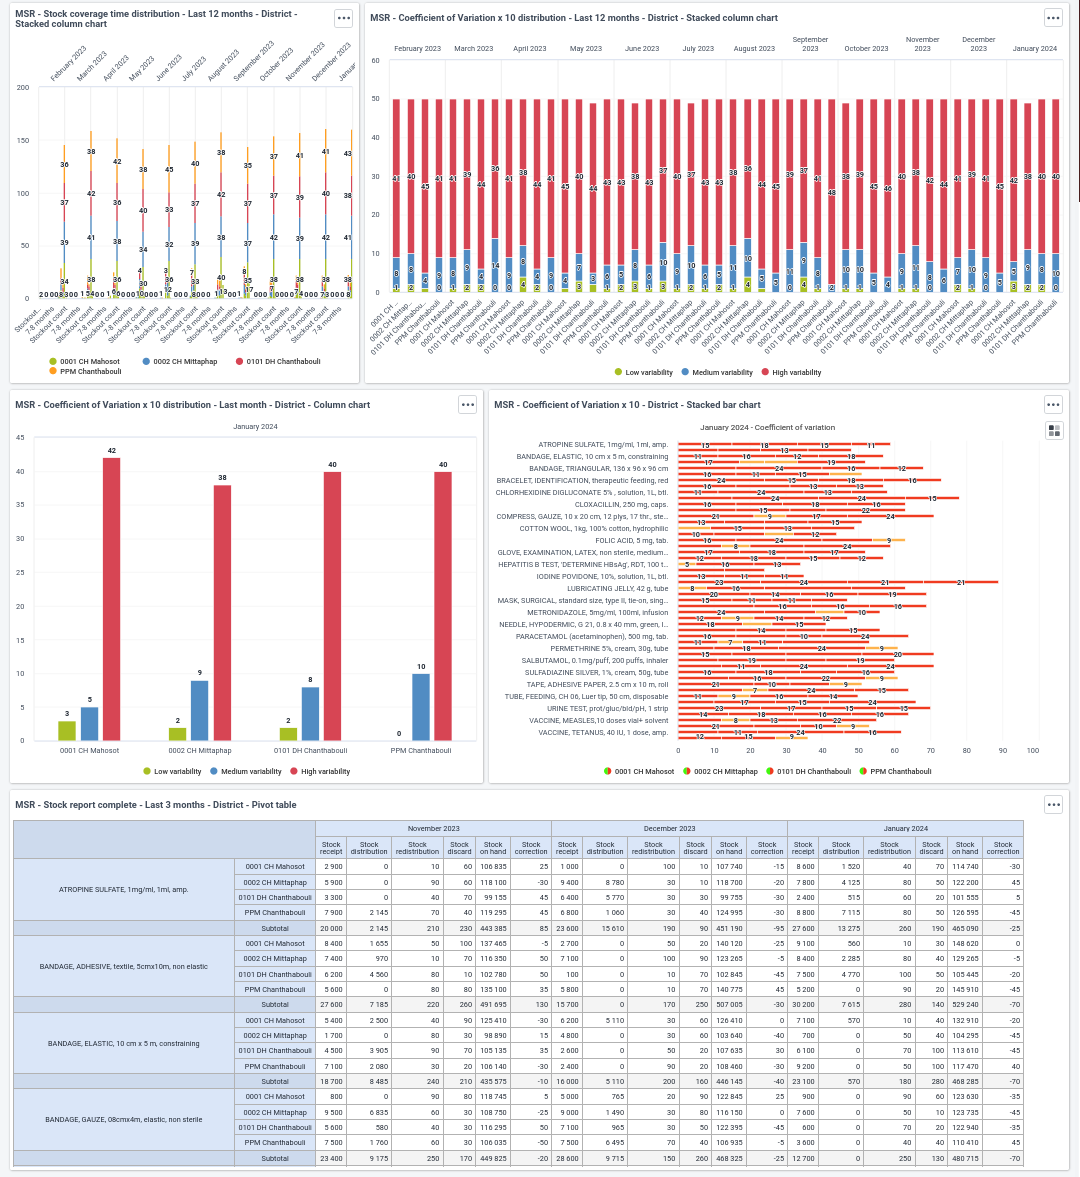
Province level
5 MSR - Visualization library - Province level
Dashboard title: "MSR - Visualization library - Province level"
Dashboard description: "Library of all available LMIS visualizations for the province in the order of their documentation. These are intended for immediate use or adapting to national policies and requirements."
Search for visualizations, reports and more
- MSR - Stock receipt - Province
- MSR - Stock distribution - Province
- MSR - Stock redistribution - Province
- MSR - Stock discard - Province
- MSR - Stock on hand - Province
- MSR - Stock correction - Province
- MSR - Stock report complete - Province
- MSR - Coefficient of Variation x 10 - Province
- MSR - Coefficient of Variation x 10 distribution - Province
- MSR - Coefficient of Variation x 10 distribution - Province
- MSR - Coefficient of Variation x 10 distribution - Province
- MSR - Stock availability - Province
- MSR - Stock availability - Province
- MSR - Stockout rate / % - Province
- MSR - Stock availability and stockout rate - Province
- MSR - Stockouts - Province
- MSR - Stockout count - Province
- MSR - Stockout count - Province
- MSR - Stockout count - Province
- MSR - Stockout duration - Province
- MSR - Stockout duration - Province
- MSR - Stock coverage time - Province
- MSR - Stock coverage time distribution- Province
- MSR - Stock coverage time categories - Province
- MSR - Stock coverage time categories - Province
- MSR - Stock discrepancy - Province
- MSR - Stock discrepancy count - Province
- MSR - Stock discrepancy count - Province
- MSR - Report completeness - Province
- MSR - Reporting rate - Province
- MSR - Reporting rate on time - Province
- MSR - Health facilities - Province
- MSR - Stock availability- Province
- MSR - Stock discrepancy count - Province
- MSR - Stockout count - Province
6 MSR - Regional level Analytics
National level
7 MSR - Visualization library - Country level
Dashboard title: "MSR - Visualization library - Country level"
Dashboard description: "Library of all available LMIS visualizations for the country in the order of their documentation. These are intended for immediate use or adapting to national policies and requirements."
Search for visualizations, reports and more
- MSR - Stock receipt - Country
- MSR - Stock distribution - Country
- MSR - Stock redistribution - Country
- MSR - Stock discard - Country
- MSR - Stock on hand - Country
- MSR - Stock correction - Country
- MSR - Stock report complete - Country
- MSR - Coefficient of Variation x 10 distribution - Country
- MSR - Coefficient of Variation x 10 distribution - Country
- MSR - Coefficient of Variation x 10 distribution - Country
- MSR - Stock availability - Country
- MSR - Stock availability - Country
- MSR - Stockout rate / % - Country
- MSR - Stock availability and stockout rate - Country
- MSR - Stockouts - Country
- MSR - Stockout count - Country
- MSR - Stockout count - Country
- MSR - Stockout count - Country
- MSR - Stockout duration - Country
- MSR - Stockout duration - Country
- MSR - Stock coverage time distribution - Country
- MSR - Stock coverage time distribution- Country
- MSR - Stock coverage time categories - Country
- MSR - Stock coverage time categories - Country
- MSR - Stock discrepancy count - Country
- MSR - Stock discrepancy count - Country
- MSR - Report completeness - Country
- MSR - Reporting rate - Country
- MSR - Reporting rate on time - Country