Neglected Tropical Diseases Overarching Module - System Design Guide
Background and Purpose
The NTD - Neglected Tropical Diseases overarching module provides an overview of the design principles and guidelines used to develop a comprehensive digital data package for routine reporting on neglected tropical diseases (NTDs) within countries' health management information systems (HMIS). This document is intended for use by DHIS2 implementers at the country and regional levels to facilitate the implementation and localization of the module. The NTD metadata package can be adapted to align with local needs and national guidelines, ensuring that specific local workflows and regulations are considered in the adoption and adaptation of the programs included in this package.
The datasets incorporated in this module are based on WHO recommendations and best practices or established reporting frameworks for NTD surveillance and control WHO, 2023. These datasets will often need to be adjusted to fit national reporting systems. This adjustment might involve adding important local variables or omitting information that is not captured at the clinical level.
The NTD Neglected Tropical Diseases overarching module supports global and national efforts in monitoring, controlling, and ultimately eliminating NTDs. By utilising standardised data collection and reporting frameworks, countries can better track their progress against the targets in the WHO's 2021-2030 road map for NTDs. This strategic document aims to reduce the number of people requiring interventions for NTDs by 90% and achieve significant reductions in disease-related morbidity and mortality by 2030 World Health Organization WHO, 2021
System Design Overview
Package Structure
The NTD toolkit includes different data sets that can be used at any given time based on local needs.
| Dataset | Periodicity | Description |
|---|---|---|
| NTD - Neglected Tropical Diseases | Monthly | Overarching module encompassing the full list of 29 NTDs. It contains the core data points for the surveillance at health facility level - cases (suspected, probable, confirmed), rumors, deaths, and treatments. |
| NTD - Human Resources | Quarterly | It contains the information relevant to monitor the staff and their trainings. |
| NTD - Stock | Monthly | Standard LMIS module available for the collection of NTD-related medical items. |
Intended users
- Health facility users: capture and report key data on malaria activities
- Program managers: managers at national and sub-national level may be responsible for supporting data entry and analysis.
- National and local health authorities: to monitor and analyze the surveillance of data through dashboards and analytics tools, to conduct risk assessments and plan response measures; to generate reports for regional and global reporting
Data Set - NTD - Neglected Tropical Diseases
The NTD overarching module is structured in 29 sections, one per disease. All sections have a flat structure and are disaggregated by sex (male and female) and by Global NTD Annual Reporting Form (GNARF) age groups (less than 1y, 1 -4y, 5-14y, 15-24y, 25-49y, 50-64y, 65+ years).
The dataset is designed for the reporting of diseases at the point of care (health facility level).
The diseases and conditions included in this module are:
| Disease | Abbreviations throughout the toolkit |
|---|---|
| Buruli ulcer | BUR |
| Chagas disease | CHA |
| Chikungunya | CHI |
| Chromoblastomycoses | CHR |
| Sporotrichosis | SPO |
| Paracoccidioidomycosis | PAR |
| Dengue & severe dengue | DEN |
| Dracunculiasis (Guinea worm disease) | DRA |
| Cystic echinococcosis | CYS |
| Foodborne trematodes | FOO |
| Human African Trypanosomiasis (gambiense) - gHAT | HAG |
| Human African Trypanosomiasis (rhodesiense) - rHAT | HAR |
| Leishmaniasis (cutaneous) - CL | LEI |
| Leishmaniasis (mucocutaneous) - ML | MCL |
| Leishmaniasis (visceral) - VL | LEV |
| Leprosy | LEP |
| Lymphatic filariasis | FIL |
| Mycetoma | MYC |
| Noma | NOM |
| Onchocerciasis | ONC |
| Rabies | RAB |
| Scabies | SCA |
| Schistosomiasis | SCH |
| Snakebite envenoming | SNK |
| Soil-transmitted helminthiasis | STH |
| Taeniasis and cysticercosis | TAE |
| Trachoma | TRA |
| Tungiasis | TUN |
| Yaws | YAW |
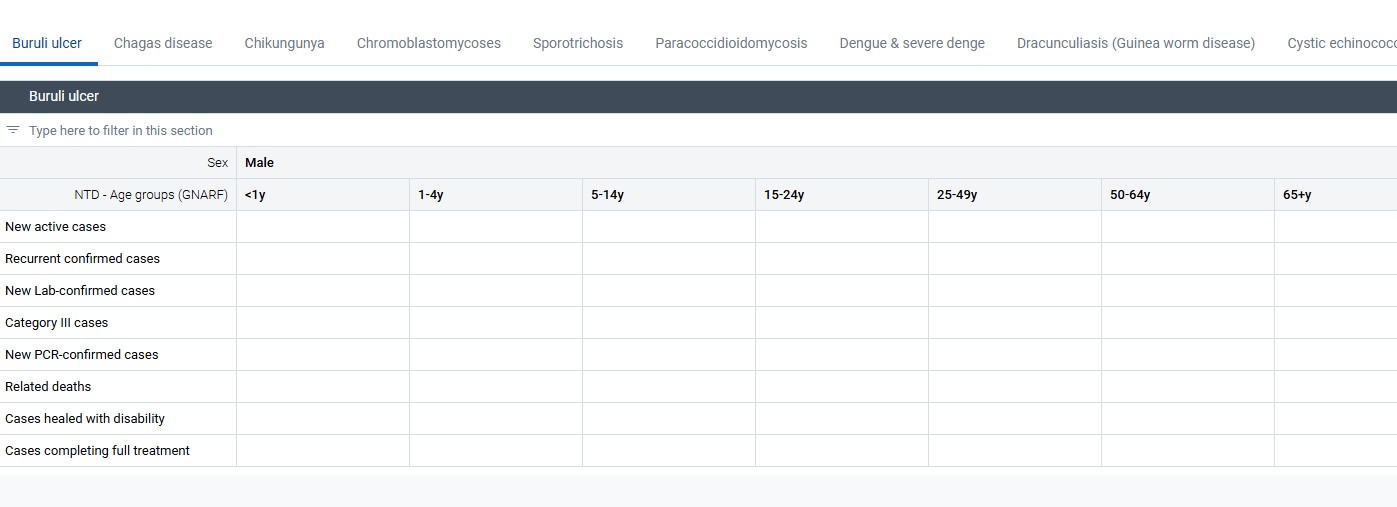
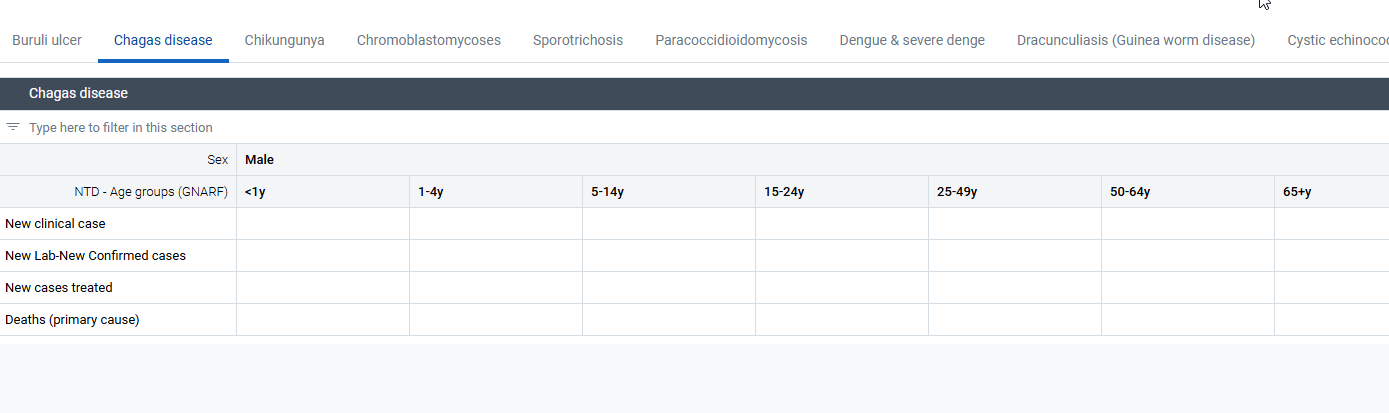
This design guide reports the first two sections (Buruli ulcer and Chagas disease) of the module as examples of the structure. The full dataset is available in the HMIS Demo.
Buruli ulcer Section
The section covers the core surveillance component for the disease based on the Global NTD Annual Reporting Form for the reporting of essential data, progress and activities related to BUR control and elimination efforts within a given country.
Chagas Disease Section
Data Set - NTD Human Resources
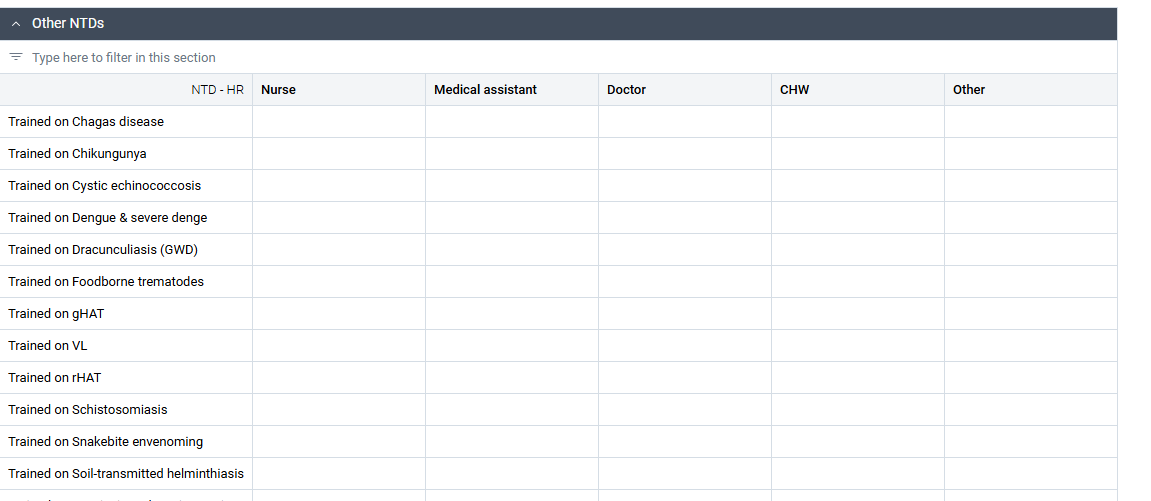
The HR dataset is divided into 3 sections: one to provide the total number of staff hired at the point of care (if assigned at the health facility level) or within a specific zone (if assigned at DIstrict or higher levels); one to count the number of staff who received training in the management of skin-related NTDs, and one to monitor the training received on other non-skin related NTDs.
All the sections are disaggregated into occupational categories - Nurse, medical assistant, doctor, CHW, and others. Implementers should adapt this disaggregation according to the local needs and available profiles.

For more information on how to triangulate HR data or how to integrate it into other relevant modules like the Health facility attributes (HFA), please refer to the Special Considerations chapter of this guide.
Population-based Data Elements
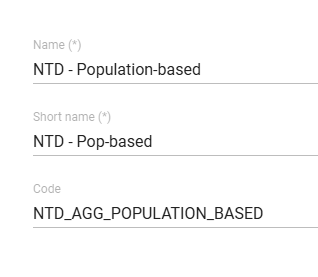
In addition to the data elements (DEs) found in the datasets, there are several DEs that are not part of the NTD dataset, but are grouped under a data element group (DEG) called "NTD - Population-Based".
These DEs are disease-specific but are not monitored specifically at the health facility level like those in the NTD Neglected Tropical Diseases Dataset. Instead, they have been isolated for the implementers and MoH/Disease Programme to evaluate their needs, feasibility, and the best way to include them in their reporting flows. This consideration should take into account existing modules and data points at the district level, ensuring a comprehensive and integrated approach to NTD surveillance and reporting.
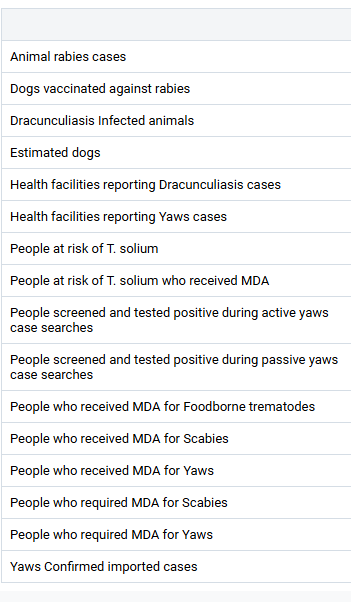
The DEs in this DEG have been grouped in a dataset called ”NTD - Population-based” and assigned at district level in the Demo instance.
Dataset - NTD - Stock
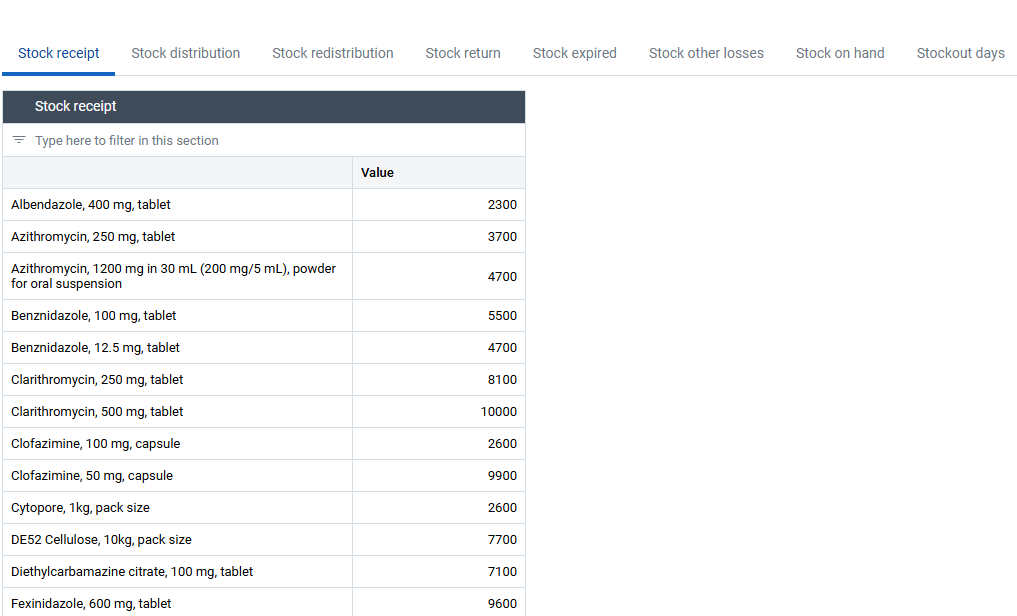
A Data set for collecting, storing, sharing and analysing essential logistics data is included in the module to allow the management of health and logistics data in a single tool. This Data set is based on a standardised logistics template which is (also) suitable for any other type of healthcare goods used by community health workers, health centres, vaccination centres or hospitals. However, if needed, additional stock data can easily be added to the Data set.
This dataset is mainly intended for use at the health facility (level). It will, ideally, be integrated with an upstream, national eLMIS (electronic logistics management information system) to provide end-to-end visibility of all logistics data. The Data entry form has been designed for storekeepers and health workers in charge of managing facility-level stocks and allows for collecting essential logistics data on mobile devices (tablet computers, mobile phones etc.), notebooks or desktop computers. Health facilities are assumed to maintain manual stock records and use DHIS2 for entering their monthly stock data and reports directly into mobile devices or computers and synchronise their reports with the central DHIS2 server.
Data Collection
The Data entry form has been intentionally limited to essential logistics data in order to minimise the workload of health workers for their monthly reporting. The list of Data Elements (medicines) can easily be modified and adapted to the national essential medicines list and needs and can be separated into different sections, for example, according to the different diseases. The tabs for the data fields are arranged in chronological order of the flow of goods:
- Stock receipt: quantity received from upstream medical stores
- Stock distribution: quantity issued from the medical store and dispensed to patients or distributed to medical services such as an outpatient department
- Stock redistribution: quantity distributed to other health facilities, for example to share excess stock
- Stock return: quantity which was previously issued to a service, patient or other health facility and which was subsequently returned.
- Stock expired: quantity of medicines which expired in stock and were removed for safe disposal
- Stock other losses: quantity which is no longer usable for any other reason than expiry, for example, because of damage, cold chain excursions or a manufacturer recall
- Stock on hand: quantity of stock available on the shelf, ideally determined during a monthly physical stock count
- Stockout days: number of days during which the medicine was out of stock at some time
Analytics and Indicators
NTD Overarching Indicators
The population data should be updated to reflect the local implementation, ensuring accuracy and alignment with specific regional requirements. While not included in the current toolkit, it is recommended to develop indicators to track and compare year-over-year changes for the diseases under analysis. This approach was implemented in the district dashboard for malaria, allowing for trend analysis over time. If needed, the following formula can be used to create this indicator accurately:
Change(%) = (a-b)/a
previous period of reference(a) and current period of comparison (b)
- Numerator: DE previous period - actual period
- (#{UID}.periodOffset(-12)- #{UID})
- Denominator: DE previous period
-
{UID}.periodOffset(-12)
Stock Analytics
Despite the small number of data fields, a wide range of logistics metrics and indicators can be configured and visualised using various charts - e.g., stock availability and stockout rates, stockout reports, stockout duration, stock coverage time (number of months of stock) and demand variability. Examples of visualisations and dashboards which can be built from the stock module stock data set can be found in the LMIS sandbox (credentials on the login page) MSR - Visualization library - Health facility level Examples of visualisations and dashboards which can be built from the stock module stock data set can be found in the LMIS sandbox (credentials on the login page) MSR - Visualization library - Health facility level The health and logistics data which is collected and managed in the same DHIS2 instance can easily be combined for calculating triangulated indicators such as comparing the number of a certain medical condition with the quantities of medicines suitable for their treatment.
Dashboards
Depending on the type of implementation chosen at the local level, the dashboard configuration can vary significantly. There could be disease-specific dashboards (e.g., one for gHAT, one for Chagas disease, etc.), or a single comprehensive dashboard that covers all locally present NTDs. Another option is to integrate the data elements (DEs) into the Integrated Disease Surveillance and Response (IDSR) module, allowing the analytics to be visualized alongside the existing IDSR dashboard(s). This flexibility ensures that the reporting and monitoring systems are tailored to the specific needs and capabilities of the local health infrastructure, optimizing the utility and effectiveness of NTD surveillance and control efforts.
The HMIS Demo presents one dashboard with four diseases (BUR for skin NTDs, SCH for water-borne NTDs, RAB for zoonotic NTDs, and DEN for vector-borne NTDs) to showcase recommended visualizations for specific diseases. This dashboard serves as an example for implementers, who can decide whether to integrate them into their existing systems or maintain them as separate entities.
To further demonstrate an integrated platform for data visualization and analysis, the HMIS Demo incorporates data on human resources (HR) and staff training with the Health Facility Assessment (HFA) module and dashboards. This integration exemplifies how diverse data streams can be unified to enhance monitoring and decision-making processes in health management systems.
User groups
As part of the package configuration, user groups have been created to be used to manage sharing settings in the metadata for all the modules. Core metadata that use these sharing settings include mainly the dataSets, dashboard, indicators and data Elements. The three user groups created include:
| User group | Dashboard | Metadata | Data |
|---|---|---|---|
| NTD - Admin | Can edit and view | Can edit and view | Can view only |
| NTD - Access | Can view only | Can view only | Can view only |
| NTD - Data capture | No access | Can view only | Can capture and view |
Special Considerations
Data Triangulation - NTD and CHIS
Triangulating neglected tropical disease (NTD) surveillance data from health facilities and community sources is crucial for comprehensive and effective disease control. This approach enhances the accuracy and completeness of data, allowing for better identification of disease patterns, timely detection of outbreaks, and more targeted interventions. Health facility data provide detailed clinical insights, while community data capture cases that may not reach healthcare settings, ensuring that the surveillance system accounts for all affected individuals. Integrating these data sources helps bridge gaps, improves resource allocation, and supports informed decision-making, ultimately leading to more effective NTD management and control strategies.
The table below summarizes the key data point requirements coming from the WHO guidance and their correspondent variables in the DHIS2 CHIS toolkit.
| NTD WHO Guidance | CHIS DHIS2 Toolkit Correspondence |
|---|---|
| Proportion of people presenting hematuria, either visible hematuria reported by the patient or micro-hematuria detected by a positive dipstick | CH147 - People with visible haematuria or +ve micro-haematuria dipstick (%) |
| Geographical coverage of mass drug administration | CH139 - Communities receiving NTDs PC |
| Proportion of people receiving PC* for deworming | CH060 - People receiving deworming preventive chemotherapy (%) |
| Number of people referred to health facility for diagnosis or treatment | CH138 - People referred for NTDs |
| Population coverage of PC for targeted NTDs | CH140 - People receiving a dose of NTDs PC (%) |
| Proportion of households in the targeted communities that received social mobilization/awareness campaigns | CH141 - Households having received social mobilization campaigns on NTDs (%) |
| CH141b - Households receiving NTD messages - CM | |
| CH141c - Households receiving NTD messages - OneHealth | |
| CH141d - Households receiving NTD messages - PC | |
| CH141e - Households receiving NTD messages - VC | |
| Proportion of people screened for skin lesions consistent with NTDs (and population coverage) | CH144 - People screened for skin NTDs (%) |
| Proportion of people suffering from physical disability related to NTDs who receive rehabilitation support | CH148 - People with NTD-linked disability receiving rehab support (%) |
| Proportion of cases who received instructions for self-care for relevant NTDs | CH149 - NTD cases having received self-care instructions (%) |
| Proportion of people assessed for mental, neurological and substance use (MNS) disorders | CH041 - People assessed for MNS disorders (%) |
| Proportion of people with mental, neurologic and substance use (MNS) referred | CH042 - People referred for MNS disorders (%) |
| Proportion of people with mental, neurologic and substance use (MNS) disorders receiving services | CH043 - People with MNS disorders receiving services (%) |
| Proportion of households covered by IVM activities for NTDs | CH150 - Houses with implemented vector reduction measure (%) |
| Proportion of targeted houses covered by domiciliary vector reduction measures | CH150 - Houses with implemented vector reduction measure (%) |
| Proportion of households with all water storage containers covered and protected (Safe water storage practices) | CH152 - Households with covered water containers (%) |
Data Triangulation - NTD Overarching Module and IDS
Triangulating data between the NTD overarching module and existing Integrated Disease Surveillance (IDS) modules within local health management information systems (HMIS) offers flexibility for enhancing disease monitoring and response. Depending on local program workflows and data flows, integrating and merging these datasets is possible. This integration can create a single, comprehensive dataset that covers vaccine-preventable diseases (VPDs), other notifiable diseases, and locally relevant NTDs from the NTD toolkit. However, if preferred locally, these modules can also be maintained as separate entities. This flexible approach allows health programs to decide the best configuration for their specific needs, ensuring that all critical information is captured and utilised effectively to strengthen overall health surveillance and response systems. The current IDS DHIS2 metadata toolkit already includes data elements for rabies and dengue. The mapping of data points from the NTD Neglected Tropical DIseases module and the existing IDSR modules is detailed in the table below, offering a clear guide for potential integration. This allows for a comprehensive approach to disease monitoring and response, facilitating the inclusion of NTD data into existing systems if needed and preferred locally, while also providing the flexibility to maintain them as separate modules. It should be noted that the IDS datasets are set with a weekly frequency, while the NTD module has a monthly reporting frequency.
| NTD Data Points | IDS Data Points | IDS Datasets |
|---|---|---|
| NTD-DEN - Dengue New confirmed cases | Dengue Fever confirmed cases during the week | IDS - Integrated Lab Weekly Report |
| NTD-RAB - Clinically diagnosed rabies cases | Rabies confirmed cases during the week | IDS - Integrated Lab Weekly Report |
| NTD-RAB - Laboratory-confirmed rabies cases | Rabies confirmed cases during the week | IDS - Integrated Lab Weekly Report |
| NTD-DEN - Dengue Suspected cases | Dengue Fever new suspected cases reported during the epi week (disaggregated by age groups 0-4 and 5+ years) | IDS - Report: Suspected, Confirm, Deaths |
| IDS - Report: Suspected, Deaths | ||
| NTD-DEN - Dengue New confirmed cases | Dengue Fever confirmed cases during the week (disaggregated by age groups 0-4 and 5+ years) | IDS - Report: Suspected, Confirm, Deaths |
| NTD-DEN - Severe Dengue Deaths (primary cause) | Dengue Fever deaths among suspected cases during the week (disaggregated by age groups 0-4 and 5+ years) | IDS - Report: Suspected, Confirm, Deaths |
| IDS - Report: Suspected, Deaths | ||
| N/A | Rabies new suspected cases reported during the epi week (disaggregated by age groups 0-4 and 5+ years) | IDS - Report: Suspected, Confirm, Deaths |
| IDS - Report: Suspected, Deaths | ||
| NTD-RAB - Lab-confirmed human rabies cases | Rabies confirmed cases during the week (disaggregated by age groups 0-4 and 5+ years) | IDS - Report: Suspected, Confirm, Deaths |
| NTD-RAB - Human rabies cases | ||
| NTD-RAB - Human dog-mediated rabies cases | ||
| NTD-RAB - Human rabies deaths | Rabies deaths among suspected cases during the week (disaggregated by age groups 0-4 and 5+ years) | IDS - Report: Suspected, Confirm, Deaths |
| IDS - Report: Suspected, Deaths | ||
| NTD-RAB - Human dog-mediated rabies deaths |
Data Triangulation - NTD HR and HFA
Integrating staff data and their NTD training into the Health Facility Attributes (HFA) program under Healthcare System Accessibility significantly enhances data accuracy and utility. The HFA toolkit within DHIS2 is designed to streamline the collection of health facility attributes, providing comprehensive insights into service availability and infrastructure readiness. This toolkit supports routine health facility data collection, which can be integrated into the national Health Management Information System (HMIS), offering a holistic view of healthcare infrastructure and service readiness.
By incorporating NTD-trained staff information, the integration prevents double data entry and ensures that up-to-date data on personnel readiness is available. This enriched dataset is crucial for strategic planning, resource allocation, and effective responses to public health needs. The HFA toolkit's dynamic digital questionnaire format allows for flexible data collection, catering to specific needs and supporting a modular approach. This integration ultimately improves healthcare service delivery and emergency preparedness by providing a unified, data-driven foundation for health management.
Data exchange
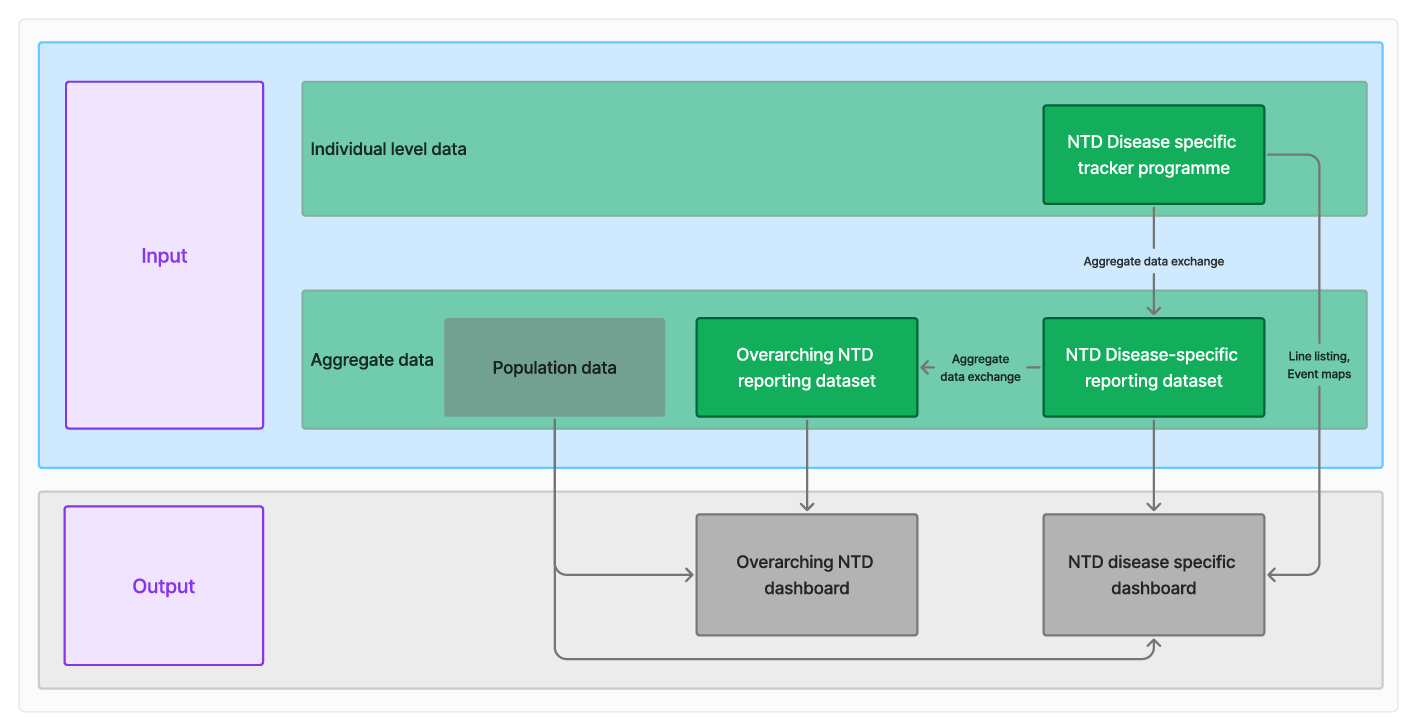
The principle of reusing data plays a key role in any successful implementation of digital tools. It is possible to link the NTD overarching module with existing disease-specific programs, should these be already implemented within the HMIS. DHIS2 supports internal and external aggregate Data Exchanges that can aggregate existing HMIS data and periodically push it to the corresponding variables in the overarching data set. For more information, please refer to DHIS2 documentation. A reference data exchange has been configured to enable data flow between Human Rabies Surveillance module and the NTD overarching data set. Information regarding this data exchange can be found in the design guide of the Human Rabies Surveillance module.
NTD overarching module vs Disease-specific NTD Modules vs Tracker
The NTD overarching module provides a foundational set of variables that each country should report on. It covers the essential data points needed for tracking NTDs at a basic level and serves as the minimum requirement for standardized reporting. In contrast, the Disease-specific NTD modules focus on one disease at the time, presenting a more detailed and higher-volume dataset for reporting, suited to countries with specific disease surveillance needs. These modules are still aggregated but are designed with increased complexity to capture disease-specific data effectively. The disease-specific dataset also facilitate the data exchange with tracker data, ensuring that information entered into trackers, such as the sabies tracker, is aggregated and visualized accuretaly within the corresponding disease-specific dataset. Importantly, to streamline reporting and avoid redundancy, data entry should occur in either the tracker, the disease-specific module or the overarching module, not in multiple places. WHen data is intered into a tracker, it will automatically aggregate within ethe disease specific dataset as its core output for HMIS-integrated monitoring and nalaysis. The dataset has, in turn, been mapped to ensure alignment with the overarching outputs.
NTD Zoonoses and Animal Health
Triangulating rabies surveillance with animal monitoring is a crucial strategy in understanding and controlling the spread of this virus. Given rabies' zoonotic nature and its potential for animal-to-human transmission, particularly in regions where the virus is endemic in wildlife, integrating human and animal surveillance efforts is essential. This approach enables the identification of potential animal reservoirs, the mapping of transmission pathways, and the prevention of new spillover events. By combining data from human case investigations, exposure assessments, and animal surveillance, public health authorities can achieve a comprehensive view of rabies transmission dynamics. The DHIS2 Animal Health toolkit is instrumental in facilitating this integration, offering a platform for systematic surveillance of animal populations, especially for zoonotic diseases like rabies. Developed in collaboration with organizations like the CDC and FAO, this toolkit can operate independently or be integrated with human health surveillance data to support a One Health approach. This cross-sectoral collaboration enables real-time reporting of unusual animal health events, triggering timely investigations. Using DHIS2 for both human and animal surveillance allows authorities to manage zoonotic risks effectively, ensuring the health of people, animals, and ecosystems is addressed holistically.