DHIS2 Documentation Team
Copyright © 2008-2023 DHIS2 Team
source.revision.date: 2026-06-16
Warranty: THIS DOCUMENT IS PROVIDED BY THE AUTHORS ‘’AS IS’’ AND ANY EXPRESS OR IMPLIED WARRANTIES, INCLUDING, BUT NOT LIMITED TO, THE IMPLIED WARRANTIES OF MERCHANTABILITY AND FITNESS FOR A PARTICULAR PURPOSE ARE DISCLAIMED. IN NO EVENT SHALL THE AUTHORS OR CONTRIBUTORS BE LIABLE FOR ANY DIRECT, INDIRECT, INCIDENTAL, SPECIAL, EXEMPLARY, OR CONSEQUENTIAL DAMAGES (INCLUDING, BUT NOT LIMITED TO, PROCUREMENT OF SUBSTITUTE GOODS OR SERVICES; LOSS OF USE, DATA, OR PROFITS; OR BUSINESS INTERRUPTION) HOWEVER CAUSED AND ON ANY THEORY OF LIABILITY, WHETHER IN CONTRACT, STRICT LIABILITY, OR TORT (INCLUDING NEGLIGENCE OR OTHERWISE) ARISING IN ANY WAY OUT OF THE USE OF THIS MANUAL AND PRODUCTS MENTIONED HEREIN, EVEN IF ADVISED OF THE POSSIBILITY OF SUCH DAMAGE.
License: Permission is granted to copy, distribute and/or modify this document under the terms of the GNU Free Documentation License, Version 1.3 or any later version published by the Free Software Foundation; with no Invariant Sections, no Front-Cover Texts, and no Back-Cover Texts. A copy of the license is included in the source of this documentation, and is available here online: http://www.gnu.org/licenses/fdl.html
After reading this chapter you will be able to understand:
What is DHIS2 and what purpose it serves with respect to health information systems (HIS)?
What are the major technological considerations when it comes to deploying DHIS2, and what are the options for extending DHIS2 with new modules?
What is the difference between patient based and aggregate data?
What are some of the benefits and challenges with using Free and Open Source Software (FOSS) for HIS?
DHIS2 is a tool for collection, validation, analysis, and presentation of aggregate and patient-based statistical data, tailored (but not limited) to integrated health information management activities. It is a generic tool rather than a pre-configured database application, with an open meta-data model and a flexible user interface that allows the user to design the contents of a specific information system without the need for programming. DHIS2 is a modular web-based software package built with free and open source Java frameworks.
DHIS2 is open source software released under the BSD license and can be obtained at no cost. It runs on any platform with a Java Runtime Environment (JRE 7 or higher) installed.
DHIS2 is developed by the Health Information Systems Programme (HISP) as an open and globally distributed process with developers currently in India, Vietnam, Tanzania, Ireland, and Norway. The development is coordinated by the University of Oslo with support from NORAD and other donors.
The DHIS2 software is used in more than 40 countries in Africa, Asia, and Latin America, and countries that have adopted DHIS2 as their nation-wide HIS software include Kenya, Tanzania, Uganda, Rwanda, Ghana, Liberia, and Bangladesh. A rapidly increasing number of countries and organisations are starting up new deployments.
The documentation provided herewith, will attempt to provide a comprehensive overview of the application. Given the abstract nature of the application, this manual will not serve as a complete step-by-step guide of how to use the application in each and every circumstance, but rather will seek to provide illustrations and examples of how DHIS2 can be implemented in a variety of situations through generalized examples.
Before implementing DHIS2 in a new setting, we highly recommend reading the DHIS2 Implementation Guide (a separate manual from this one), also available at the main DHIS2 website.
The key features and purpose of DHIS2 can be summarised as follows:
Provide a comprehensive data management solution based on data warehousing principles and a modular structure which can easily be customised to the different requirements of a management information system, supporting analysis at different levels of the organisational hierarchy.
Customisation and local adaptation through the user interface. No programming required to start using DHIS2 in a new setting (country, region, district etc.).
Provide data entry tools which can either be in the form of standard lists or tables, or can be customised to replicate paper forms.
Provide different kinds of tools for data validation and improvement of data quality.
Provide easy to use - one-click reports with charts and tables for selected indicators or summary reports using the design of the data collection tools. Allow for integration with popular external report design tools (e.g. JasperReports) to add more custom or advanced reports.
Flexible and dynamic (on-the-fly) data analysis in the analytics modules (i.e. GIS, PivotTables,Data Visualizer, Event reports, etc).
A user-specific dashboard for quick access to the relevant monitoring and evaluation tools including indicator charts and links to favourite reports, maps and other key resources in the system.
Easy to use user-interfaces for metadata management e.g. for adding/editing datasets or health facilities. No programming needed to set up the system in a new setting.
Functionality to design and modify calculated indicator formulas.
User management module for passwords, security, and fine-grained access control (user roles).
Messages can be sent to system users for feedback and notifications. Messages can also be delivered to email and SMS.
Users can share and discuss their data in charts and reports using Interpretations, enabling an active information-driven user community.
Functionalities of export-import of data and metadata, supporting synchronisation of offline installations as well as interoperability with other applications.
Using the DHIS2 Web-API , allow for integration with external software and extension of the core platform through the use of custom apps.
Further modules can be developed and integrated as per user needs, either as part of the DHIS2 portal user interface or a more loosely-coupled external application interacting through the DHIS2 Web-API.
In summary, DHIS2 provides a comprehensive HIS solution for the reporting and analysis needs of health information users at any level.
The wider context of HIS can be comprehensively described through the information cycle presented in Figure 1.1 below. The information cycle pictorially depicts the different components, stages and processes through which the data is collected, checked for quality, processed, analysed and used.

DHIS2 supports the different facets of the information cycle including:
Collecting data.
Running quality checks.
Data access at multiple levels.
Reporting.
Making graphs and maps and other forms of analysis.
Enabling comparison across time (for example, previous months) and space (for example, across facilities and districts).
See trends (displaying data in time series to see their min and max levels).
As a first step, DHIS2 serves as a data collection, recording and compilation tool, and all data (be it in numbers or text form) can be entered into it. Data entry can be done in lists of data elements or in customised user defined forms which can be developed to mimic paper based forms in order to ease the process of data entry.
As a next step, DHIS2 can be used to increase data quality. First, at the point of data entry, a check can be made to see if data falls within acceptable range levels of minimum and maximum values for any particular data element. Such checking, for example, can help to identify typing errors at the time of data entry. Further, user can define various validation rules, and DHIS2 can run the data through the validation rules to identify violations. These types of checks help to ensure that data entered into the system is of good quality from the start, and can be improved by the people who are most familiar with it.
When data has been entered and verified, DHIS2 can help to make different kinds of reports. The first kind are the routine reports that can be predefined, so that all those reports that need to be routine generated can be done on a click of a button. Further, DHIS2 can help in the generation of analytical reports through comparisons of for example indicators across facilities or over time. Graphs, maps, reports and health profiles are among the outputs that DHIS2 can produce, and these should routinely be produced, analysed, and acted upon by health managers.
DHIS2 can be perceived as a platform on several levels. First, the application database is designed ground-up with flexibility in mind. Data structures such as data elements, organisation units, forms and user roles can be defined completely freely through the application user interface. This makes it possible for the system to be adapted to a multitude of locale contexts and use-cases. We have seen that DHIS2 supports most major requirements for routine data capture and analysis emerging in country implementations. It also makes it possible for DHIS2 to serve as management system for domains such as logistics, labs and finance.
Second, due to the modular design of DHIS2 it can be extended with additional software modules or through custom apps. These software modules/apps can live side by side with the core modules of DHIS2 and can be integrated into the DHIS2 portal and menu system. This is a powerful feature as it makes it possible to extend the system with extra functionality when needed, typically for country specific requirements as earlier pointed out.
The downside of the software module extensibility is that it puts several constraints on the development process. The developers creating the extra functionality are limited to the DHIS2 technology in terms of programming language and software frameworks, in addition to the constraints put on the design of modules by the DHIS2 portal solution. Also, these modules must be included in the DHIS2 software when the software is built and deployed on the web server, not dynamically during run-time.
In order to overcome these limitations and achieve a looser coupling between the DHIS2 service layer and additional software artefacts, a REST-based API has been developed as part of DHIS2. This Web API complies with the rules of the REST architectural style. This implies that:
The Web API provides a navigable and machine-readable interface to the complete DHIS2 data model. For instance, one can access the full list of data elements, then navigate using the provided URL to a particular data element of interest, then navigate using the provided URL to the list of data sets which the data element is a member of.
(Meta) Data is accessed through a uniform interface (URLs) using plain HTTP requests. There are no fancy transport formats or protocols involved - just the well-tested, well-understood HTTP protocol which is the main building block of the Web today. This implies that third-party developers can develop software using the DHIS2 data model and data without knowing the DHIS2 specific technology or complying with the DHIS2 design constraints.
All data including meta-data, reports, maps and charts, known as resources in REST terminology, can be retrieved in most of the popular representation formats of the Web of today, such as XML, JSON, PDF and PNG. These formats are widely supported in applications and programming languages and gives third-party developers a wide range of implementation options.
All computers have an Operating System (OS) to manage it and the programs running it. The operating system serves as the middle layer between the software application, such as DHIS2, and the hardware, such as the CPU and RAM. DHIS2 runs on the Java Virtual Machine, and can therefore run on any operating system which supports Java. Platform independence implies that the software application can run on ANY OS - Windows, Linux, Macintosh etc. DHIS2 is platform independent and thus can be used in many different contexts depending on the exact requirements of the operating system to be used.
Additionally, and perhaps most importantly, since DHIS2 is a browser-based application, the only real requirement to interact with the system is with a web browser. DHIS2 supports most web browsers, although currently either Google Chrome, Mozilla Firefox or Opera are recommended.
Hosting DHIS2 on a national scale is a considerable undertaking which requires planning, provisioning, monitoring and management of potentially complex hardware and/or cloud resources. For a full discussion of the various tradeoffs of different approaches see the server hosting section of the DHIS2 implementation guide.
Patient data is data relating to a single patient, such as his/her diagnosis, name, age, earlier medical history etc. This data is typically based on a single patient-health care worker interaction. For instance, when a patient visits a health care clinic, a variety of details may be recorded, such as the patient's temperature, their weight, and various blood tests. Should this patient be diagnosed as having "Vitamin B 12 deficiency anaemia, unspecified" corresponding to ICD-10 code D51.9, this particular interaction might eventually get recorded as an instance of "Anaemia" in an aggregate based system. Patient based data is important when you want to track longitudinally the progress of a patient over time. For example, if we want to track how a patient is adhering to and responding to the process of TB treatment (typically taking place over 6-9 months), we would need patient based data.
Aggregated data is the consolidation of data relating to multiple patients, and therefore cannot be traced back to a specific patient. They are merely counts, such as incidences of Malaria, TB, or other diseases. Typically, the routine data that a health facility deals with is this kind of aggregated statistics, and is used for the generation of routine reports and indicators, and most importantly, strategic planning within the health system. Aggregate data cannot provide the type of detailed information which patient level data can, but is crucial for planning and guidance of the performance of health systems.
In between the two you have case-based data, or anonymous "patient" data. A lot of details can be collected about a specific health event without necessarily having to identify the patient it involved. Inpatient or outpatient visits, a new case of cholera, a maternal death etc. are common use-cases where one would like to collect a lot more detail that just adding to the total count of cases, or visits. This data is often collected in line-listing type of forms, or in more detailed audit forms. It is different from aggregate data in the sense that it contains many details about a specific event, whereas the aggregate data would count how many events of a certain type, e.g. how many outpatient visits with principal diagnosis "Malaria", or how many maternal deaths where the deceased did not attend ANC, or how many cholera outbreaks for children under 5 years. In DHIS2 this data is collected through programs of the type single event without registration.
Patient data is highly confidential and therefore must be protected so that no one other than doctors can get it. When in paper, it must be properly stored in a secure place. For computers, patient data needs secure systems with passwords, restrained access and audit logs.
Security concerns for aggregated data are not as crucial as for patient data, as it is usually impossible to identify a particular person to a aggregate statistic . However, data can still be misused and misinterpreted by others, and should not be distributed without adequate data dissemination policies in place.
Software carries the instructions that tell a computer how to operate. The human authored and human readable form of those instructions is called source code. Before the computer can actually execute the instructions, the source code must be translated into a machine readable (binary) format, called the object code. All distributed software includes the object code, but FOSS makes the source code available as well.
Proprietary software owners license their copyrighted object code to a user, which allows the user to run the program. FOSS programs, on the other hand, license both the object and the source code, permitting the user to run, modify and possibly redistribute the programs. With access to the source code, the users have the freedom to run the program for any purpose, redistribute, probe, adapt, learn from, customise the software to suit their needs, and release improvements to the public for the good of the community. Hence, some FOSS is also known as free software, where “free” refers, first and foremost, to the above freedoms rather than in the monetary sense of the word.
Within the public health sector, FOSS can potentially have a range of benefits, including:
Lower costs as it does not involve paying for prohibitive license costs.
Given the information needs for the health sector are constantly changing and evolving, there is a need for the user to have the freedom to make the changes as per the user requirements. This is often limited in proprietary systems.
Access to source code to enable integration and interoperability. In the health sector interoperability between different software applications is becoming increasingly important, meaning enabling two or more systems to communicate metadata and data. This work is a lot easier, and sometimes dependent on the source code being available to the developers that create the integration. This availability is often not possible in the case of proprietary software. And when it is, it comes at a high cost and contractual obligations.
FOSS applications like DHIS2 typically are supported by a global network of developers, and thus have access to cutting edge research and development knowledge.
The Data Entry app is where you manually enter aggregated data in DHIS2. You register data for an organisation unit, a period, and a set of data elements (data set) at a time. A data set often corresponds to a paper-based data collection tool. You configure the data sets in the Maintenance app.
Note
If a data set has both a section form and a custom form, the system displays the custom form during data entry. Users who enter data can't select which form they want to use. In web-based data entry the order of display preference is:
Custom form (if it exists)
Section form (if it exists)
Default form
Mobile devices do not support custom forms. In mobile-based data entry the order of display preference is:
Section form (if it exists)
Default form
When you close an organisation unit, you can't register or edit data to this organisation unit in the Data Entry app.

Open the Data Entry app.
In the organisation unit tree to the left, select an organisation unit.
Select a Data set.
Select a Period.
The available periods are controlled by the period type of the data set (reporting frequency). You can jump a year back or forward by clicking Prev year or Next year.
Note
Depending on how you've configured the data entry form, you might have to enter additional information before you can open the date entry form. This can for example be a project derived from a category combination.
Enter data in the data entry form.
A green field means that the system has saved the value.
A grey field means that the field is disabled and you can't enter a value. The cursor will automatically jump to the next open field.
To move to the next field, press the Tab key or the Down Arrow key.
To move back to the previous field, press Shift+Tab or the Up Arrow key.
If you type in an invalid value, for example a character in a field that only accepts numeric values, you'll get a pop-up that explains the problem and the field will be coloured yellow (not saved) until you have corrected the value.
If you have defined a minimum maximum value range for the field and you enter a value that is outside this range, you'll get a pop-up message that says the value is out of range. The value remains unsaved until you've changed the value or updated the value range and then re-entered the value.
When you've filled in the form, click Run validation in the top right corner or below the data entry form.
All validation rules which involves data elements in the current data entry form (data set) are then run against the new data. If there are no violations of the validation rules, you'll see a message saying The data entry screen successfully passed validation. If there are validation violations, they will be presented in a list.
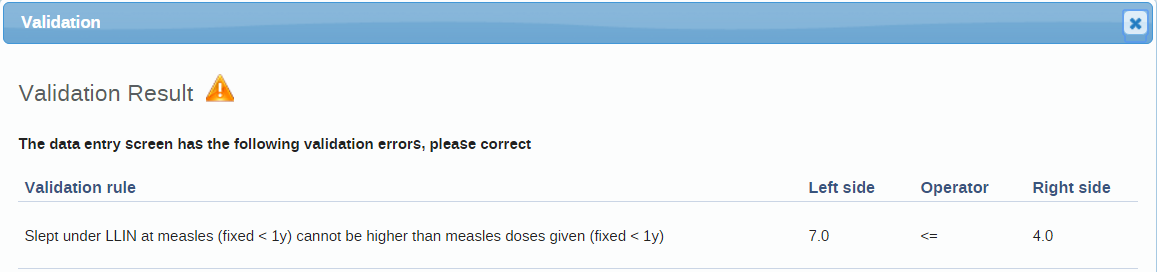
(Optional) Correct validation violations.
Note
Zero (0) will delete the value if the data element has been configured to not store zeros.
When you've corrected errors and you're done with data entry, click Complete.
The system uses this information when generating completeness reports for district, county, province or the national level.

If you for example have a suspicious value that you need to investigate further, you can keep it the system, but mark it for follow-up. In the Data Quality app you can then run a follow-up analysis to view and correct all marked values.
Open the Data Entry app.
Open an existing data entry form.
Double-click the field with the value you want to mark for follow-up.
Click the star icon.
Open the Data Entry app.
Open an existing data entry form.
Click Incomplete.
Change the relevant data values.
Note
Zero (0) will delete the value if the data element has been configured to not store zeros,
Click Complete.
You can display the last 12 values registered for a field.
Open the Data Entry app.
Open an existing data entry form.
Double-click the field with the value you want to view the history for.
Click Data element history.
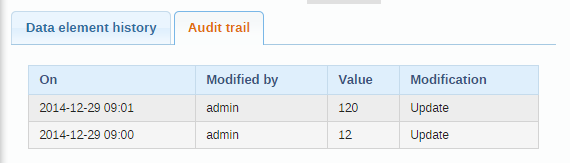
The audit trail allows you to view other data values which have been entered prior to the current value. The audit trail also shows when the data value was altered and which user who made the changes.
Open the Data Entry app.
Open an existing data entry form.
Double-click the field with the value you want to view the audit trail for.
Click Audit trail.

In the Data Entry app, open a data entry form.
Double-click the field for which you want to set the minimum maximum value range.
Enter Min limit and Max limit.
Click Save.
If values don't fall within the new value range the next time you enter data, the data entry cell will appear with an orange background.
(Optional) Type a comment to explain the reason for the discrepancy, for example an event at a facility which may have generated a large number of clients.
(Optional) Click Save comment.
Tip
Click the star icon to mark the value for further follow-up.
The Data Entry app works even if you don't have a stable Internet connection during data entry. When you don't have an internet connection, the data you enter is saved to your local computer. When the Internet connection is back, the app will push the data to the server. The total bandwidth usage is reduced since data entry forms no longer are retrieved from the server for each rendering.
Note
To use this functionality, you must login to the server while you've an Internet connection.
When you're connected to the Internet, the app displays this message at the top of the data entry form:

If your Internet connection breaks during data entry, the app detects it and displays this message:

Now your data will be stored locally. You can continue to enter data as normal.
Once you have entered all necessary data and the app detects that the Internet connection is back, you'll see this message:

Click Upload to synchronize data with the server.
When the data has successfully synchronized with the server, you'll see this confirmation message:


It can be useful to enter data for multiple organisation units in the same data entry form, for instance if there are few data elements in the form and a huge number of organisation units in the hierarchy. In that case, you can enable multi-organisation unit data entry.
Note
Multi-organisation unit data entry only works for section forms.
Open the System Settings app.
Select Enable multi-organisation unit forms.
In the Data Entry app, select the organisation unit immediately above the organisation unit you want to enter data for in the organisation unit hierarchy.
Data elements will appear as columns and organisation units as rows in the form.
Note
The data entry forms should still be assigned to the facilities that you actually enter data for, that is the organisation units now appearing in the form.
The Data Entry app is used to enter aggregate data in DHIS2. Aggregate data is collected at a group level and doesn't belong to any one individual. Looking to enter individual-level data? Check out the Tracker Capture app.
Data entry forms are filled in for a specific context, which is made up of the following choices: 1. Data set is a collection of data elements that represent the data you want to collect. 2. Organisation unit is where the data is being registered, which is often a location like a clinic, hospital, or classroom. 3. Period is when the data is from. 4. Additional selections are shown for some data entry forms and help to collect data into meaningful groups.
The Data Entry app is made up of a few different sections:

To get started with data entry, you need to open a form. Choose the form you want to open using the top bar: 1. Choose a data set from the first control in the top bar. The dropdown menu shows the data sets that you have access to. The data set determines what other choices are available, so you have to choose a data set first. 2. Choose an organisation unit from the second control in the top bar. You can search for an organisation unit or browse the tree hierarchy. 3. Choose a period from the third control in the top bar. The dropdown menu shows the periods set up for the chosen data set. Choose from different years by clicking the left and right arrow buttons. 4. Make additional selections, if applicable. If there are any other selections available, they will be shown as the last controls in the top bar. Additional selections depend on the chosen data set, organisation unit, and period, so they won't be shown until those first three choices are made. If there aren't any additional selections then extra controls won't be shown.
After you've made the selections in the top bar, the data entry form will open in the data workspace. If there's a problem opening a form, the data workspace will show an error that explains the problem.
Once you've opened a form, you can start entering data into the form cells. The active cell, the cell that you're entering data into, is always highlighted with a blue border. To work quickly, you can move around using your keyboard: - to move on to the next cell, press Tab or Down. - to go back to the previous cell, press Shift+Tab or Up.
Cells look different depending on what their status is:
| Cell | Status |
|---|---|
 | Showing a value that's already saved or a cell that's empty. |
 | The cell value is saved on the server. |
 | The cell value is saved locally and is syncing, or waiting to sync, to the server. |
 | There's a problem with the cell value. Click or hover over the cell to learn more about the problem. These invalid values are not saved to the server or locally. |
 | The value has a comment. |
 | The cell is locked and the value can't be edited. |
Filtering is useful if you're looking for a certain cell in a form. You can filter the whole form, filter single sections, or both. Any cells that don't match the filter will be hidden.
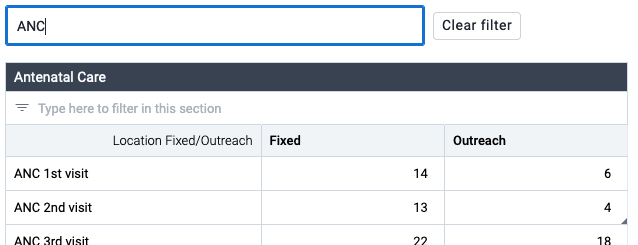
To filter the whole data entry form, enter a value into the input at the top of the form.
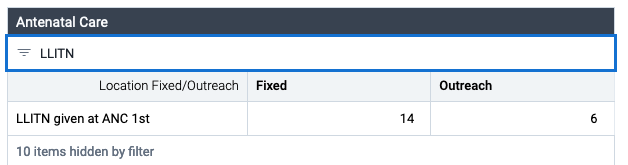
For section forms you can also filter inside a single section. Enter a value into the input at the top of a section.
When you're done entering data you can run validation on the data values. Validation checks the values against rules set up by your DHIS2 instance.
To run validation, click the Run validation button in the bottom bar.
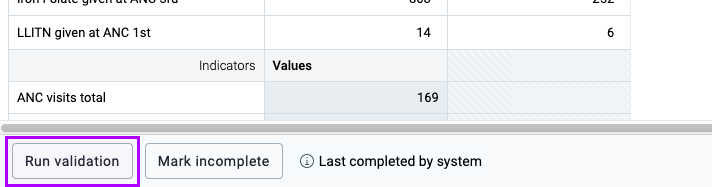
The validation results are shown in the details sidebar, grouped into high, medium, and low priority results. Once you've fixed validation issues, click the Run validation again button to recheck data values.

After entering data and running validation, the last step is completing a form. Completing a form means that all the intended data has been entered and empty cells are intentionally left empty. Mark a form as complete by clicking the Mark complete button in the bottom bar.
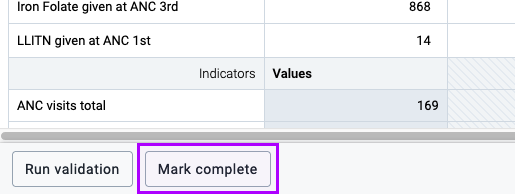
If a form is complete but shouldn't be, you can mark it as incomplete by clicking the Mark incomplete button in the bottom bar.
The basic data entry functionality is covered above, but the Data Entry app offers more actions and information. These actions and information are found in the data details sidebar that's shown on the right of the data workspace.

There are different ways to open the data details sidebar: - Click the View details button. With a data entry cell selected, you can click the View details button in the bottom bar. - Use the Ctrl+Enter or Cmd+Enter keyboard shortcut. With a data entry cell selected, use one of these keyboard shortcuts.
The data details sidebar will stay open until you close it so that you can keep it open for reference as you work through a data entry form.
Marking data values for follow-up can be a useful way of highlighting suspicious or odd values that need to be investigated. Data values marked for follow-up will still be saved, but they will be highlighted in the Data Quality app for further investigation or analysis.
To mark a data value for follow-up, make sure the data details sidebar is open, then click the Mark for follow-up button in the top section.
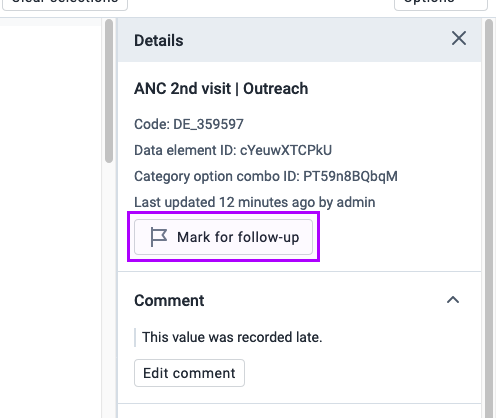
To unmark a data value, click the Unmark for follow-up button.
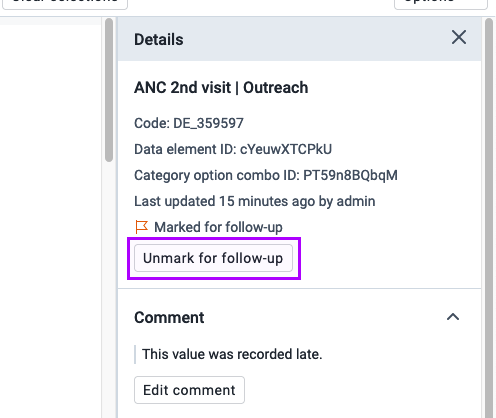
You can add a comment to any data value. Comments can be useful to add more information about a value, like noting reasons why a value is unusually high or out of the normal range.
To add a comment to a data value, make sure the data details sidebar is open, then click the Add comment button in the Comment section.
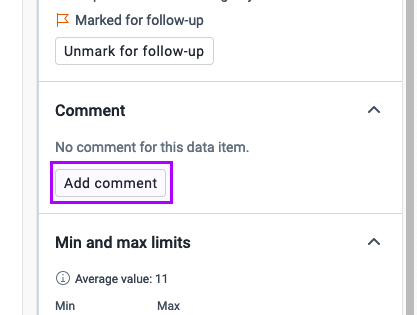
Once you've written a comment, click the Save comment button.
If a data value already has a comment, you can edit it by clicking the Edit comment button below the comment.
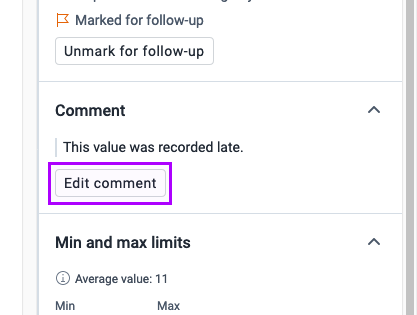
A data value can have a minimum and maximum limit. These limits won't allow someone to enter values outside of the minimum or maximum.
To add limits to a data value, make sure the data details sidebar is open, then click the Add limits button in the Min and max limits section. If possible, an average value will be shown to help you create reasonable limits.
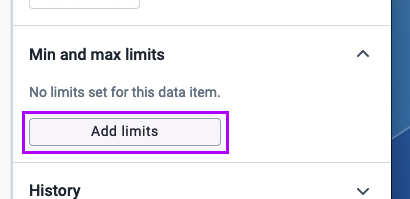
Once you've added a minimum and maximum limit, click the Save limits button.
If a data value already has limits set up, you can change them or remove them. To change the limits, click the Edit limits button. To remove the limits, click the Delete limits button.
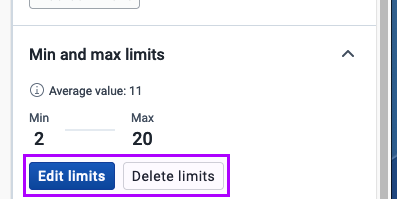
Caution
Adding, changing, or removing limits requires the correct user privileges. When limits are applied to a data value, the same limits apply for everyone using same data set.
To learn more about a data value, you can see the last twelve values in the History section of the data details sidebar. Make sure the data details sidebar is open, then open the History section

When working through a data entry form, the History section is closed by default to prevent too much network data from being sent for every value.
Every data entry cell has an audit log that shows when values were changed and who changed them. To see the audit log, make sure the data details sidebar is open, then open the Audit log section.
When working through a data entry form, the Audit log section is closed by default to prevent too much network data from being sent for every value.
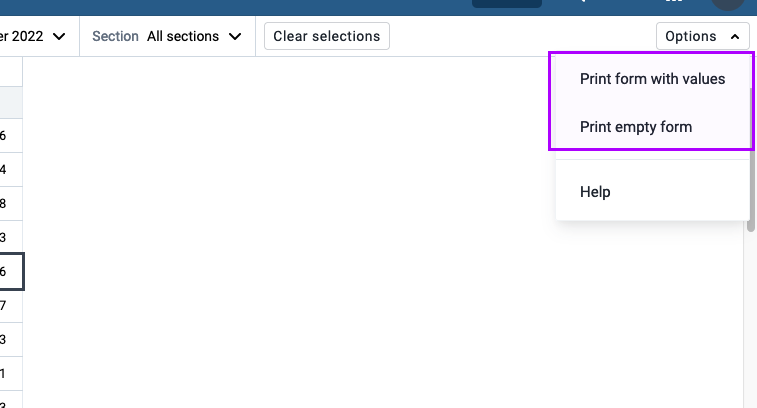
To print a data entry form, click the Options button in the top bar. From the dropdown menu, you can choose to print the form including cell data values, or an empty form.
You don't need to be connected to the internet or DHIS2 server to enter data. Data entered into forms while you are offline is saved to your local computer. When you reconnect to the internet/server your locally saved data automatically syncs with your DHIS2 server.
To work offline, you need to open the Data Entry app while you are connected to the internet so the data entry forms can be downloaded and stored on your local computer. Downloading of forms happens automatically in the background.
The badge in the header bar at the top of the screen shows your connection status. If you are not connected to the internet or DHIS2 server, the badge shows offline. As well as the offline badge, forms cells you enter data will show the waiting to sync status.

Note
Some features aren't available when offline because they need contact with a DHIS2 server to work.
Validation, data value history, and data value audit logs aren't available offline.
The Data Entry app is constantly evolving and new features are being added. There are some features that the previous Data Entry app offered that are supported yet: - Custom forms don't support CSS/JS yet. We are currently examining the different ways custom forms are used in order to build a more sustainable, flexible solution. - Multi-organisation unit entry isn't supported.
The Data Quality app contains tools to validate the accuracy and reliability of the data in the system. You can assess different dimensions of data quality as outlined in the table below:
| Dimension | Description |
|---|---|
| Correctness | Data should be within the normal range for data collected at that facility. There should be no gross discrepancies when compared with data from related data elements. |
| Completeness | Data for all data elements for all reporting organisation units should have been submitted. |
| Consistency | Data should be consistent with data entered during earlier months and years while allowing for changes with reorganization, increased work load, etc. and consistent with other similar facilities. |
| Timeliness | All data from all reporting organisation units should be submitted at the appointed time. |
You can verify data quality in different ways, for example:
At point of data entry, DHIS 2 can check the data entered to see if it falls within the minimum maximum value ranges of that data element (based on all previous data registered).
By defining validation rules, which can be run once the user has finished data entry. The user can also check the entered data for a particular period and organization unit(s) against the validation rules, and display the violations for these validation rules.
By analysing data sets, that is, examine gaps in the data.
By data triangulation, that is, comparing the same data or indicator from different sources.
A validation rule is based on an expression which defines a numeric relationship between data element values. The expression forms a condition which should assert that certain logical criteria are met.
The expression consist of:
a left side
a right side
an operator
A validation rule could assert that "Suspected malaria cases tested" >= "Confirmed malaria cases".
The left and right sides must return numeric values.
The validation rule analysis tests validation rules against the data registered in the system. Validation violations are reported when the condition defined in the validation rule expression is not met, which means when the condition is false.
You can configure a validation rule analysis to automatically send out information about validation violations to selected user groups. These messages are called validation notifications and you create them in the Maintenance app. Validation notifications are sent via the internal DHIS 2 messaging system.
In the Maintenance app, create validation rules and validation rule groups.
(Optional) In the Maintenance app, create validation notifications.
Run the validation rule analysis, either automatically or manually.
In the Scheduler app, you schedule the validation rule analysis to run automatically for all validation rules included in one or several validation rule groups. After the system has run the analysis, you'll see the validation violations (if any) in the validation notifications sent via the internal DHIS 2 messaging system.
In the Data Quality app, you run the validation rule analysis manually for selected validation rules. After the analysis process has finished, you'll see a list of validation violations (if any).
Note
Only validation rules that are included in one or several validation notifications will be a part of the validation rule analysis. If there is no corresponding validation notification for a validation rule, no notification will be sent.
Note
While running validation rule analysis automatically, any results not already persisted, will be persisted during this run. Persisted results can currently only be accessed trough the API. Consult the developers guide for more information about how persisted validation rule violations can be accessed.
Verify that you have created all the validation rules, validation rule groups and validation notifications you need.
Open the Scheduler app and click the add button in the bottom right corner.
Choose a suitable Name for the new job.
Select the Monitoring Job type using the drop-down menu.
Select a running frequency for the job, i.e. when and how often the job should run.
Fill in the Parameters section, including the Validation rule groups.
Press the Add job button to confirm the job creation. For more information on adding jobs, see Scheduling.

Verify that you have created all the validation rules, validation rule groups and validation notifications you need.
Open the Data Quality app and click Validation rule analysis.
Select Start date and End date.
Select which Validation rule group you want to include in the analysis.
You can select all validation rules or all validation rules from a single validation rule group.
(Optional) Select Send notifications to trigger validation notifications.
Note
If you want to send out validation notifications, you must first create them in the Maintenance app.
(Optional) Select Persist new results to persist any non-persisted results found during the analysis
Select a Parent organisation unit.
Click Validate.
The analysis process duration depends on the amount of data that is being analysed. If there are no violations of the validation rules, you'll see a message saying Validation passed successfully. If there are validation violations, they will be presented in a list.

(Optional) Click the show details icon to get more information about a validation violation. In the pop-up window you'll find information about the data elements included in the validation rules and their corresponding data values. You can use this information to identify the source of the validation rule violation.
(Optional) Click Download as PDF, Download as Excel or Download as CSV to download the validation violations list in PDF, Excel or CSV formats.
The outlier detection tool identifies values which are numerically distant from the rest of the data, potentially indicating that they are outliers. The analysis is based on the standard normal distribution. DHIS 2 calculates the mean of all values for an organisation unit, data element, category option combination and attribute option combination.
Note
As indicated above, this data quality analysis is only appropriate for data which is normally distributed. Data with large seasonal variation, or which may be distributed according to other statistical models (e.g. logistical ) may lead values being flagged which actually should be considered valid. It is therefore recommended to first confirm whether the data actually is normally distributed before running a standard deviation outlier analysis.
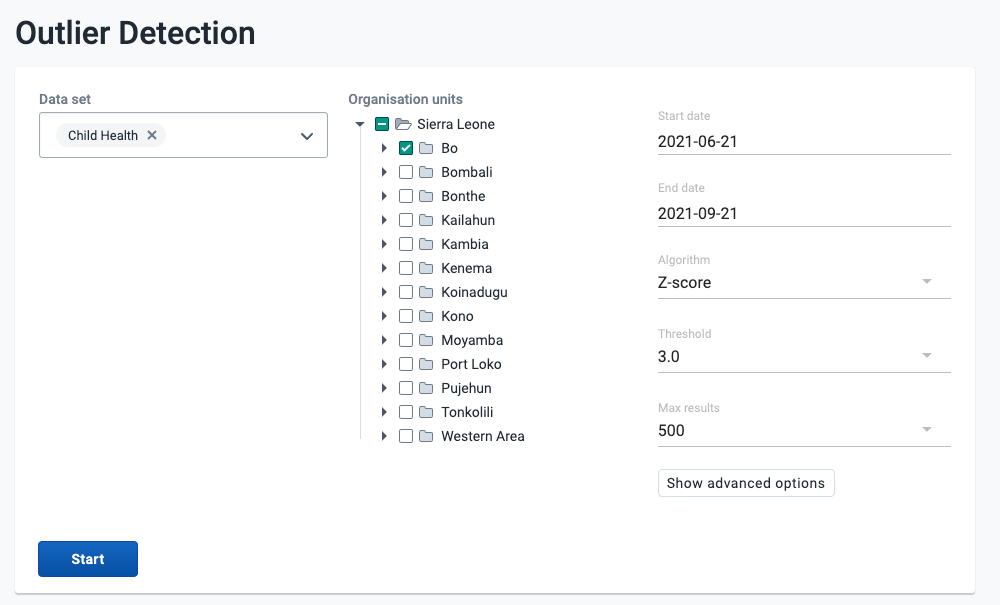
Open the Data Quality app and click Outlier Detection.
Select one or multiple data sets.
Select Organisation units.
Multiple organisation units can be selected. The analysis is made on raw data for all organisation units in the sub-hierarchy of the selected units, not on aggregated data.
Select From date and To date.
Set the Algorithm to use.
Z-score (based on the mean of data values), Modified Z-score (based on the median of data values) and Min-max values (based on stored min-max data values) are available algorithms.
Select a Threshold.
This refers to the number of standard deviations the data is allowed to deviate from the mean before it is classified as an outlier.
This refers to the maximum number of outliers listed in the results.
These fields can be used to perform outlier detection analysis on a subset of the data within the provided date range. When left blank, the natural start and end date of the dataset will be used (in advanced section).
The outliers can be sorted by Z-score or by Absolute deviation from Mean (in advanced section).
Click Start The analysis process duration depends on the amount of data that is being analysed. If there are standard deviations outliers, they will be presented in a list.  For each outlier, you will see the data element, period, organisation unit, value, z-score, deviation, standard deviation, mean, min, and max. The minimum and maximum values refer to the border values derived from the number of standard deviations selected for the analysis.
(Optional) Click Download as CSV to download the list in CSV format.
Tip
Click the checkbox to mark an outlier value for further follow-up.
You can verify the data quality at the point of data entry by setting a minimun/maximum value range for each data value. You can define the value ranges manually or generate them automatically.
The auto-generated minimum maximum value range is suitable only for normally distributed data. DHIS2 will determine the arithmetic mean and standard deviation of all values for a given data element, category option, organisation unit and attribute combination. Then the system will calculate the minimum maximum value range based on the Data analysis std dev factor specified in the System Settings app.
For data which is highly-skewed or zero inflated (as is often the case with aggregate data), the values which DHIS2 auto-generates may not provide an accurate minimum maximum value range. This can lead to excessive false violations, for example if you analyse values related to seasonal diseases.
Note
Minimum maximum value ranges are calculated across all attribute combination options for a given data element, category option and organisation unit combination.
Create a minimum maximum value range, either automatically or manually.
In the Data Administration app, you generate value ranges automatically.
In the Data Entry app, you may set value ranges manually.
In the Data Quality app, run the Min-max outlier analysis.
Note
Auto-generated minimum maximum value ranges can be useful for many situations, but it's recommended to verify that the data is actually normally distributed prior to using this function.
You generate minimum maximum value ranges calculated by data set in the Data Administration app. The new value ranges override any value ranges that the system has calculated previously.
Set the Data analysis standard deviation (std dev) factor:
Open the System Settings app, and click General.
In the Data analysis std dev factor field, enter a value.
This sets the number of standard deviations to use in the outlier analysis. The default value is 2. Higher values indicate a broader distribution, which may lead to outliers not being flagged correctly by the analysis.
Open the Data Administration app and click Min-max value generation.
Select data set(s).
Select an Organisation unit.
Click Generate.
New minimum maximum value ranges for all data elements in the selected data sets for all organisation units (including descendants) of the selected organisation units are generated.
In the Data Entry app, open a data entry form.
Double-click the field for which you want to set the minimum/maximum value range.
Enter Min limit and Max limit in the dialog that appears.
Click Save.
If values don't fall within the new value range the next time you enter data, the data entry cell will appear with an orange background.
(Optional) Type a comment to explain the reason for the discrepancy, for example an event at a facility which may have generated a large number of clients.
(Optional) Click Save comment.
Tip
Click the star icon to mark the value for further follow-up.
You can permanently delete all minimum maximum value ranges for selected data sets and organisation units in the Data Administration app.
Open the Data Administration app and click Min-max value generation.
Select data set(s).
Select an Organisation unit. Note, that the selection cascades to descendant organisation units!
Click Remove.

Verify that you've created minimum maximum value ranges.
Open the Data Quality app and click Outlier Detection.
Select data set(s).
Select Parent organisation unit.
Multiple organisation units can be selected. The analysis is made on raw data for all organisation units in the sub-hierarchy of the selected units, not on aggregated data.
Select From date and To date.
Set Algorithm to Min-max values.
Select Max results
This refers to the maximum number of outliers listed in the results.
Click Start
The analysis process duration depends on the amount of data that is being analysed. If there are standard deviations outliers, they will be presented in a list.

For each outlier, you will see the data element, period, organisation unit, value, deviation, min, and max.
(Optional) Click Download as CSV to download the list in CSV format.
Tip
Click the checkbox to mark the value for further follow-up.
The follow-up analysis creates a list of all data values marked for follow-up. You can mark a data value for follow-up in the Data Entry app and in the result list you get from a standard deviation outlier or minimum maximum outlier analysis.

Open the Data Quality app and click Follow-up analysis.
Select a data set or multiple data sets.
Select Organisation units.
Multiple organisation units can be selected. The analysis is made on raw data “under” the organisation unit, not on aggregated data.
Select a Start Date and End Date which defines the periods which you are interested in looking for values which have been marked for follow up.
Press Follow up to generate a list of values which have been marked for follow up.
(Optional) Click Download as PDF, Download as Excel or Download as CSV to download the validation violations list in PDF, Excel or CSV formats.

Tip
Check the Unfollow checkbox in the list and click the Unfollow-button to remove the follow-up tags from the marked data values. You can also enter a comment in the field to indicate any additional information regarding the value.
In the Capture app you register events that occurred at a particular time and place. An event can happen at any given point in time. This stands in contrast to routine data, which is captured for predefined, regular intervals. Events are sometimes called cases or records. In DHIS2, events are linked to a program. The Capture app lets you select the organisation unit and program and specify a date when an event happened, before entering information for the event. Some events are linked to a tracked entity instance, for example a person, allowing longitudinal follow-up.
Open the Capture app.
Select an organisation unit.
Select an event program.
You will only see programs associated with the selected organisation unit and programs you have access to, and that are shared with your user group through data level sharing.
If the program has a category combination set the category option will have to be selected.
Click Create new event.

Fill in the required information. If the programs program stage is configured to capture a location:
If the field is a coordinate field you can either enter the coordinates directly or you can click the map icon to the left of the coordinate field. The latter one will open a map where you can search for a location or set on directly by clicking on the map.
If the field is a polygon field you can click the map icon to the left of the field. This will open a map where you can search for a location and capture a polygon (button in the upper right corner of the map).
If desired, you can add a note by clicking the Write note button at the bottom of the form. Be aware that Event notes are attributed to a user and cannot be deleted.
If desired you can add a relationship by clicking the Add relationship button at the bottom of the form. See the section about Adding a relationship for more information.
Click Save and exit or click the arrow next to the button to select Save and add another.
Note
Some data elements in an event might be mandatory (marked with a red star next to the data element label). All mandatory data elements must be filled in before the user is allowed to complete the event. The exception to this is if the user has the authority called "Ignore validation of required fields in Tracker and Event Capture". If the user has this authority, the mandatory data elements will not be required and the red star will not be displayed next to the data element label. Note that super user that have the "ALL" authority automatically have this authority.
Tip
The data entry form can also be displayed in row view. In this mode the data elements are arranged horizontally. This can be achieved by clicking the Switch to row view button on the top right of the data entry form. If you are currently in row view you can switch to the default form view by clicking the Switch to form view button on the top right of the data entry form.
There are two different ways one can register a tracked entity instance under an organisation unit. The first way, is to register a tracked entity instance without enrolling it to a tracker program. The second option, is to register a tracked entity instance with program and enroll it.
Open the Capture app.
Select an organisation unit.
Click Create new.

You'll now be navigated to the registration page. In that page you will see a drop down menu similar to the one in the image below. From the dropdown menu you can select a tracked entity type, eg. Building, Person etc.

Select the tracked entity type which you want to create a new instance for.

The moment you select a tracked entity type, a form will be shown on the screen.
The "Profile" section will be shown. In this section you can add data relevant to the tracked entity instance. The profile section mainly contains all the tracked entity attributes linked to the tracked entity type.

Fill in the required information.
If the tracked entity type is configured to capture a location:
If the field is a coordinate field you can either enter the coordinates directly or you can click the map icon to the left of the coordinate field. The latter one will open a map where you can search for a location or set on directly by clicking on the map.
If the field is a polygon field you can click the map icon to the left of the field. This will open a map where you can search for a location and capture a polygon (button in the upper right corner of the map).
Click the Save person button to register the tracked entity instance.
You will now be prompted to the tracked entity instance dashboard.
The dashboard will show relevant information about the newly created tracked entity instance.
Open the Capture app.
Select an organisation unit.
Select a tracker program of your choice.
Click Create new person. Note that the label of this button corresponds to the tracked entity type of the program, which could vary, such as "Building," "Person," etc.

Now, you will be able to see a form similar to the image below.
The enrollment form has different layouts depending on how the program is customized. The top section has the title "Enrollment", and it holds all the relevant information about the enrollment details. This section will always be present, regardless of layout. Underneath, the different data input fields relevant to the tracked entity instance will be displayed. These fields will either be displayed within sections or as a completely custom form. The sections, or custom form, mainly contains all the tracked entity attributes linked to the program or tracked entity type.

Fill in the required information for the enrollment. If the tracked entity type is configured to capture a location:
If the field is a coordinate field you can either enter the coordinates directly or you can click the map icon to the left of the coordinate field. The latter one will open a map where you can search for a location or set on directly by clicking on the map.
If the field is a polygon field you can click the map icon to the left of the field. This will open a map where you can search for a location and capture a polygon (button in the upper right corner of the map).
Click Save person to register the tracked entity instance. The Save button shows a loading spinner and the Cancel button is disabled while the request is processing.
You will now be prompted to the tracked entity instance dashboard.
The dashboard will show relevant information about the newly created tracked entity instance.
Note
Some data elements in an event might be mandatory (marked with a red star next to the data element label). All mandatory data elements must be filled in before the user is allowed to complete the event. The exception to this is if the user has the authority called "Ignore validation of required fields in Tracker and Event Capture". If the user has this authority, the mandatory data elements will not be required and the red star will not be displayed next to the data element label. Note that super user that have the "ALL" authority automatically have this authority.
Tip
The data entry form can also be displayed in row view. In this mode the data elements are arranged horizontally. This can be achieved by clicking the Switch to row view button on the top right of the data entry form. If you are currently in row view you can switch to the default form view by clicking the Switch to form view button on the top right of the data entry form.
Events can automatically be created when enrolling in a program.
To automatically generate events, you can do the necessary configuration in the maintenance app. 1. Open the maintenance app
Select the Program tab 
Select a Tracker program 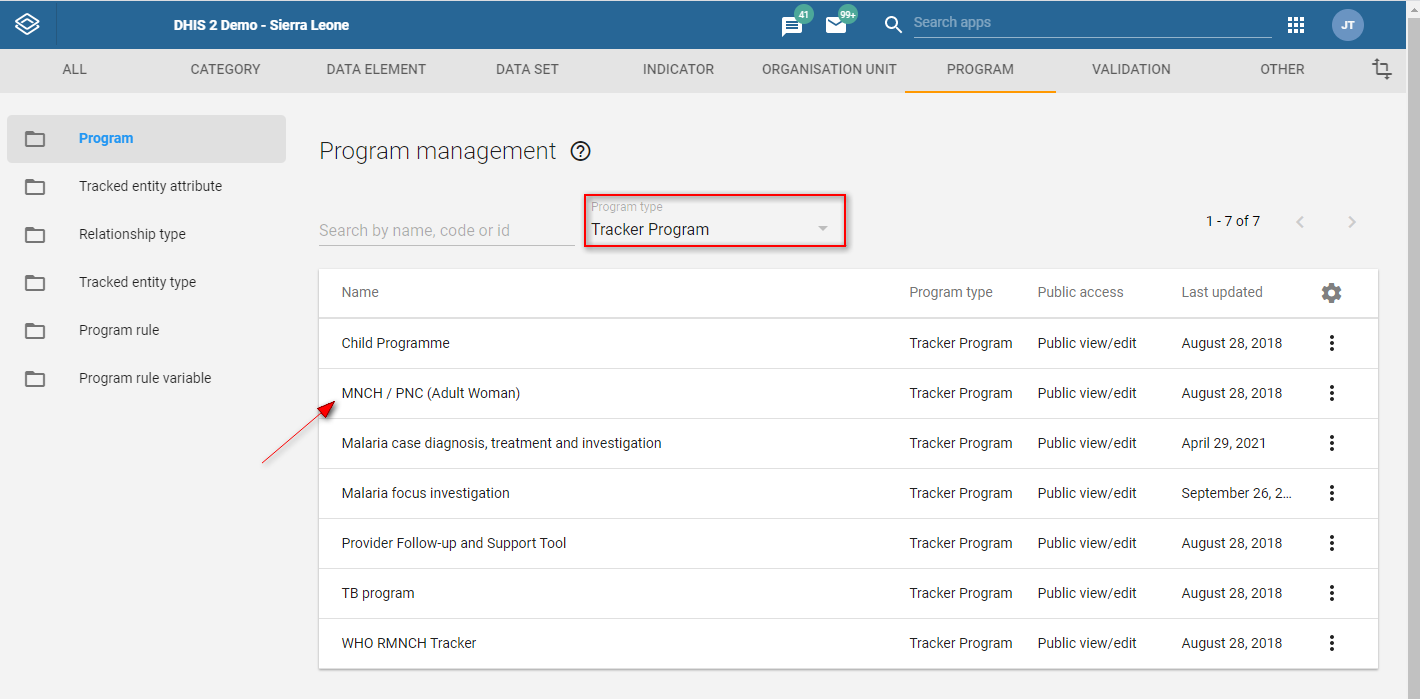
Select the Program stages tab 
Click on the program stage you would like to generate an event for 
Select "Auto-generate event" 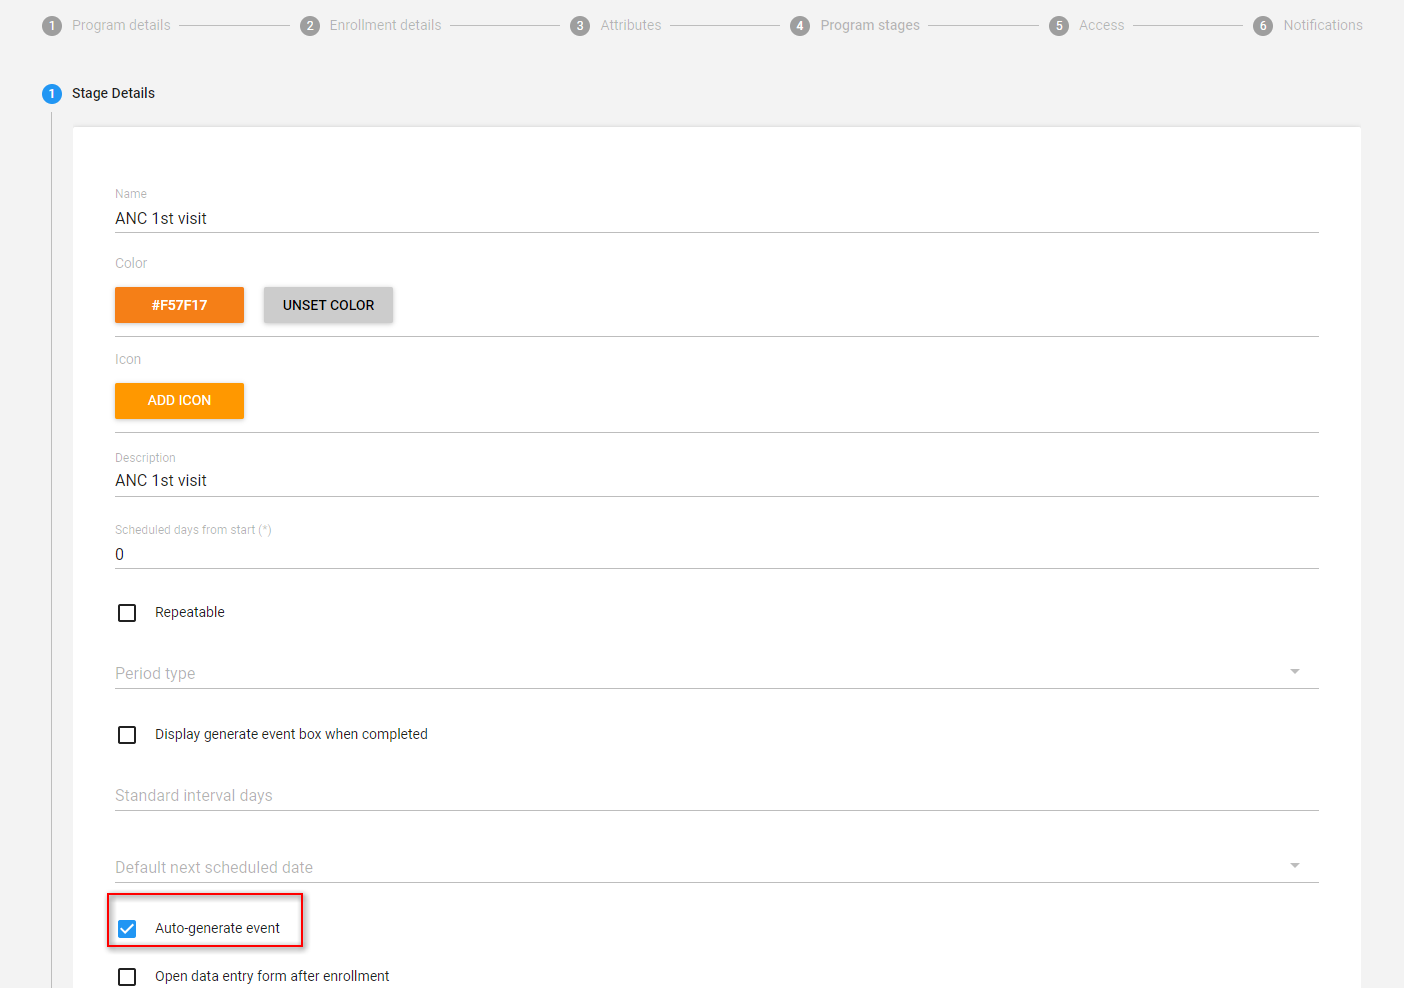
You can set multiple program stages within a program to be auto-generating (this will create an event for each program stage configured this way)
A program can be configured to automatically take the user to register a new event immediately after enrolling a tracked entity instance. To enable this behavior, the program must have at least one program stage with the "Open data entry form after registration" option checked. If more than one program stage has this option enabled, the first stage will be used.
To configure it, you must follow the steps described in the Enrollment with auto generated events section and then check the option "Open data entry form after enrollment".
For tracker programs enable the "First stage appears on registration page" flag in the Maintenance. The enrollment registration page will now display the first program stage the user has access to.

If the stage has the "Open data entry form after enrollment" selected, then the event will be generated into the ACTIVE status. Also its execution date will be calculated for the event, in addition to a due date. The generation happens based on either the enrollment date or the incident date. You can choose the reporting date from the dropdown menu "Report date to use". 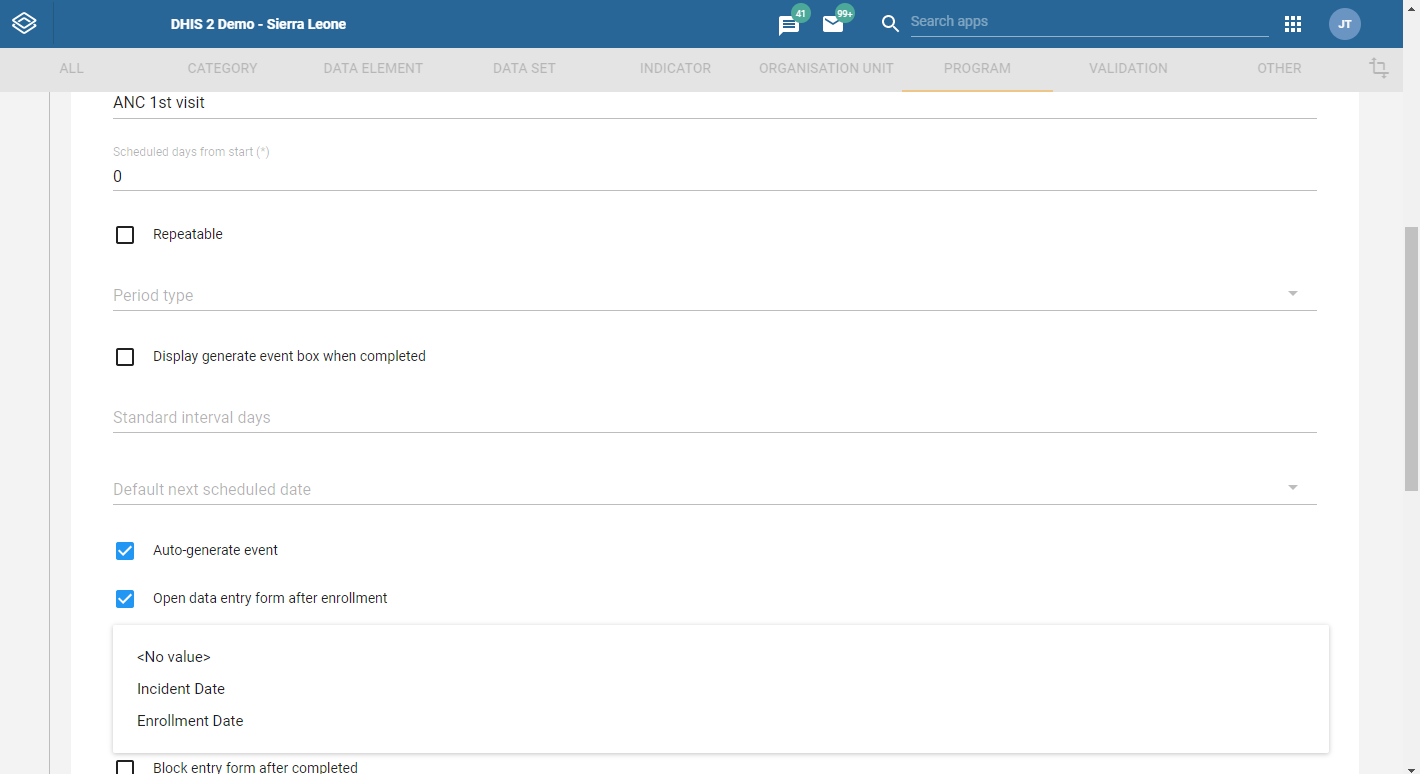
As shown in the image you have three options, a) Incident date b) Enrollment date or c) No value. Choosing reporting date as "Incident date" indicates that both the event execution date and due date will be the same as the incident date. Choosing reporting date as either "Enrollment date" or "No value" indicates that both the event execution date and due date will be the same as the enrollment date.
When the "Open data entry after enrollment" is not checked, it means that the event generated will be a SCHEDULE event. The scheduled event does not have an execution date, but only a due date. The due date for these future events are calculated based on either enrollment date or incident date. If the flag below is checked, the reference date is the enrollment date, if the flag is not checked, the incident date is used. 
When there is no incident date, the reference date will fall back on the enrollment date regardless of whether the flag above is checked.
On SCHEDULE type of events the user can also configure the "Scheduled days from start". Which means if a stage has a number in "Scheduled days from start" the reference date will increased by that number. In the example below we increase the due date by 30 days.
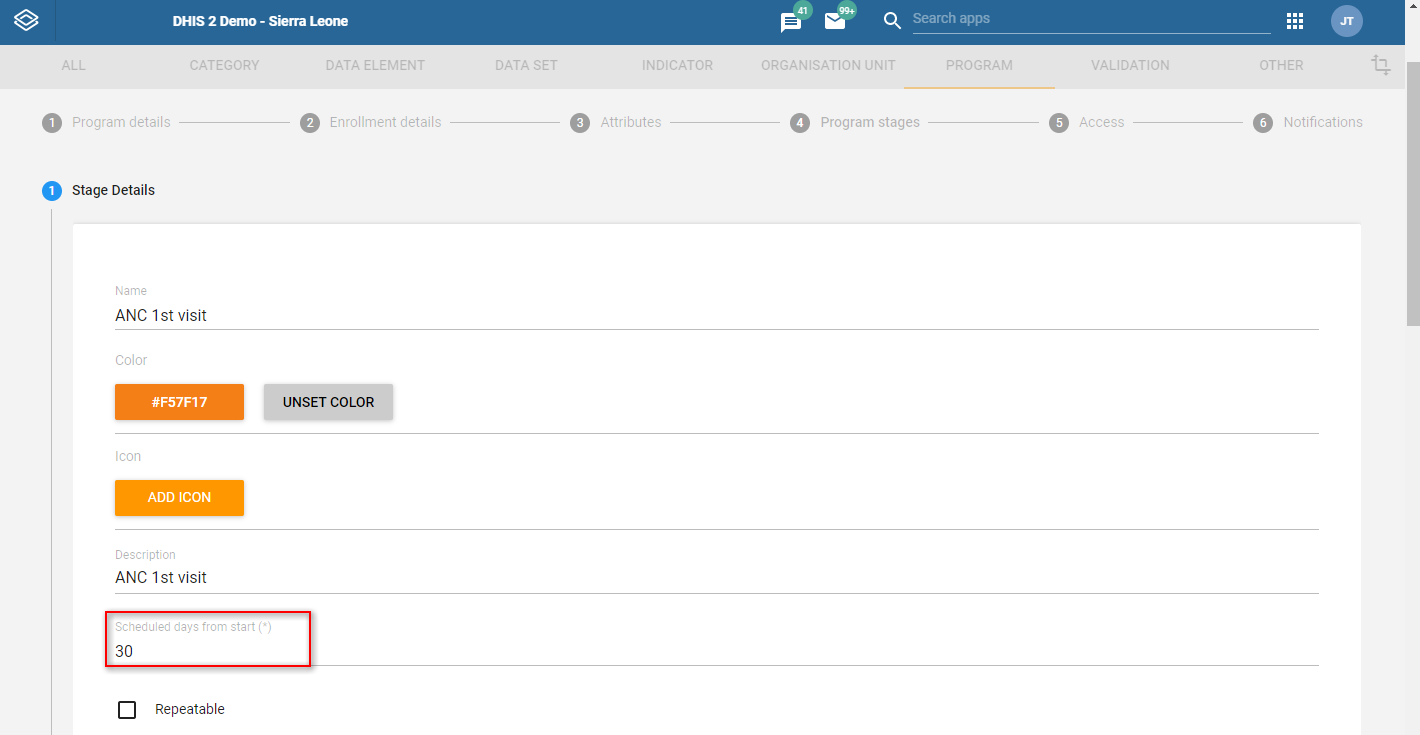
When the "Scheduled days from start" does not contain a number or contains 0 the reference date is used without adding any days to it.
In both cases of registering a tracked entity instance, (with enrollment or without enrollment) the system will start looking for possible duplicates. Note that programs need to be correctly configured through the maintenance app for the system to start detecting duplicates when enrolling a new person in a program.
To configure a program through the maintenance app you will have to:
Open the maintenance app. 
In the program section select your program. We select Child Programme for this example. 
Select the Attributes tab. 
Enable duplicates search by checking program attributes as searchable 
The attributes you have selected as "Searchable" will be the ones which the system will use to detect possible duplicates against.
Let us explain this with an example that demonstrates the detection of possible duplicates while enrolling a child in the Child Programme.
Open the Capture app. 
Select your organisation unit and program from the menu on the top. 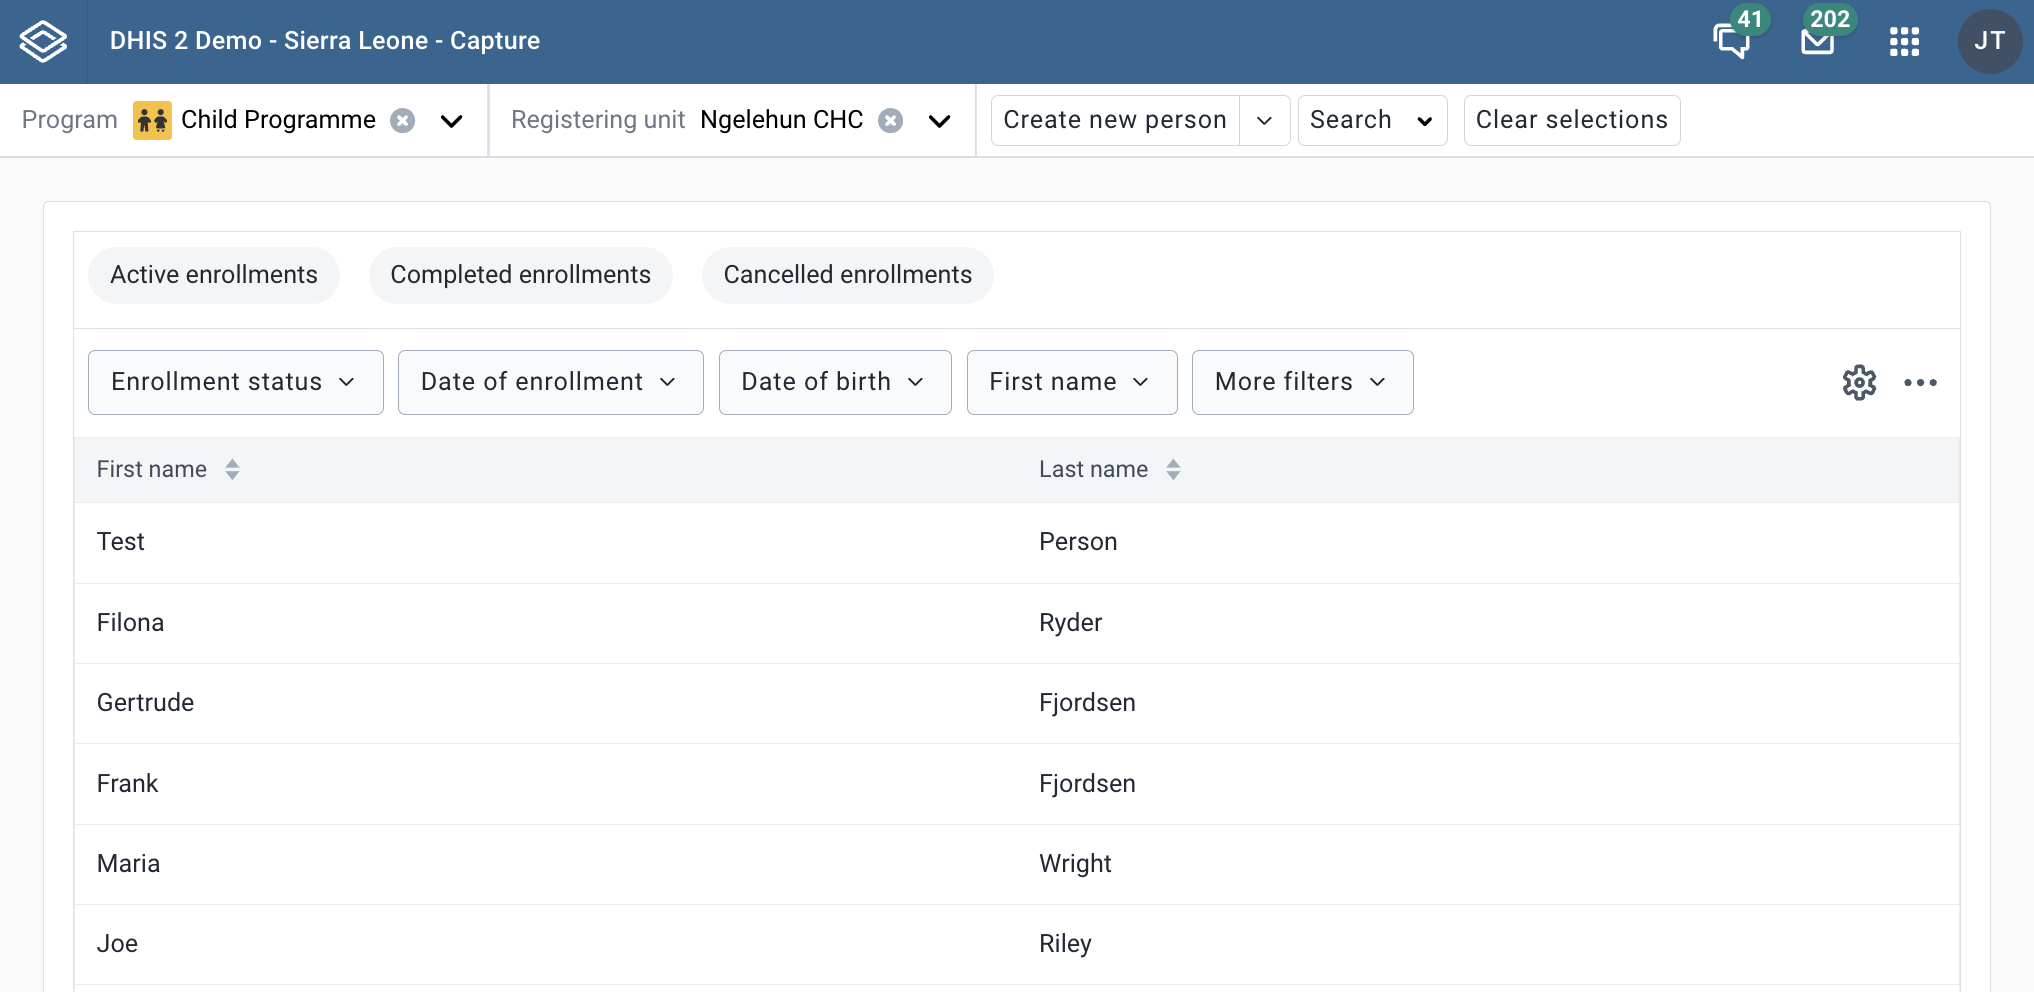
Click Create new person 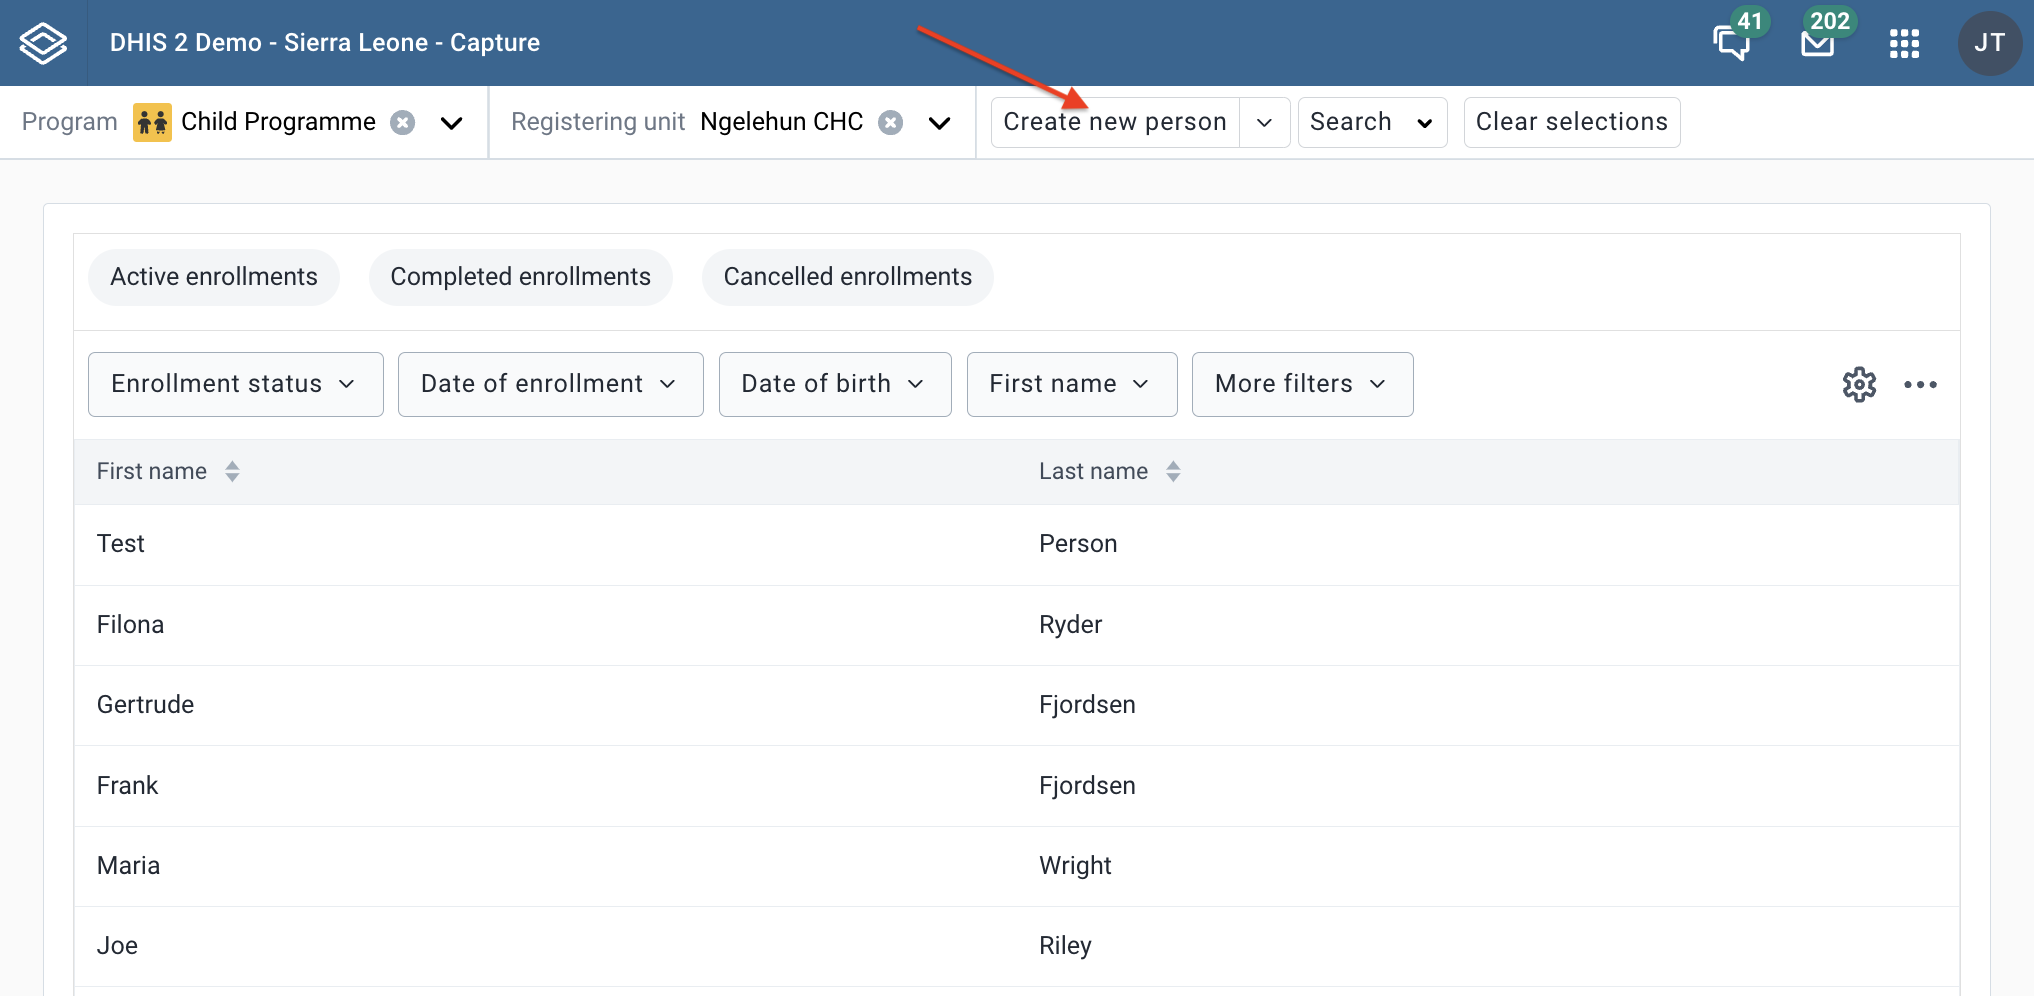
Fill in the first name in the form. Remember, the first name we have checked as "Searchable" in the maintenance app. Click Save person. The system will start looking for possible duplicates that match the name Sarah. 
The system will automatically show a list of possible duplicates if there are any. 
You can choose to make a new enrollement by clicking Save as new or if you see the right person in the list - you can view the dashboard. 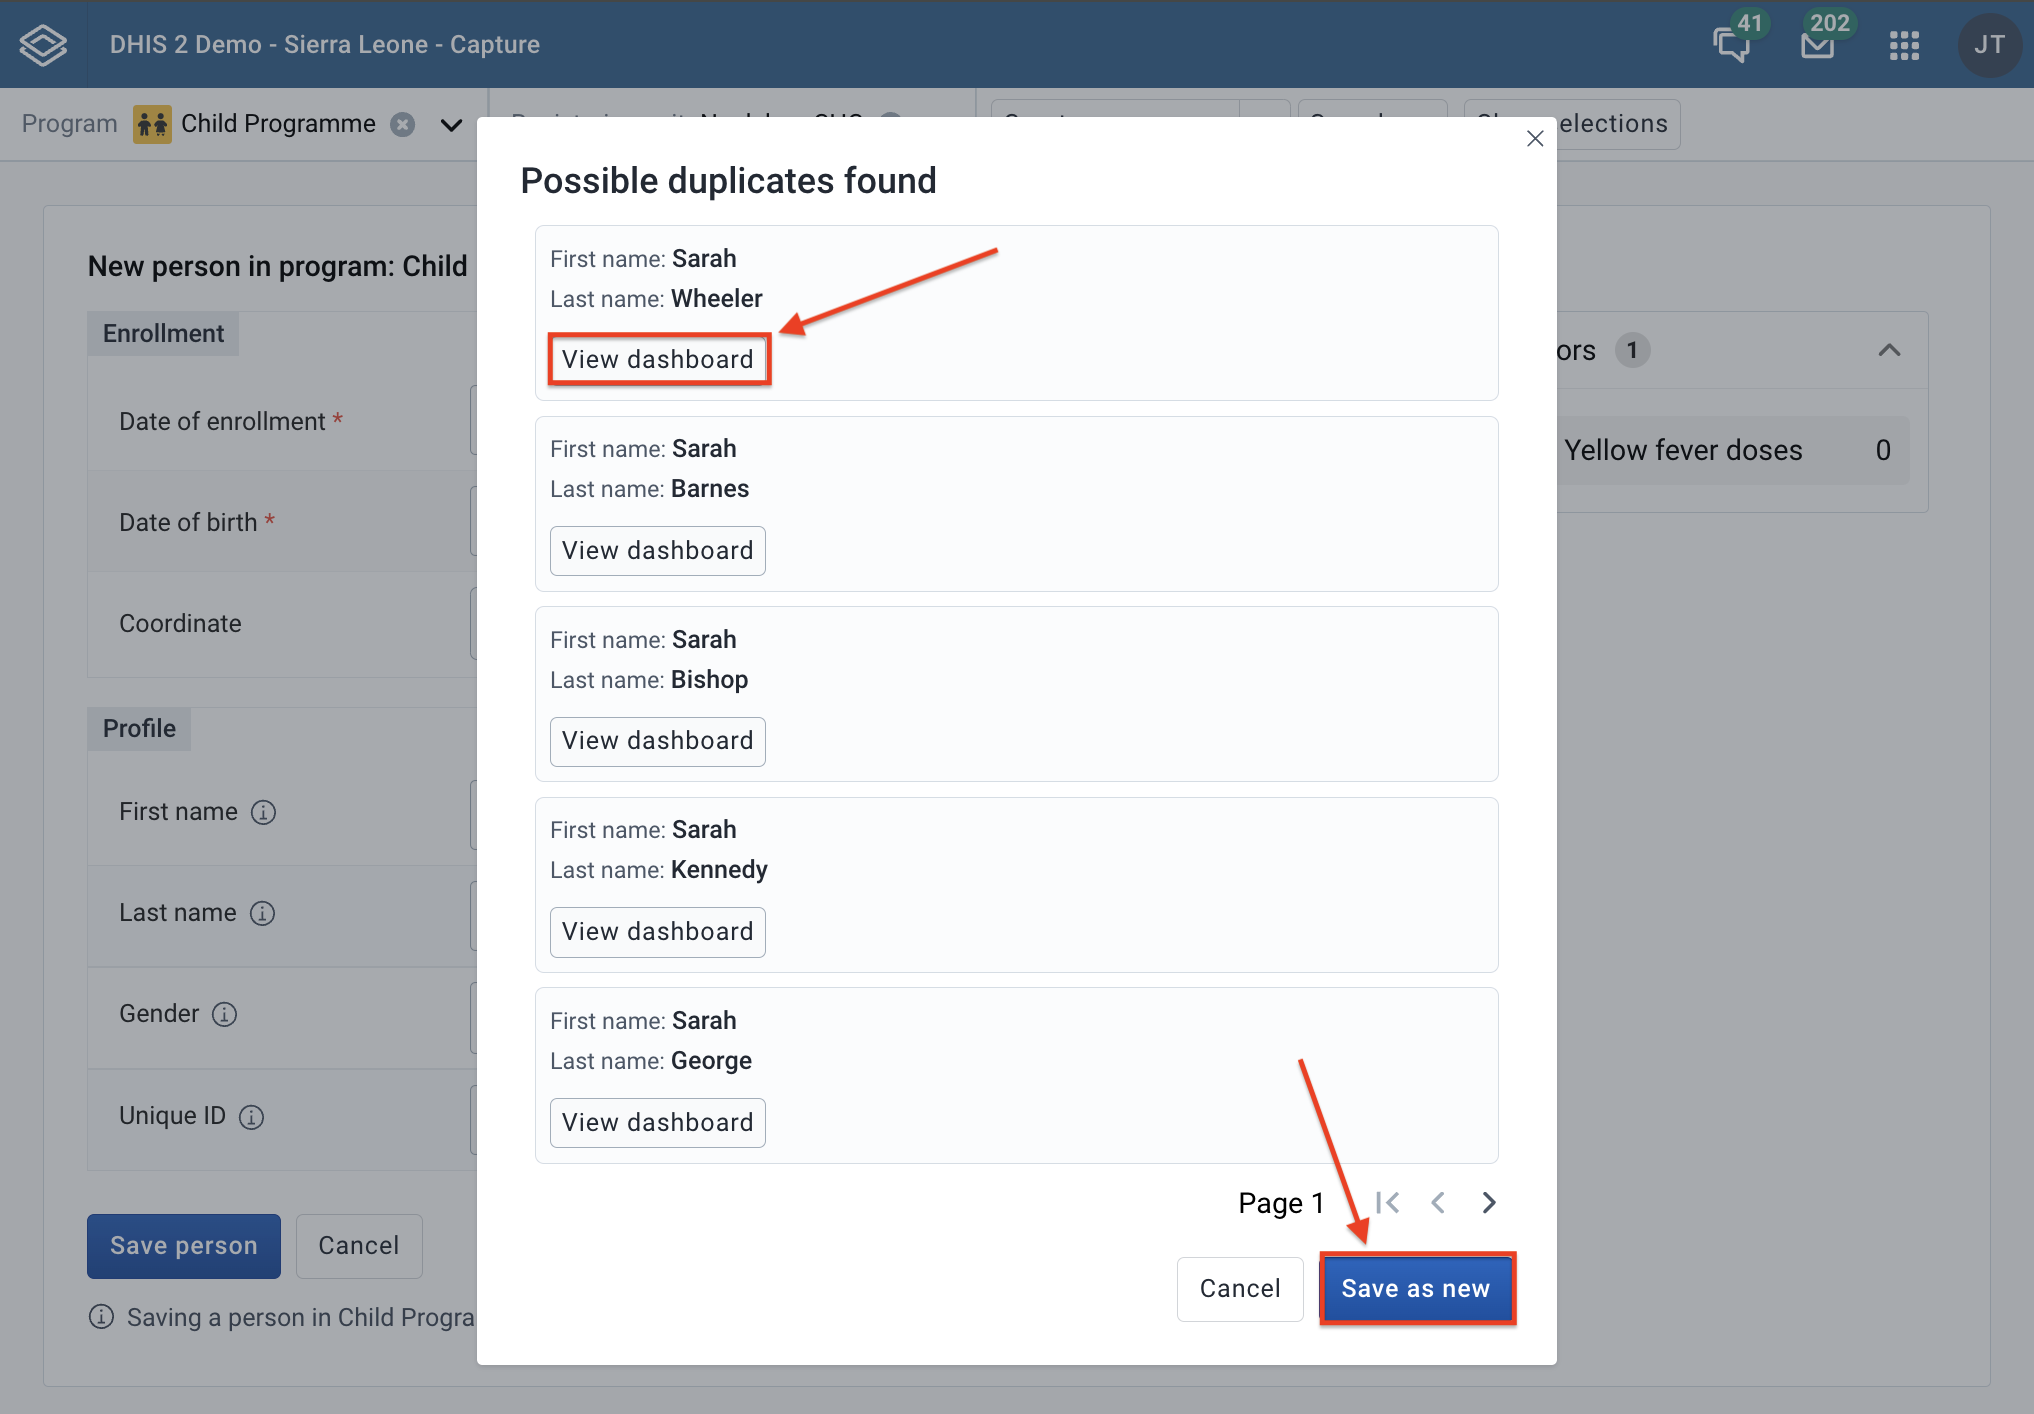
Tip
You can configure duplicates detection for tracked entity types the same way as we did for programs.
In both cases of registering a tracked entity instance (with enrollment or without enrollment), the system will run program rules you have configured. Note that rules can be configured in the maintenance app.
To see a rule being executed while enrolling a tracked entity instance you will have to take the following steps.
Configure a rule in the maintenance app. For the example below we configured a rule that throws a warning when the date of birth is less than a year.
Open the Capture app.
Select your organisation unit and program from the menu on the top. 
Fill in the date of birth with a value which is less than a year. In our case this is 27th of January 2021. 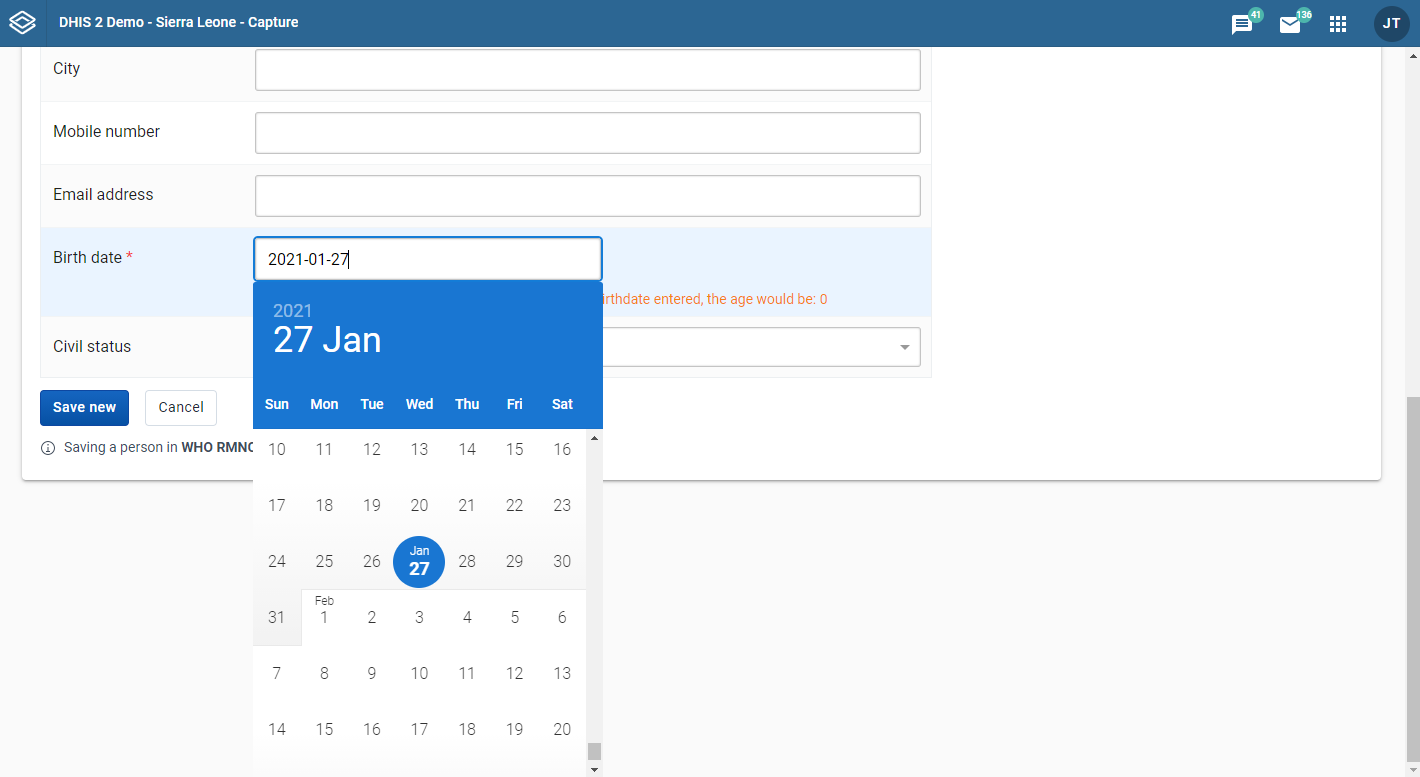
You will now be able to see the warning produced by the program rule underneath the birth date field. 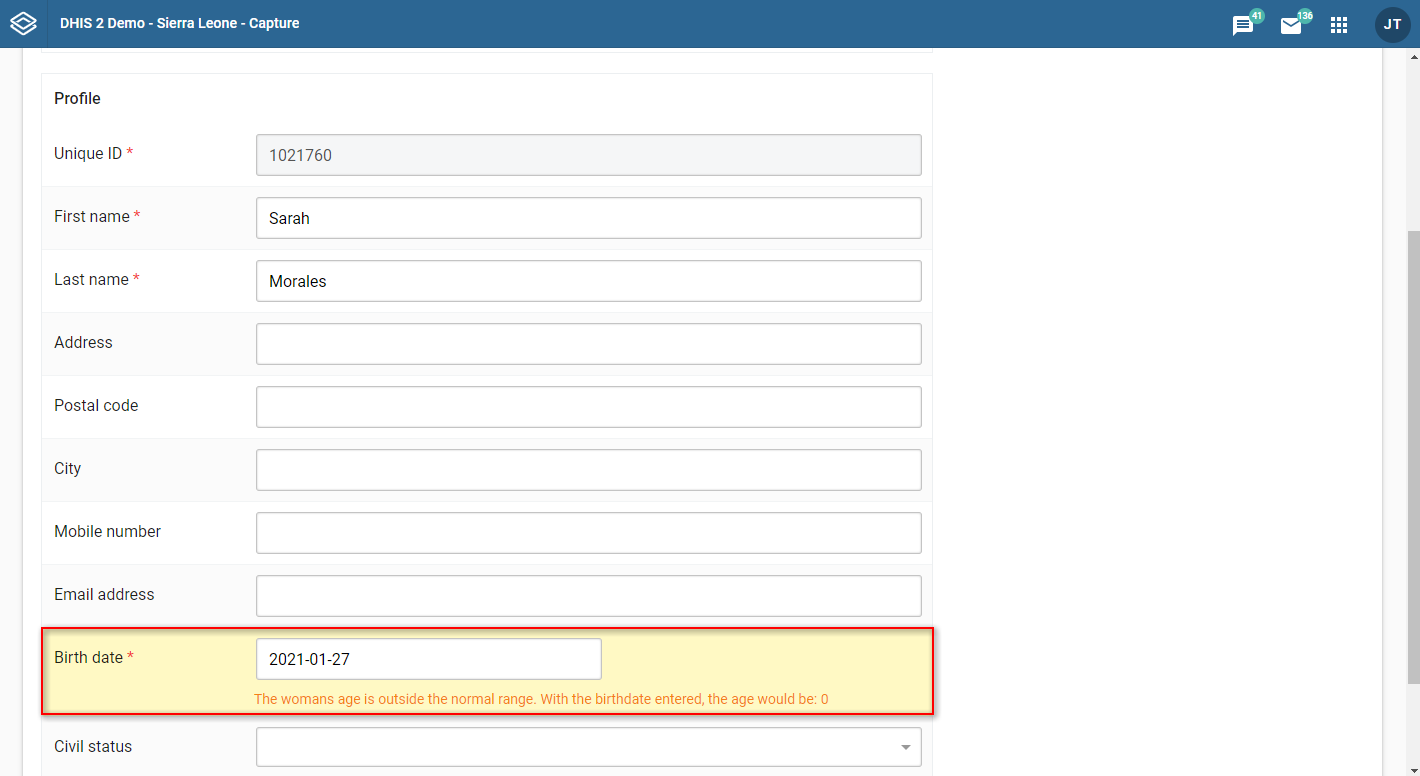
When you are on the re-enroll page, the teId will be visible in the URL parameters. The attributes of the tracked entity instance will be pre-fielded with the current values. 
Relationships can be added either during registration, editing or viewing of an event. Currently the Capture App only supports Event to Tracked Entity Instance relationships.
While in an event, click Add relationship.
Select the relationship type you want to create.
You now have two options:
Link to an existing Tracked Entity Instance or
Create new Tracked Entity Instance.
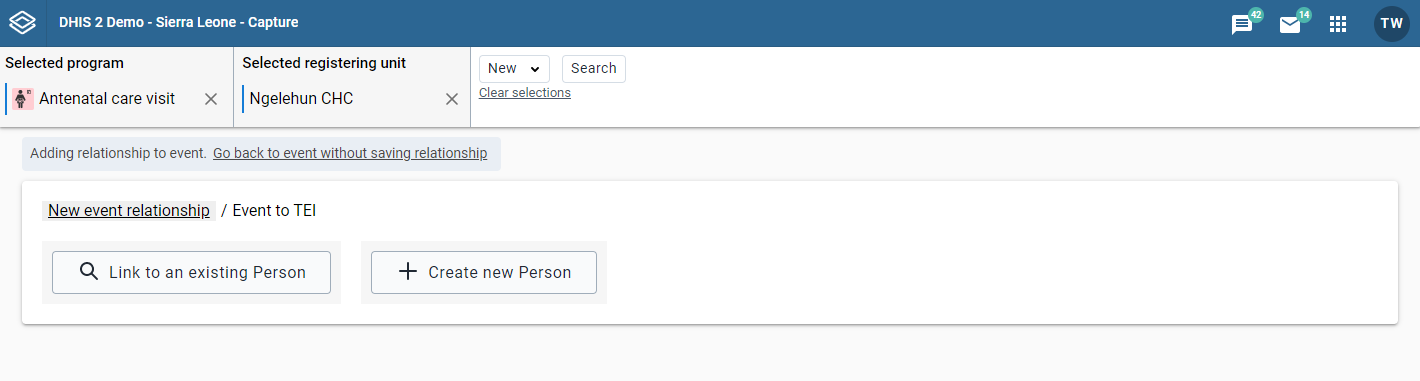
Click Link to an existing Tracked Entity Instance.
You will be presented with some options for searching for a Tracked Entity Instance. You have the option to select a program. If a program is selected the attributes are derived from the selected program. If no program is selected, only the attributes that belong to the Tracked Entity Instance will be visible.
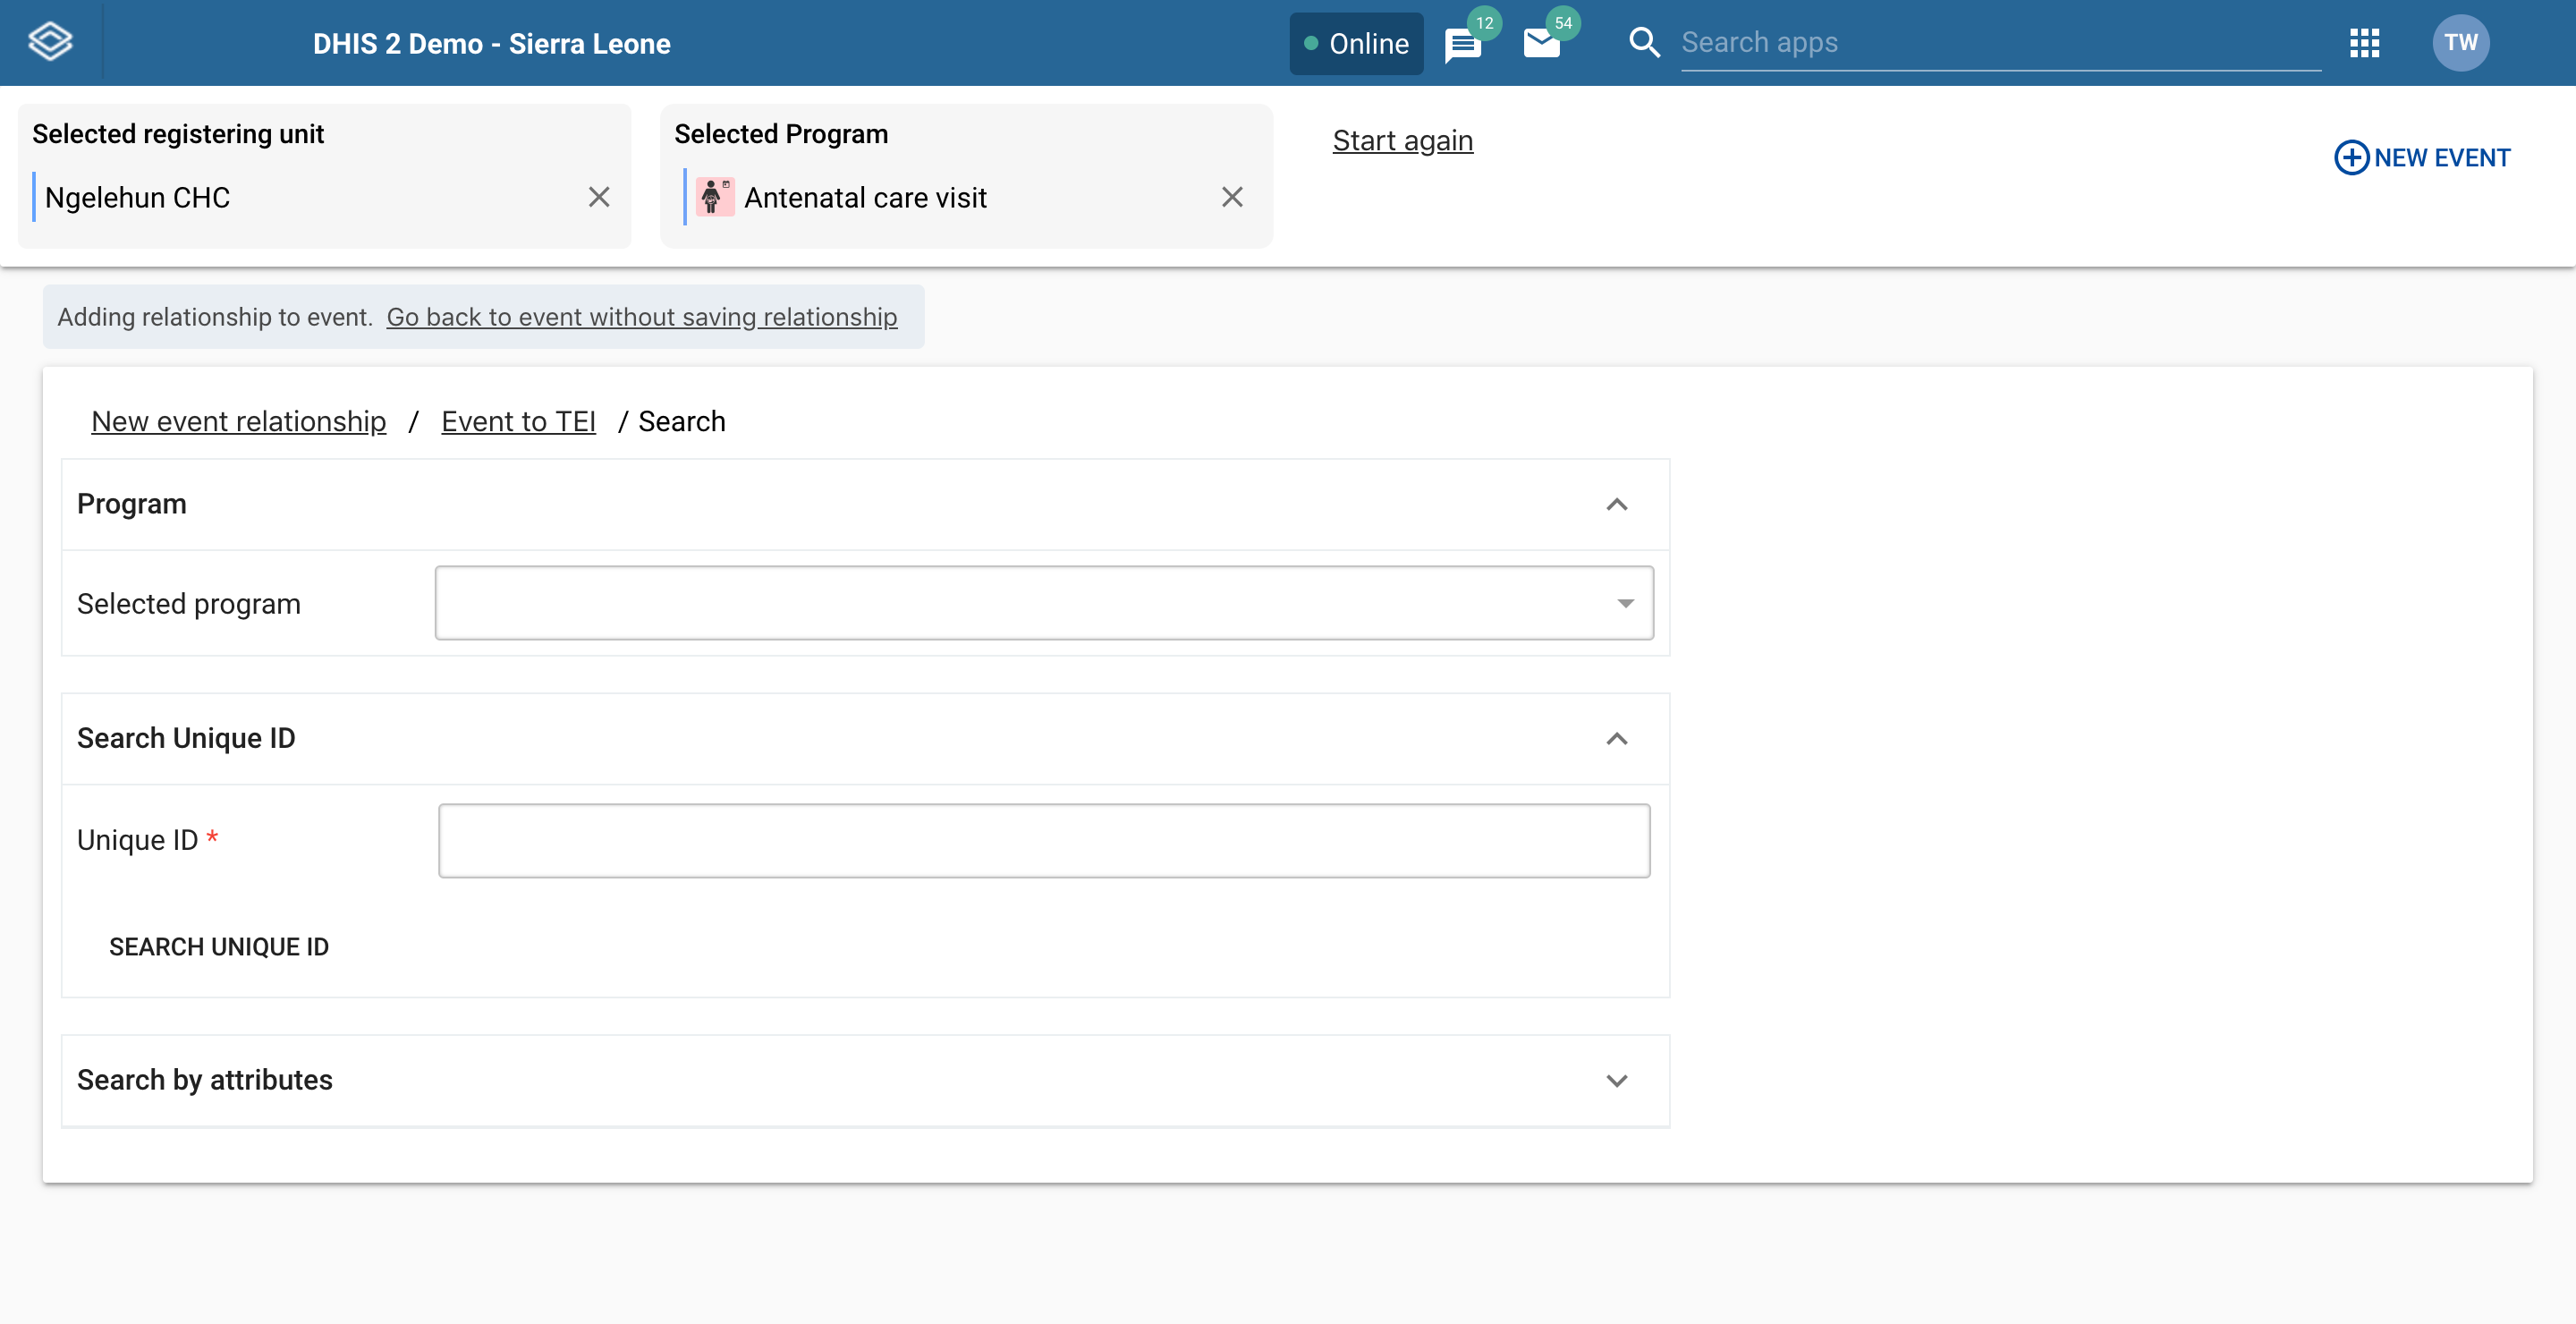
If the Tracked Entity Instance or program is configured with a unique attribute, this attribute can be used for finding a specific Tracked Entity Instance or program. This attribute should be presented alone. When the unique attribute field has been filled out, click the Search button located right below the unique attribute field.
If the Tracked Entity Instance or program has attibutes these can be used for searching by expanding the Search by attributes box. When all desired attribute fields have been filled out, click the Search by attributes button located at the bottom. You can also limit the search by setting the Organisation unit scope. If set to All accessible you will search for the Tracked Entity Instance in all organisation units you have access to. If you select Selected, you will be asked to select which organisation units to search within.
After a successful search you will be presented with a list of Tracked Entity Instances matching the search criteria. To create a relationship click the Link button on the Tracked Entity Instance you would like to create a relationship to.
If you did not find the Tracked Entity Instance you were looking for, you can either click the New search or Edit search buttons. New search will take you to new blank search while Edit search will take you back to the search you just performed keeping the search criteria.
Click Create new Tracked Entity Instance.
You are now presented with a form for registering a new Tracked Entity Instance. You can choose to either register with or without a program. If a program is selected, the new Tracked Entity Instance will be enrolled in said program. You can also change the Organisation unit by removing the one that is automatically set and selecting a new one.

Fill in the desired (and possibly mandatory) attributes and enrollment details.
Click Create Tracked Entity Instance and Link.
Note
When filling in data you might face a warning telling you that a possible duplicate has been found. You can click the warning to see these duplicates and if the duplicate is a match you can choose to link that Tracked Entity Instance by clicking the Link button. If the warning is still present when you are done filling in data, you will not see the Create Tracked Entity Instance and Link button. Instead you will be presented with a button called Review duplicates. When you click this button a list of possible duplicates will be displayed. If any of these duplicates matches the Tracked Entity Instance you are trying to create you can click the Link button, if not you can click the Save as new person button to register a new Tracked Entity Instance.
Open the Capture app.
Select a program.
Select an organisation unit or click the all events-link to view all events accessible to you.
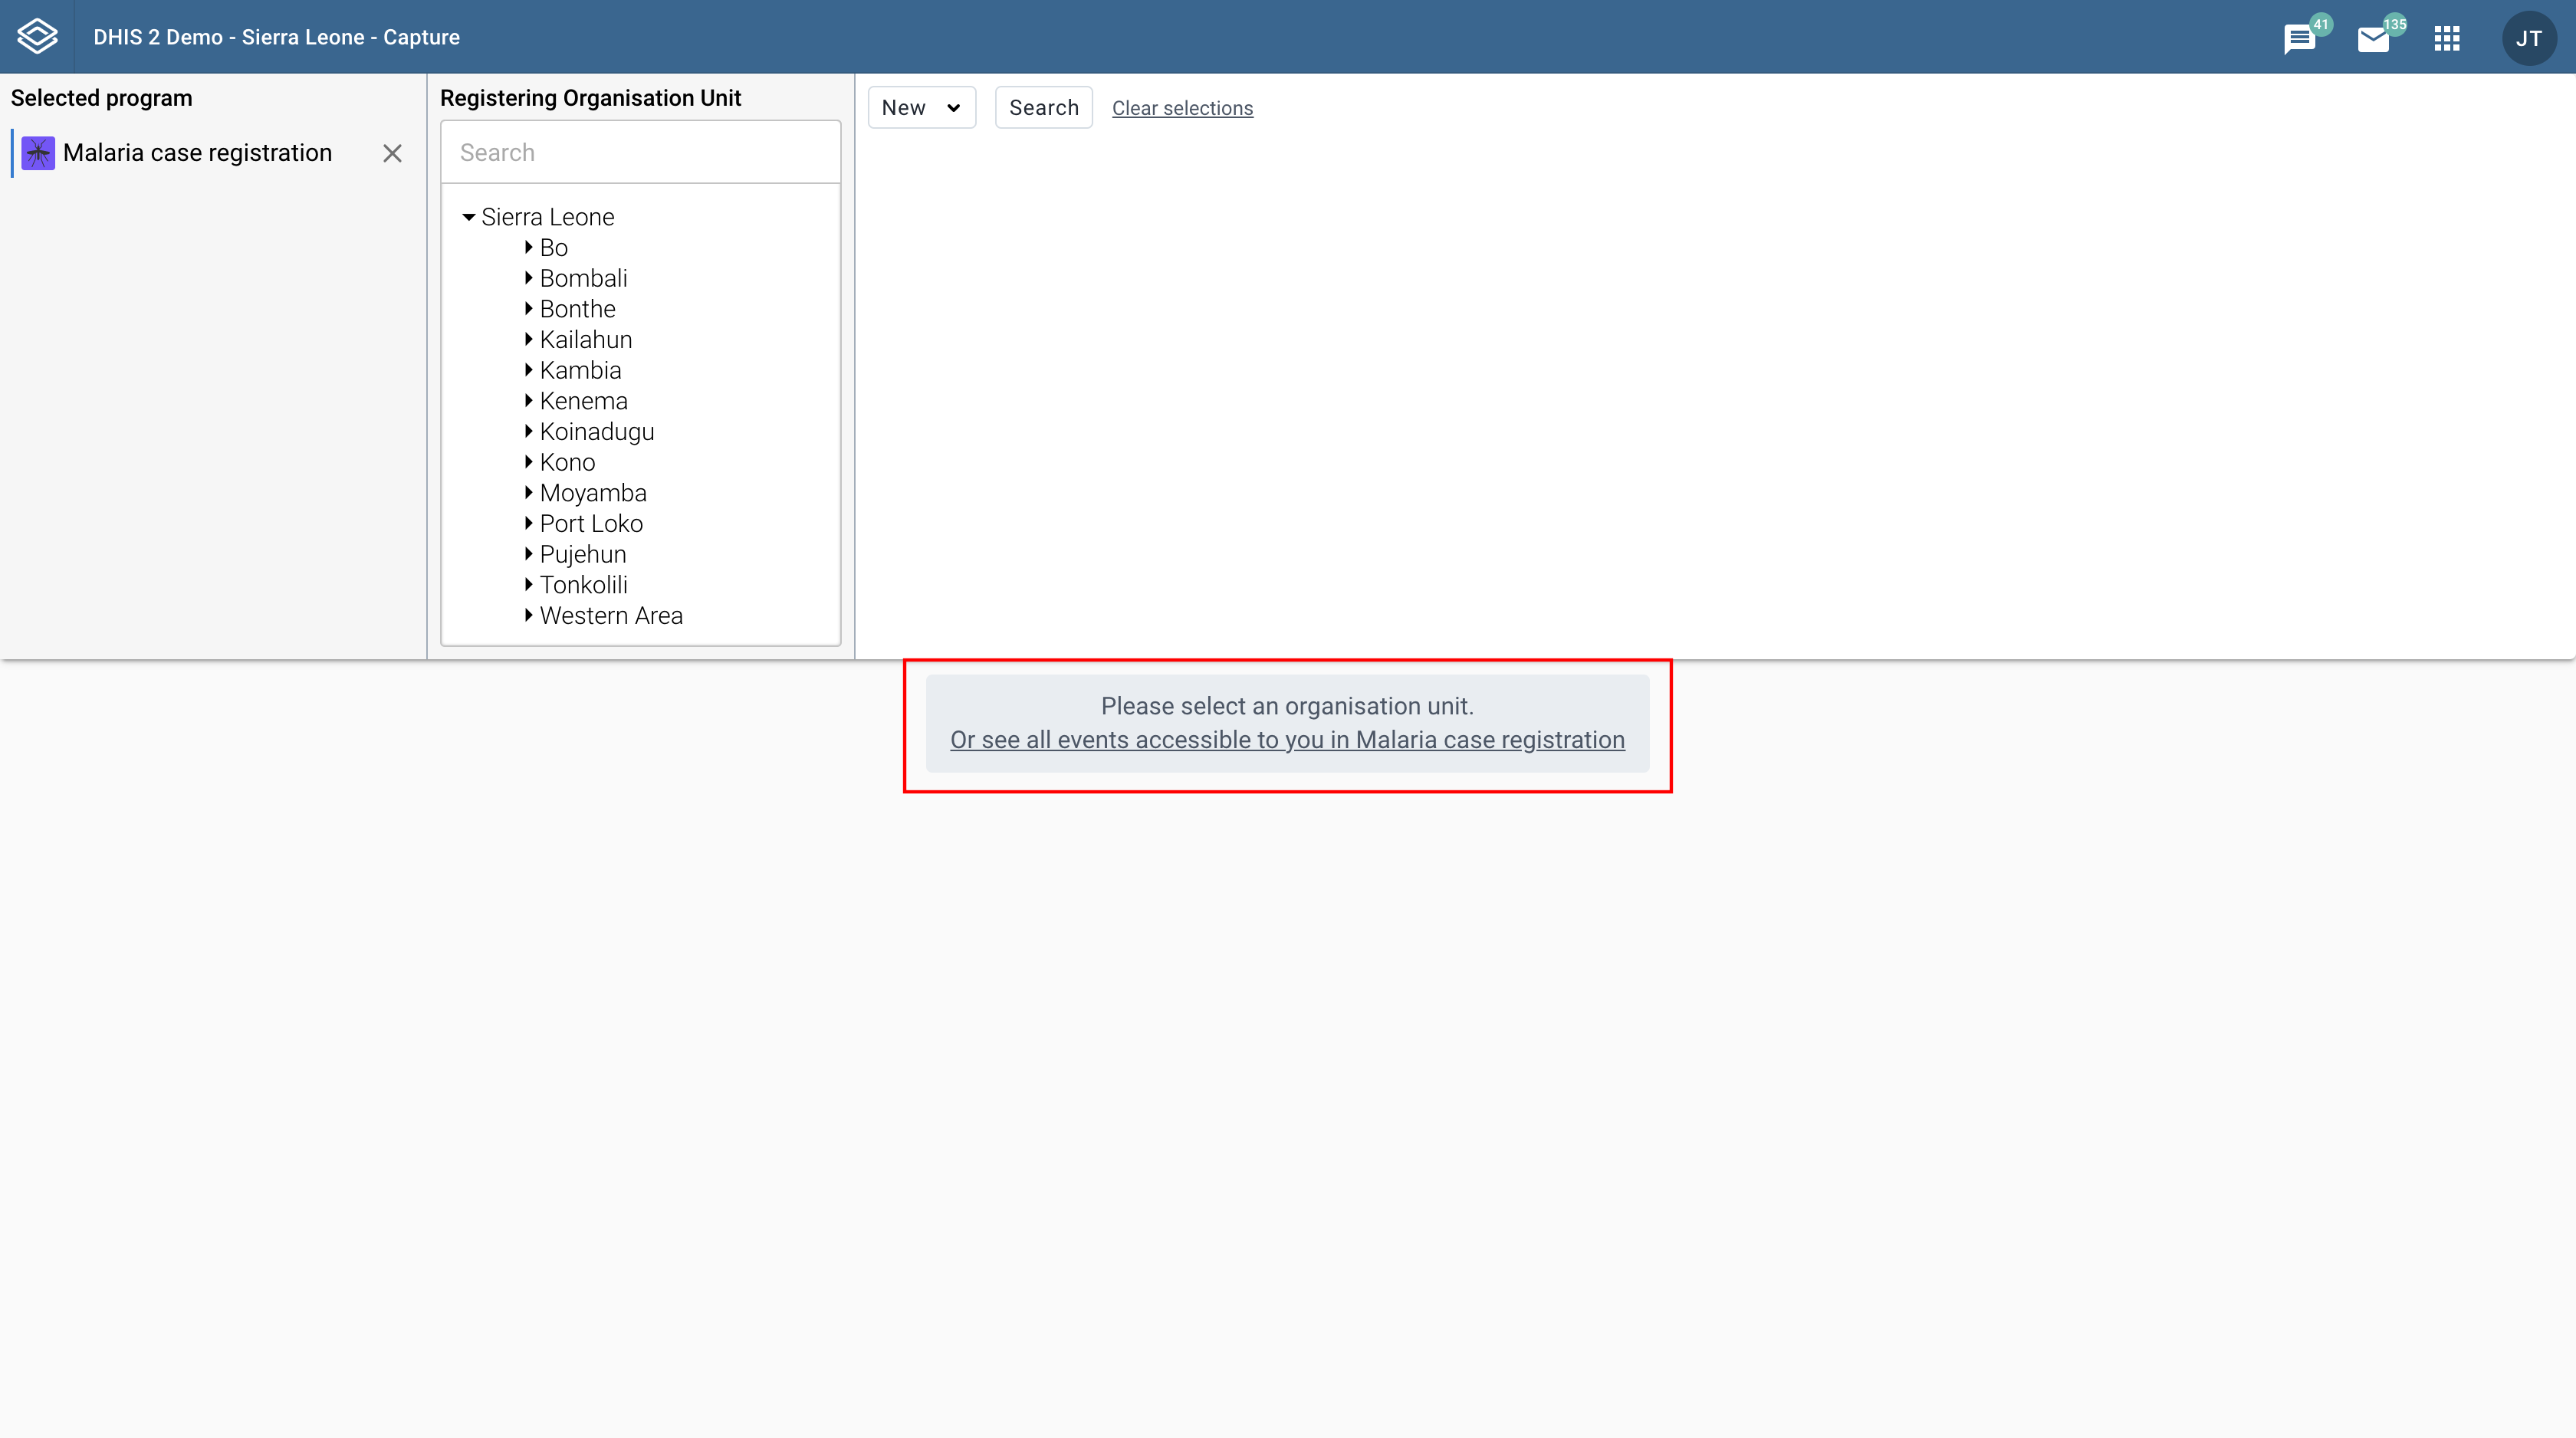 All events registered to the selected program show up in a list.
Click the event you want to modify.
Click the Edit event button.
Modify the event details and click Save.
Note
The Edit event button is disabled if the program stage has Block entry form after completed enabled and your user role does not include the Uncomplete events authority.
Open the Capture app.
Select an organisation unit.
Select a program.
All events registered to the selected program show up in a list.
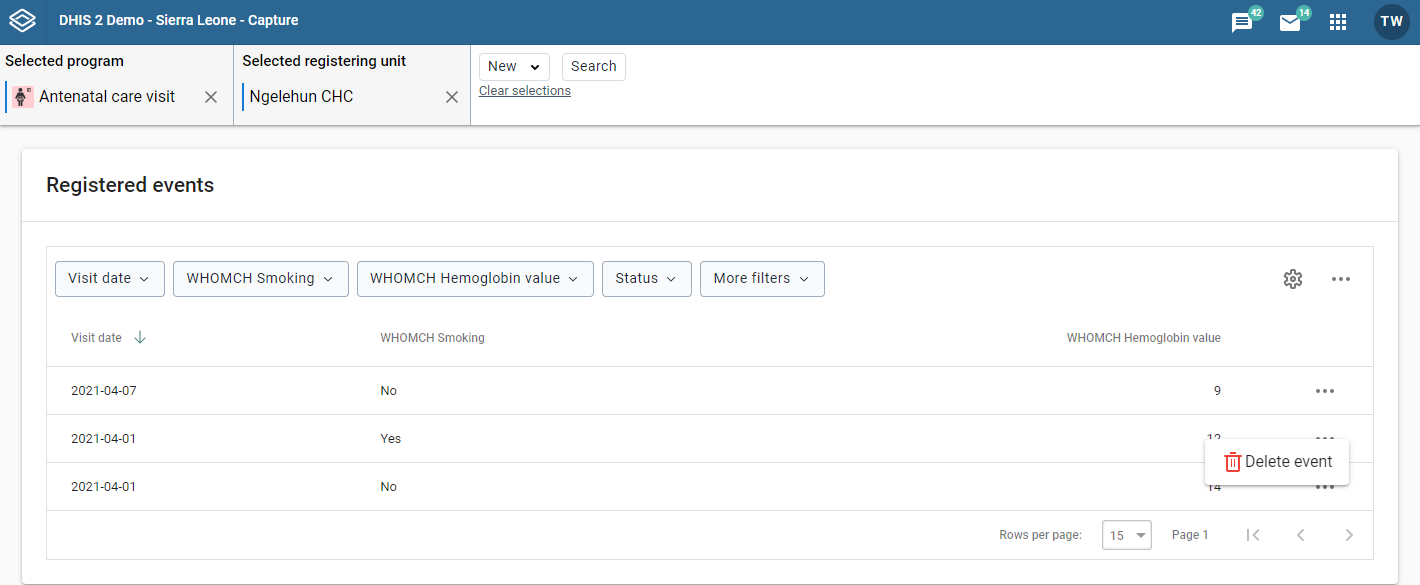
Click the triple dot icon on the event you want to delete.
In the menu that is displayed click Delete event.
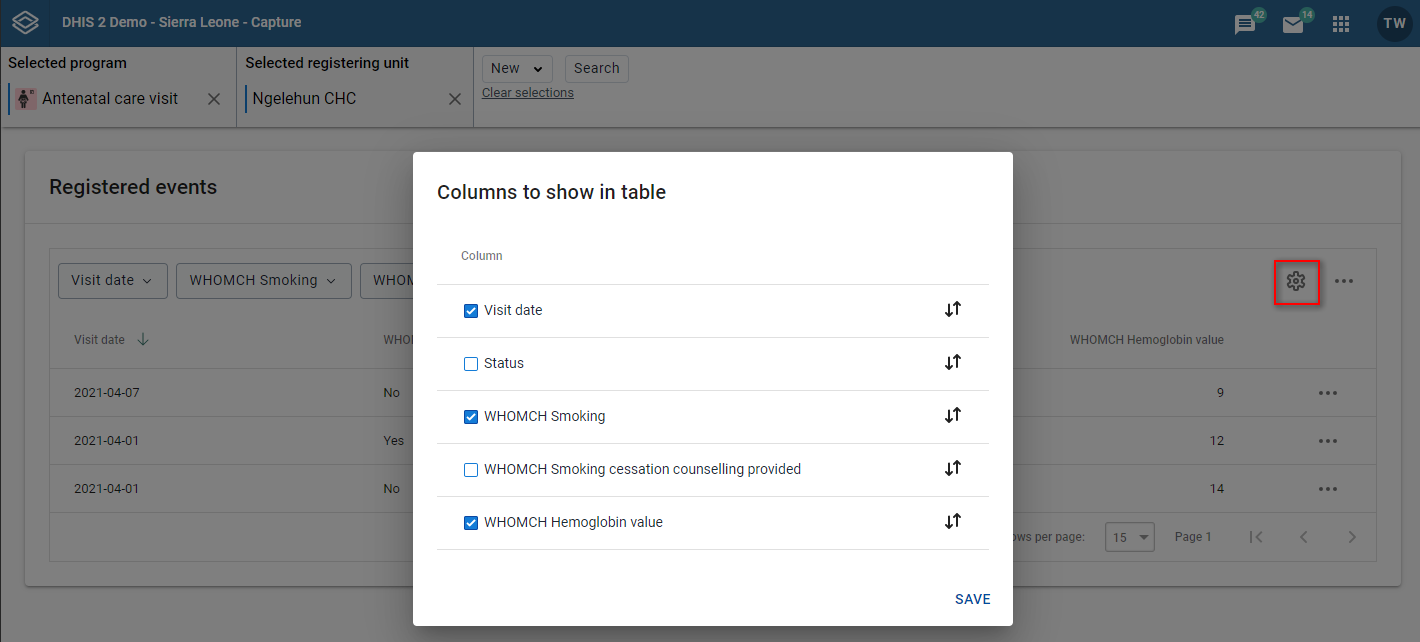
You can select which columns to show or hide in an event list. This can be useful for example when you have a long list of data elements assigned to a program stage.
Open the Capture app.
Select an organisation unit.
Select a program.
All events registered to the selected program show up in a list.
Click the gear icon on the top right of the event list.
Select the columns you want to display and click Save.
Tip
You can reorganize the order of the data elements by draging and dropping them in the list.
Open the Capture app.
Select an organisation unit.
Select a program.
All events registered to the selected program show up in a list.
Along the top of the event list are buttons with the same names as the column headers in the list.
Use the buttons on the top of the list to filter.
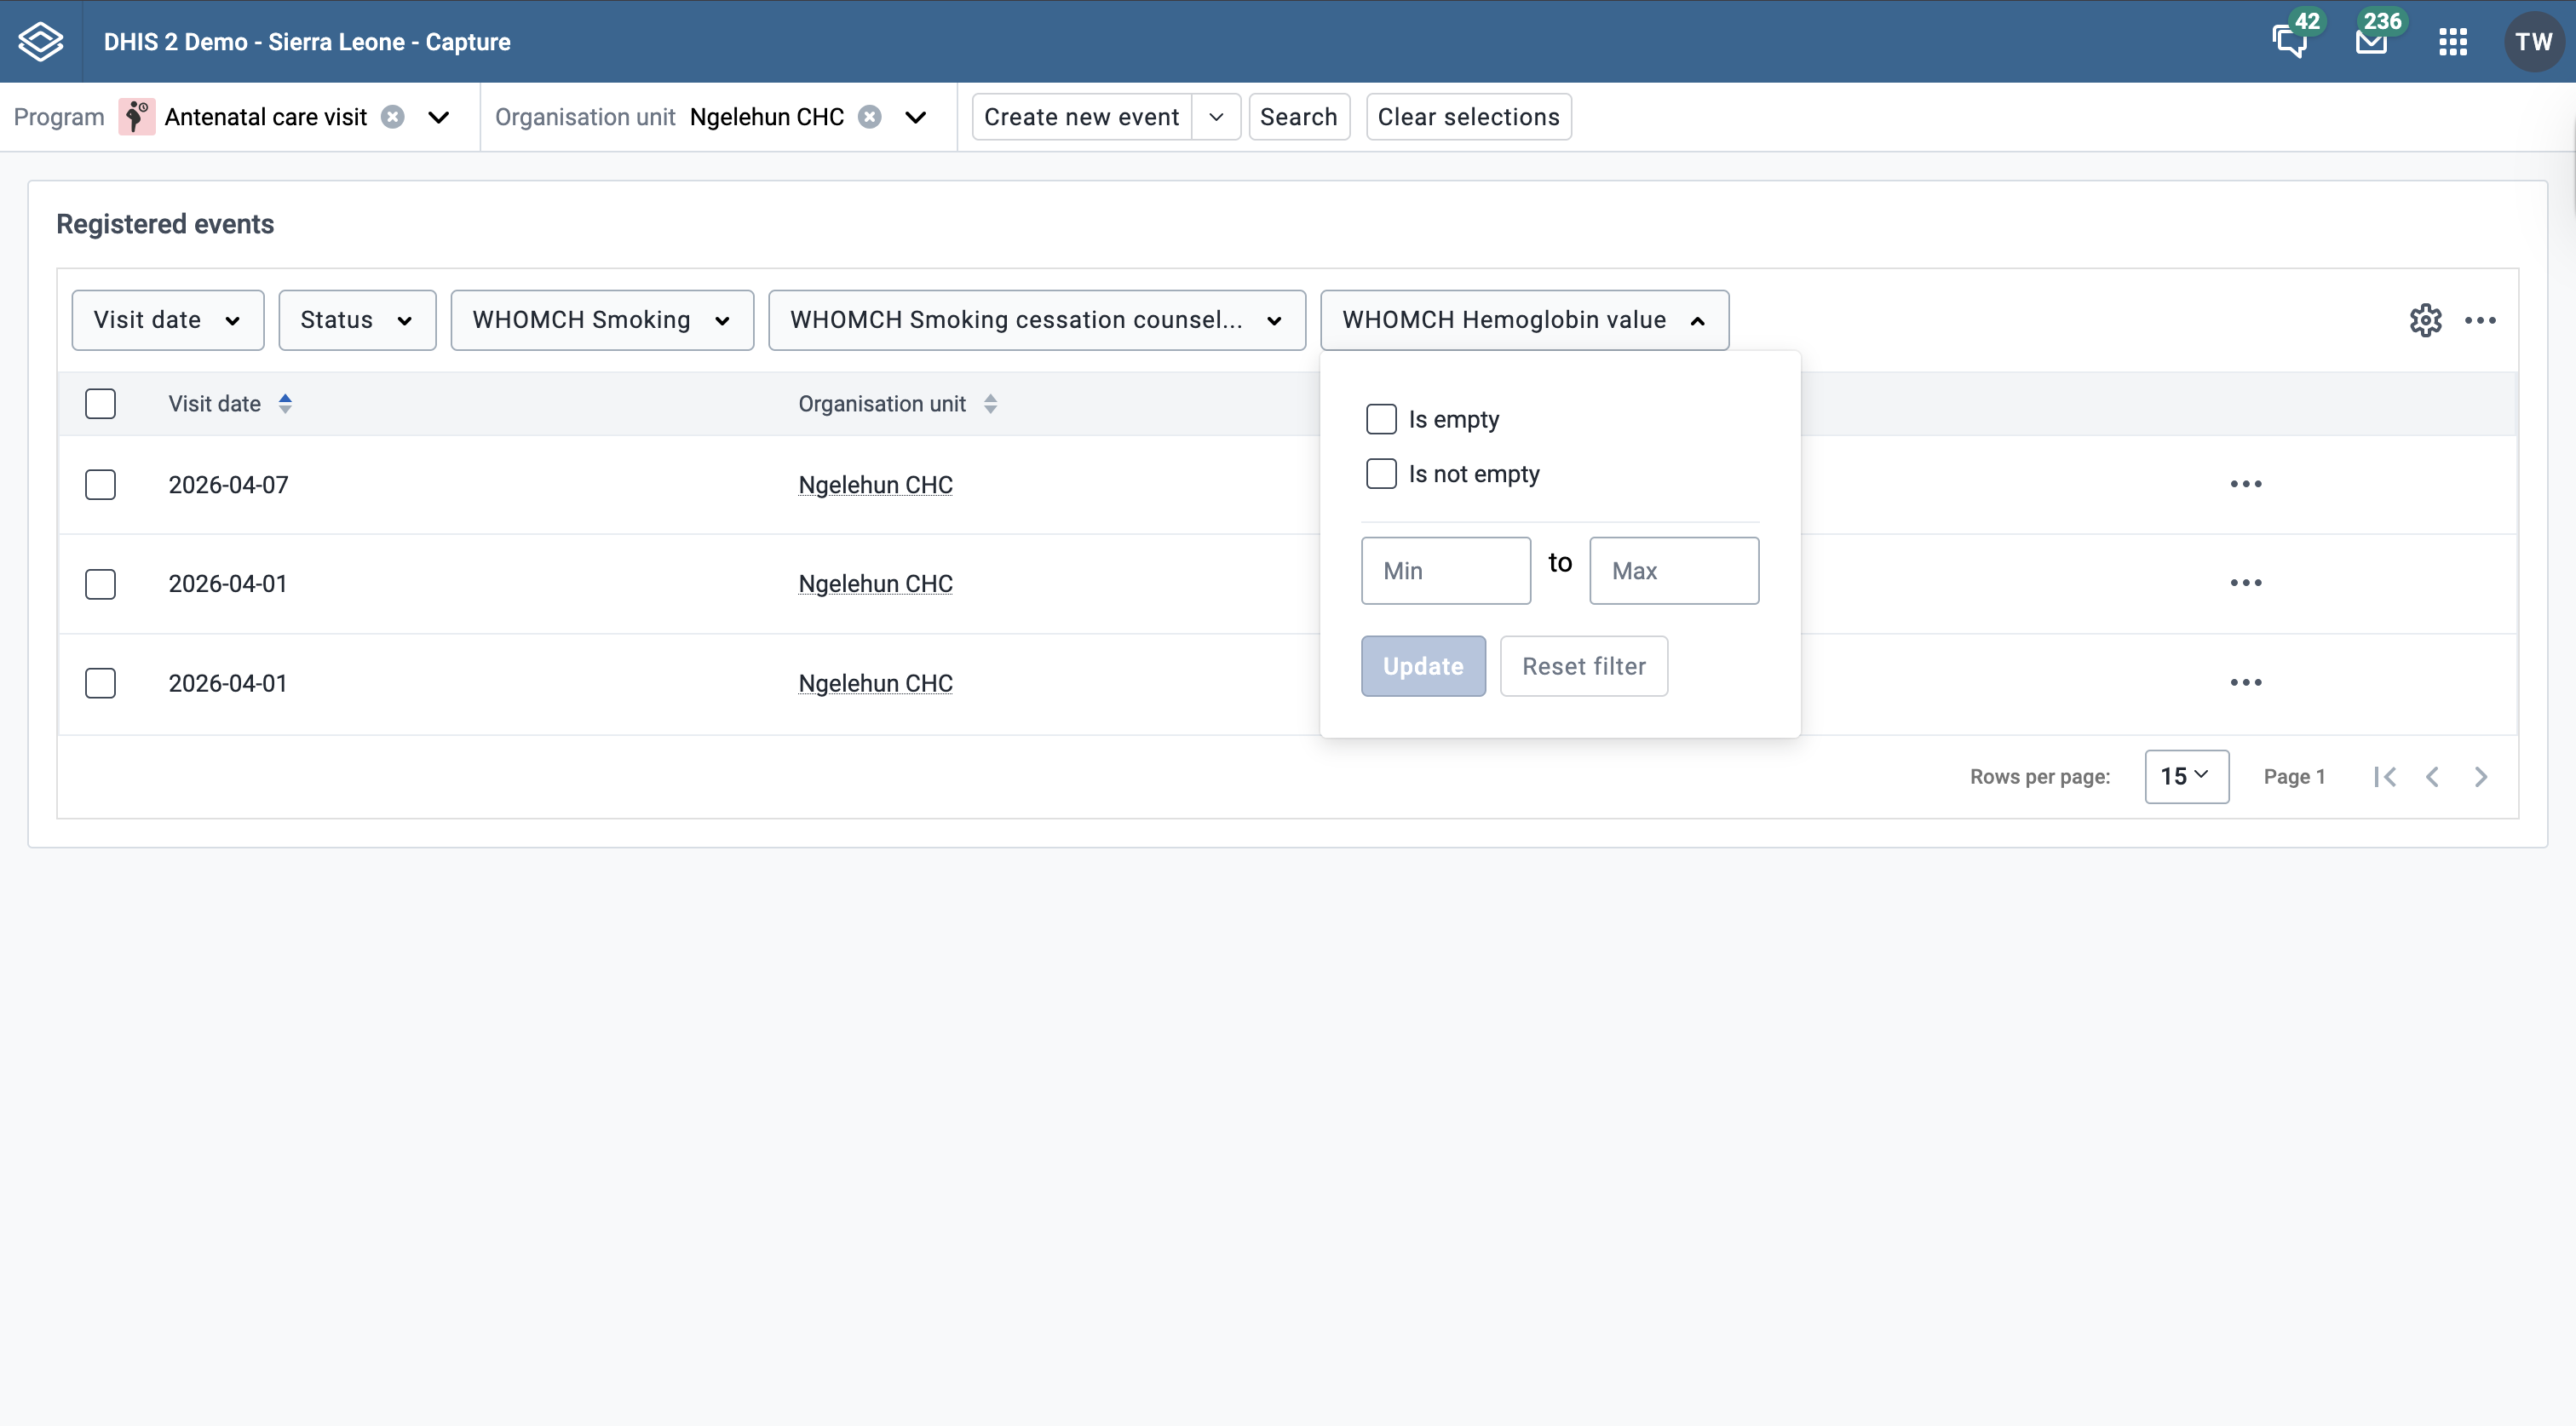
Each filter adapts to the data element's value type — for example, numeric data elements provide a range selector, text data elements a search input, and date data elements a date picker. Filtering is available for all value types except MULTI_TEXT (multi-select option sets).
Data element filters show two checkboxes at the top:
Only one option can be active at a time per filter. Selecting Is empty or Is not empty clears any value-based criteria for the filter.
For image, file and coordinate data elements, Is empty and Is not empty are the only available filter options.
Note
The empty / non-empty checkboxes are not shown on the main filters (report date, status, assignee, etc.).
Filtering on empty / non-empty values requires DHIS2 server version 2.42 or higher. On older servers the checkboxes are not shown.
Open the Capture app.
Select an organisation unit.
Select a program. All events registered to the selected program show up in a list.
Click one of the column headers to sort the list on that data element in ascending order.
A small upward arrow is displayed next to the column is marked blue to show that the list is sorted in ascending order.
Click the column header again to sort the list on that data element in descending order.
A small downward arrow is displayed next to the column is marked blue to show that the list is sorted in descending order.

Open the Capture app.
Select an organisation unit.
Select a program. All events registered to the selected program show up in a list.
Click the three dots icon on the top right of the event list.
Click Download data.
Select the format you want to download.

Note
You can download an event list in JSON or CSV formats.
You can set up your own views and save them for later use. The views can also be shared with others. A view consists of filters, column order and event sort order.
Select an organisation unit and a program.
Set filters using the filter buttons above the event list (described in detail here).

Set the column order by clicking the cog icon and then, in the pop-up, specify the layout according to your preference (how to modify the layout is described in detail here).

Sort the events by clicking on one of the column headers (described in detail here).

Open the more menu (three dots icon) to the right and then select "Save current view..."

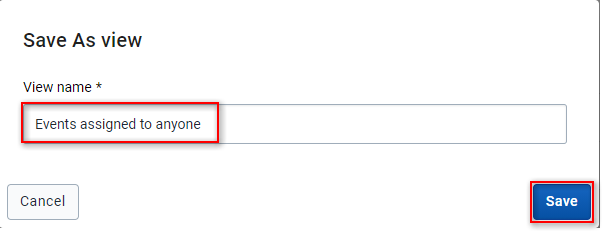
Fill in a name for the view and click save.
Select an organisation unit and a program with a predefined view.
The views should be available above the event list itself. Click on a view to load it.
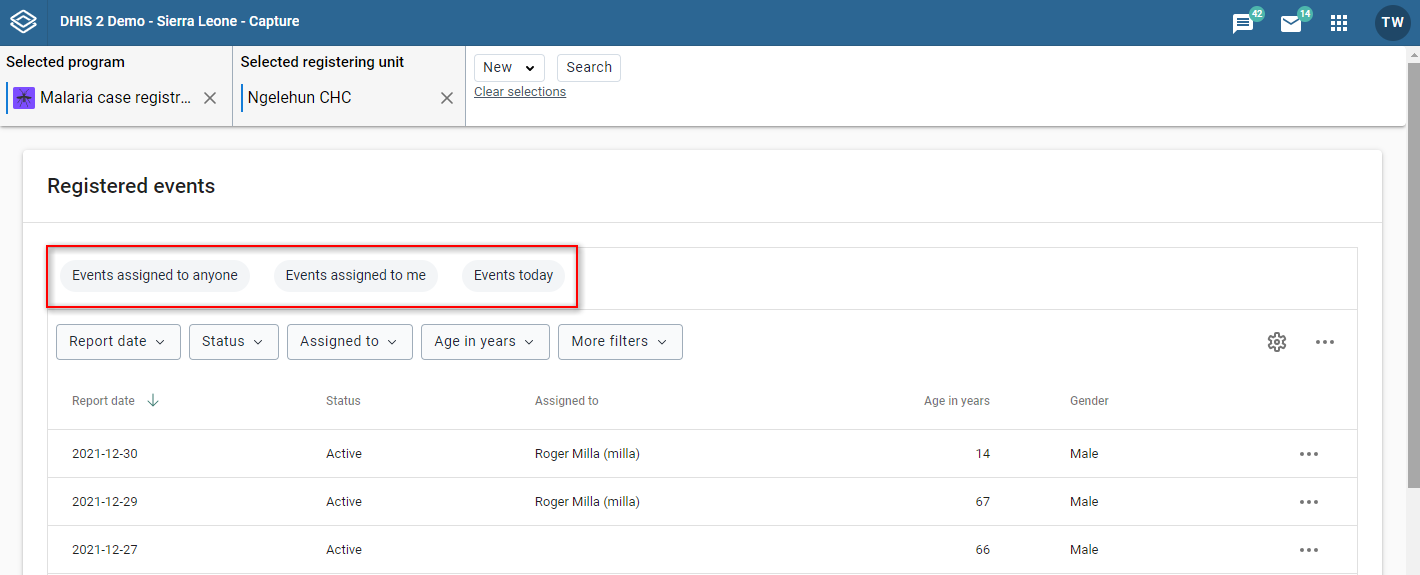
An example of a loaded view.
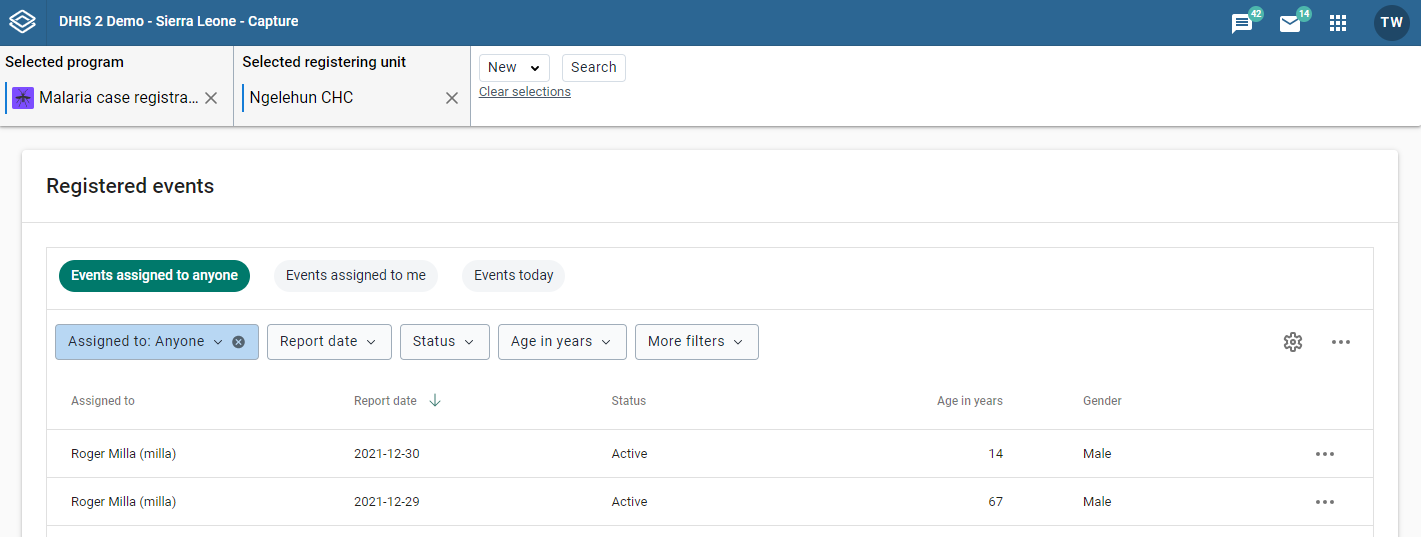
Load the view you would like to update (see loading a view).
Make your changes to filters, column order and/or event sort order.
Note
An asterisk(*) is appended to the view name when the view has unsaved changes.
Open the more menu (three dots icon) to the right and then select "Update view".

Load the view you would like to share (see loading a view).
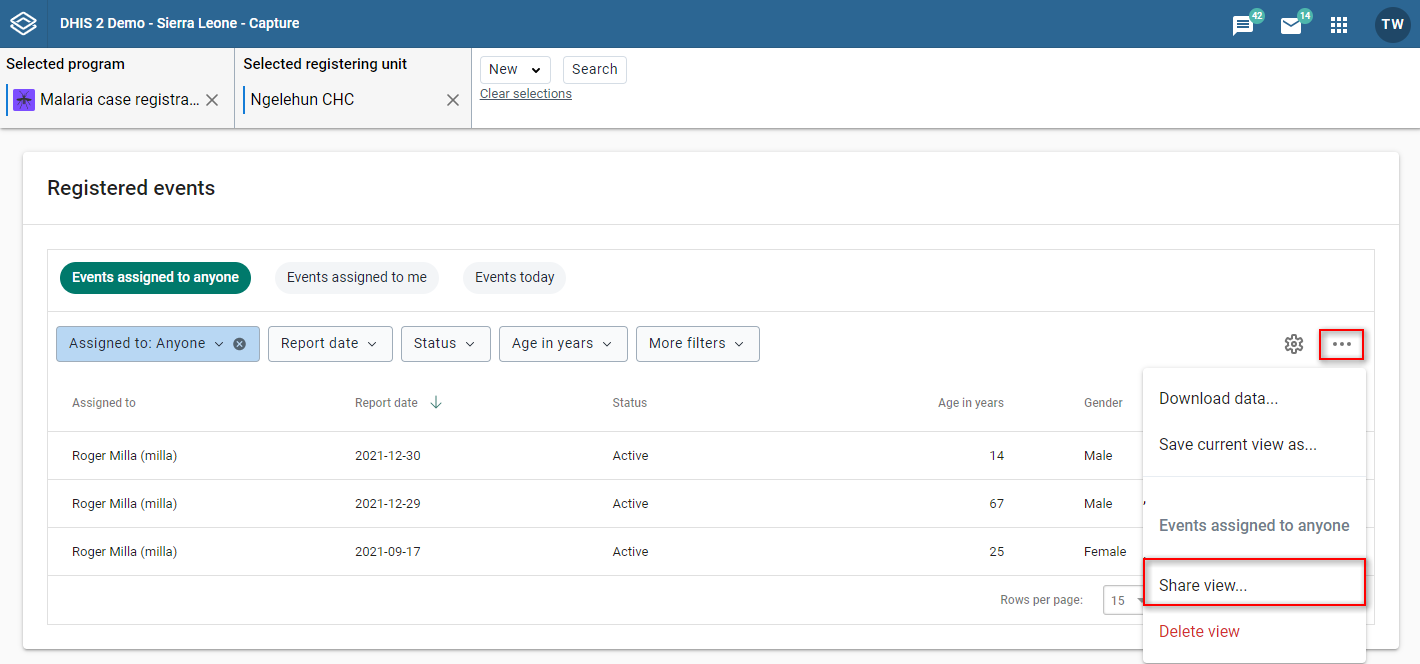
Open the more menu (three dot icon) to the right and then select "Share view..."
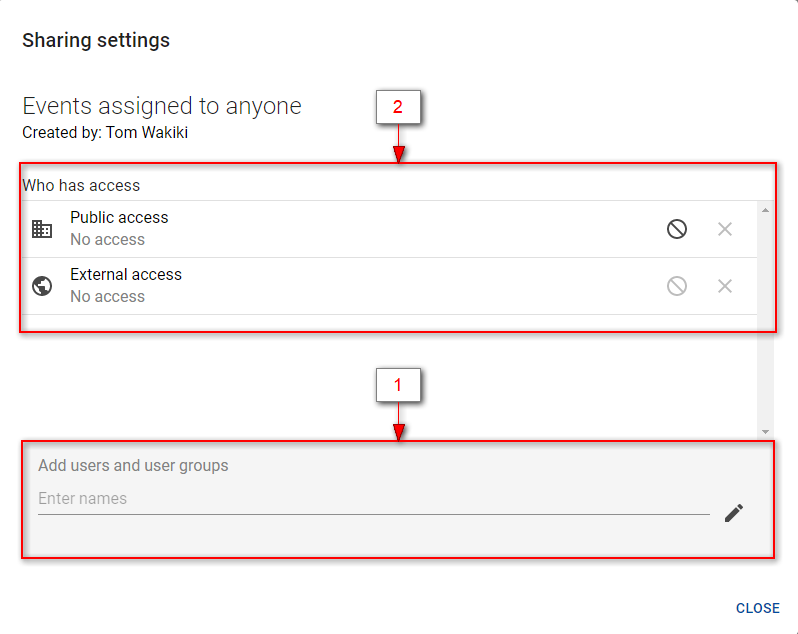
Make your changes. You would typically add users/groups (1) and/or change the access rights of users/groups added earlier (2).
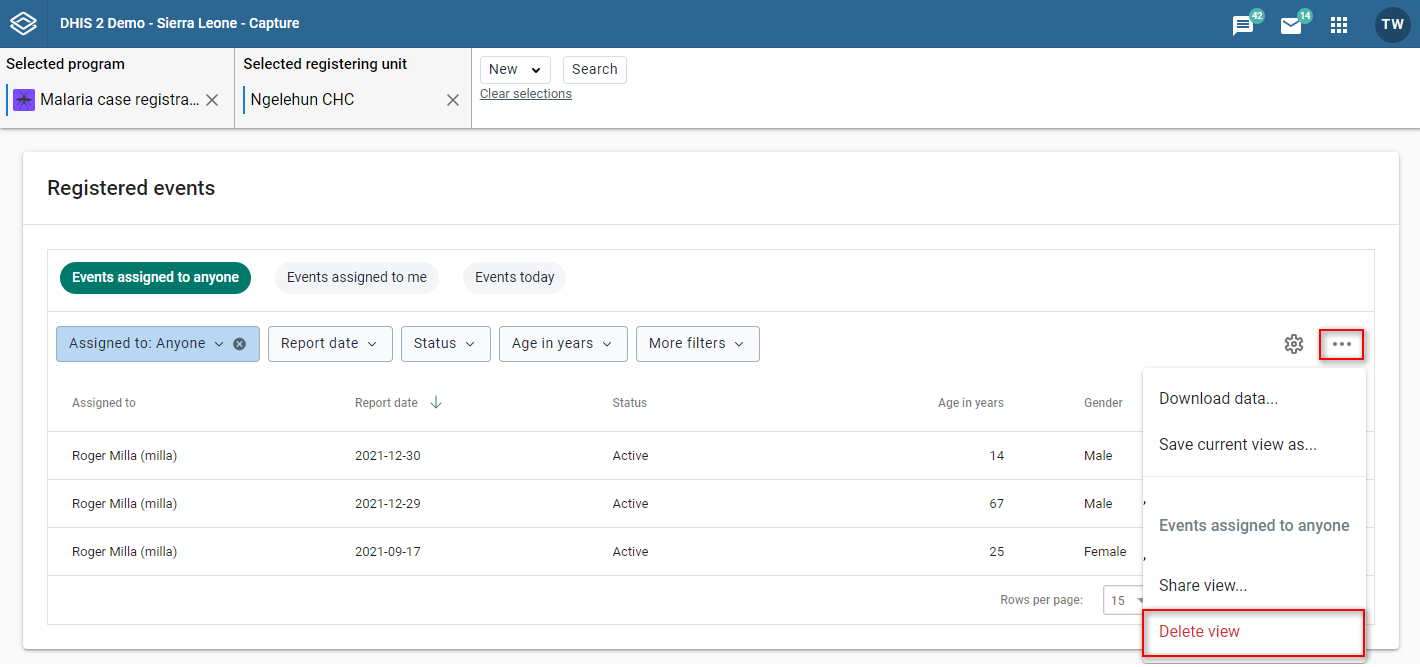
Load the view you would like to delete (see loading a view).
Open the more menu (three dots icon) to the right and then select "Delete view".
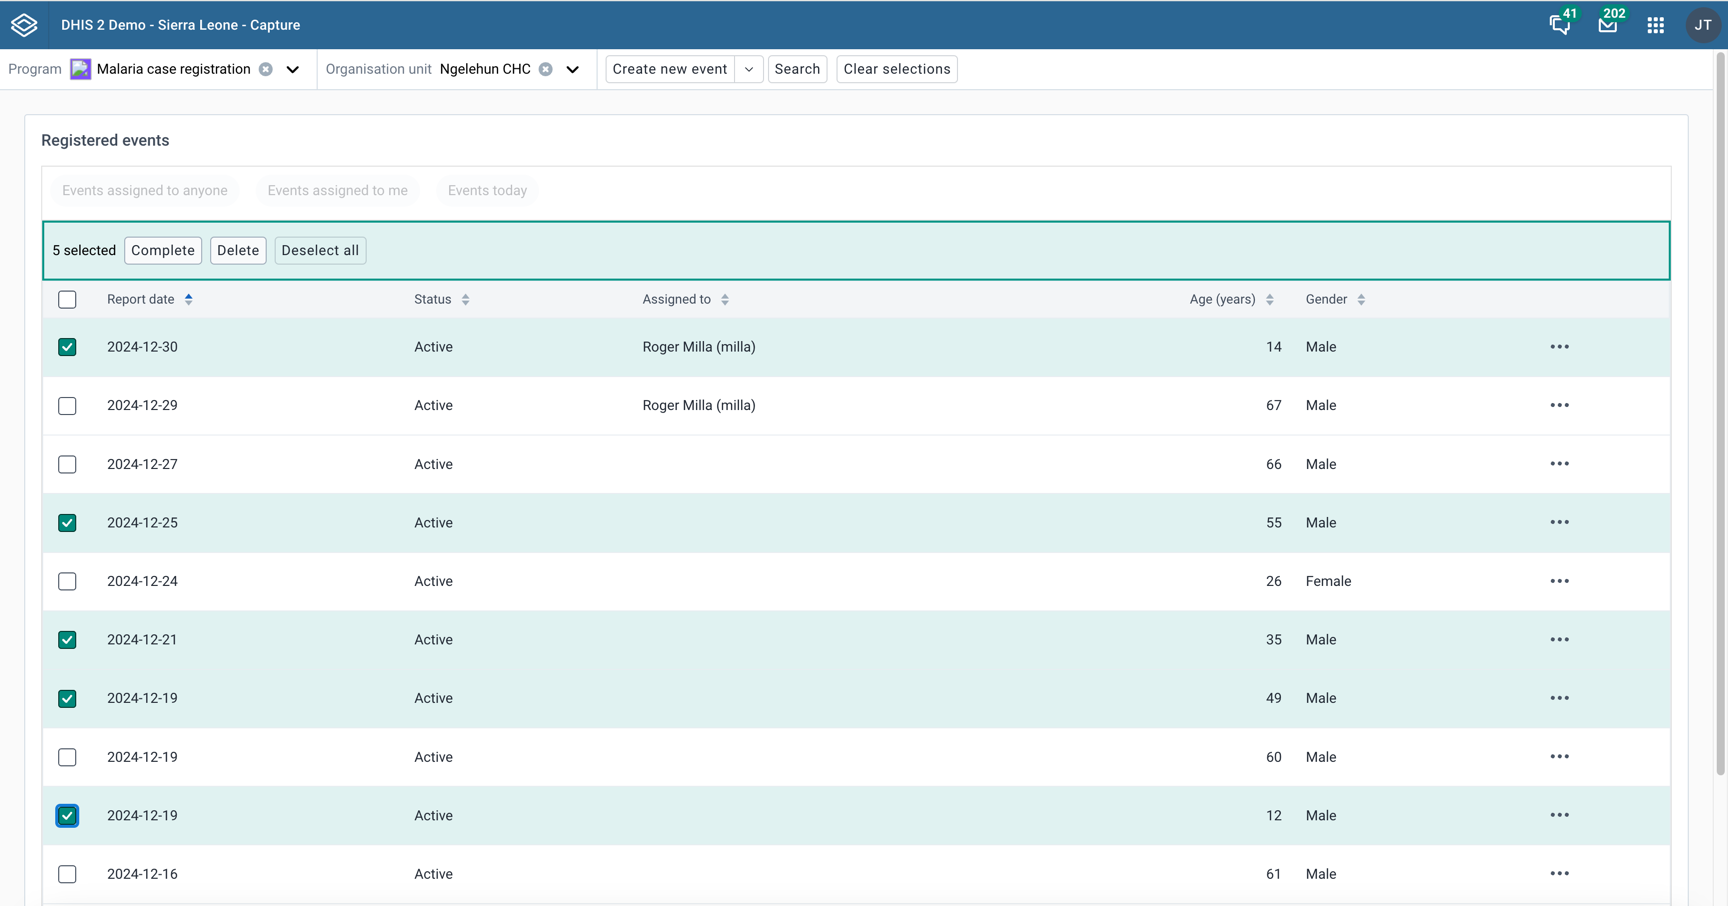
You can perform bulk actions on events in the event list.
Select the events you want to perform the action on by clicking the checkbox to the left of the event.
You can choose between quickly completing the selected events or deleting them.
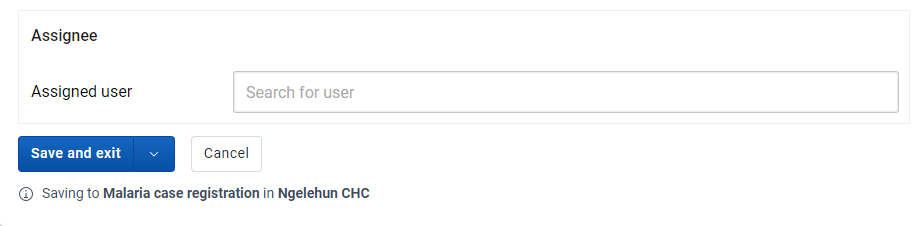
Events can be assigned to users. This feature must be enabled per program.
Select an organisation unit and a program with user assignment enabled.
Click New Event in the upper right corner.
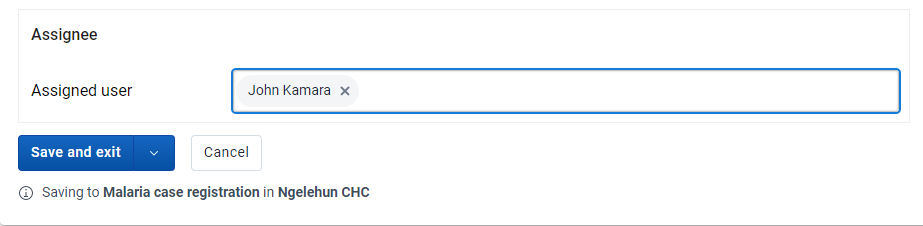
You will find the assignee section near the bottom of the data entry page. Search for and select the user you would like to assign the event to. The assignee will be preserved when you save the event.
Select an organisation unit and a program with user assignment enabled.
Click an event in the list
In the right column you will find the assignee section.
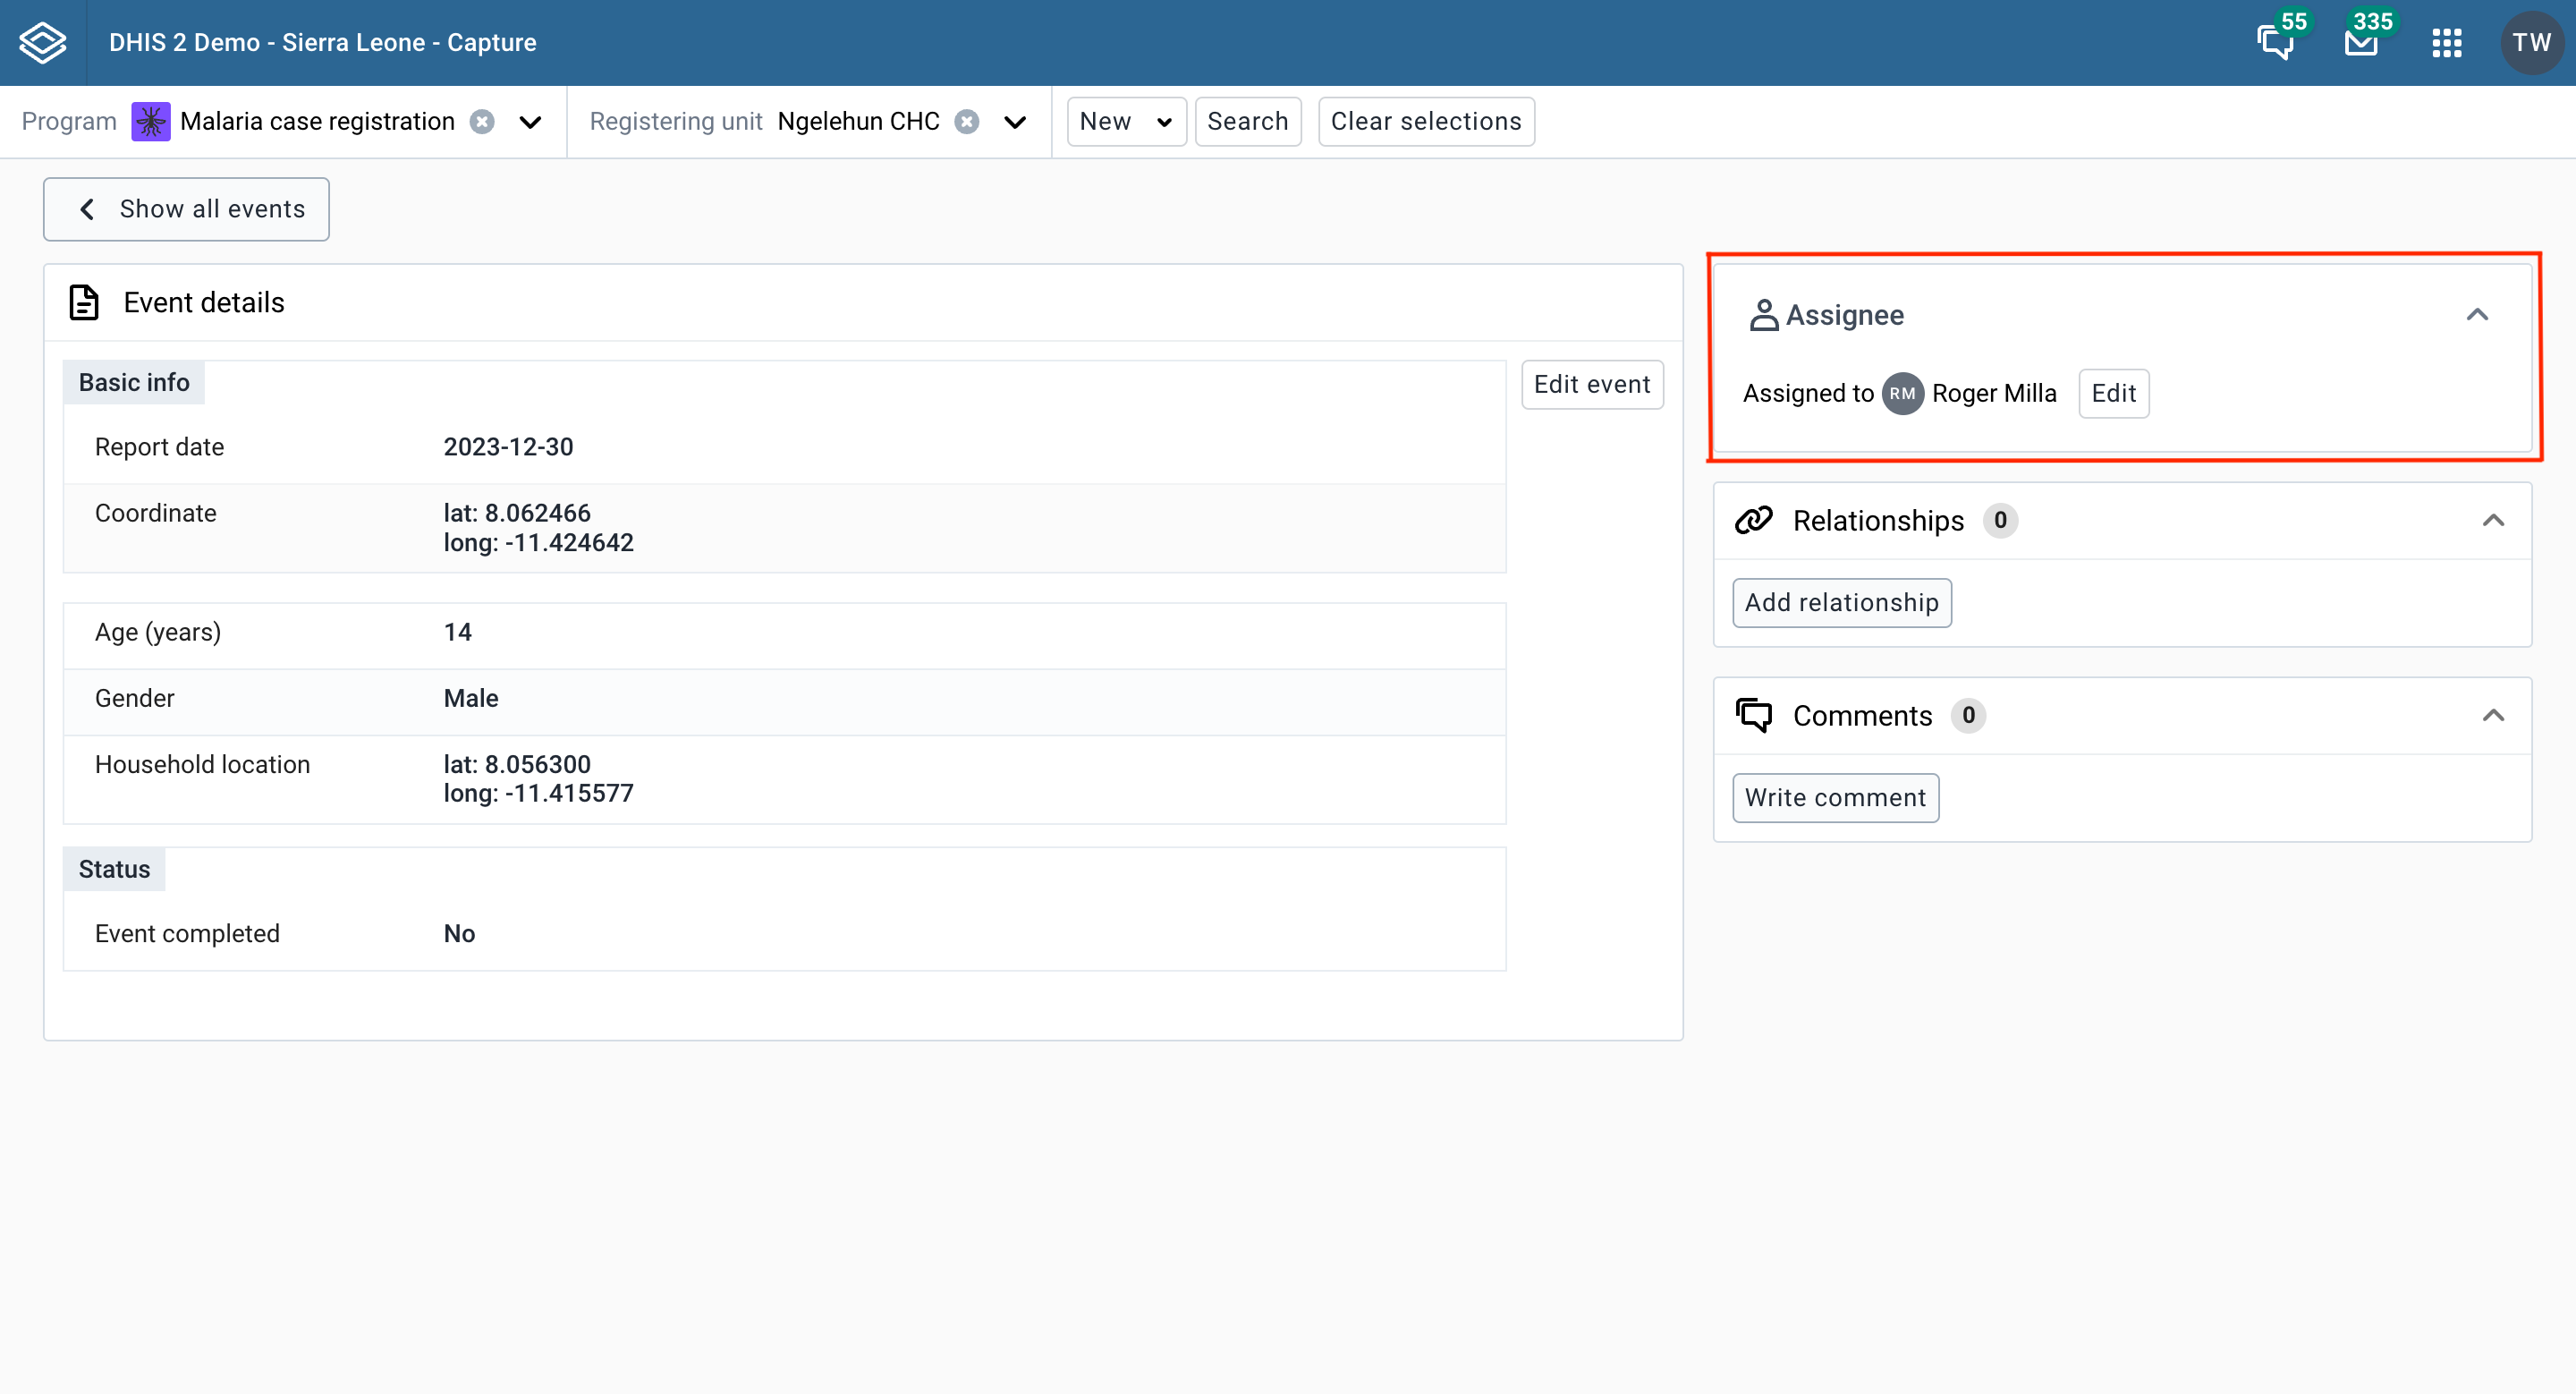
Click the Edit button, or the Assign button if the event is not currently assigned to anyone.
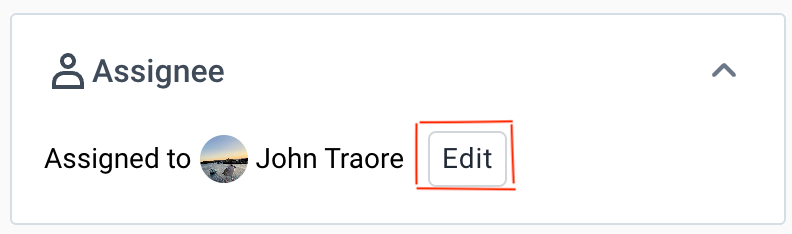
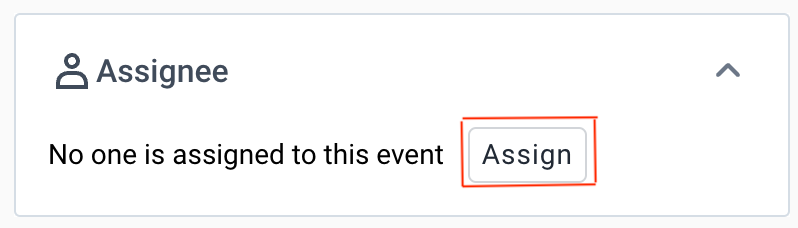
Search for and select the user you would like to reassign the event to. Click the Save button.
In the event list you will be able to view the assignee per event. Moreover, you can sort and filter the list by the assignee.
Click the Assigned to filter.

Select your preferred assignee filter and then click update.

The Capture app supports the workinglists in tracker programs, but when you open a tracked entity instance, you will be redirected to the enrollment dashboard in the Tracker Capture app.
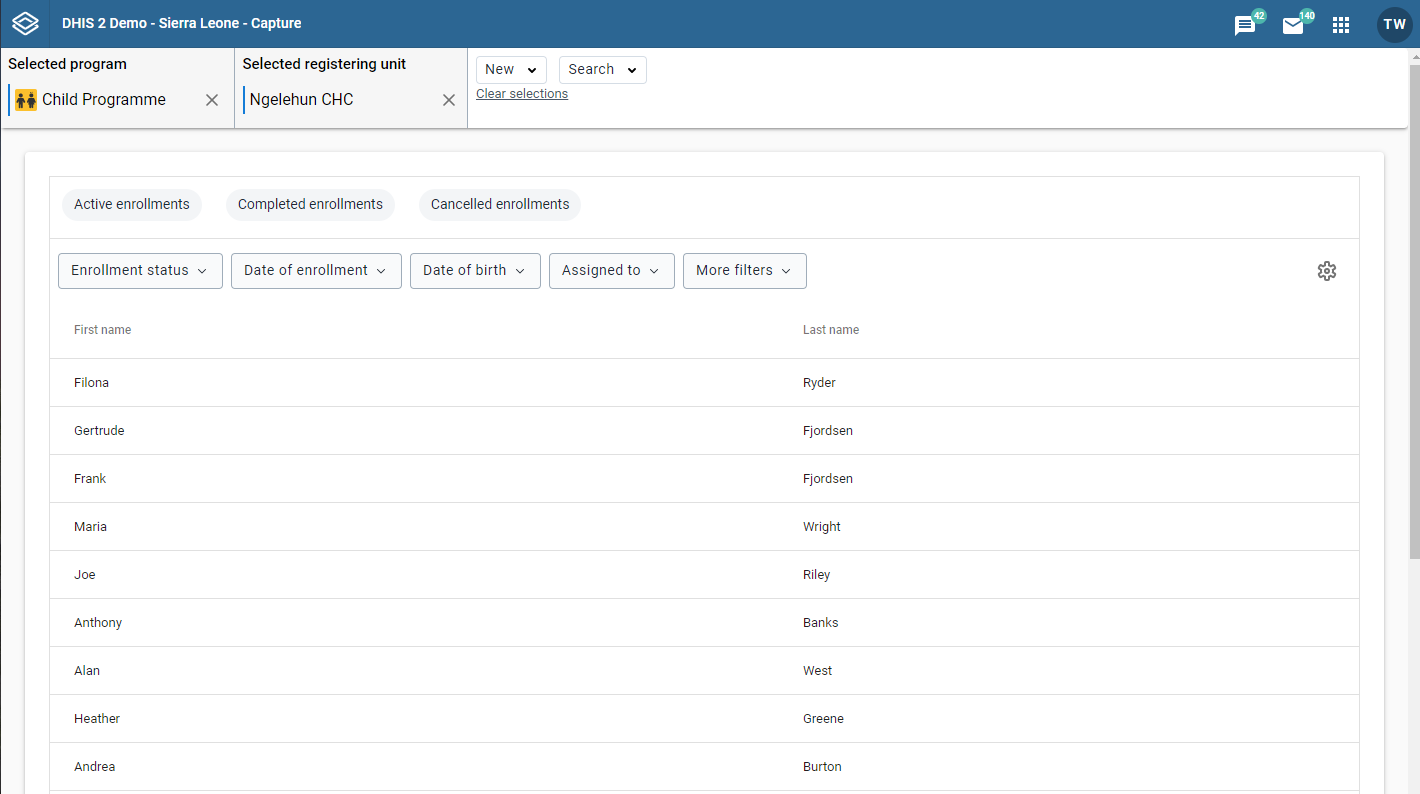
Open the Capture app.
Select a program.
You will only see programs associated with the selected organisation unit and programs you have access to, and that are shared with your user group through data level sharing.
Click the Search button.
From the dropdown menu click the first option.
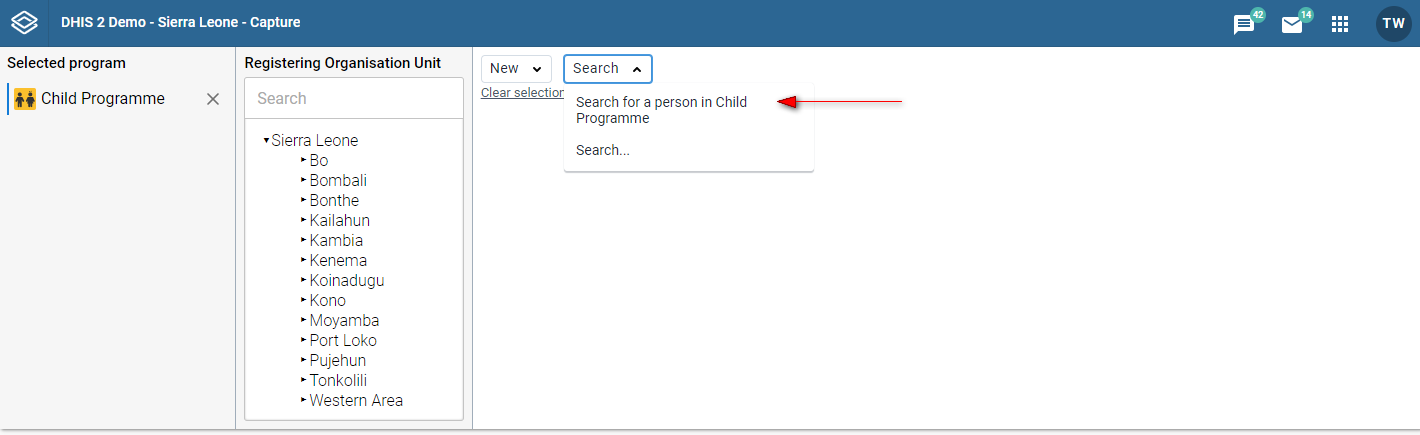
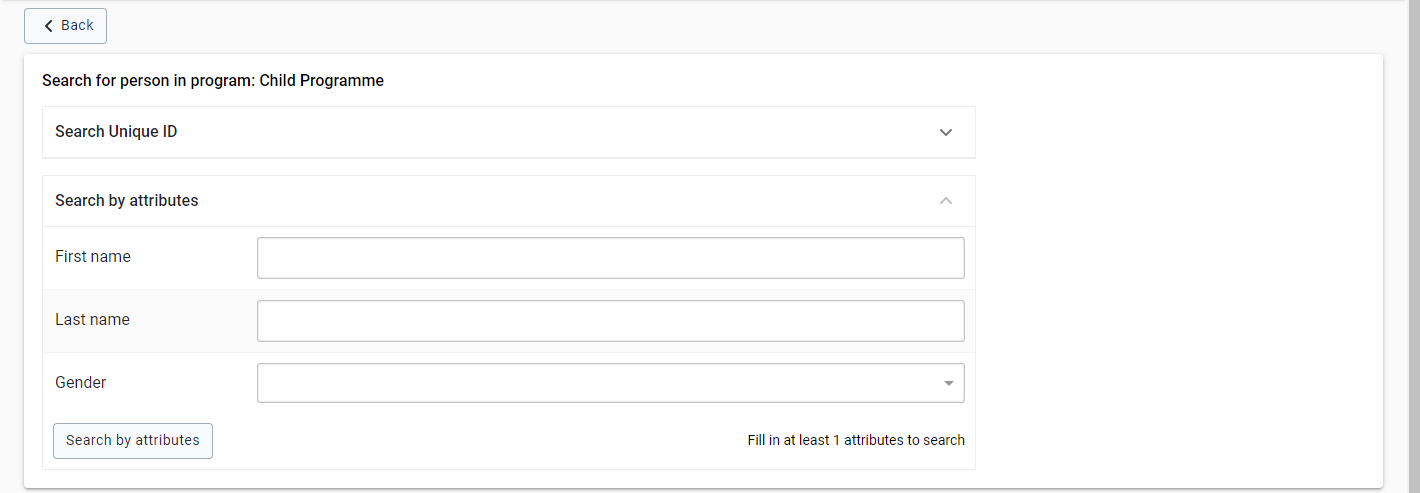
These steps will take you to the search page. There, based on the configuration of your organisation, will see the different attributes you can search with. An example of how this looks is the following.
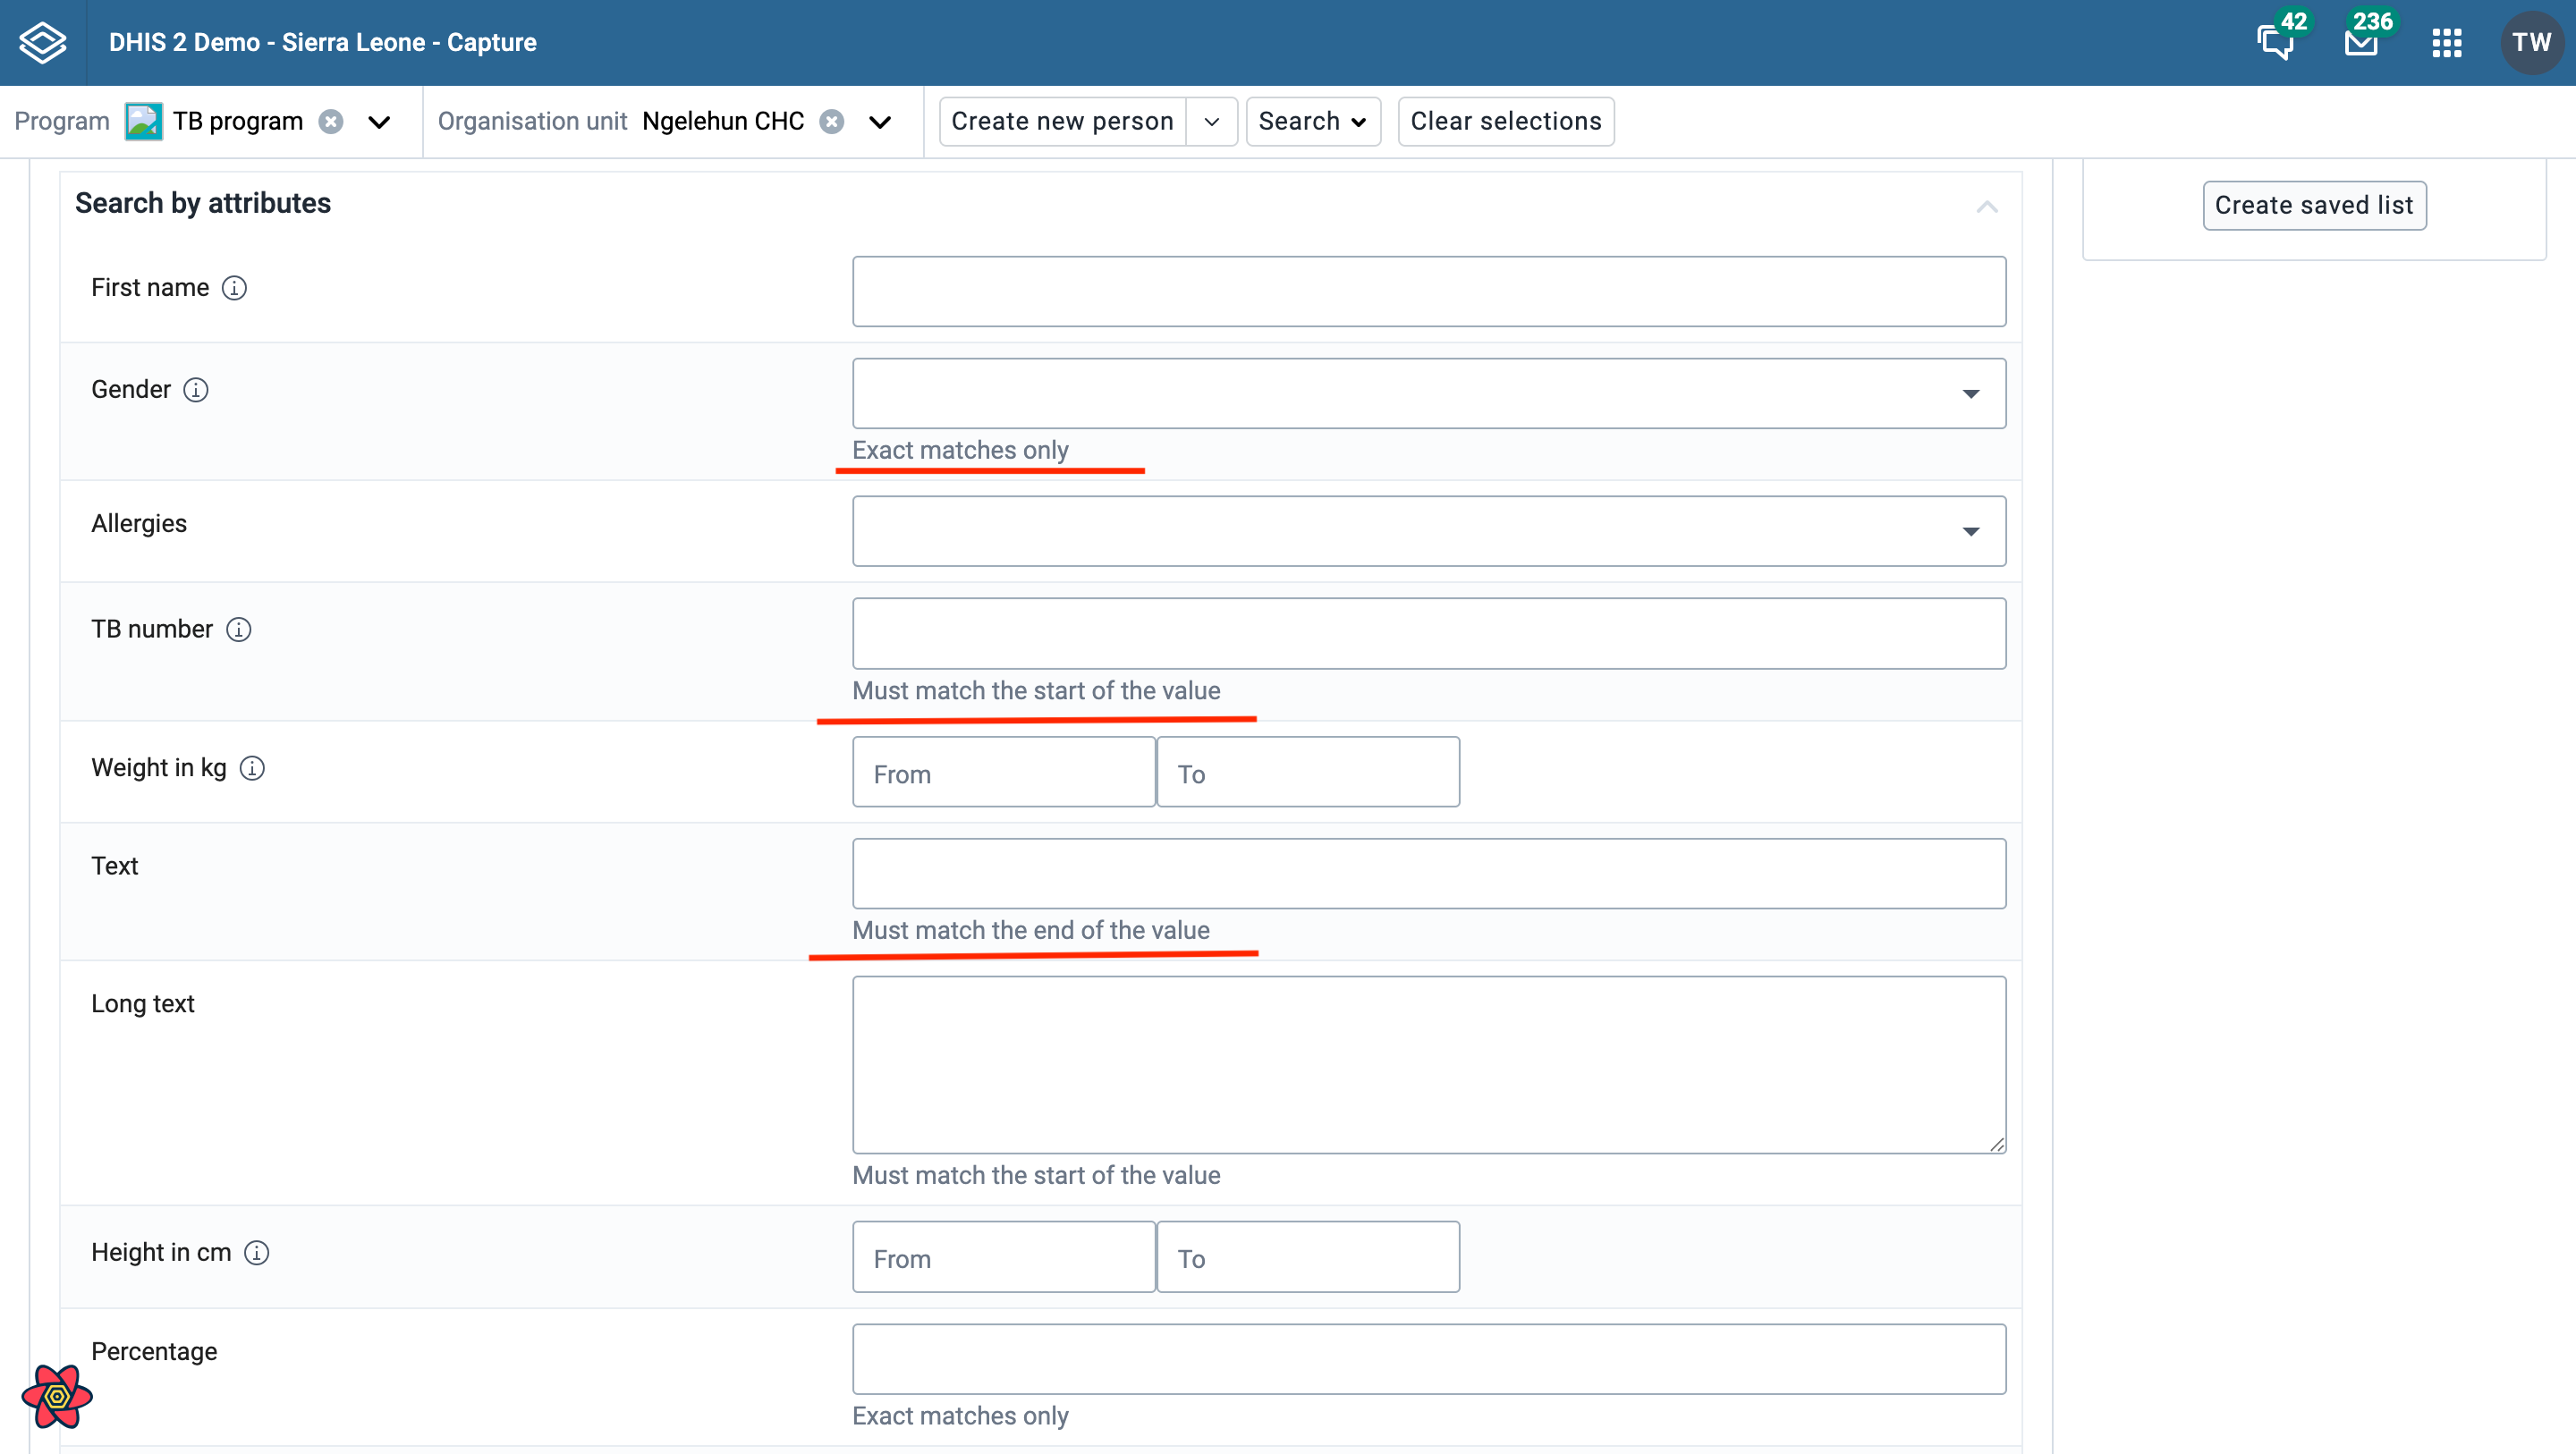
To enhance search performance, you can configure the preferredSearchOperator or blockedSearchOperators metadata in Maintenance. Tracked entity attributes with the following value types apply these settings: TEXT, LONG_TEXT, EMAIL, PHONE_NUMBER and PERCENTAGE. If preferredSearchOperator is not defined, the search falls back to the first available operator in [LIKE, SW, EQ] that is not listed in blockedSearchOperators. Attributes with other value types ignore the preferredSearchOperator. Helper text messages are displayed below the attribute search fields to guide the user.
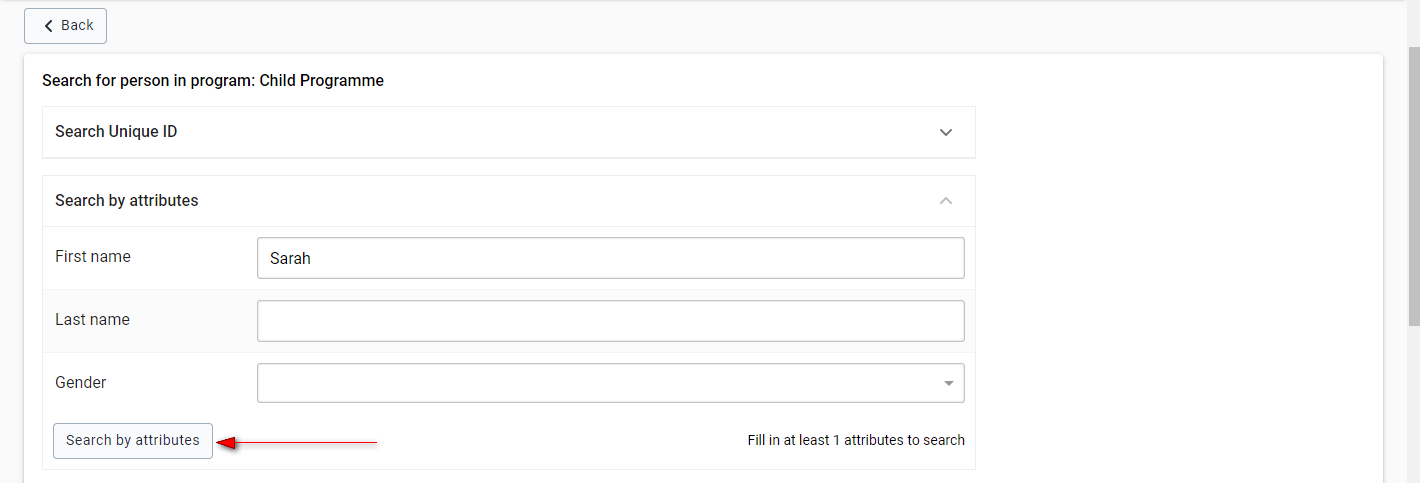
To execute a search now:
Fill in the attributes you want to search with.
Click the Search by attributes button.
The results of the search will be displayed as follows.

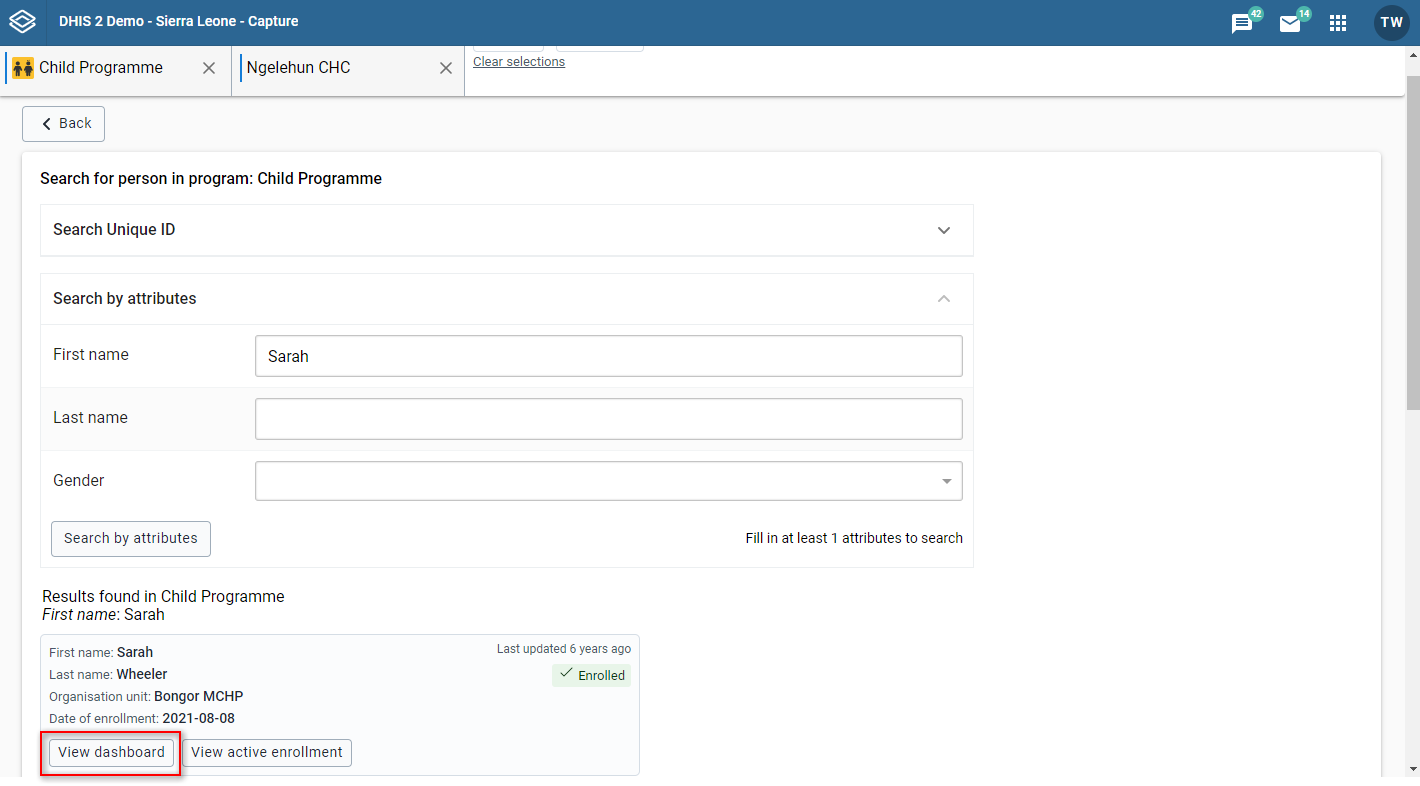
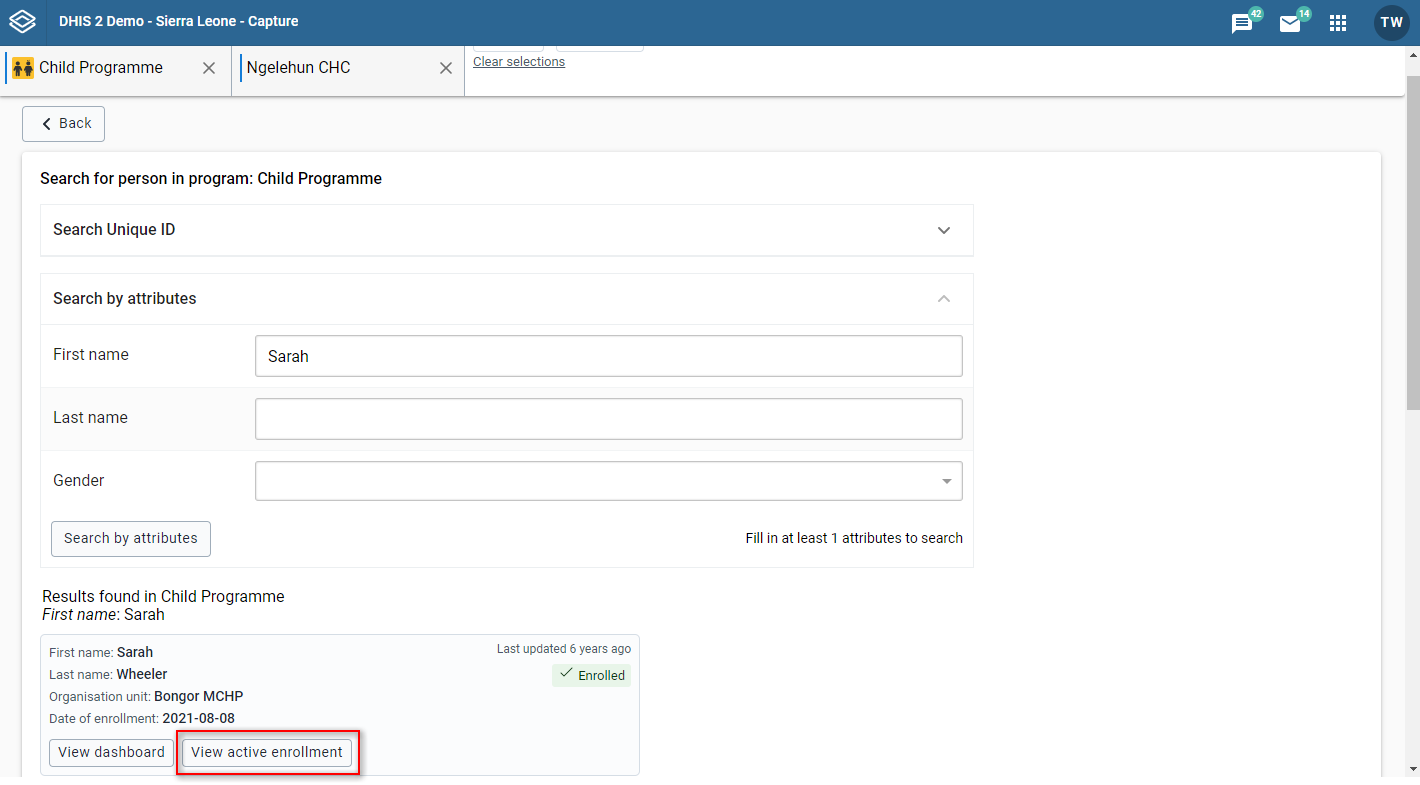
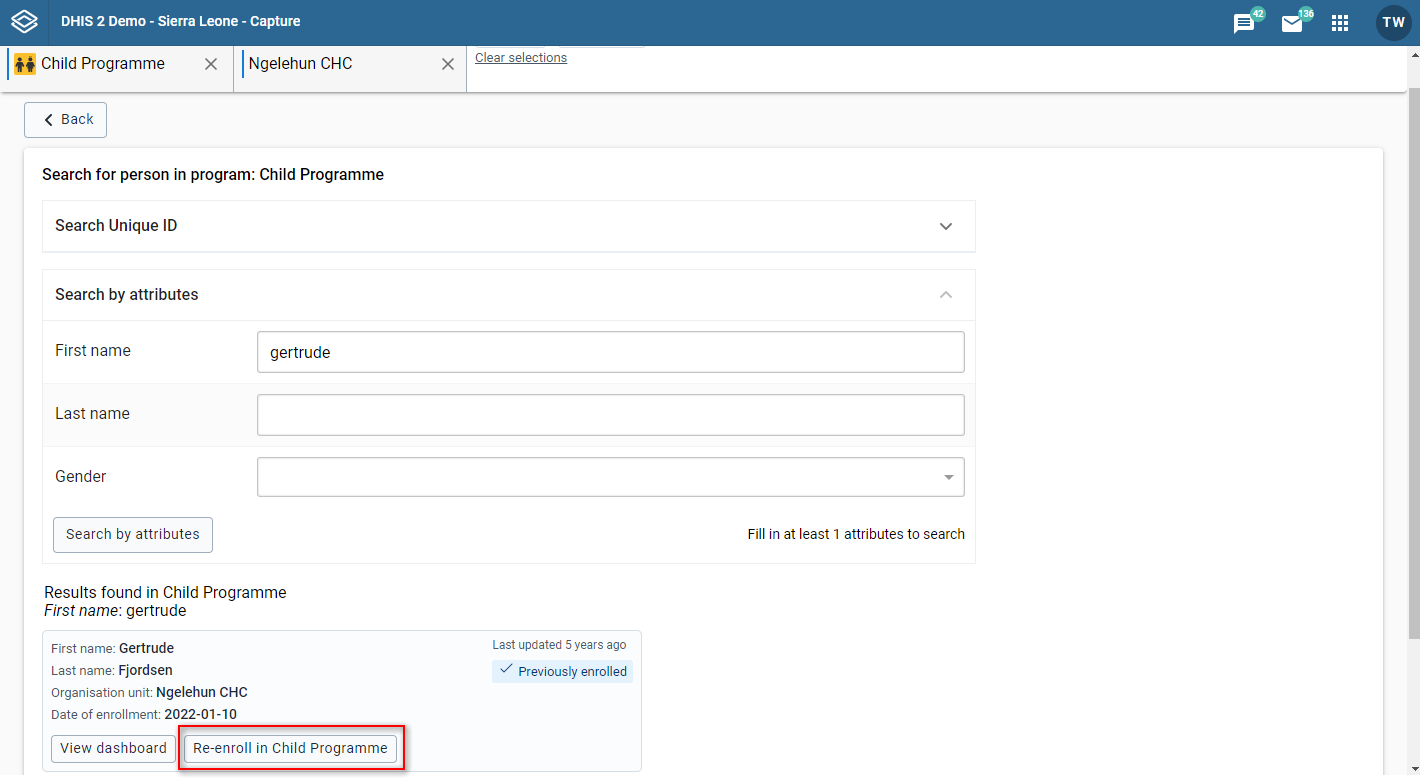
In this list you can see the entries that match your search. For each entry you can have a total of three options.
a. You can choose to view the dashboard for the Tracked Entity Instance by clicking the "View dashboard" button
b. You can view the the active enrollment of a Tracked Entity Instance by clicking the "View active enrollment" button
c. You can re-enroll a Tracked Entity Instance to the current program you are searching within.
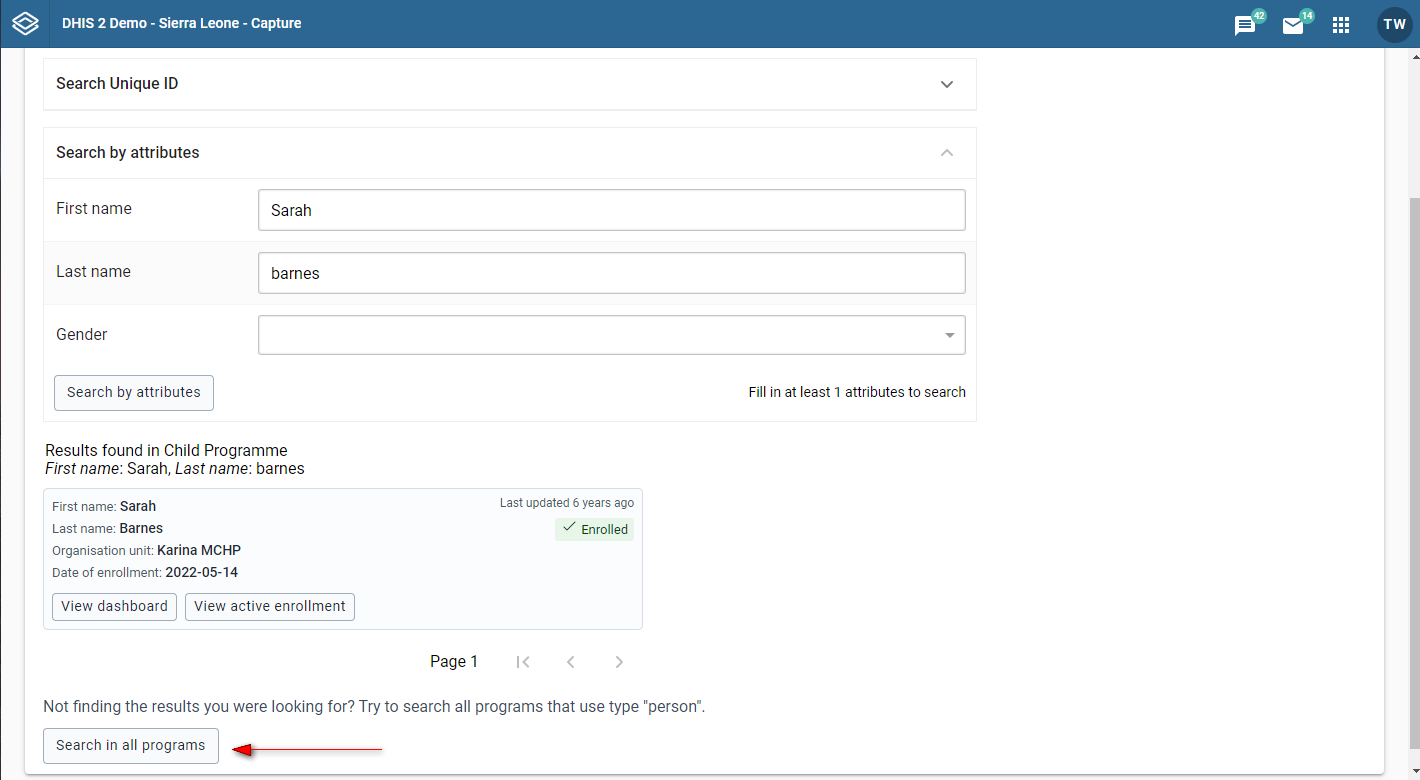
Execute a full search as described above. If the search you have made has results they will be displayed. However, the actual Tracked Entity Instance you are searching for may be within a different program. In that case, you may want to extend the search to other programs. This is known as a fallback search.
To execute a fallback search, simply press the button on the bottom saying "Search in all programs". You will see the Results in all programs be appended below the search in the current program. These two modules are collapsible to save space.
If the fallback can not be done, you will be presented with a modal to go Back to search so that you can change the search terms.
Note
The fallback search is only possible when searching within a Program.
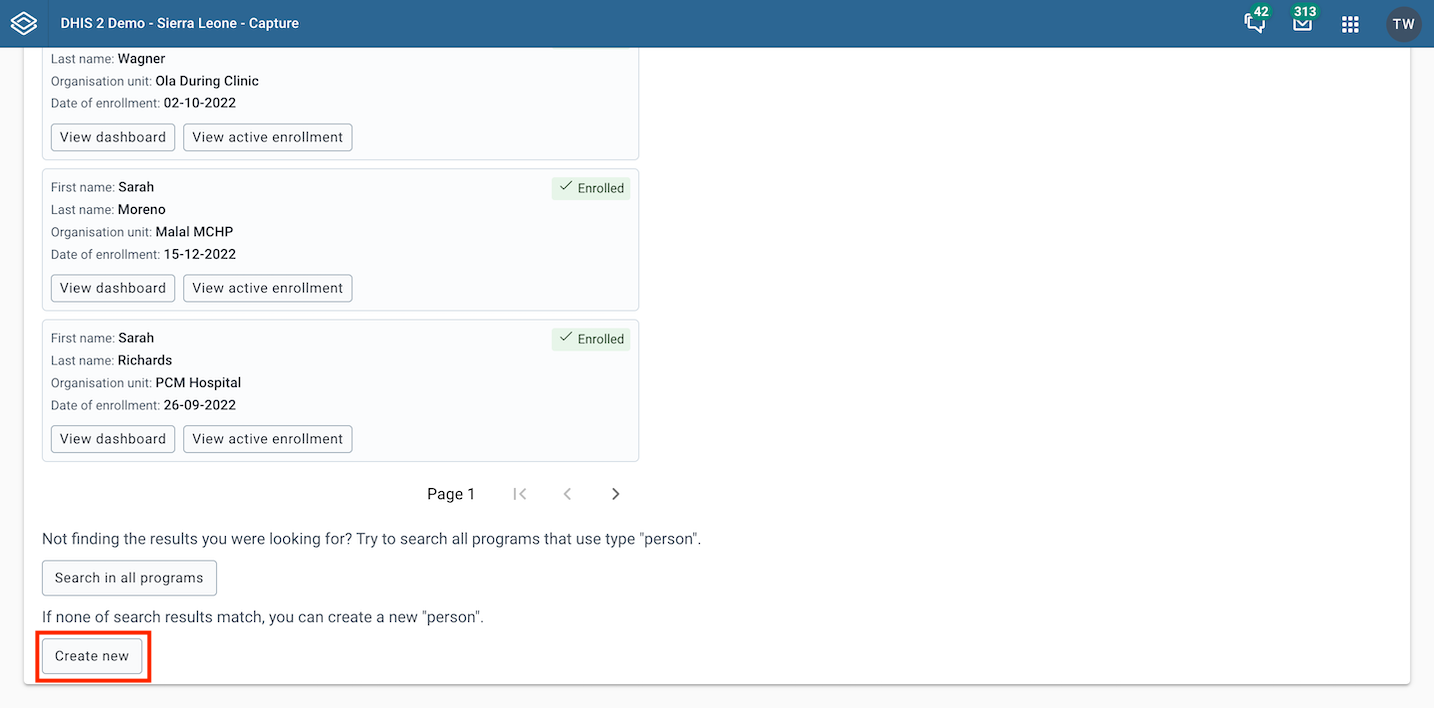
When none of the results match, you can create a new user by clicking Create new button on the bottom of the search page.
Based on the search domain, you will be navigated to the registration of the selected Tracked entity type, with or without program enrollment preselected. The search terms that you typed in before will be prefilled in the registration form.
Open the Capture app.
Click the Search button to open the search page.
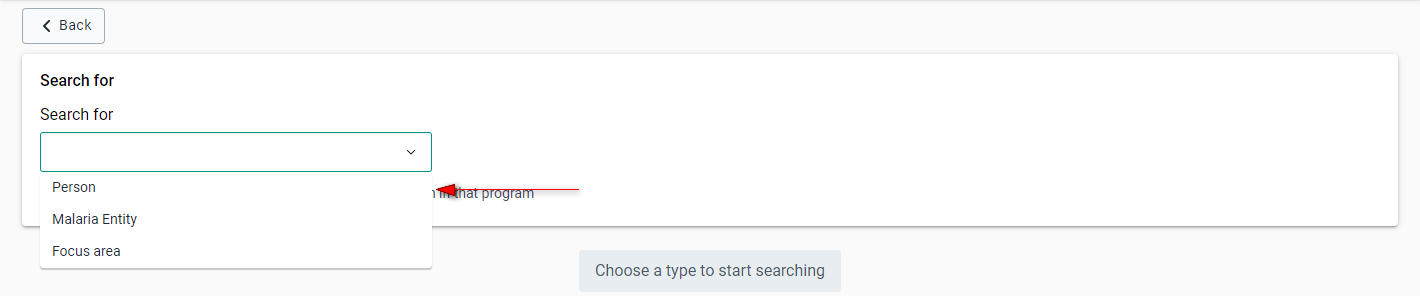
Click on the drop down menu and select the type of entity you want to search for.

Make a selection from the list.
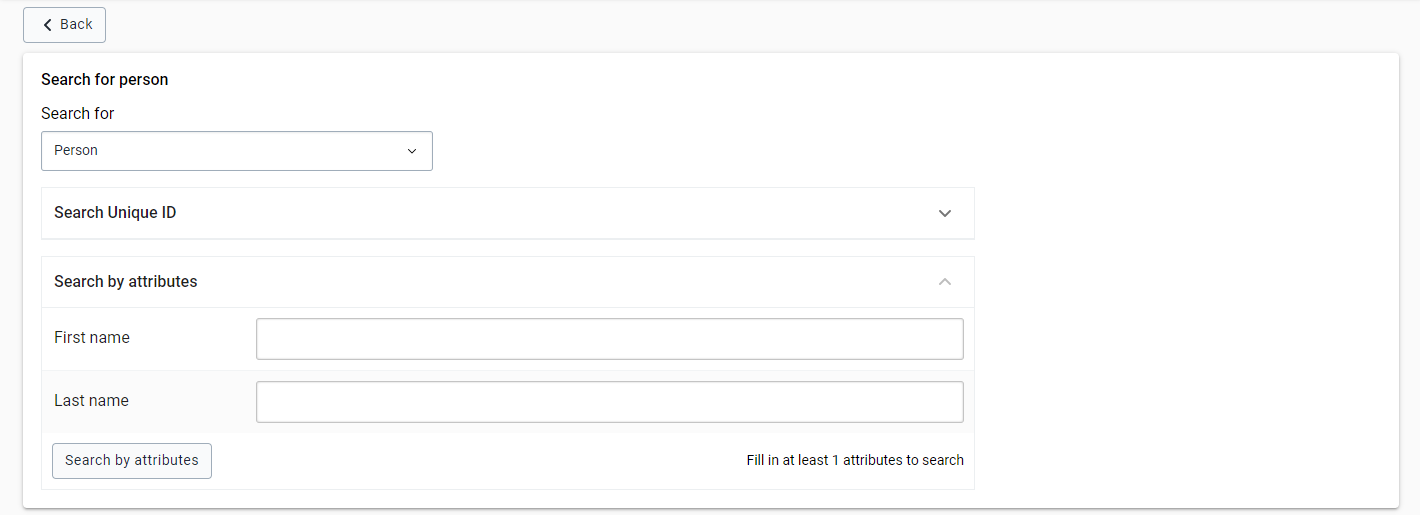
Based on the configuration of your organisation you will see the different attributes you can search with. An example of how this looks is the following.
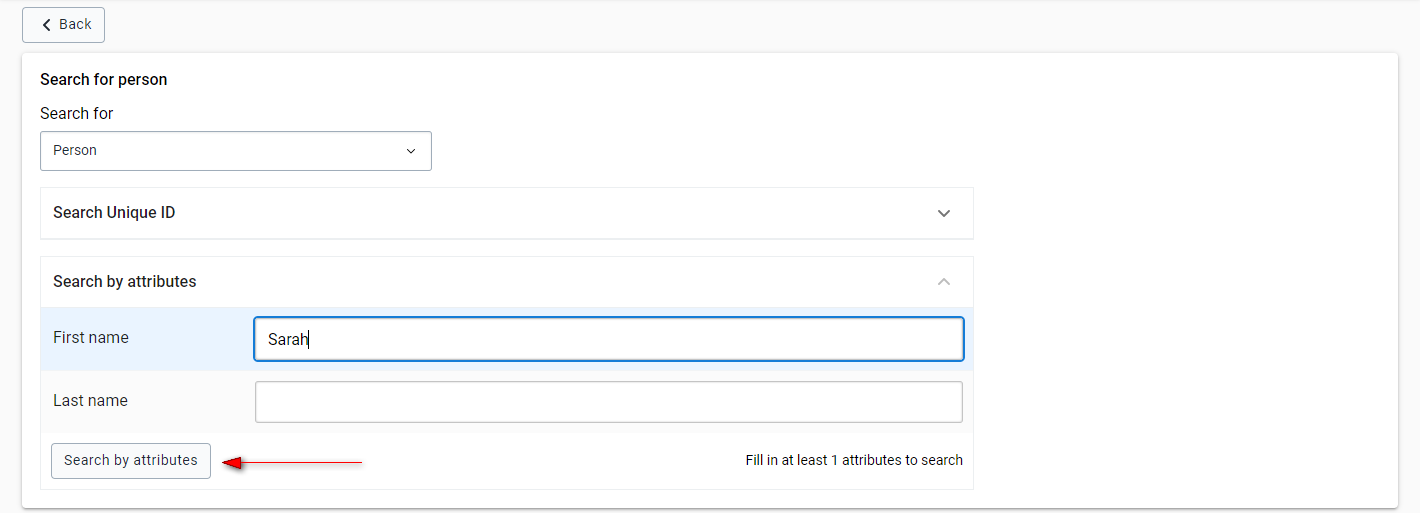
To execute a search now:
Fill in the attributes you want to search with.
Click the Search by attributes button.
The results of the search will be displayed as follows.

In this list you can see the entries that match your search. For each entry you have the option to click the "View Dashboard" button to view the dashboard for the Tracked Entity Instance.
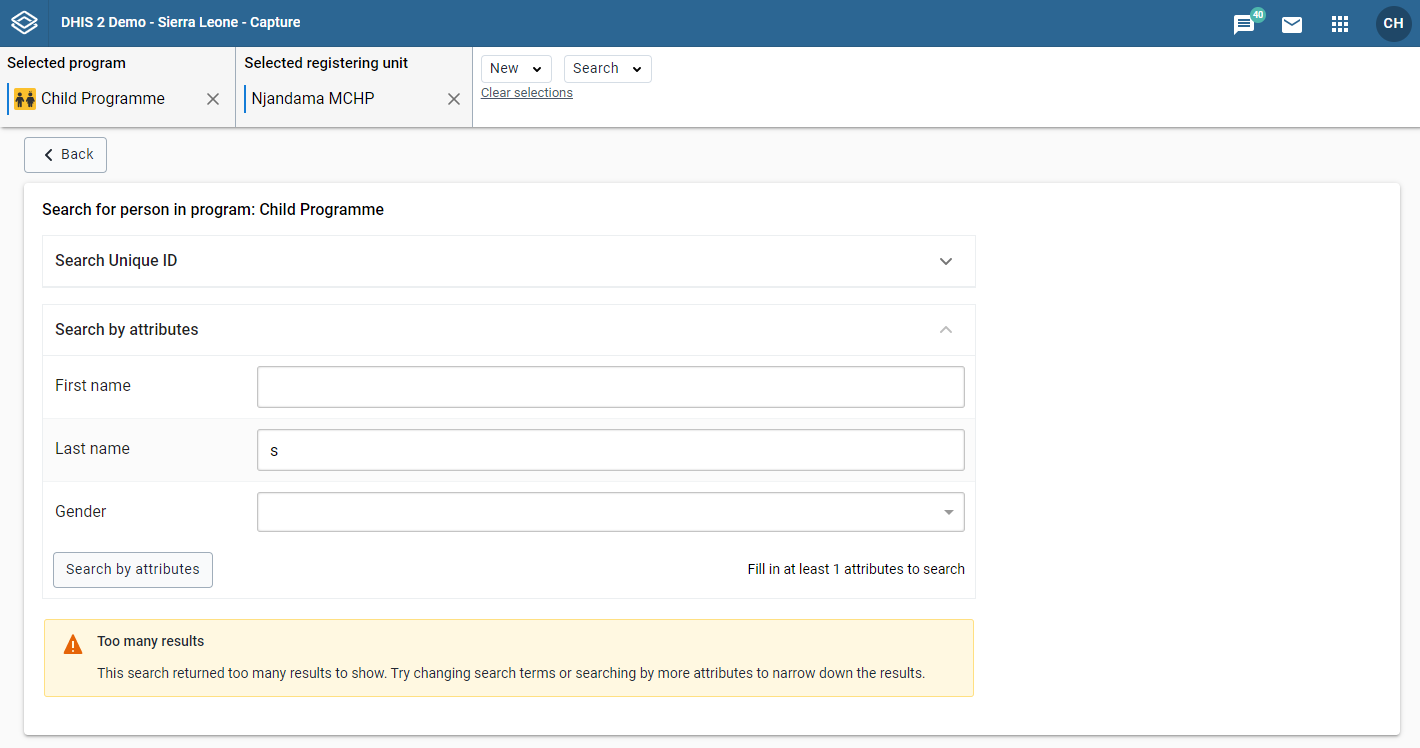
The program or tracked entitiy type you are searching within may be configured with a limit on the number of results that are retrurned from a search. If your search results exceed this limit you will be shown a warning message like the one below.
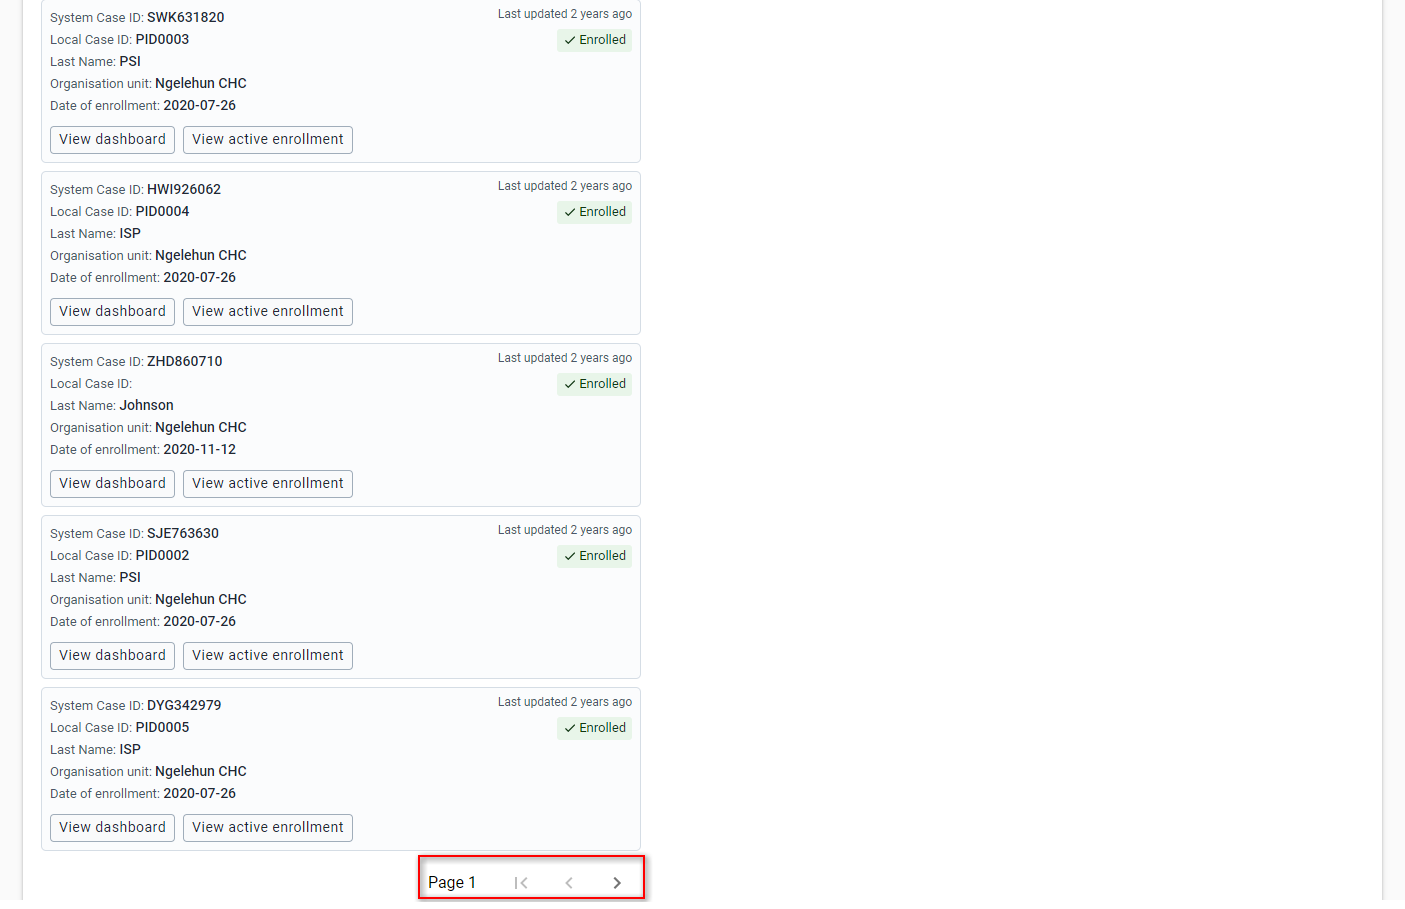
The results page shows up to five results at a time. You should try to use specific search criteria so that there are not too many matches. However, if there are more than five results, you can see the next results by using the > button at the end of the page.
Open the Capture app.
Select an organisation unit.
Select a tracker program with "Display front page list" set to true.
The program can have categories associated with it (implementing partner would be an example of such a category). If this is the case, fill them in.
Open the Capture app.
Select an organisation unit.
Select a tracker program with "Display front page list" set to false.
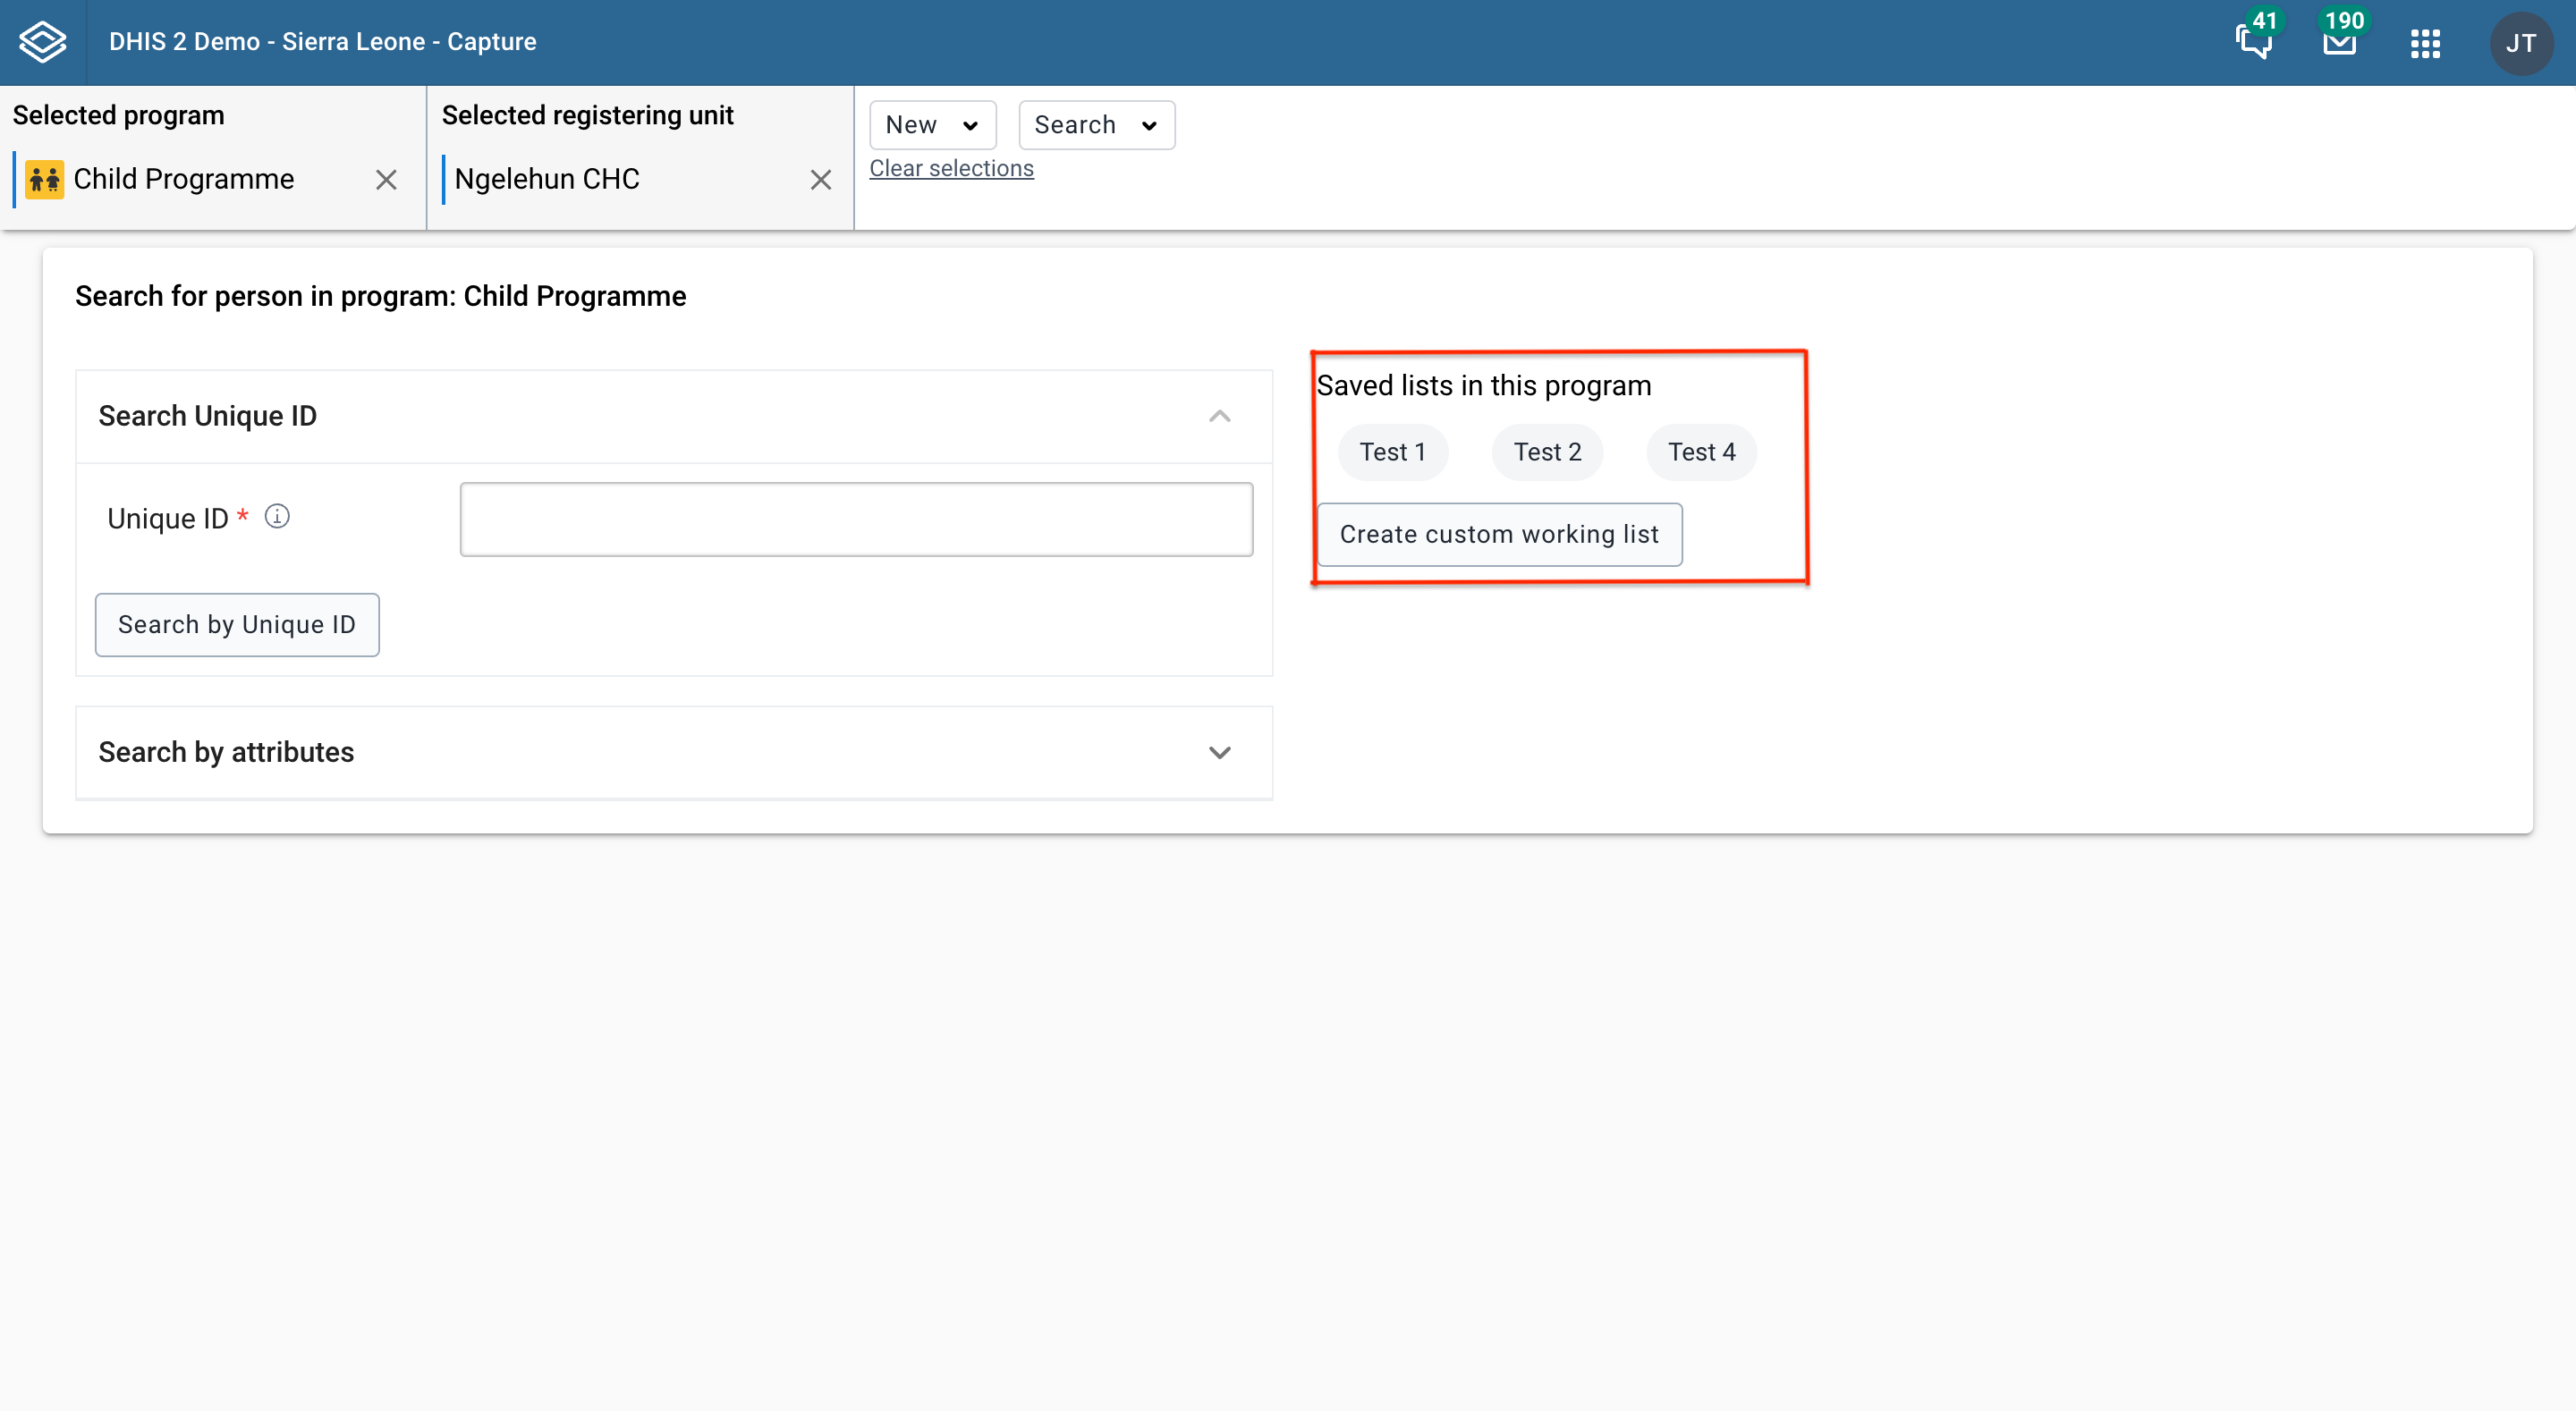
If the program has any custom working list you are able to click and load it.
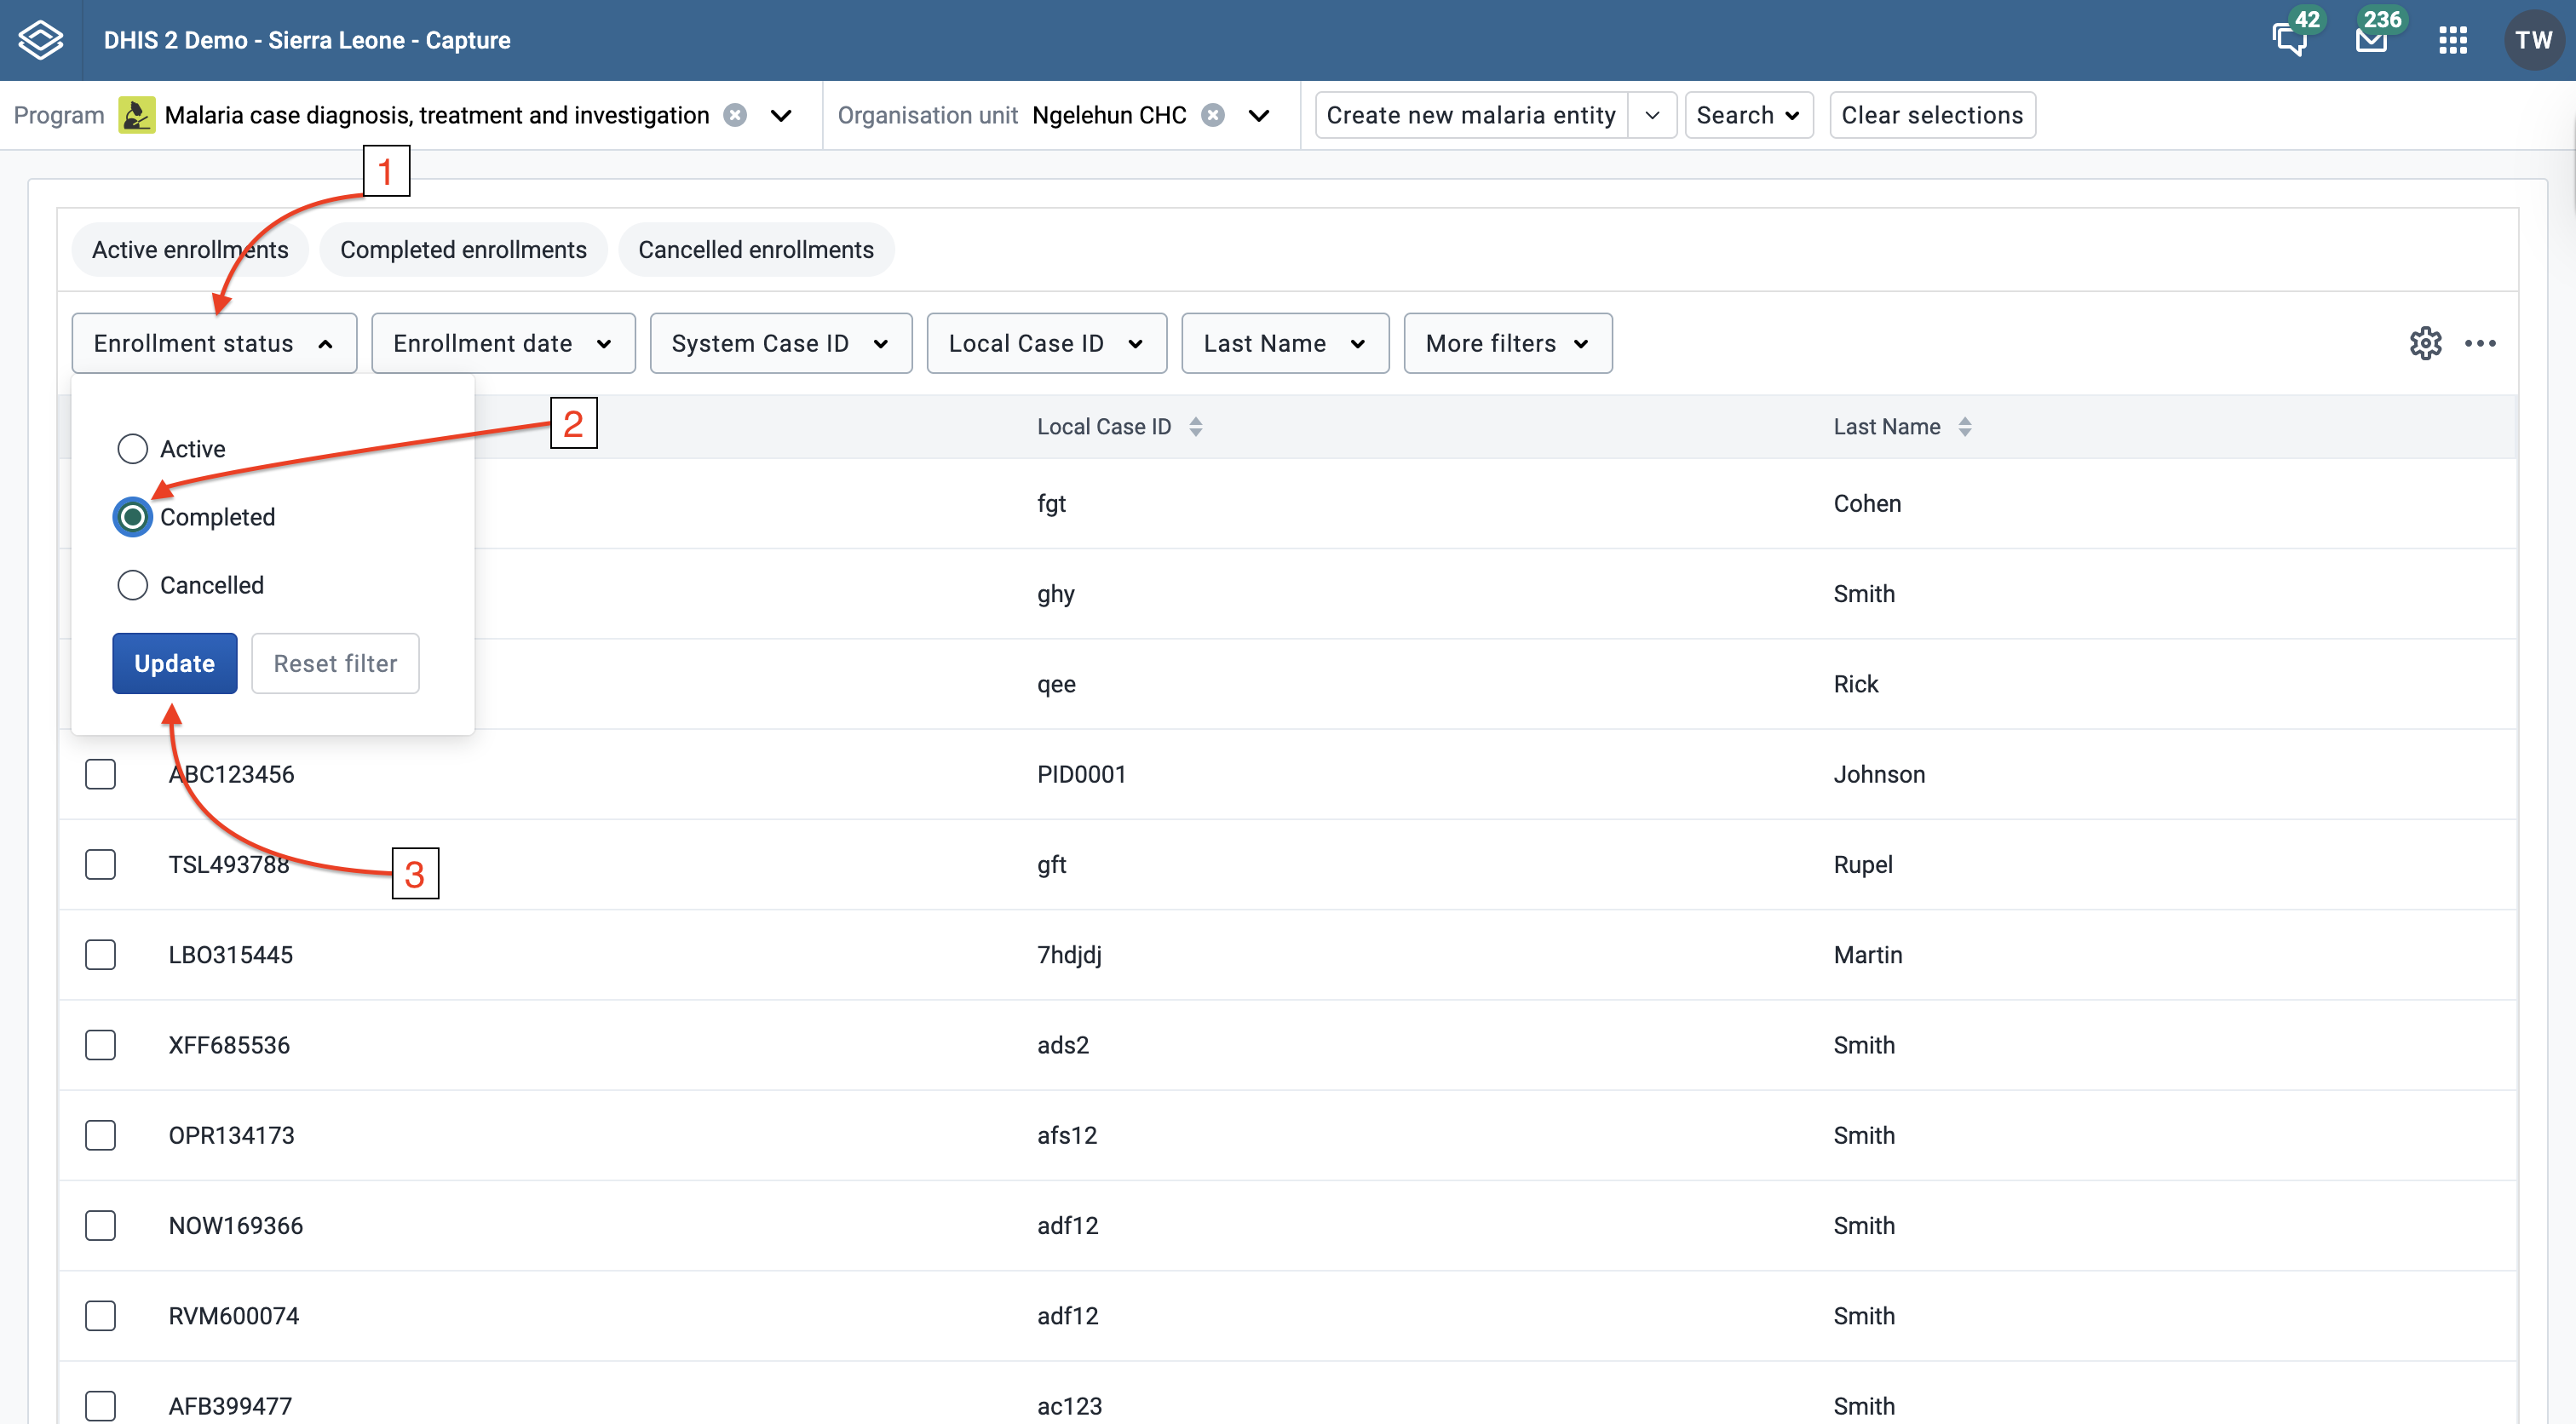
Use the buttons above the list to filter it.

As an example, you could filter the list to show only tracked entity instances where the enrollment status is "Completed": Click the "Enrollment status" filter (1), select "Completed" (2) and then "Update" the changes (3).
Each filter adapts to the attribute's value type — for example, numeric attributes provide a range selector, text attributes a search input, and date attributes a date picker. Filtering is available for all value types except MULTI_TEXT (multi-select option sets).
Data element filters show two checkboxes at the top:
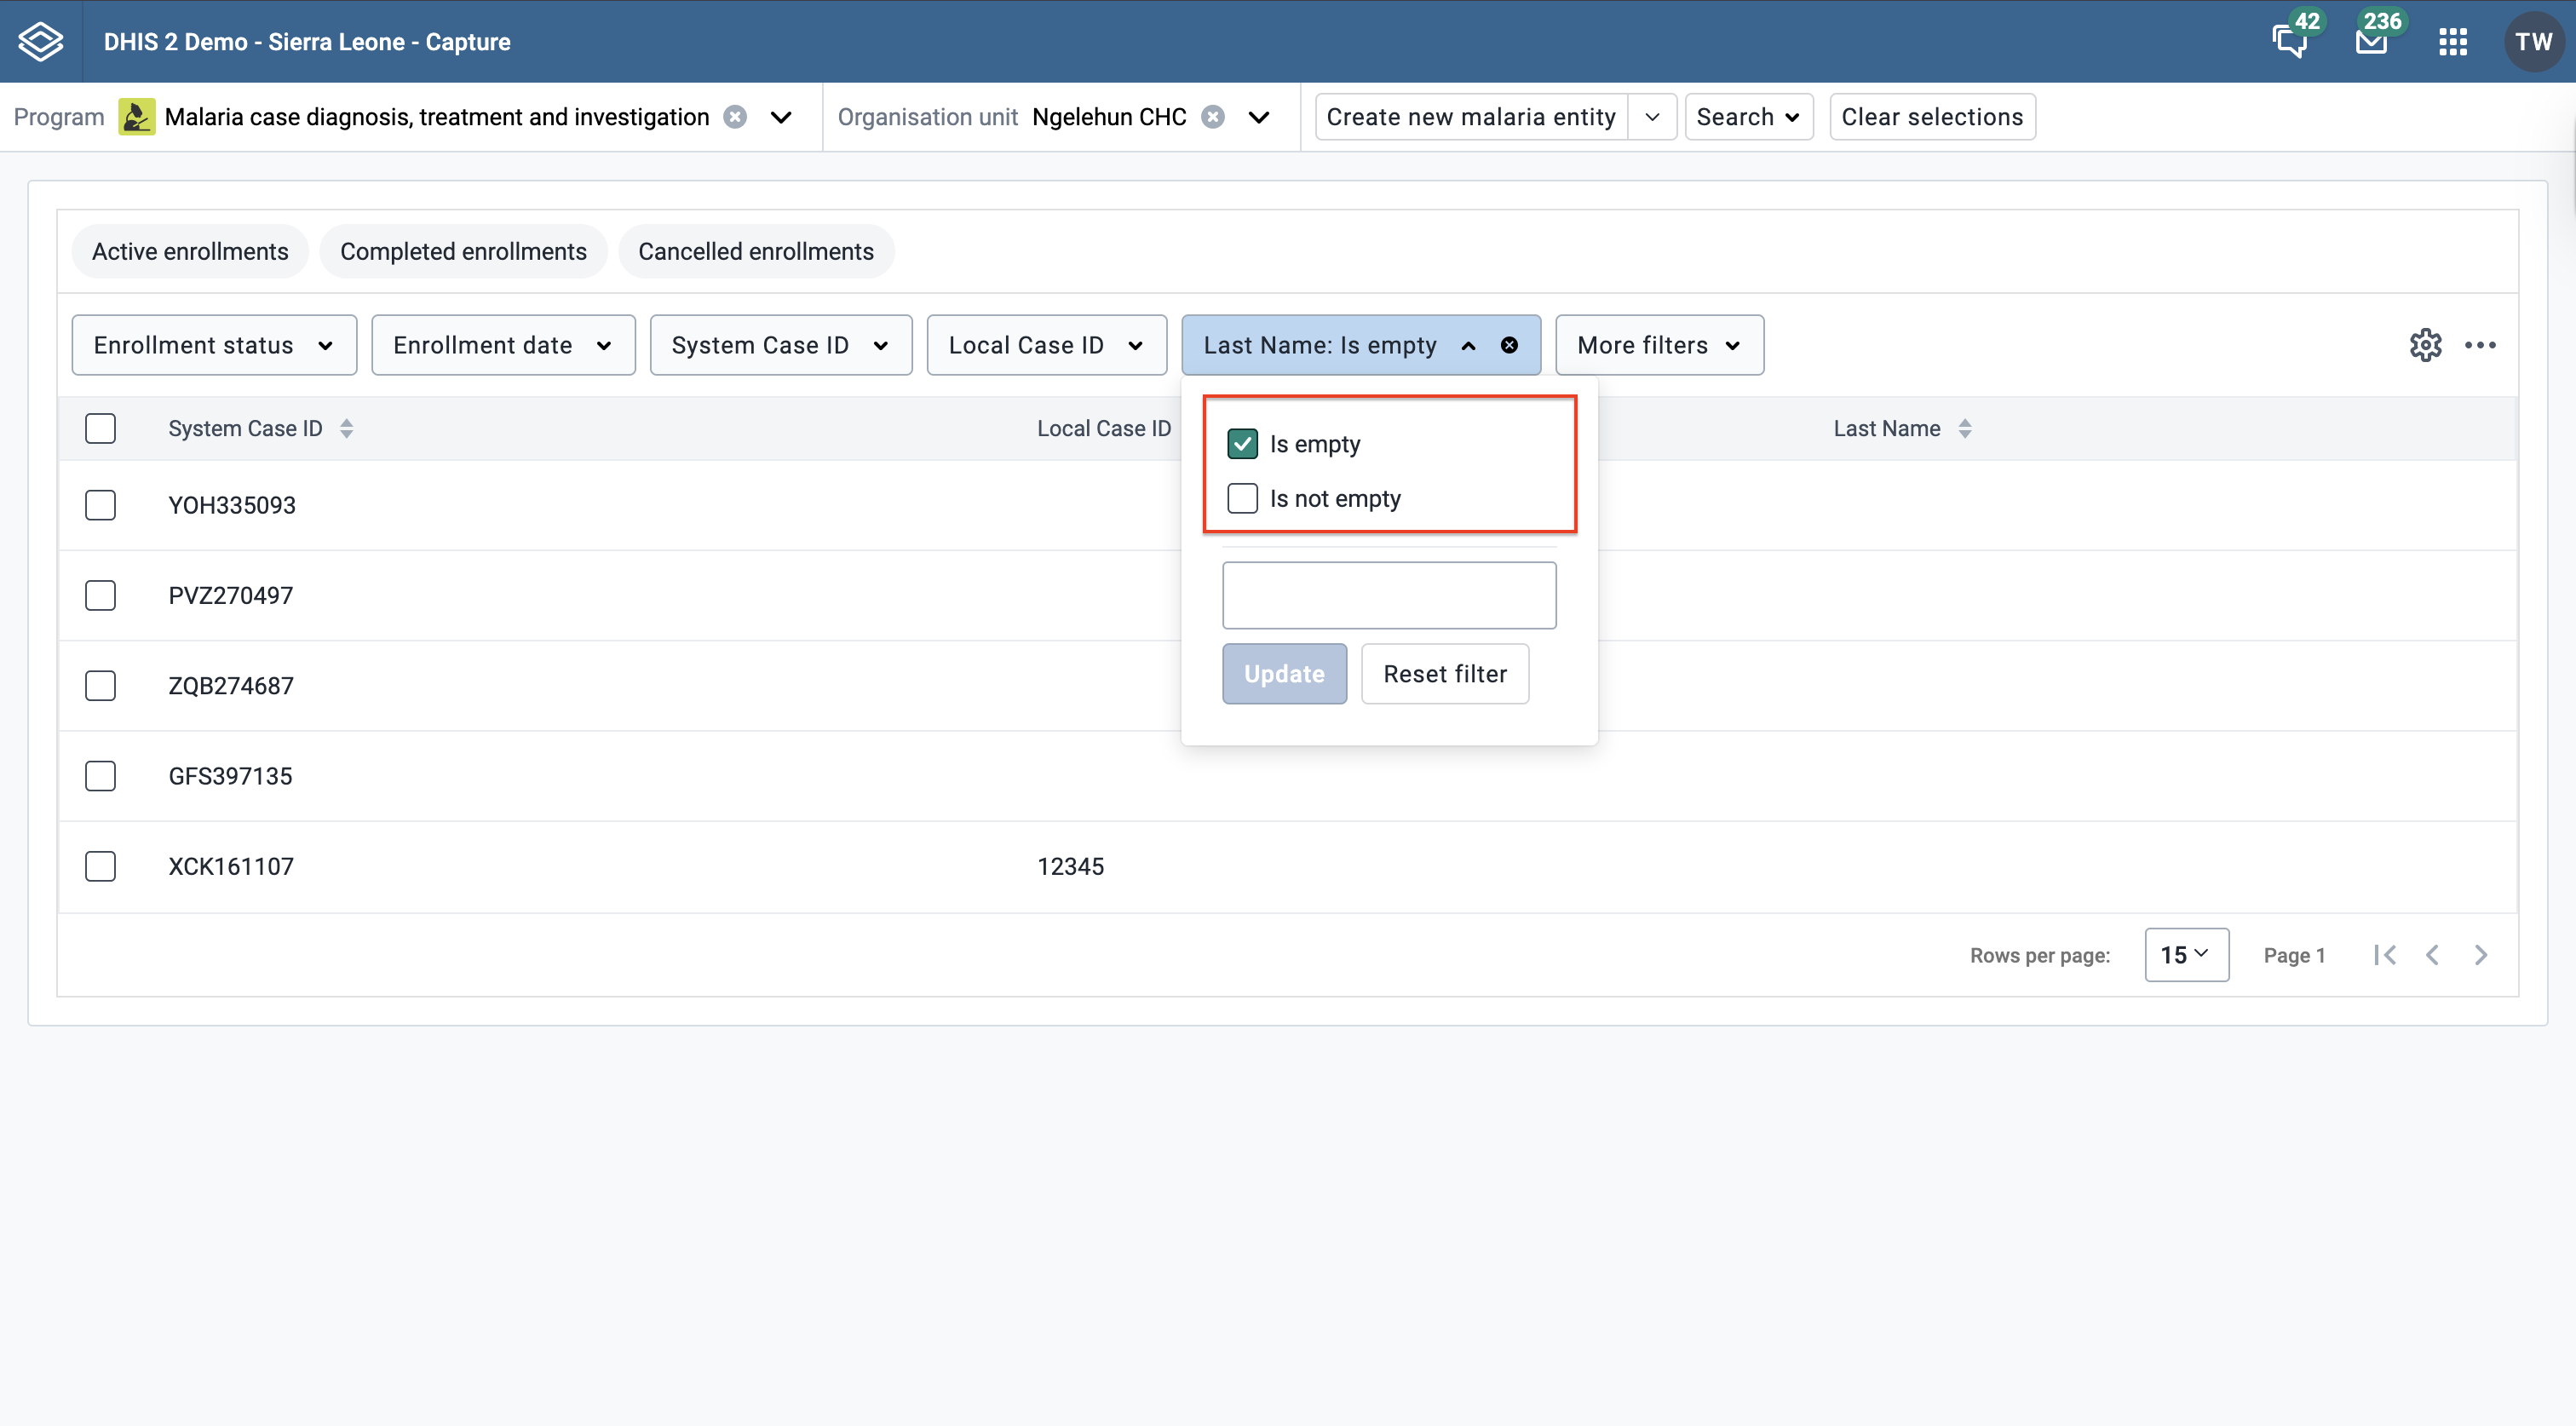
Only one option can be active at a time per filter. Selecting Is empty or Is not empty clears any value-based criteria for the filter.
For image, file and coordinate data elements, Is empty and Is not empty are the only available filter options.
Note
The empty / non-empty checkboxes are not shown on the main filters (report date, status, assignee, etc.).
Filtering on empty / non-empty values requires DHIS2 server version 2.42 or higher. On older servers the checkboxes are not shown.
Click one of the column headers to sort the list by that column. A small arrow is displayed next to the column header to indicate the current sort order. Click again to change between ascending and descending order.

You can select which columns to show in the list and also reorganize the order of the columns.
Click the gear icon in the top right corner of the list. Tick the checkboxes for the the columns you would like to display (1) and reorgainze the columns by dragging and dropping (2).

You will find the predefined list views above the filters for the list. Click to load a view.


Note You can download the tracked entities list in JSON or CSV formats.
You can perform bulk actions on tracked entities and their enrollments in the tracked entity list.
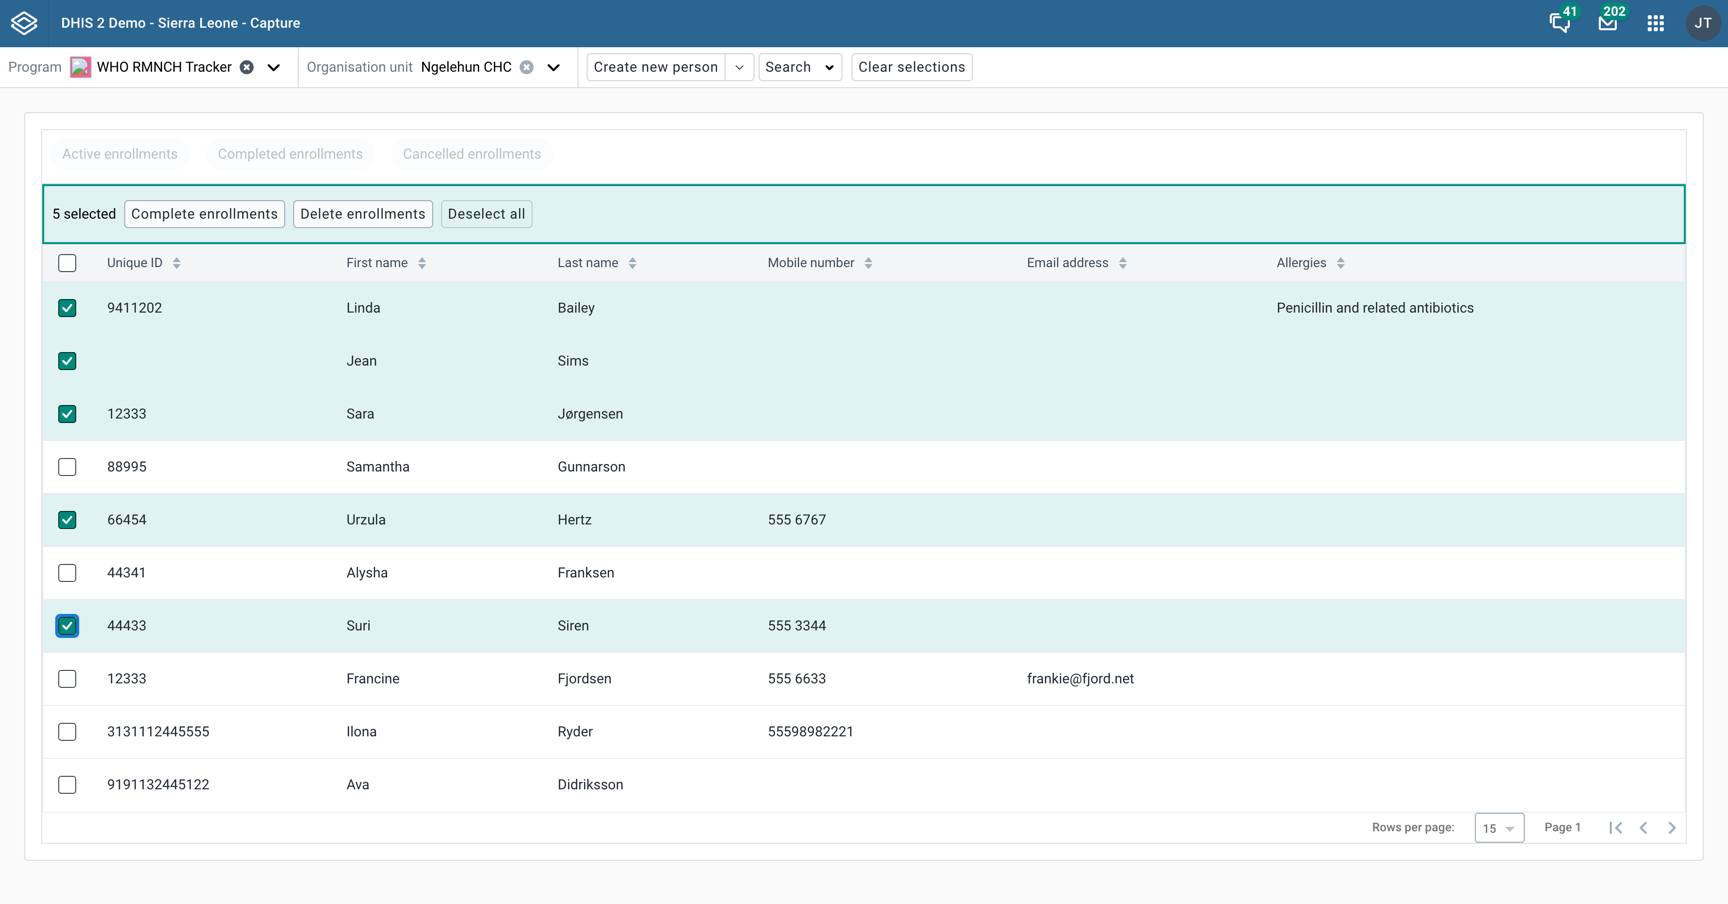
Select the tracked entities you want to perform the action on by clicking the checkbox to the left of the tracked entity.
Click the Complete enrollments button.
Confirm the action in the dialog that appears.
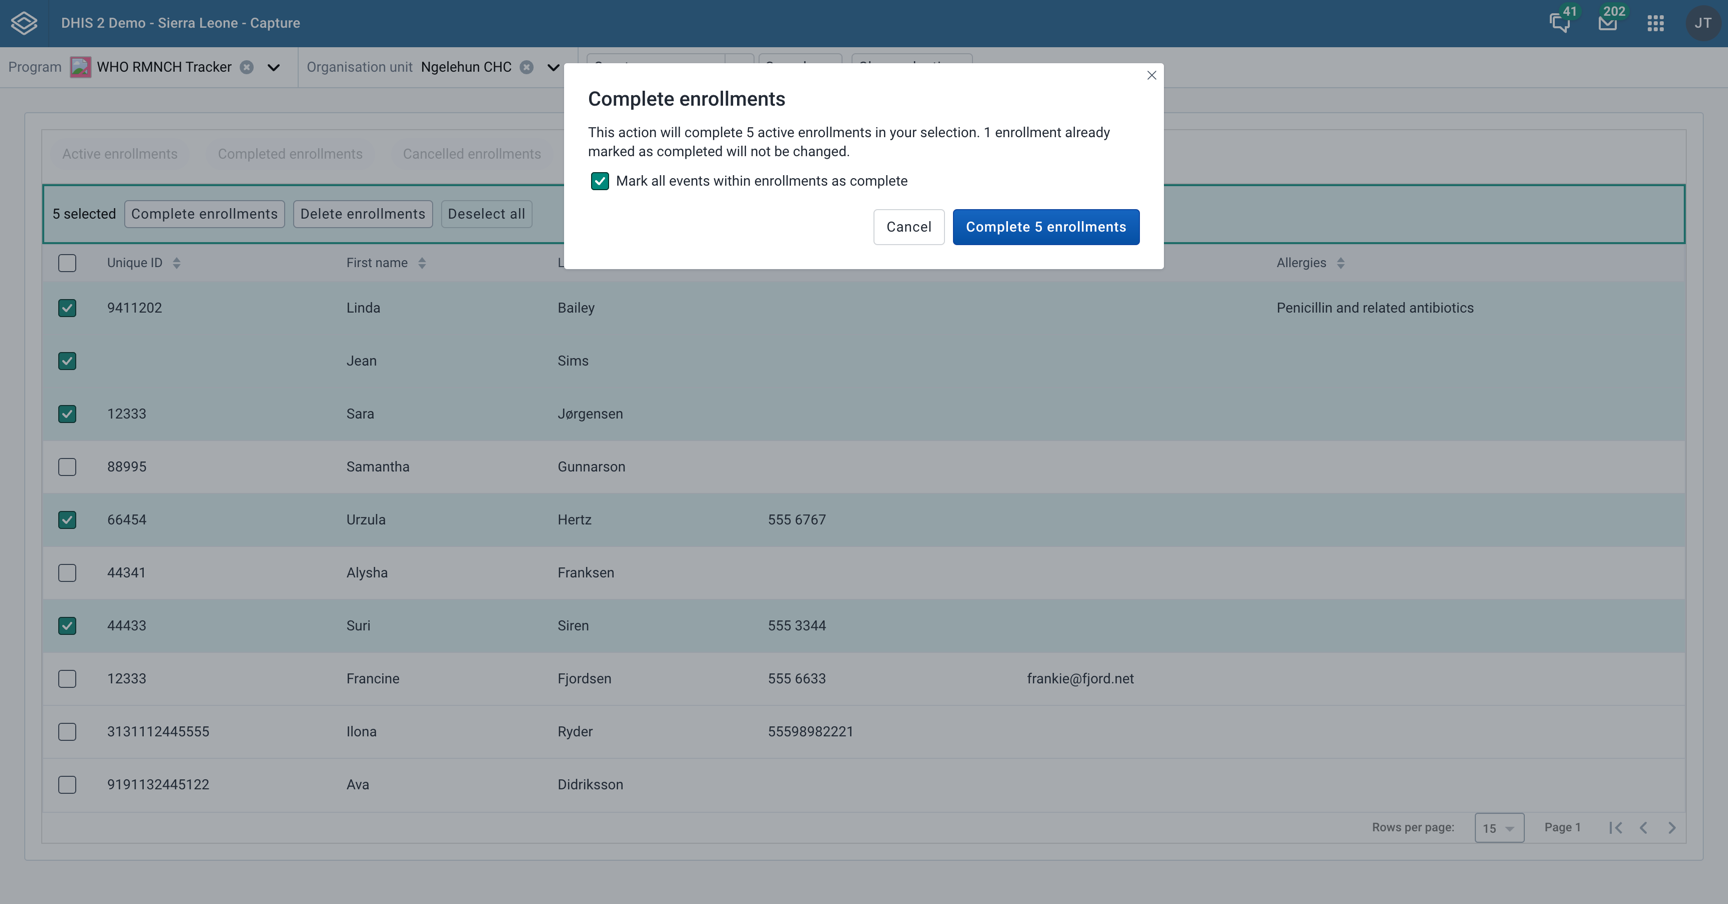
Select the tracked entities you want to perform the action on by clicking the checkbox to the left of the tracked entity.
Click the Delete enrollments button.
In the dialog that appears, select what enrollment statuses you want to delete and confirm the action.
You can choose any combination of enrollment statuses to delete.
Confirm the action in the dialog that appears.
You can show data elements from a single stage in a working list. Select the "Program stage" option from the "More filters" dropdown, then choose a program stage.
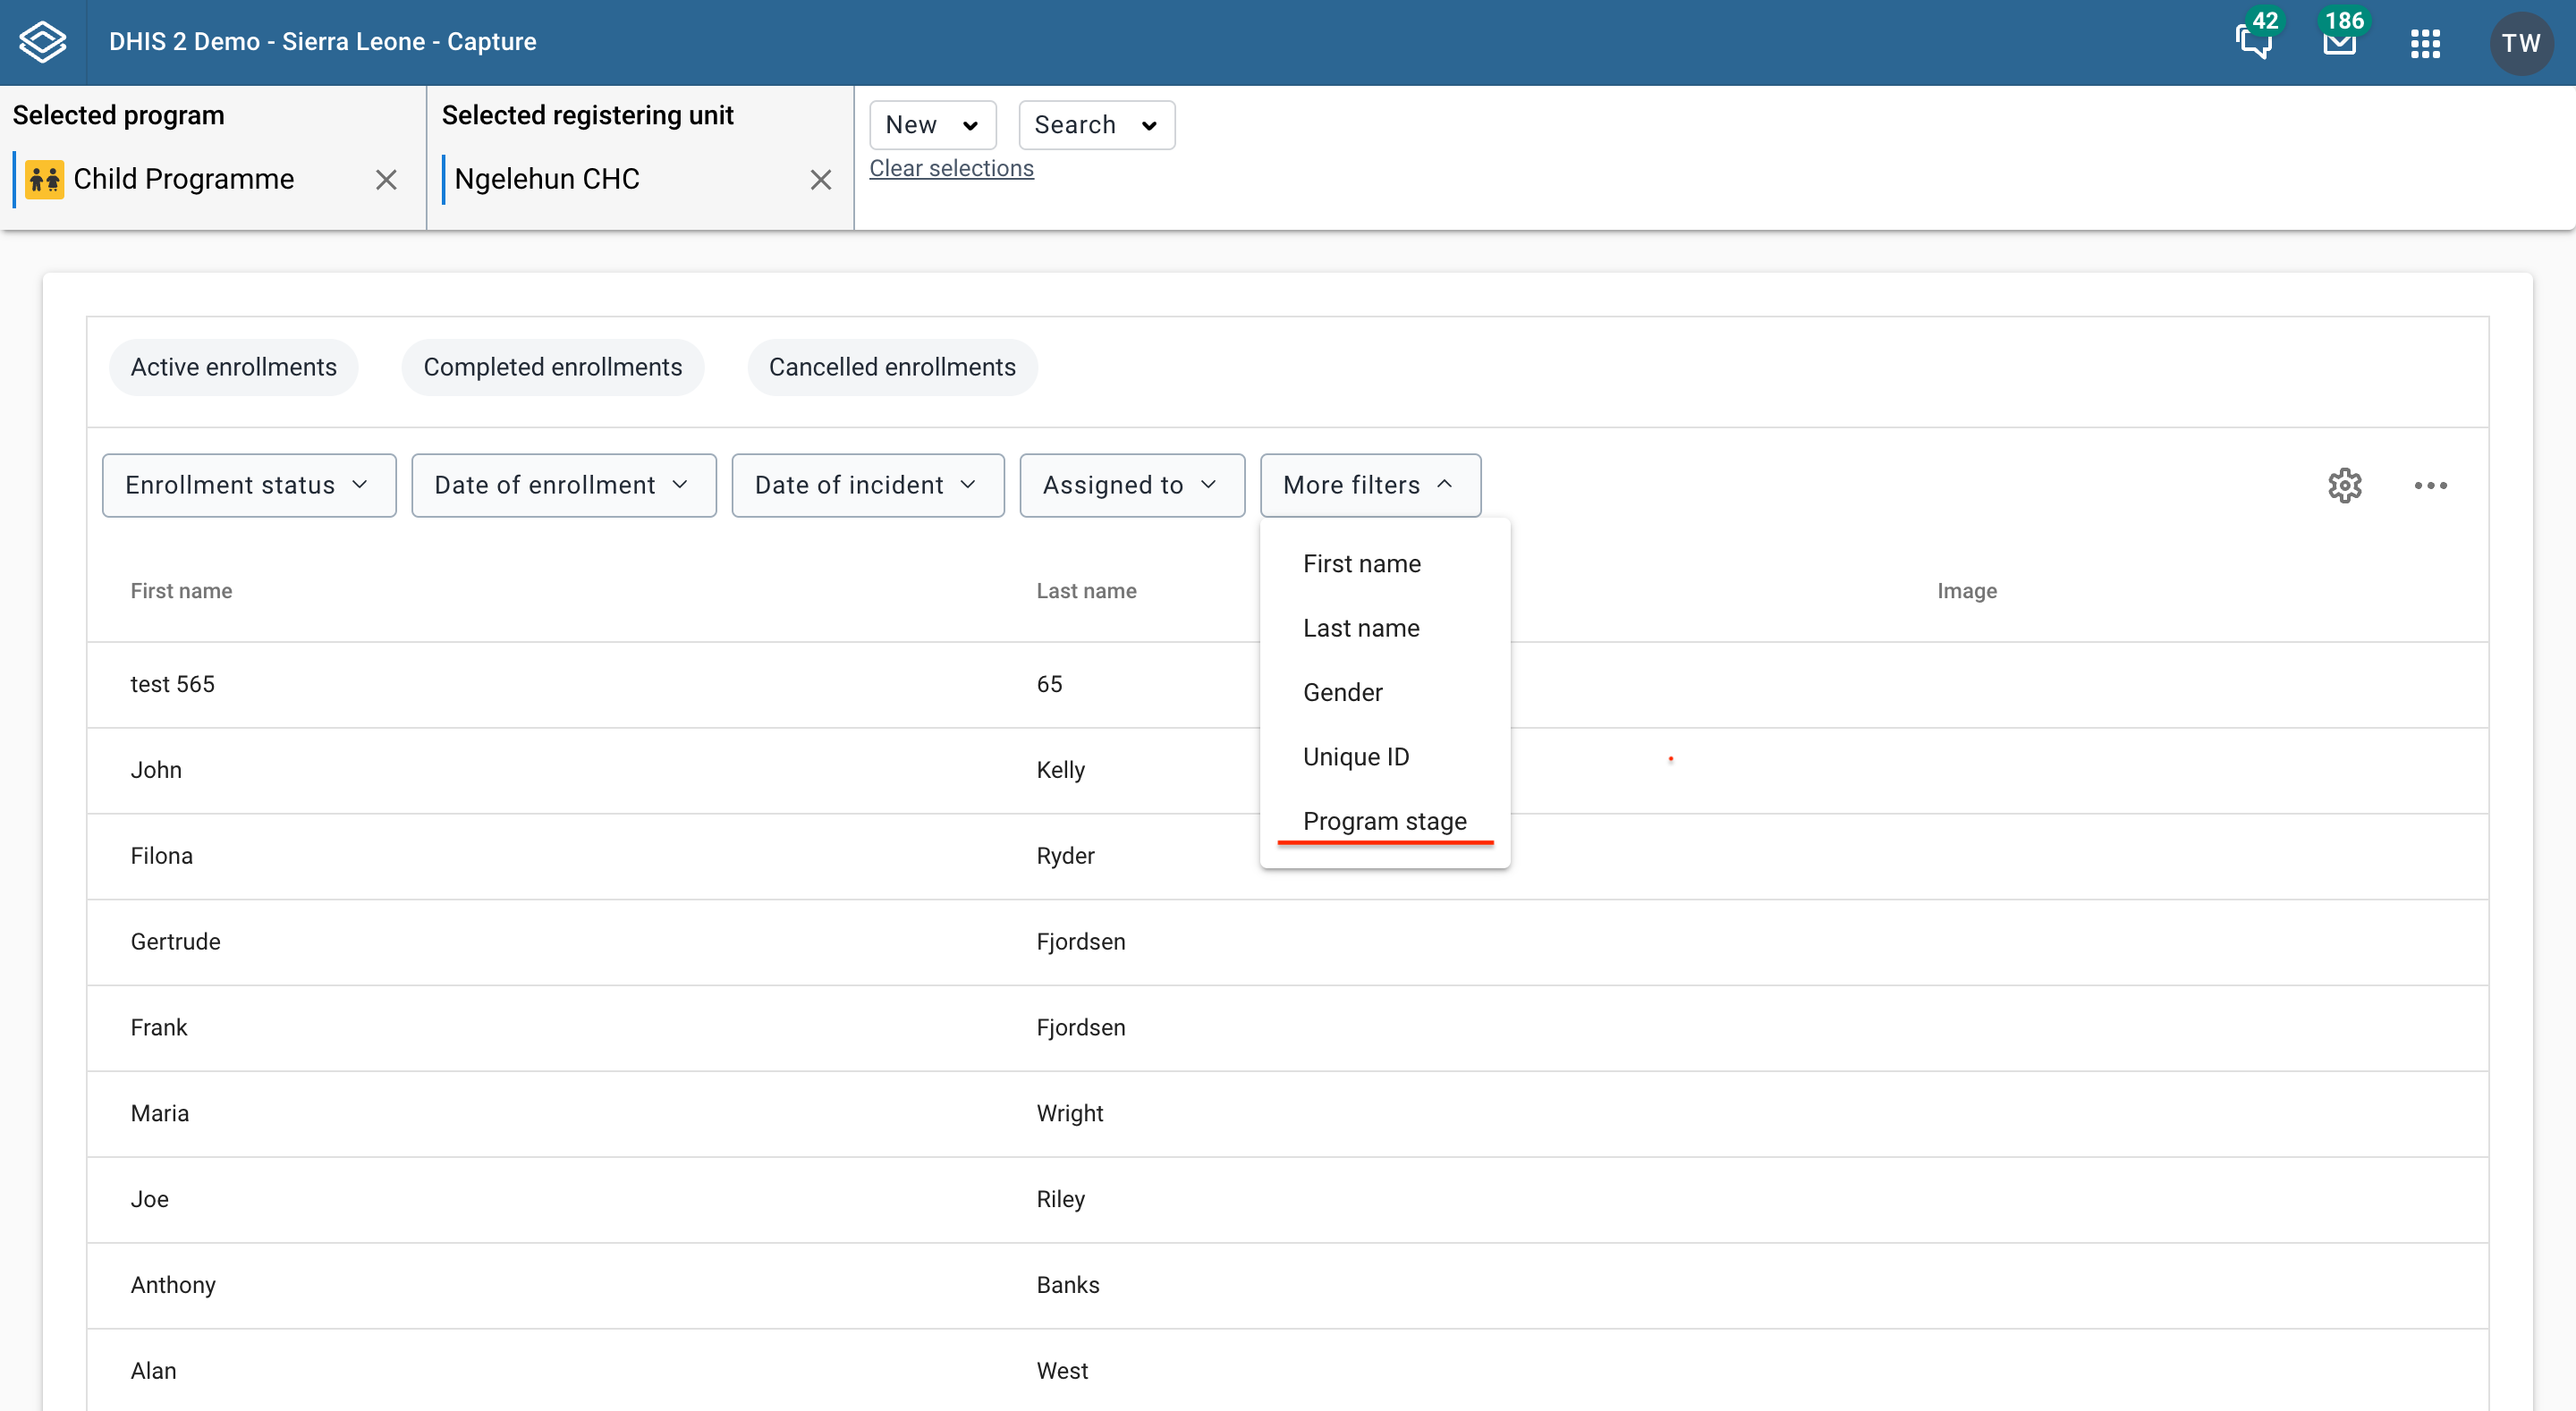
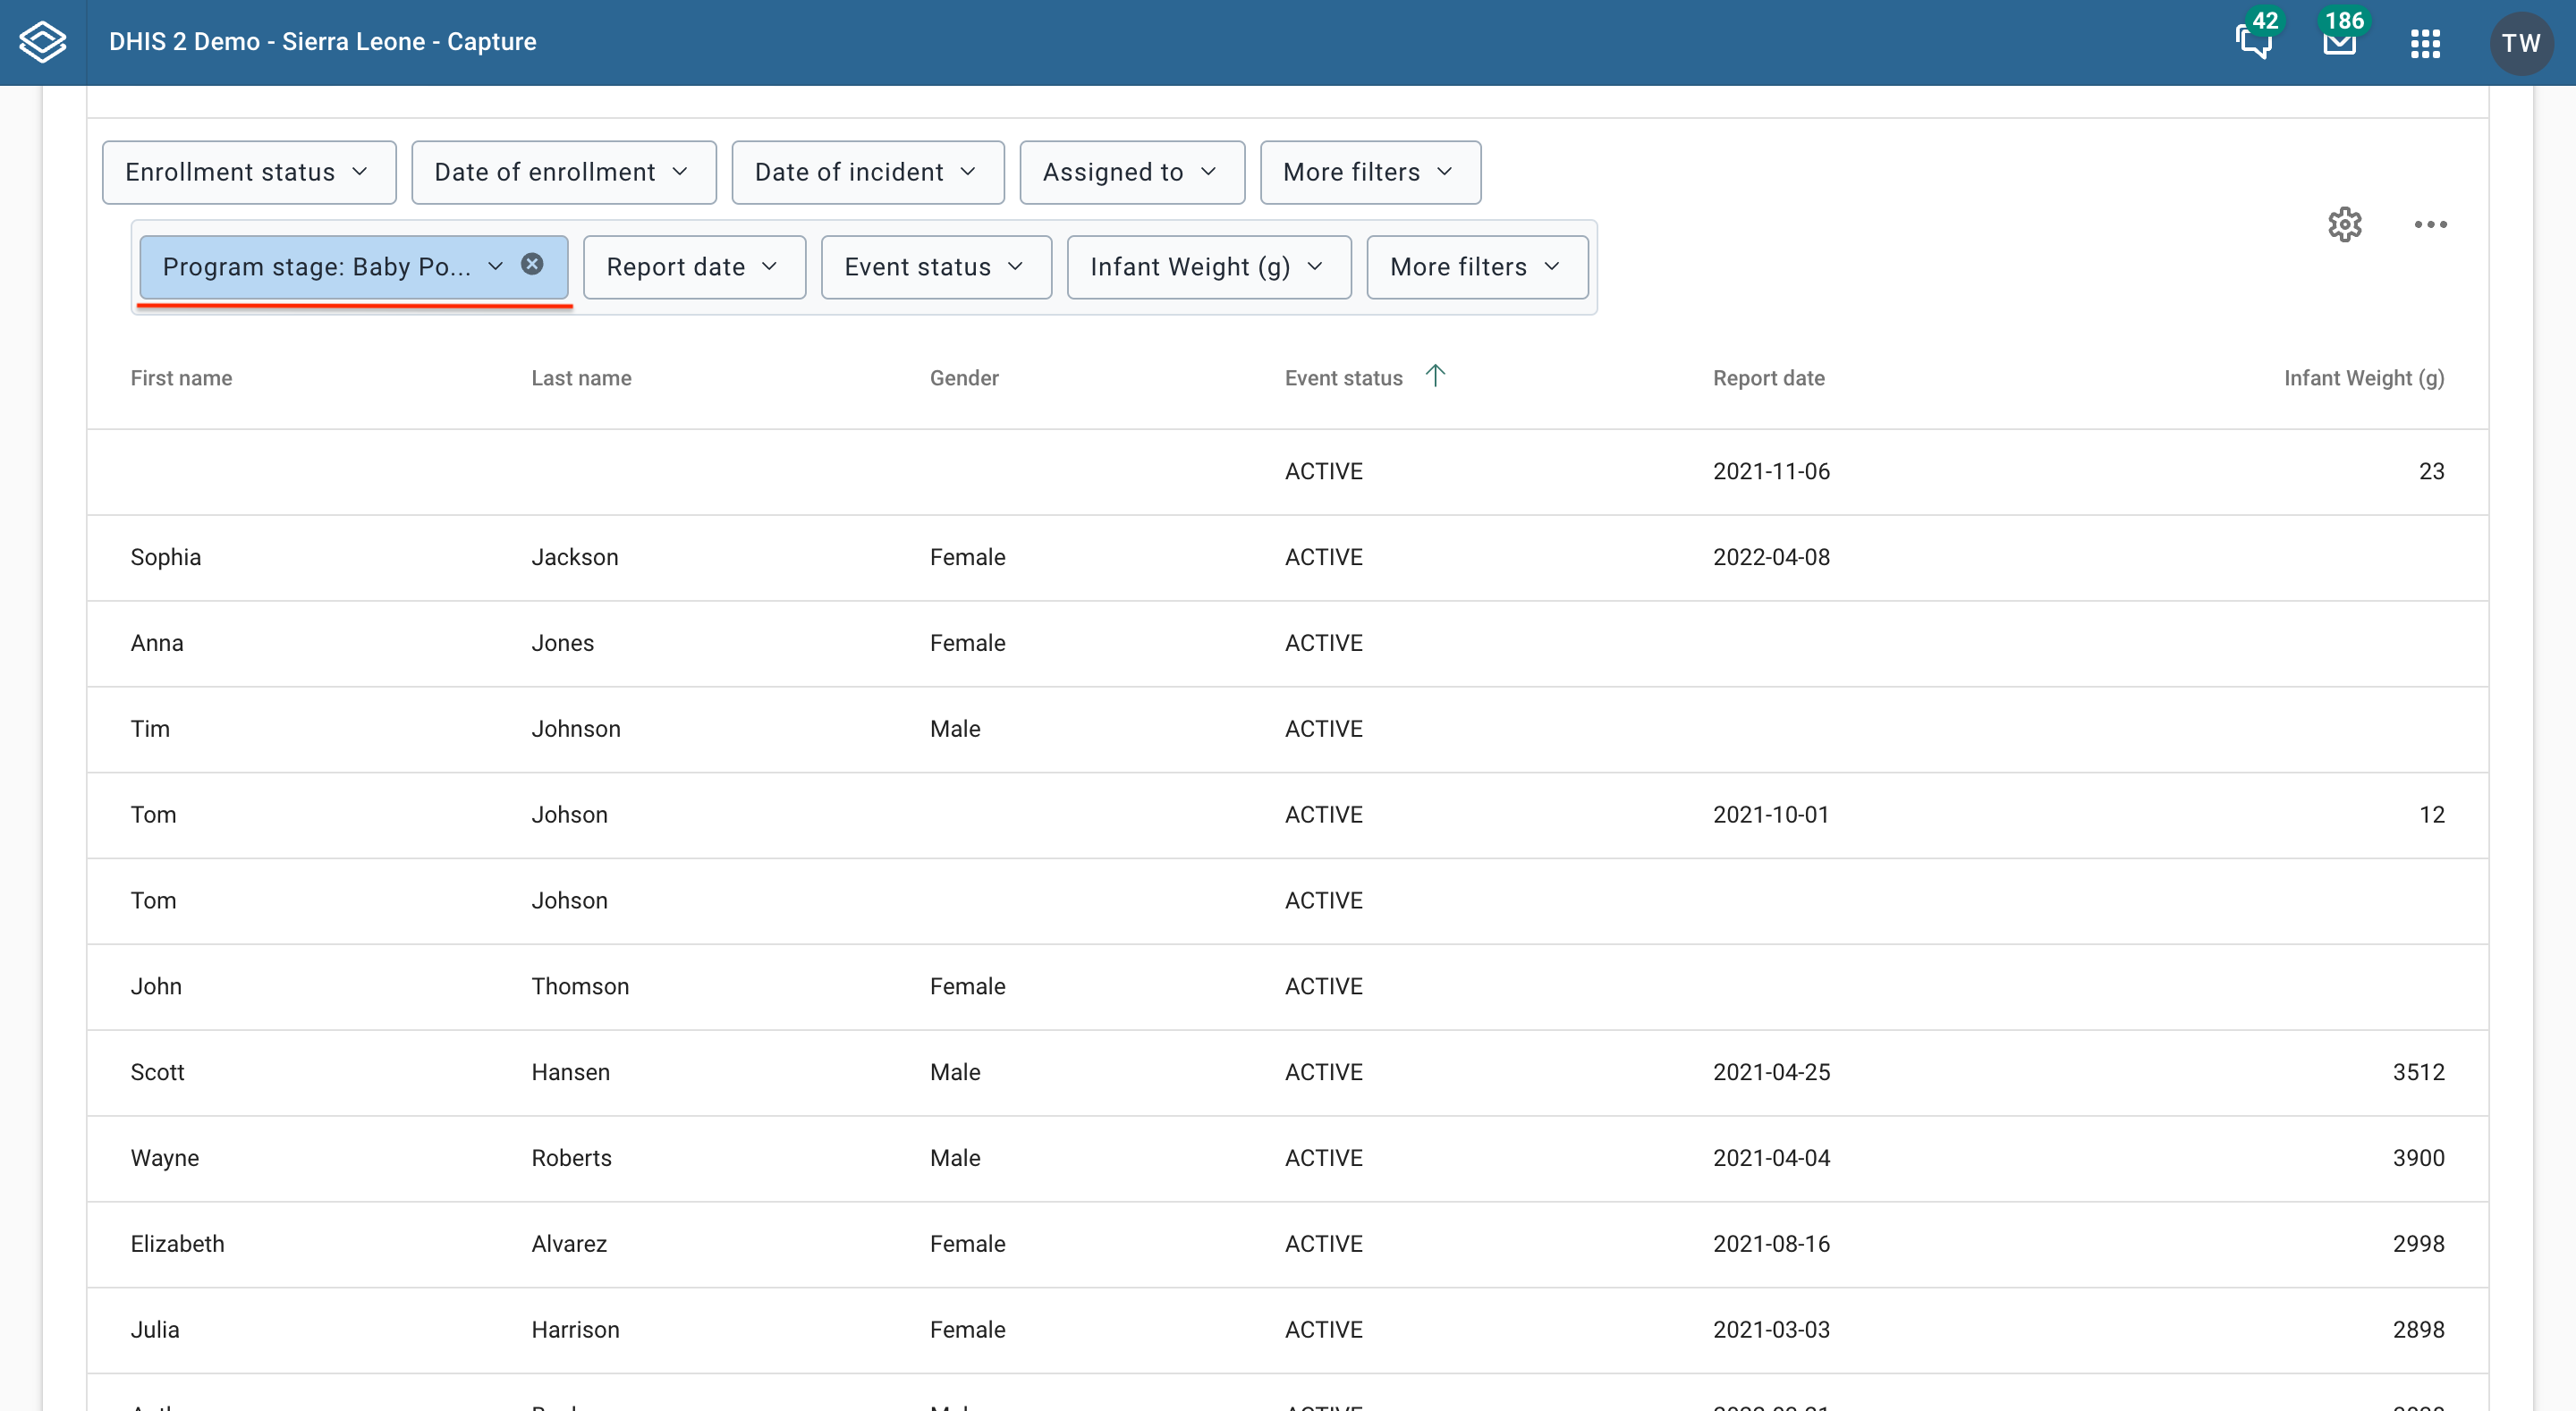
The tracker program stage list can be filtered, sorted, modified, saved, updated, deleted and shared in the same way as other working lists. Additionally, the program stage list can be filtered by assignee, just like an event program list.
For performance reasons the Capture app caches metadata in the client browser. When metadata is updated on the server the changes needs to be propagated to the clients that have already cached the metadata. Depending on the change, this is done in one of three ways:
If the change is bound to a program you will need to increase the program version for that particular program. For example, if you change the data elements in a program or a program rule, the version for the bound program needs be increased.
If the change is NOT bound to a program you will need to increase ANY program version for the change to be propagated to the clients. Examples here are changes to constants, organisation unit levels or organisation unit groups.
The exception to the two rules above is option sets. Option sets have their own version property, i.e. increasing the option set version should ensure the option set metadata are propagated to the clients.
You reach the enrollment dashboard either by typing in the address bar of your browser or using the user interface of the capture app. In this section we are focusing on the first use-case, where you type or paste the url you want to access in the Address bar.

One way to reach the enrollment dashboard and view a specific tracked entity instance's enrollment is by using only the enrollment id. For example the link .../dhis-web-capture/#/enrollment?enrollmentId=wBU0RAsYjKE will take you the dashboard for the enrollment with id wBU0RAsYjKE.
The top of the dashboard defines your context. For example in the image below the context is as follows, the selected program is "Child Programme", the organisation unit is "Ngelehun CHC", the selected person is "Anna Jones" and the selected enrollment is "2017-11-16 11:38".

You can change your context by clicking the "x" button.

When you deselect the program you see the following

When program and enrollment selections are empty, you first have to select a program. If the tracked entity instance (in this case "Anna Jones") has enrollments under the program you select you will see the following message.

If the tracked entity instance (in this case "Anna Jenkins") does not have enrollments under the program you select you will see a message explaining that there are no enrollments for that program. You will also be given the option to enroll "Anna Jenkins" in that program.

When you select an event program you will see the following. (Remember event programs do not have enrollments in the system, only tracker programs do).

You will also be given the option to either create a new event for the selected program or view the working lists for the selected program.
When your selected tracked entity type is a person, as in our example with Anna Jenkins, and you select a program that is not of type person but for example of a type Malaria case you will see the following.

You are also given the option to enroll a tracked entity instance in the program you selected.
When you deselect the organisation unit you see the following
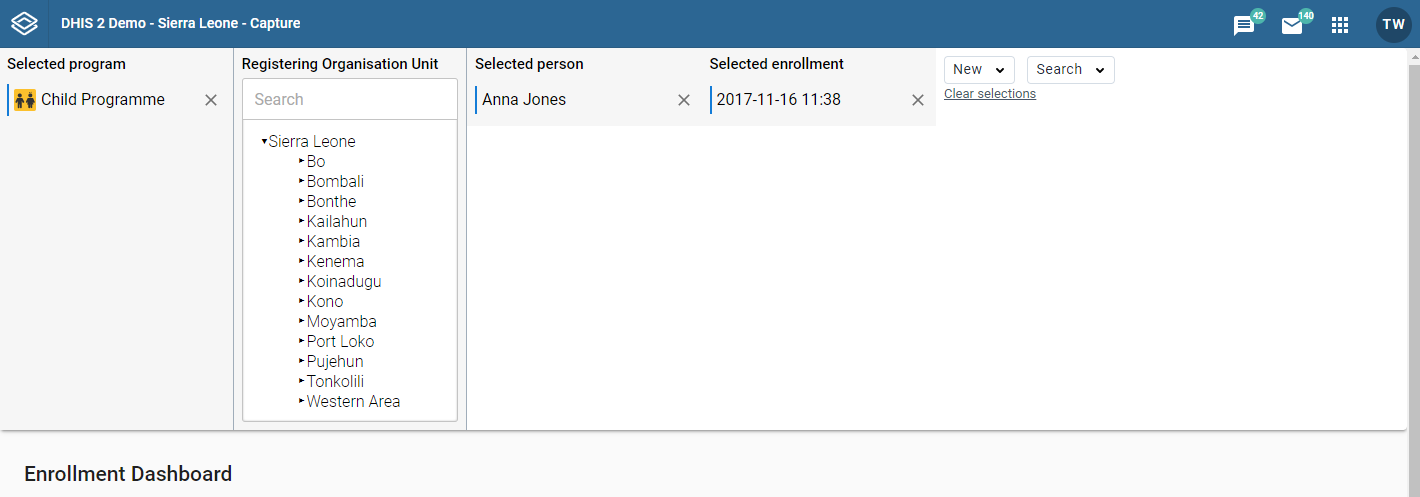
When you deselect the tracked entity instance, in this case "Anna Jones" you are taken to the working lists in that Tracker program.
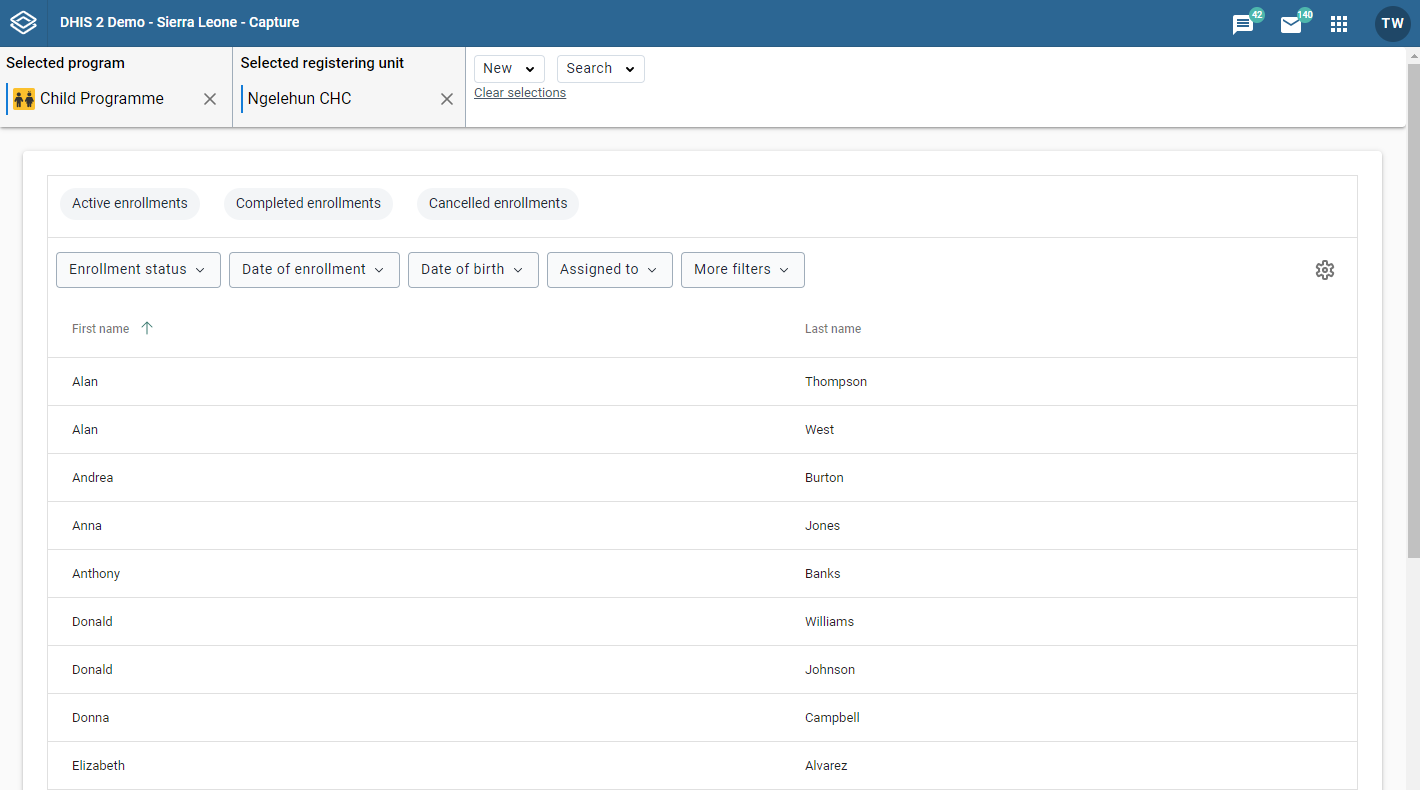
When you deselect the enrollment you see the following

The quick actions widget offers shortcuts for frequently used actions for the current enrollment.
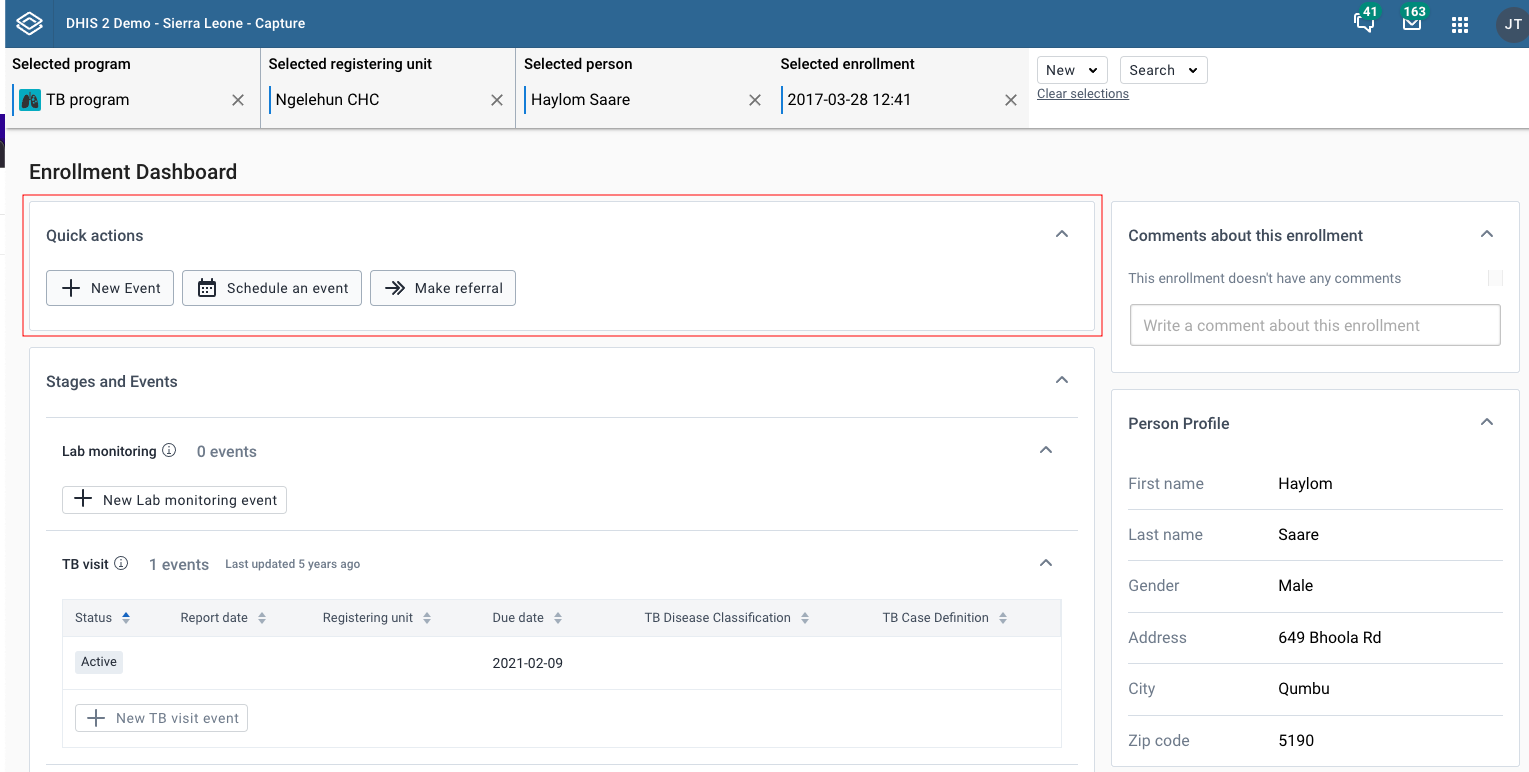
Stages can be collapsed or expanded to reveal the events inside.


In the collapsed state, you can view the summary information about this stage including: - Icon - Program stage name - Program stage description (on hovering the information icon) - Total number of events - Last updated date Depending on the status of events, there can be additional information regarding: total number of overdue events or total number of scheduled events.

When you expand the list, you will see the table contains the data of events in the stage. This includes mandatory columns: Status, Report date and Organization unit, the following columns depend on the data elements that have been selected as Display in list of event.
Events are sorted with most recent on top and other columns are also sortable.

When clicking New {stage event name} button, you will be redirected to the Add new event page for this selected stage.

When clicking Go to full {stage event name} button, you will be redirected to the Program stage list page for this selected stage.
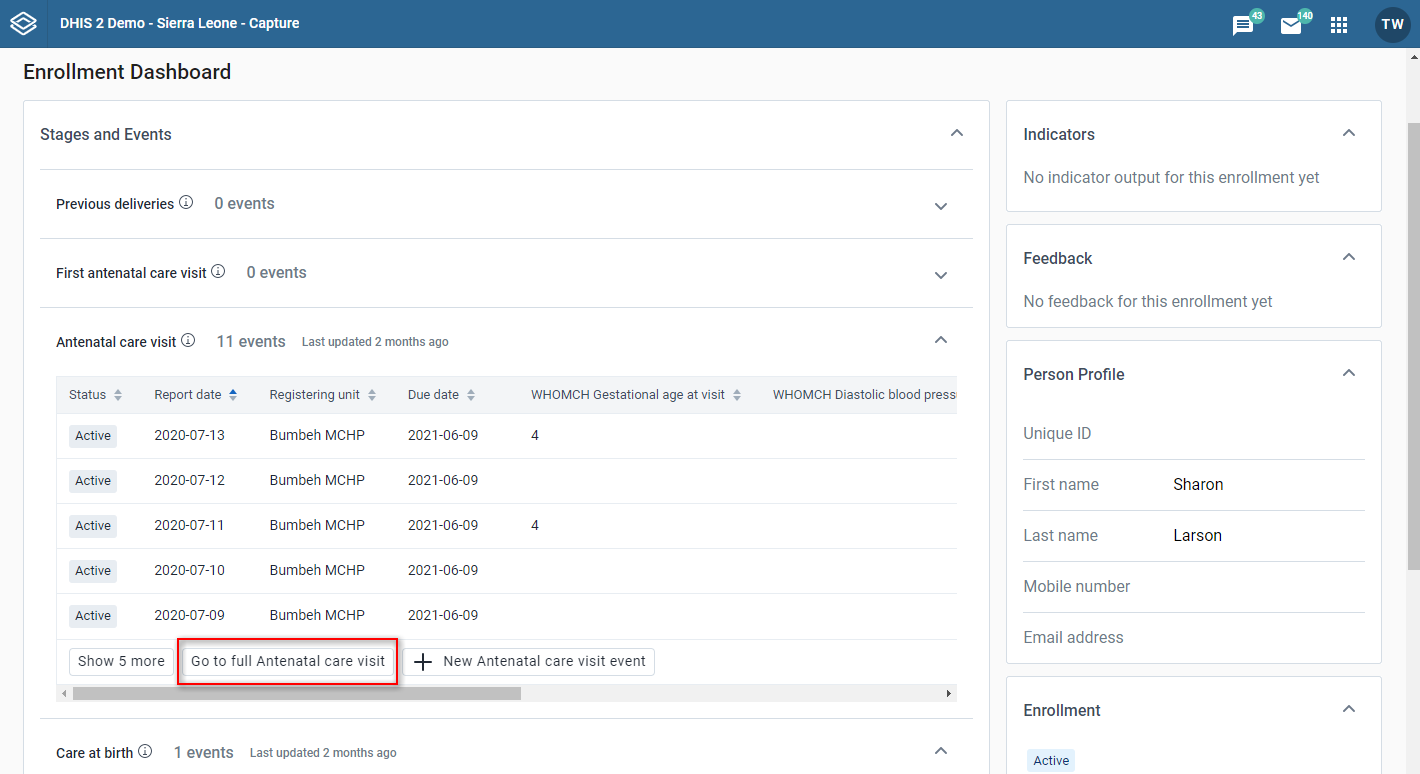
In case there are more than 5 events in the list, only the first 5 are shown. You will be able to view the rest by clicking Show more.

If you want to collapse events, you can use Reset list button which will return the table back to the default sorting and initial 5 events.
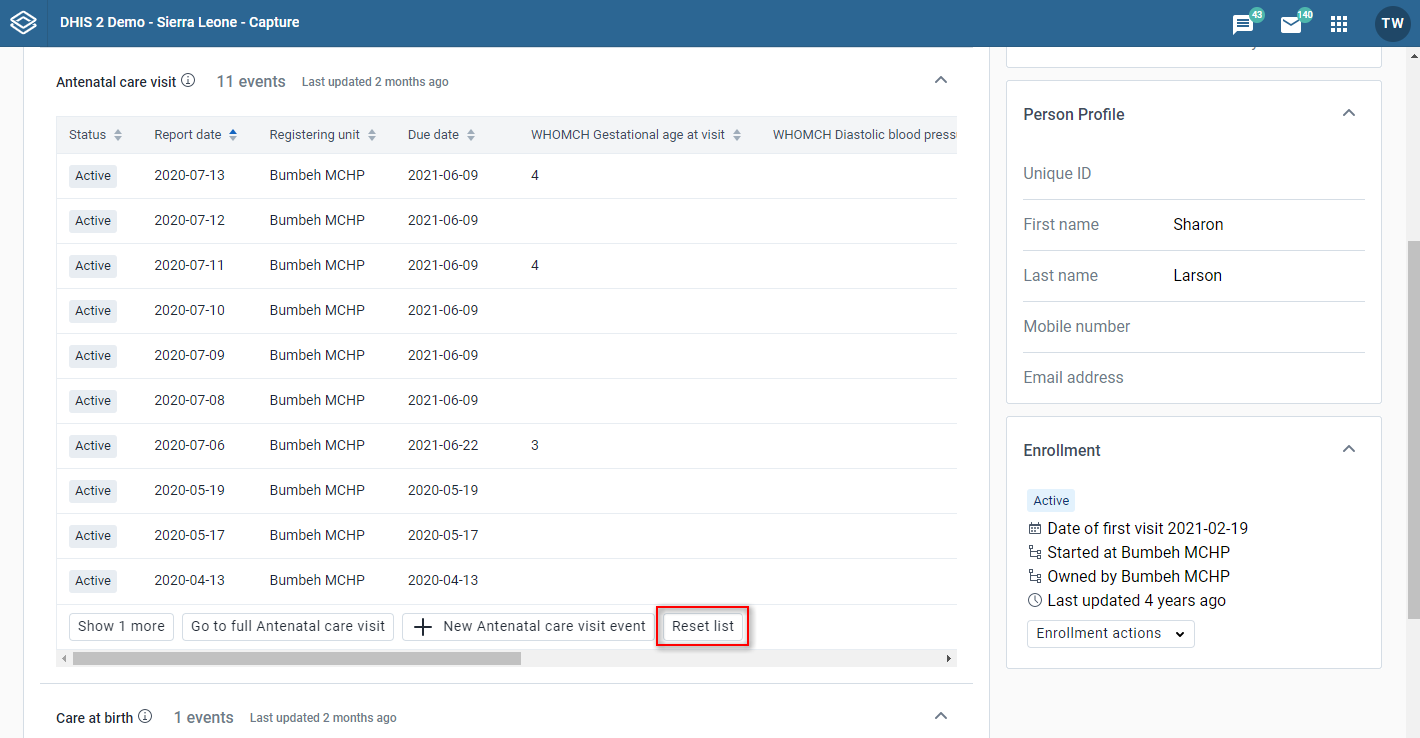
On the enrollment page you can see the enrollment widget
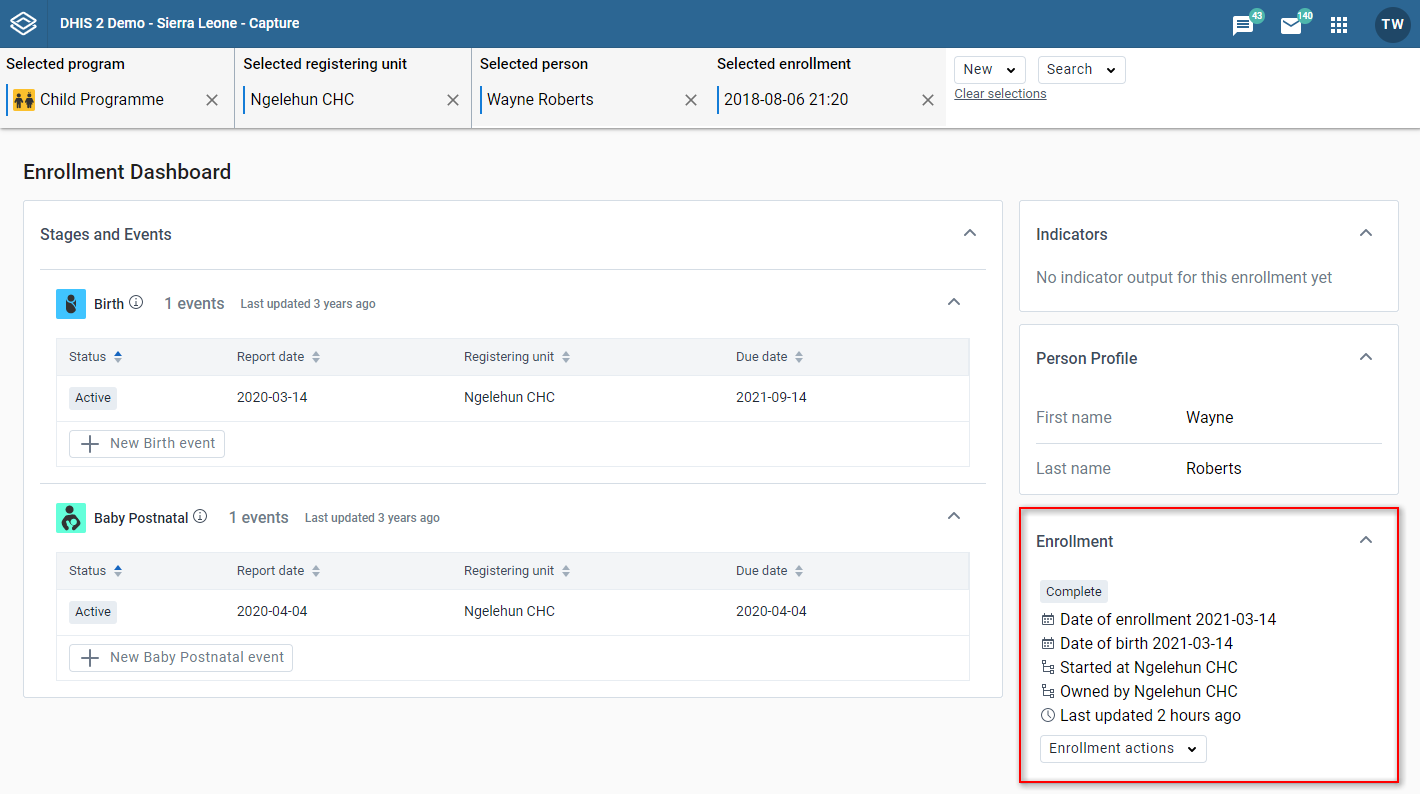
When you click on the enrollment actions button, a menu with all the available actions will open. You can:
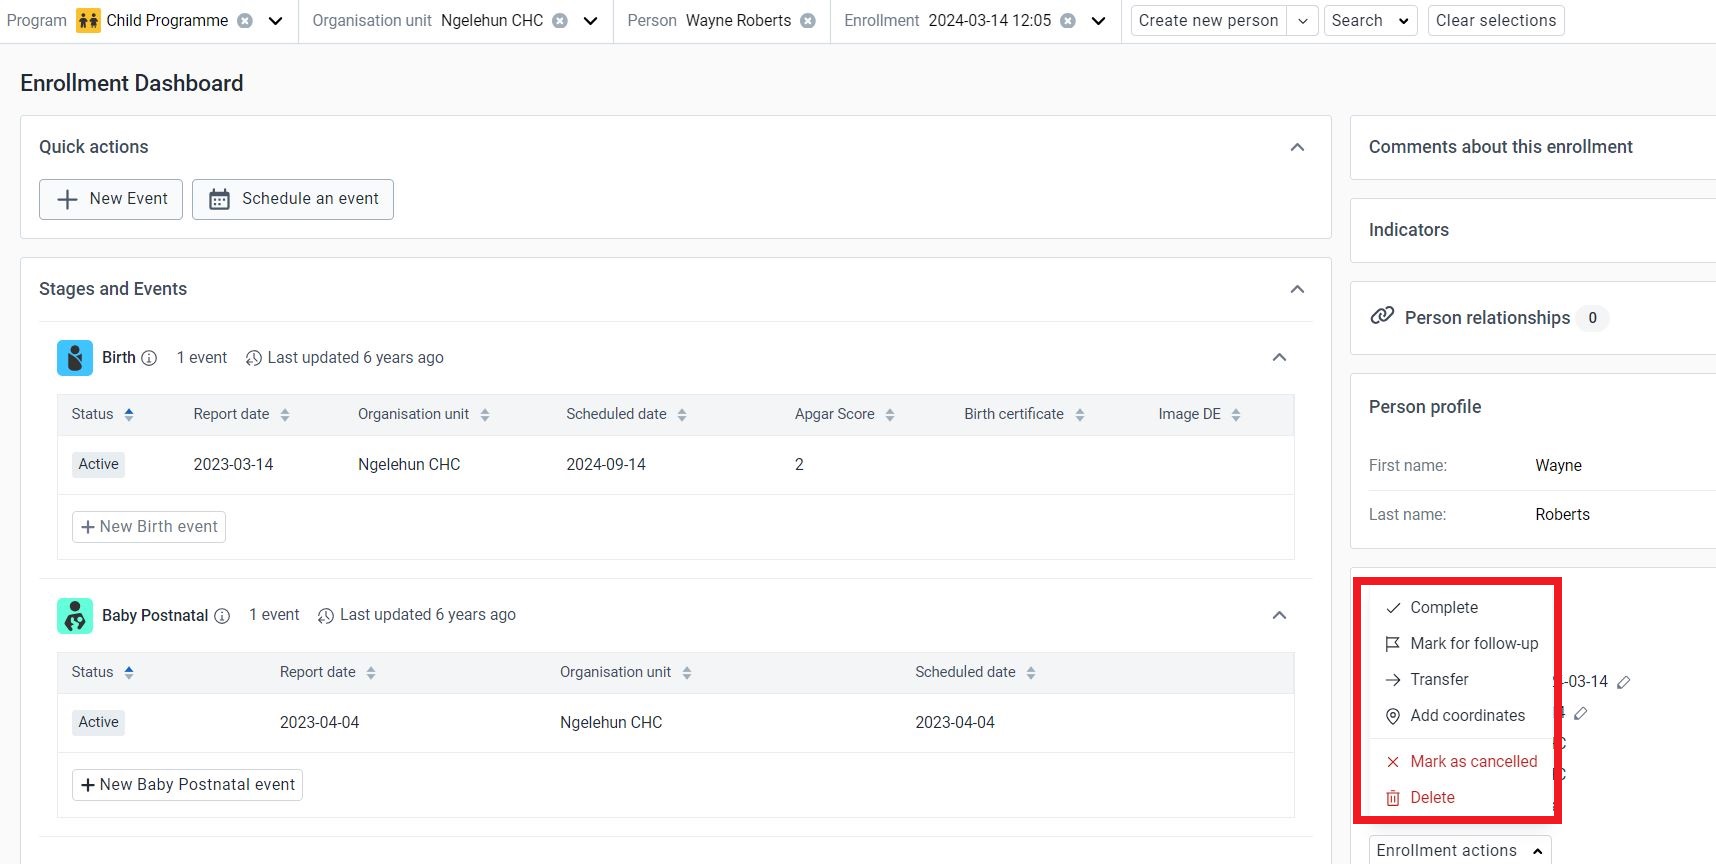
There can only be one active enrollment at a time. If there are no active enrollments, there will be a button Add new to enroll the tracked entity instance in the program again. If the program only allows one enrollment per tracked entity instance, the Add new button will be disabled with a tooltip saying Only one enrollment per {TET} is allowed in this program.
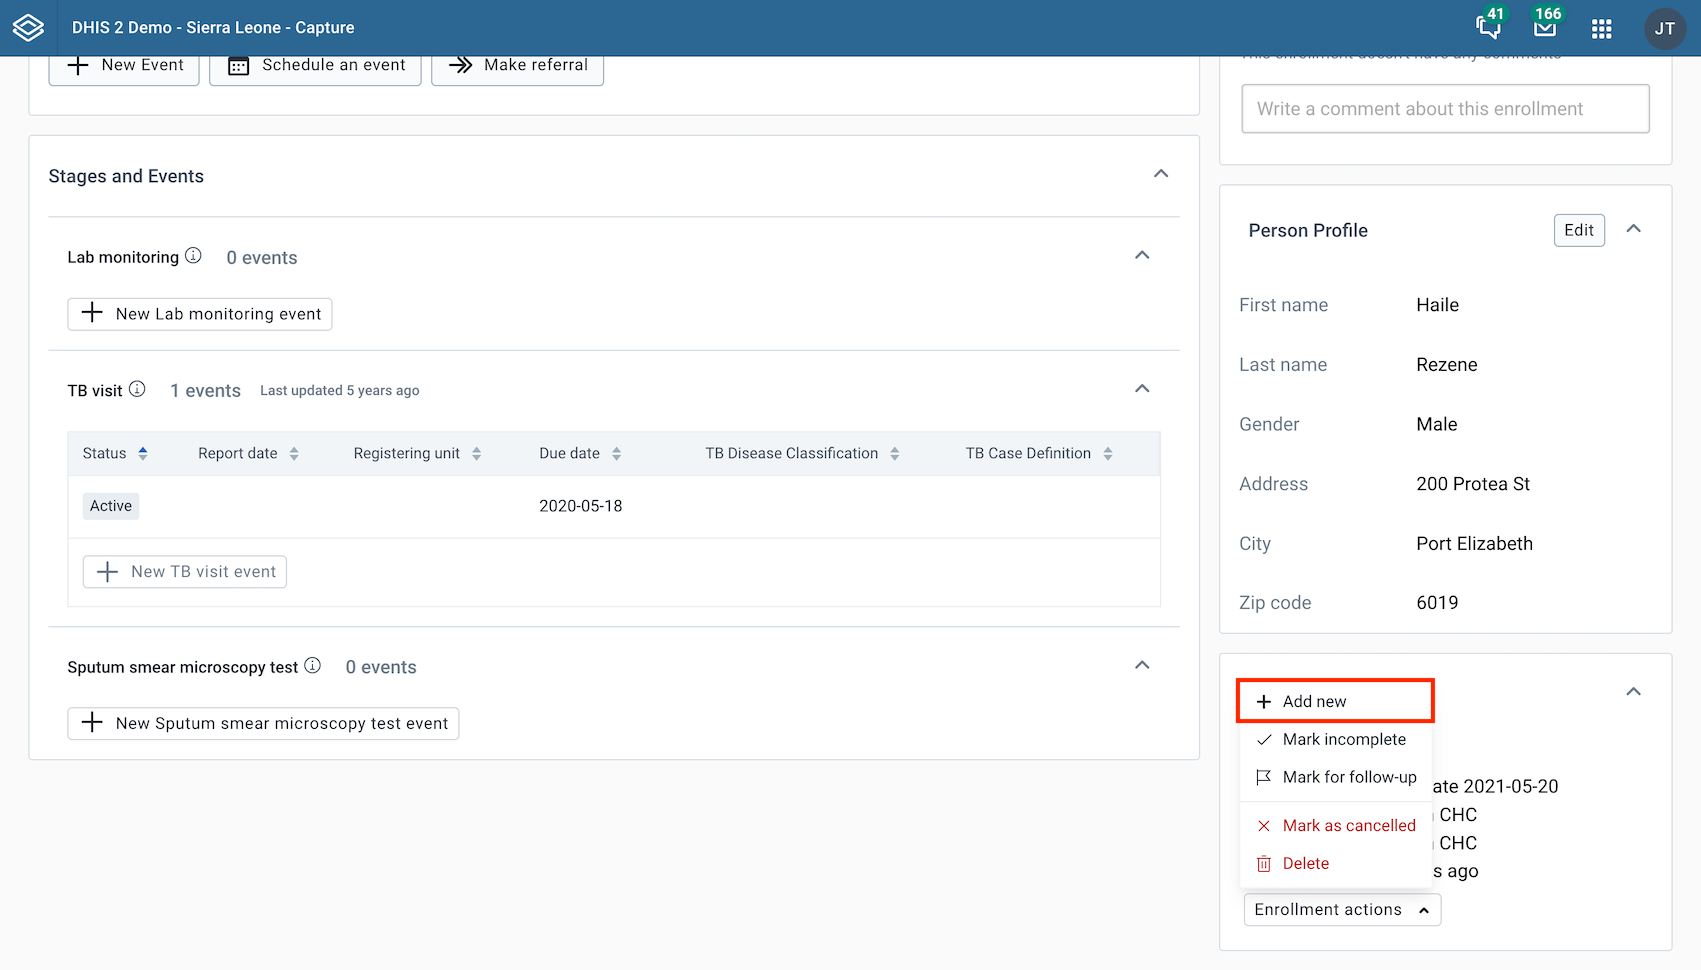
In the enrollment actions, you could also choose to transfer the enrollment to another organisation unit. Click the transfer button and select the organisation unit you want to transfer the enrollment to.
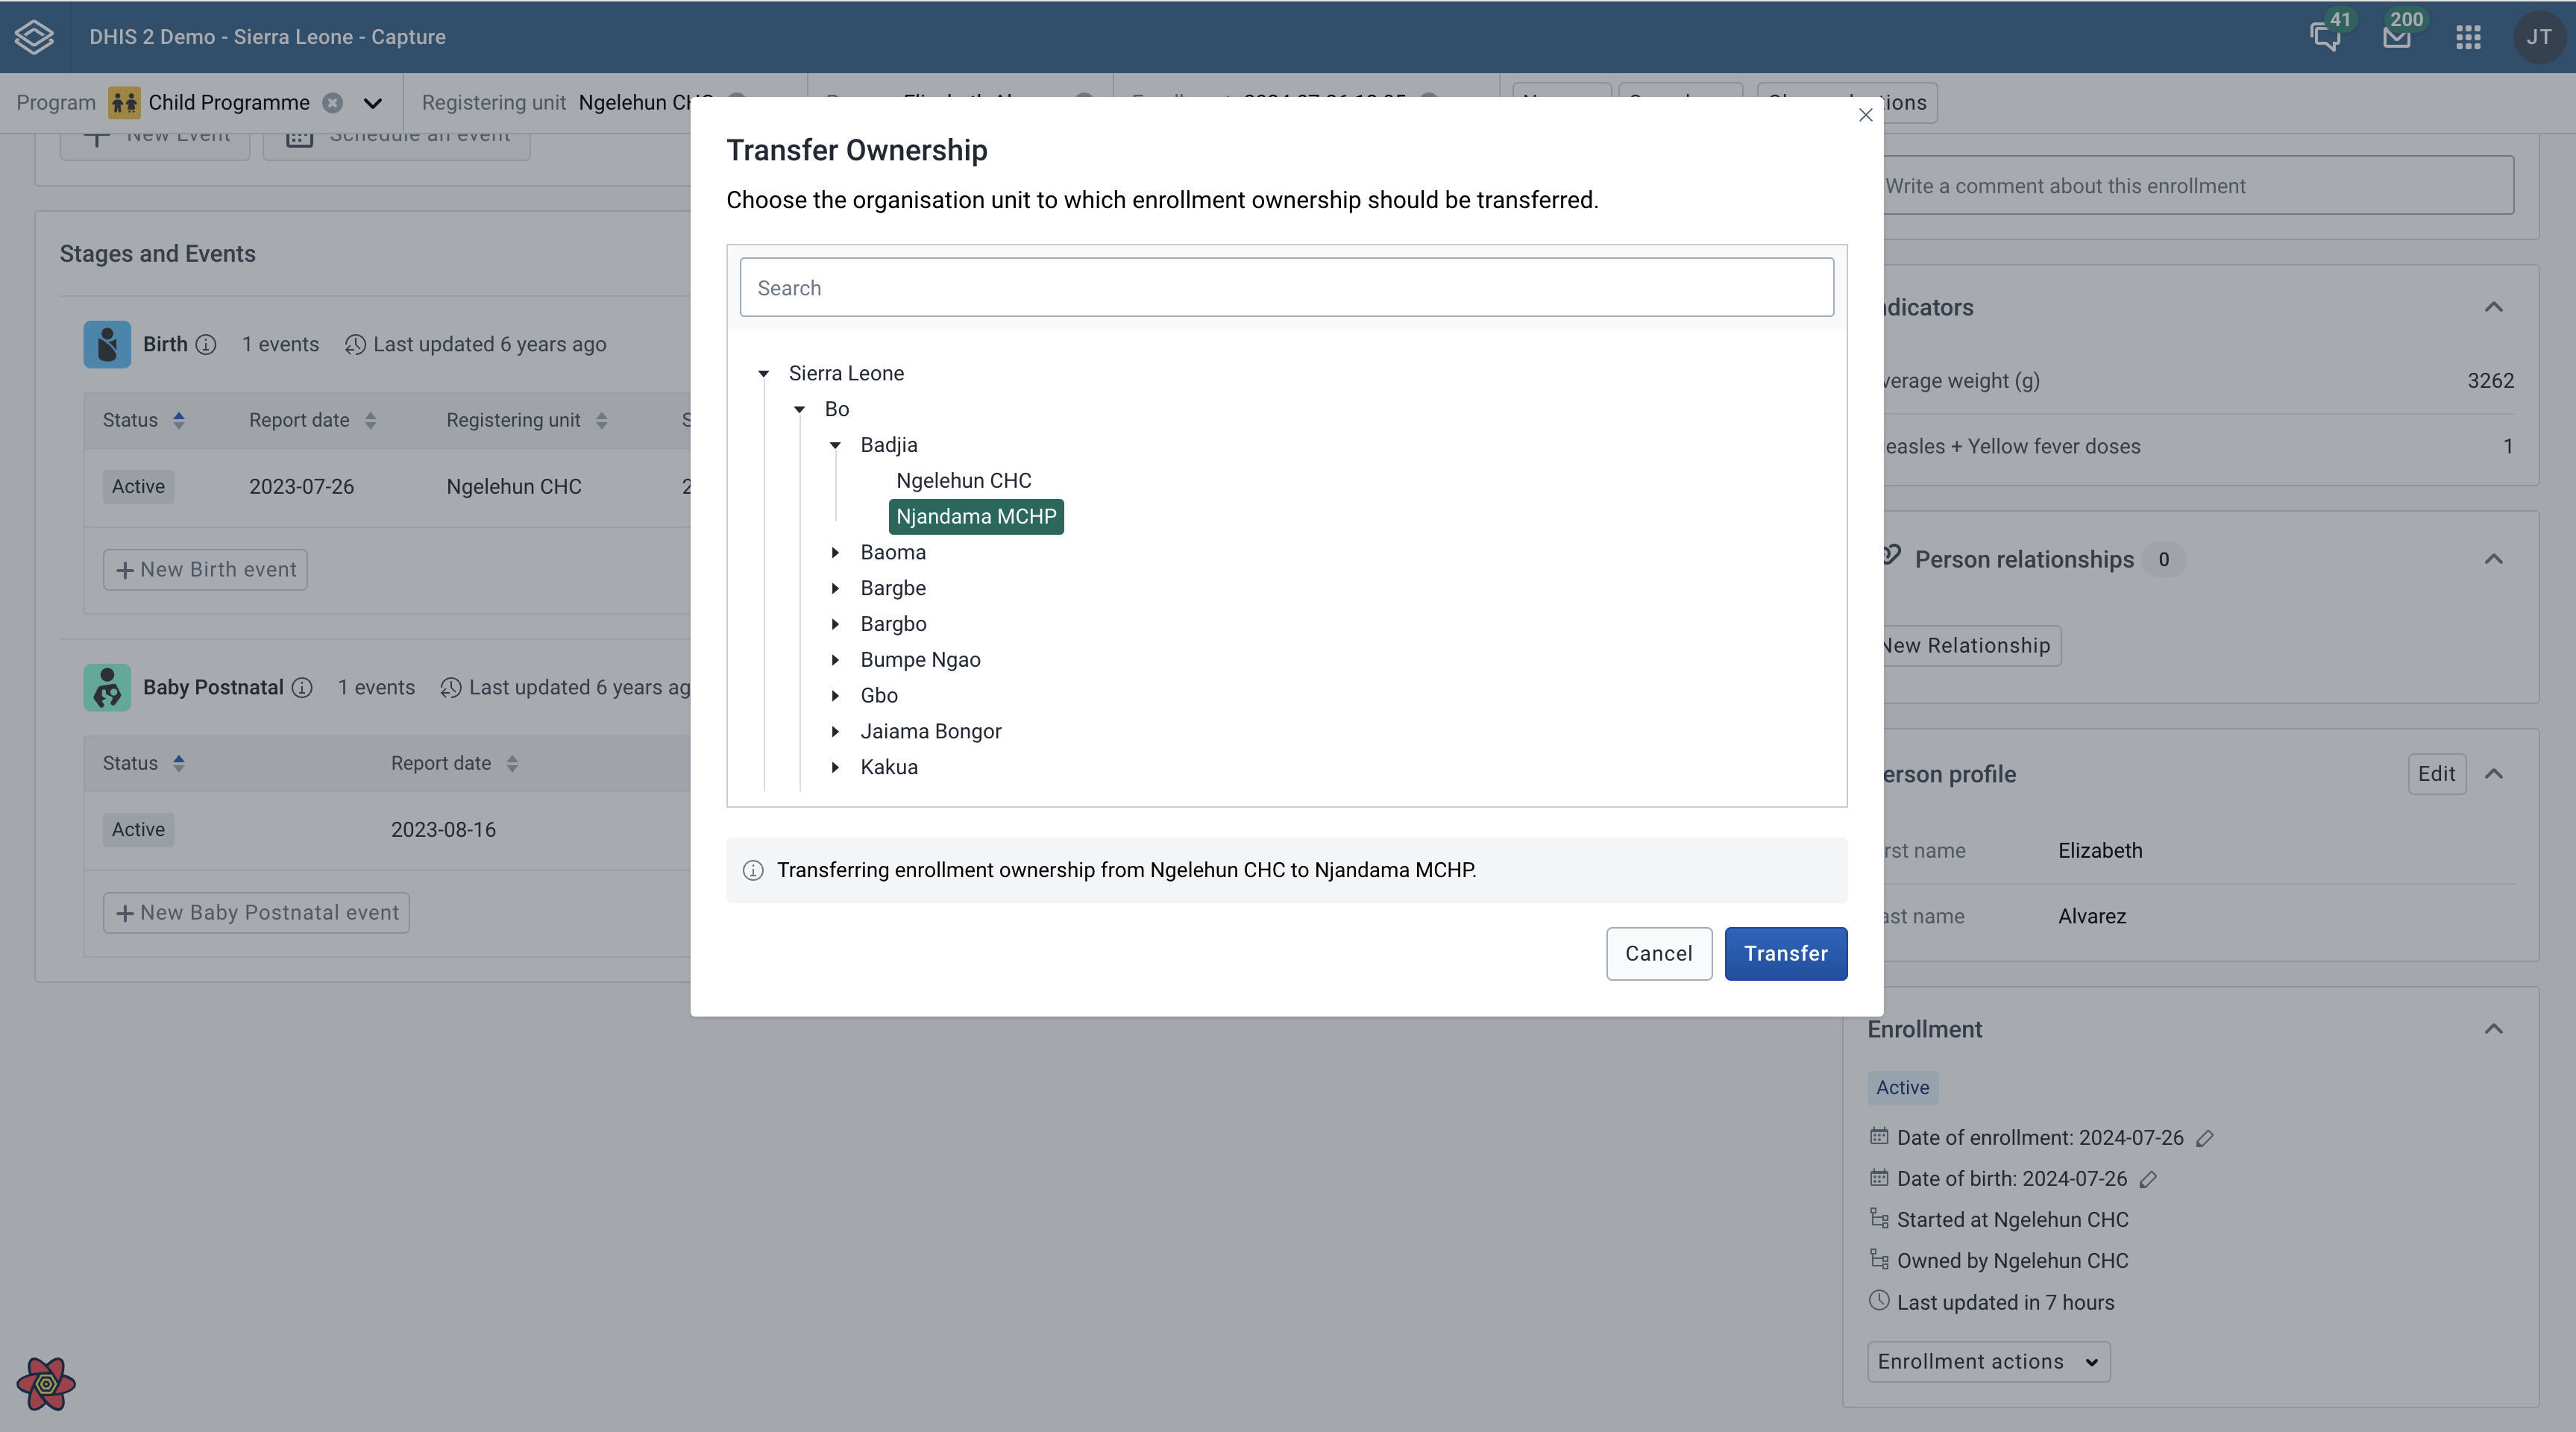
You can delete the enrollment by clicking the delete button and confirming the action in the modal.
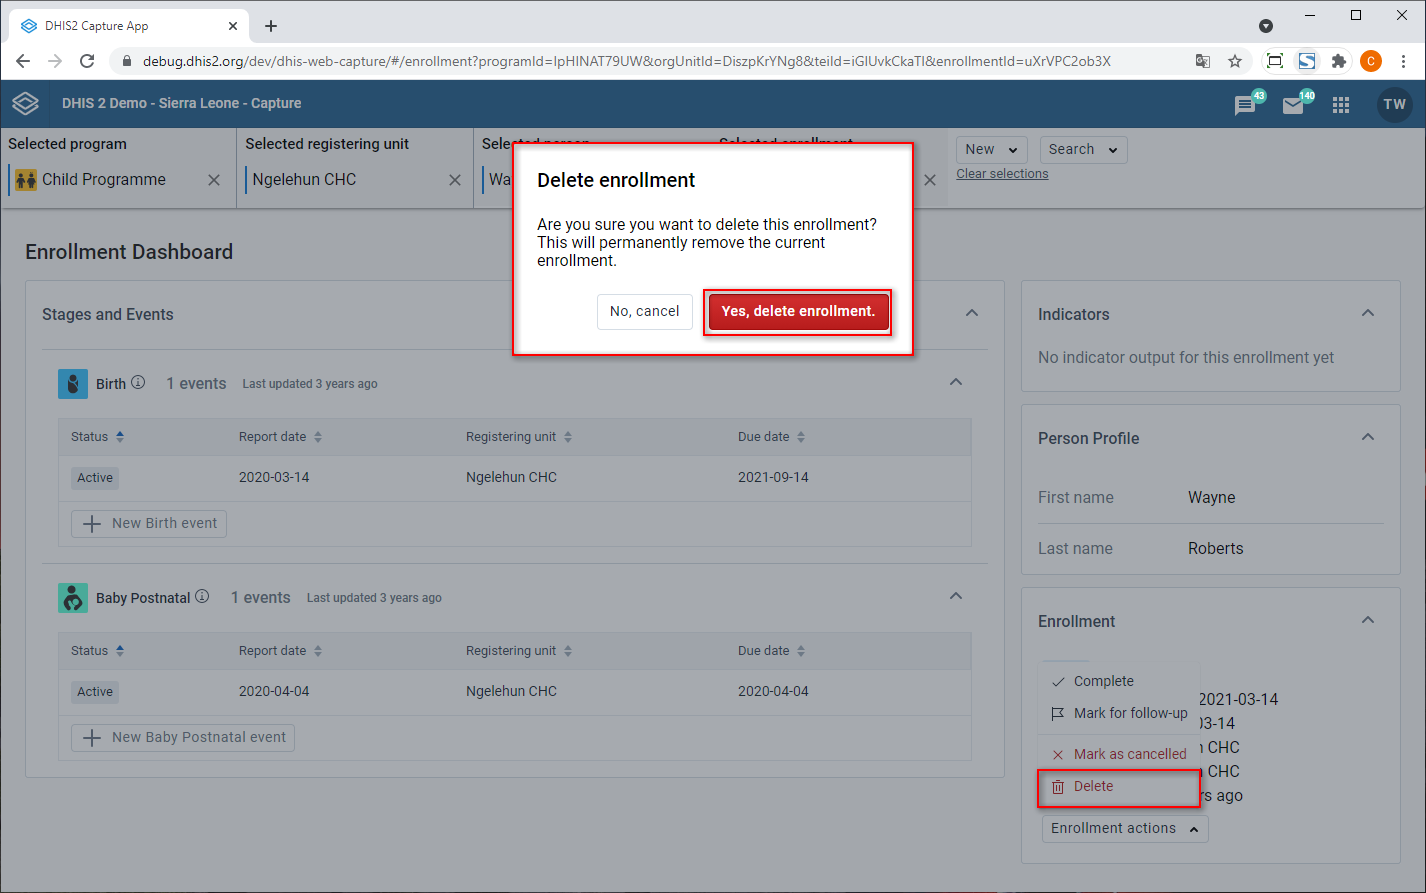
You can complete the enrollment by clicking the complete button. When there are active events, you can choose to complete the enrollment along with the events from the confirmation modal.
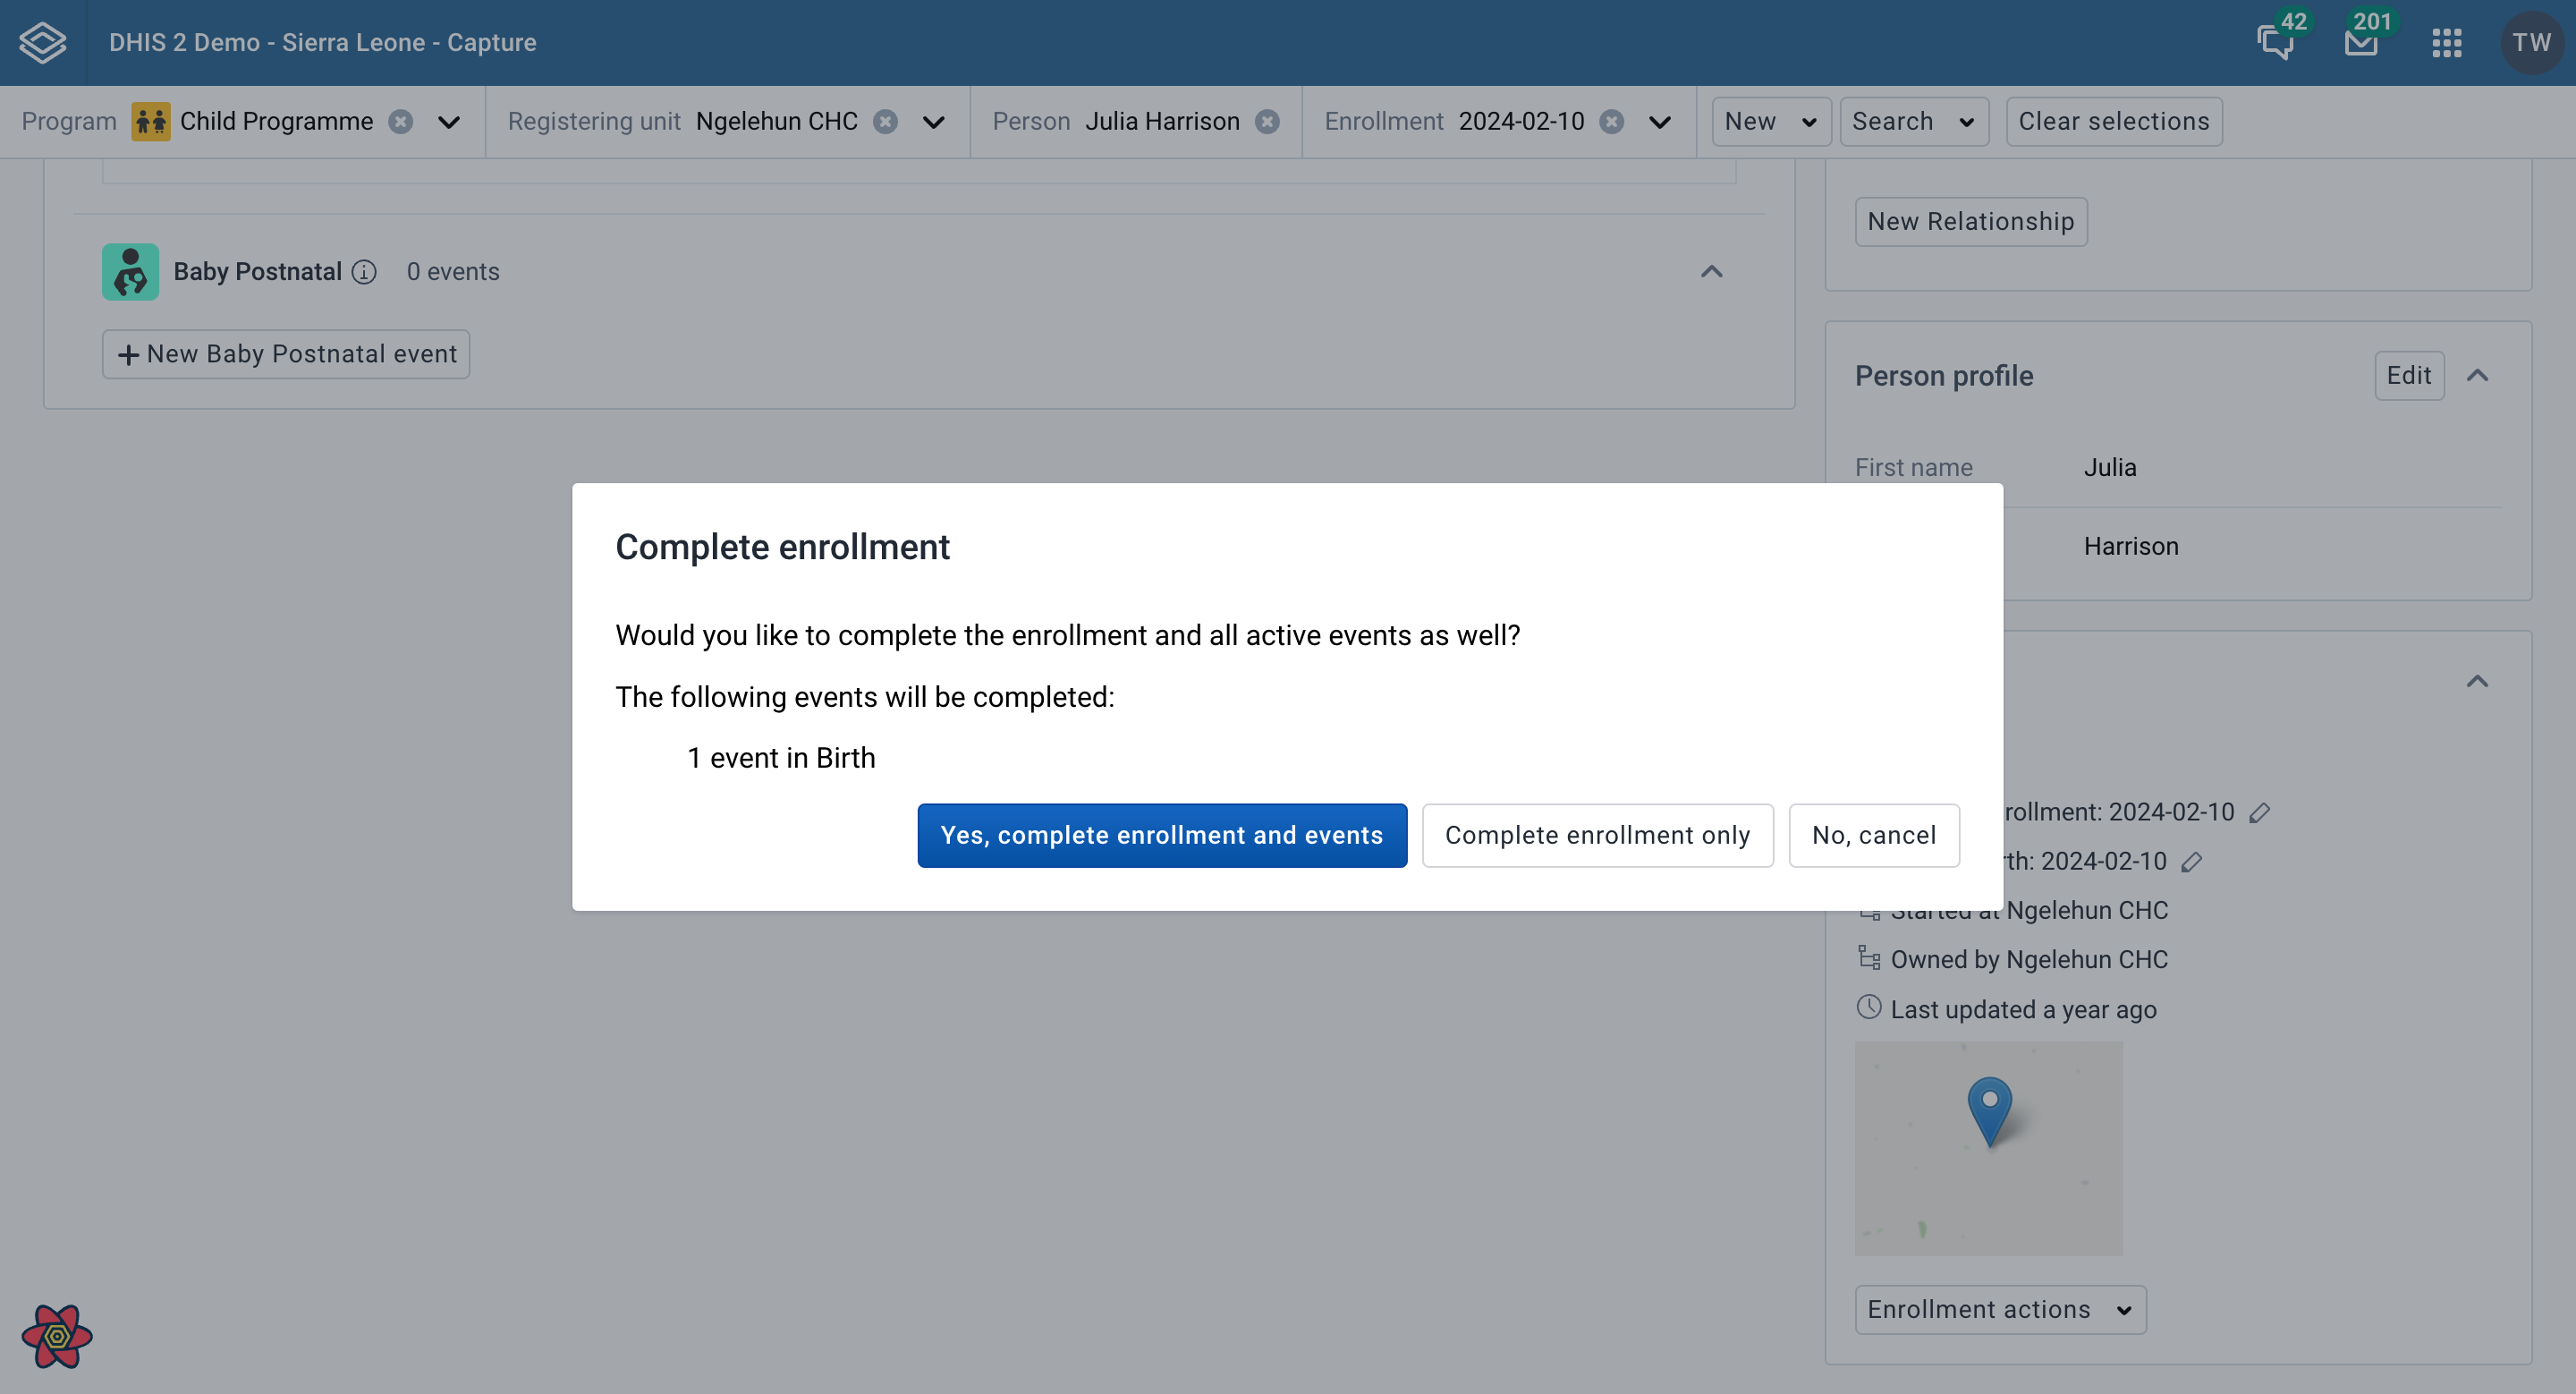
The enrollment note widget displays notes and allows addition of notes, associated with the current enrollment.
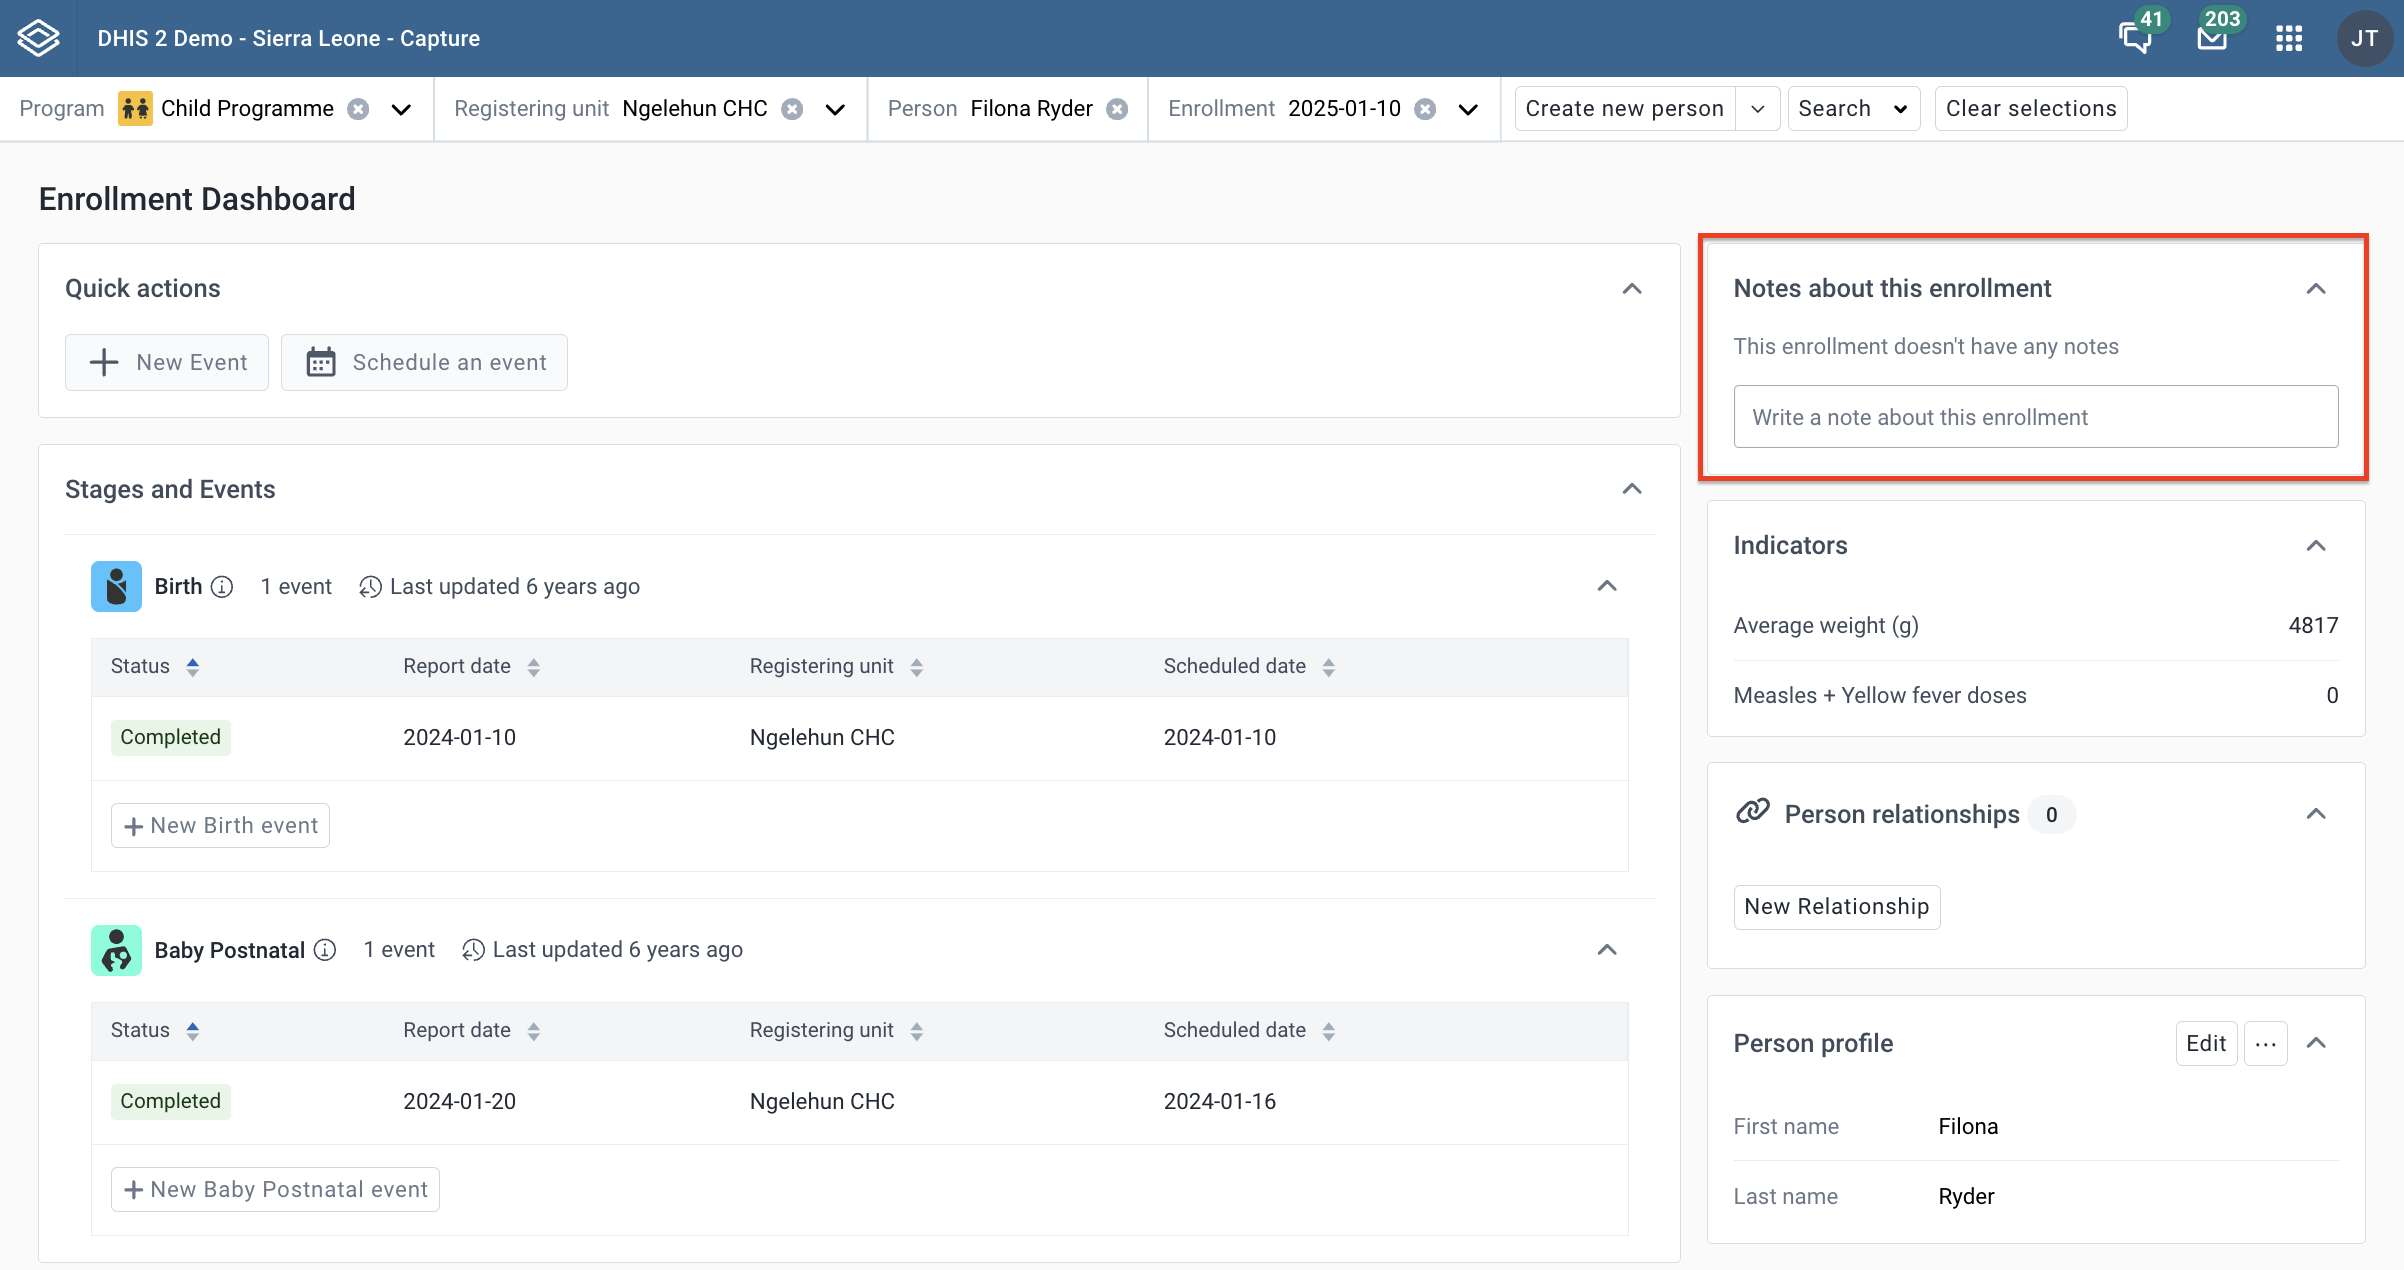
By clicking in the text field, you will be able to enter new text and see action buttons Save note and Cancel. Be aware that Enrollment notes are attributed to a user and cannot be deleted.
The Relationships widget on the enrollment dashboard is used for viewing the record’s linked relationships to other records. The number next to the title signifies the total number of relationships
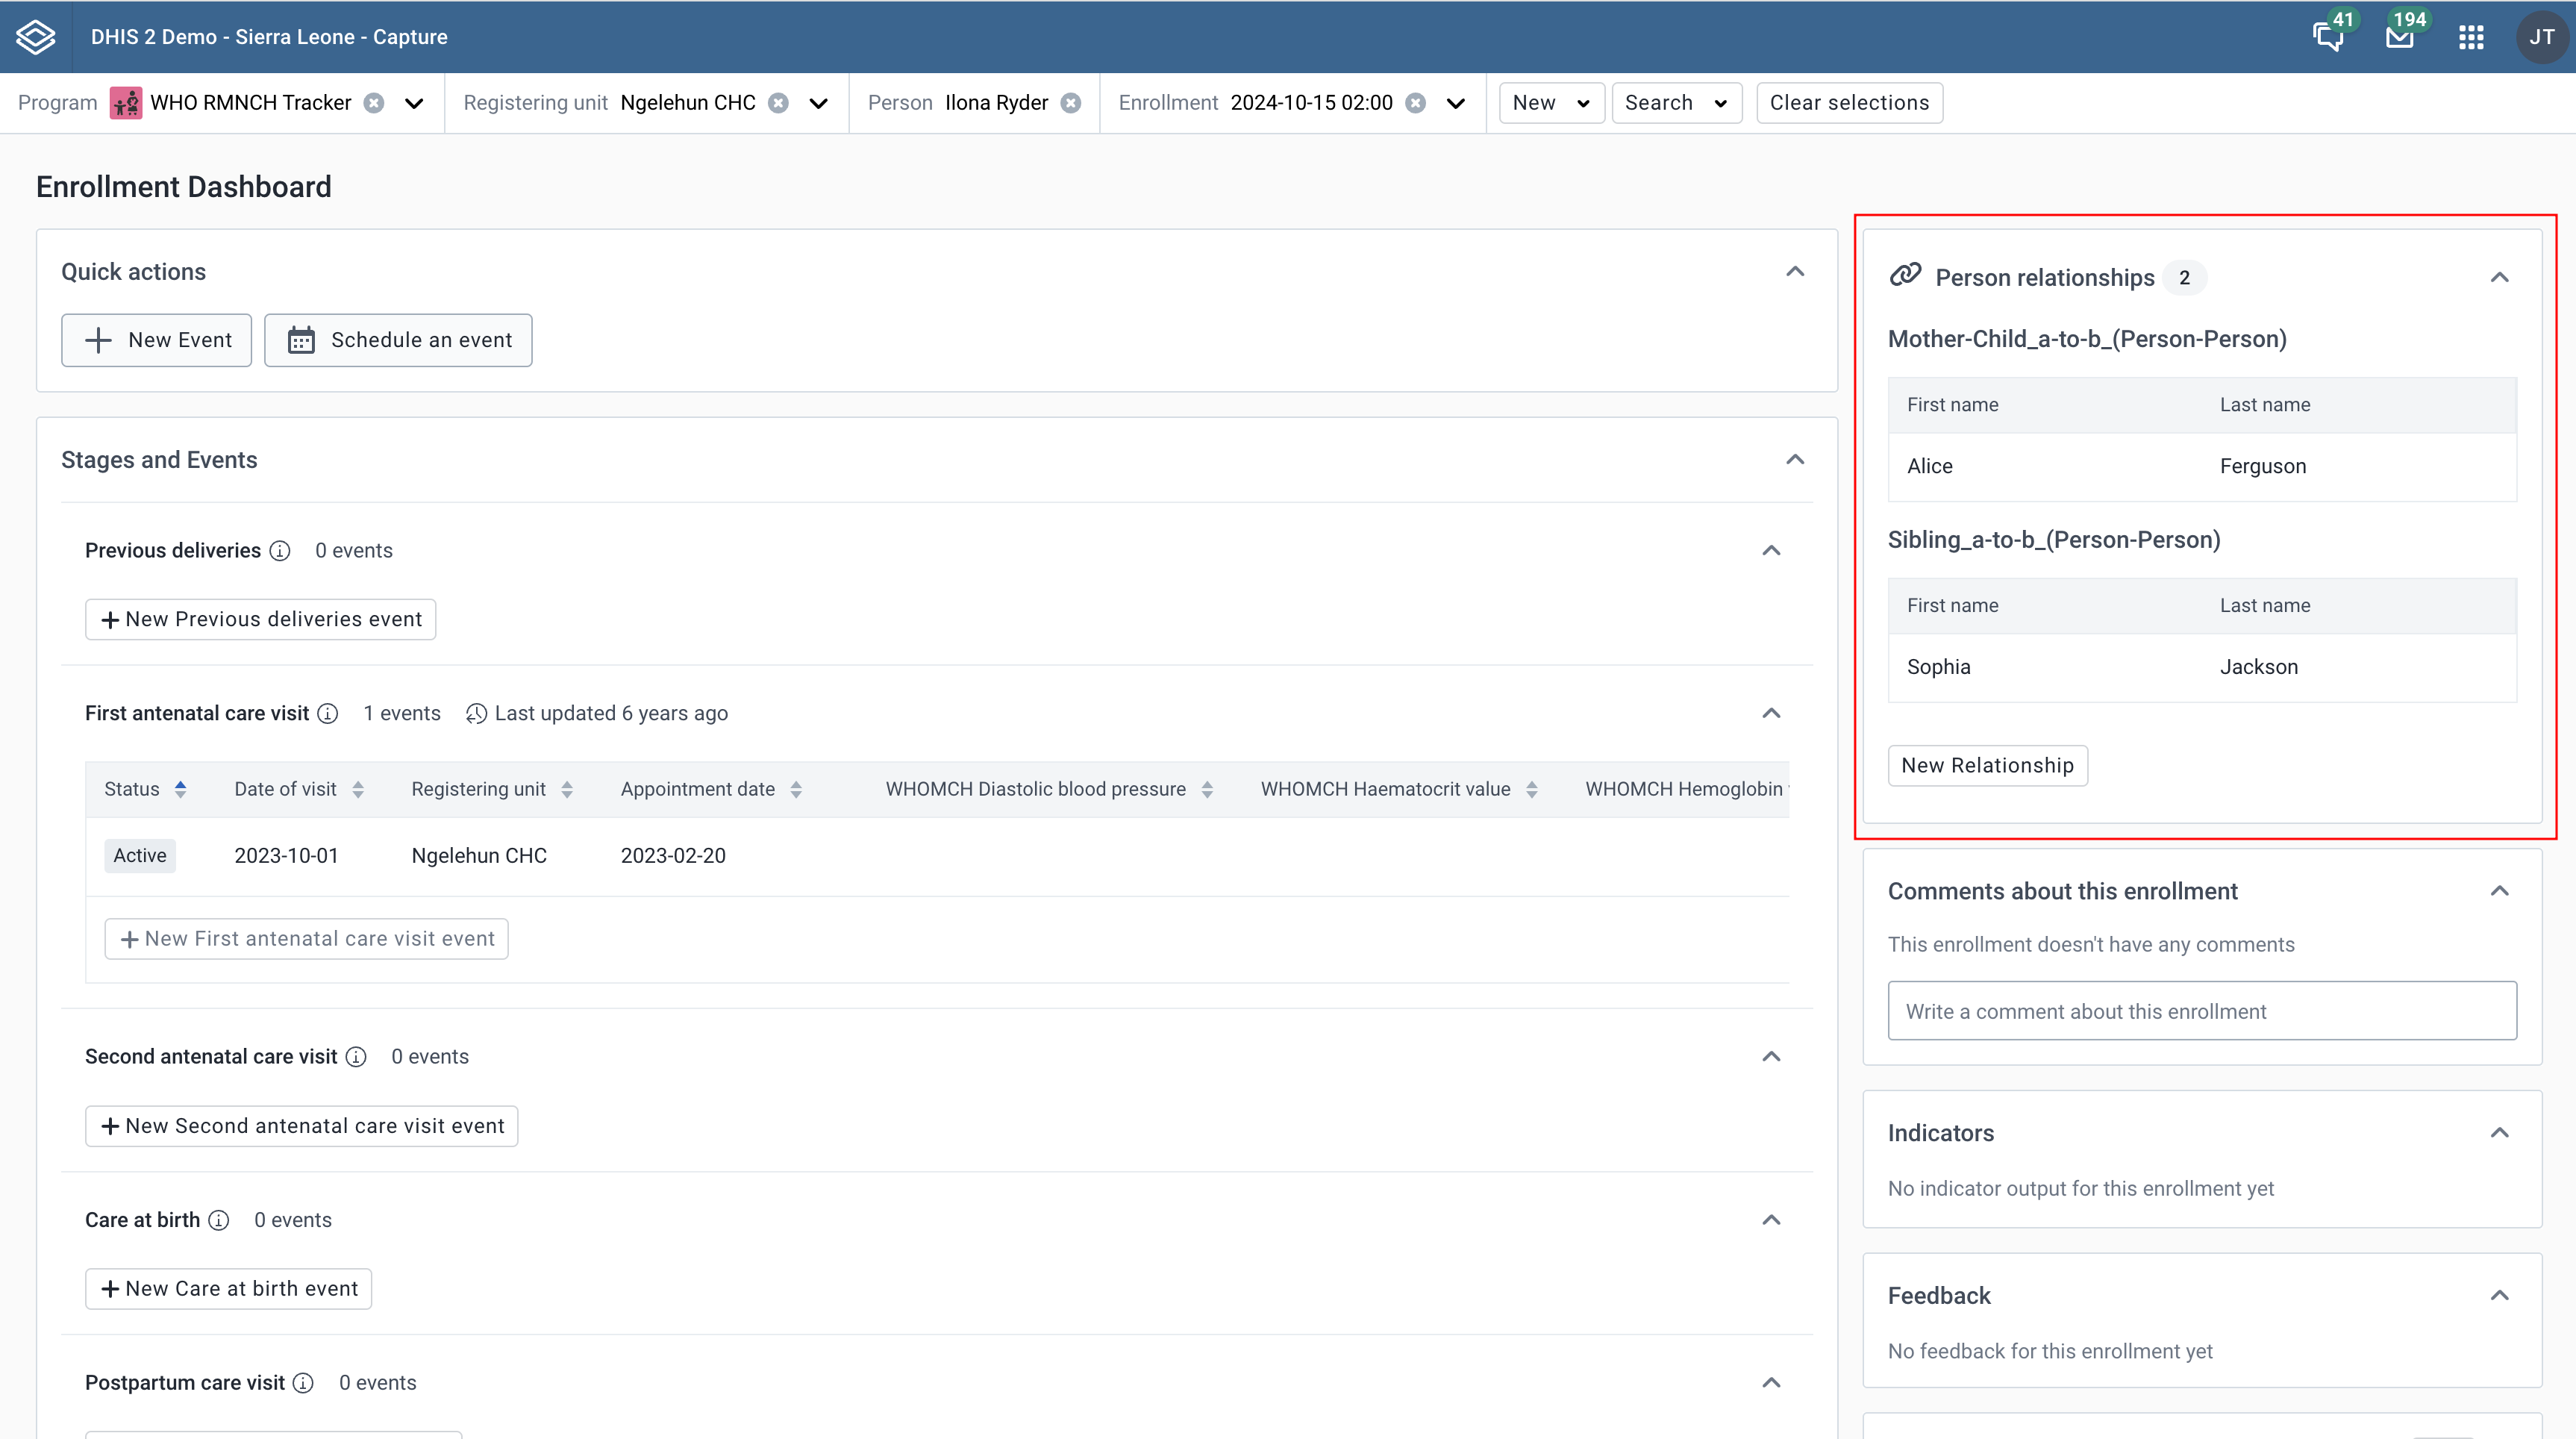
For tracked entity instance relationships, the key attributes shown in the widget are the attributes that have been selected to be displayed on the relationship type page in Maintenance.
If no attributes are selected, it will just show a row per record with tracked entity type name and relationship creation date.
When clicking a tracked entity instance you should be taken to the Enrollment Dashboard. If the relationship type includes a program, you should be taken to the latest enrollment for that program. If no program is specified, you should still be sent to the enrollment dashboard, but without a program.
Click the Add new button to add a new relationship. Adding a new relationship opens a dialog where you can select the applicable relationship type.
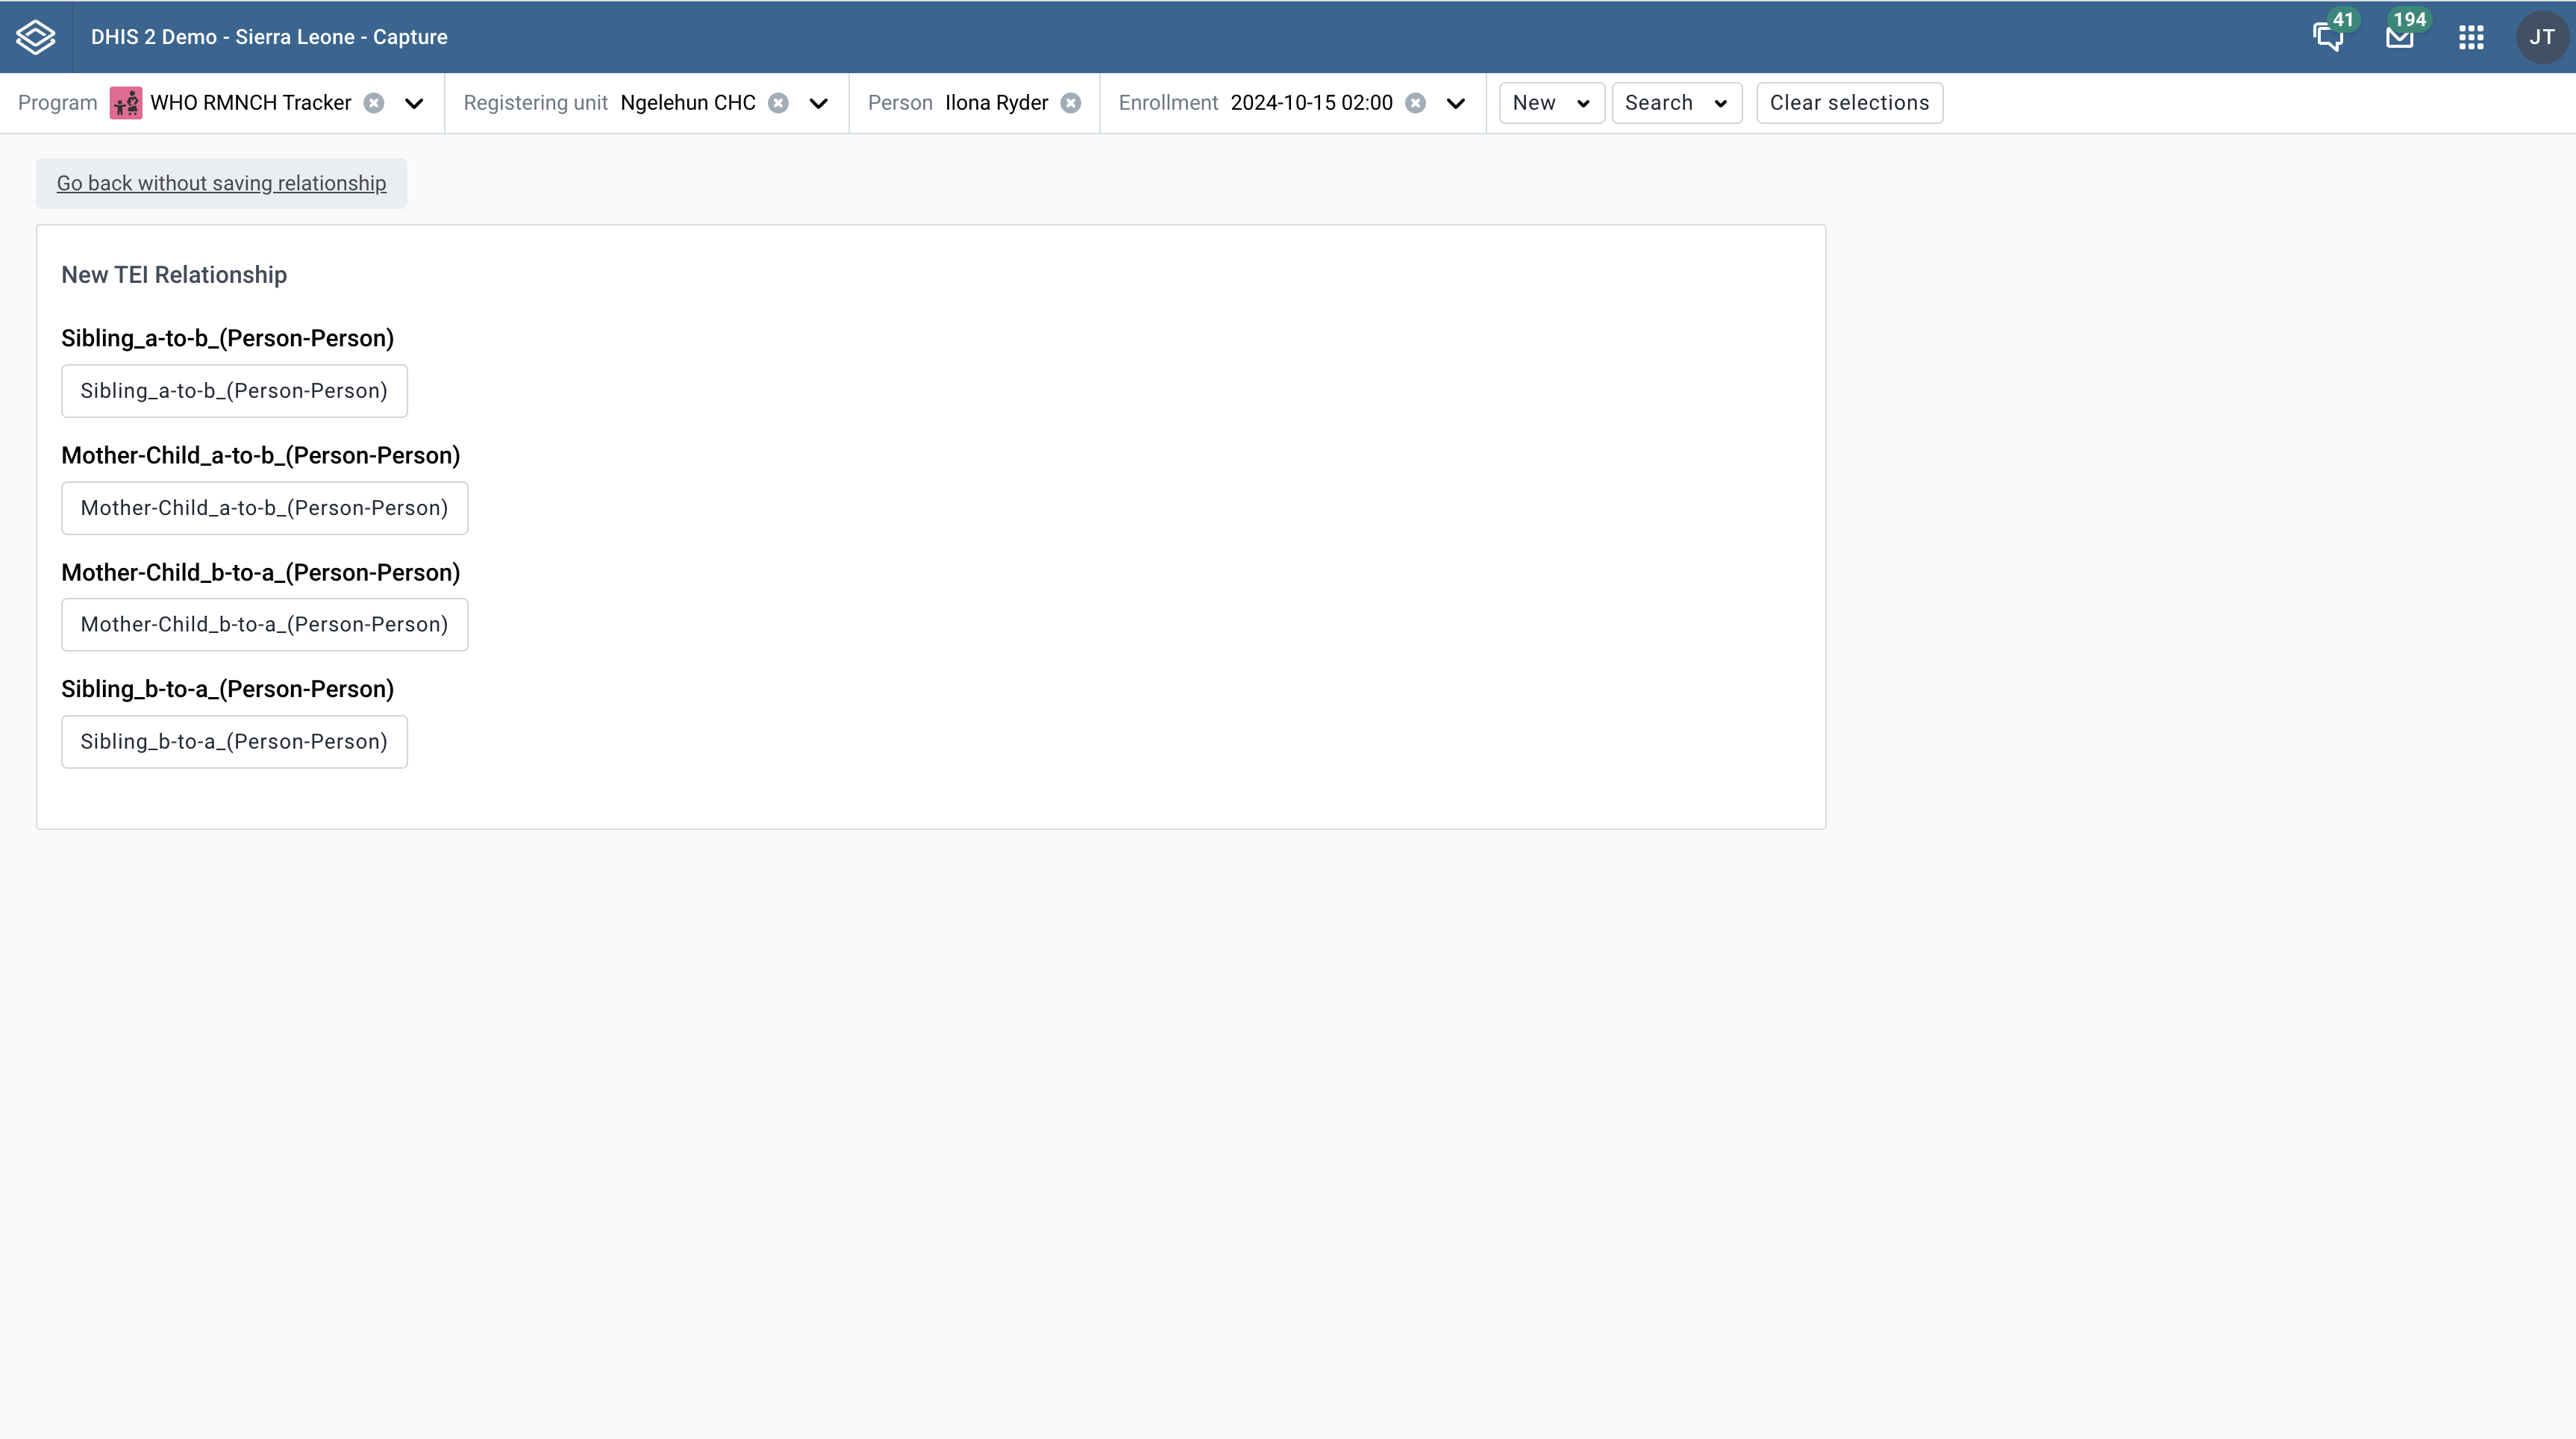
Choose between linking to an existing tracked entity instance or creating a new one.
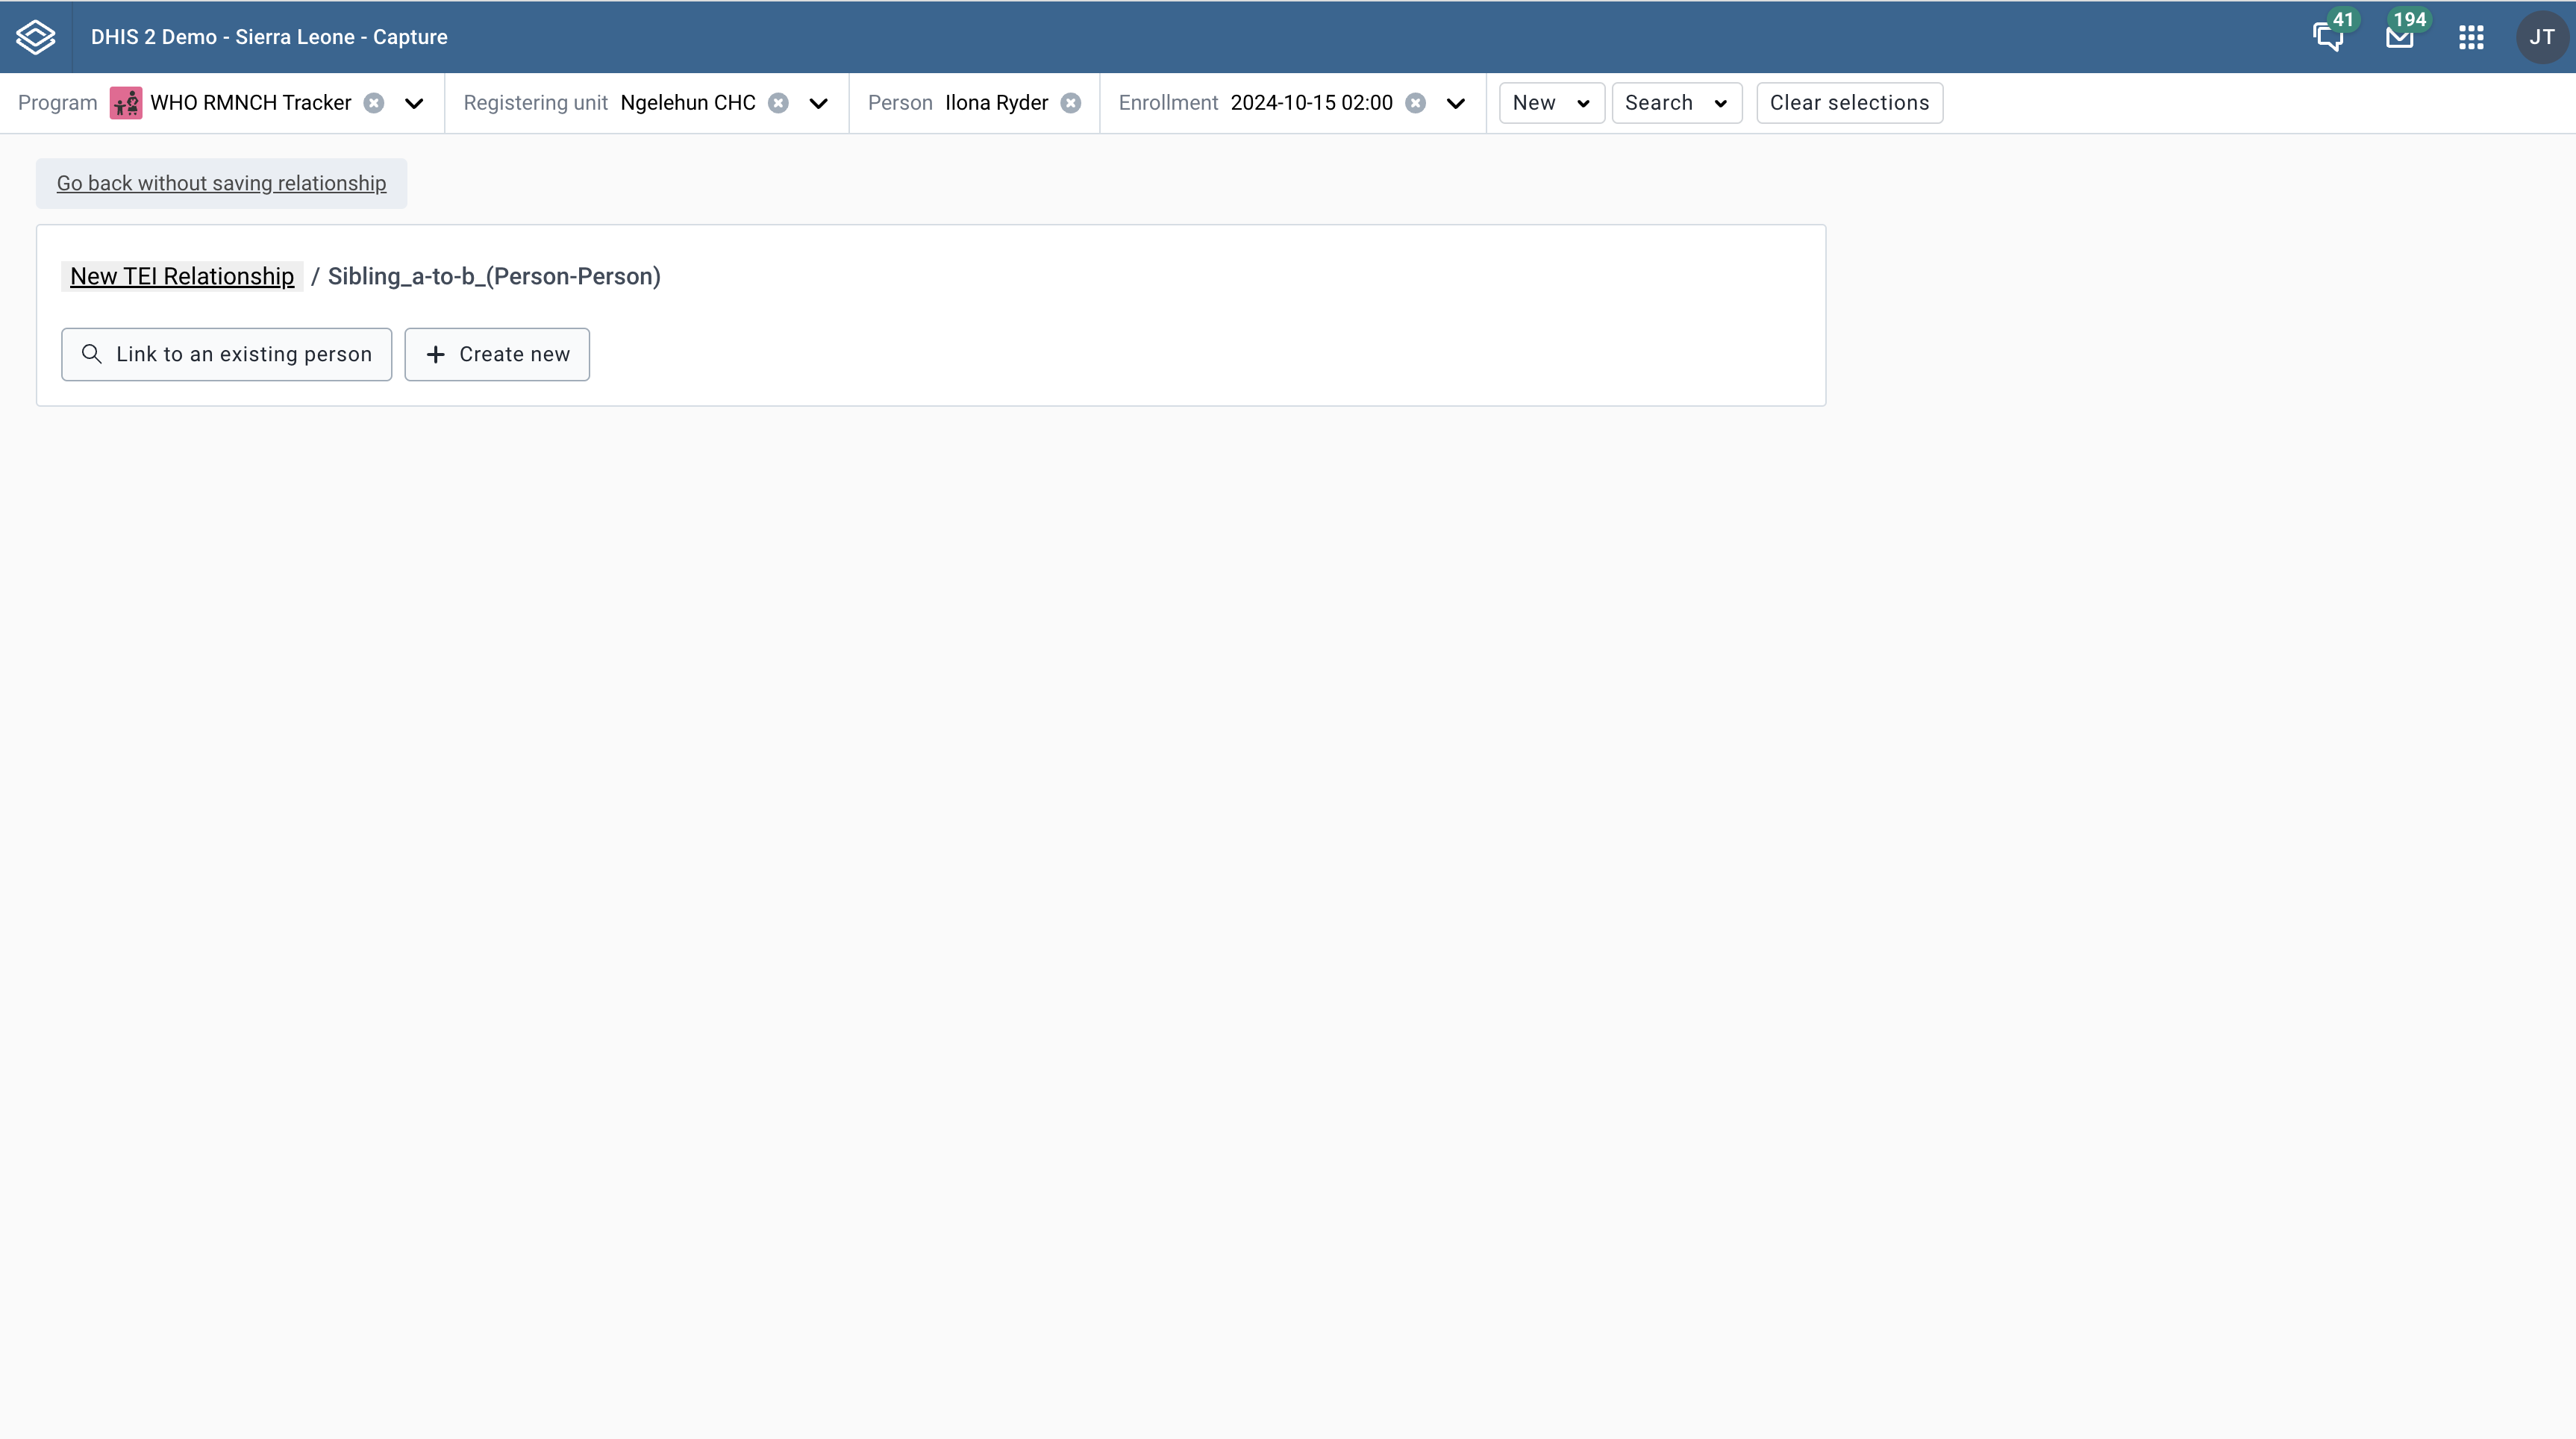
Use the search form to find any existing record to link to.
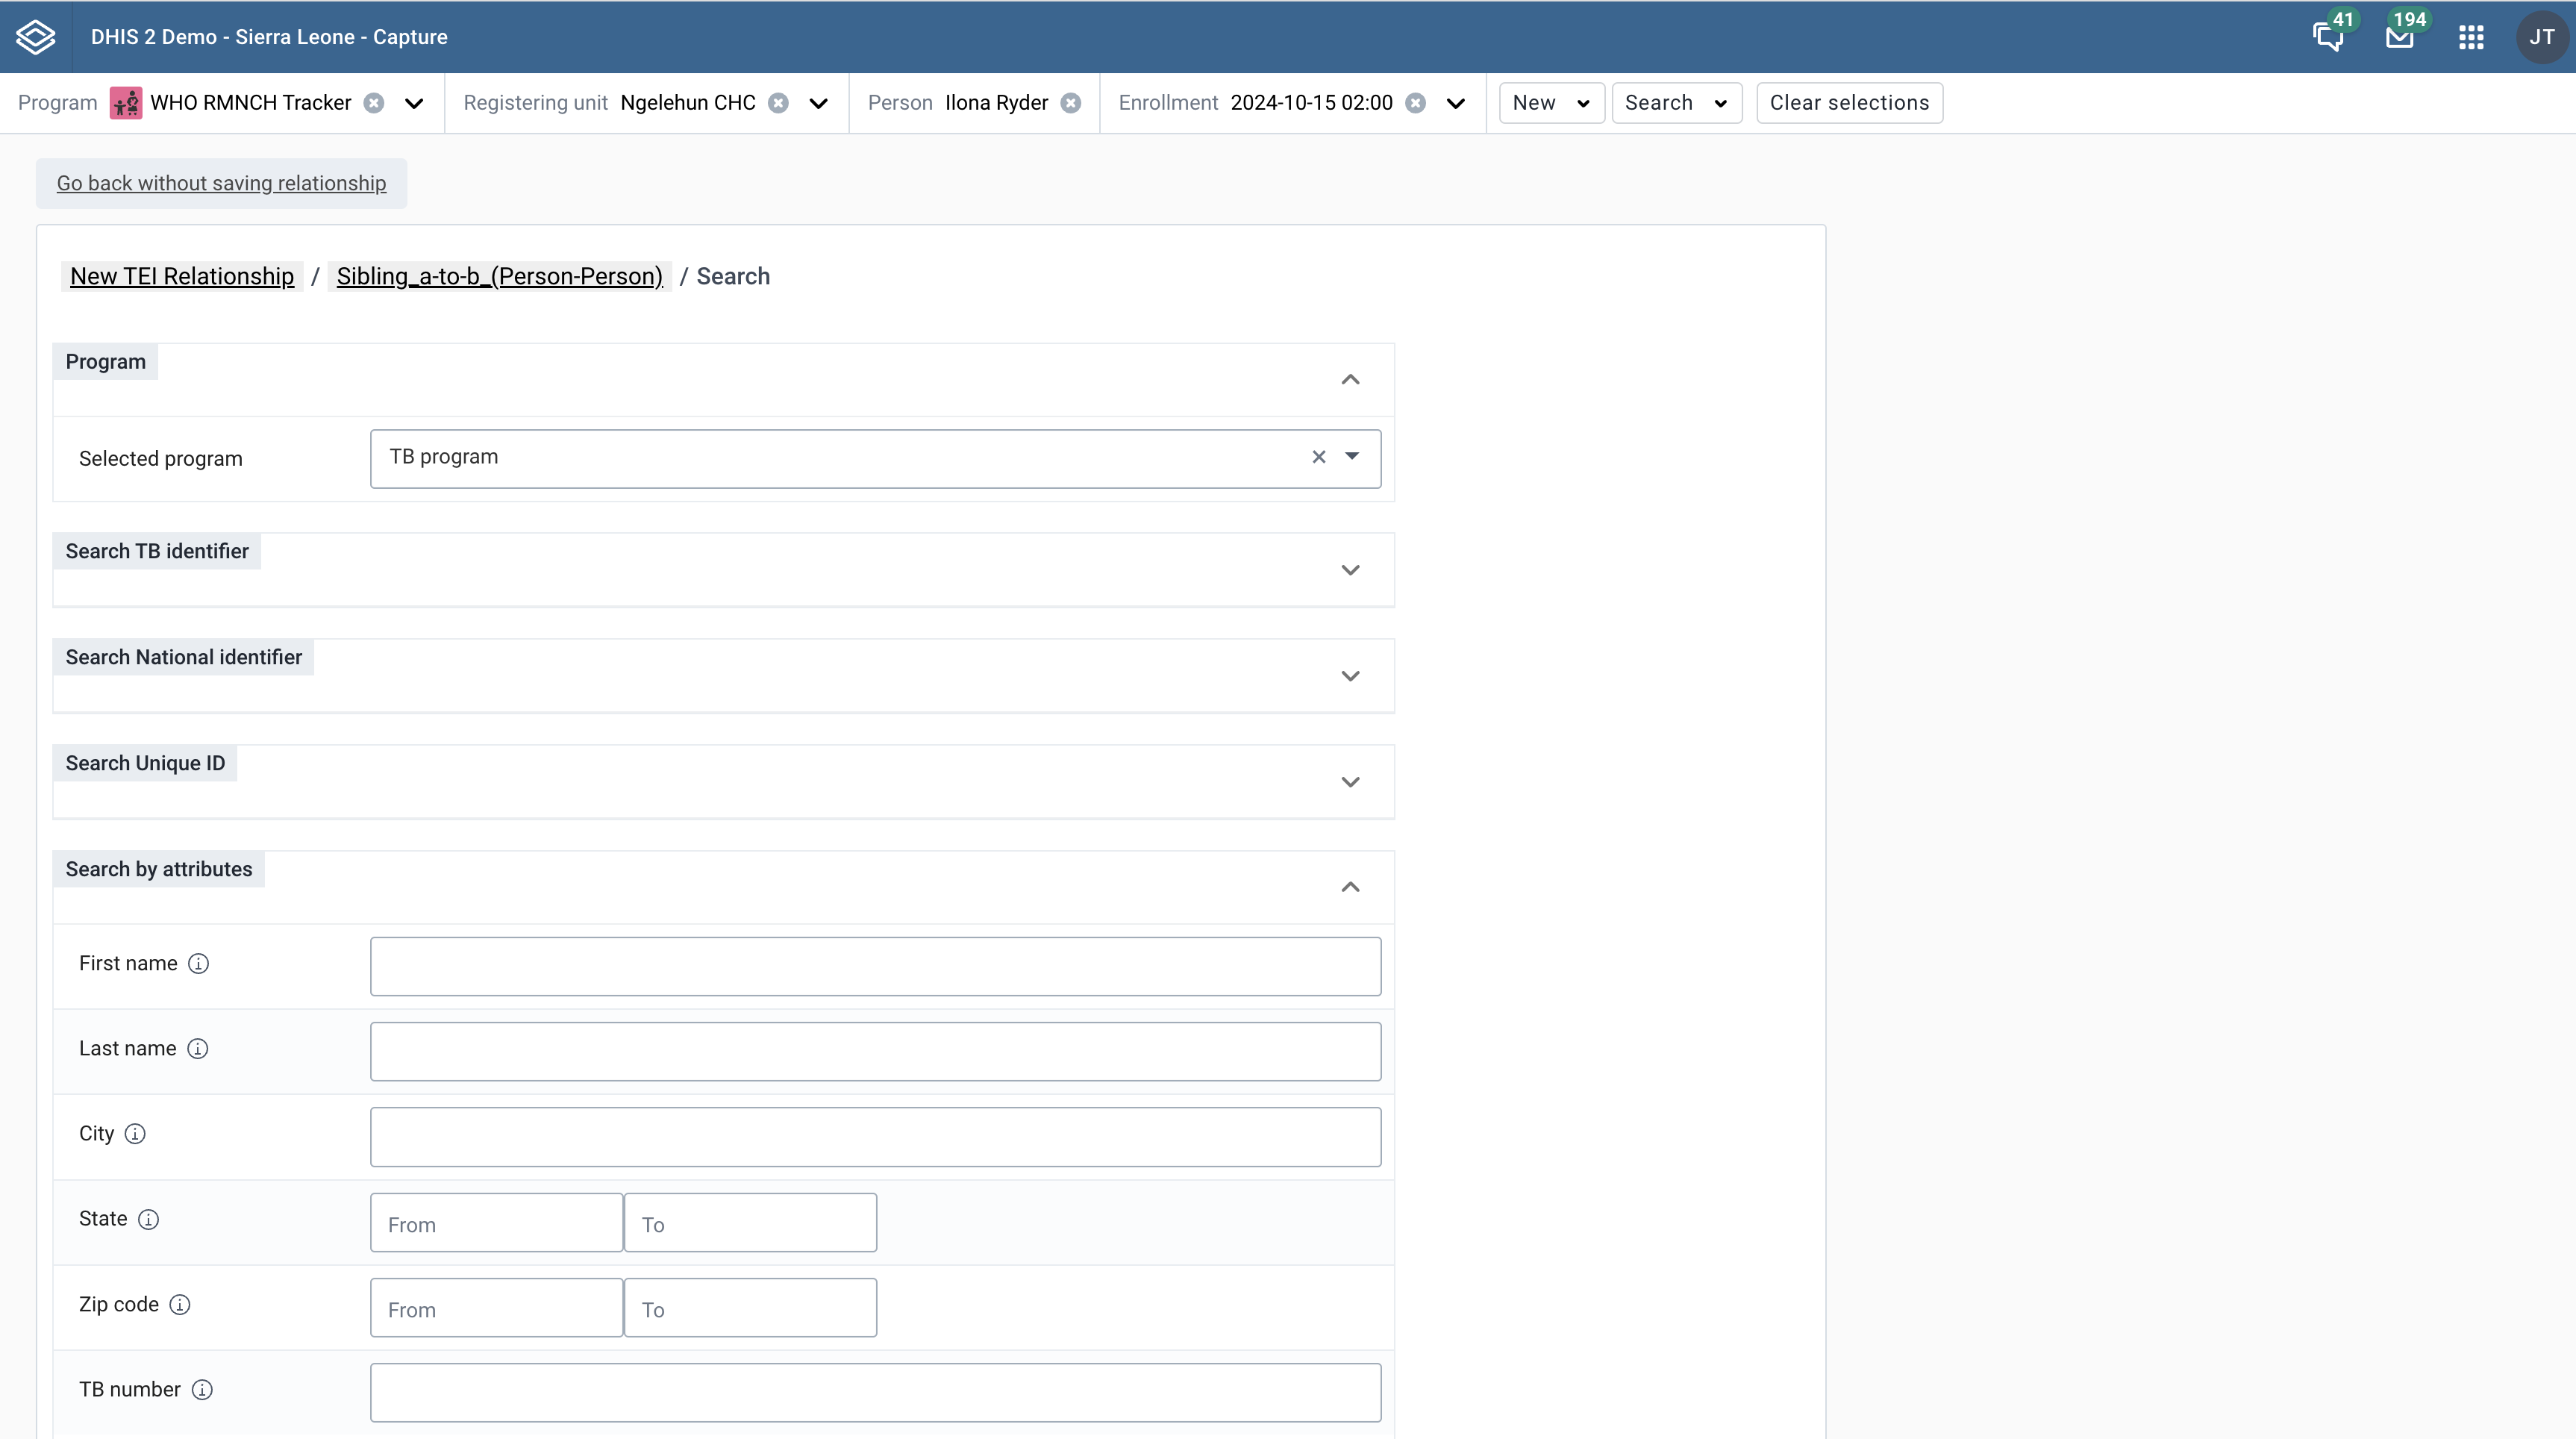
Use the form to create a new record and link.
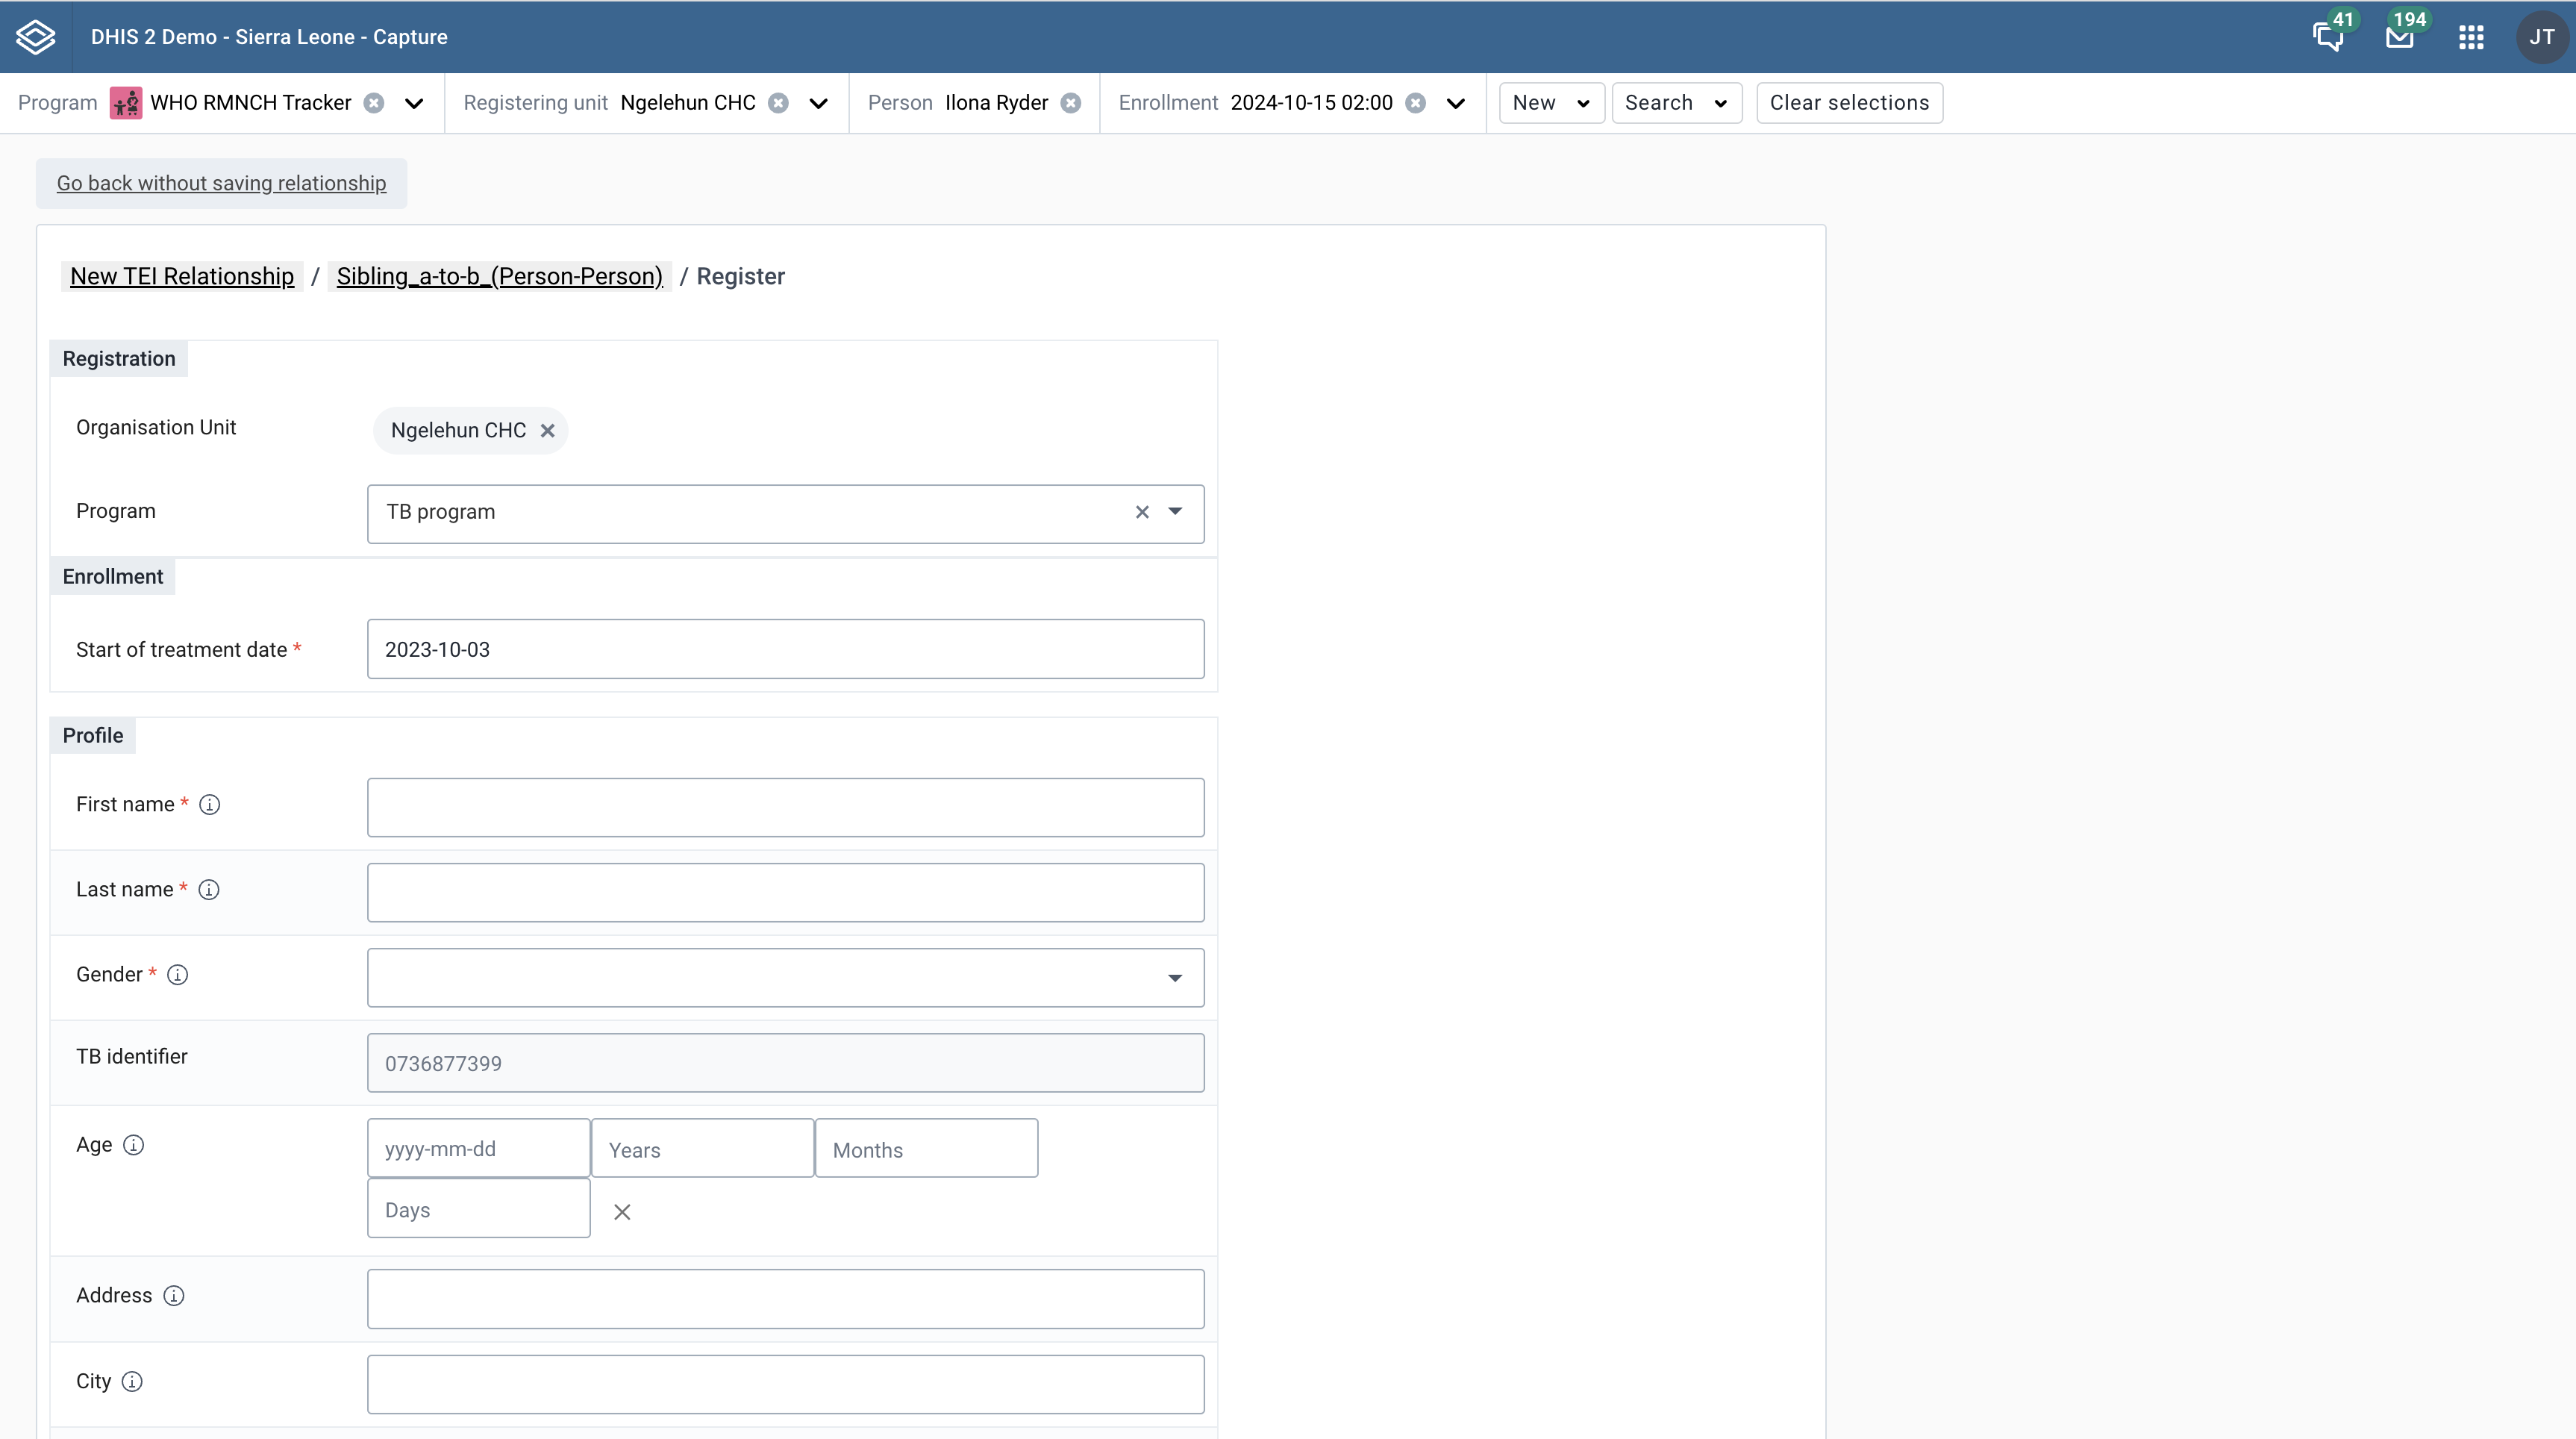
On the enrollment dashboard, you can view the tracked entity instance profile widget. Inside the profile widget you can view the key attributes values.
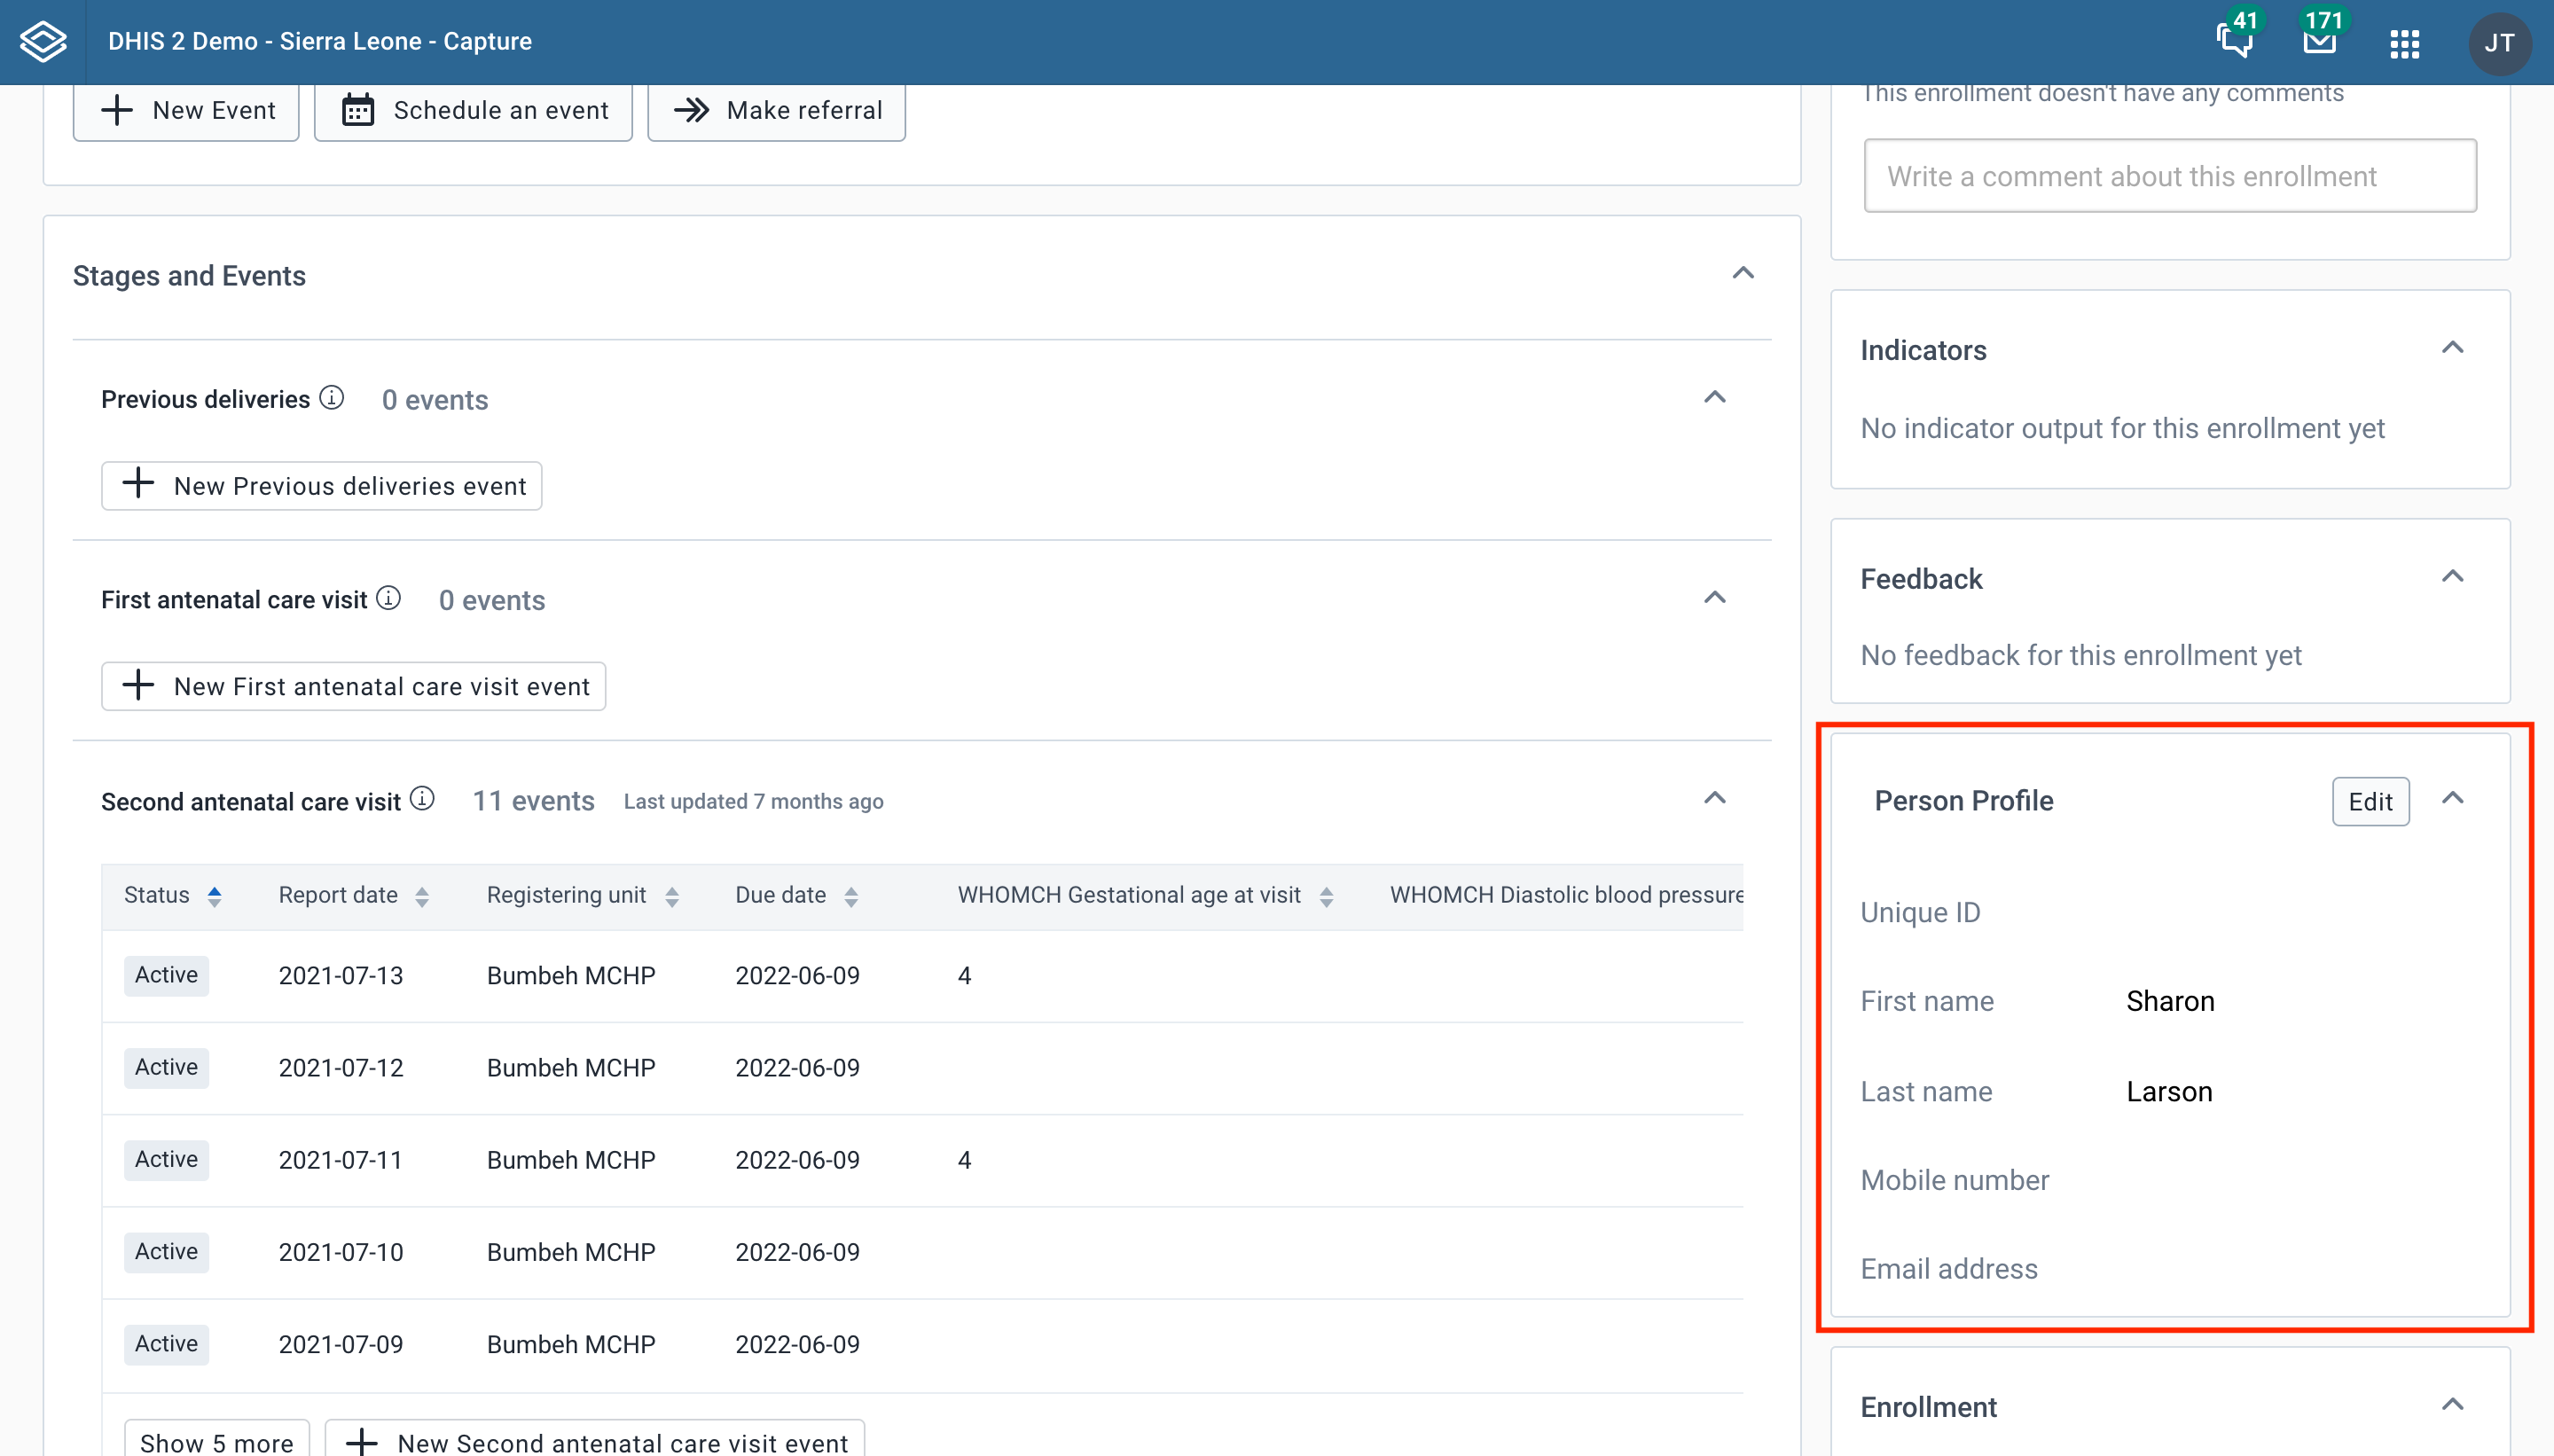
Click the Edit button to make changes to the tracked entity instance profile. Editing the profile opens a dialog where the profile attributes can be changed.
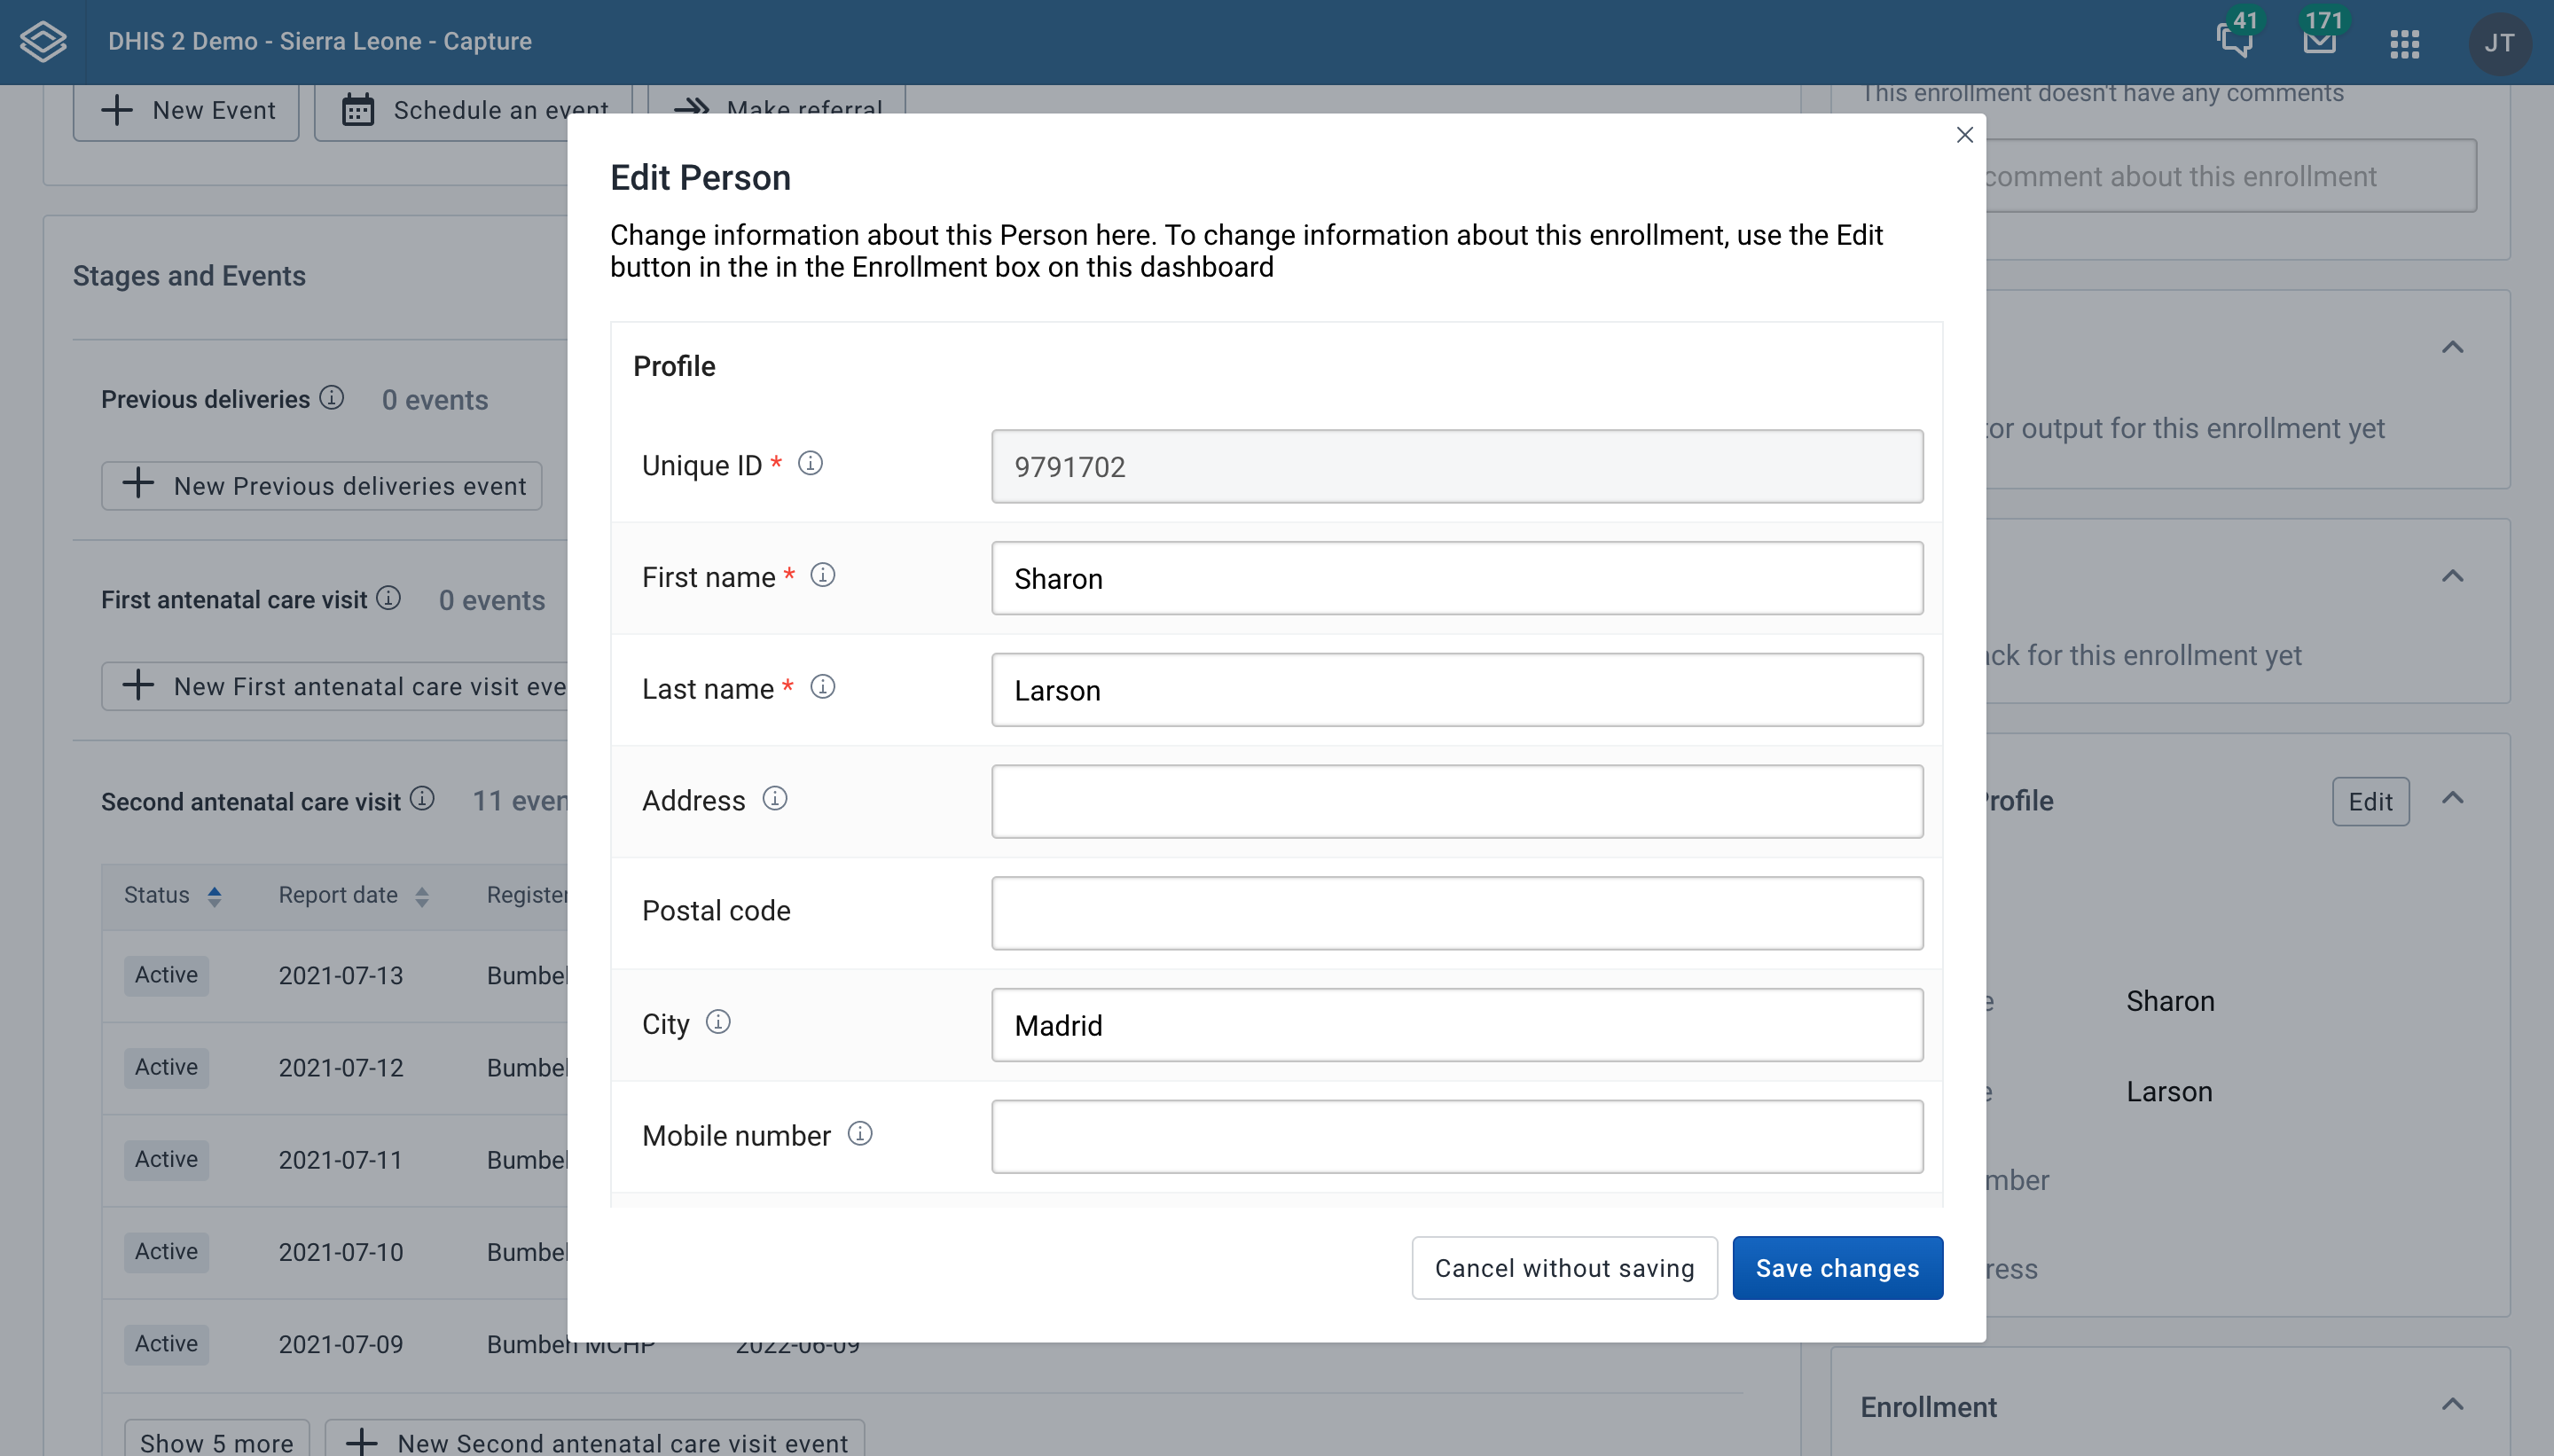
Click the Delete ${tracked entity type} button to delete the tracked entity. You can confirm the action from the dialog. Once confirmed, tracked entity and all its associated enrollment and events across all programs will be deleted. To delete a tracked entity that has any enrollments, the user needs the authority Delete tracked entity instance and associated enrollments and events.
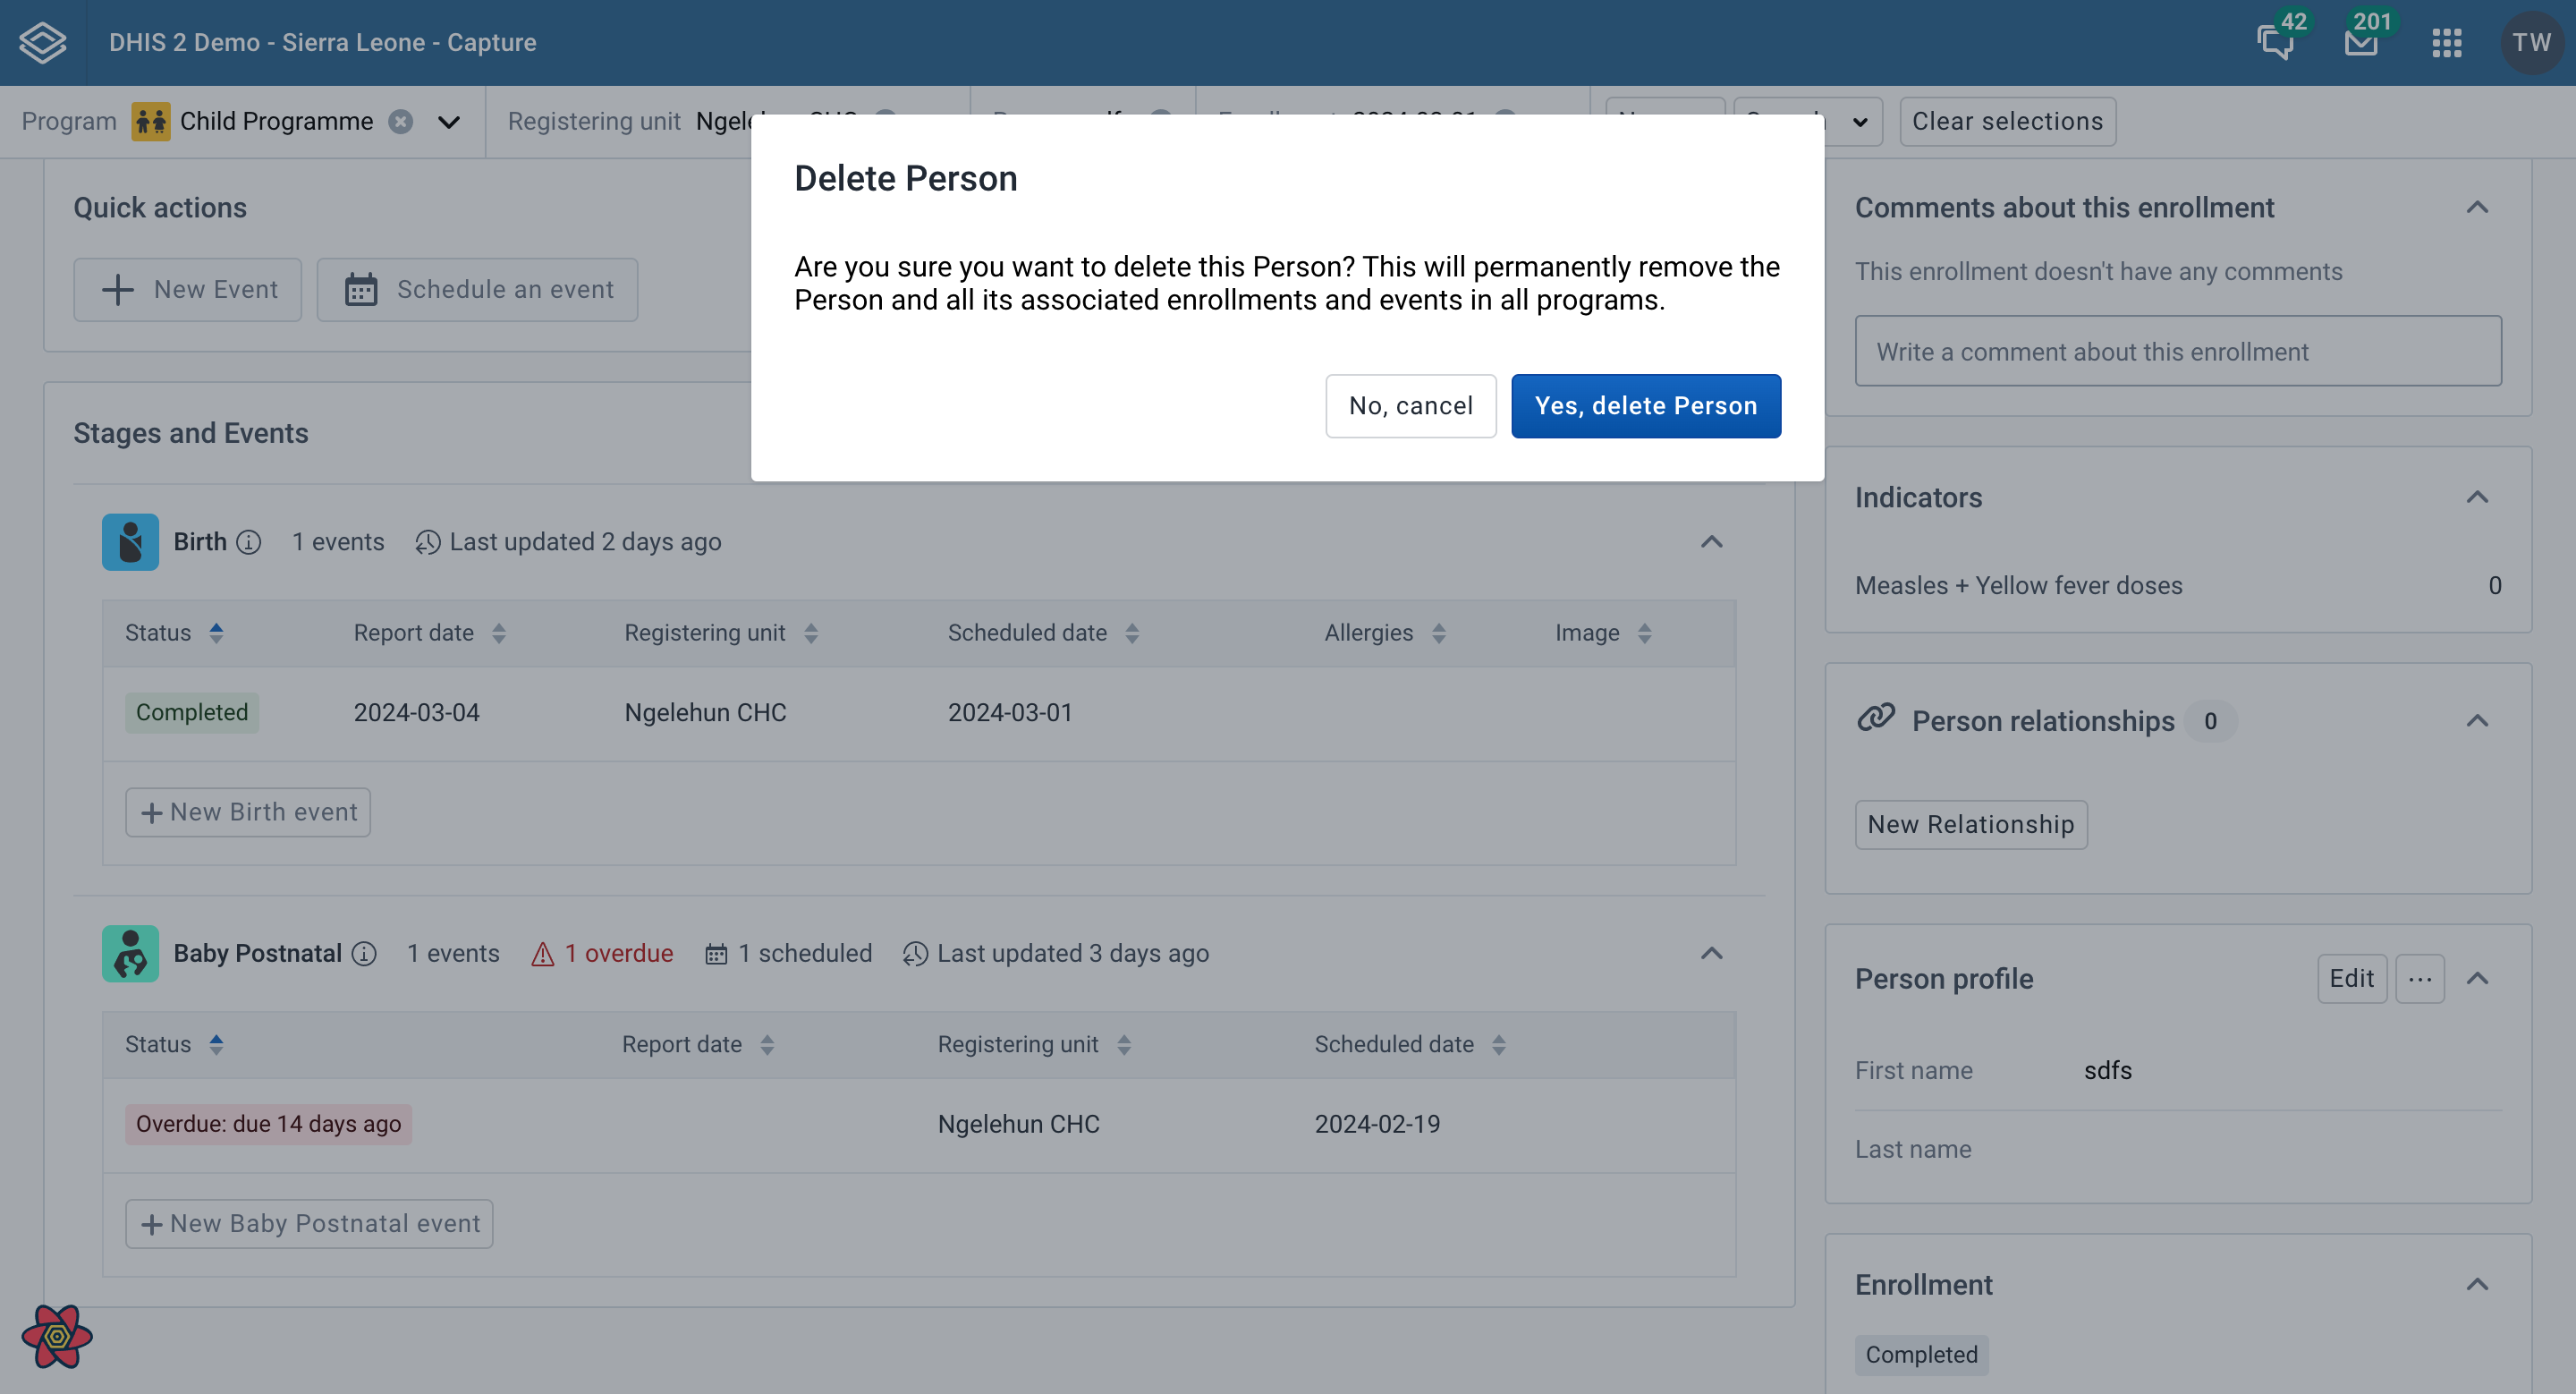
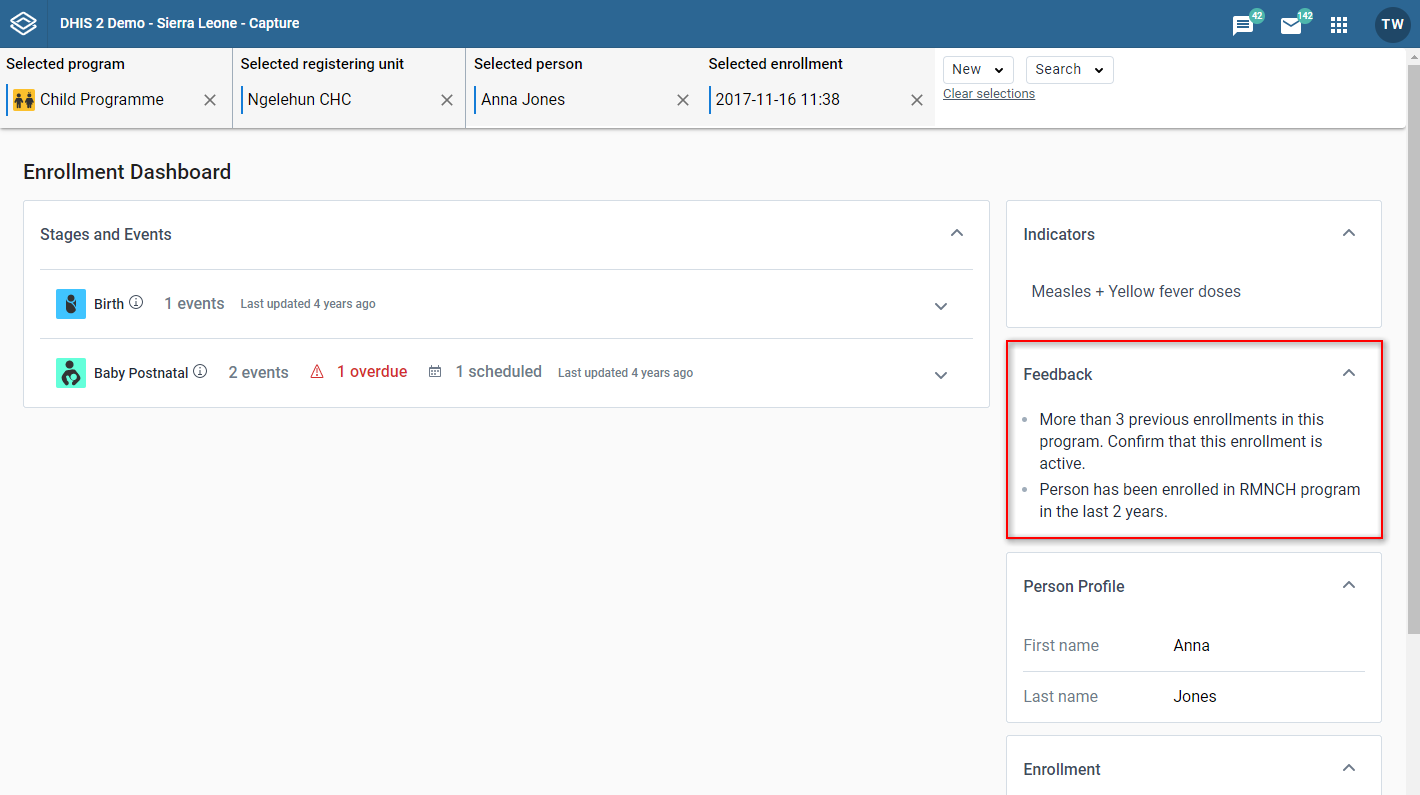
On the enrollment dashboard, the feedback widget displays text and values that are triggered by certain conditions. If the current dashboard triggers some rules set up in the program, the text or values will be automatically displayed.
If there isn't any feedback for the current dashboard, the widget shows a short empty message. If there aren't any program rules that could show feedback for the current dashboard then the widget is hidden.
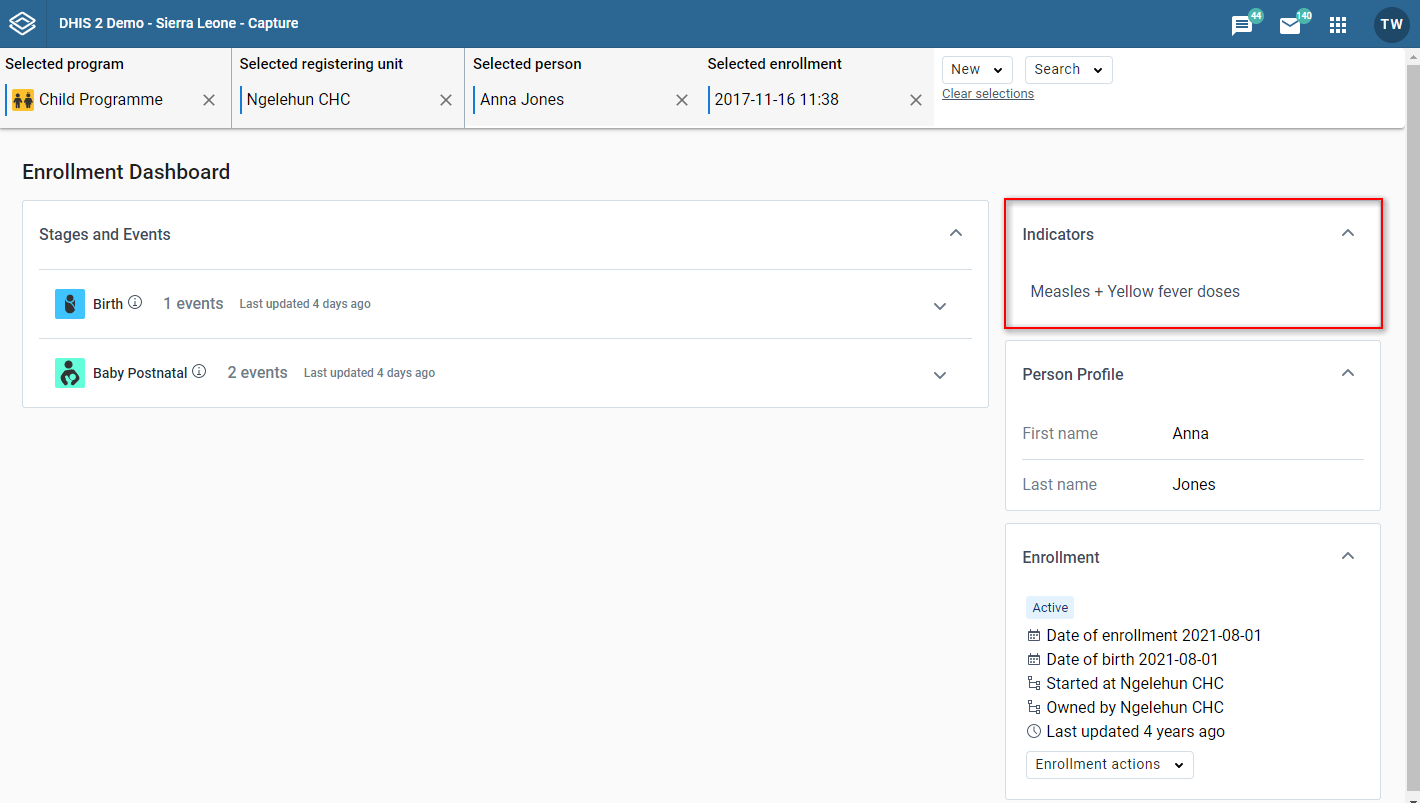
On the enrollment dashboard, the indicator widget displays indicator text and values output related to the current dashboard. The indicators will be sorted alphabetically.
If there aren't any related indicators or indicator output for the current dashboard, the widget shows a short empty message. If the current dashboard can't show any indicator output (because it has no related indicators) then the widget is hidden.
Some indicator values show a colored circle next to the value. The colored circle shows the related legend color for that indicator value. Colored legend circles are only shown for indicator values that have them set up.
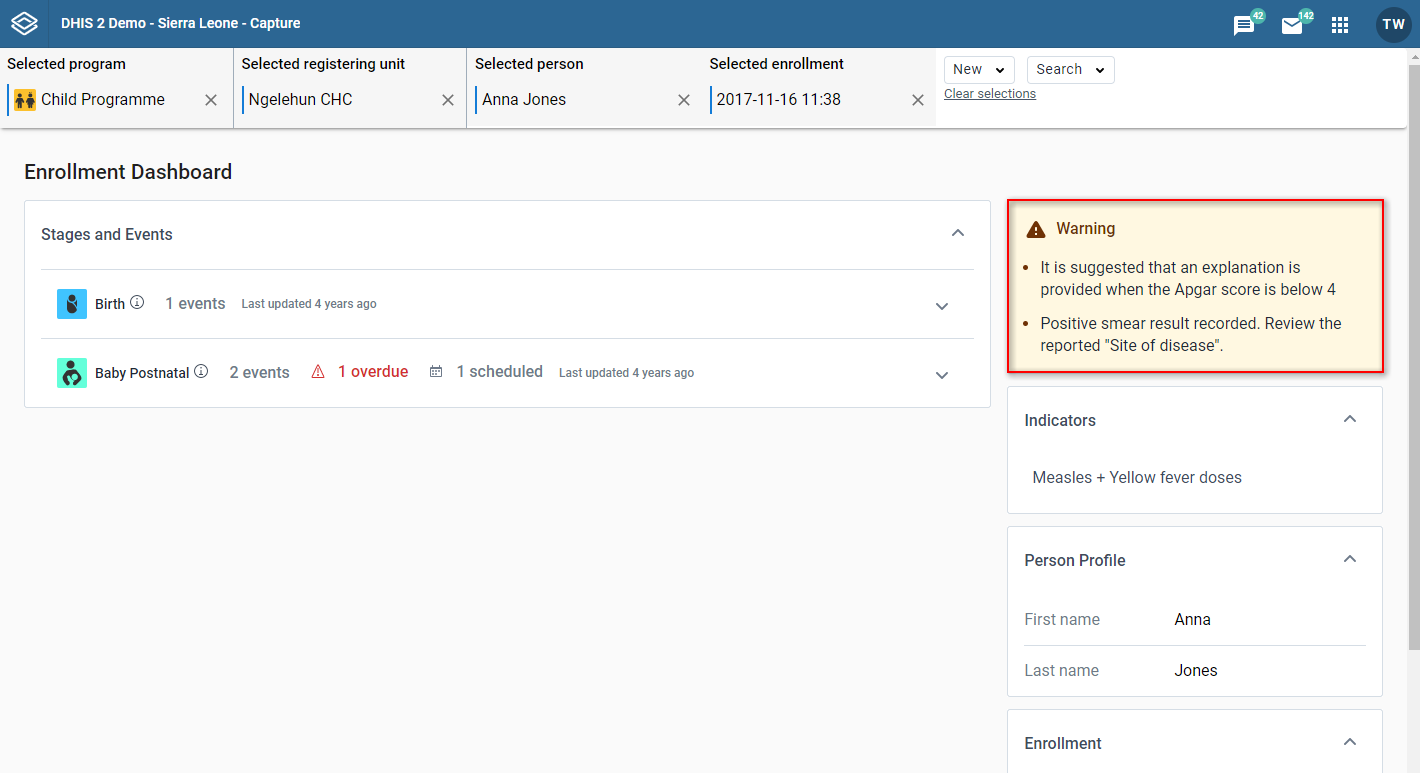
On the enrollment dashboard, the warning widget displays warnings related to the current dashboard. The widget shows warnings that are not associated with any specific data item. If there aren't any warnings to show for the current dashboard then the widget is hidden.
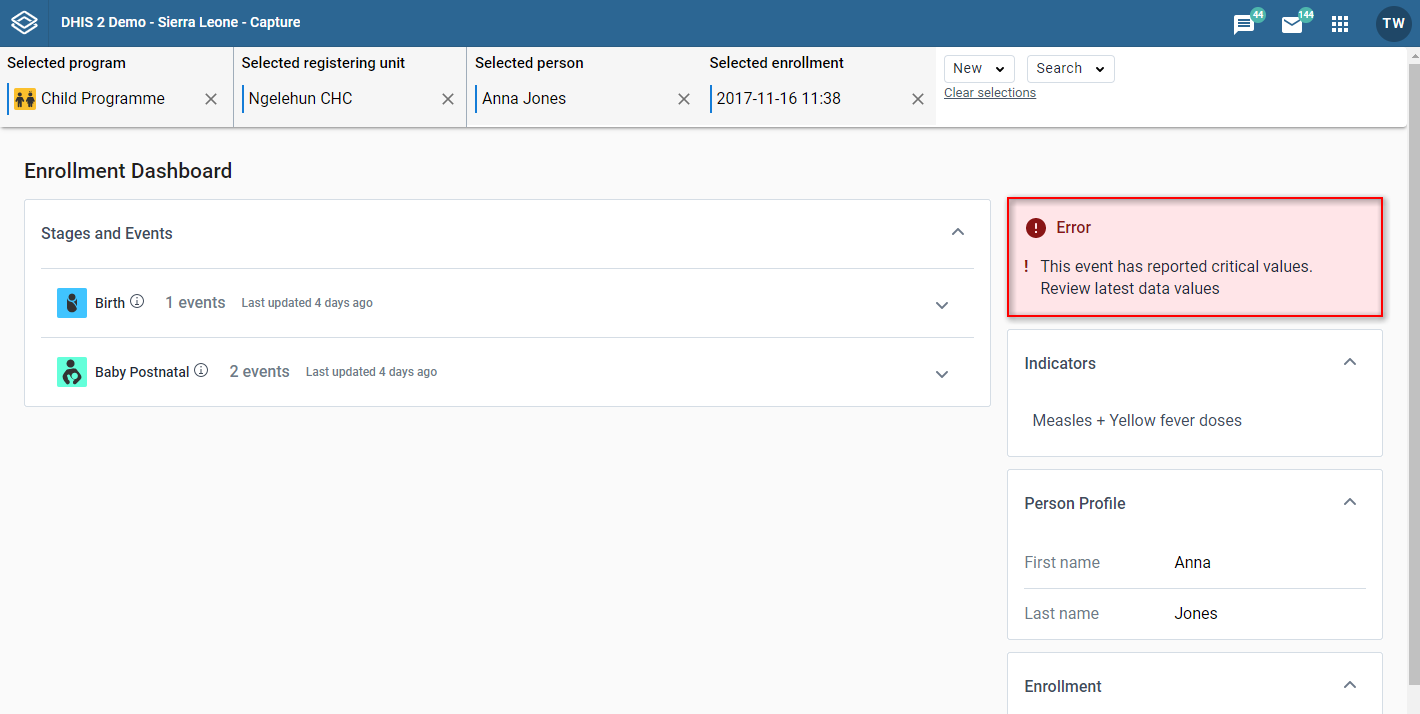
On the enrollment dashboard, the errors widget displays errors related to the current dashboard. The widget shows errors that are not associated with any specific data item. If there aren't any errors to show for the current dashboard then the widget is hidden.
You can reach the enrollment event edit page is by clicking any event in the Program stage list from the Enrollment Overview page.
At the top of the page you can see various information related to the current context. You can see the program, the organization unit, the tracked entity, the enrollment date, the stage and the enrollment event date.
To go to Enrollment Overview page you can: - click the "Back to all stages and events" button. - deselect the stage from the top bar. - deselect the event from the top bar.
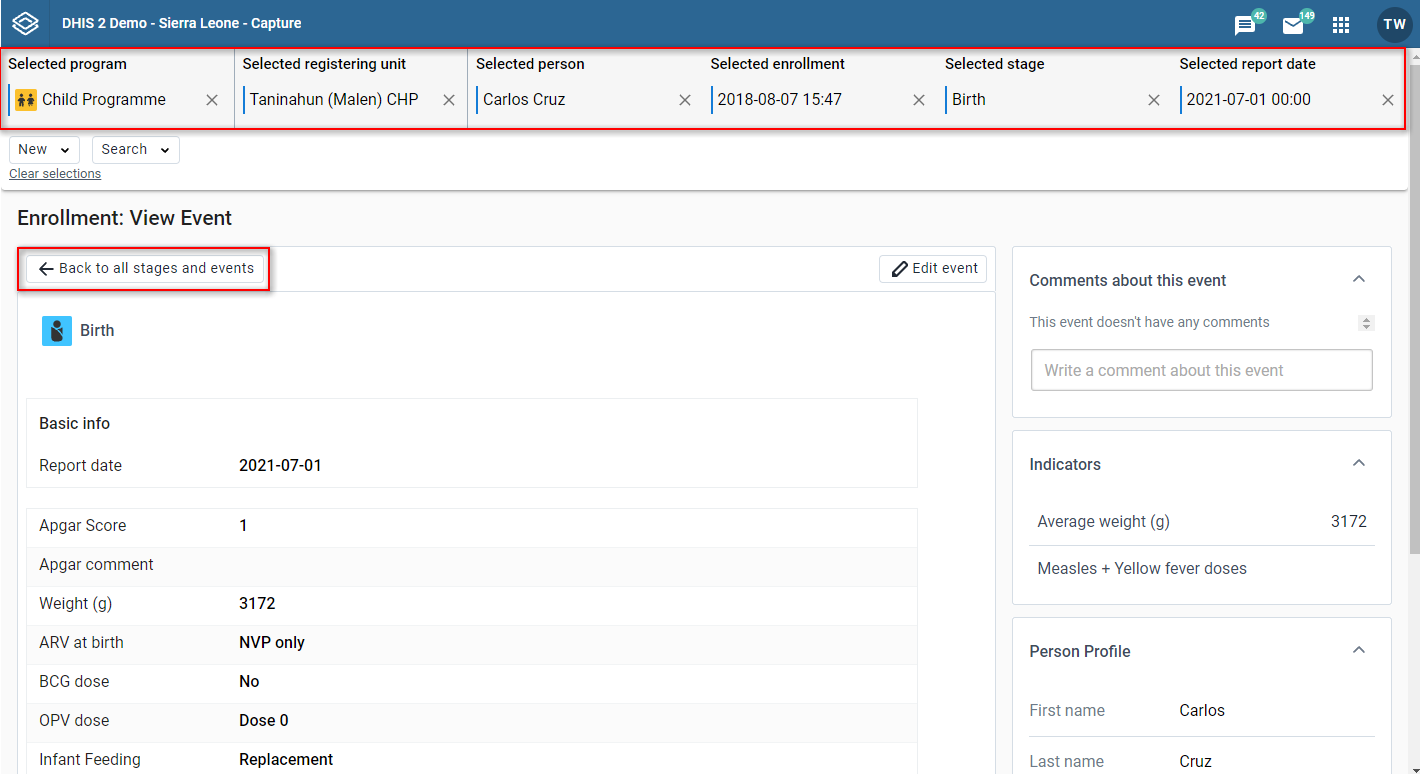
This is the form where you can see and edit the enrollment event details.
In the view/edit event form you can see the stage name and icon.
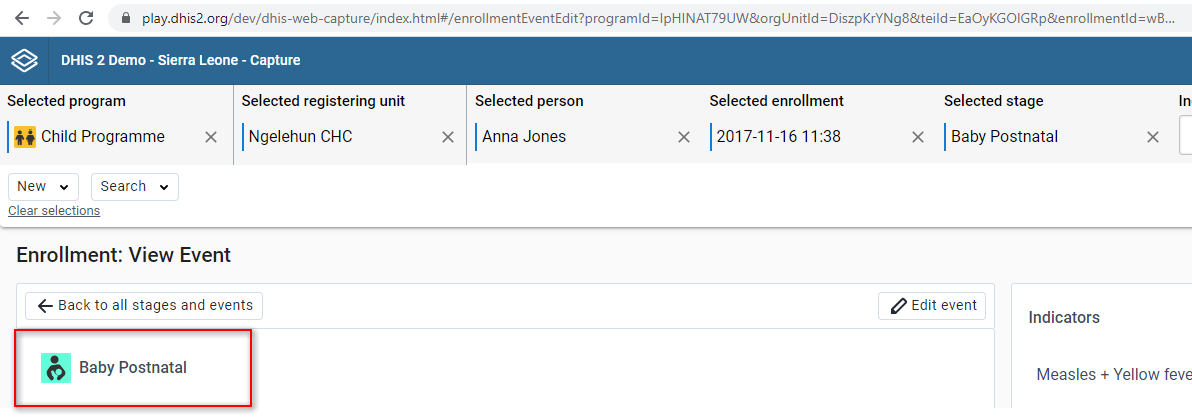
At the top of the page you can see different informations related with the current context. You can see the program, the organization unit, the tracked entity, the enrollment date, the stage.
To go to Enrollment Overview page you can: - deselect the stage from the top bar. - deselect the event from the top bar.
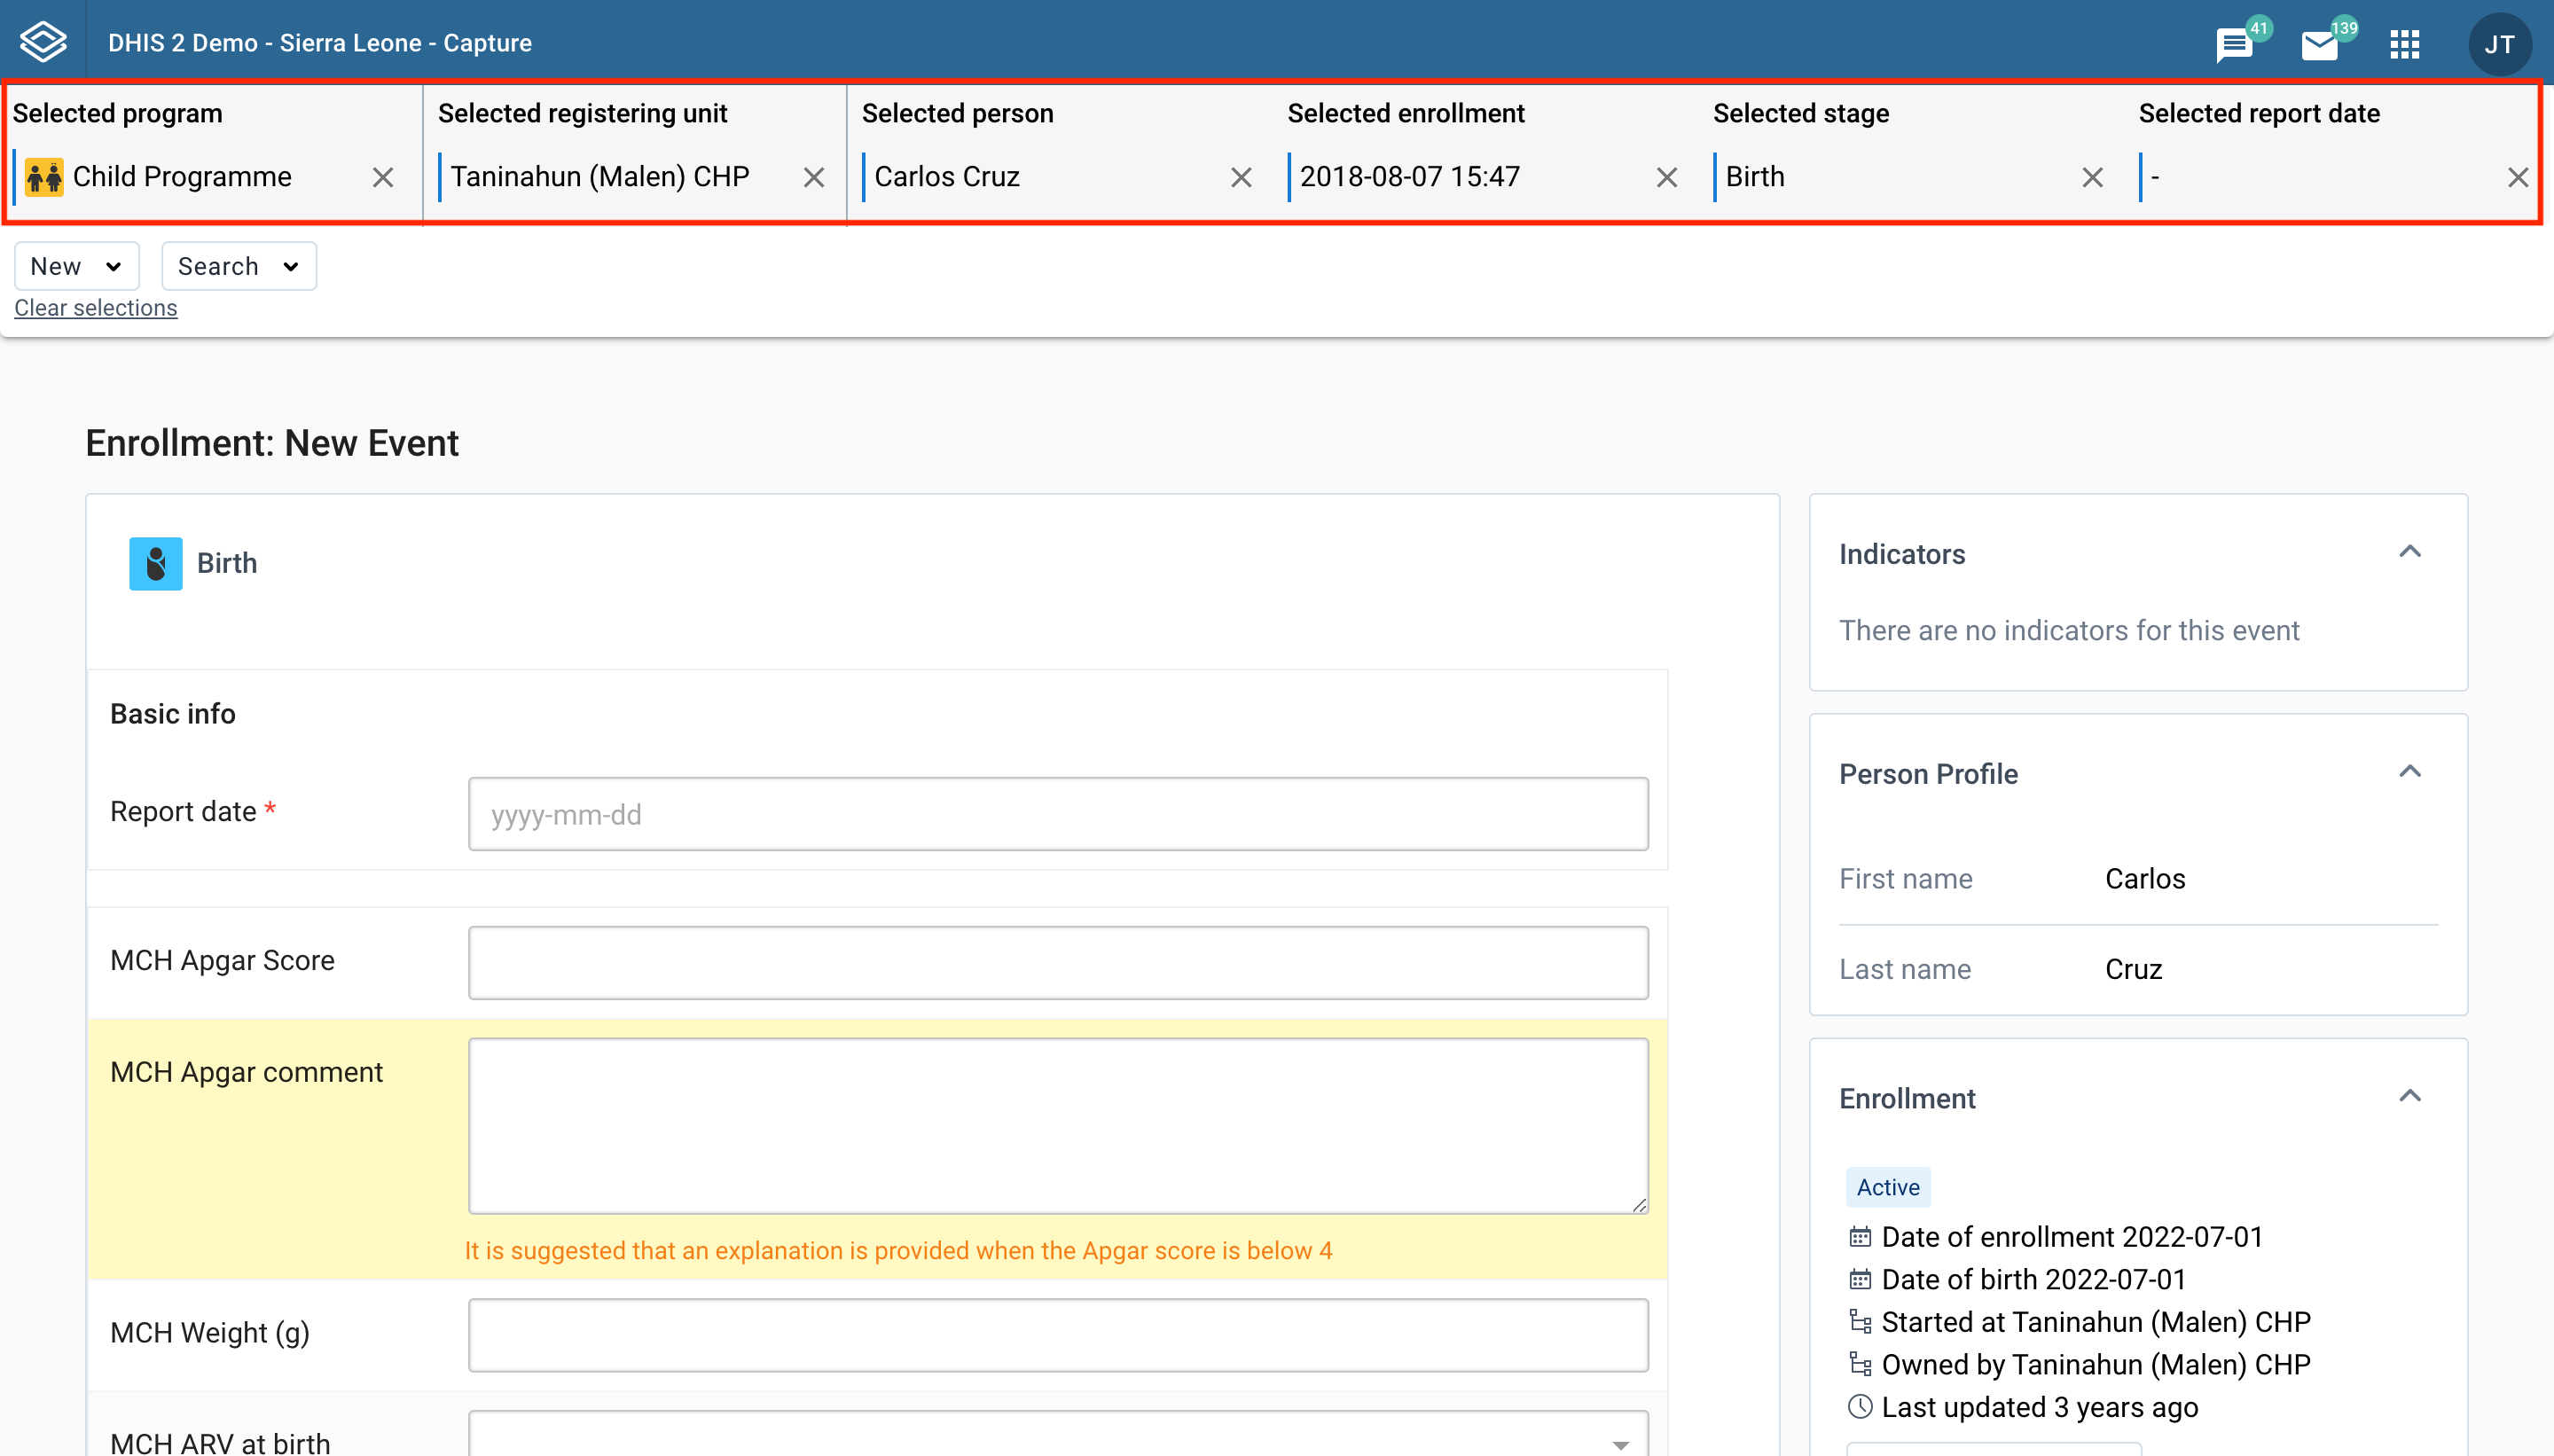
If an event has the status Scheduled or Overdue, you will be able to see the Report and Schedule tab.
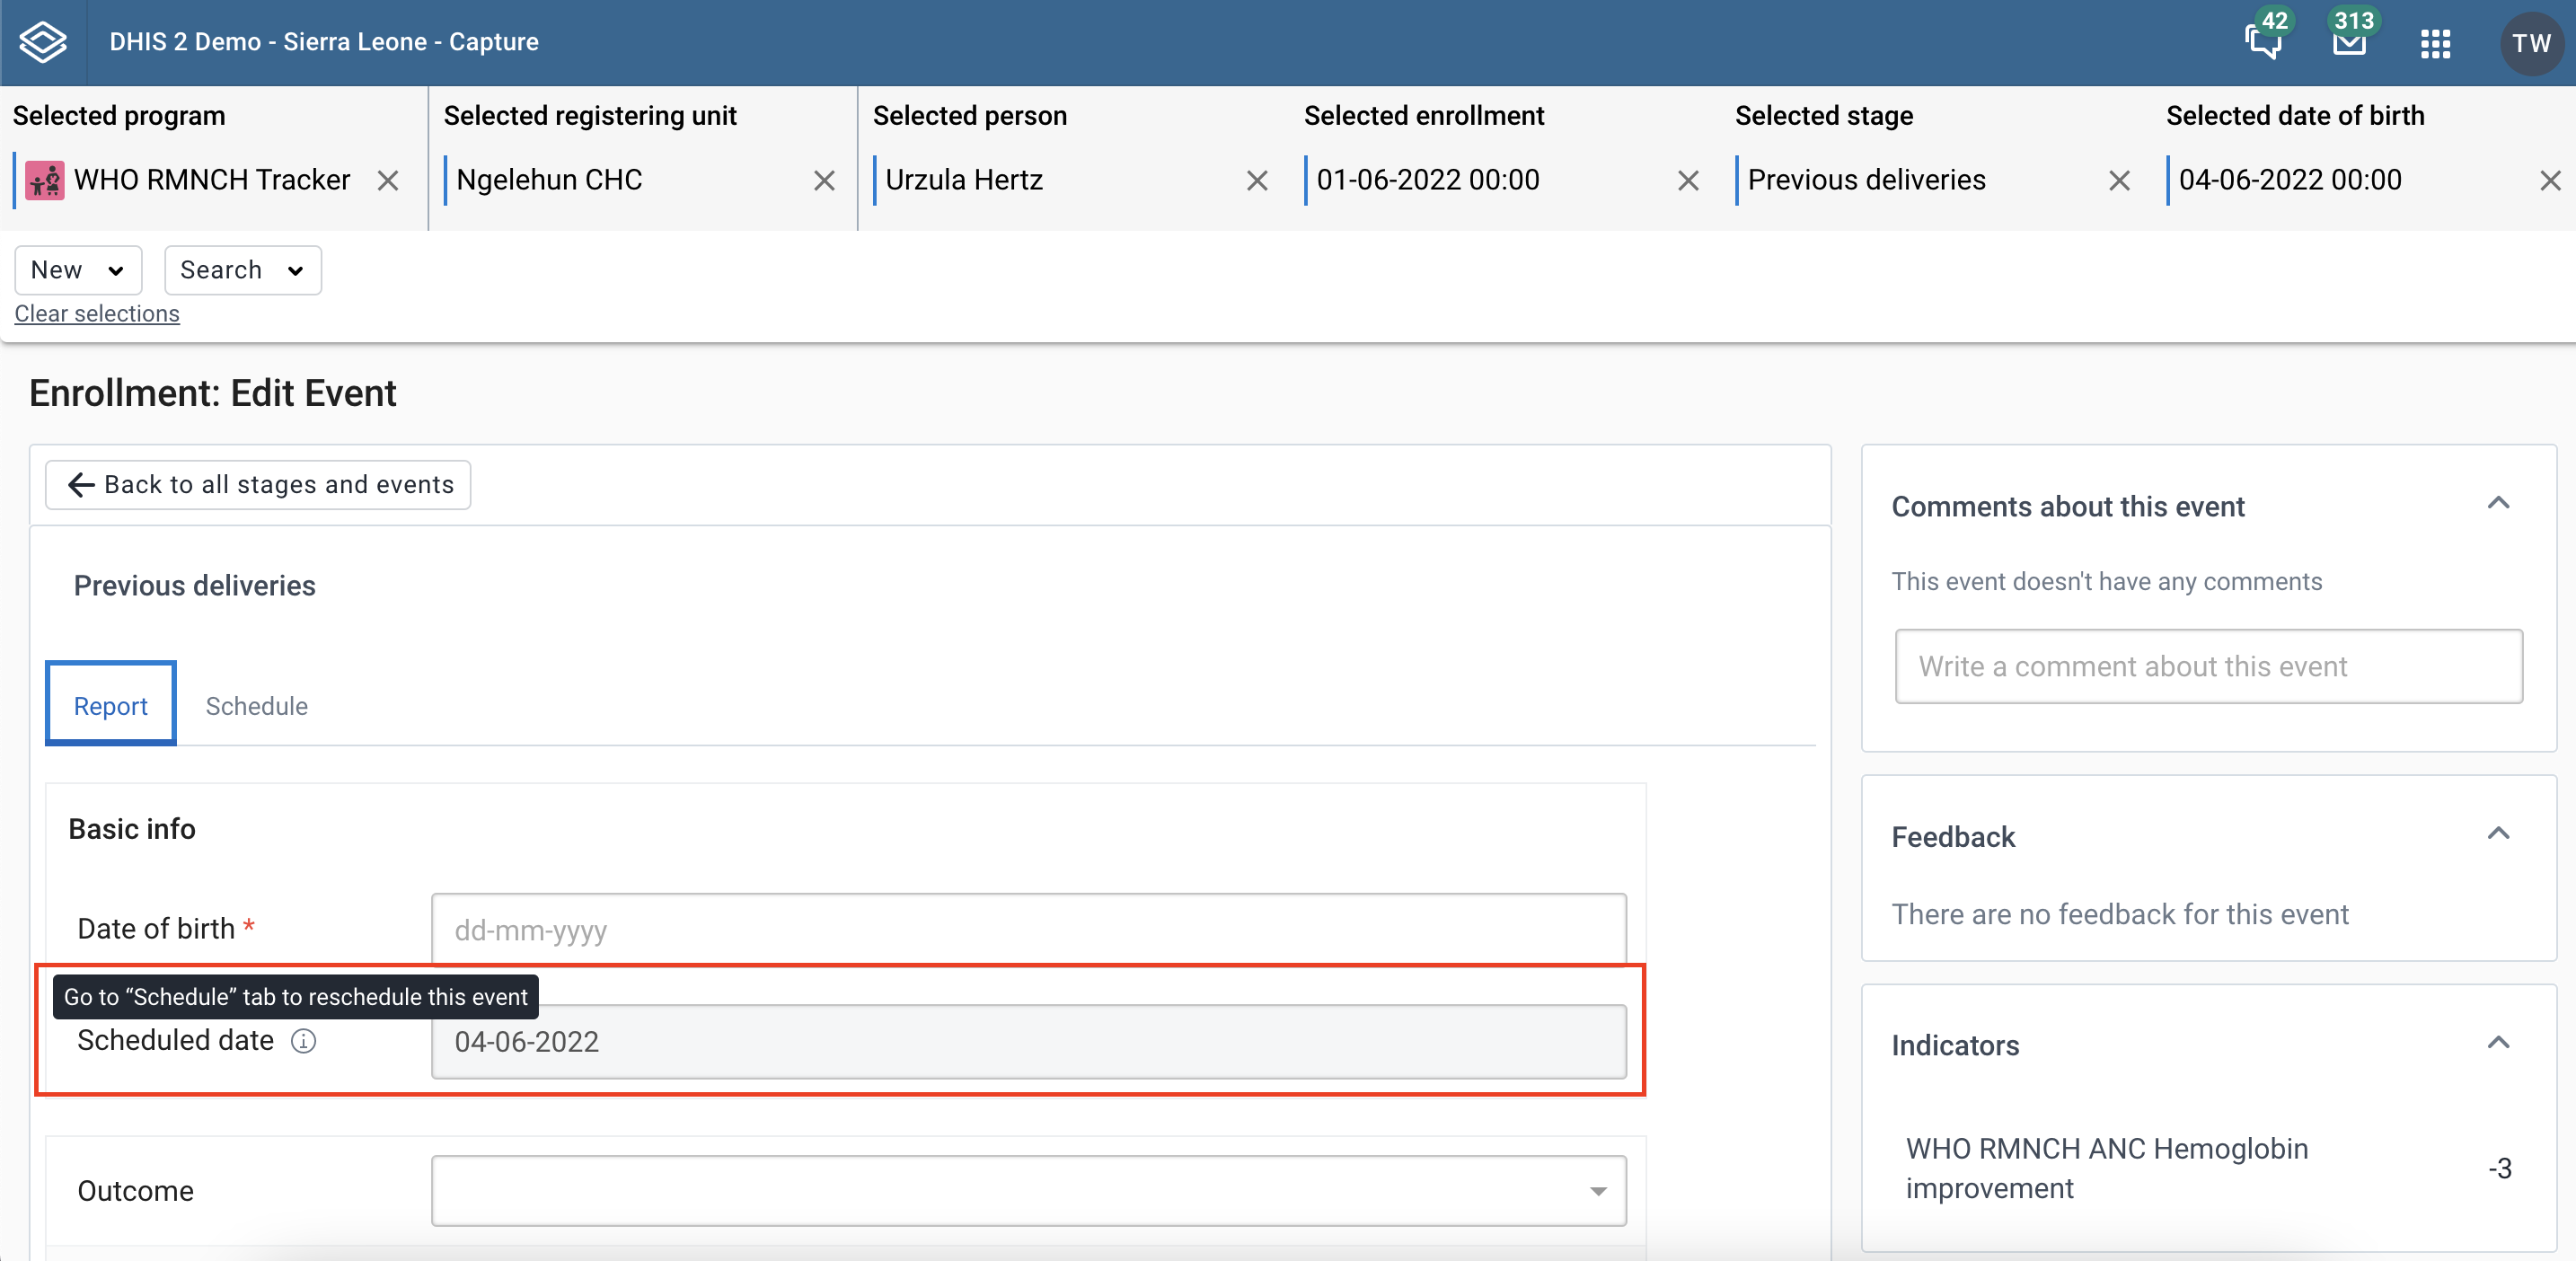
In the Report tab, the scheduled date field will still be shown, but will be greyed out, and there will be an icon next to it with a tooltip saying “Go to Schedule tab to reschedule this event”.
In the Schedule tab, the similar information about scheduling an event as in New event workspace will be shown. You will be able to edit the schedule date and save the change by clicking Schedule button.
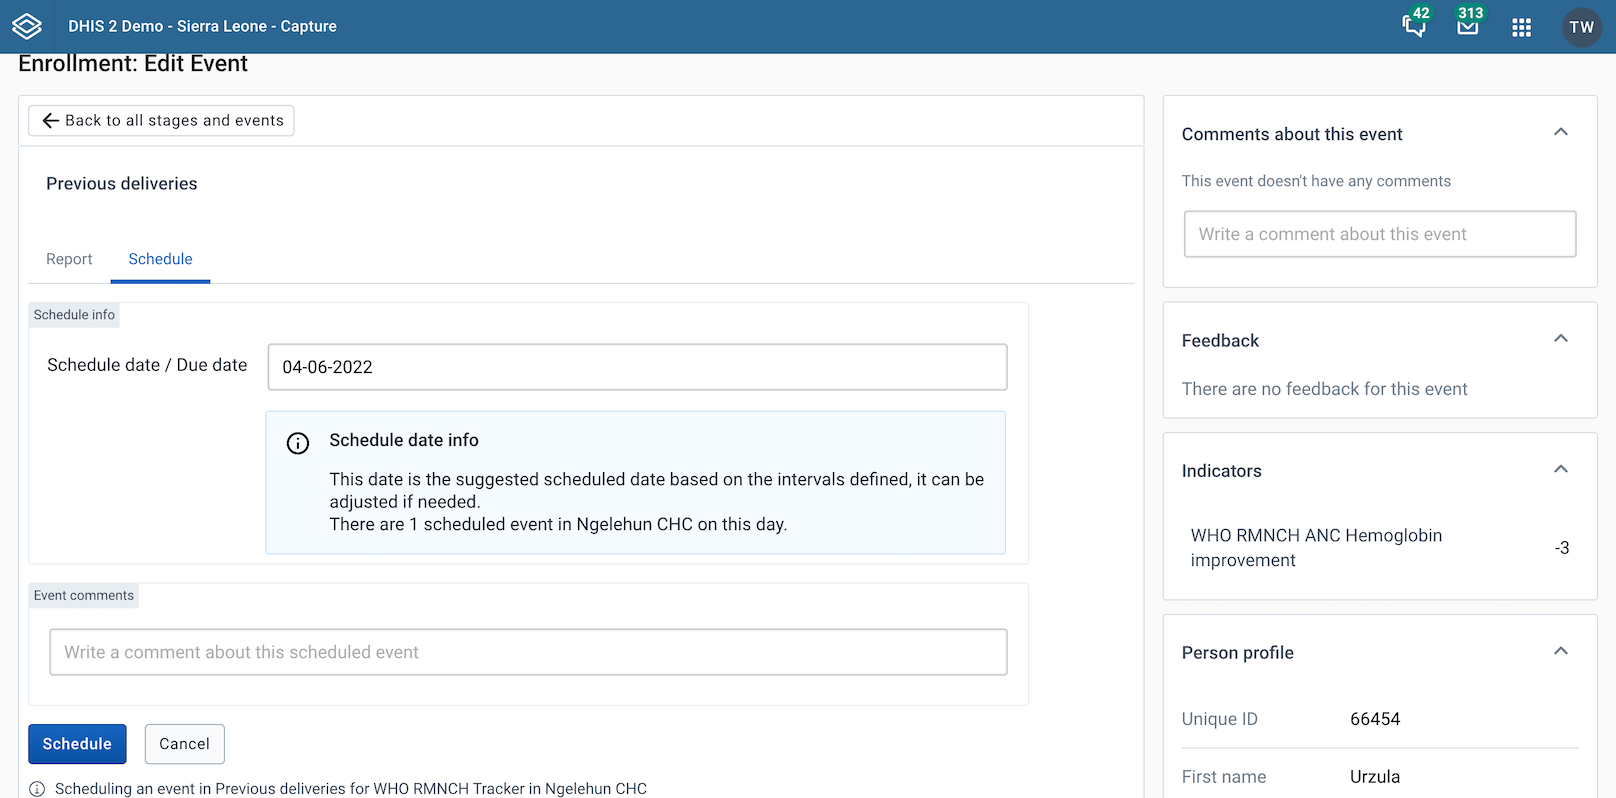
If an active event has a scheduled date before becoming active or a completed event has scheduled date, this date should still be shown in the workspace. It’ll be locked with an icon next to it and a tooltip saying “Scheduled date cannot be changed for active/completed events”.
If the flag “Hide due date” in the Maintenance configuration is enabled, scheduled date will not be shown in the form.
However, you can still schedule an event, but it automatically chooses the date based on "Scheduled days from start" that has been configured in Maintenance, and this can not be changed. In the Schedule tab, there will be “Schedule info” saying “Scheduled automatically for xx/xx/xx”, and the user can click Schedule button.
If this flag has been enabled for the stage in Stage details in Maintenance, a modal will show up after the user checks the Complete event checkbox and clicks save.
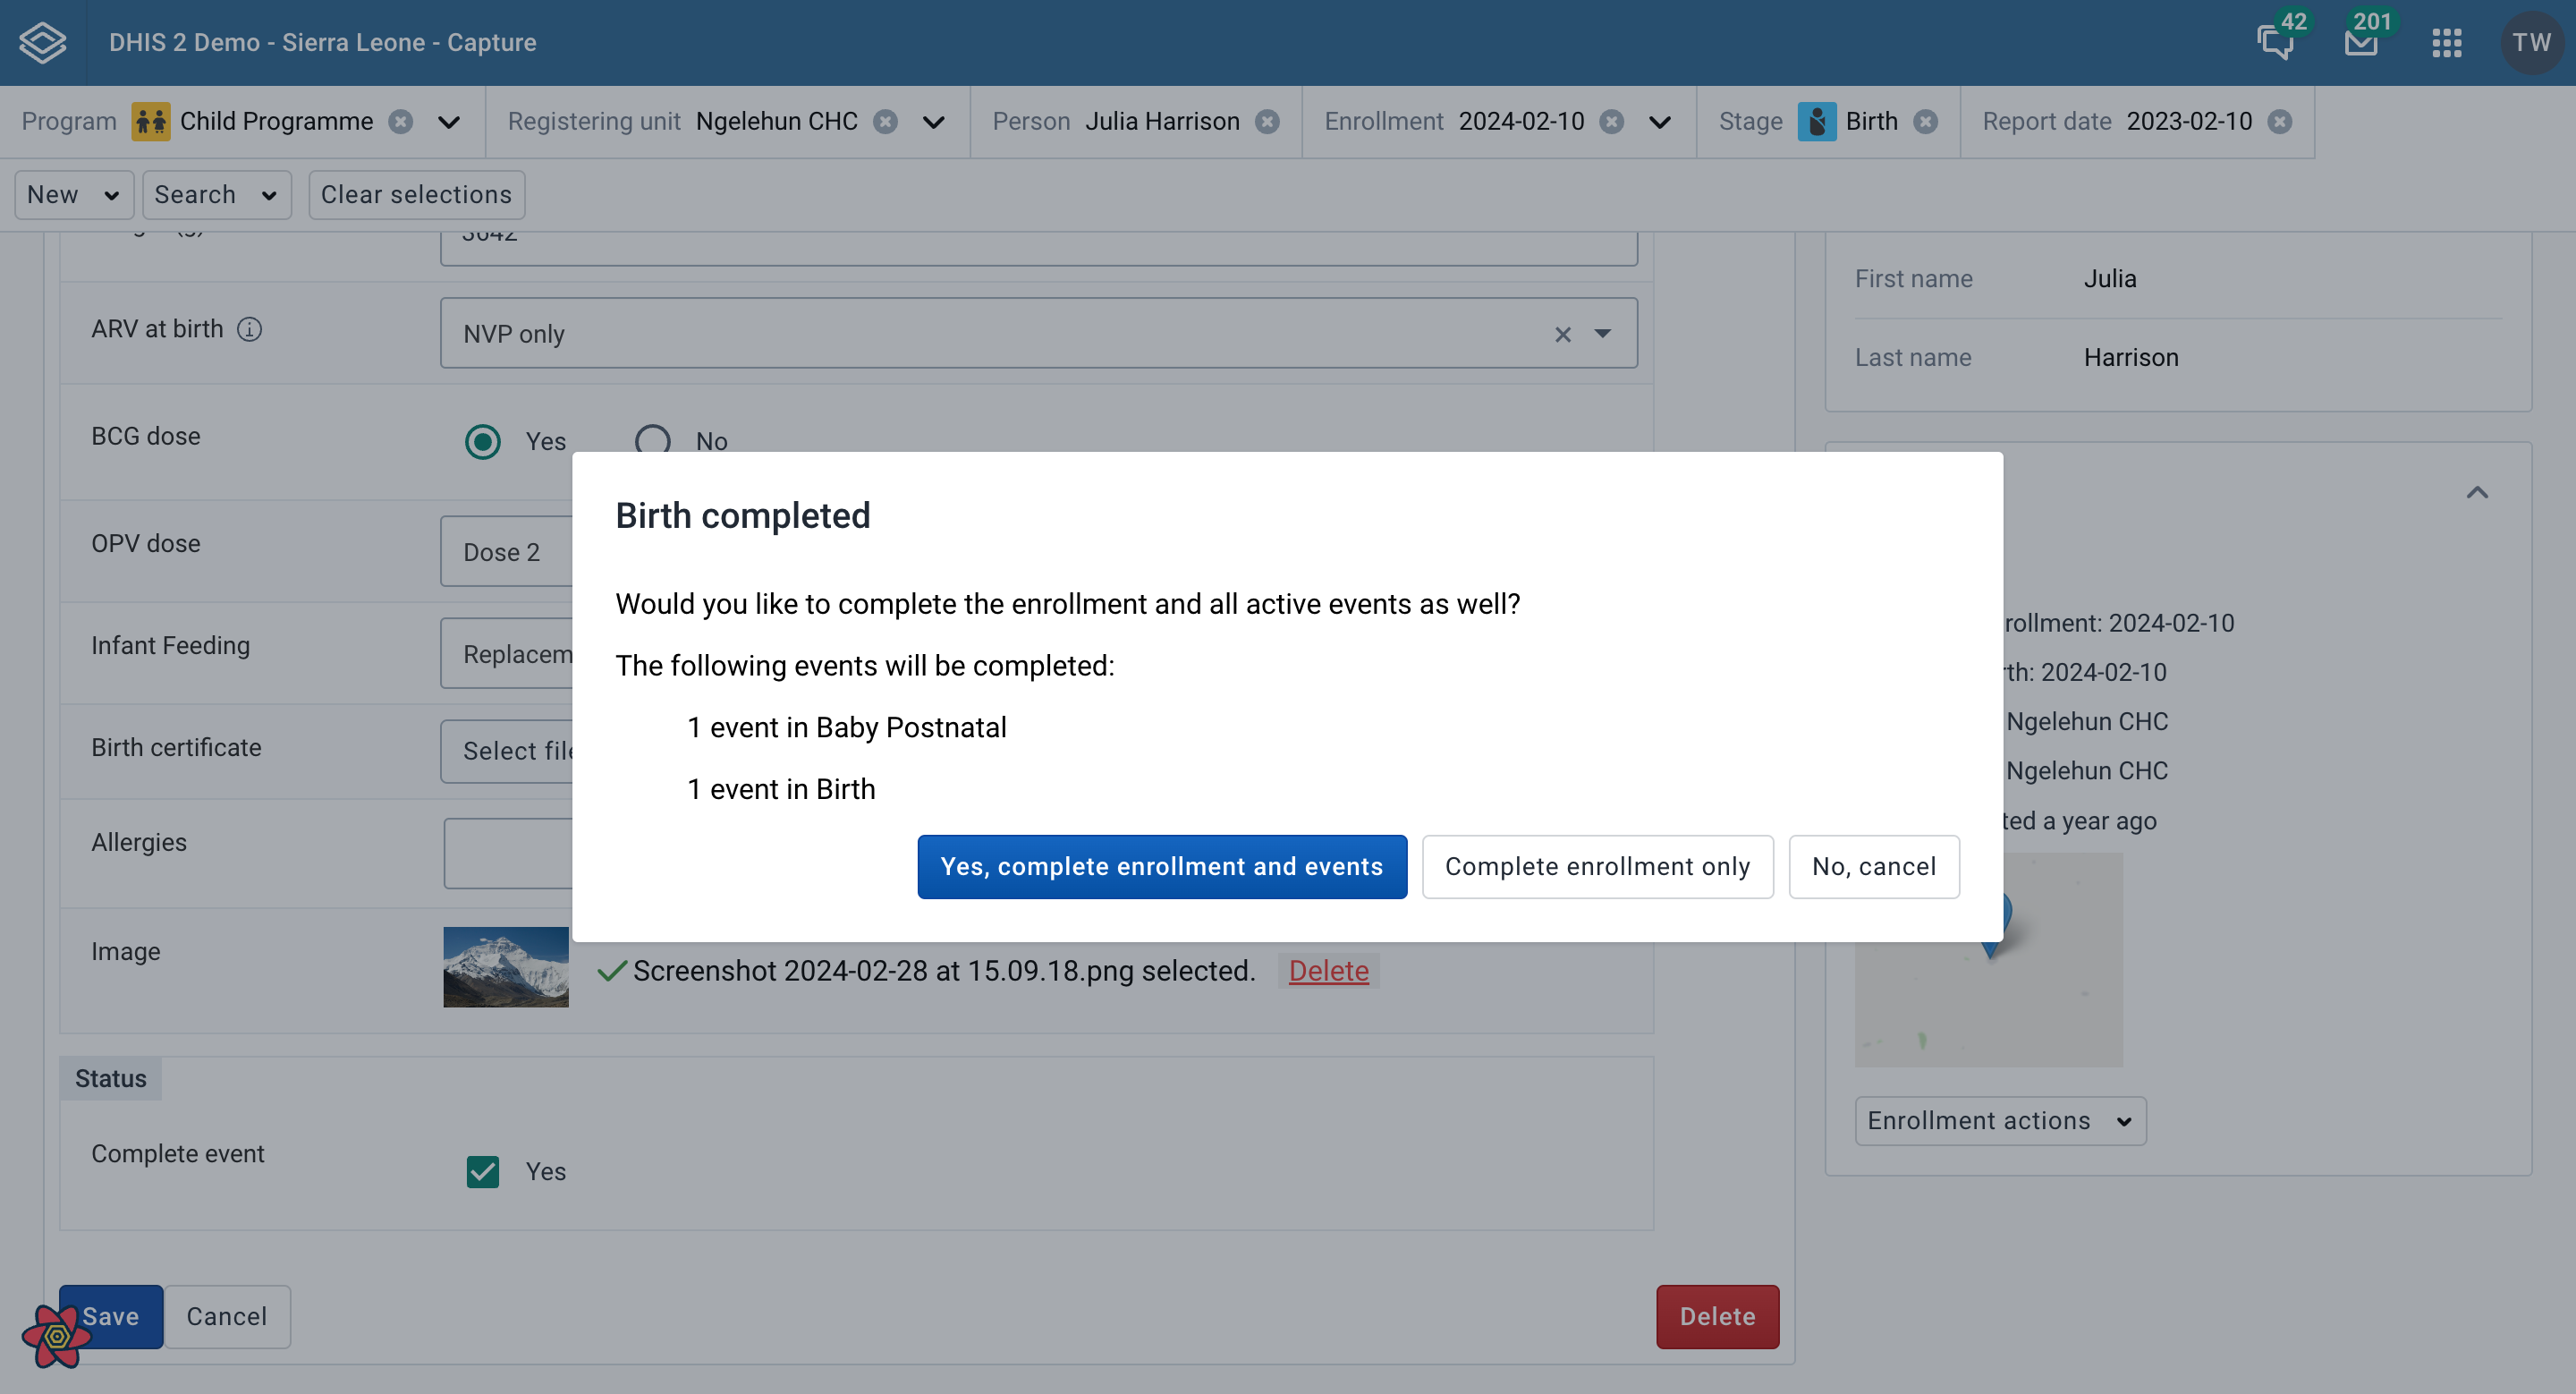
When the form is in the view mode the title of the page will appear as: Enrollment: View Event. You can see in the page all the information related to the event. Click the Edit event button to switch to the edit mode. This mode is bypassed for events that are scheduled.
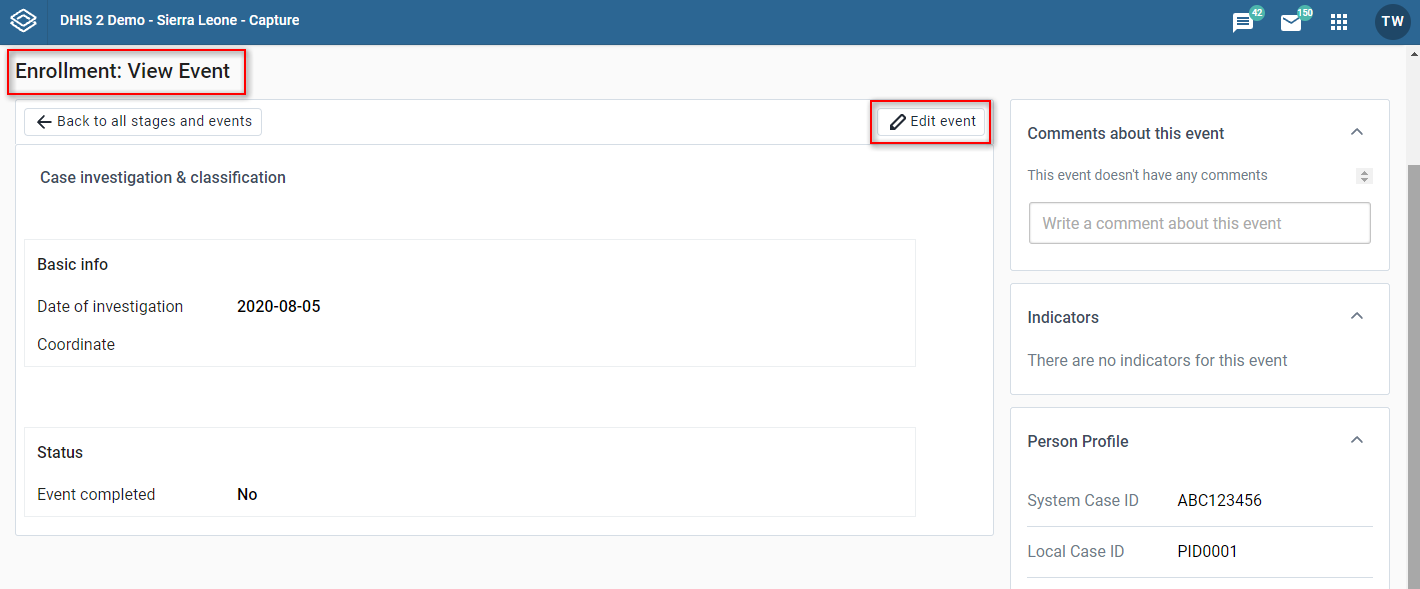
When the form is in the edit mode the title of the page will appear as: Enrollment: Edit Event. You can modify the event and click the Save button. Click the Cancel button to switch to the view mode without saving the changes. Scheduled events are are the exception and they are opened in edit mode directly, without the user having to click Edit event. Click the Cancel button to go back to the enrollment dashboard page without saving the changes.
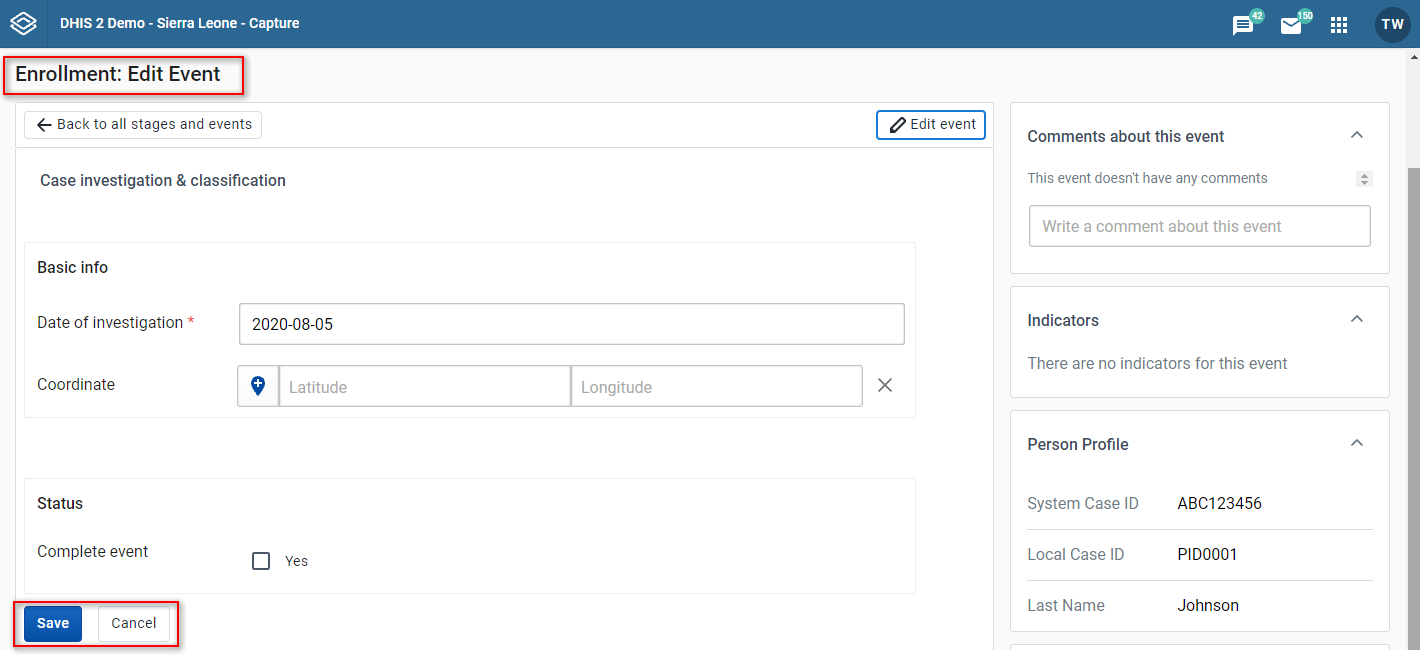
In this form you can also delete the event by clicking Delete button, a modal will appear to confirm if you want to delete this event. You will then be navigated back to Enrollment dashboard page.
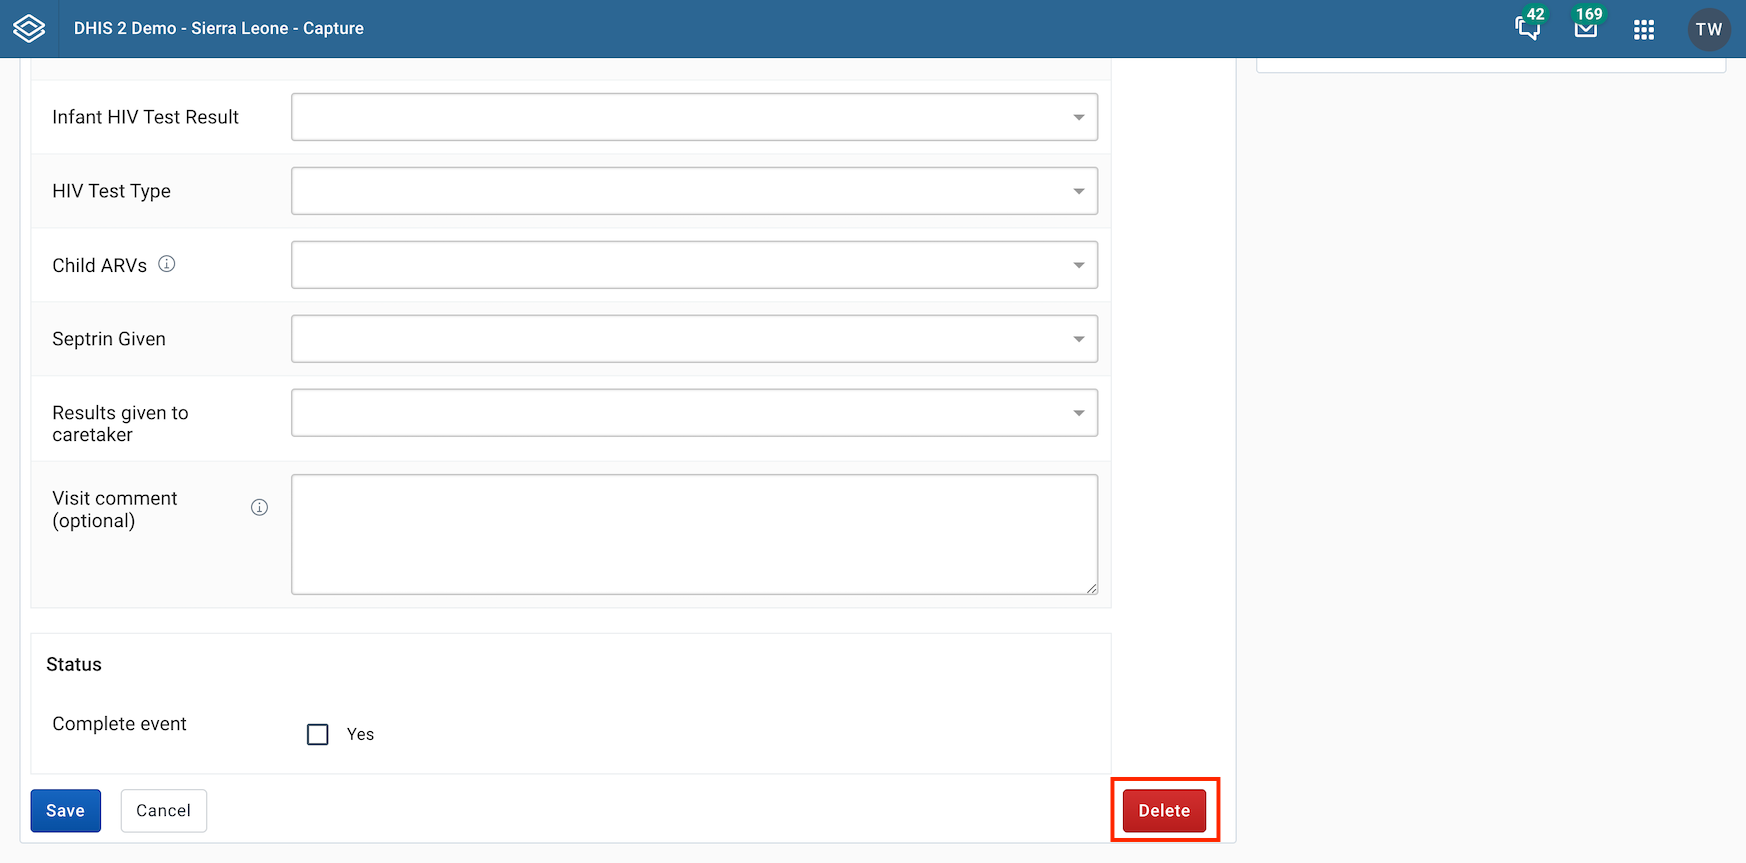
The widgets seen in the right-hand column will display and function the same way as mentioned in the enrollment dashboard.
In View/Edit enrollment event page
In the right column you will find the assignee widget.
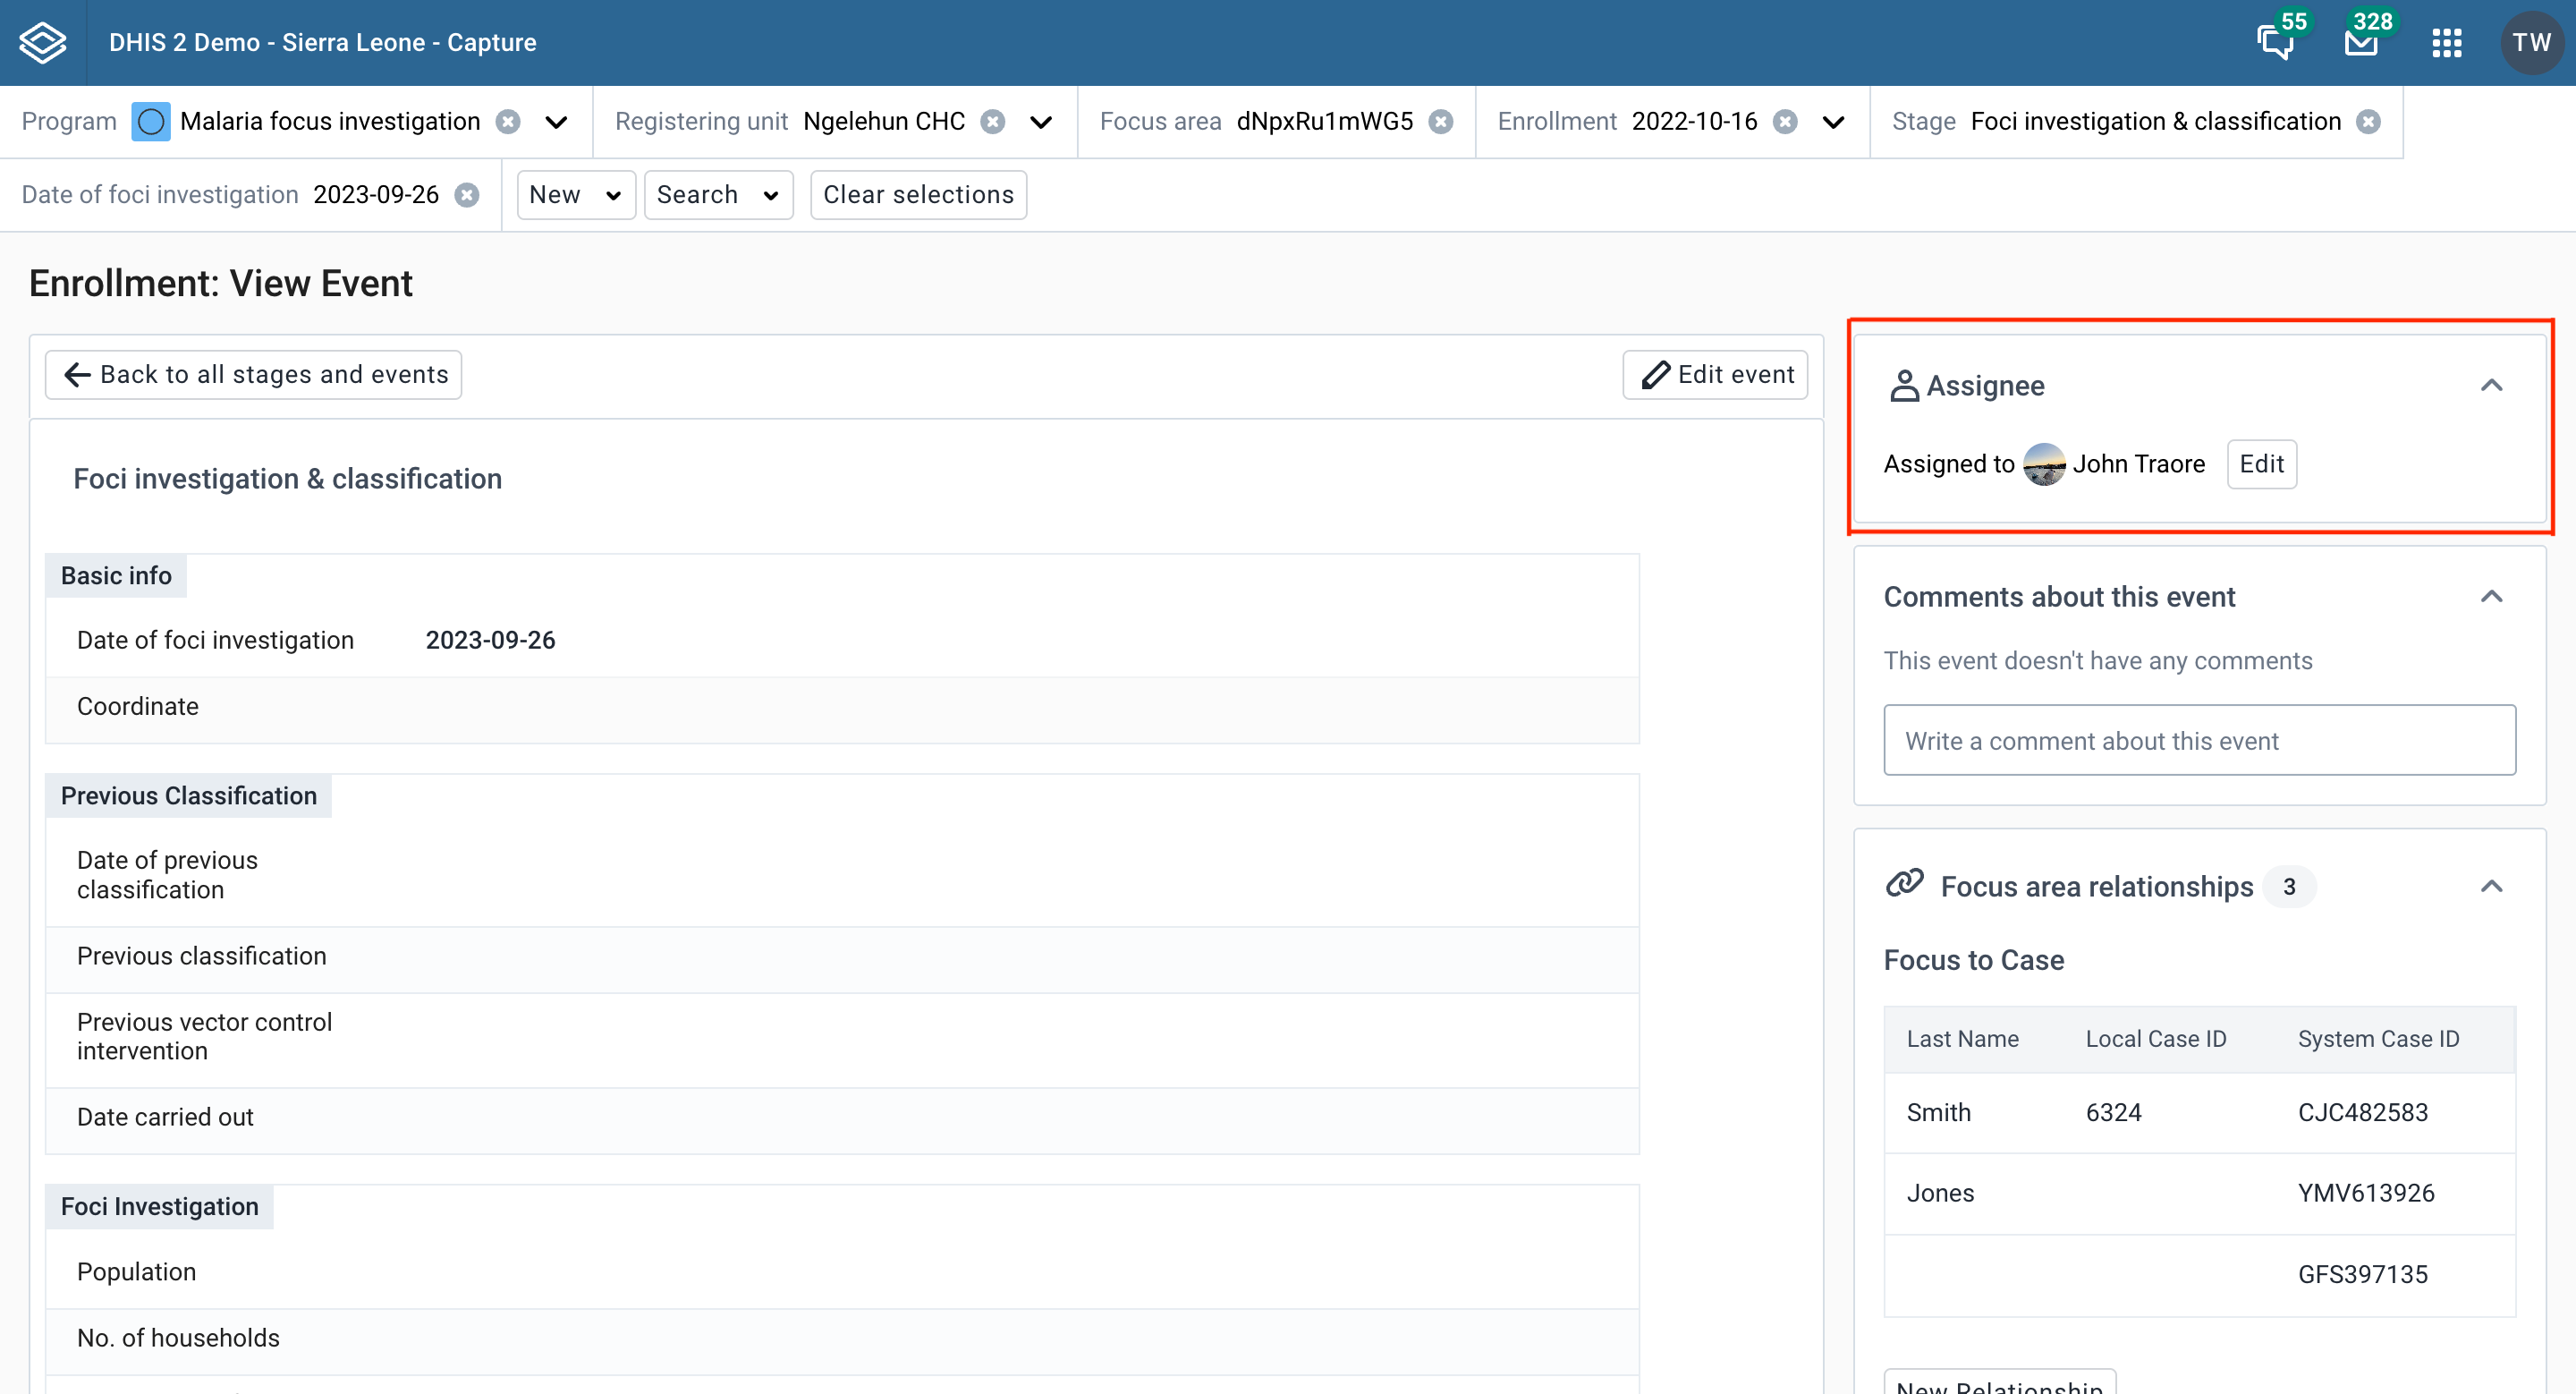
Click the Edit button, or the Assign button if the event is not currently assigned to anyone.
Search for and select the user you would like to reassign the event to. Click the Save button.
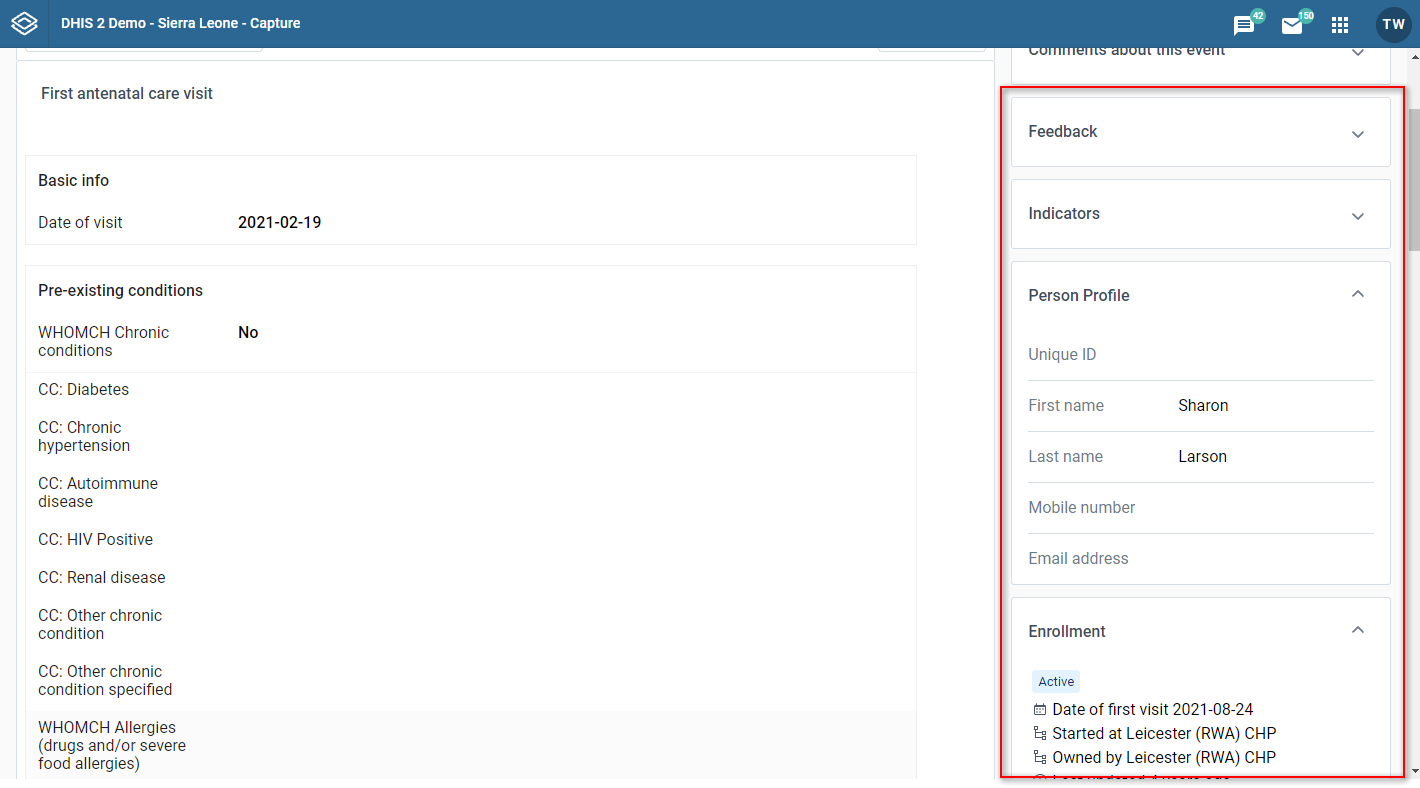
You can reach this page add event page by clicking in the New {stage event name} button in the overview page. In this page you can switch between different tabs: Report to add new event, Schedule to schedule an event and Refer to refer event. If you have unsaved changes in one tab and switch to another tab, there will be a warning displayed.
This is the form where you can modify the event details before saving. In the header you can see the stage name and icon.

If you enter the new event page with no stage selected, a list of available stages will be displayed. Select the stage you want to add a new event in by clicking the associated button. To navigate back to the enrollment overview, click the Cancel without saving-button

If this flag has been enabled for the stage in Stage details in Maintenance, a modal will show up after the user clicks the Complete button.
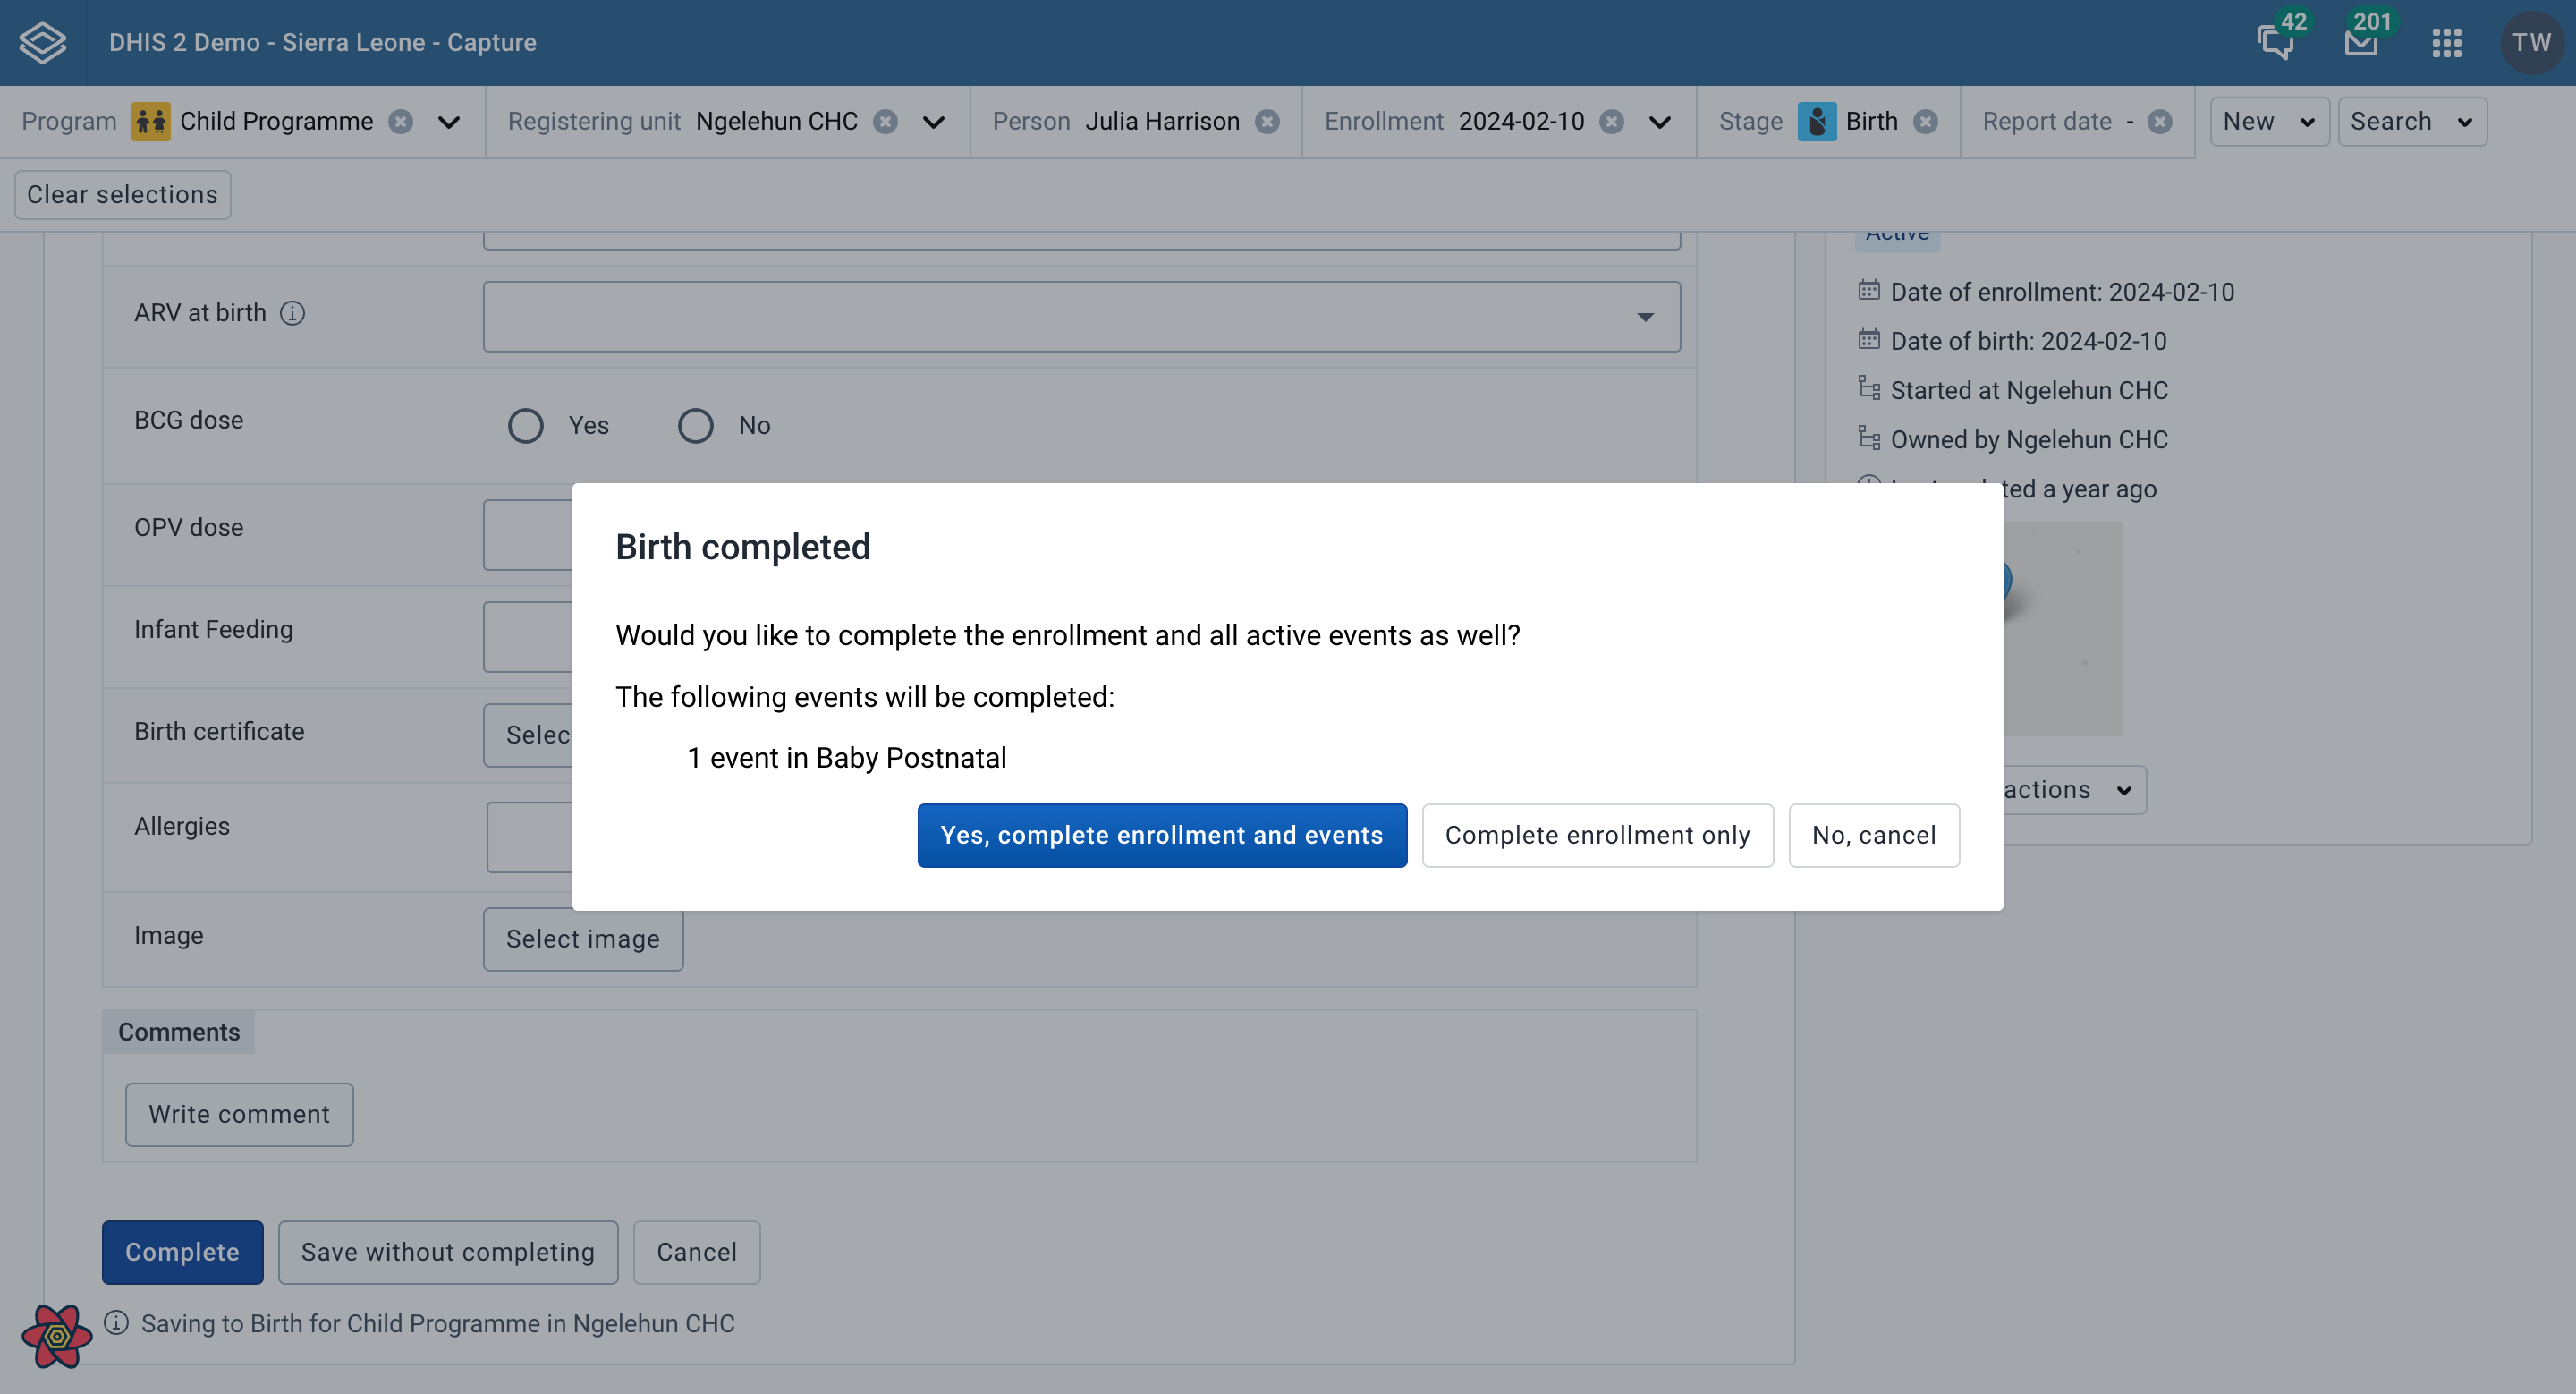
If this flag has been enabled for the stage in Stage details in Maintenance, a modal will show up after the user clicks the Complete button or checks the Complete event checkbox and clicks save. The user can choose the button Yes, create new event to navigate to the New Event page or No, cancel to navigate back to the enrollment dashboard. If there is only one possible stage available, the user will be taken directly to the New event workspace for that stage.
When reporting or scheduling an event, you can assign a user to it. This feature must be enabled per program stage in a tracker program by clicking the "Allow user assignment of events" check box.
You will find the assignee section near the bottom of the data entry page. Search for and select the user you would like to assign the event to. The assignee will be preserved when you save the event.
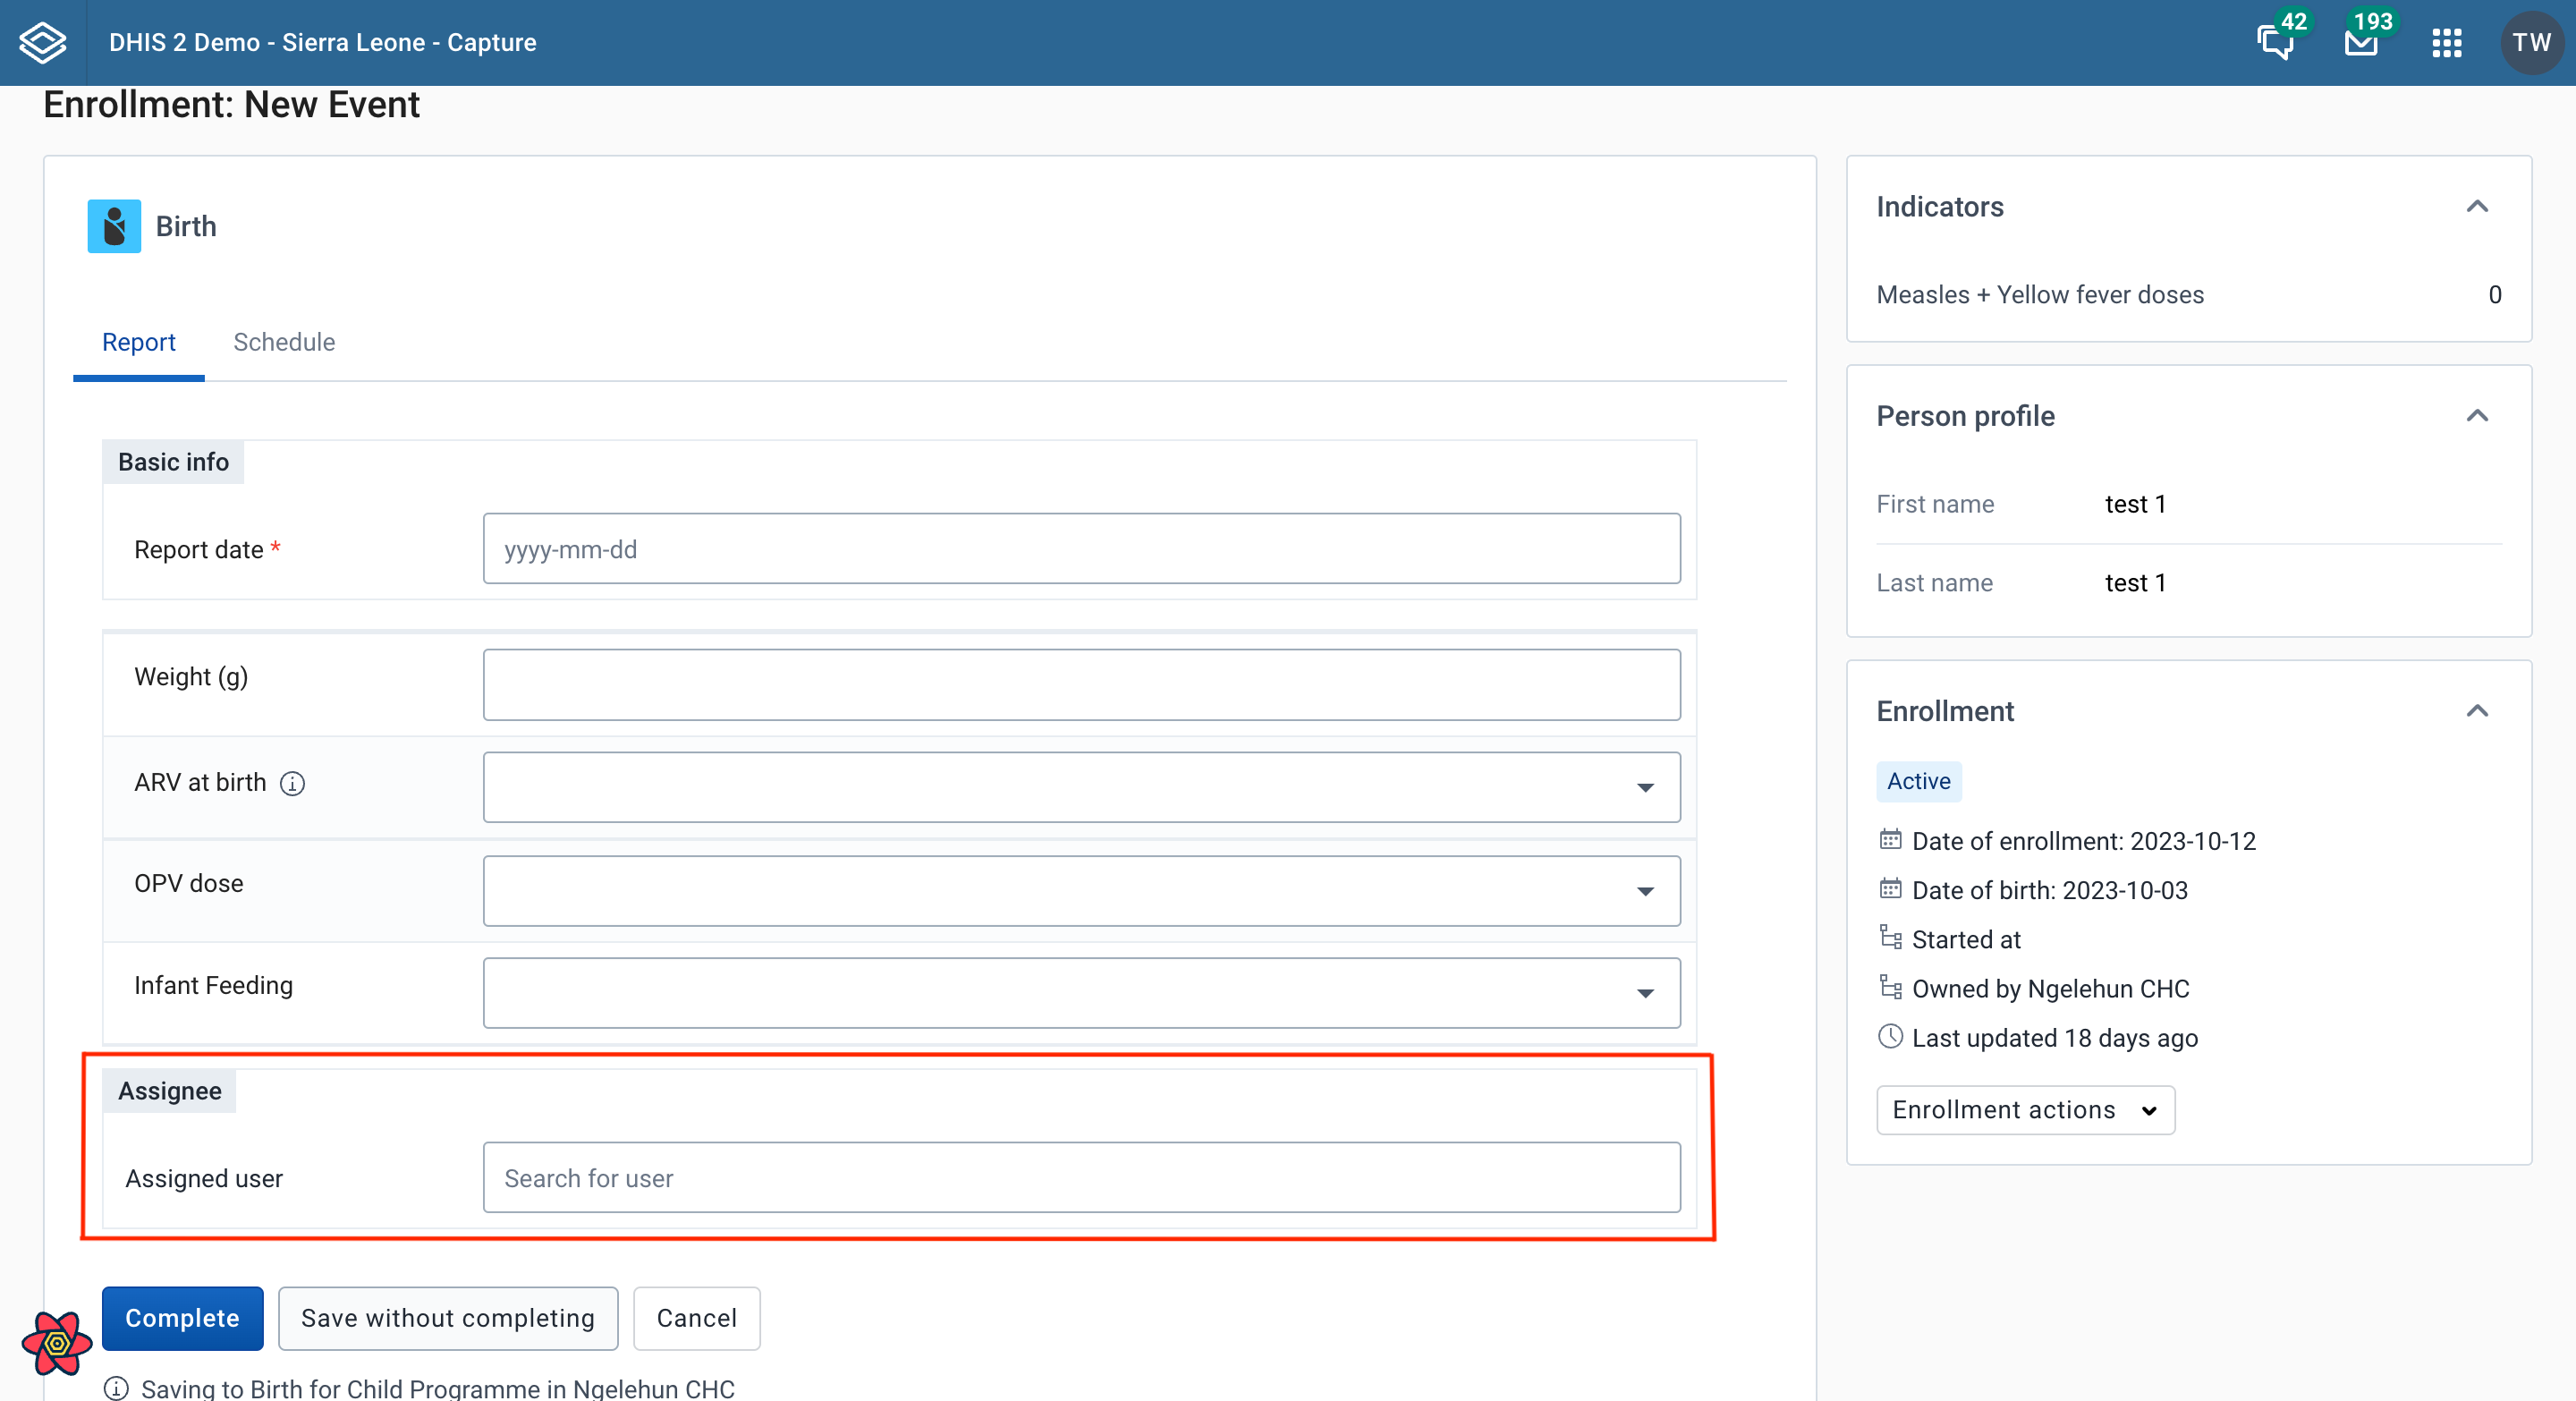

Instead of reporting an event the user can select to schedule an event for later. The form will open with a suggested scheduled date. This date is determined by a set of rules as explained below.
The suggested date for the first event of a program stage in an enrollment is always based on the enrollment date or the incident date (depending on the program configuration). The program stage configuration setting "scheduled days from start" will be added to the base date to cumpute the suggested date.
If a program stage has a default next scheduled date configured, the suggested date is the most recent next scheduled date. Below is an example of how this can work.
- A data element with value type date needs to be created and assigned to the particular program stage with access to future dates. The name of the data element could for example be: Next suggested follow up date. The program stage is configured to use the data element as default when scheduling a new event by assigning the data element to default next scheduled date.
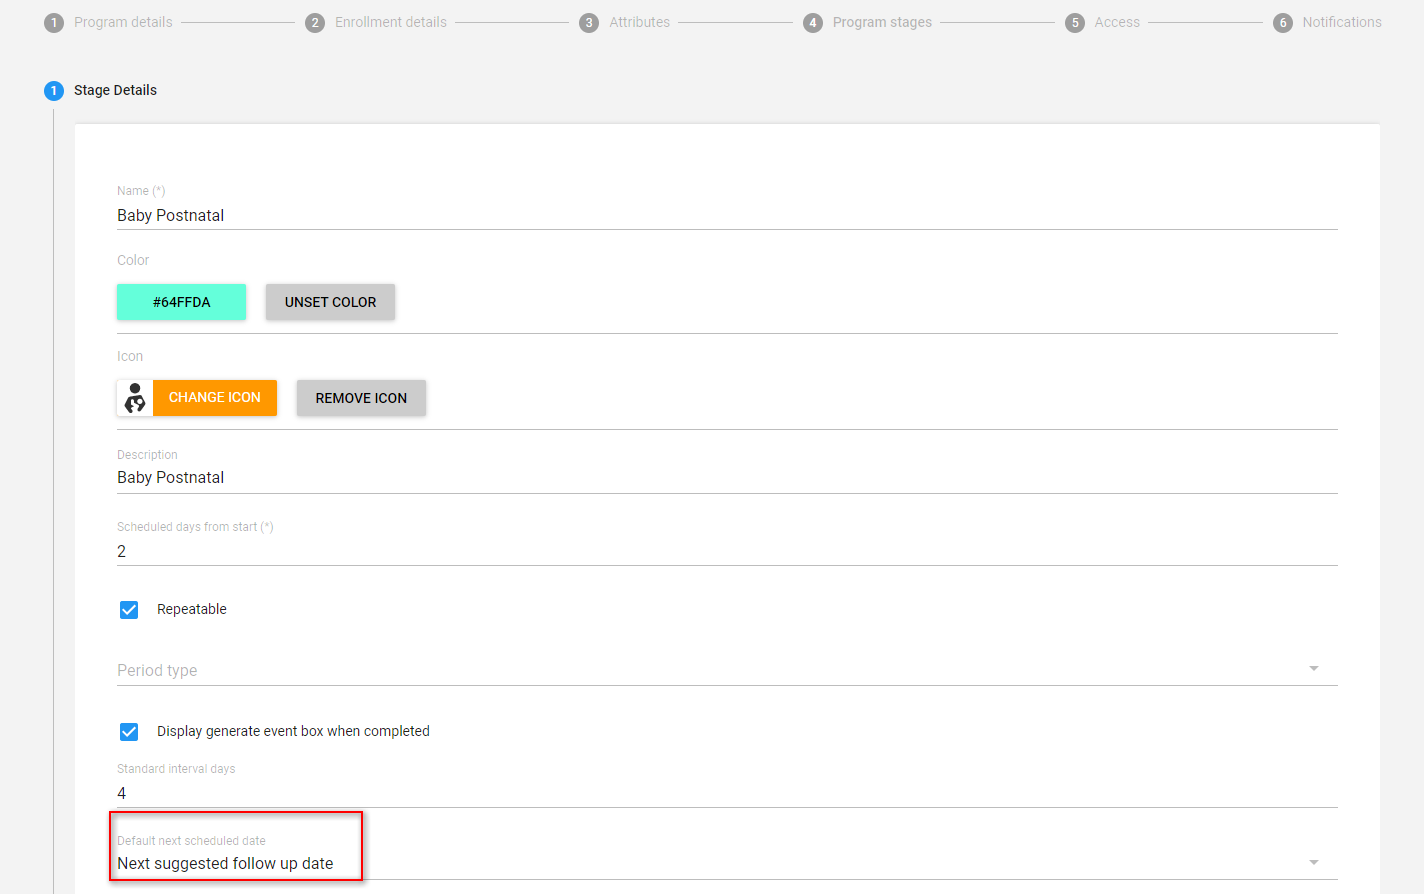
A program rule based on the data entered in the program stage, will determine how many days until the next suggested follow up will be. For example: A program rule with the following condition: #{penta_dose} == '1' (The program rule will trigger when the TEI has received Penta Dose 1), Assign value to the data element: next suggested follow up date with expression: d2:addDays(V{event_date}, '30') The number suggest how many days from event date the next scheduled event should be.
Open the Capture app and create a TEI. As long as Penta Dose has value Dose 1, the suggested next scheduled event is 30 days forward from event date. When scheduling a new event, the system will pick up from the data element as long it has value.
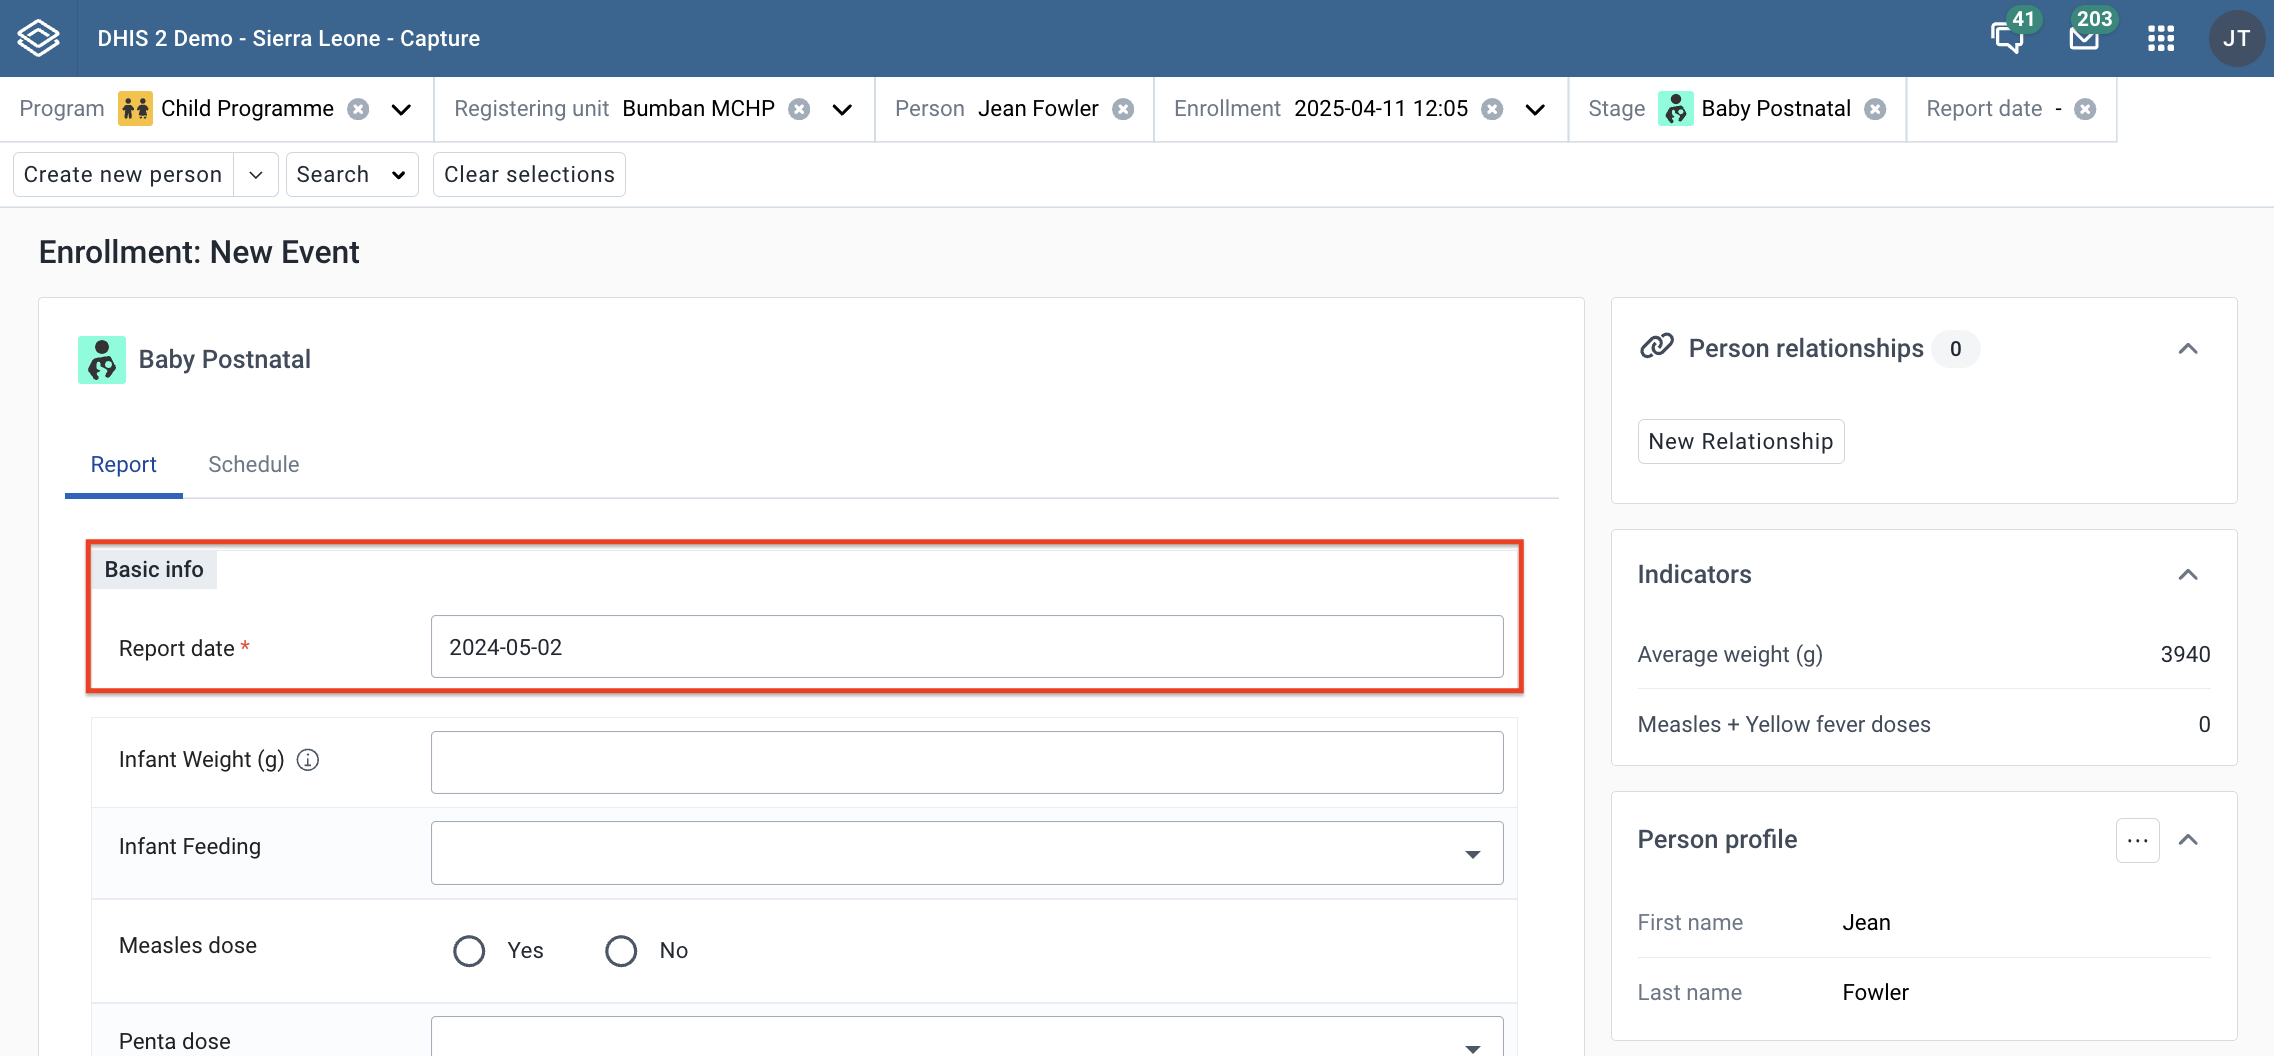
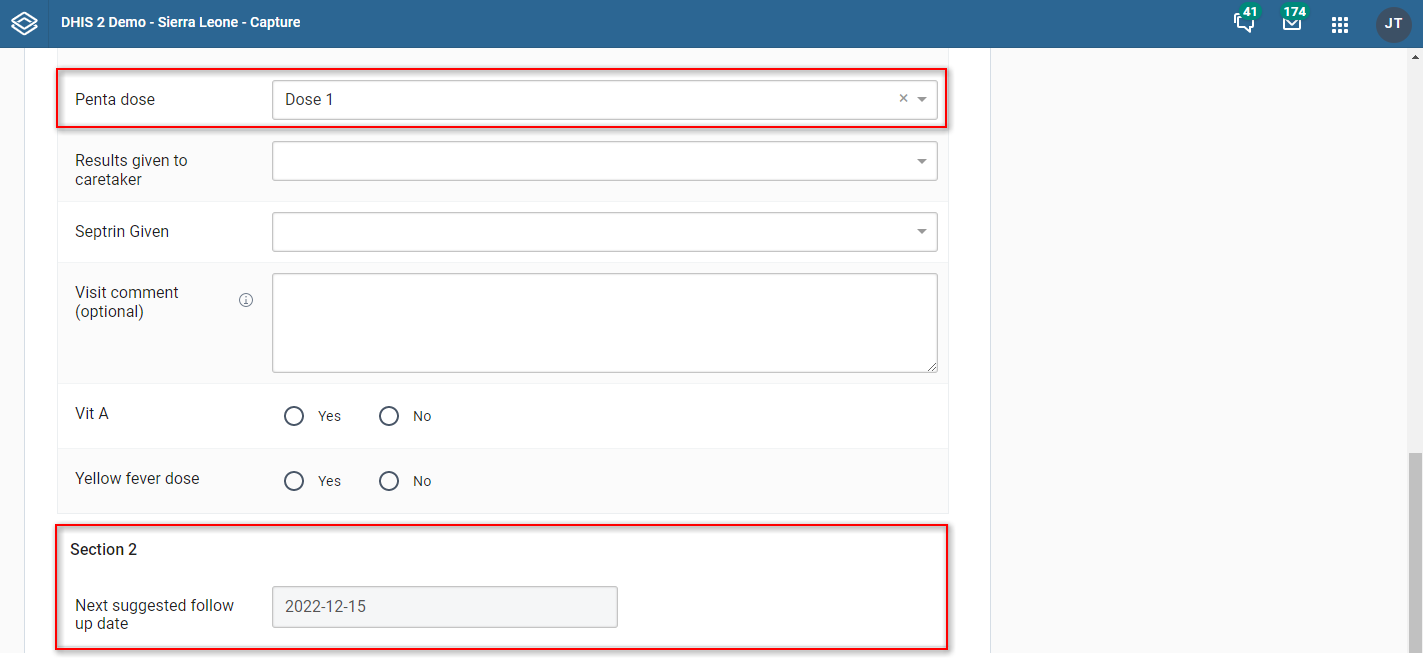
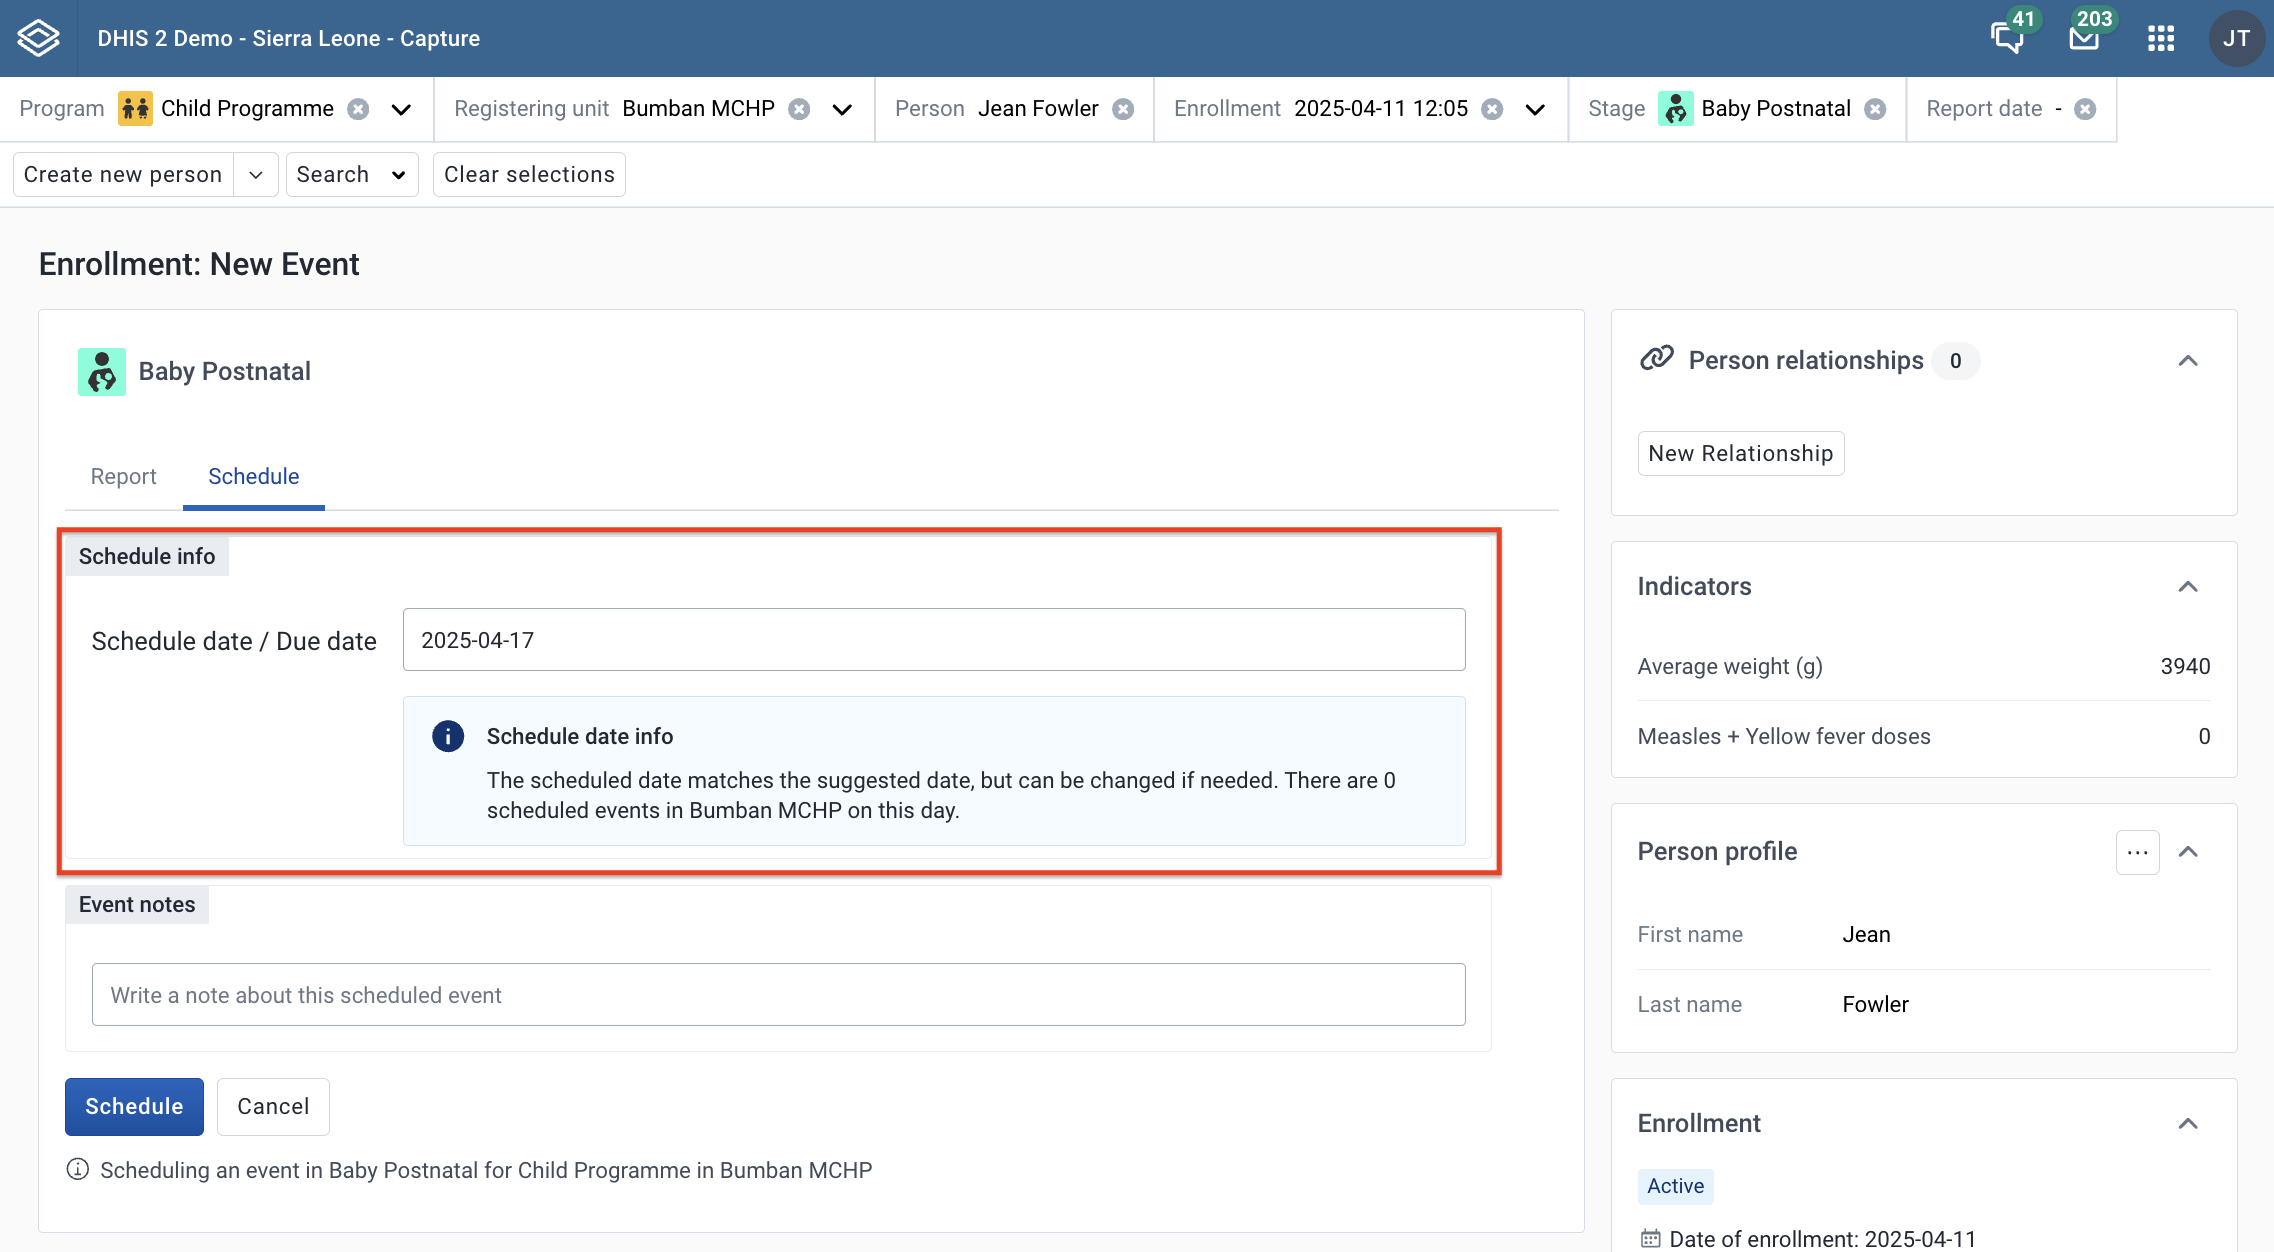
User can also find more information about how many events that scheduled on the same selected date or the interval of selected date and the suggested date from the information box.
Below the schedule date entry, user can choose to add a note to the scheduled event.
After clicking Schedule button, user will be navigated back to enrollment overview page.
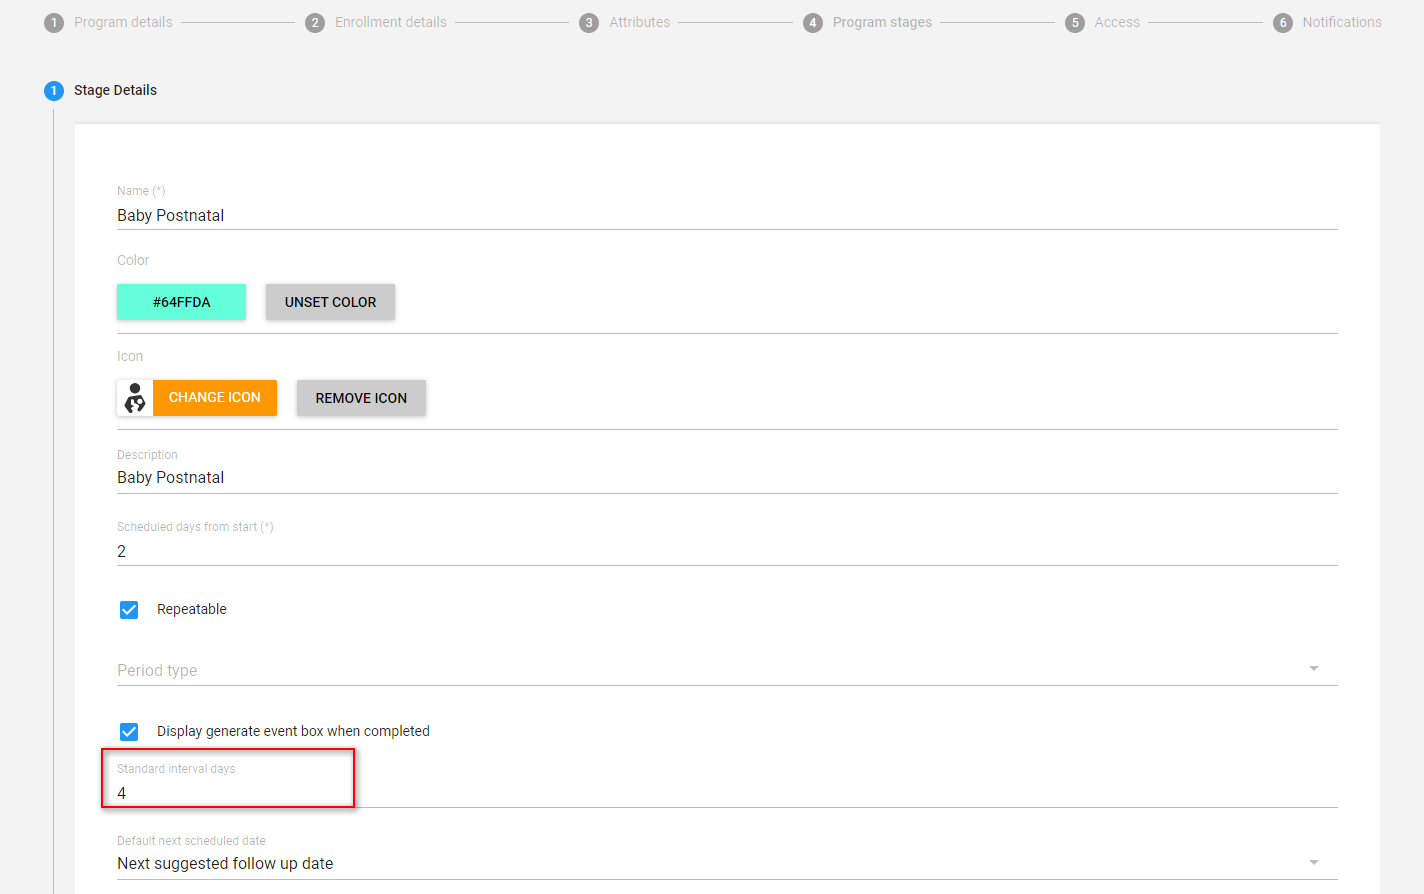
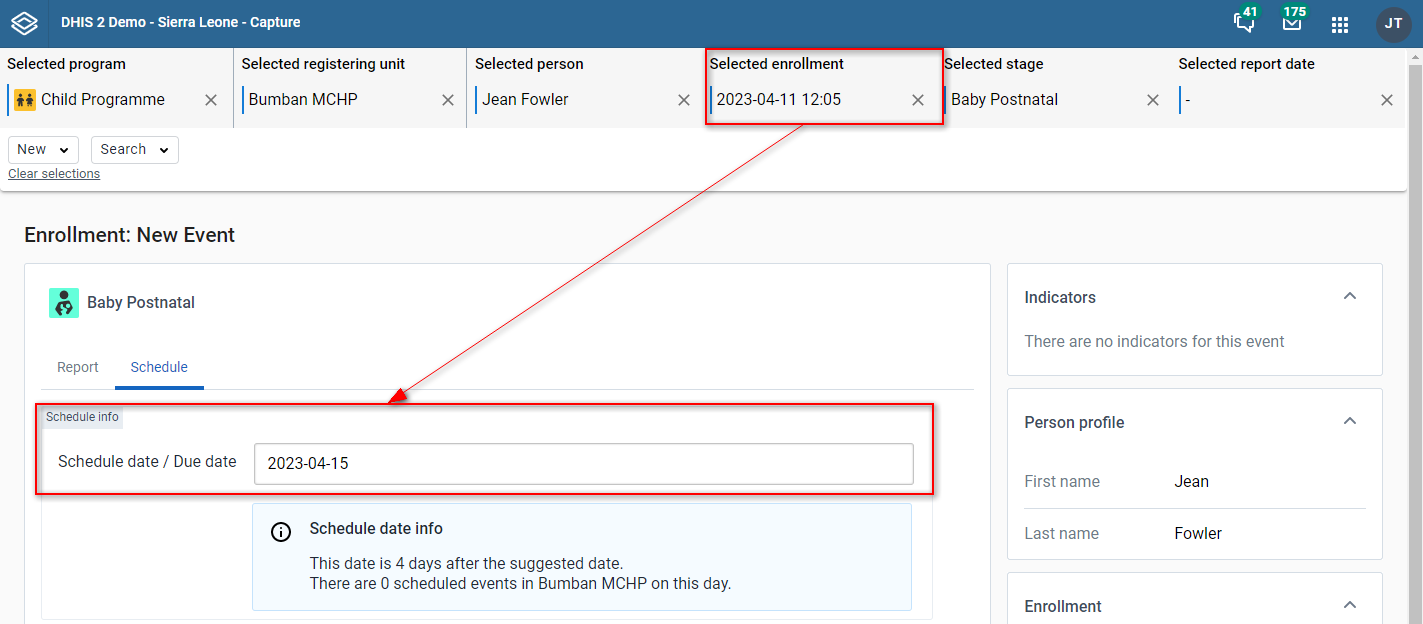

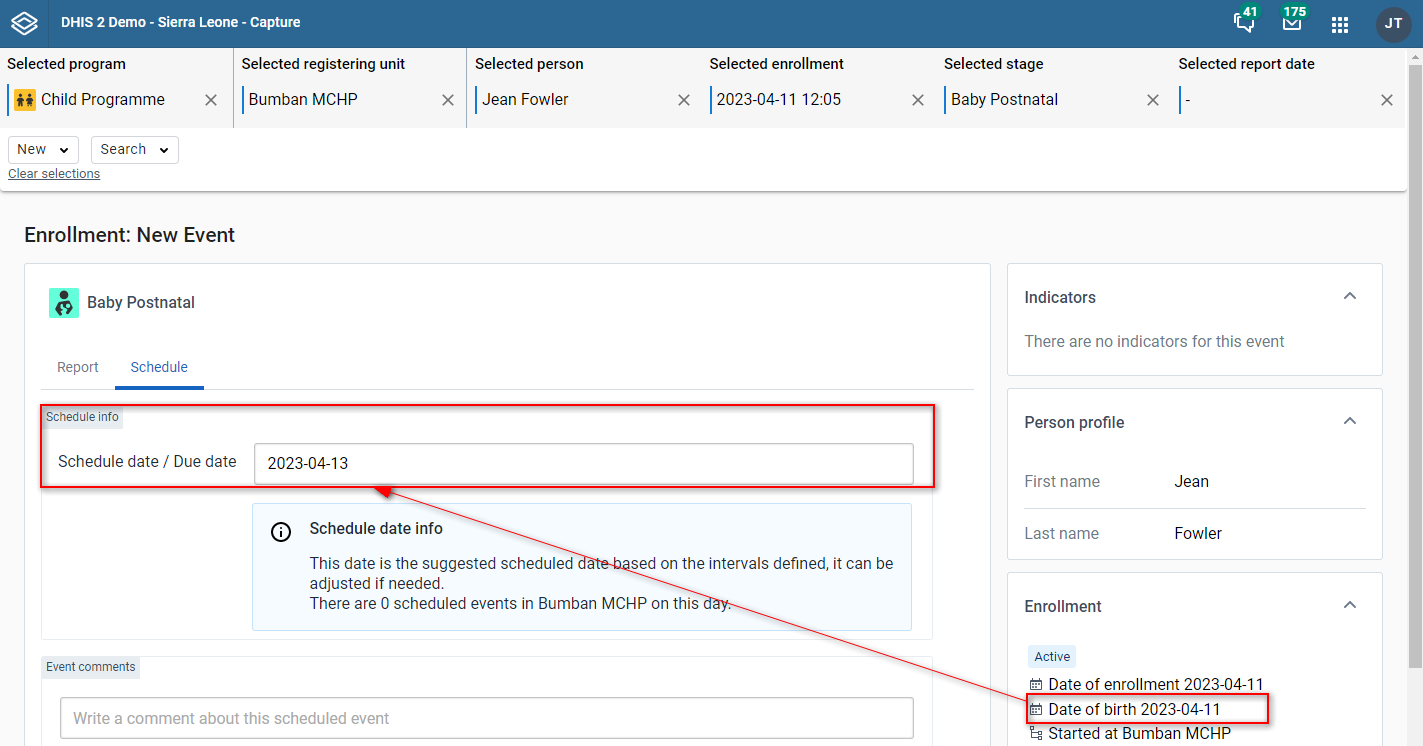
You can reach the program stage event list by clicking Go to full {stage event name} button in the overview page.
In this view you can see all events in a stage
In the header, you can see the stage name and icon

You can add segregation to your Tracker event data using attribute option combos. To get started, add a category combination to your Tracker program configuration.
The attribute option combo selector will be displayed when you are adding or changing/viewing Tracker events. Additionally, the selector will be displayed when enrolling if events are being auto-generated as part of the enrollment process.
Example from new Tracker event:
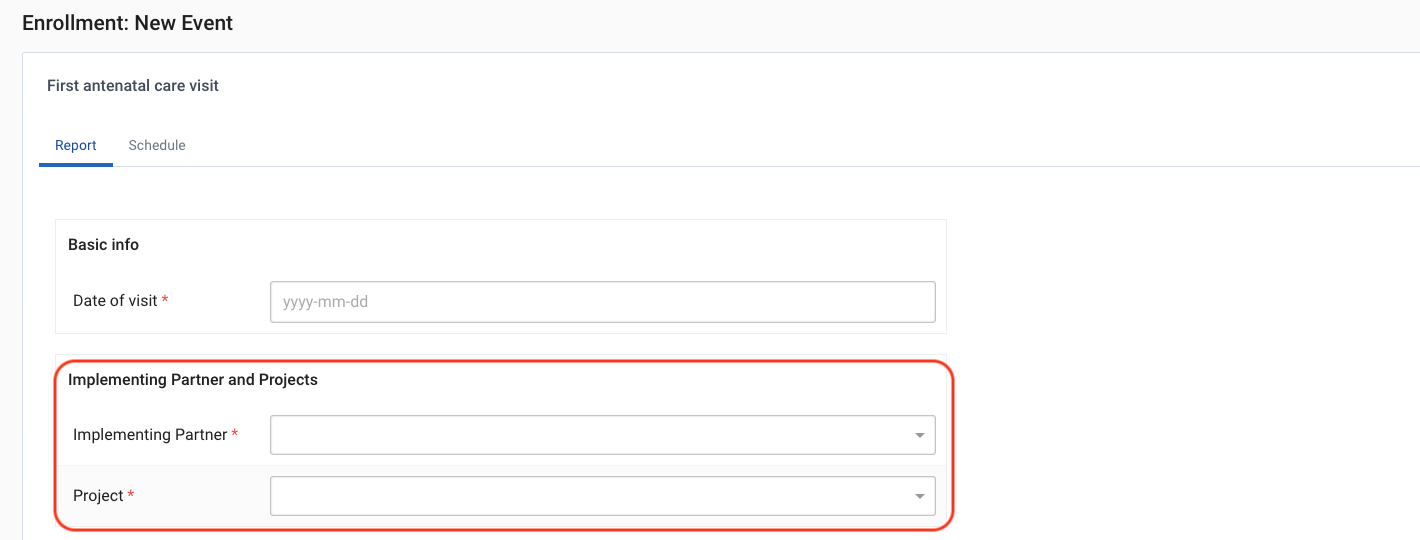
The Changelog feature provides a historical record of changes made to data for both events and Tracked Entities. Every time data is added, modified, or deleted, a record is stored in the changelog.
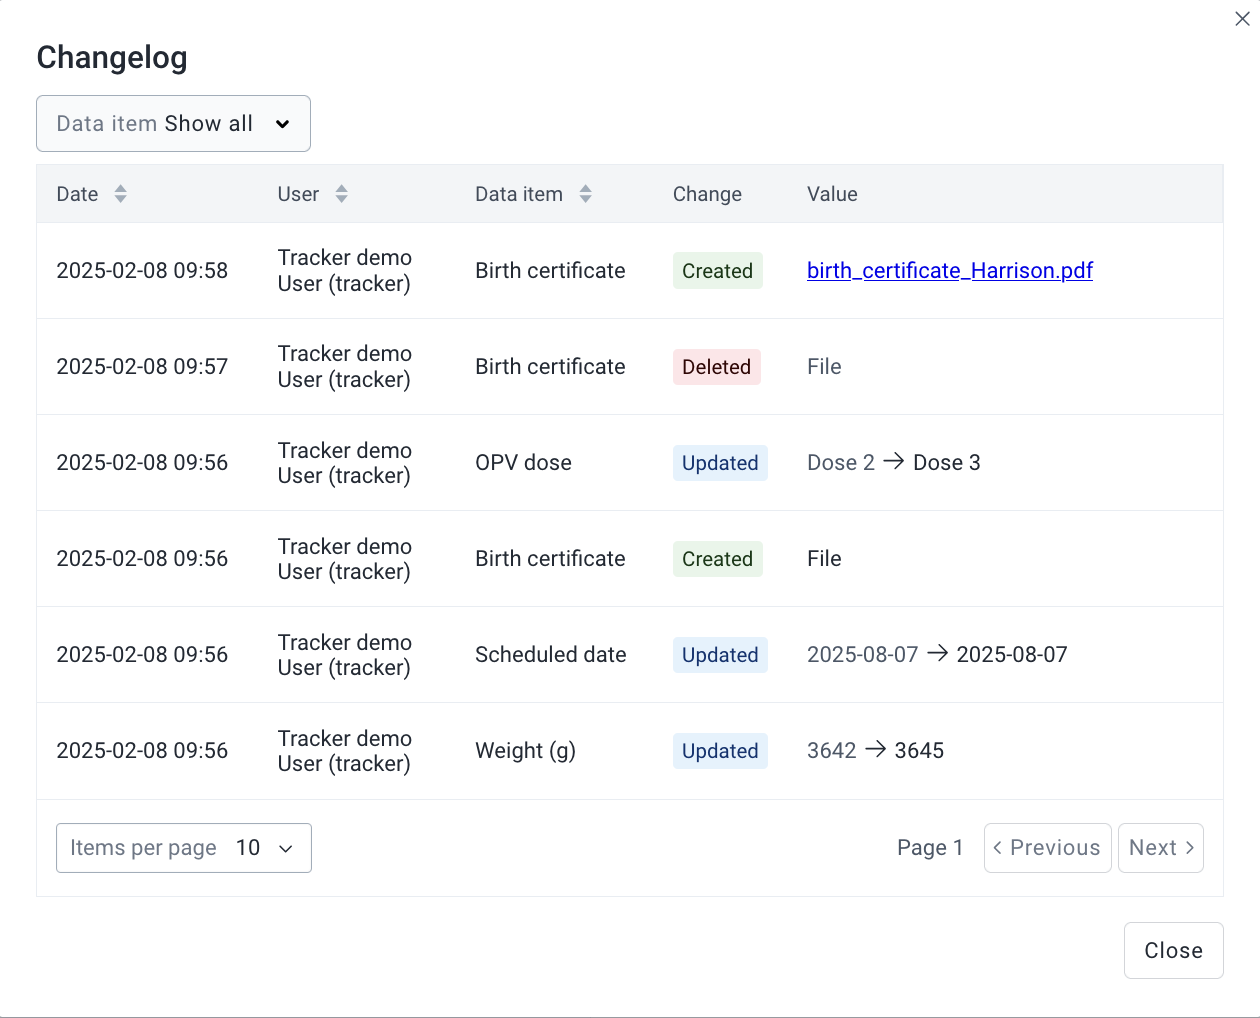
Sorting: Clicking the sorting icon next to a column header toggles between default, ascending, and descending order. By default, records are sorted by date (newest first). Sorting by user or data item is also available, but you can only apply one sorting option at a time.
Filtering: You can filter by a specific data item. You can only apply one filter at a time.
Note:
All data items are displayed in the filter dropdown, regardless of whether they have a changelog record.
Pagination: Displays 10 records per page by default, with options to adjust the number of records shown, up to 100 per page.
The Event Changelog tracks changes to data items within an event. These data items include event properties (e.g., report date, scheduled date, and geometry) and data elements.
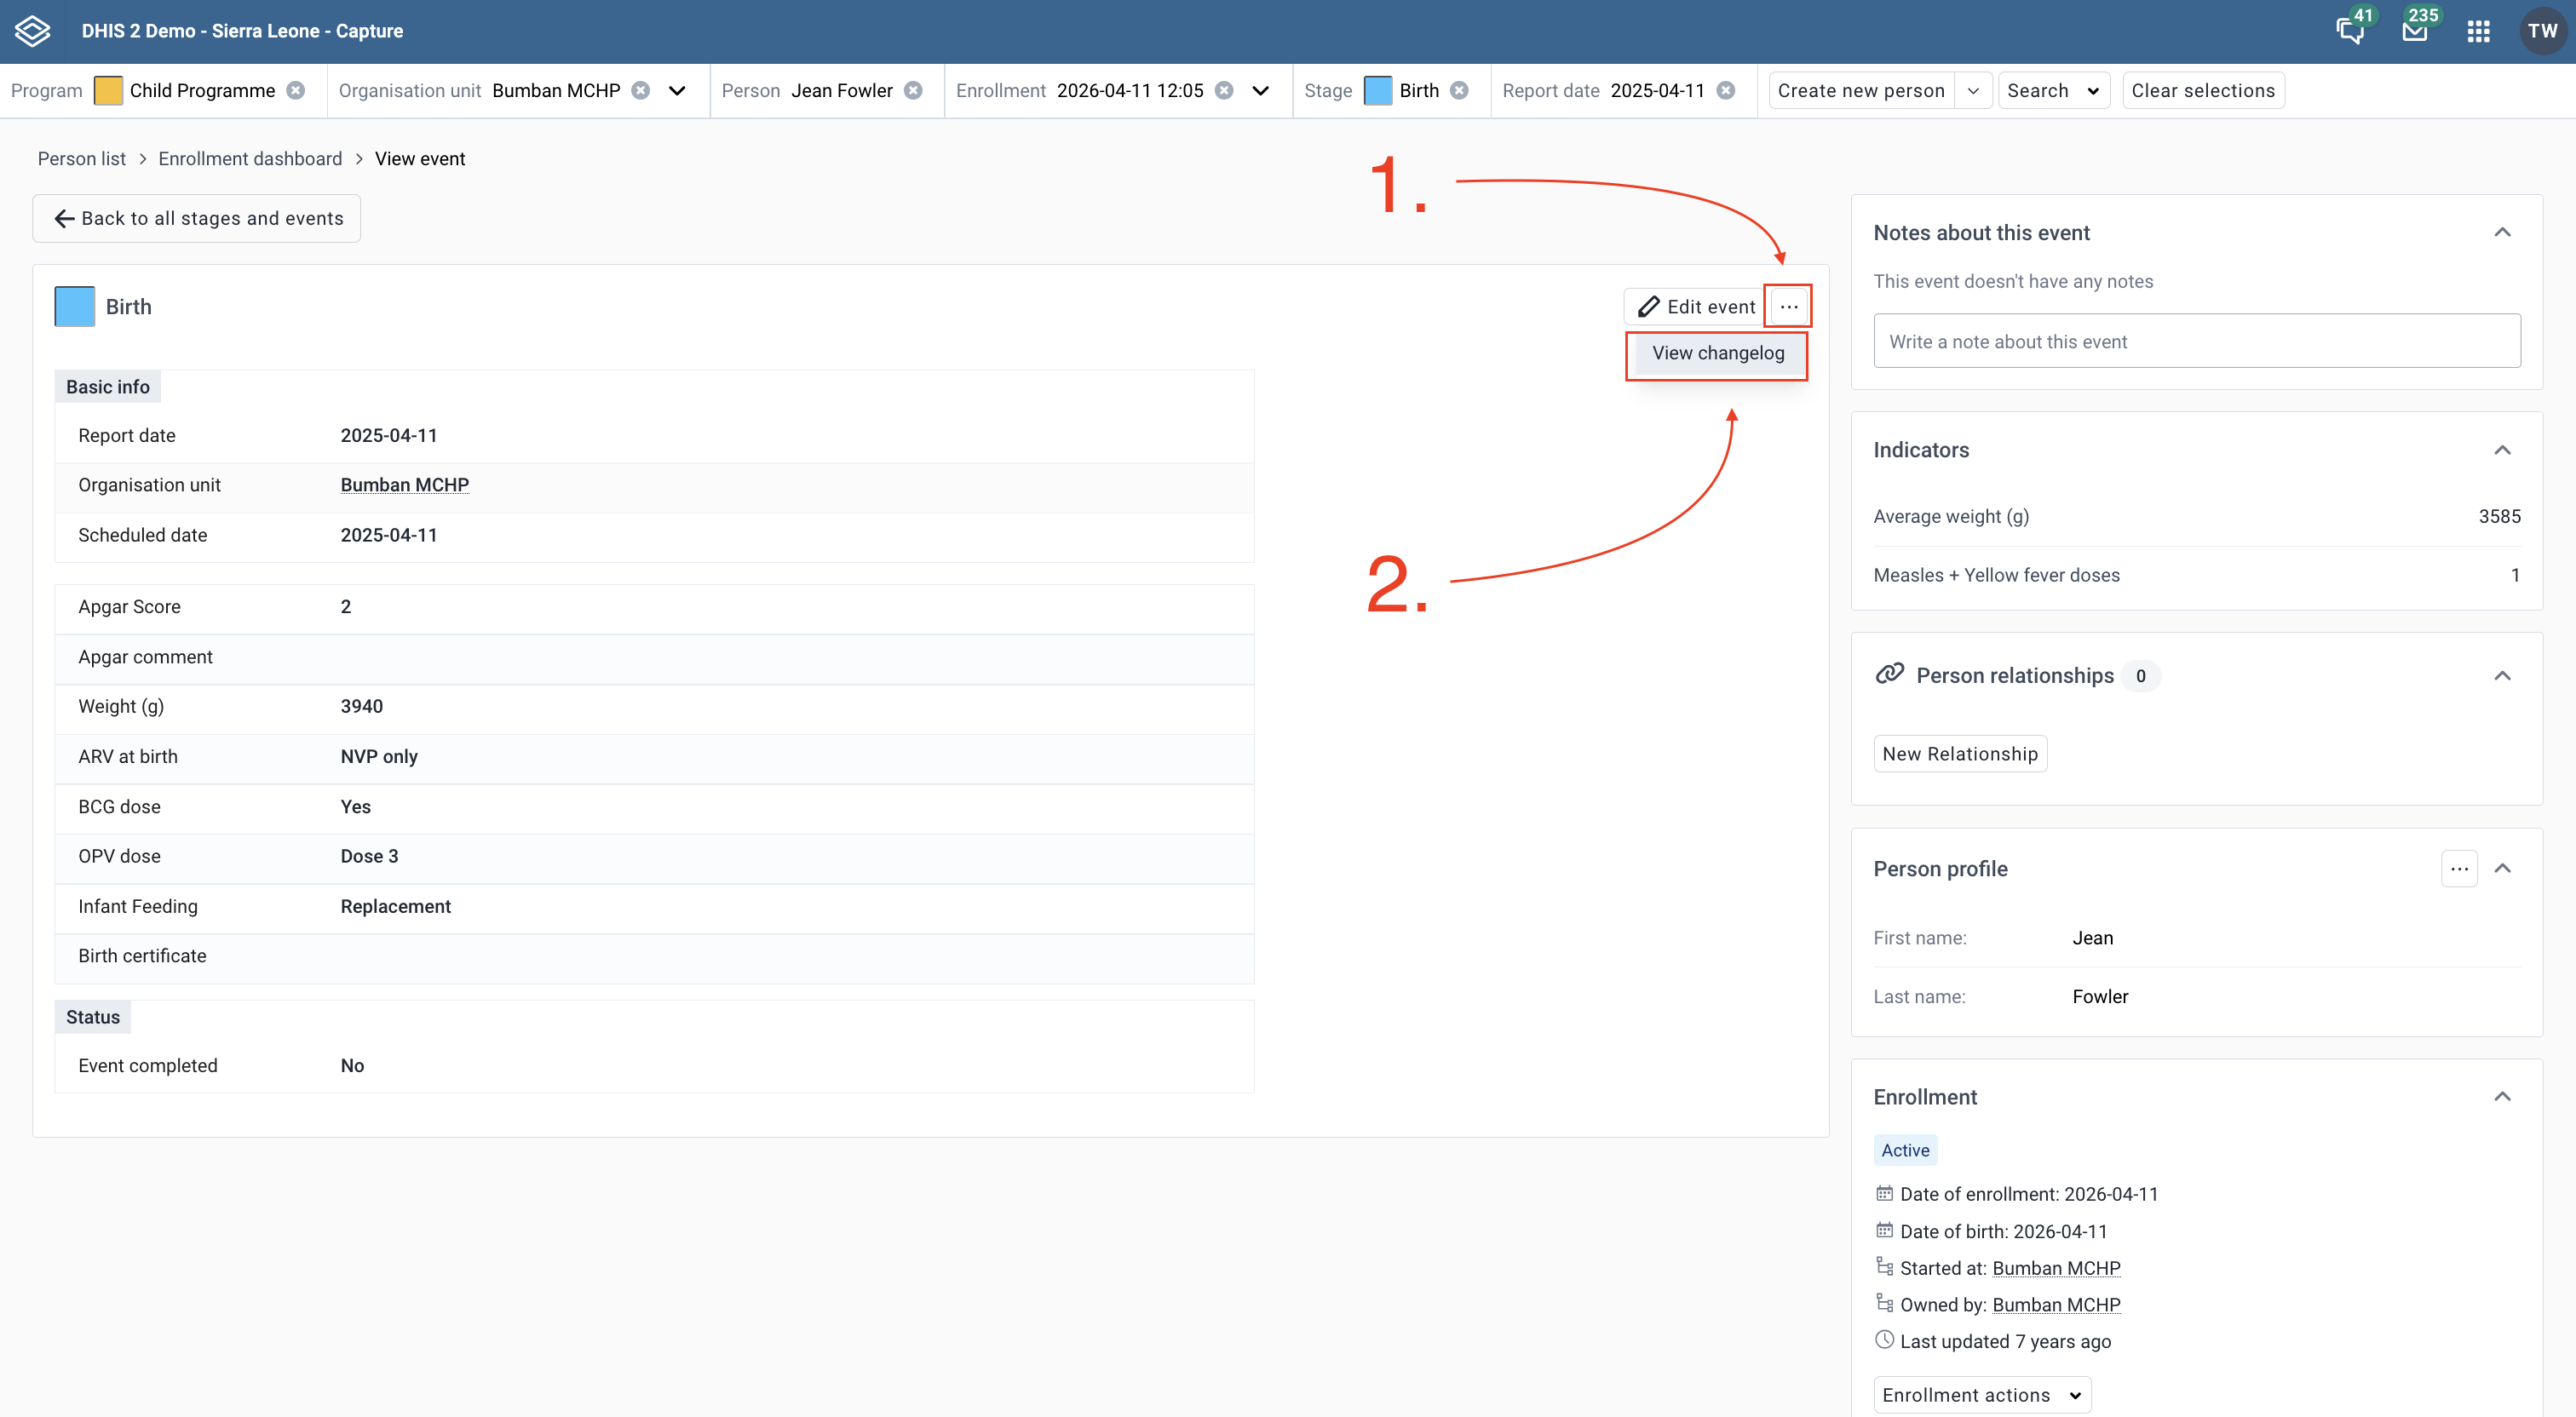
The tracked entity changelog tracks changes to attributes of a tracked entity within an enrollment.
Go to the Maintenance app and enable the Tracked Entity Instance Audit Log. 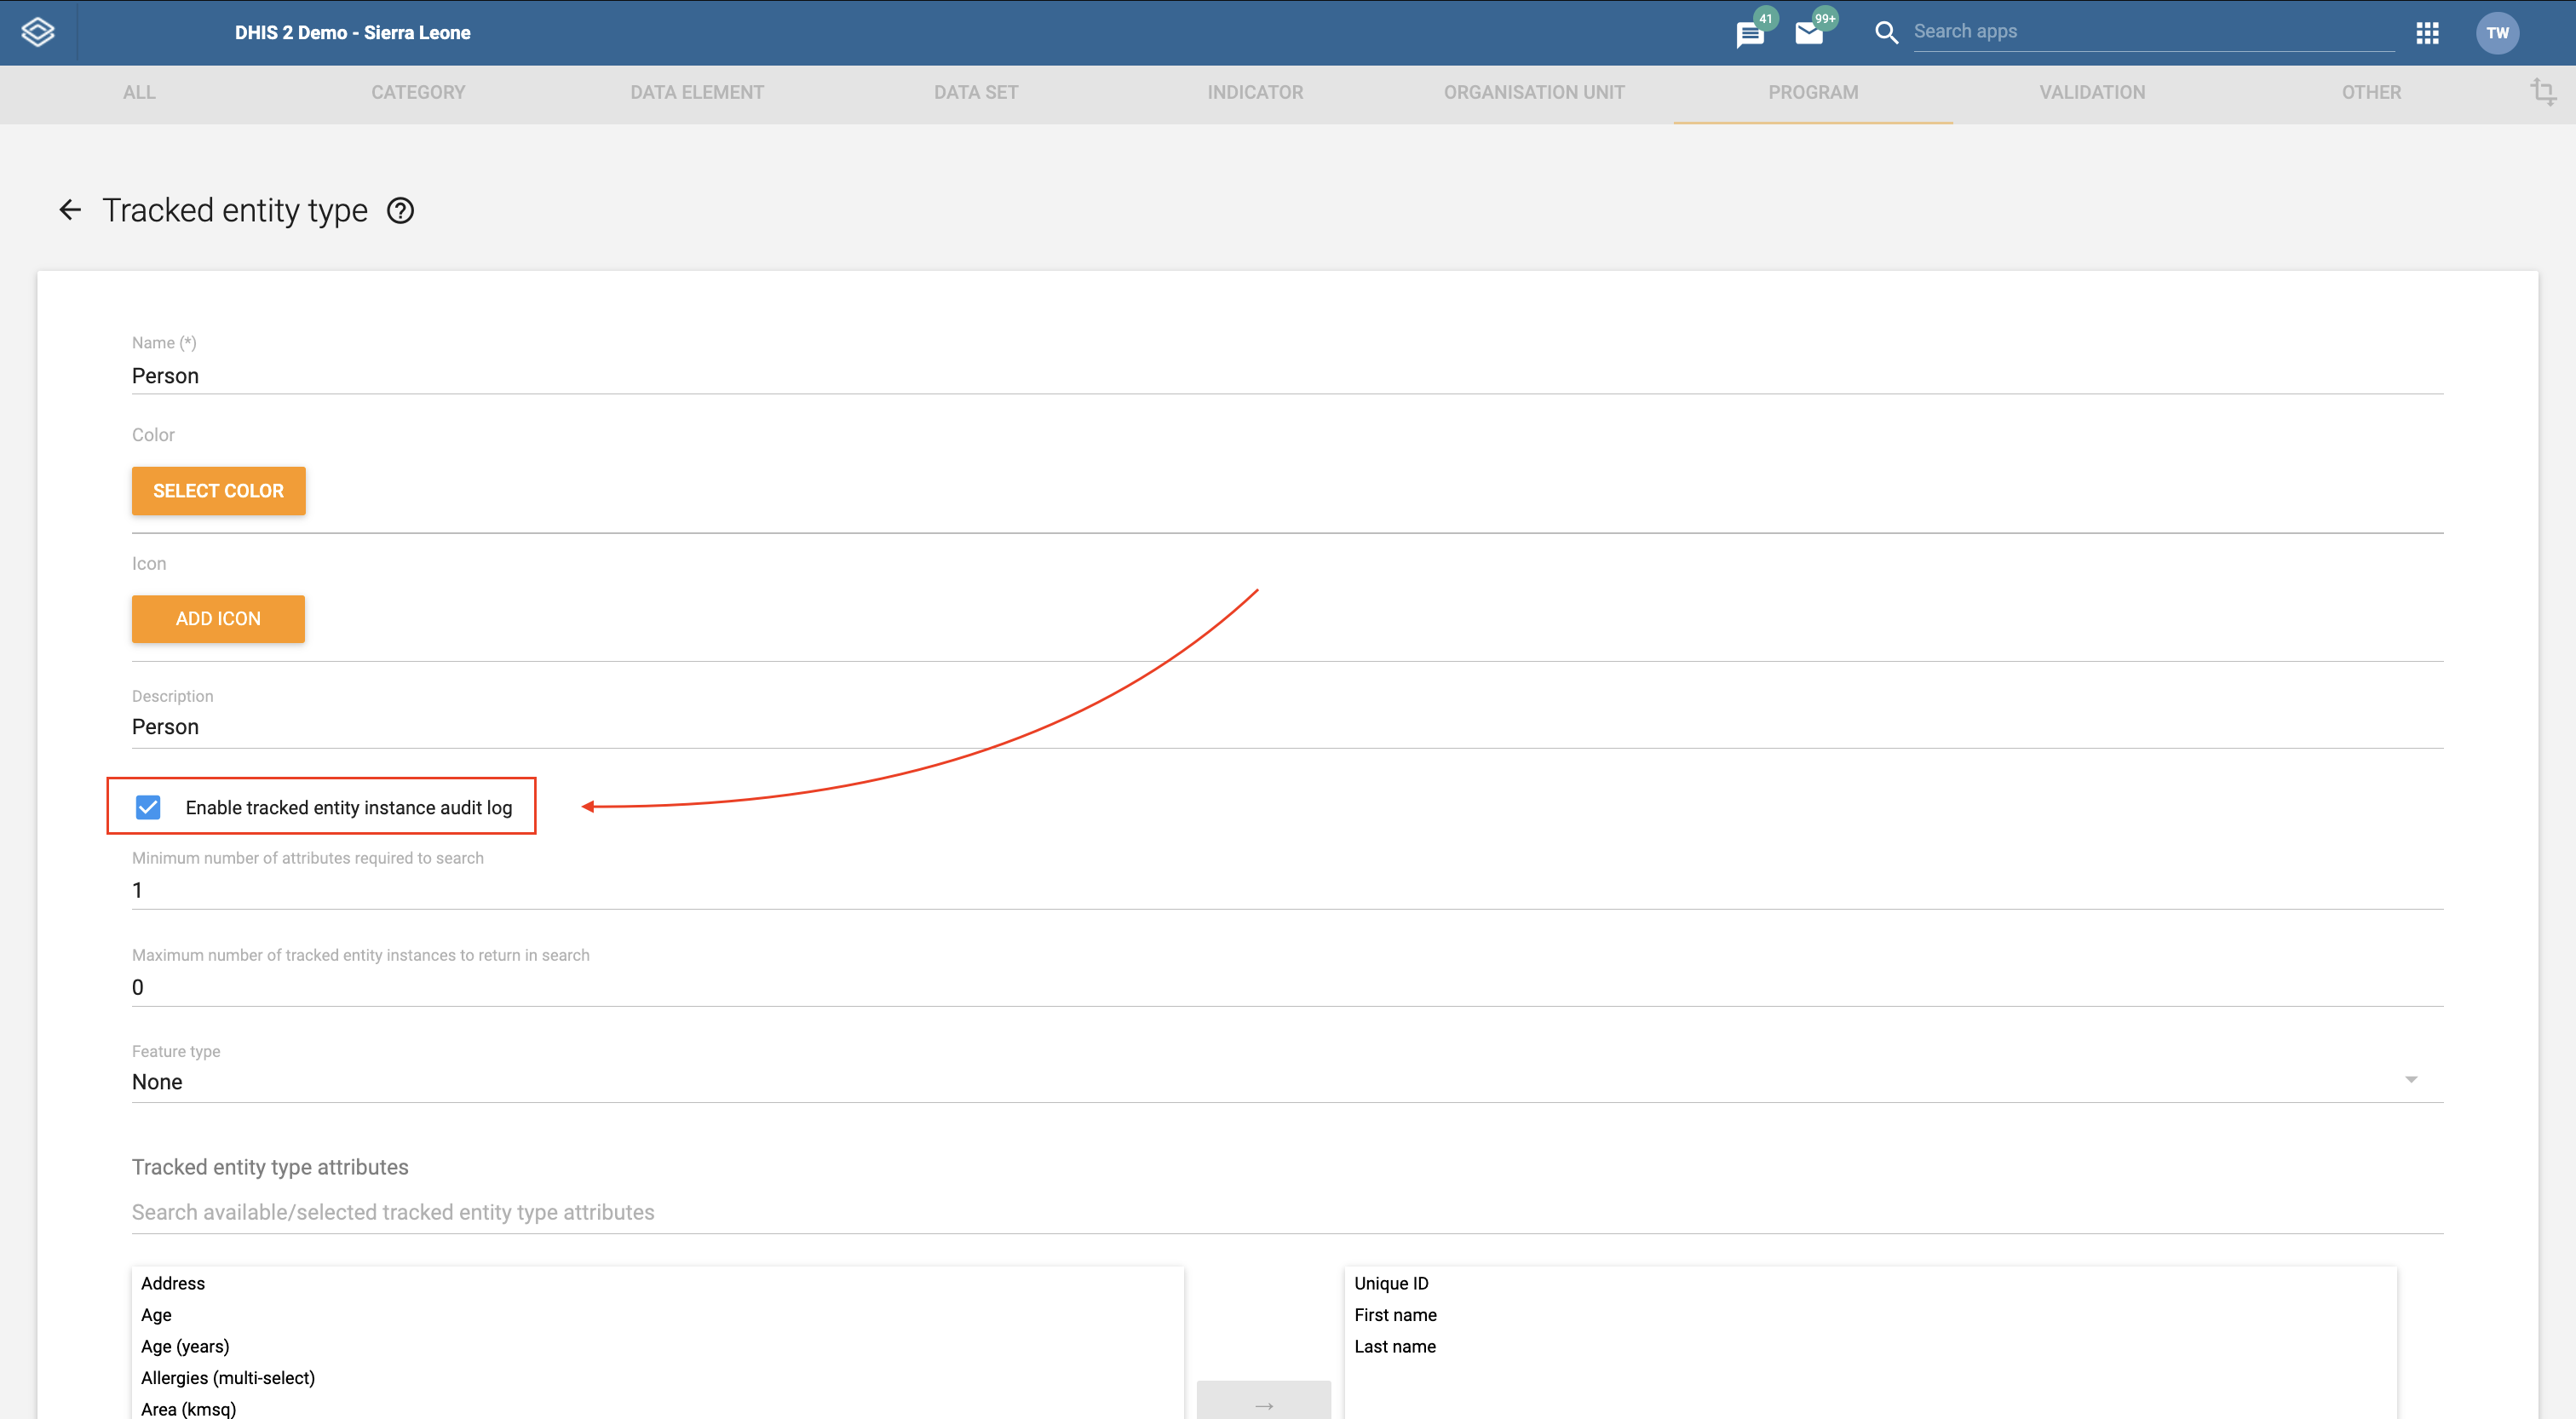
Open the enrollment dashboard in the Capture app.
Click View Changelog in the Tracked Entity Profile widget to open the changelog. 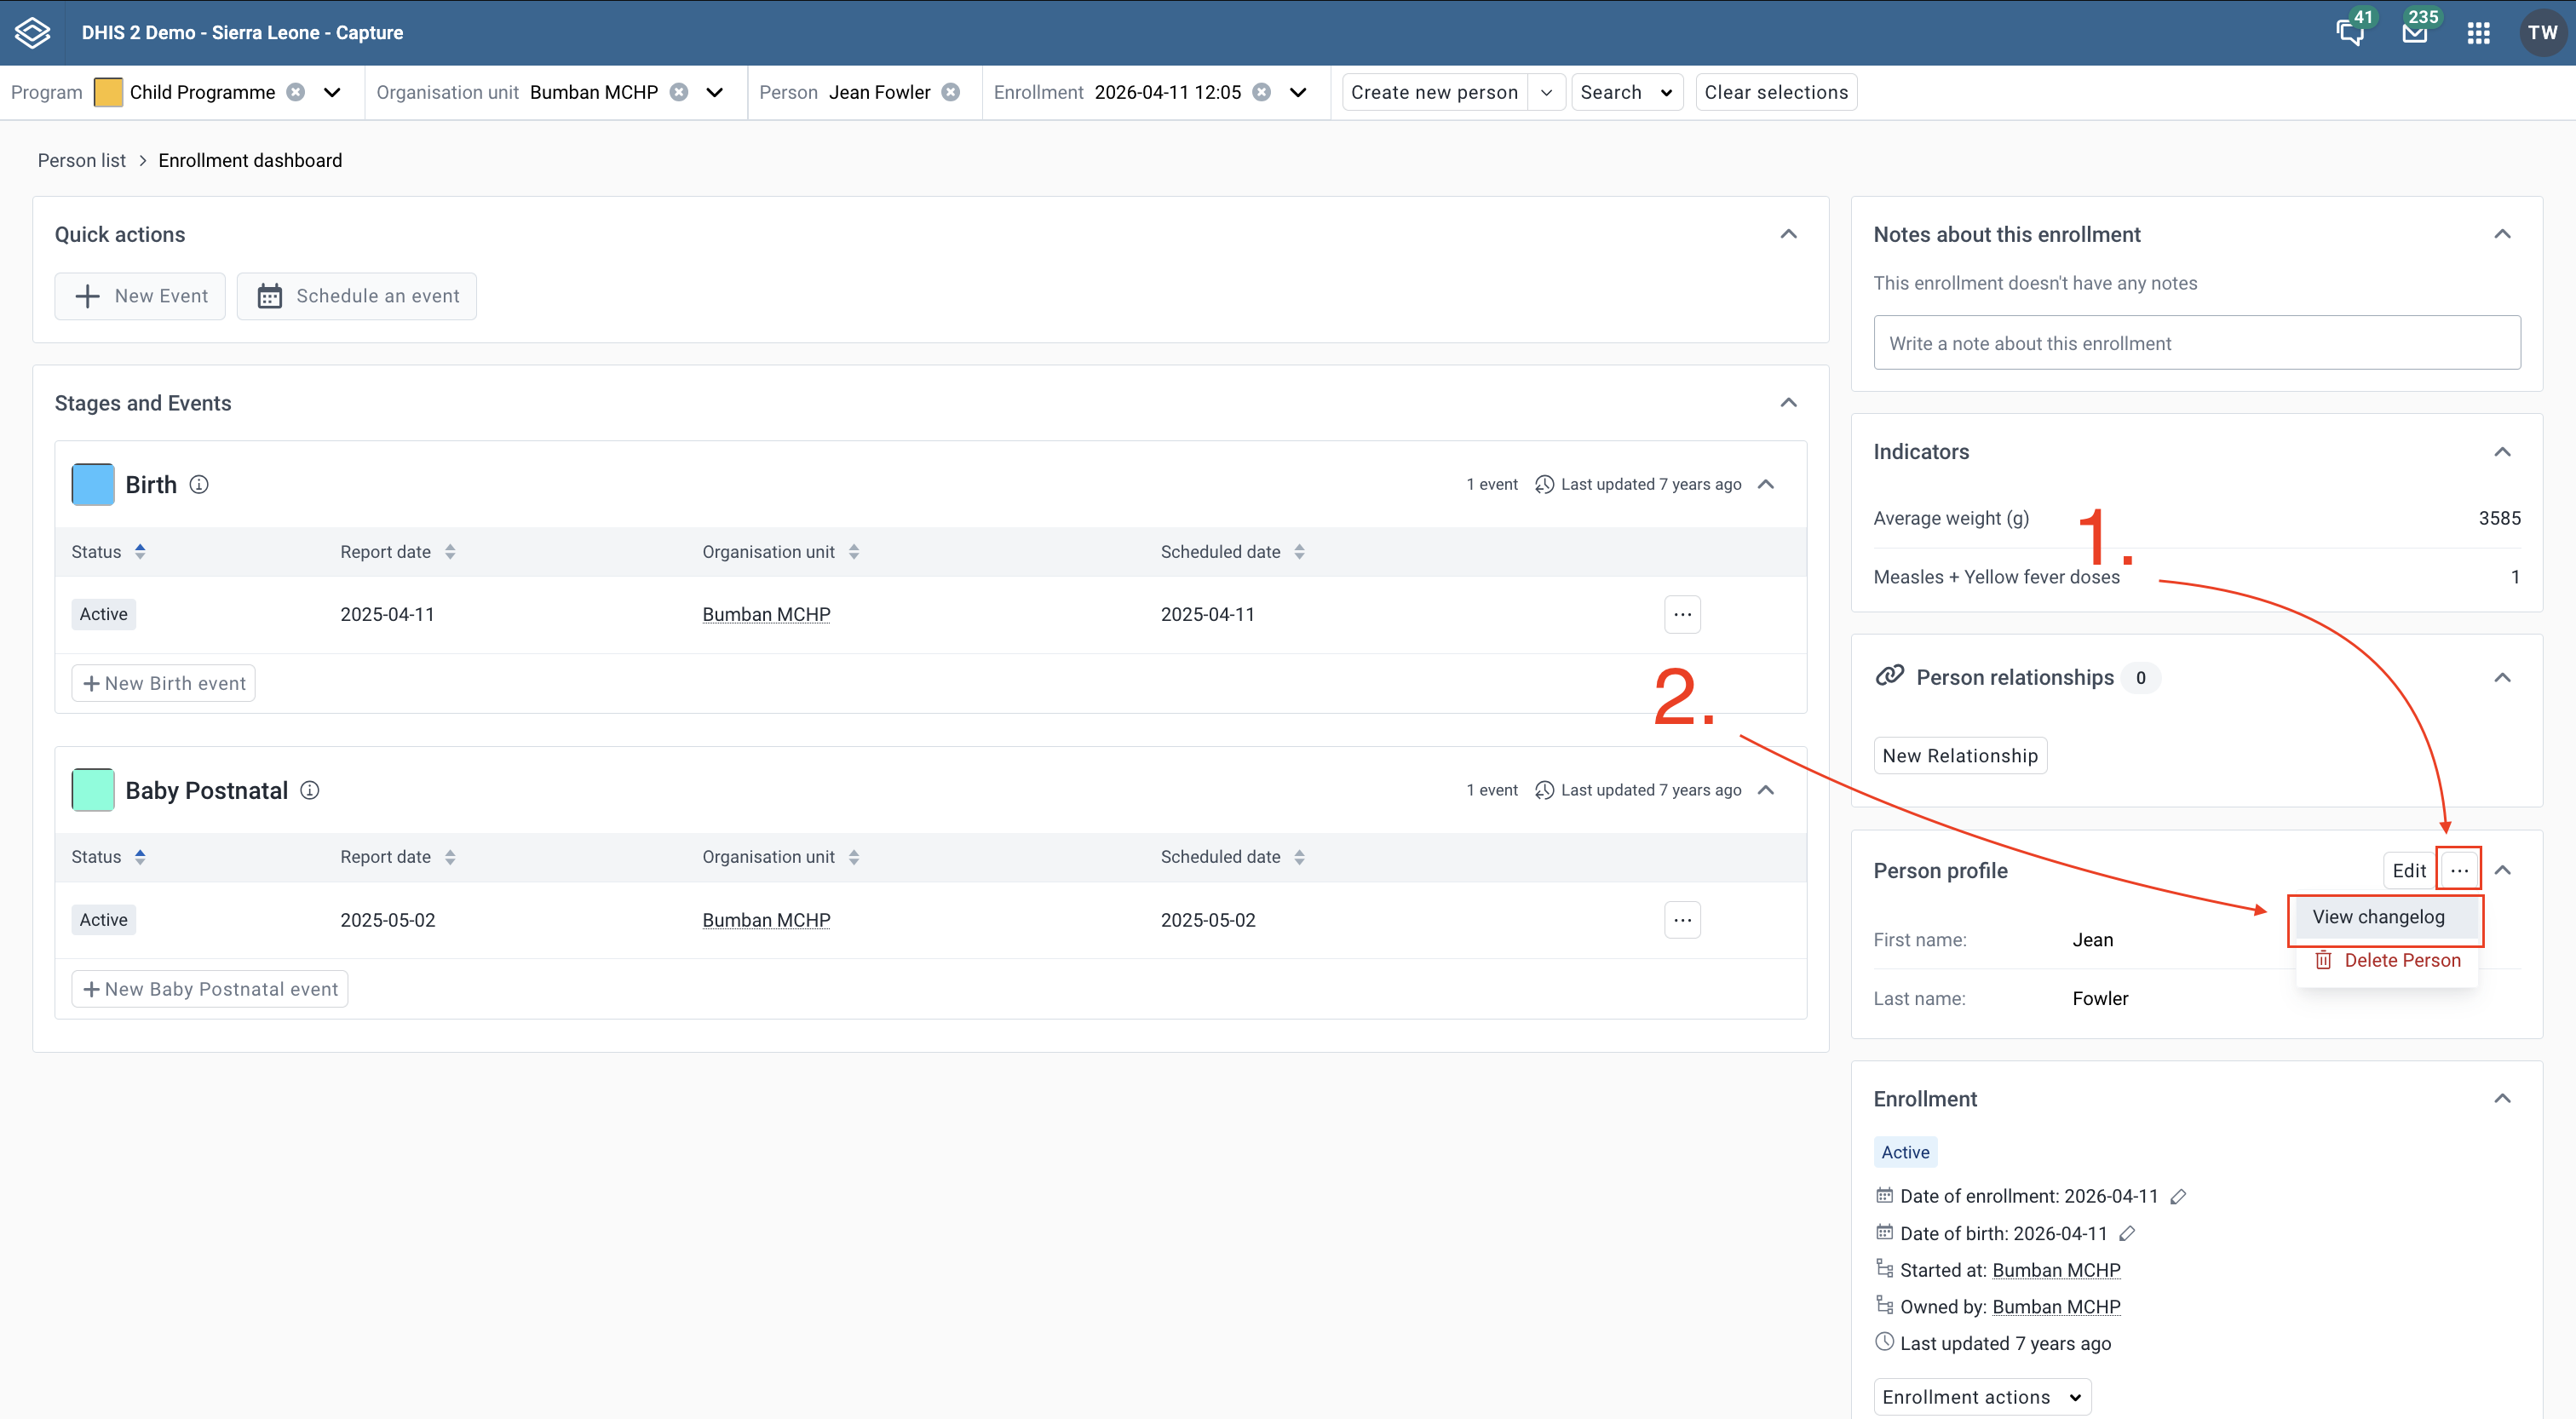
You can connect any two program stages via a relationship. To enable this feature, you can set up two program stages in the same program and link them with an event-event relationship. 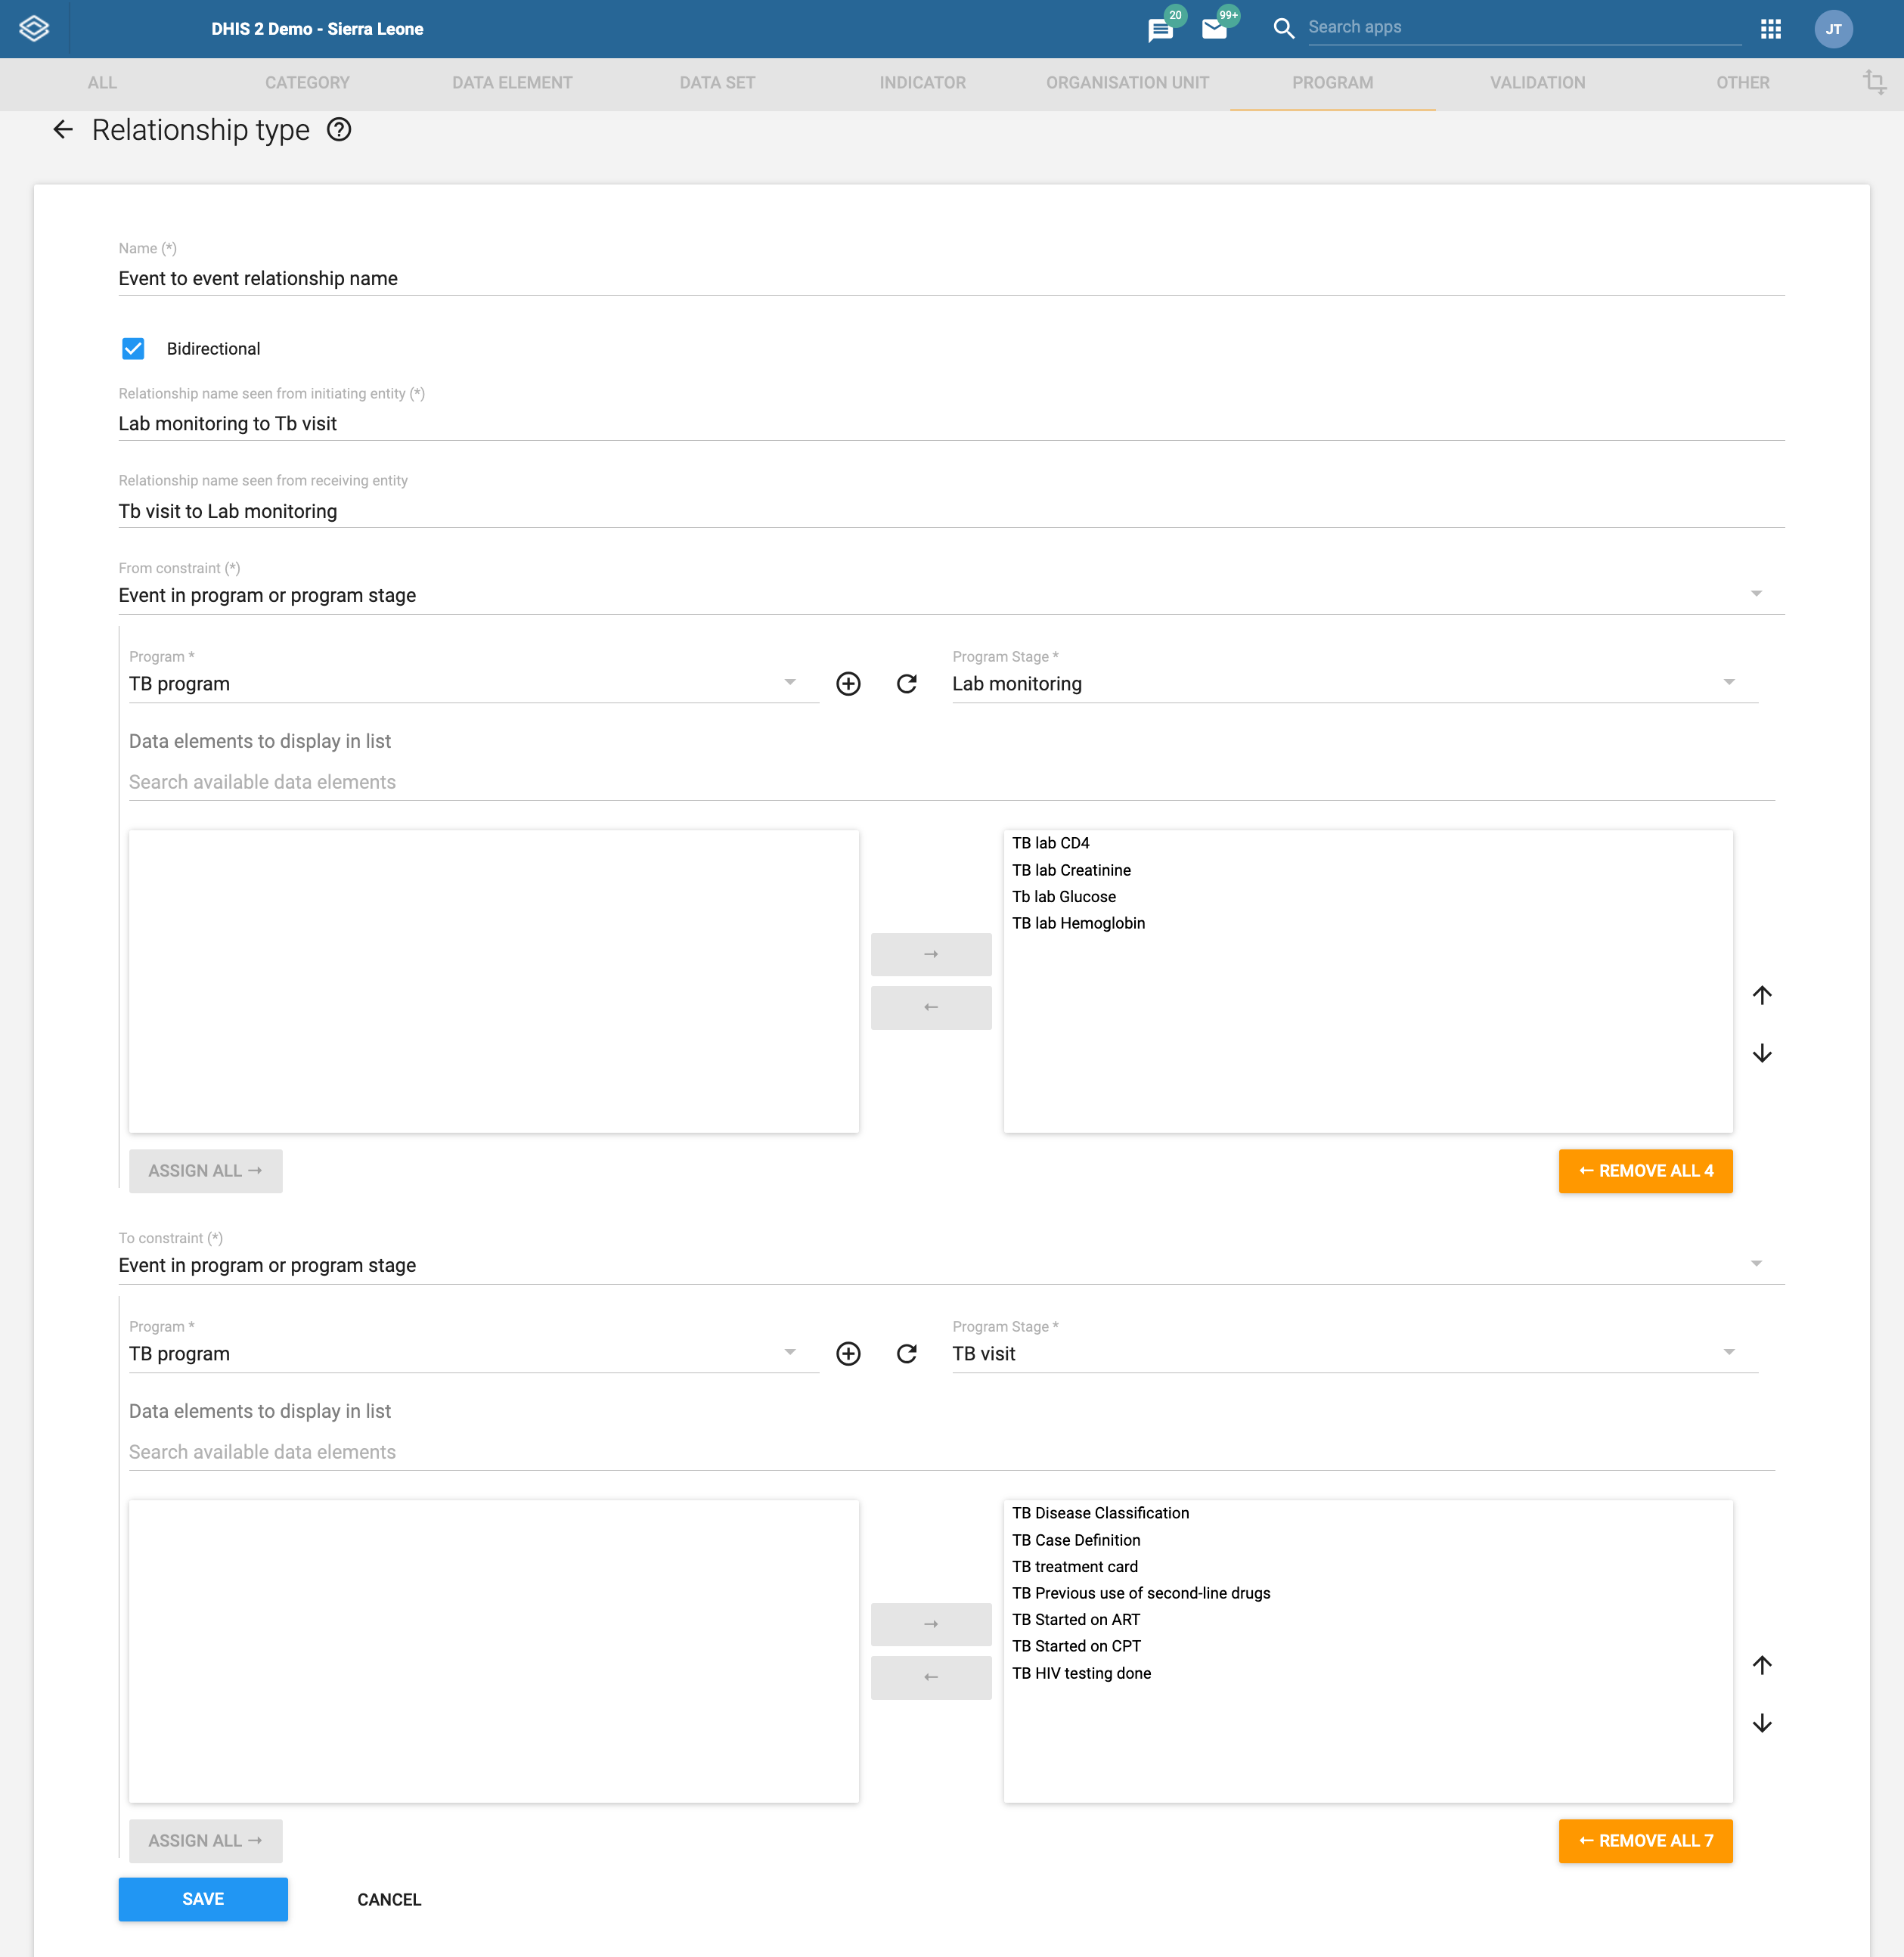
When opening the new event form, a widget called Actions - ${Relationship type name} will appear at the bottom of the page. From this widget, users can: 1. Schedule a new event by selecting a scheduled date and an organisation unit 2. Enter data for the linked event directly 3. Link to an already existing event.
When clicking Complete or Save without completing, the Capture app will create the current event, schedule the linked event and make sure that there is a relationship between them in the correct context. 
If the event is eligible for related stages but isn’t linked yet, a widget called Linked event will appear at the bottom of the page. From this widget, users can: 1. Schedule a new event by selecting a scheduled date and an organisation unit 2. Enter data for the linked event directly 3. Link to an already existing event.
The label of the action button will change based on the user's selections. When clicking Complete or Save without completing, the Capture app will create the current event, schedule the linked event and make sure that there is a relationship between them in the correct context. 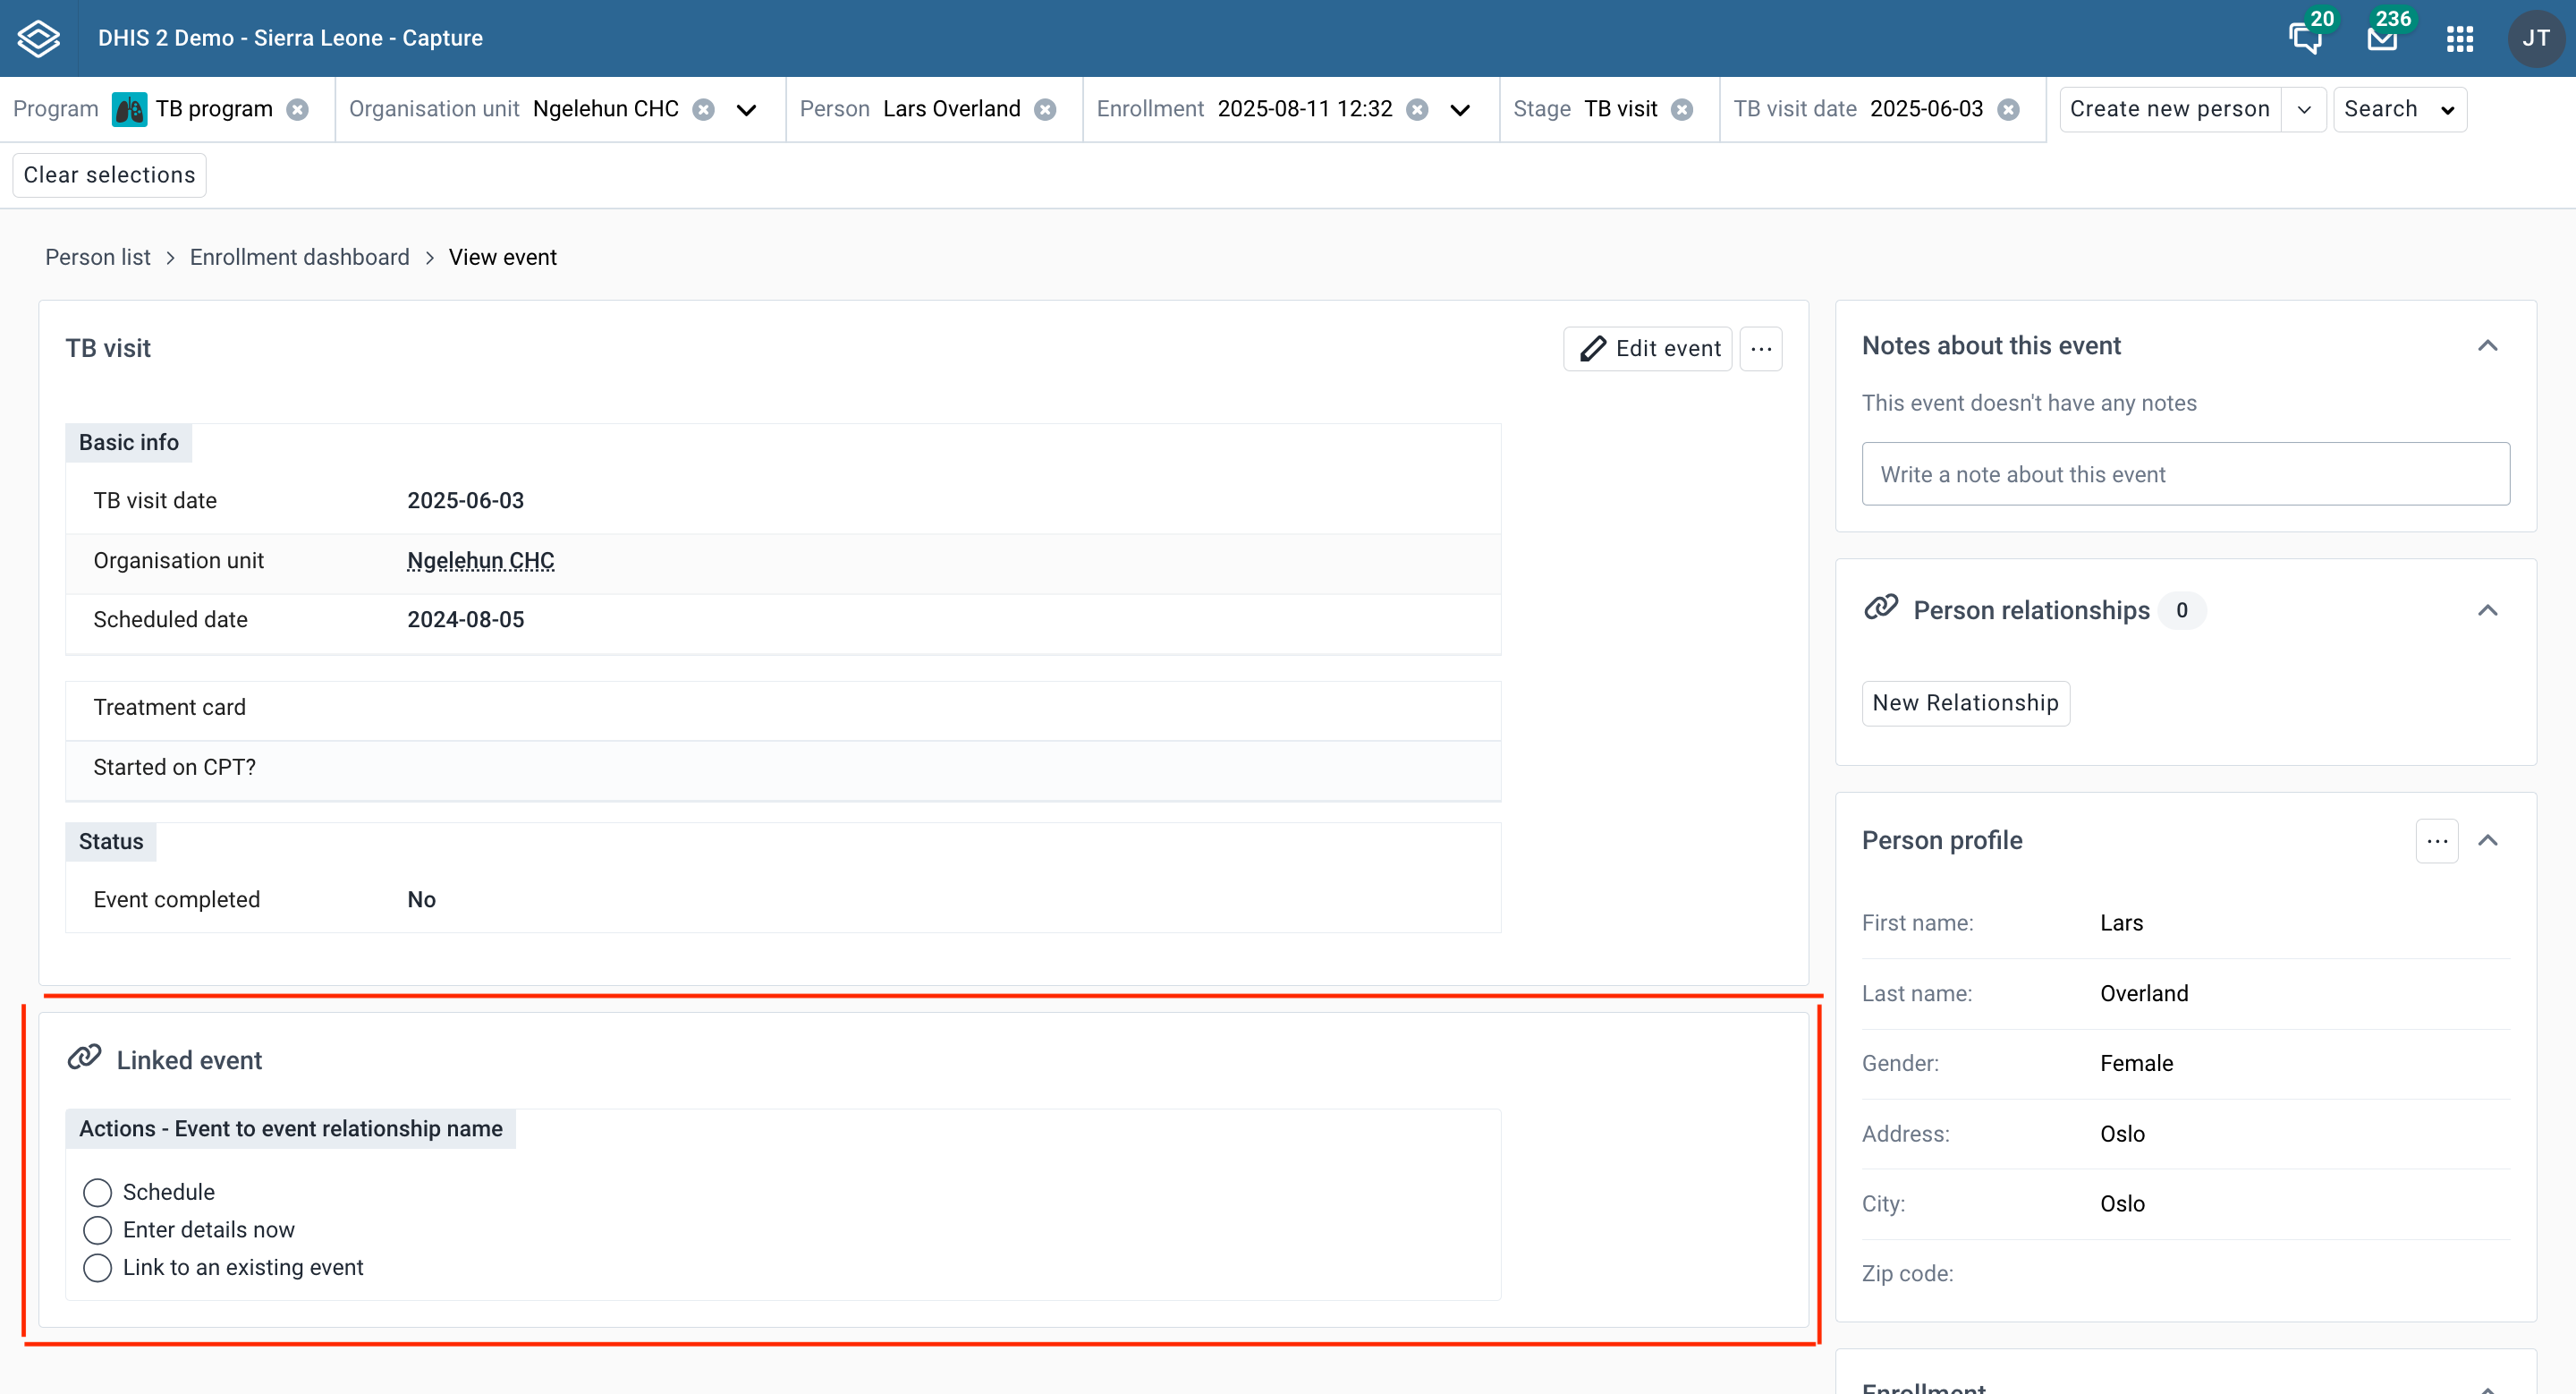
If the event is already linked, a Linked Event widget will appear at the top of the page. This widget allows users to view details of the linked event. 
Additionally, by clicking the Menu in the top-right corner, users can: 1. Unlink the linked event. 2. Unlink and delete the linked event. 
Enable the "First stage appears on registration page" flag in the Maintenance for the Tracker program. When opening the form to enroll a new tracked entity, a widget called Actions - ${Relationship type name} will appear at the bottom of the page. From this widget, users can: 1. Schedule a new event by selecting a scheduled date and an organisation unit 2. Enter data for the linked event directly
When clicking Save, the Capture app will enroll the tracked entity, create the event in the first stage, schedule the linked event and make sure that there is a relationship between them in the correct context. 
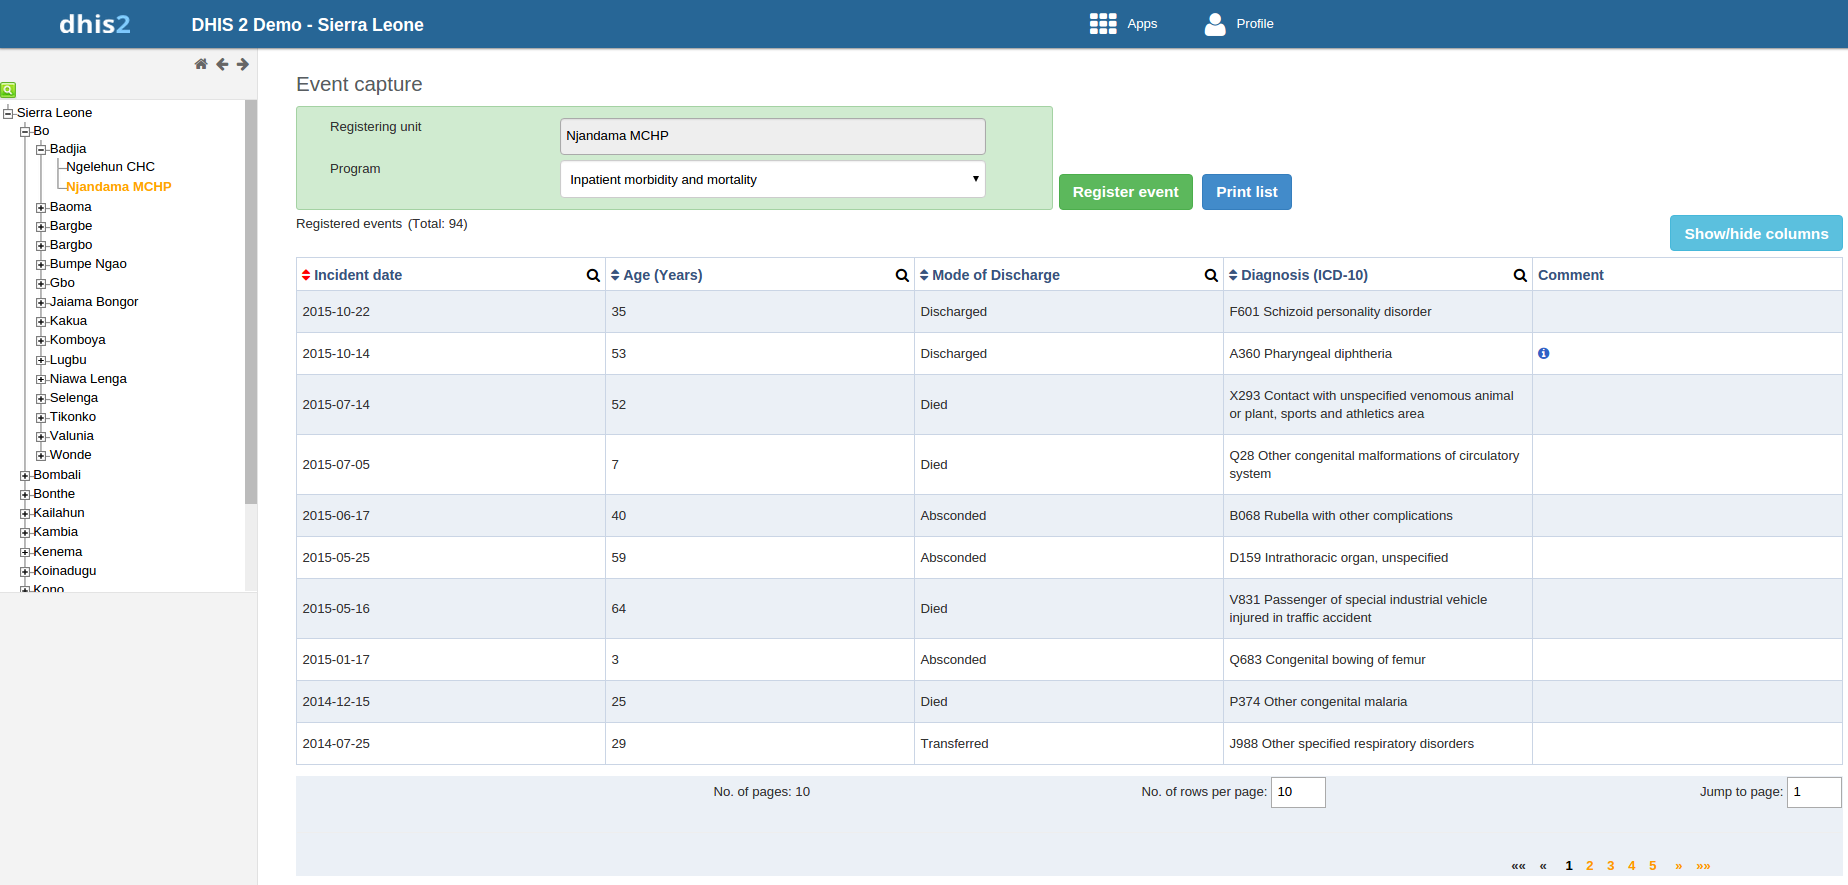
In the Event Capture app you register events that occurred at a particular time and place. An event can happen at any given point in time. This stands in contrast to routine data, which can be captured for predefined, regular intervals. Events are sometimes called cases or records. In DHIS2, events are linked to a program. The Event Capture app lets you select the organisation unit and program and specify a date when a event happened, before entering information for the event.
The Event Capture app works online and offline. If the Internet connectivity drops, you can continue to capture events. The events will be stored locally in your web browser (client). When connectivity has returned, the system will ask you to upload the locally stored data. The system then sends the data to the server where the data is stored.
Note
If you close the web browser while in offline mode, it is not possible to reopen a new web browser window and continue the working session. However the data will still be saved locally and can be uploaded to the server the next time the machine is online and the you have logged into the server.
You only see programs associated with the organisation unit you've selected and programs you've access to view through your user role.
Both skip-logic and validation error/warning messages are supported during registration.
When you close an organisation unit, you can't register or edit events to this organisation unit in the Event Capture app. You can still view and filter the event list and view the details of an event.
On-the-fly indicator expression evaluation is supported. If a program has indicators defined for it and the moment all values related to the indicator expression are filled, the system will calculate indicator and display the result.
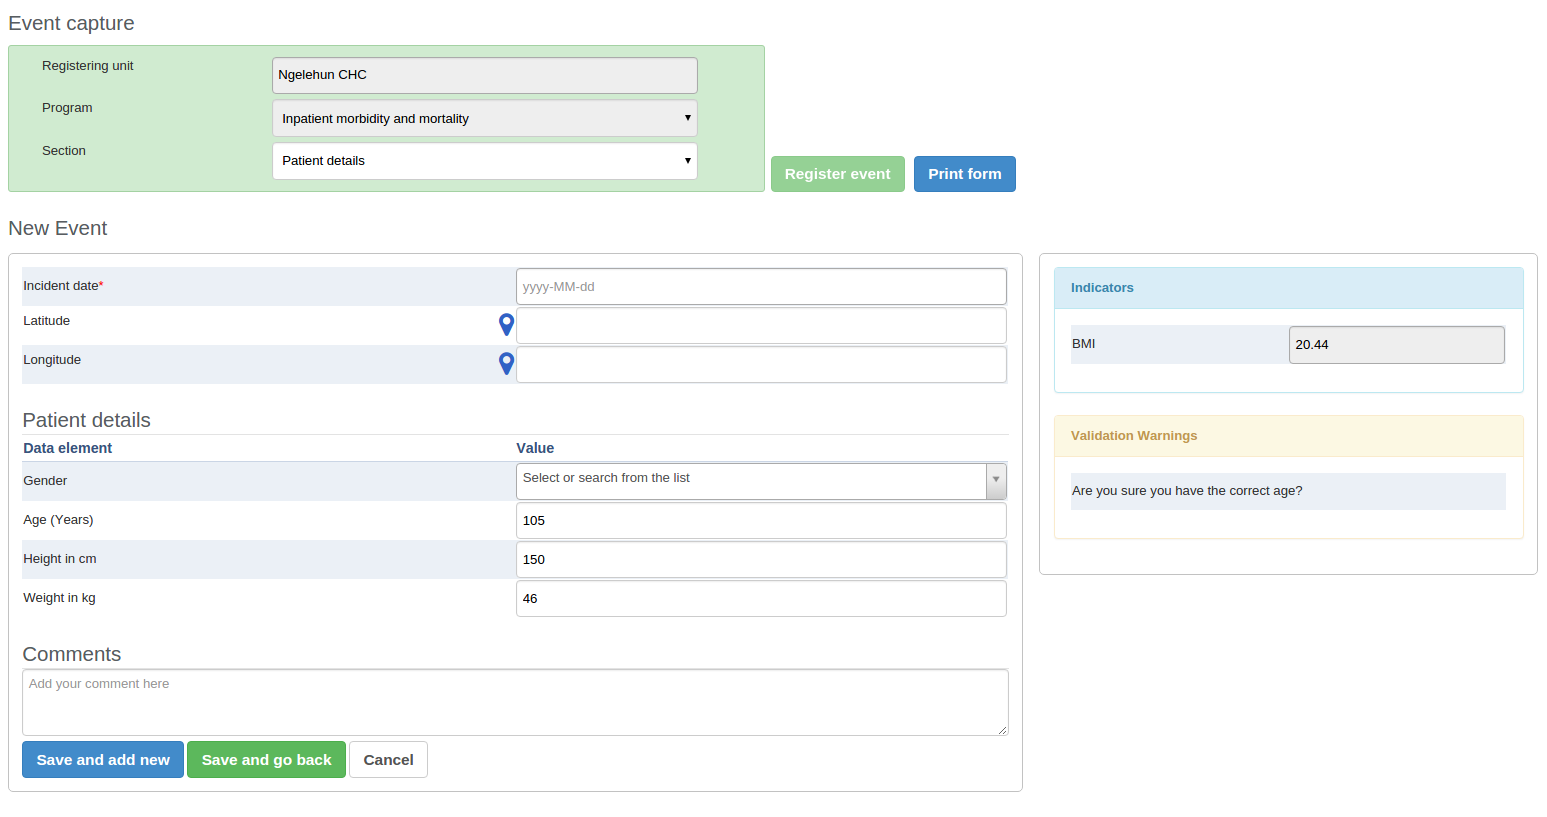
Sorting: this can be done by clicking the sorting icon of each column header. A red sorting icon implies the current sorting column. However, the sorting functionality works only within the page displayed. Currently, it is not possible to do sorting from serverside.
Filtering: this is done by clicking the small search icon shown to the right of each column header. Clicking them provides an input field to type a filtering criteria. The system starts applying the filter the moment a user starts to type. During filtering it is possible to define start and end dates for date type data elements and lower and upper limits for number types. Server side filtering is not-support at the moment.
Open the Event Capture app.
Select an organisation unit.
Select a program.
You'll only see programs associated with the selected organisation unit and programs you've access to through your user role.
Click Register event.
Select a date.
Fill in the required information.
If the program's program stage is configured to capture GPS coordinate, you can enter the coordinates in two ways:
Enter values directly in corresponding fields.
Choose a location in a map. The map option also displays polygons and points that are defined for organisation units.
Click Save and add new or Save and go back.
Note: Some data elements in an event might be mandatory (marked with a red star next to the data element lable). What this means is that all mandatory data elements must be filled in before the user is allowed to save the event. The exception to this is if the user has the authority called "Ignore validation of required fields in Tracker and Event Capture". If the user has this authority, the mandatory data elements will not be required to be filled in before saving and the red star will not be displayed next to the data element lable. Note that super user that have the "ALL" authority automatically have this authority.
Open the Event Capture app.
Select an organisation unit.
Select a program.
All events registered to the selected program show up in a list.
Click the event you want to modify and select Edit.
Modify the event details and click Update.
The Edit in grid function allows you to edit a selected event within the table but only those columns (data elements) visible in the grid. If you need more columns, use Show/hide columns to specify which columns should be displayed in the list.
Open the Event Capture app.
Select an organisation unit.
Select a program.
All events registered to the selected program show up in a list.
Click the event you want to modify and select Edit in grid.
Modify the event details.
Click on another event to close the edit mode.
You can share an event in edit mode via its web address.
Open the Event Capture app.
Open the event you want to share in edit mode.
Copy the URL.
Make sure that the URL contains "event" and "ou" (organisation unit) parameters.
Paste the URL in the sharing method of your choice, for example an e-mail or a message within DHIS2.
If you're not logged in to DHIS2 when you click the link, you'll be asked to do so and then taken to the dashboard.
Open the Event Capture app.
Select an organisation unit.
Select a program.
All events registered to the selected program show up in a list.
Click an event and select Audit history.
Open the Event Capture app.
Select an organisation unit.
Select a program.
All events registered to the selected program show up in a list.
Click an event and select Remove.
Click Remove to cocnfirm the deletion.
You can select which columns to show or hide in an event list. This can be useful for example when you have a long list of data elements assigned to a program stage. Once you've modified the layout, it's saved on your user profile. You can have different layouts for different programs.
Open the Event Capture app.
Select an organisation unit.
Select a program.
All events registered to the selected program show up in a list.
Click the Show/hide columns icon.
Select the columns you want to display and click Close.
Open the Event Capture app.
Select an organisation unit.
Select a program.
All events registered to the selected program show up in a list.
Click Print list.
Open the Event Capture app.
Select an organisation unit.
Select a program.
All events registered to the selected program show up in a list.
Click the Downlad icon and select a format.
You can download an event list in XML, JSON or CSV formats.
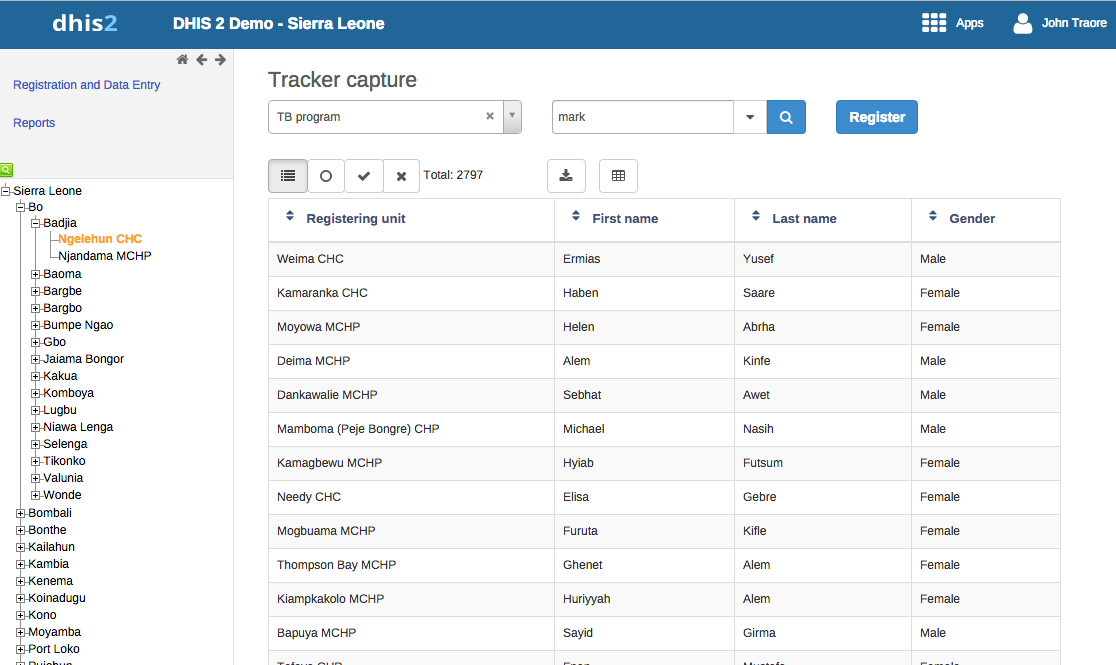
The Tracker Capture app is an advanced version of the Event Capture app.
Event Capture: handles single events without registration
Tracker Capture: handles multiple events (including single event) with registration.
You capture event data for a registered tracked entity instance (TEI).
You only see programs associated with the organisation unit you've selected and programs you've access to view through your user role.
The options you see in the search and register functions depend on the program you've selected. The program attributes control these options. The attributes also decide the columns names in the TEI list.
If you don't select a program, the system picks default attributes.
Both skip-logic and validation error/warning messages are supported during registration.
When you close an organisation unit, you can't register or edit events to this organisation unit in the Tracker Capture app. You can still search for TEIs and filter the search results. You can also view the dashboard of a particular TEI.
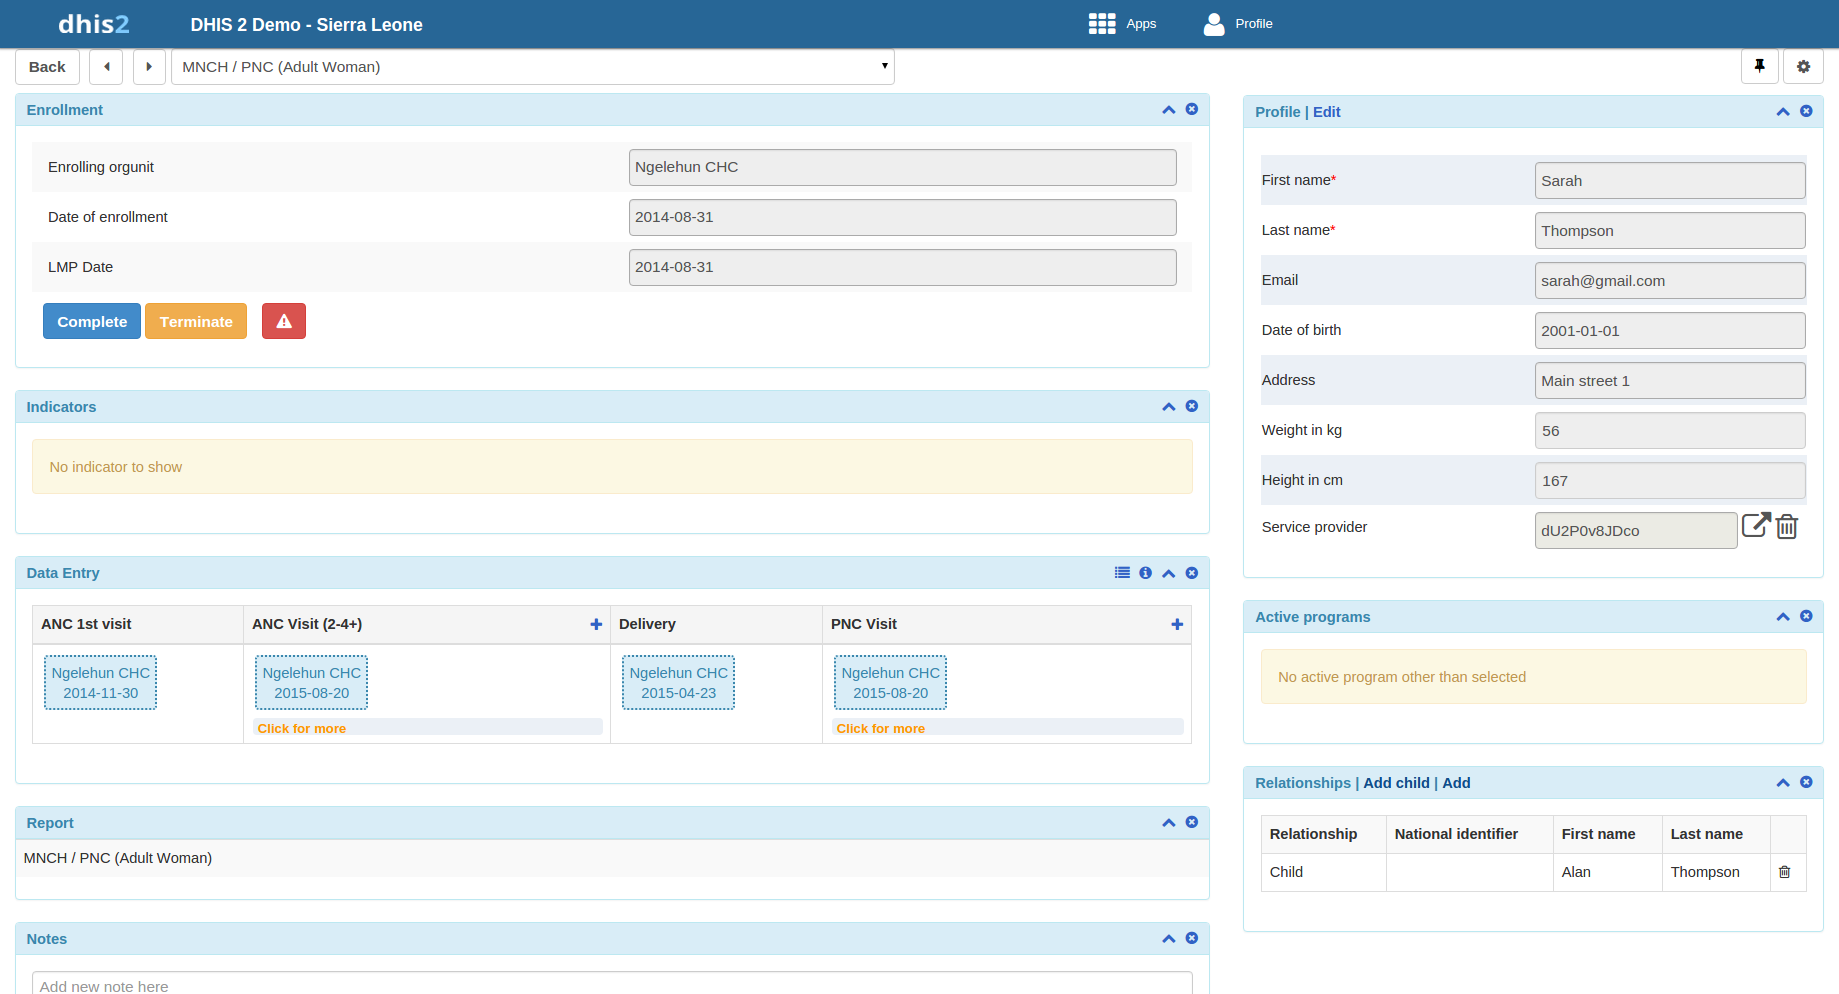
You manage a TEI from the TEI's dashboard in the Tracker Capture app.
The dashboard consist of widgets. Drag and drop the widgets to place them in the order and in the position you want.
Click the pin icon to stick the right column of widgets to a fix position. This is useful especially during data entry.
If you have many data elements or big form to fill in, stick the right widget column. Then all the widgets you've placed in the right column remain visible while you scroll in the data entry part.
Any indicator defined for the program you've selected will have its value calculated and displayed in the Indicators widget.
Navigation:
Back: takes you back to the search and registration page
Previous and next buttons: takes you to the previous or next TEI dashboard in the TEI search results list
Working process of Mother and child health program
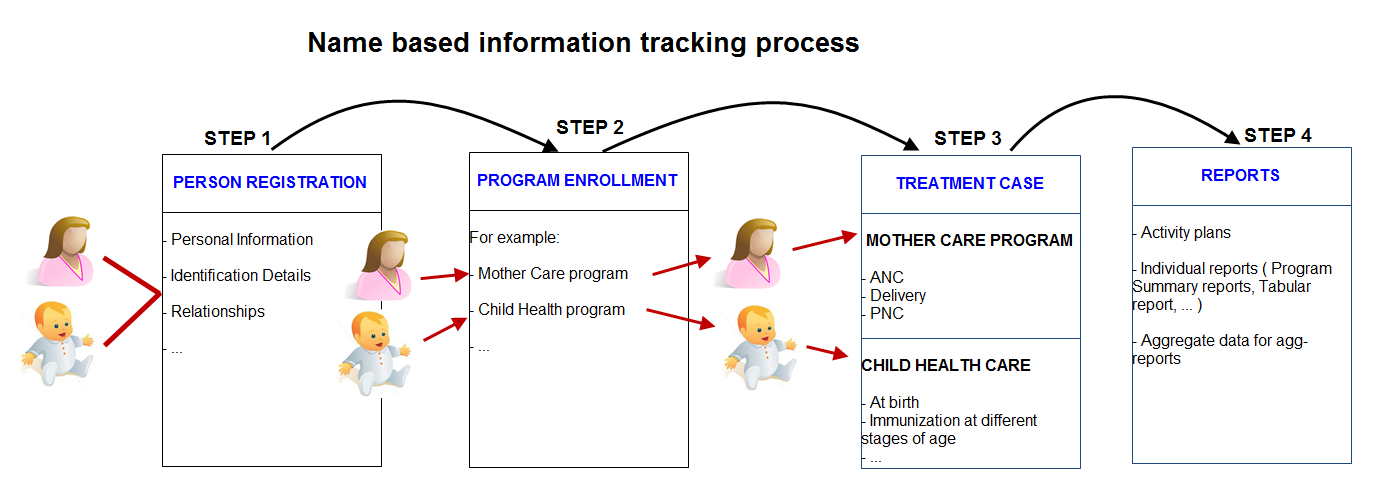
Create new or find existing TEI.
You can search on defined attributes, for example name or address.
Enroll TEI in a program.
Based on the services of the program by the time, the app creates an activity plan for the TEI.
The TEI is provided with various services depending on the program. All services are recorded.
Use information about the individual cases to create reports.
You can share a program selection on the "home screen.
Open the Tracker Capture app.
Select the program you want to link to.
Copy the URL.
Paste the URL in the sharing method of your choice, for example an e-mail or a message within DHIS2.
Note: If the program does not exist in the selected organisation unit (that is stored in the local cache) the system will instead select the first available program for that organisation unit. If the local cache is empty/clean and the root organisation unit of the current user does not have the specified program, the system will also here select the first available program for the root organisation unit.
You can share a TEI dashboard via its web address.
Open the Tracker Capture app.
Open the dashboard you want to share.
Copy the URL.
Make sure that the URL contains "tei", "program" and "ou" (organisation unit) parameters.
Paste the URL in the sharing method of your choice, for example an e-mail or a message within DHIS2.
If you're not logged in to DHIS2 when you click the link, you'll be asked to do so and then taken to the dashboard.
You can create a TEI and enroll that TEI to a program in one operation:
Open the Tracker Capture app.
In the organisation unit tree in the left hand pane, select an organisation unit.
Select a program.
Click Register.
Fill in the required information.
Both tracked entity type and program can be configured to use a feature type. This makes it possible to capture geometry for either the TEI or the enrollment. Supported feature type is Point and Polygon. Please see How to use geometry.
If the selected program is configured to display first stage during registration, all mandatory fields in the stage will have to be filled in. At the end of the stage you will also be asked if you want to complete the stage that you have entered data for. If you select Yes, the stage will have the status completed once saved. If you select No, the stage will have the status active.
If searching for program is configured, a background search will be performed on searchable fields to help you prevent registering duplicates. If there is any matching TEIs, a blue box will be displayed on the right side of the form with the possibility to view these matching TEIs.
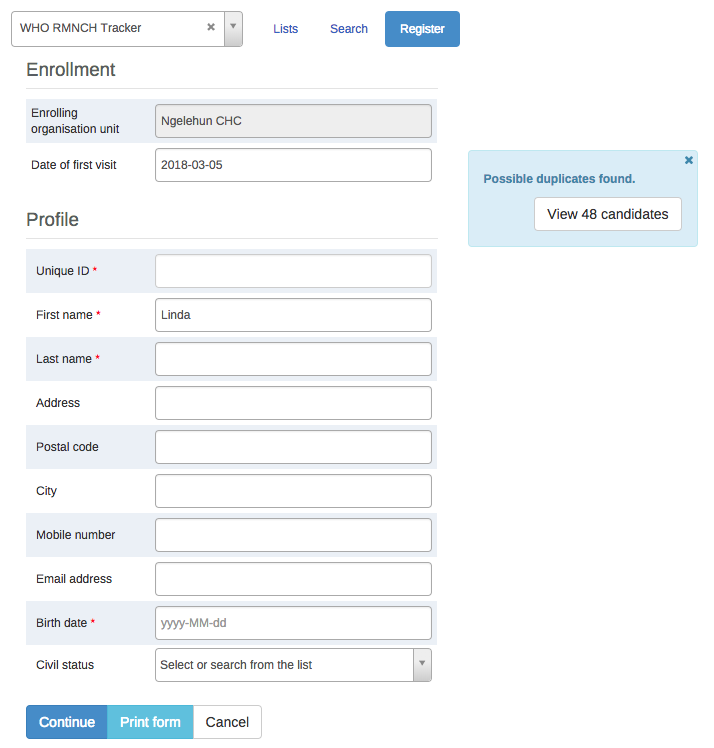
If there is any matching TEIs, click Continue to review possible duplicates before registering a new one.
If there is no matching TEIs, click Save and continue or Save and add new
Save and continue: completes the registration and opens the registered TEI's dashboard
Save and add new: completes the registration but stays on the same page. Use this option when you want to register and enroll one TEI after another without enter data.
Note: All mandatory attributes have to be filled in to be able to save. Mandatory attributes are marked with a red star next to the attribute label. If the user has the authority called "Ignore validation of required fields in Tracker and Event Capture" you will not be required to fill in the mandatory attributes and will not see the red star next to the attribute label. Note that super user that have the "ALL" authority automatically have this authority.
There are multiple ways to find a TEI: Using the "Lists" which is predefined lists in the current selection, or "Search" for global lookup.
Lists is used to find and display TEIs in the selected organisation unit and program.
Open Tracked Capture app
In the organisation unit tree in the left hand pane, select an organisation unit
Select a program
Click the "Lists" button if not already selected
If not configured, a set of predefined lists will be available:
Any TEI with any enrollment status
TEIs with an active enrollment of the current program
TEIs with a completed enrollment of the current program
TEIs with a cancelled enrollment of the current program

You can select which columns to show or hide in the lists for each program. This will be saved in your user settings.
Click the grid icon button
Check the columns you want to include
Click Save
There is also an option to create a custom working list with own filters. This can be used to create custom lists on the fly.
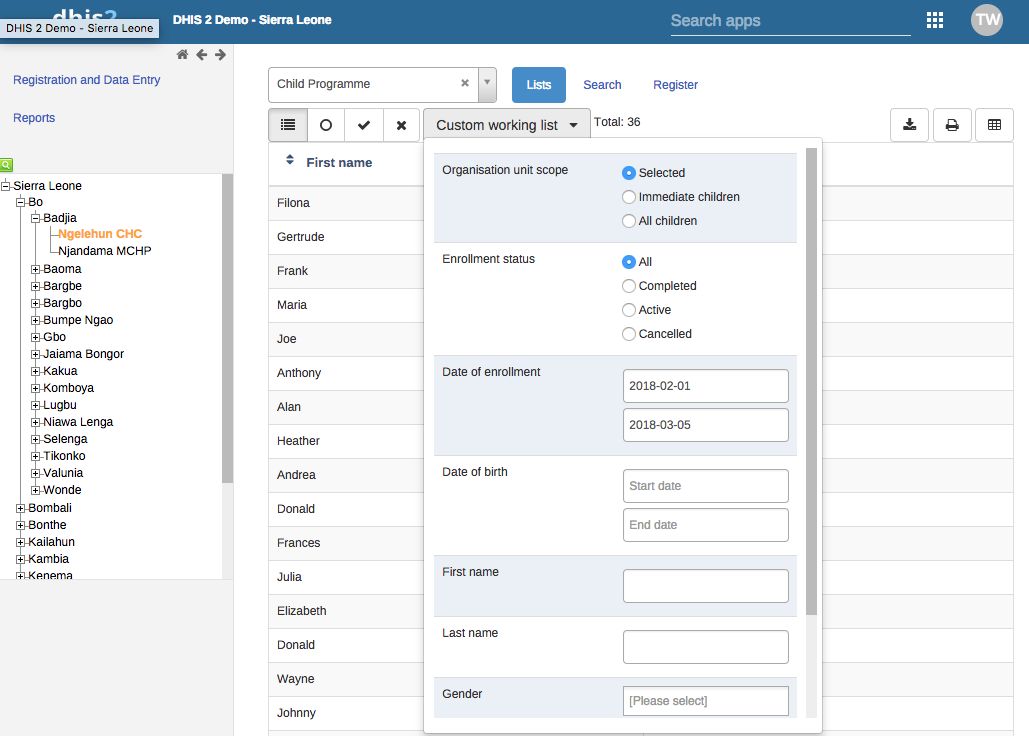
Lists can also be downloaded or printed.

If the program has any custom tracked entity filters associated with it, these will take the place of the four predefined lists mentioned above. The predefined lists will when well configured be an effective way to find or work with the data relevant for the user in that program.
Working lists can be defined with a wide variety of options, here are some examples:
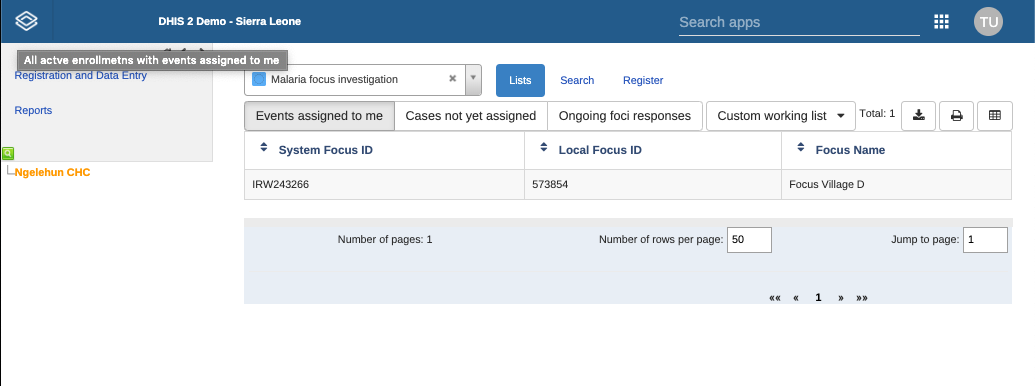
See the API documentation for a full list of functionality supported for these predefined tracked entity instance filters.
Search is used to search for TEIs in the organisation units the user has search access to. This can be used if you want to find a TEI, but you don't know which organisation unit or program the TEI was enrolled in. There are two ways of doing this: With and without a program context. Searchable fields needs to be configured. For configuring searching with program context, this is done individually for each program in the program maintenance app. For configuring searching without a program context, this is done individually for each tracked entity type in the tracked entity type maintenance app.
Searching without a program context:
Open Tracker Capture app
Click the Search button
Searchable fields will be displayed in groups. Unique attributes is only individually searchable. Non-unique attributes can be combined.
Fill in search criteria and click the search icon button.
Searching with a program context:
Open Tracker Capture app
Select an organisation unit which has the program you wish to search in
Select the program
Click the Search button
Searchable fields will be displayed in groups. Unique attributes is only individually searchable. Non-unique attributes can be combined.
Fill in search criteria and click the search icon button
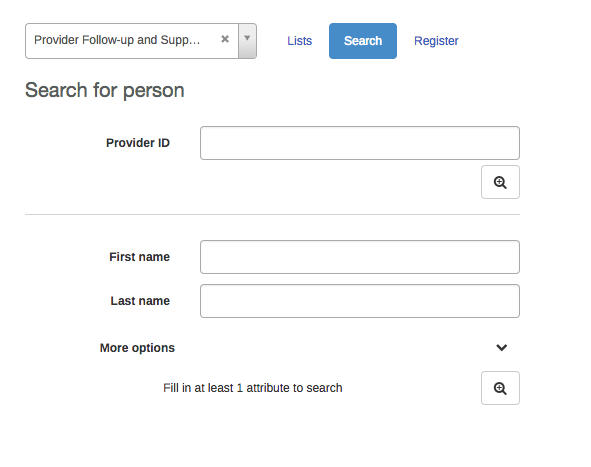
After the search has been done, you will be presented with the search result. Whats displayed depends on the outcome of the search.
For unique attribute search:
If no matching TEI found, you will get the possibility to open the registration form.
If the TEI was found in the selected organisation unit, the TEI dashboard will automatically open.
If the TEI was found in outside the selected organisation unit, you will get the possibility to open the TEI.
For non-unique attributes search:
If no matching TEI's found, you will get the possibility to open the registration form.
If matching TEI's found, you can either click on any TEI in the result list, or open the registration form.
If a too large number of matches was found, you will be prompted to refine your search criteria
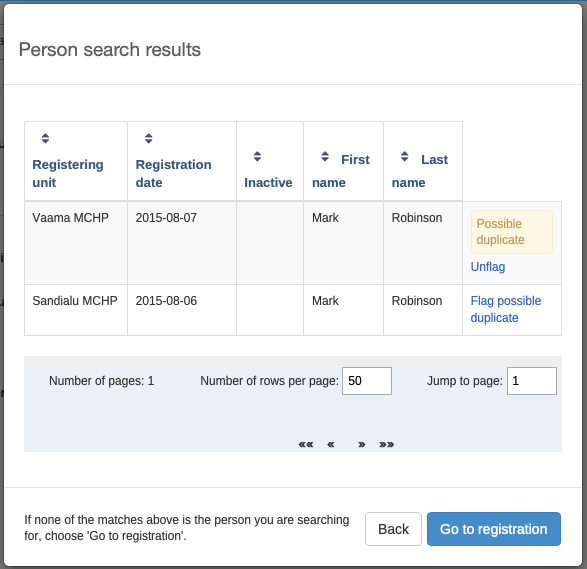
The search results have functionality for flagging tracked entity instances as possible duplicates, see next chapter.
When choosing to open the registration form, the search values will automatically be filled into the registration form.
When searching for tracked entity instances in the tracker capture app, the user will sometimes suspect that one or more of the search hits are duplicates of other tracked entity instances. The user has the option of clicking on the flag possible duplicate link in the rightmost column of the search result grid.
Tracked entity instances flagged in this way will be marked as "possible duplicate" in the DHIS2 database. The flag indicates that the tracked entity instance is/has a duplicate. The presence of such a flag is visible to the user in two places. One is the result list itself (in this example Mark Robinson is already flagged as a potential duplicate):
The other place is within the tracked entity instance dashboard:
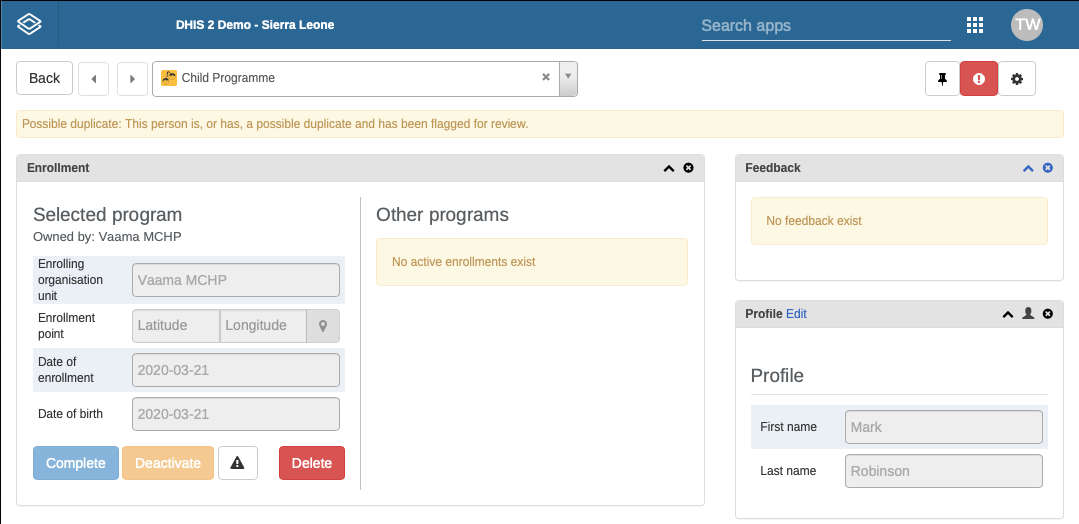
In addition to informing users about the tracked entity instance potentially being a duplicate, the flag will be used by the underlying system for finding and merging duplicates in coming versions of DHIS2.
If the program is configured with access level protected, and the user searches and finds tracked entity instances that is owned by organisation unit that the user does not have data capture authority for, the user is presented with the option of breaking the glass. The user will give a reason for breaking the glass, then gain temporary ownership of the tracked entity instance.
Open the Tracker Capture app.
Open an existing TEI dashboard.
Select a program.
In the Enrollment widget, click Add new.
Fill in the required information and click Enroll.
In a TEI dashboard, you enter event data in the Timeline Data entry or Tabular data entry widgets.
| Widget name | Description |
|---|---|
| Timeline Data entry | For data entry using either default or custom forms. Depending on program definition, in particular program stages, events will be displayed in a timely fashion. Clicking on any of them displays the corresponding data entry. If a stage needs new event, a plus icon is displayed for new event creation. To proceed with data entry, it is mandatory to have event date. Once an event date is specified it is not possible to change due date. The assumption is that by specifying event date, the event has already taken place. If the event hasn't occurred yet, it is possible to change due date - this is effectively doing nothing but rescheduling. The buttons at the bottom help to change the status of a selected event. Another key feature from this widget is addition of multiple notes for an event. Normally data recording is through data elements, however there are cases where it is necessary to record additional information or comments. This is where the notes section comes handy. However it is not possible to delete a note. The idea is notes are more like log books. Both skip-logic and validation error/warning messages are supported during data entry. Also included in the Timeline Data entry is the option to compare your data entry to previous entries. This can be enabled by clicking the "Switch to compare form" button (Two sheets of paper) in the top right corner of the Timeline Data entry widget. |
| Tabular data entry | For tabular-style data entry. The widget displays the list of program stages as left-hand side labels. Events will be listed in table for repeatable program stage, and allows for in-line edits of event data values. |
You can create an event for a TEI by:
Open the Tracker Capture app.
Open an existing TEI dashboard.
In the Timeline Data entry or Tabular data entry widget, click the +-button.
Select a Program stage and set a Report date.
Program stages can be configured to use a feature type. This makes it possible to capture geometry for an event. Supported feature type is Point and Polygon. Please see How to use geometry.
Click Save.
You can schedule an event for a future date by:
Open the Tracker Capture app.
Open an existing TEI dashboard.
In the Timeline Data entry or Tabular data entry widget, click the Calendar icon.
Select a Program stage and set a Schedule date.
Click Save.
Sometimes it might be necessary to refer a patient to a different Organisation unit. To refer a TEI:
Open the Tracker Capture app.
Open an existing TEI dashboard.
In the Timeline Data entry or Tabular data entry widget, click the Arrow icon.
Select a Program stage, Organisation unit and set a ****Report date****.
Click either One-time referral which will only refer TEI for one single event or Move permanently which will move TEI ownership to the selected Organisation Unit. Further access to the TEI will be based on the ownership organisation unit.
Some data elements in an event might be mandatory (marked with a red star next to the data element label). What this means is that all mandatory data elements must be filled in before the user is allowed to complete the event. The exception to this is if the user has the authority called "Ignore validation of required fields in Tracker and Event Capture". If the user has this authority, the mandatory data elements will not be required to be filled in before saving and the red star will not be displayed next to the data element label. Note that super user that have the "ALL" authority automatically have this authority.
Tracked entity type, program and program stage can be configured to use a feature type. This makes it possible to capture geometry for a TEI, program or event. Supported feature types are Point and Polygon.
Option 1: Fill in the latitude and longitude into the field.
Option 2: 1. Click on the map icon 2. Find the location you want by either searching or locating it on the map 3. Right-click on the location you want, and choose Set coordinate 4. Click Capture at the bottom
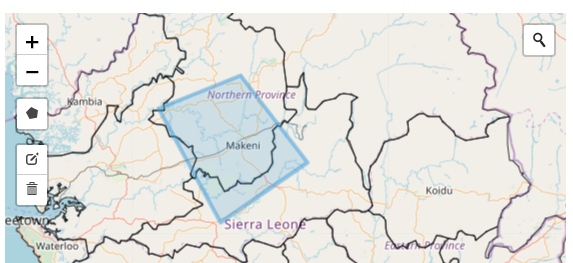
Polygons can also be deleted 1. Click the map icon 2. Click the trash can icon at the left side of the map, and select Clear all
In the Maintenance App a program stage can be configured to allow user assignment. If user assignment is enabled, you will be able to assign a user to an event.
The Enrollment widget gives access to information and functionality for the enrollment in the selected program.
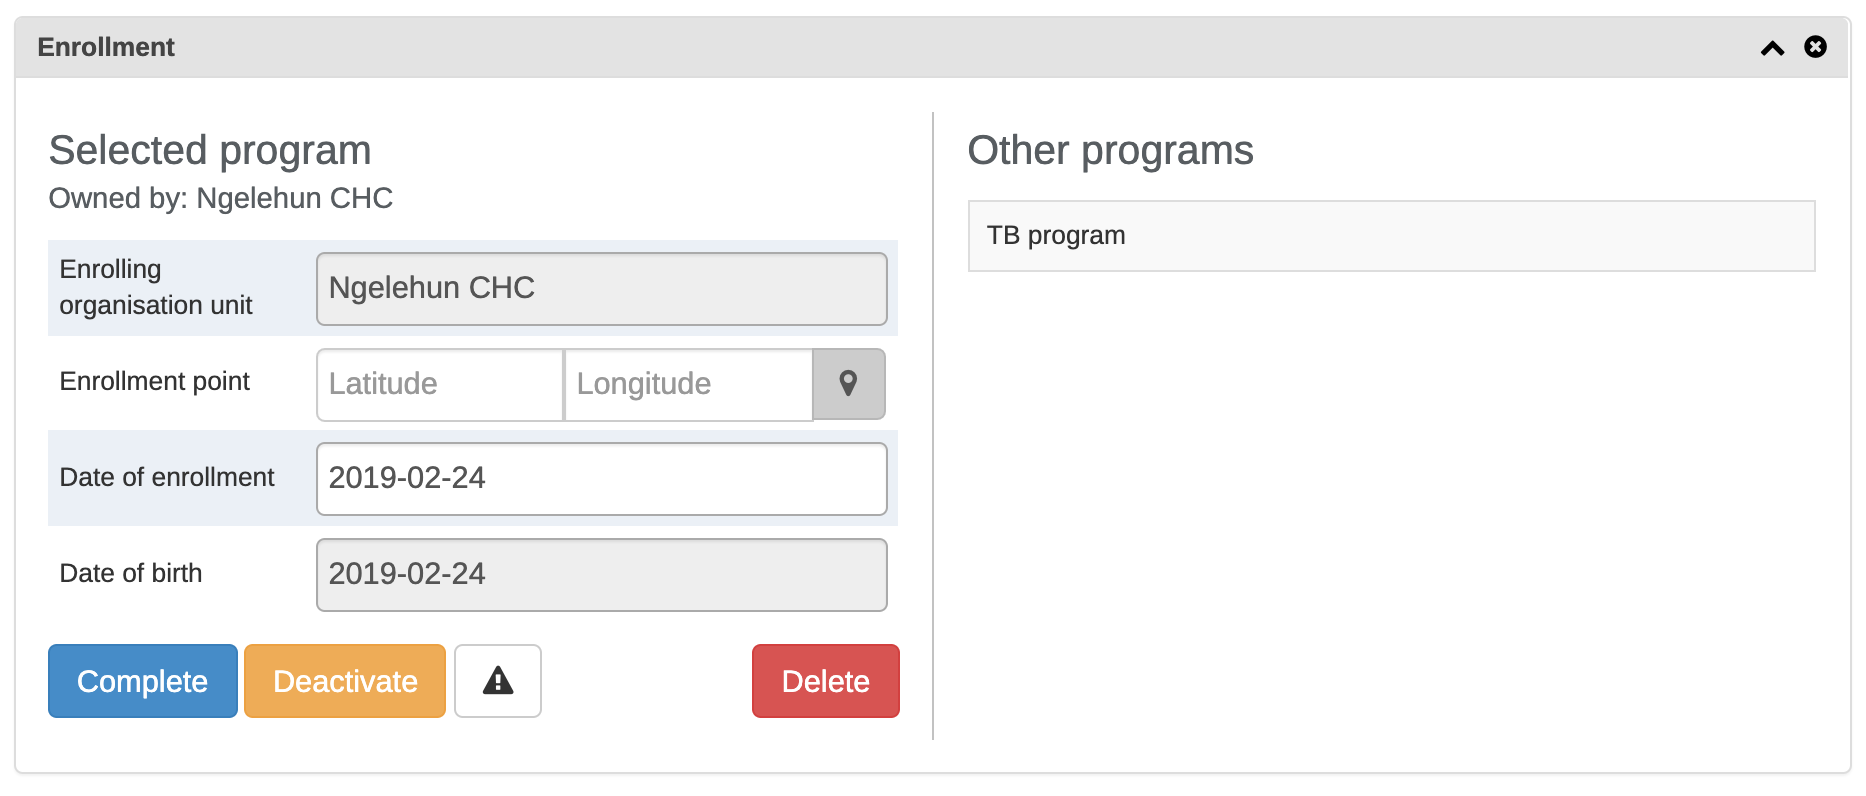
The current ownership of all enrollments in the selected program is displayed in the "Owned by" part of the enrollment widget. The ownership will always start out as the organisation unit that first enrolled the TEI into the given program.
Ownership can be different for a TEIS different programs, for example one clinic can follow up a patient in HIV, while another clinic follows up the same patient in MCH.
To update the ownership for a TEI/program combination, the user has to utilize the referral functionality and select the "Move permanently" option while referring.
A user that has capture access to the organisation unit that is the current owner of the TEI/Program will have write access to all enrollments for that TEI/Program combination. A user that has search access to the organisation unit that is the current owner will have access to search and find the TEI/Program combination.
If you deactivate a TEI dashboard, the TEI becomes 'read-only'. You can't enter data, enroll the TEI or edit the TEI's profile.
Open the Tracker Capture app.
Open an existing TEI dashboard.
In the Enrollment widget, click Deactivate.
Click Yes to confirm.
Open the Tracker Capture app.
Open an existing TEI dashboard.
In the Enrollment widget, click Activate.
Click Yes to confirm.
Open the Tracker Capture app.
Open an existing TEI dashboard.
In the Enrollment widget, click Complete.
Click Yes to confirm.
Open the Tracker Capture app.
Open an existing TEI dashboard.
In the Enrollment widget, click Reopen.
Click Yes to confirm.
Open the Tracker Capture app.
Open an existing TEI dashboard.
In the Profile widget, click the Audit history icon.
An enrollment note is useful to record information about for example why an enrollment was cancelled.
Open the Tracker Capture app.
Open an existing TEI dashboard.
In the Notes widget, type your note and click Add.
Open the Tracker Capture app.
Open an existing TEI dashboard.
In the Messaging widget and select SMS or E-mail.
Enter the required contact information.
If the TEI's profile contains an e-mail address or a phone number, these fields are filled in automatically.
Type a message.
Click Send.
You can use mark a TEI's enrollment for follow-up and then use this status as a filter when you create Upcoming events and Overdue events reports. This can be useful for example to monitor high-risk cases during a pregnancy program.
Open the Tracker Capture app.
Open an existing TEI dashboard.
In the Enrollment widget, click the Mark for follow-up icon.
You edit a TEI's profile or tracked entity attributes in the Profile widget.
Open the Tracker Capture app.
Open an existing TEI dashboard.
In the Profile widget, click Edit.
Modify the profile and click Save.
You can create a relationship from one TEI to another, for example linking a mother and a child together or a husband and a wife. Depending on how the relationship type is configured, the relative can inherit attributes.
Assume there are two programs: Antenatal care for the mother and Immunization for the child. If first name, last name and address attributes are required for both programs, it is possible to configure last name and address attributes as inheritable. Then during child registration, there is no need to enter these inheritable attributes. You can add them automatically based on the mother's value. If you want to have a different value for the child, you can override the automatically generated value.
Open the Tracker Capture app.
Open an existing TEI dashboard.
In the Relationships widget, and click Add.
Select a relationship type.
Search for the relative and select it. The search follows the same pattern as when searching for tracked entity instances from the tracker front page. Searches are by default covering the users search scope.
Select the tracked entity instance that matches the search criteria in the popup.
Click Save.
Note: If the relationship is a bi-directional relationship, the relationship will be displayed in the TEI that the relationship was created in and in the TEI that the relationship was linked to. Also, if the relationship is bi-directional, each end of the relationship will have a unique name that will be displayed in the relationship widget under the "Relationship" column.
You can share a TEI dashboard via its web address.
Open the Tracker Capture app.
Open the dashboard you want to share.
Copy the URL.
Make sure that the URL contains "tei", "program" and "ou" (organisation unit) parameters.
Paste the URL in the sharing method of your choice, for example an e-mail or a message within DHIS2.
If you're not logged in to DHIS2 when you click the link, you'll be asked to do so and then taken to the dashboard.
If you deactivate a TEI, the TEI becomes 'read-only'. Data associated with the TEI is not deleted.
Open the Tracker Capture app.
Open an existing TEI dashboard.
In the top right corner, click the  button > Deactivate.
Click Yes to confirm.
Open the Tracker Capture app.
Open an existing TEI dashboard.
In the upper top corner, click the button > Activate.
Click Yes to confirm.
Warning
When you delete a TEI, you delete all data associated with the TEI.
Open the Tracker Capture app.
Open an existing TEI dashboard.
In the top right corner, click the button > Delete.
Click Yes to confirm.
Open the Tracker Capture app.
Open an existing TEI dashboard.
Click the Settings icon, and select Show/hide widgets.
Select the widgets you want to show or hide.
Click Close.
You can save the dashboard's layout as default for a program.
Open the Tracker Capture app.
Open an existing TEI dashboard.
Click the Settings icon, and select Save dashboard layout as default.
If you are the administrator you have the option of locking the layout of the dashboard for all users.
Open the Tracker Capture app.
Open an existing TEI dashboard.
Organize the widgets to the desired layout and save it as default (see section above).
Click the Settings icon, and select Lock layout for all users.
Users will still be able to reorganize the widgets temporarily, but the layout will be reset to the admin's saved layout after page refresh. The remove widget buttons will be hidden when the dashboard layout is locked.
The top bar can be a helpful tool to see important data in a quick and easy way. To start using the top bar:
Open the Tracker Capture app.
Open an existing TEI dashboard.
Click the Settings icon, and select Top bar settings.
Click Activate top bar and click the data you would like to display in the top bar.
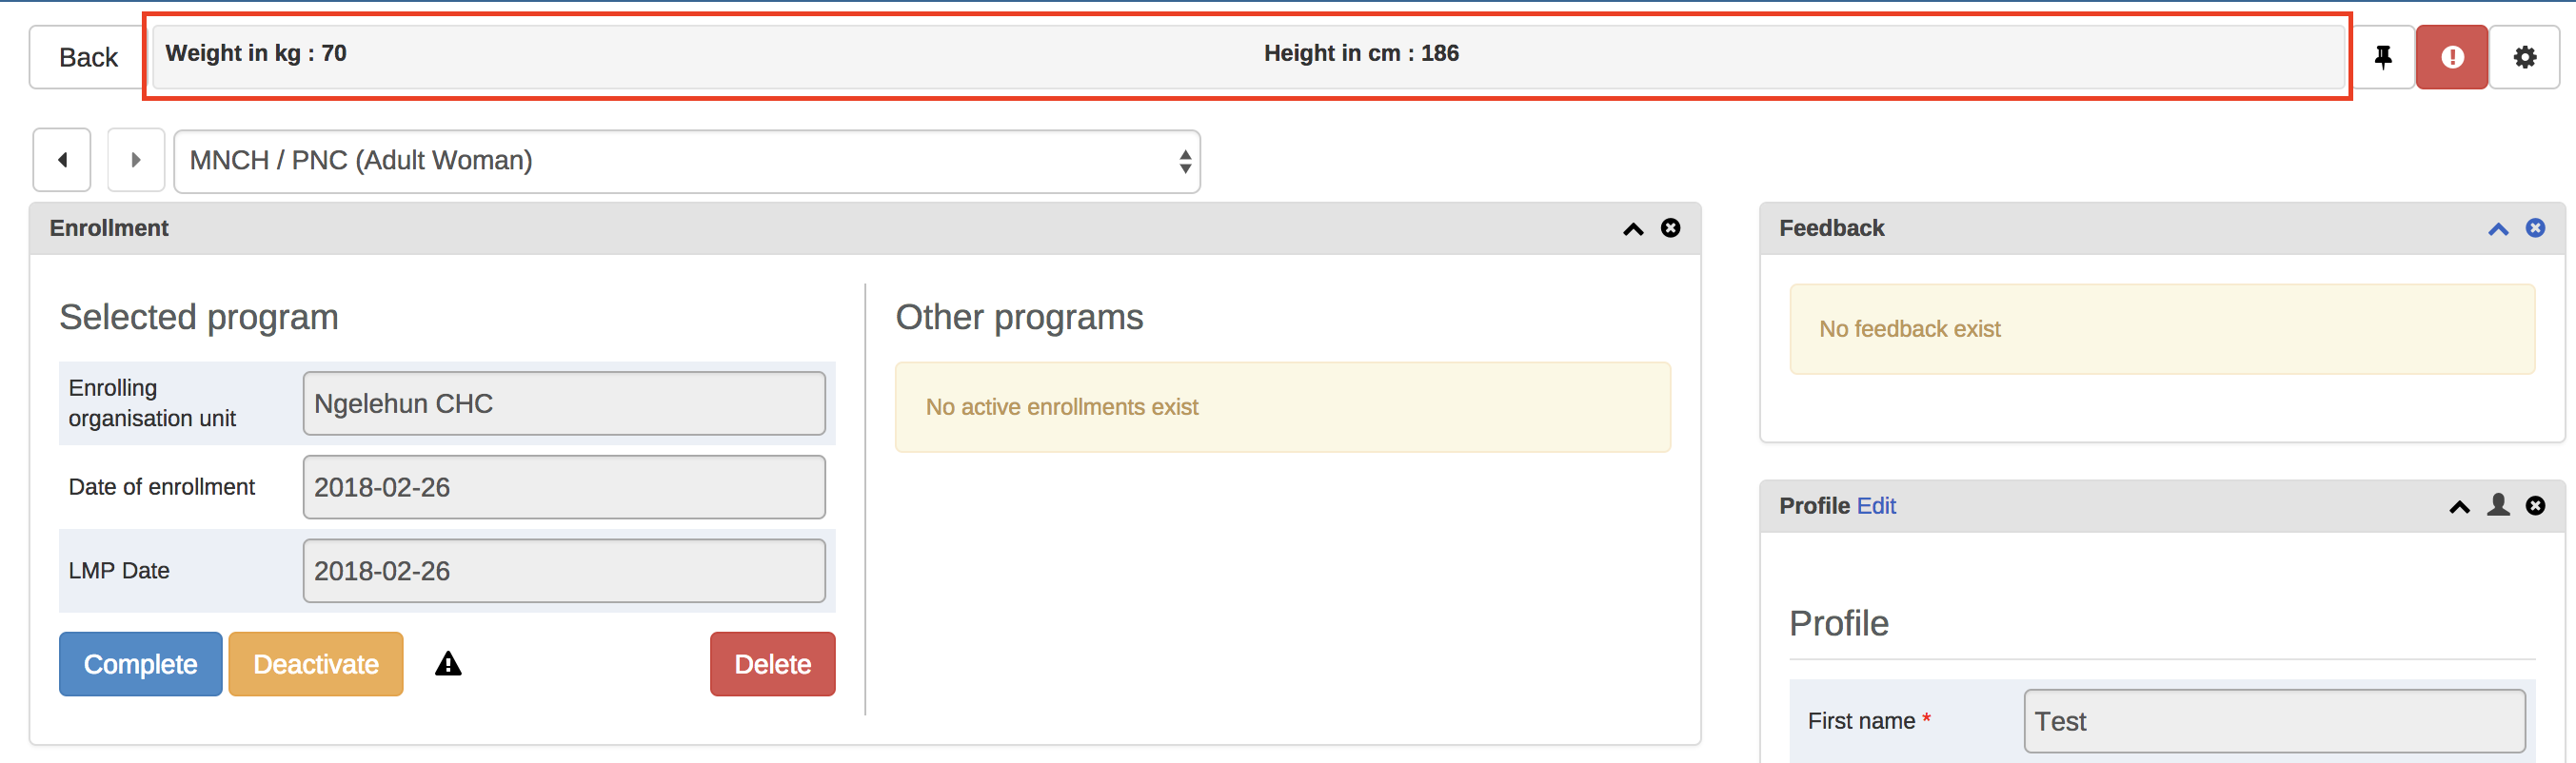
The Timeline Data Entry widget has 5 different table display modes that can be selected. The different options are: - Default form - Shows all data elements vertically.
Compare form previous - Shows the previous (repeatable) program stage next to the current selected program stage.
Compare form all - Shows all previous (repeatable) program stages next to the current selected program stage.
Grid form - Shows the data elements horizontally.
POP-over form - The same as Grid form, but when clicked the data elements are displayed in a pop-up.
To change the current display mode, click the second icon in the widgets top bar (see image below):
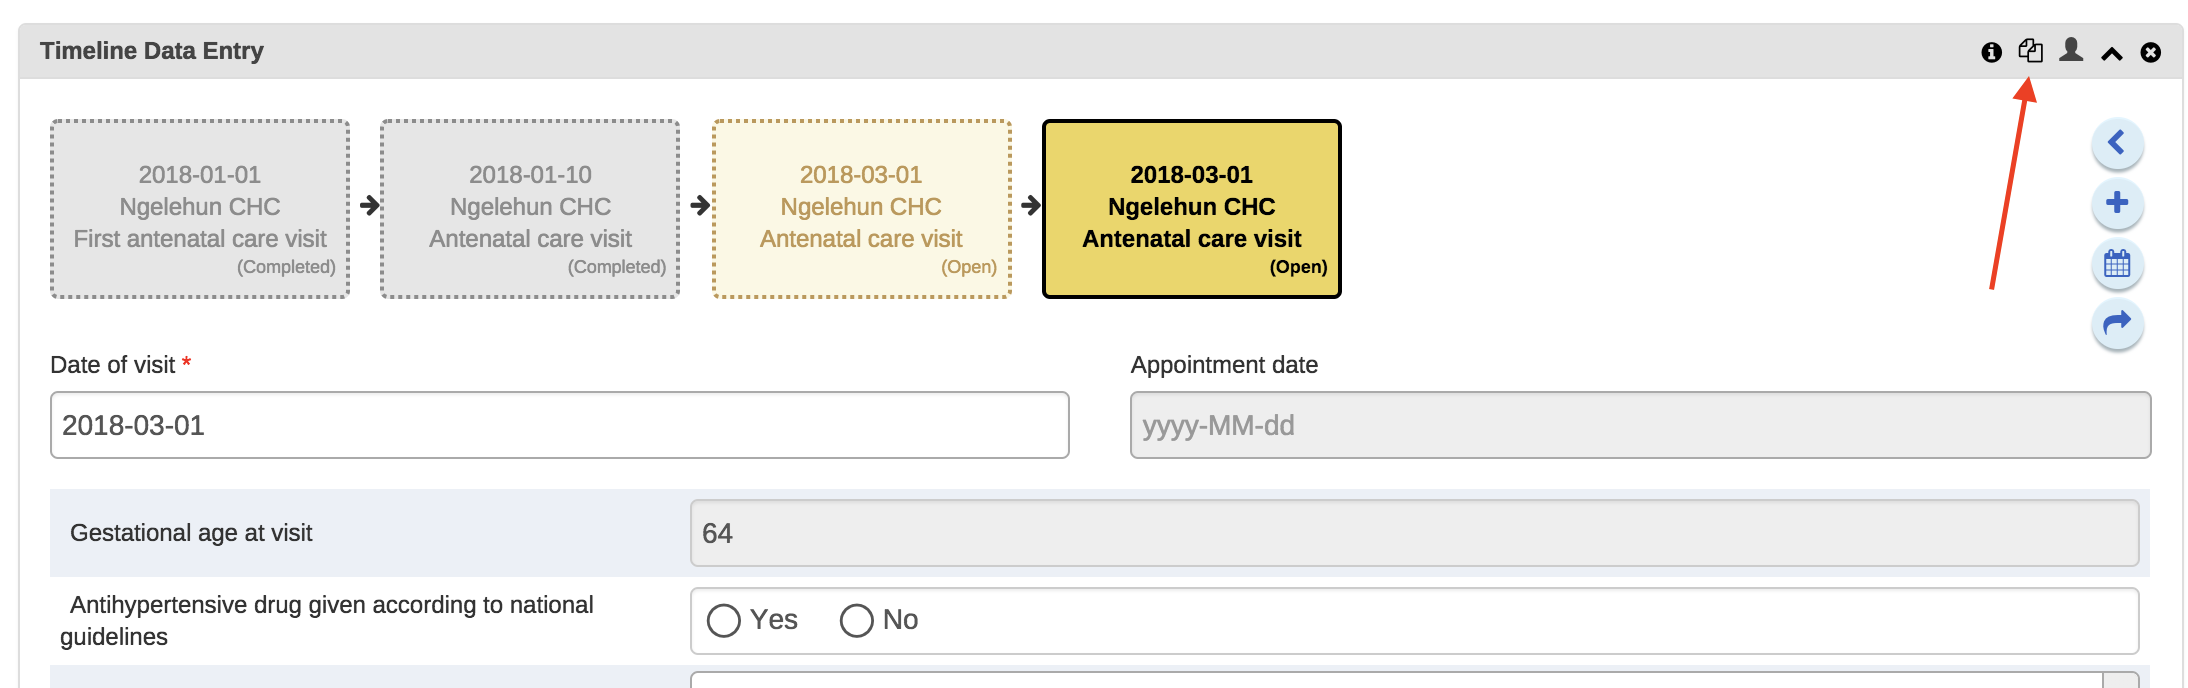
Once an option is selected the selection is stored for that specific program stage. This mean that you can have different table modes for the different program stages in a program.
Notes: 1. The Compare form options will function best if you have multiple repeatable events (of the same program stage) present. 2. The Grid form and POP-over form options are not selectable if the program stage has more than 10 data elements. 3. The icon in the widgets bar will change depending on the option you have selected.
Open the Tracker Capture app.
Click Reports.
Select a report type.
| Report type | Description |
|---|---|
| Program summary | A summary report for a particular program, organisation unit and time frame. The report consist of a list of TEIs and their records organised based on program stages. |
| Program statistics | A statistics report for a particular program. The report provides for example an overview of drop-outs or completion rates in a given time frame at a particular organisation unit. |
| Upcoming events | A tabular report showing tracked entity instances and their upcoming events for a selected program and time. You can sort the columns and search the values. Show/hide operations are possible on the columns. You can also export the table to Microsoft Excel. |
| Overdue events | A list of events for a selected program. The report displays a list of TEIs and their events that are not completed on time. You can sort the columns and search the values You can also export the table to Microsoft Excel. |
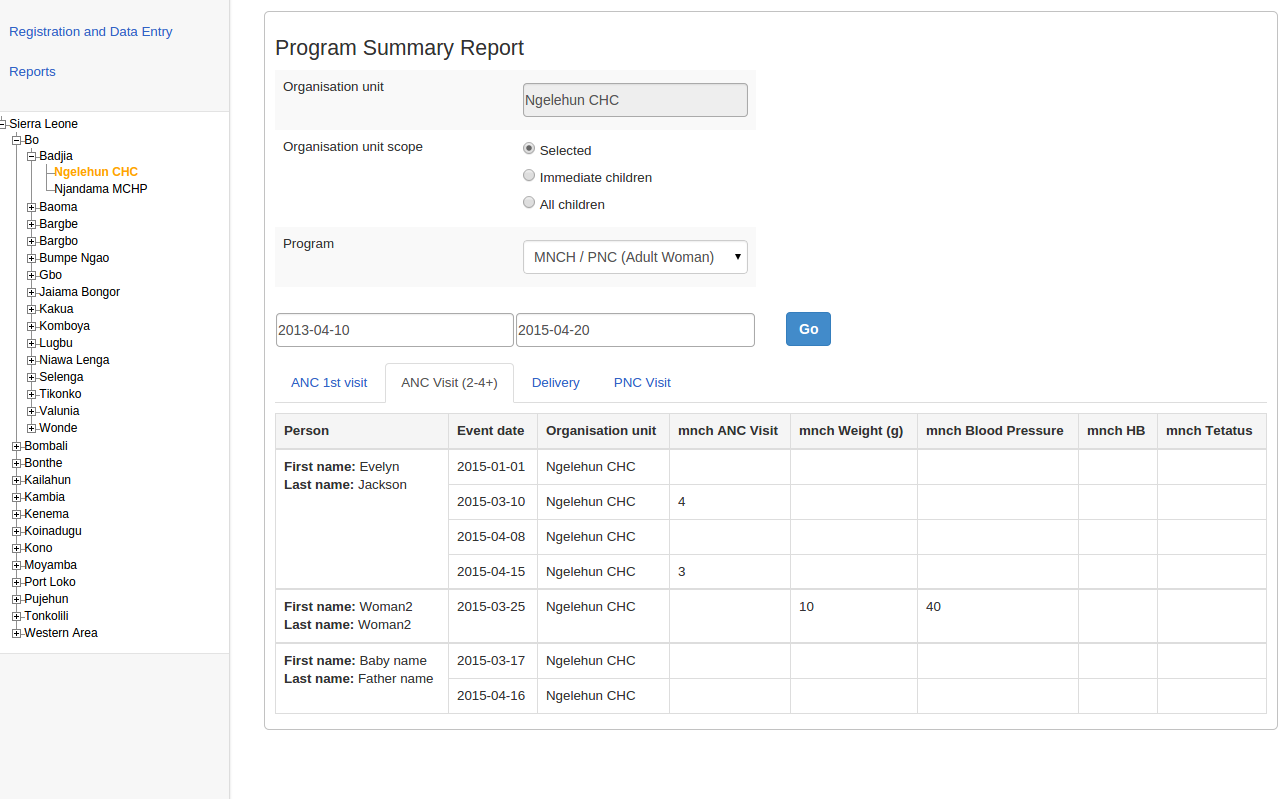
The summary report displays a list of TEIs and their records for "MNCH/PNC (Adult Woman)" program. The records are organized in the form of tabs where each tab is a program stage. The columns in the table are data elements which are configured to be displayed in reports under program stage definition.
DHIS2 has an optional feature that allows authorized users to approve data that has been entered. It allows data to be reviewed and approved at selected levels in the organisation unit hierarchy, so the approval follows the structure of the hierarchy from lower levels to higher levels.
Data is approved for a combination of (a) period, (b) organisation unit and (c) workflow. Data may be approved for the organisation unit for which it is entered, as well as for higher-level organisation units to which the data is aggregated. As part of system settings, you can choose the organisation unit level(s) at which data is approved. It can be approved at higher levels only after it has been approved for all that organisation unit's descendants at lower levels for the same workflow and period. When you approve a workflow, it approves data for any data sets that have been assigned to that workflow.
After a period, organisation unit and workflow combination has been approved, data sets associated with that workflow will be locked for that period and organisation unit, and any further data entry or modification will be prohibited unless it is first un-approved.
For example, the following diagram illustrates that data has already been approved for organisation units C and D, for a given period and workflow. It may now be approved for organisation unit B for the same period and workflow. But it is not ready to be approved for organization unit A. Before it can be approved for organisation unit A, it must be approved for B, and for any other children of organisation unit A, for that period and workflow.
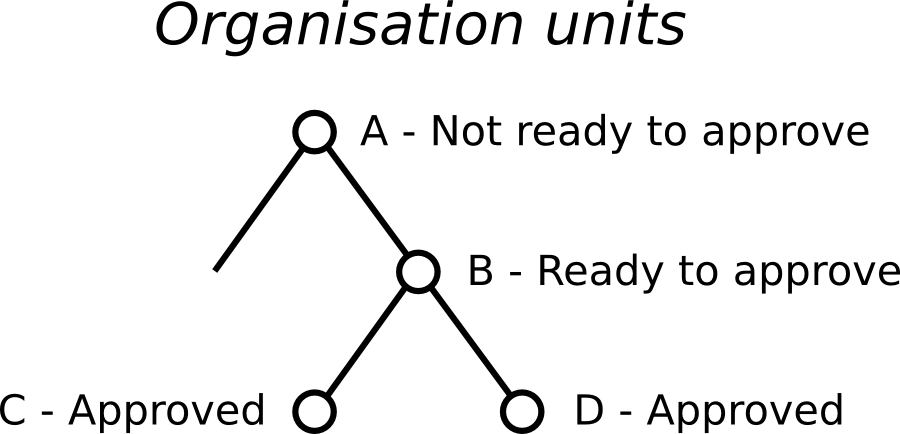
DHIS2 supports two different types of approval processes: either a one-step process where the data is approved at each level, or a two-step process where data is first approved and then accepted at each level. This is illustrated in the following diagram:
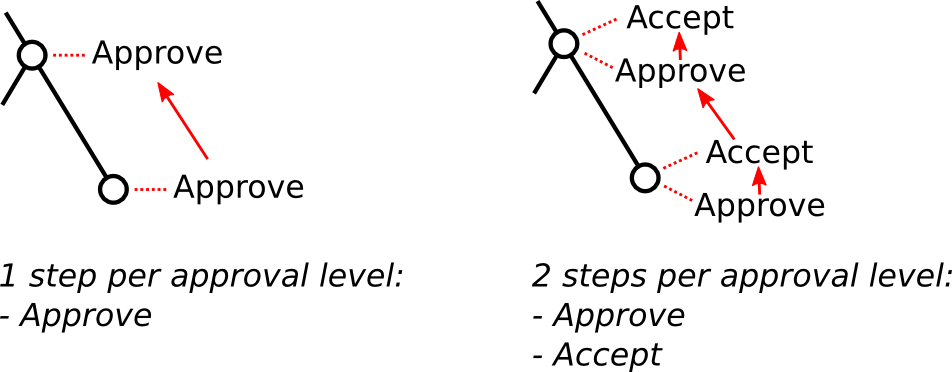
In the one-step process, data is approved at one level, and then approved at the next higher level. Until it is approved at the next higher level, it may be unapproved at the first level. (For example, if the data was approved my mistake, this allows the approver to undo their mistake.) Once the data is approved at the next higher level, it may not be unapproved at the lower level unless it is first unapproved at the higher level.
In the two-step process, data is approved at one level, and then the approval is accepted at the same level. This acceptance is done by a user who is authorized to approve data at the next higher level. Once the data is accepted, it may not be changed or unapproved unless it is first unaccepted.
The two-step process is not required by DHIS2. It is an optional step for a user reviewing data at the next higher level. It has the benefit of locking the acceptance from the level below, so reviewer does not have to worry that the data could be changing from below while it is being reviewed. It can also be used by the higher-level user to keep track of which lower-level data has already been reviewed.
Two-step process can be activated by checking Acceptance required before approval in SystemSettings app under General section.
To approve data, you must be assigned a role containing one of these authorities:
Approve data - You may approve data for the organisation unit(s) to which you are assigned. Note that this authority does not allow you to approve data for lower-levels below the organisation unit(s) to which you are assigned. This is useful to separate the users authorized to approve at one level from the users authorized to approve at levels below.
Approve data at lower levels - Allows you to approve data for all lower levels below the organisation units assigned to you. This is useful if, for example, you are a district-level user whose role includes approving the data for all the facilities within that district, but not for the district itself. If you are assigned this as well as the Approve data authority, you may approve data at the level of the organisation unit(s) to which you have been assigned, and for any level below.
Accept data at lower levels - Allows you to accept data for the level just below the organisation unit(s) assigned to you. This authority can be given to the same users as approve data. Or it may be given to different users, if you want to have some users who accept data from the level below, and a different set of users who approve data to go up to the next level above.
In the Maintenance app section under Data approval level you can specify the levels at which you want to approve data in the system. Click the Add new button on this page and select the organisation unit level at which you want approvals. It will be added to the list of approval settings. You may configure the system for approving data at every organisation unit level, or only at selected organisation unit levels.
Note that when you add a new approval level, you may optionally choose a Category option group set. This feature is discussed later in this chapter.
Also in maintenance under Data approval workflow, you can define the workflows that will be used for approving data. Each workflow can be associated with one or more approval levels. Any two workflows may operate at all the same approval levels as each other, some of the same and some different levels, or completely different levels.
If you want data for a data set to be approved according to a workflow, then assign the workflow to the data set when you add or edit the data set. If you do not want data for a data set to be subject to approval, then do not assign any workflow to that data set. For data sets that you want to approve at the same time as each other, assign them to the same workflow. For data sets that you want to approve independently, assign each data set to its own workflow.
Under System Settings -> Analytics, you can control what unapproved data (if any) will appear in analytics. See the "Analytics settings" section of this user guide. Note that users who are assigned to organisation units where data is ready for approval can alwyas view this data in analytics, as can users assigned to higher-level organisation units if they have the Approve data at lower levels authority or the View unapproved data authority.
If the option Hide unapproved data in analytics is enabled, data will be hidden from viewing by users associated with higher levels. When determining whether a data record should be hidden for a specific user, the system associates a user with a specific approval level and compares it to the level to which the data record has been approved up to. A user is associated with the approval level which matches the level of the organisation unit(s) she is linked to, or if no approvel level exists at that level, the next approval level linked to an organisation unit level below herself. A user will be allowed to see data which has been approved up to the level immediately below her associated approval level. The rationale behind this is that a user must be ablet to view the data that has been approved below so that she can eventually view and approve it herself.
Note that if the user has been granted the View unapproved data or the ALL authority she will be able to view data irrespective of the approval status.
Lets consider the following example: There are four organisation unit levels, with approval levels associated with level 2 and 4. User A at country level (1) gets associated with approval level 1 since the approval level exists at the same level as the organisation unit level. User B gets associated with approval level 2 since there is no approval level directly linked to her organisation unit level and approval level 2 is the immediate level below. User C gets associated with approval level 2. User D is below all approval levels which implies that she can see all data entered at or below her organisation unit level.

Using this example, lets consider some scenarios:
Data is entered at facility level: Only User D can see the data, as the data has not yet been approved at all.
Data is approved by User D at facility level: Data becomes visible to User C and User B, as the data is now approved at their level.
Data is approved by User C at district level: Data becomes visible to User A, as data is now approved at the level immediately below herself.
To approve data, go to Reports and choose Data Approval. When this report shows data that is configured for approval, it shows the approval status of the data in the report. The approval status will be one of the following:
Waiting for lower level org units to approve - This data is not yet ready to be approved, because it first needs to be approved for all the child organisation units to this organisation unit, for the same workflow and period.
Ready for approval - This data may now be approved by an authorized user.
Approved - This data has already been approved.
Approved and accepted - This data has already been approved, and also accepted.
If the data you are viewing is in an approval state that can be acted upon, and if you have sufficient authority, one or more of the following actions will be available to you on the Data Approval form:
Approve - Approve data that has not yet been approved, or that was formerly approved and has been unapproved.
Unapprove - Return to an unapproved state data that has been approved or accepted.
Accept - Accept data that has been approved.
Unaccept - Return to an unaccepted (but still approved) state data that has been accepted.
In order to unapprove data for a given organisation unit, you must have the authority to approve data for that organisation unit or to approve data for a higher-level organisation unit to which that data is aggregated. The reason for this is as follows: If you are reviewing data for approval at a higher organisation unit level, you should consider whether the data at lower organisation units are reasonable. If all lower-level data looks good, you can approve the data at the higher level. If some lower-level data looks suspect, you can unapprove the data at the lower level. This allows the data to be reviewed again at the lower level, corrected if necessary, and re-approved up through the organisation unit levels according to the hierarchy.
When defining an approval level, you specify the organisation unit level at which data will be approved. You may also optionally specify a category option group set. This is useful if you are using category option groups to define additional dimensions of your data, and you want approvals to be based on these dimensions. The following examples illustrate how this can be done within a single category option group set, and by using multiple category option group sets.
For example, suppose you define a category option group set to represent NGOs who serve as healthcare partners at one or more organisation units. Each category option group within this set represents a different partner. The category option group for Partner 1 may group together category options (such as funding account codes) that are used by that partner as a dimension of the data. So data entered by Partner 1 is attributed to a category option in Partner 1's category option group. Whereas data entered by partner 2 is attributed to a category option in Partner 2's category option group:
| Category option group set | Category option group | Category options |
|---|---|---|
| Partner | Partner 1 | Account 1A, Account 1B |
| Partner | Partner 2 | Account 2A, Account 2B |
Each partner could enter data for their accounts independently of the other, for the same or different workflows, at the same or different facilities. So for example, data can be entered and/or aggregated at the following levels for each partner, independently of each other:

Tip
You can use the sharing feature on category options and category option groups to insure that a user can enter data (and/or see data) only for certain category options and groups. If you don't want users to see data that is aggregated beyond of their assigned category options and/or category option groups, you can assign Selected dimension restrictions for data analysis, when adding or updating a user.
You can optionally define approval levels for partner data within any or all of these organisation unit levels. For example, you could define any or all of the following approval levels:
| Approval level | Organisation unit level | Category option group set |
|---|---|---|
| 1 | Country | Partner |
| 2 | District | Partner |
| 3 | Facility | Partner |
You can also define approval levels for different category option group sets. To continue the example, suppose that you have various agencies that manage the funding to the different partners. For example, Agency A funds accounts 1A and 2A, while Agency B funds accounts 1B and 2B. You could set up category option groups for Agency A, and Agency B, and make them both part of a category option group set called Agency. So you would have:
| Category option group set | Category option group | Category options |
|---|---|---|
| Partner | Partner 1 | Account 1A, Account 1B |
| Partner | Partner 2 | Account 2A, Account 2B |
| Agency | Agency A | Account 1A, Account 2A |
| Agency | Agency B | Account 1B, Account 2B |
Now suppose that at the country level, you want each partner to approve the data entered by that partner. Once this approval is done, you want each agency to then approve the data from accounts that are managed by that agency. Finally, you want to approve data at the country level across all agencies. You could do this by defining the following approval levels:
| Approval level | Organisation unit level | Category option group set |
|---|---|---|
| 1 | Country | |
| 2 | Country | Agency |
| 3 | Country | Partner |
Note that multiple approval levels can be defined for the same organisation unit level. In our example, Partner 1 would approve country-wide data at approval level 3 from category options Account 1A and Account 1B. Next, Agency A would approve country-wide data at approval level 2 from category options Account 1A (after approval by Partner 1) and Account 2A (after approval by Partner 2.) Finally, after approval from all agencies, country-wide data can be approved at approval level 1 across all category options. Note that approval level 1 does not specify a category option group set, meaning that it is for approving data across all category options.
This example is meant to be illustrative only. You may define as many category option groups as you need, and as many approval levels as you need at the same organisation unit level for different category option group sets.
If you have multiple approval levels for different category option group sets at the same organisation unit level, you may change the approval ordering in the Settings section, under System Approval Settings. Just click on the approval level you wish to move, and select Move up or Move down. If you have an approval level with no category option groups set, it must be the highest approval level for that organisation unit level.
The Data Approval app provides an intuitive interface to support the approval process in line with the configured approval workflows.
Start by selecting a workflow in the top left of the screen. If you only have access to a single workflow, it will be preselected for you.
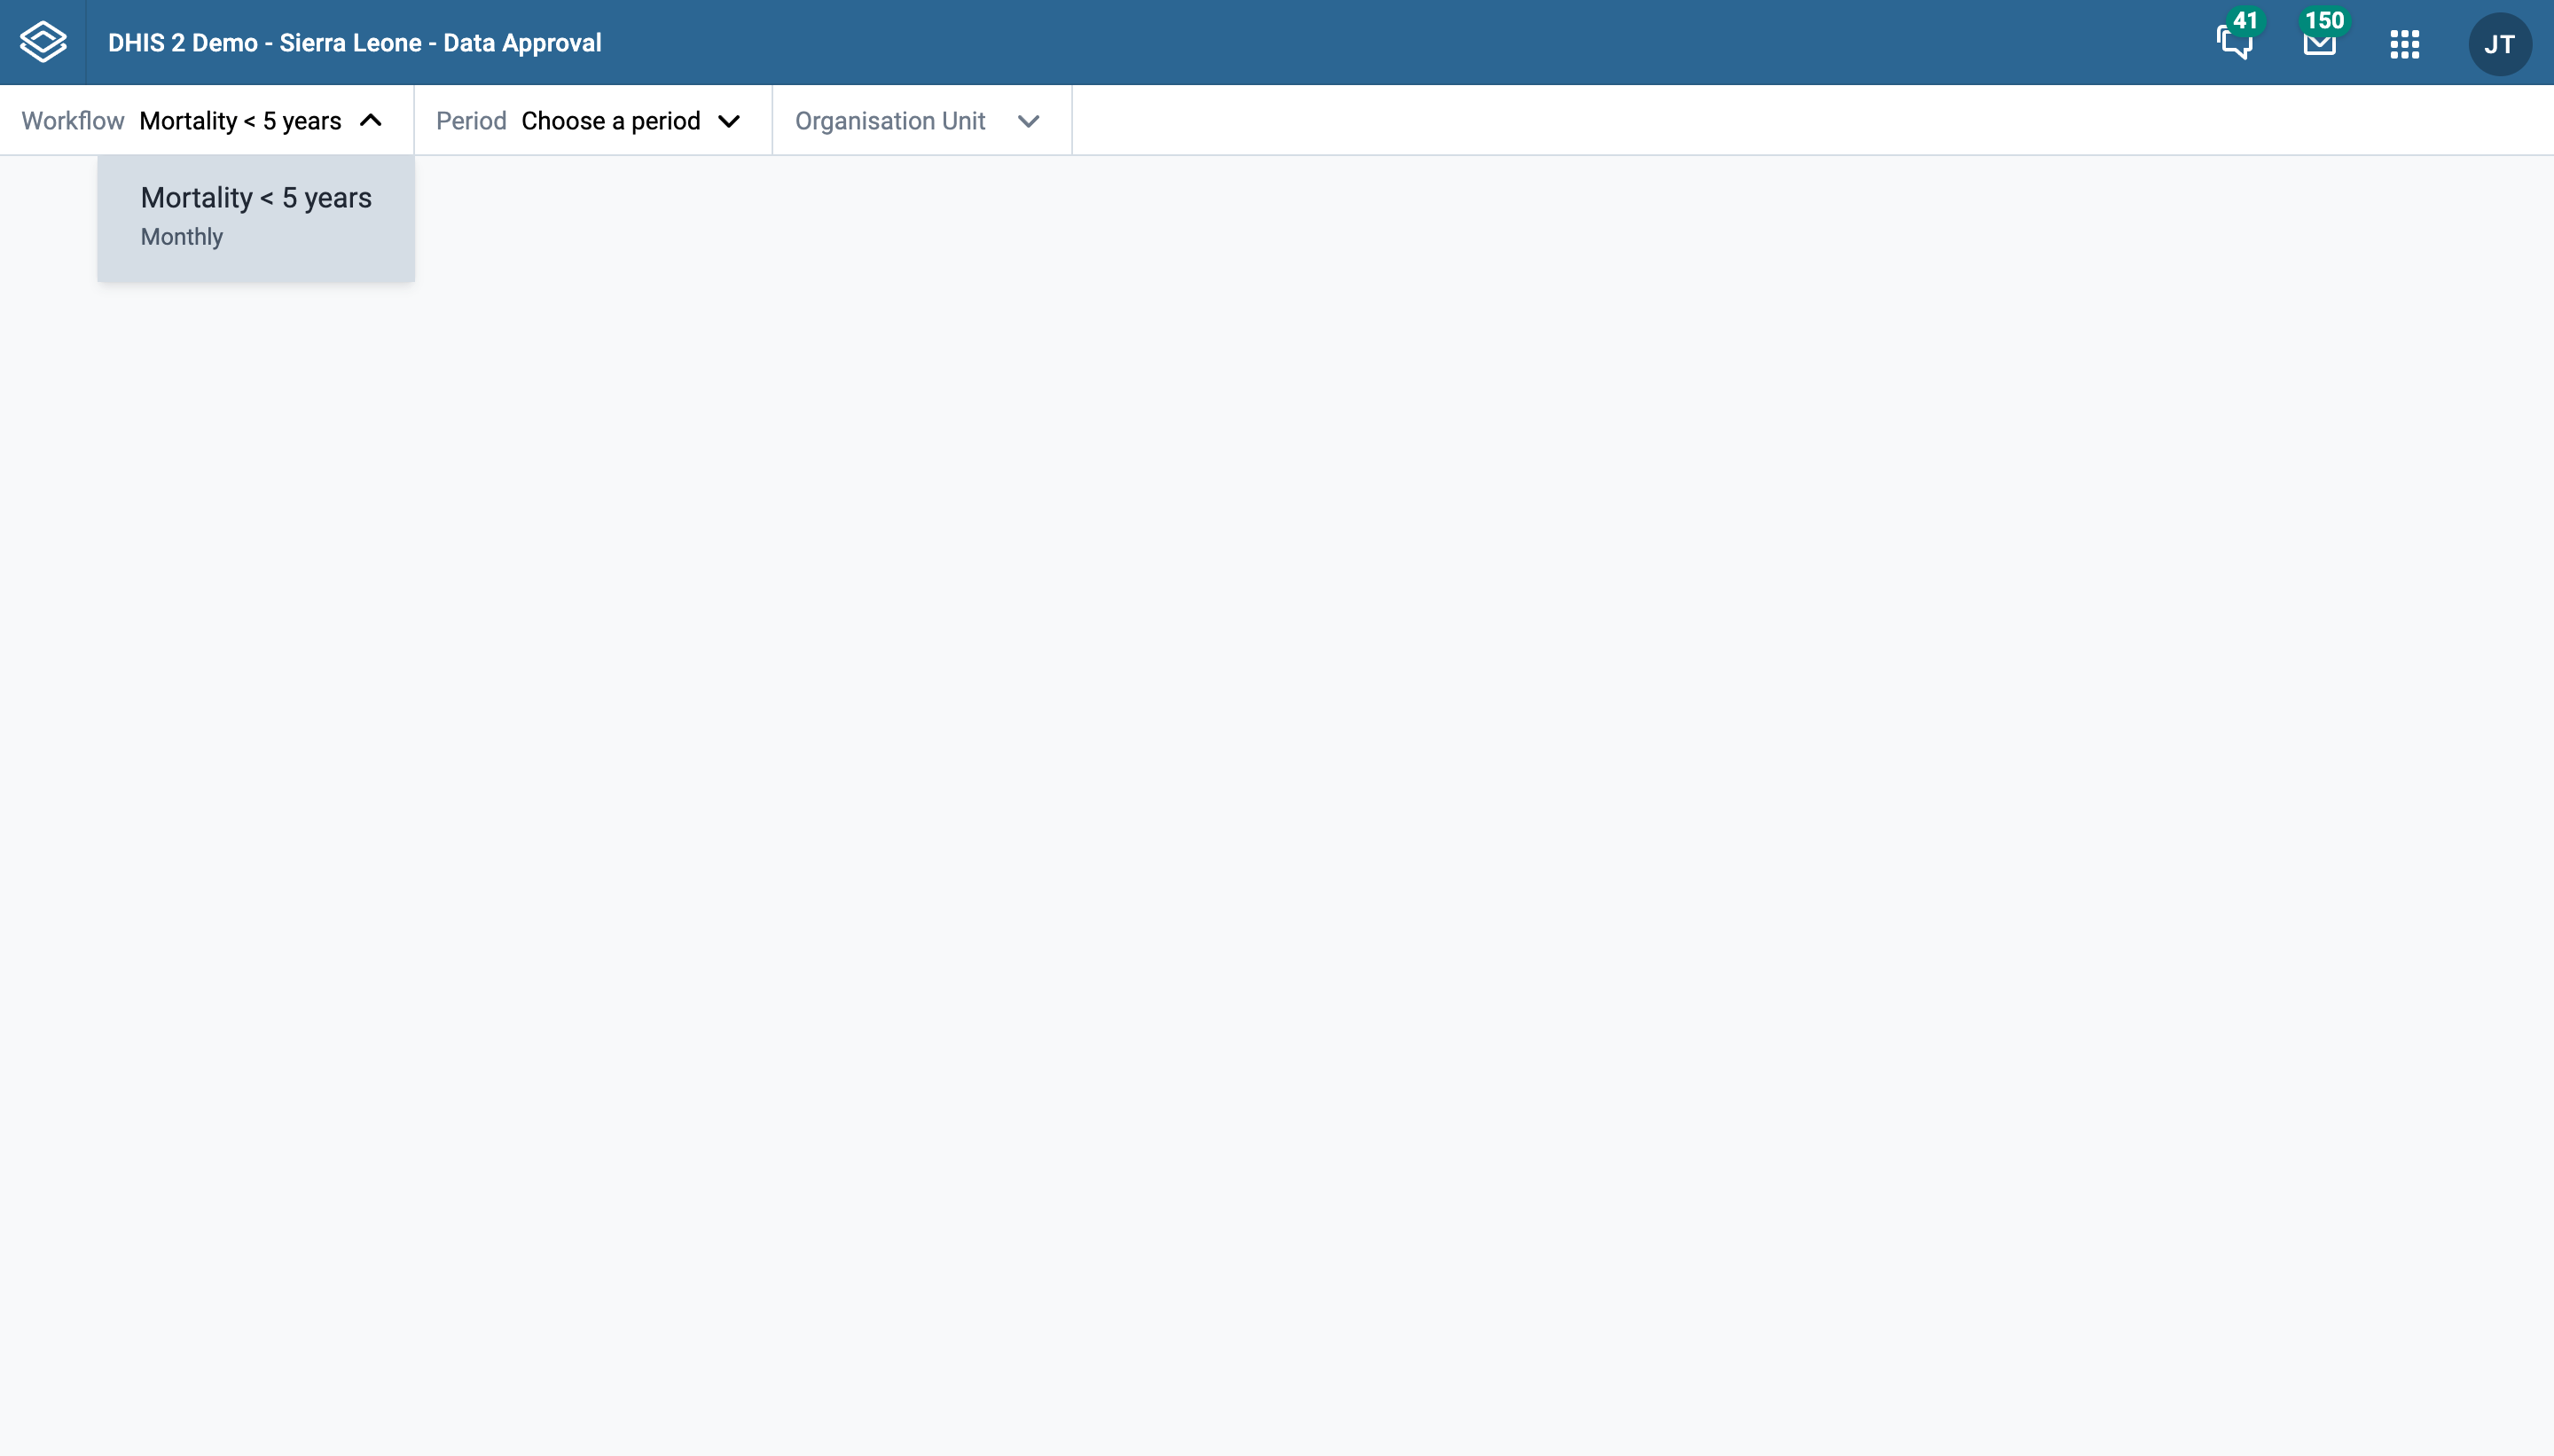
Proceed to select a period you would like to approve data for.
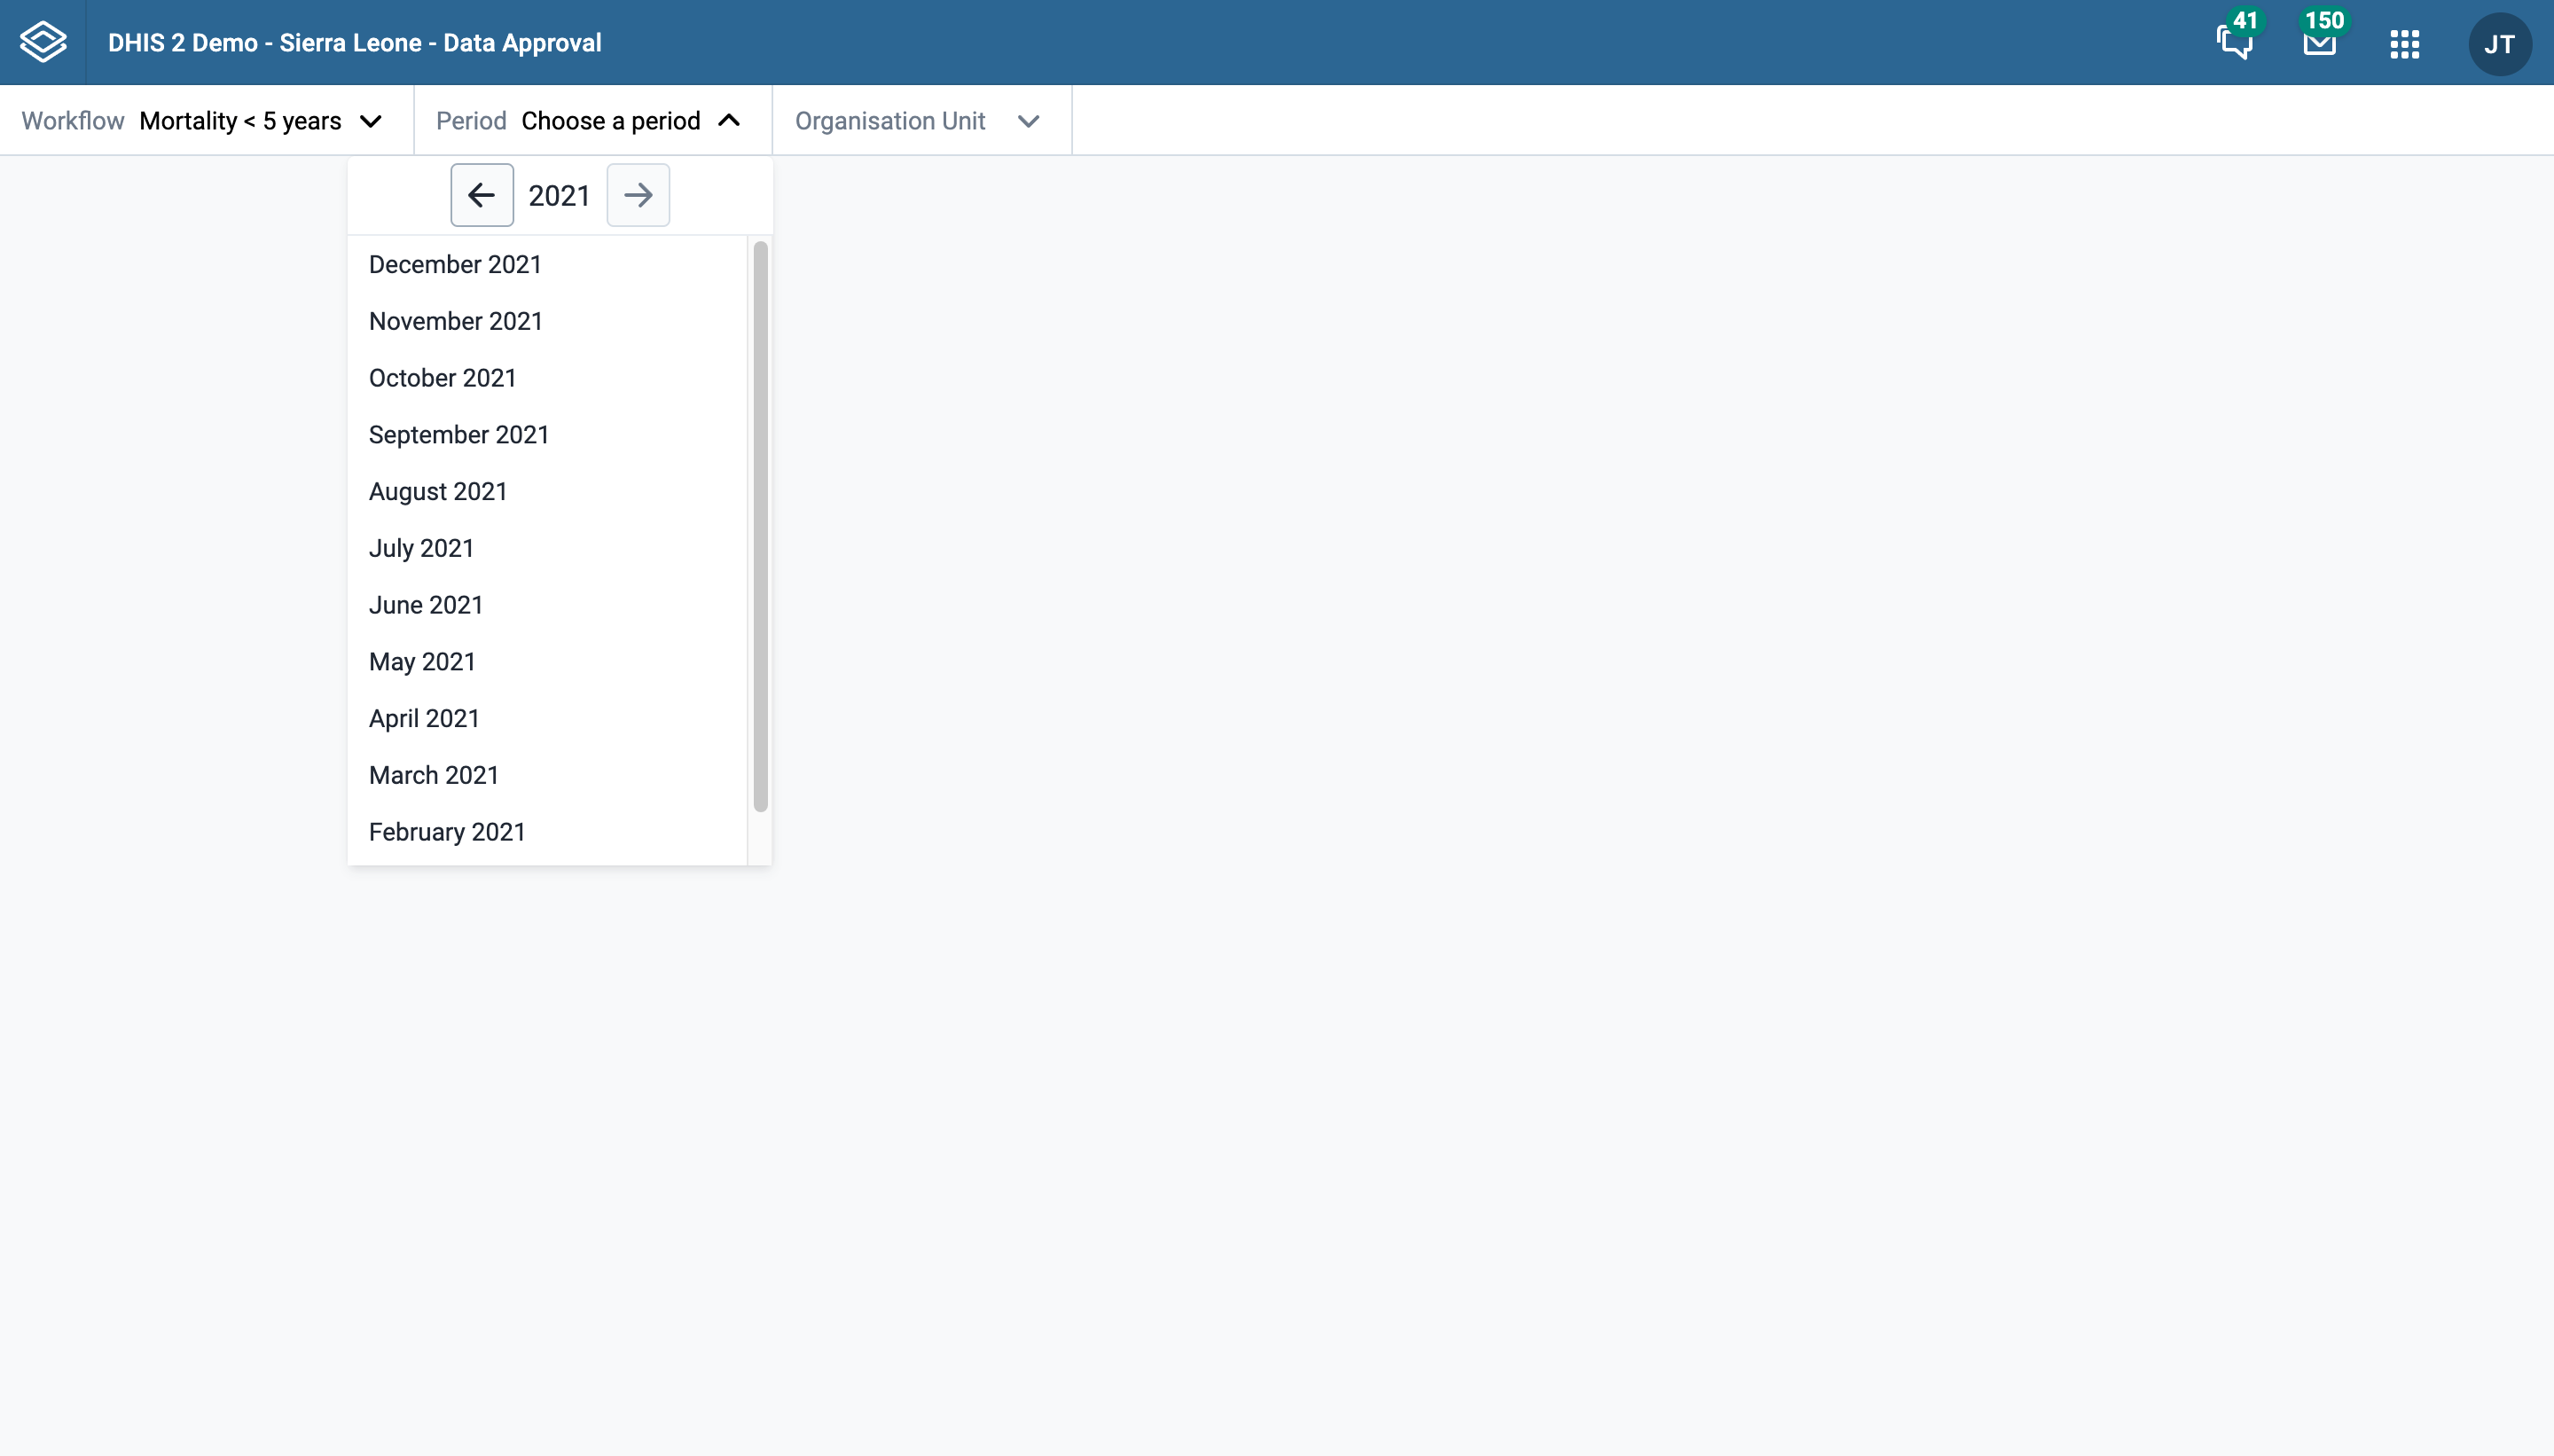
Finally, select an organisation unit you would like to approve data for. Each visible organisation unit in the tree is preceded with a status-icon. This icon serves as an indication of the actions available to your user profile for that organisation unit. In the screenshot below, "Badjia" is an organisation unit with status "ready for approval".
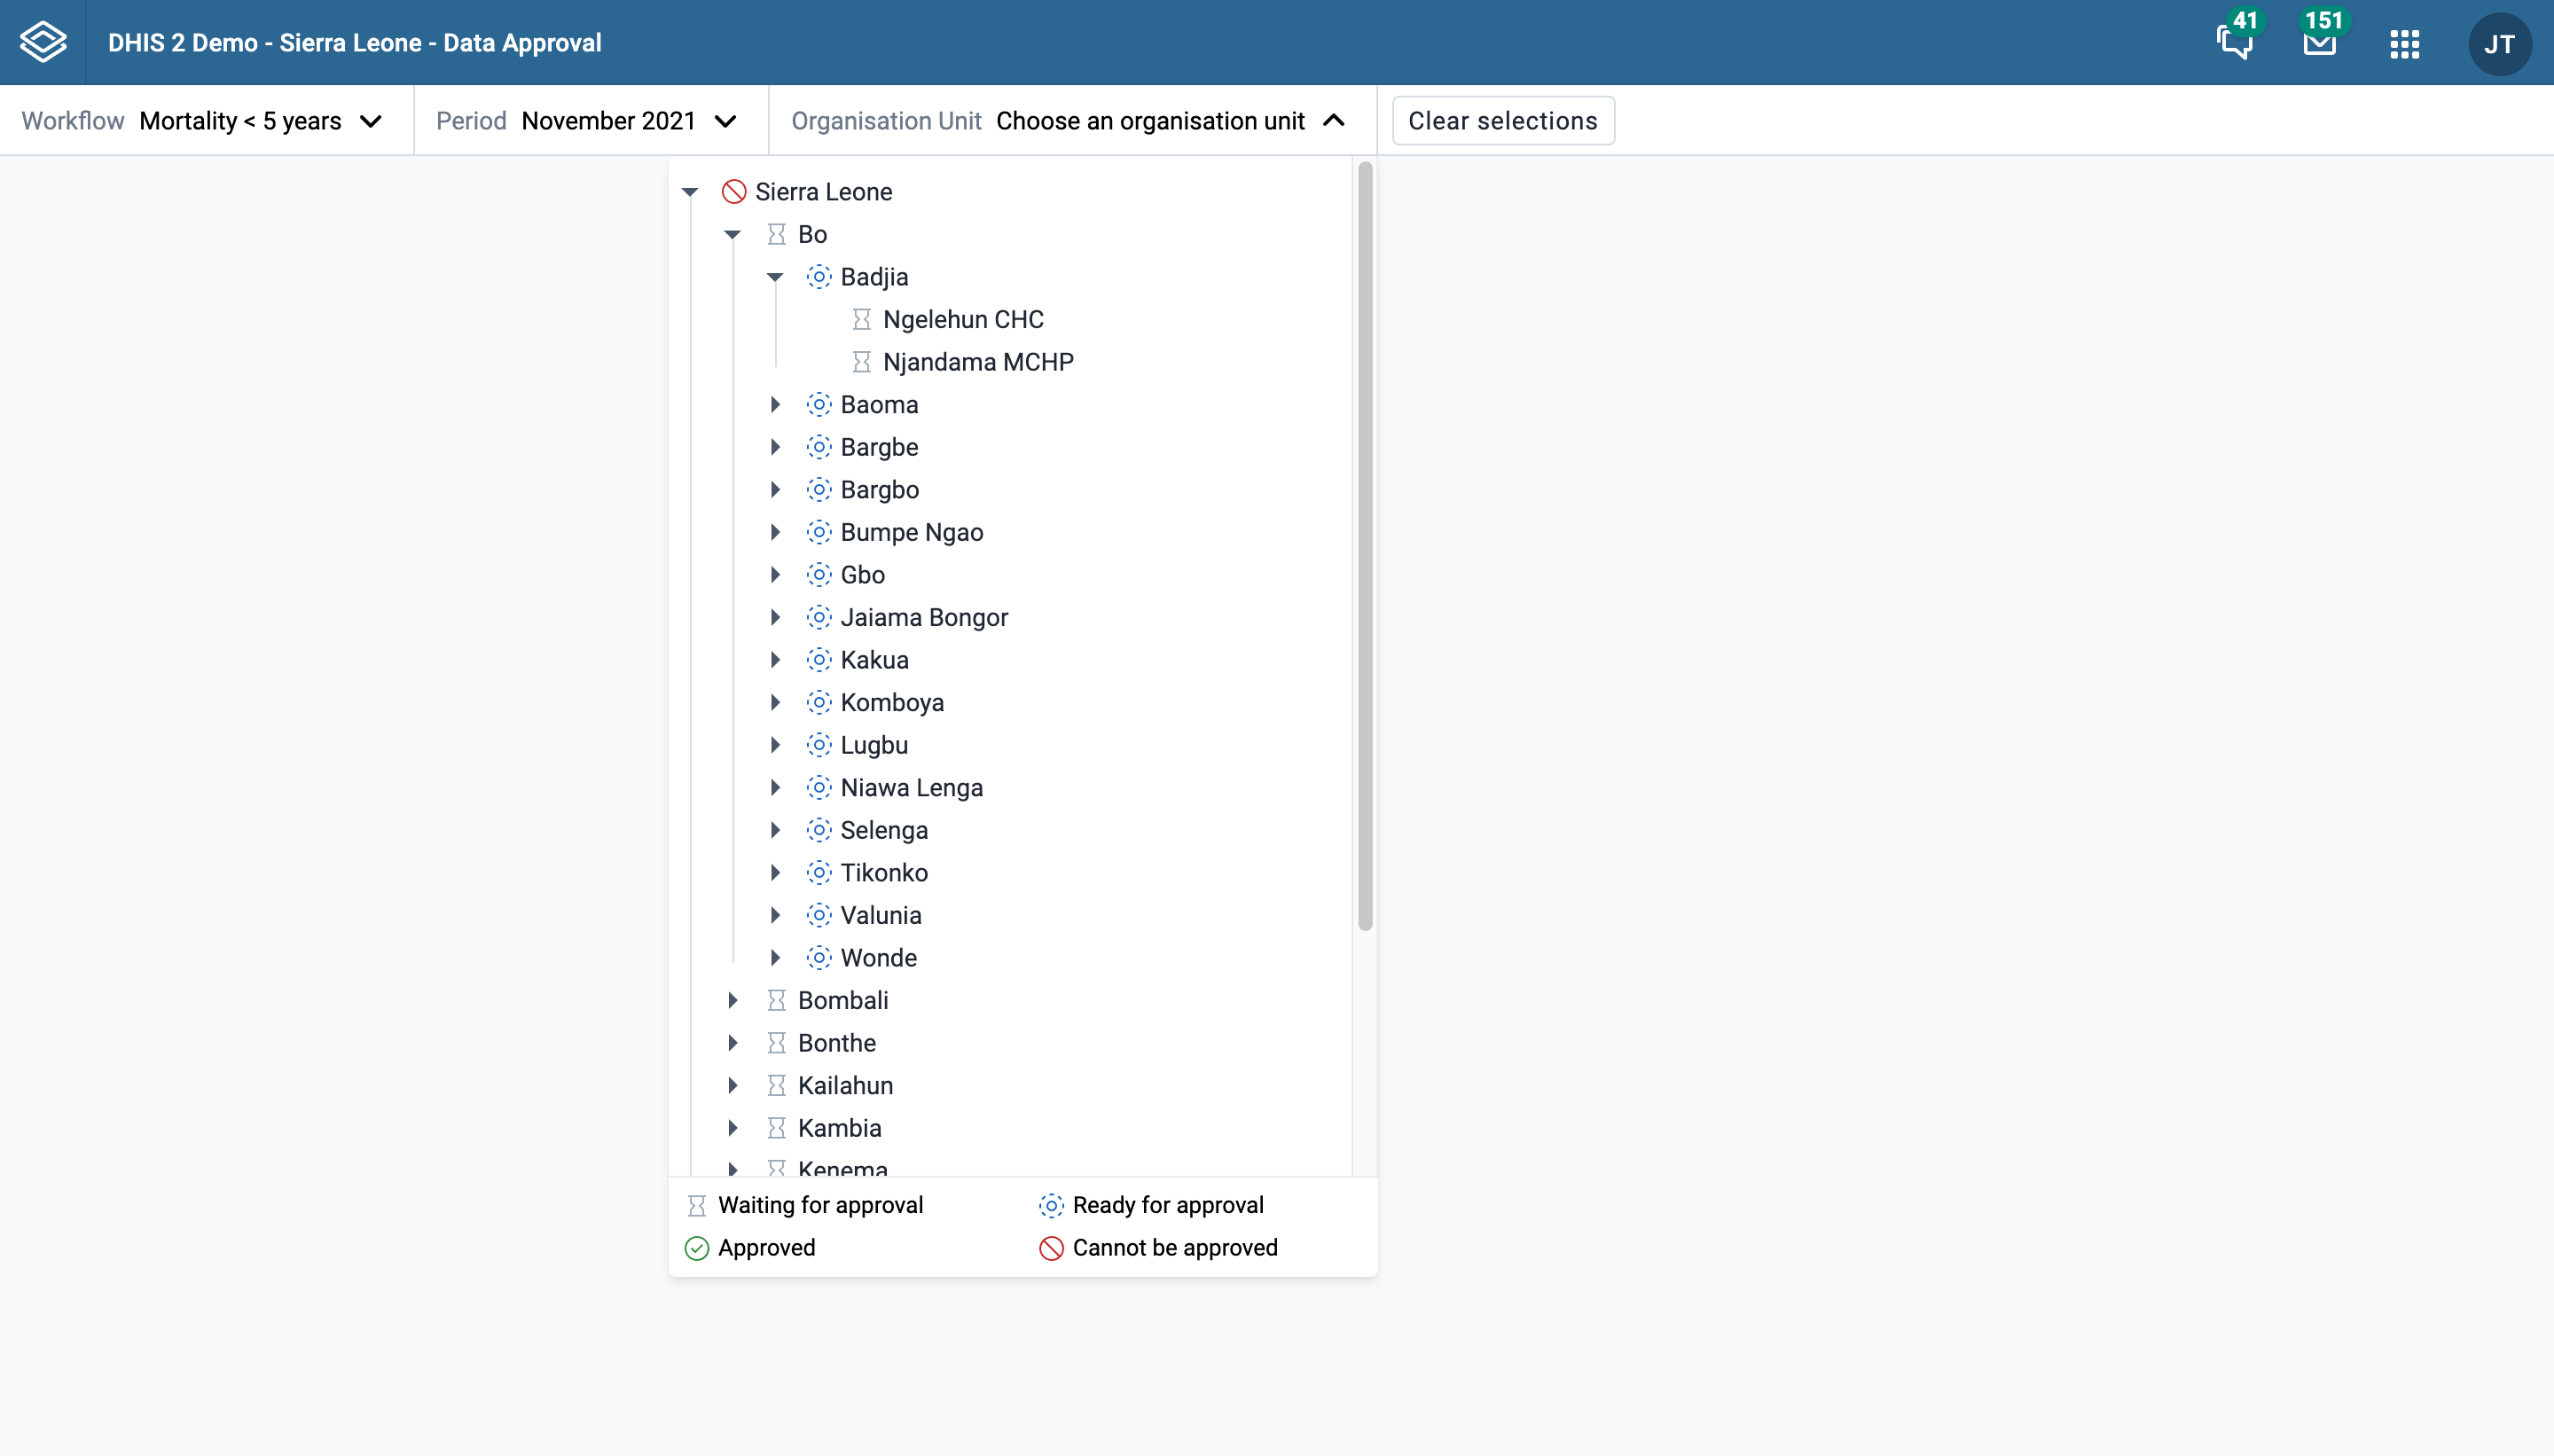
Once a workflow, period, and organisation unit have been selected, a "Clear selections" button will appear. This button can be used to quickly clear all three fields and start a fresh selection.
Once a workflow, period, and organisation unit have been selected, you can review the dataset reports for the datasets connected to the selected workflow. The data for each dataset is presented in a tab.
Datasets can have different period types than the workflow the are connected to. If this is the case, the approval app will show data for all the dataset-periods that end within the selected workflow period.
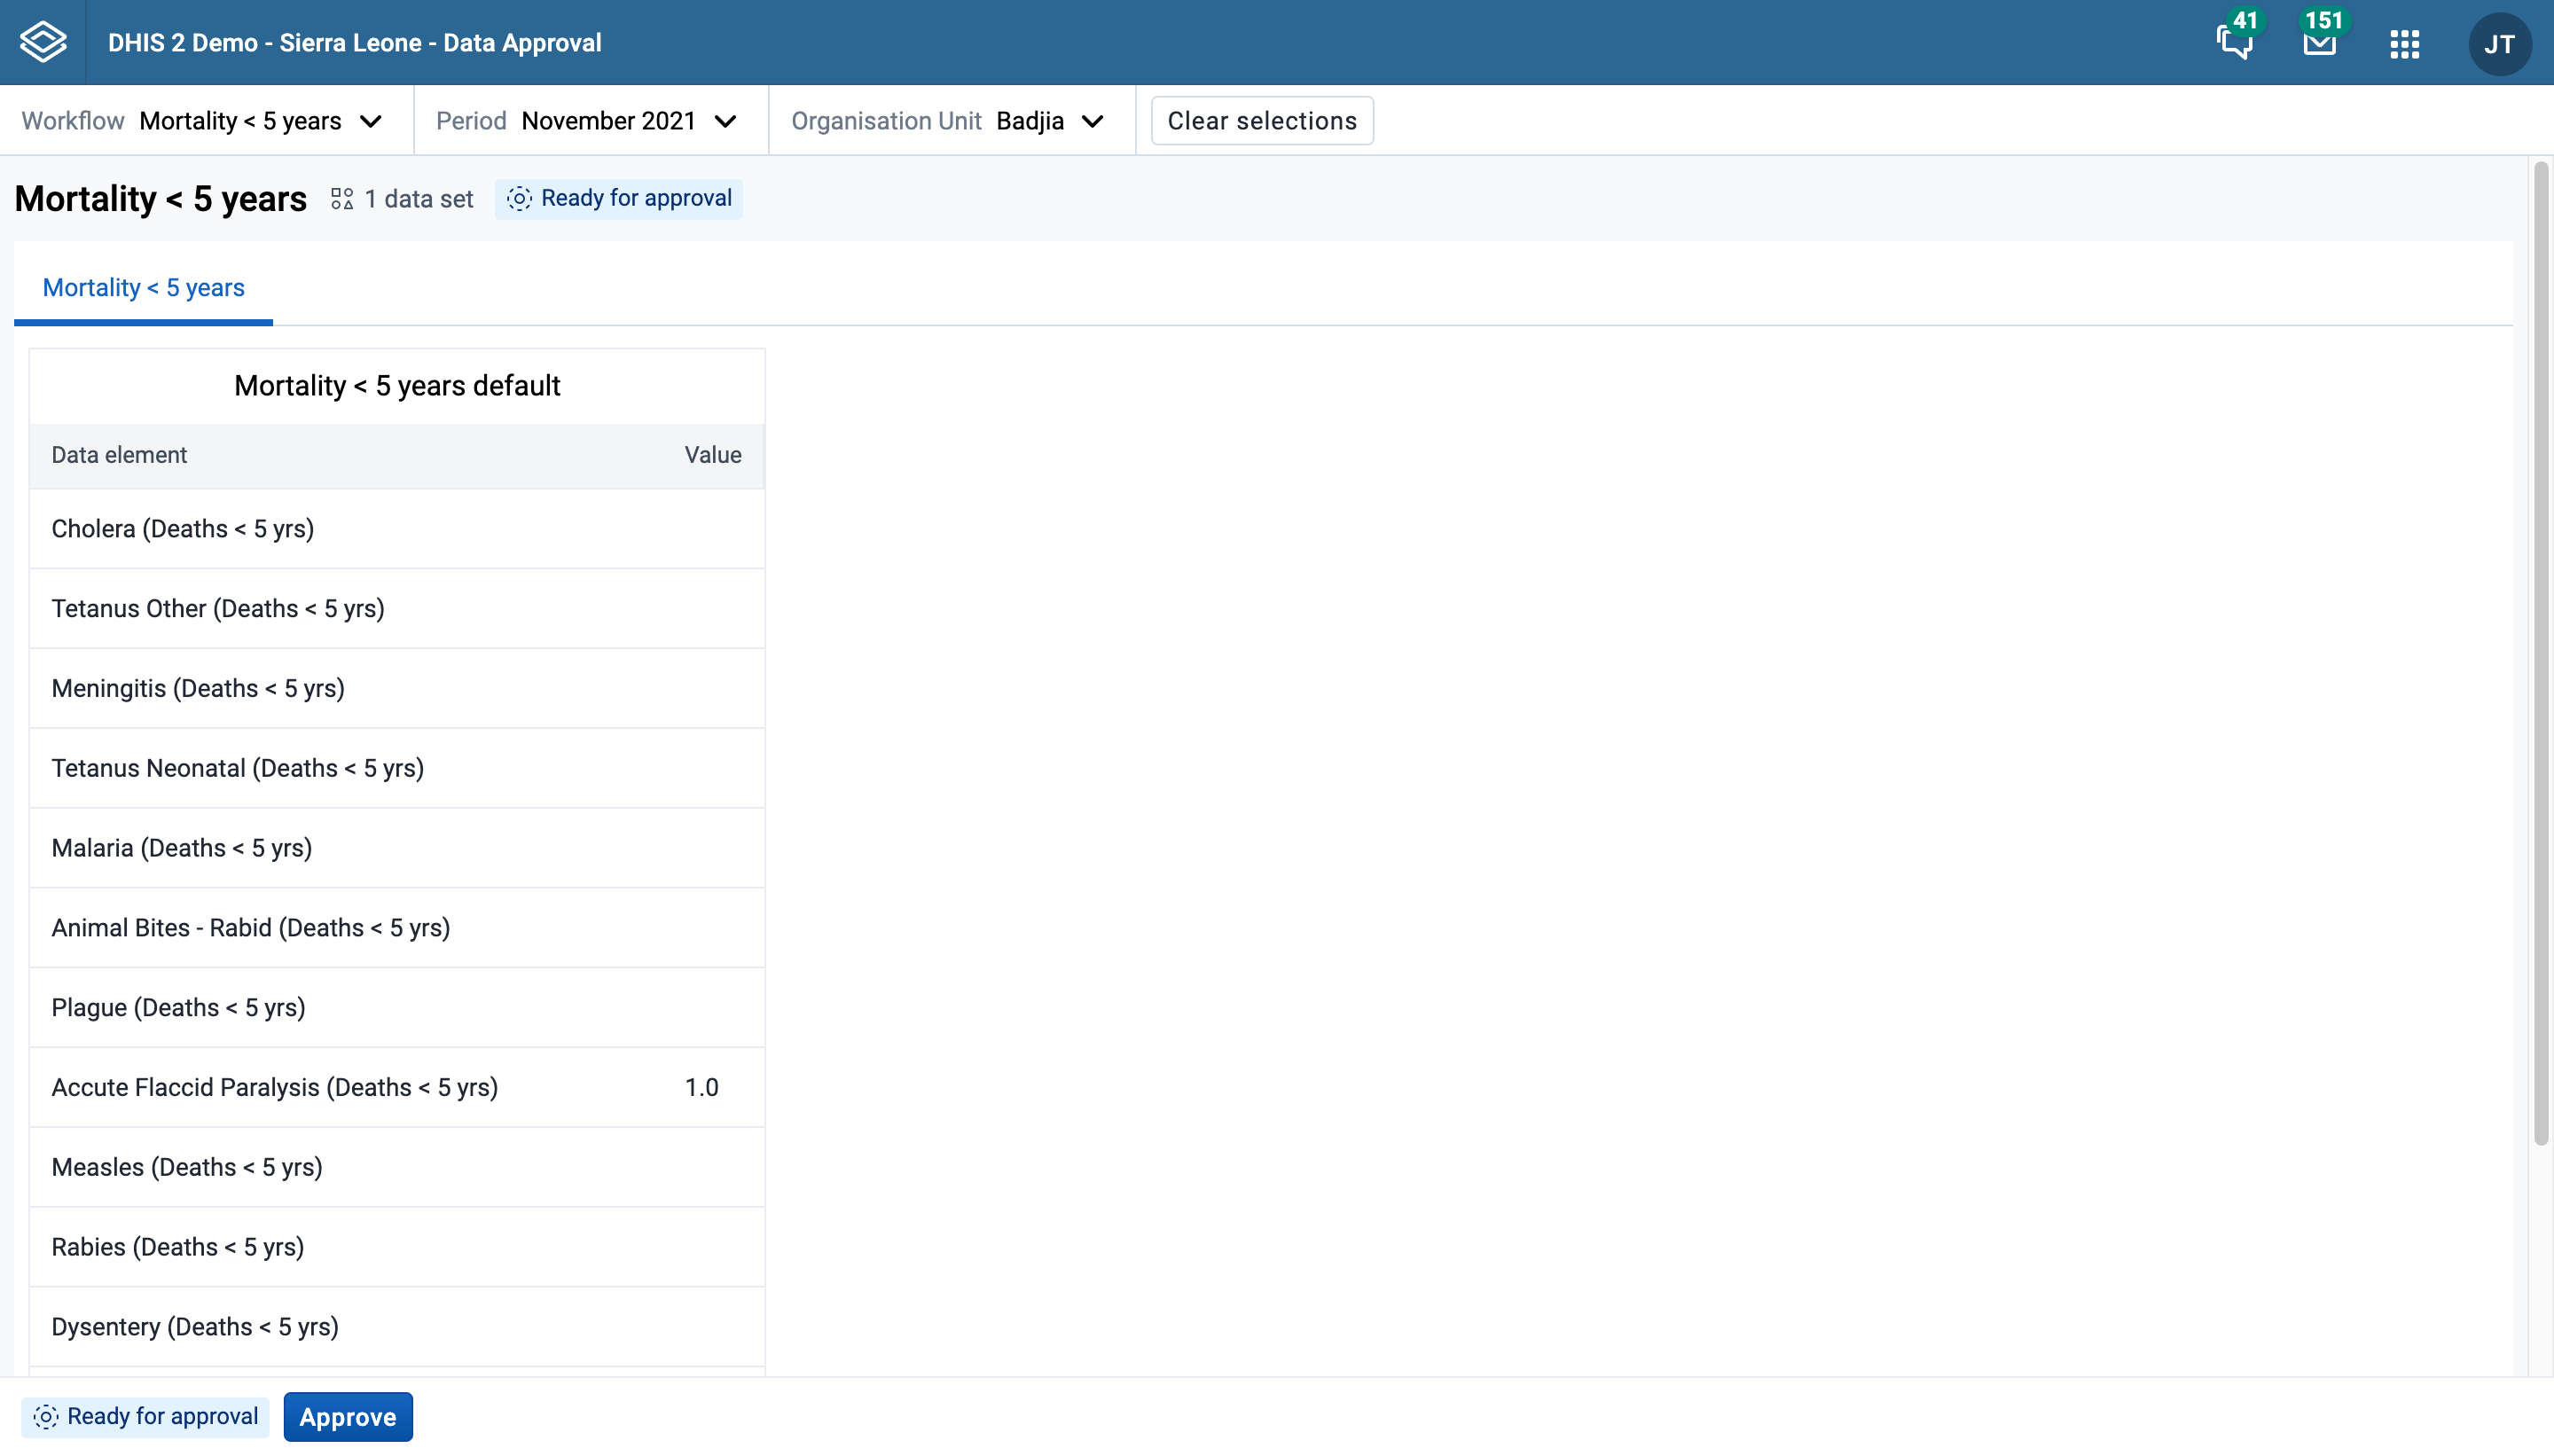
Once you have reviewed the data in the datasets, you can proceed to take an approval action. The following actions are available:
Which of these actions are available for a given workflow at a given moment in time depends on the type of actions which have been taken already at the current and other levels of the organisational hierarchy.
In the example above the "approve" action is available. When you choose the "Approve" action, you are presented with a confirmation dialog as displayed below which summarises the datasets you are approving. The workflow is not approved until you click "Approve" to confirm there. Other actions take effect immediately and do not have a confirmation step.
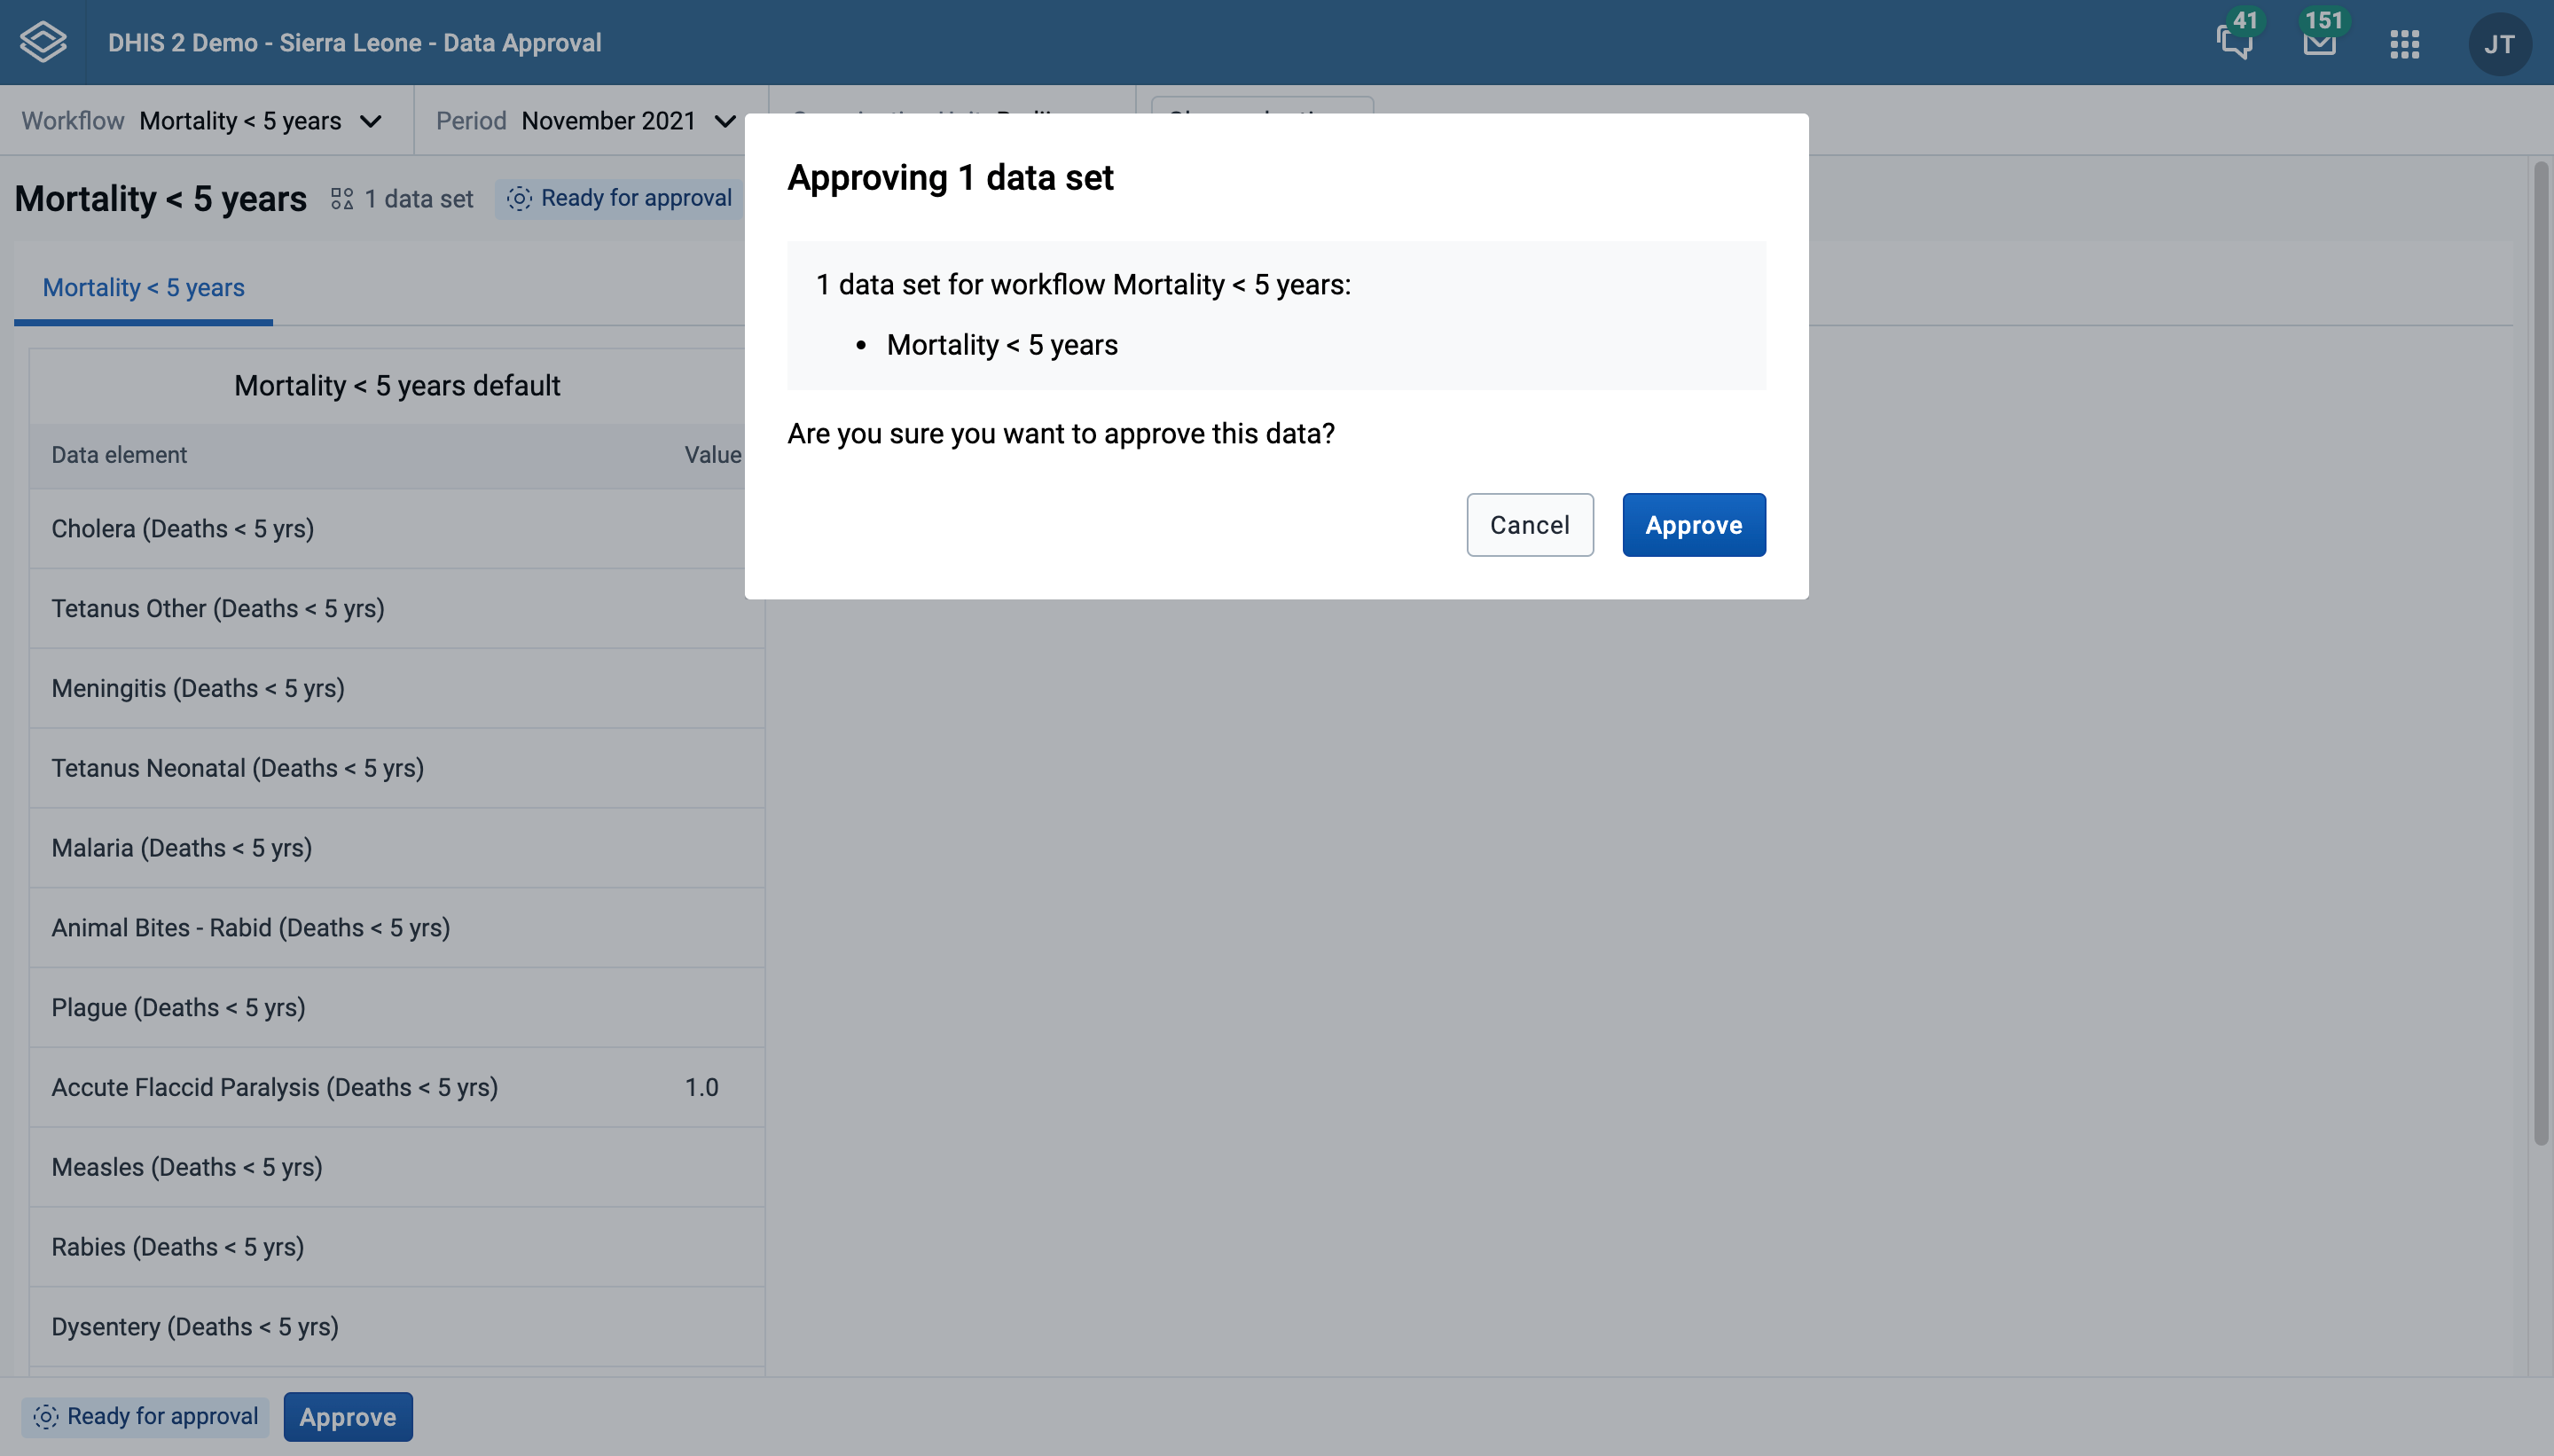
After taking one of the approval actions, in this case after confirming the approval, the workflow is updated immediately and you see a the new approval status.
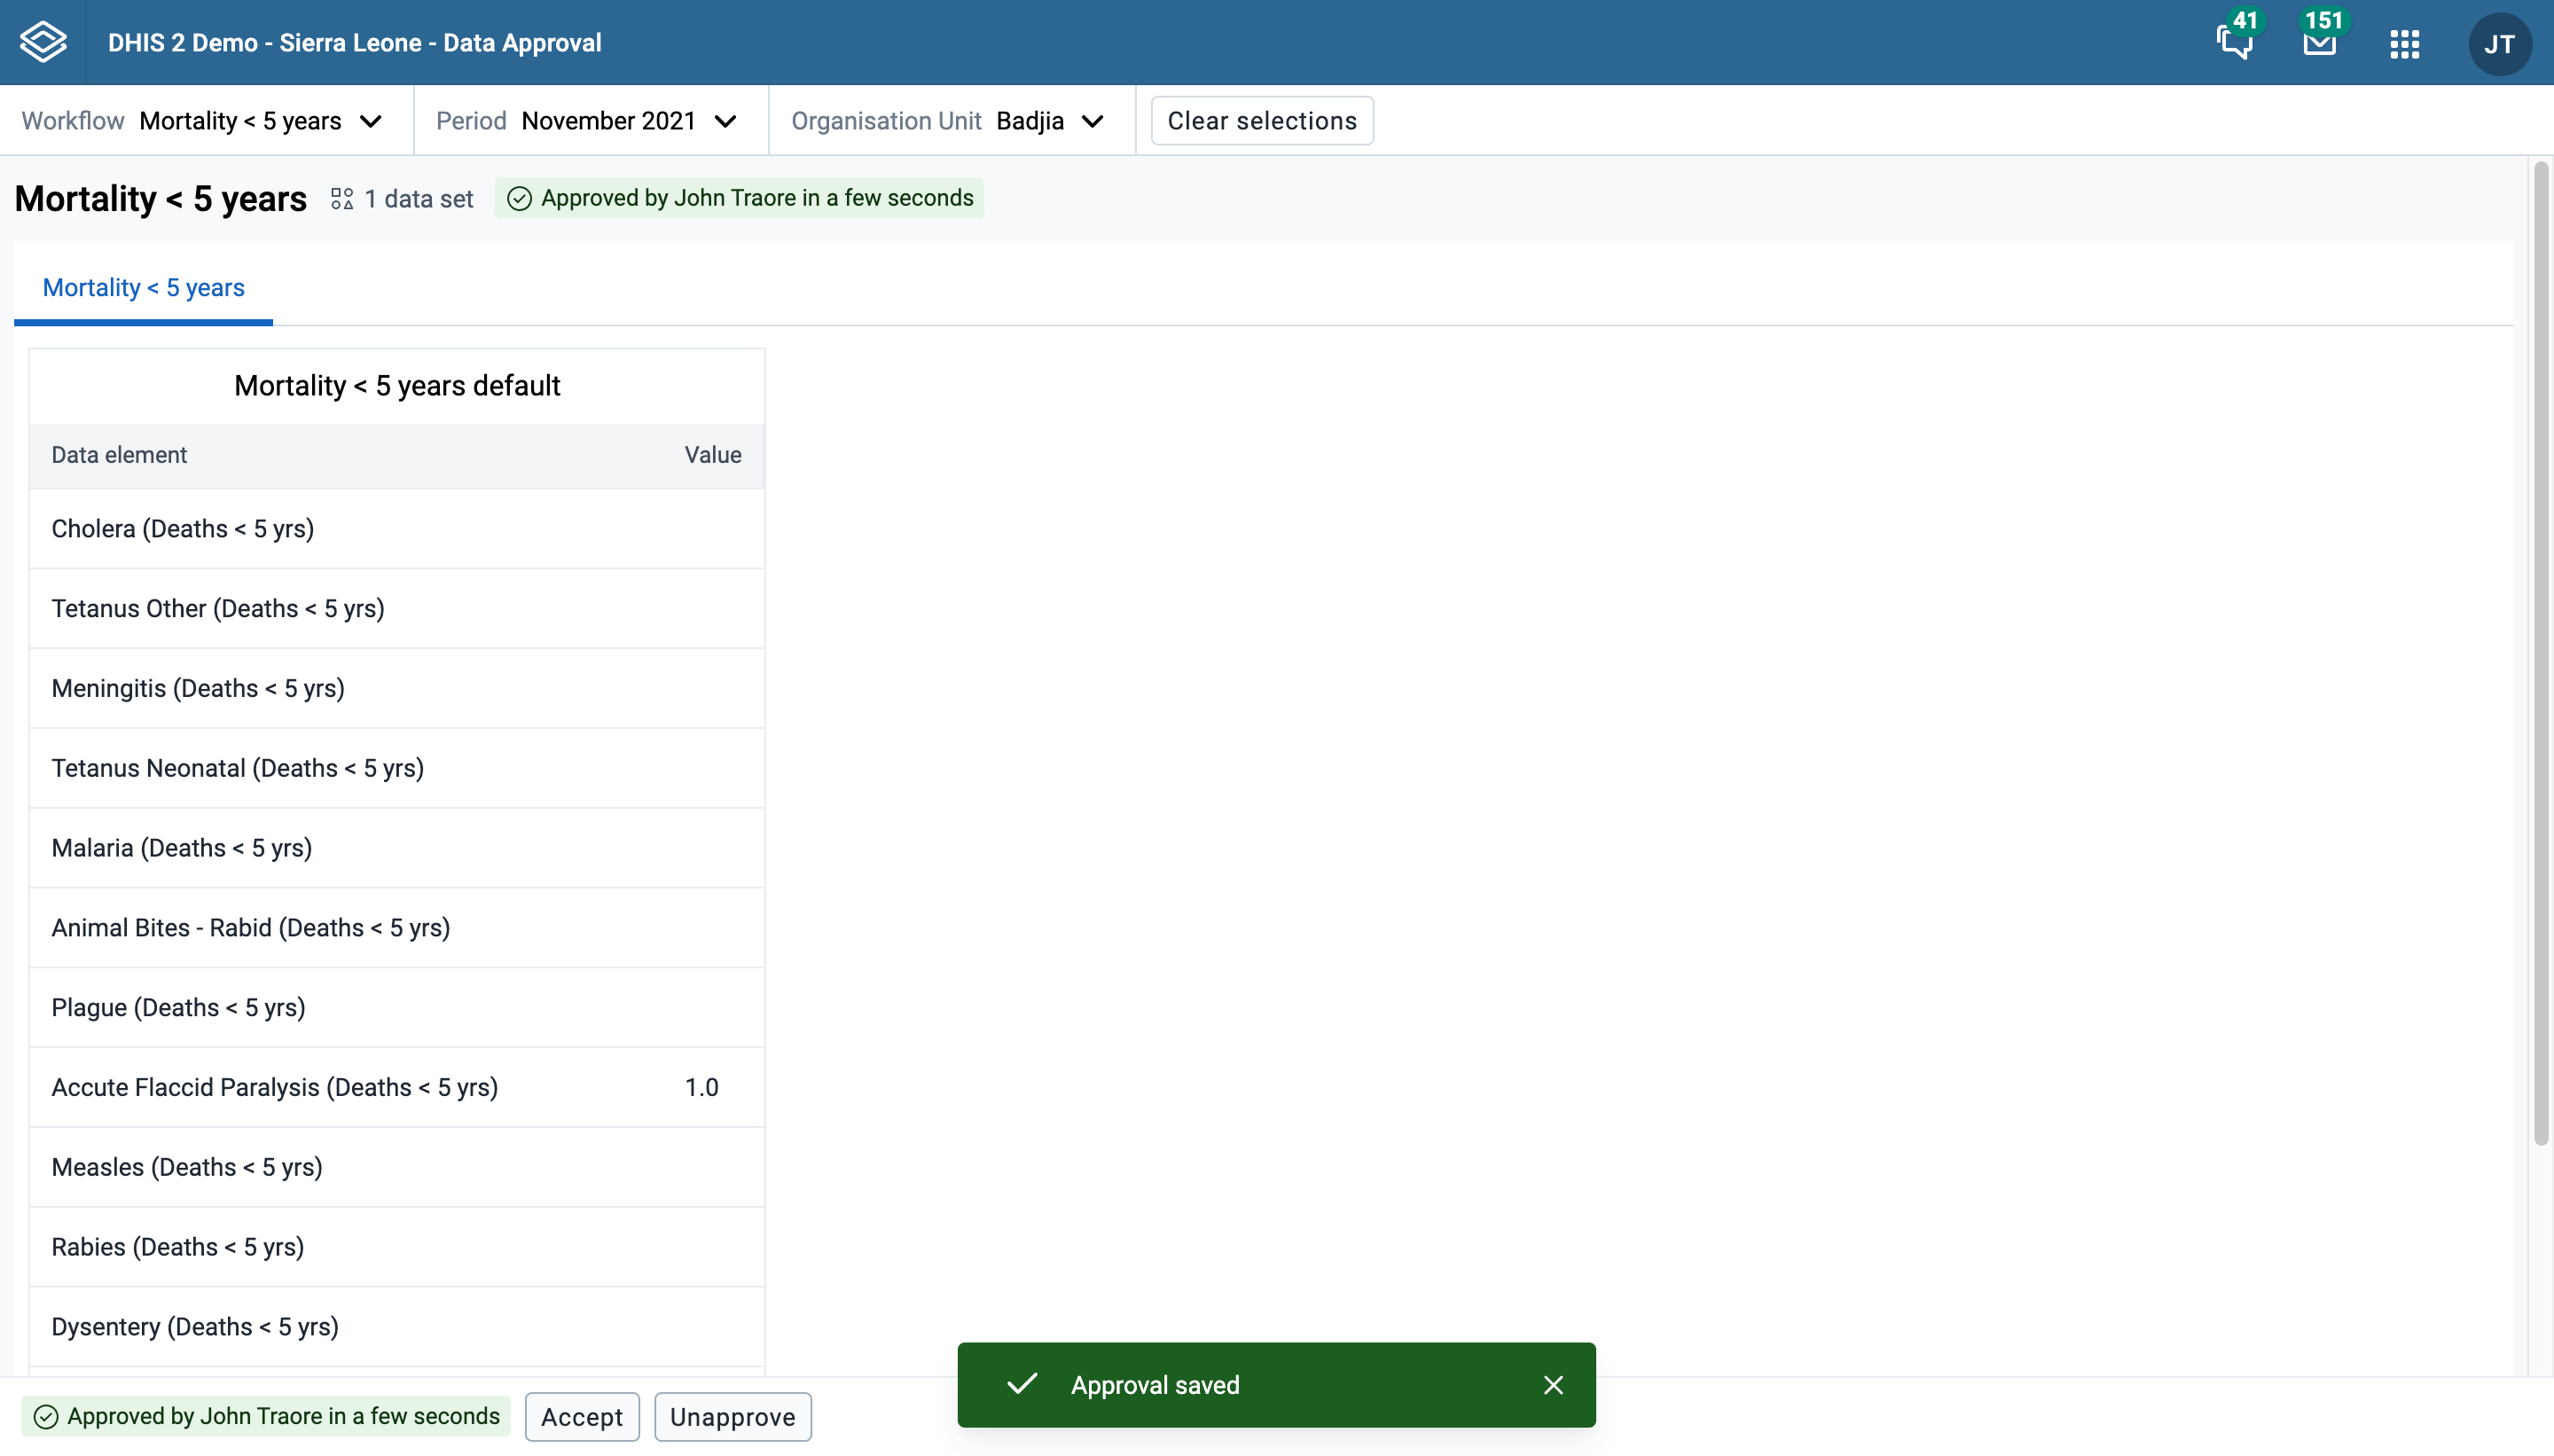
As shown in the image above, the approval status is displayed in two places:
These status tags may not always display the same information, because the have a slightly different meaning:
A workflow may be ready to be approved at a given organisation unit level, but you do not have the appropriate authority to do so.
The Dashboards app makes it possible to present a high level overview of your data, including displaying analytical objects such as maps, charts, reports, tables, and line lists, as well as displaying text-based information, resource links, plugins and app widgets.
Features of the Dashboards app include:
Dashboards have a title, description, dashboard items. The title and actions bar is at the top of the page under the header bar, and shows the title, a dropdown for searching and selecting dashboards, and actions that can be taken with the current dashboard. There is also a + button for creating a new dashboard.
The Dashboards app has two modes: view and edit/create. When you first log in to DHIS2, your most recently used dashboard will be displayed in view mode, if you are on the same computer as you were previously. If you are using a different computer or browser, then the first starred dashboard will be displayed. If there are no starred dashboards, then the first dashboard (alphabetically) will be displayed. Starred dashboards always show first in the dashboard list.
Below is a dashboard named "Antenatal Care", which has been populated with charts and maps:
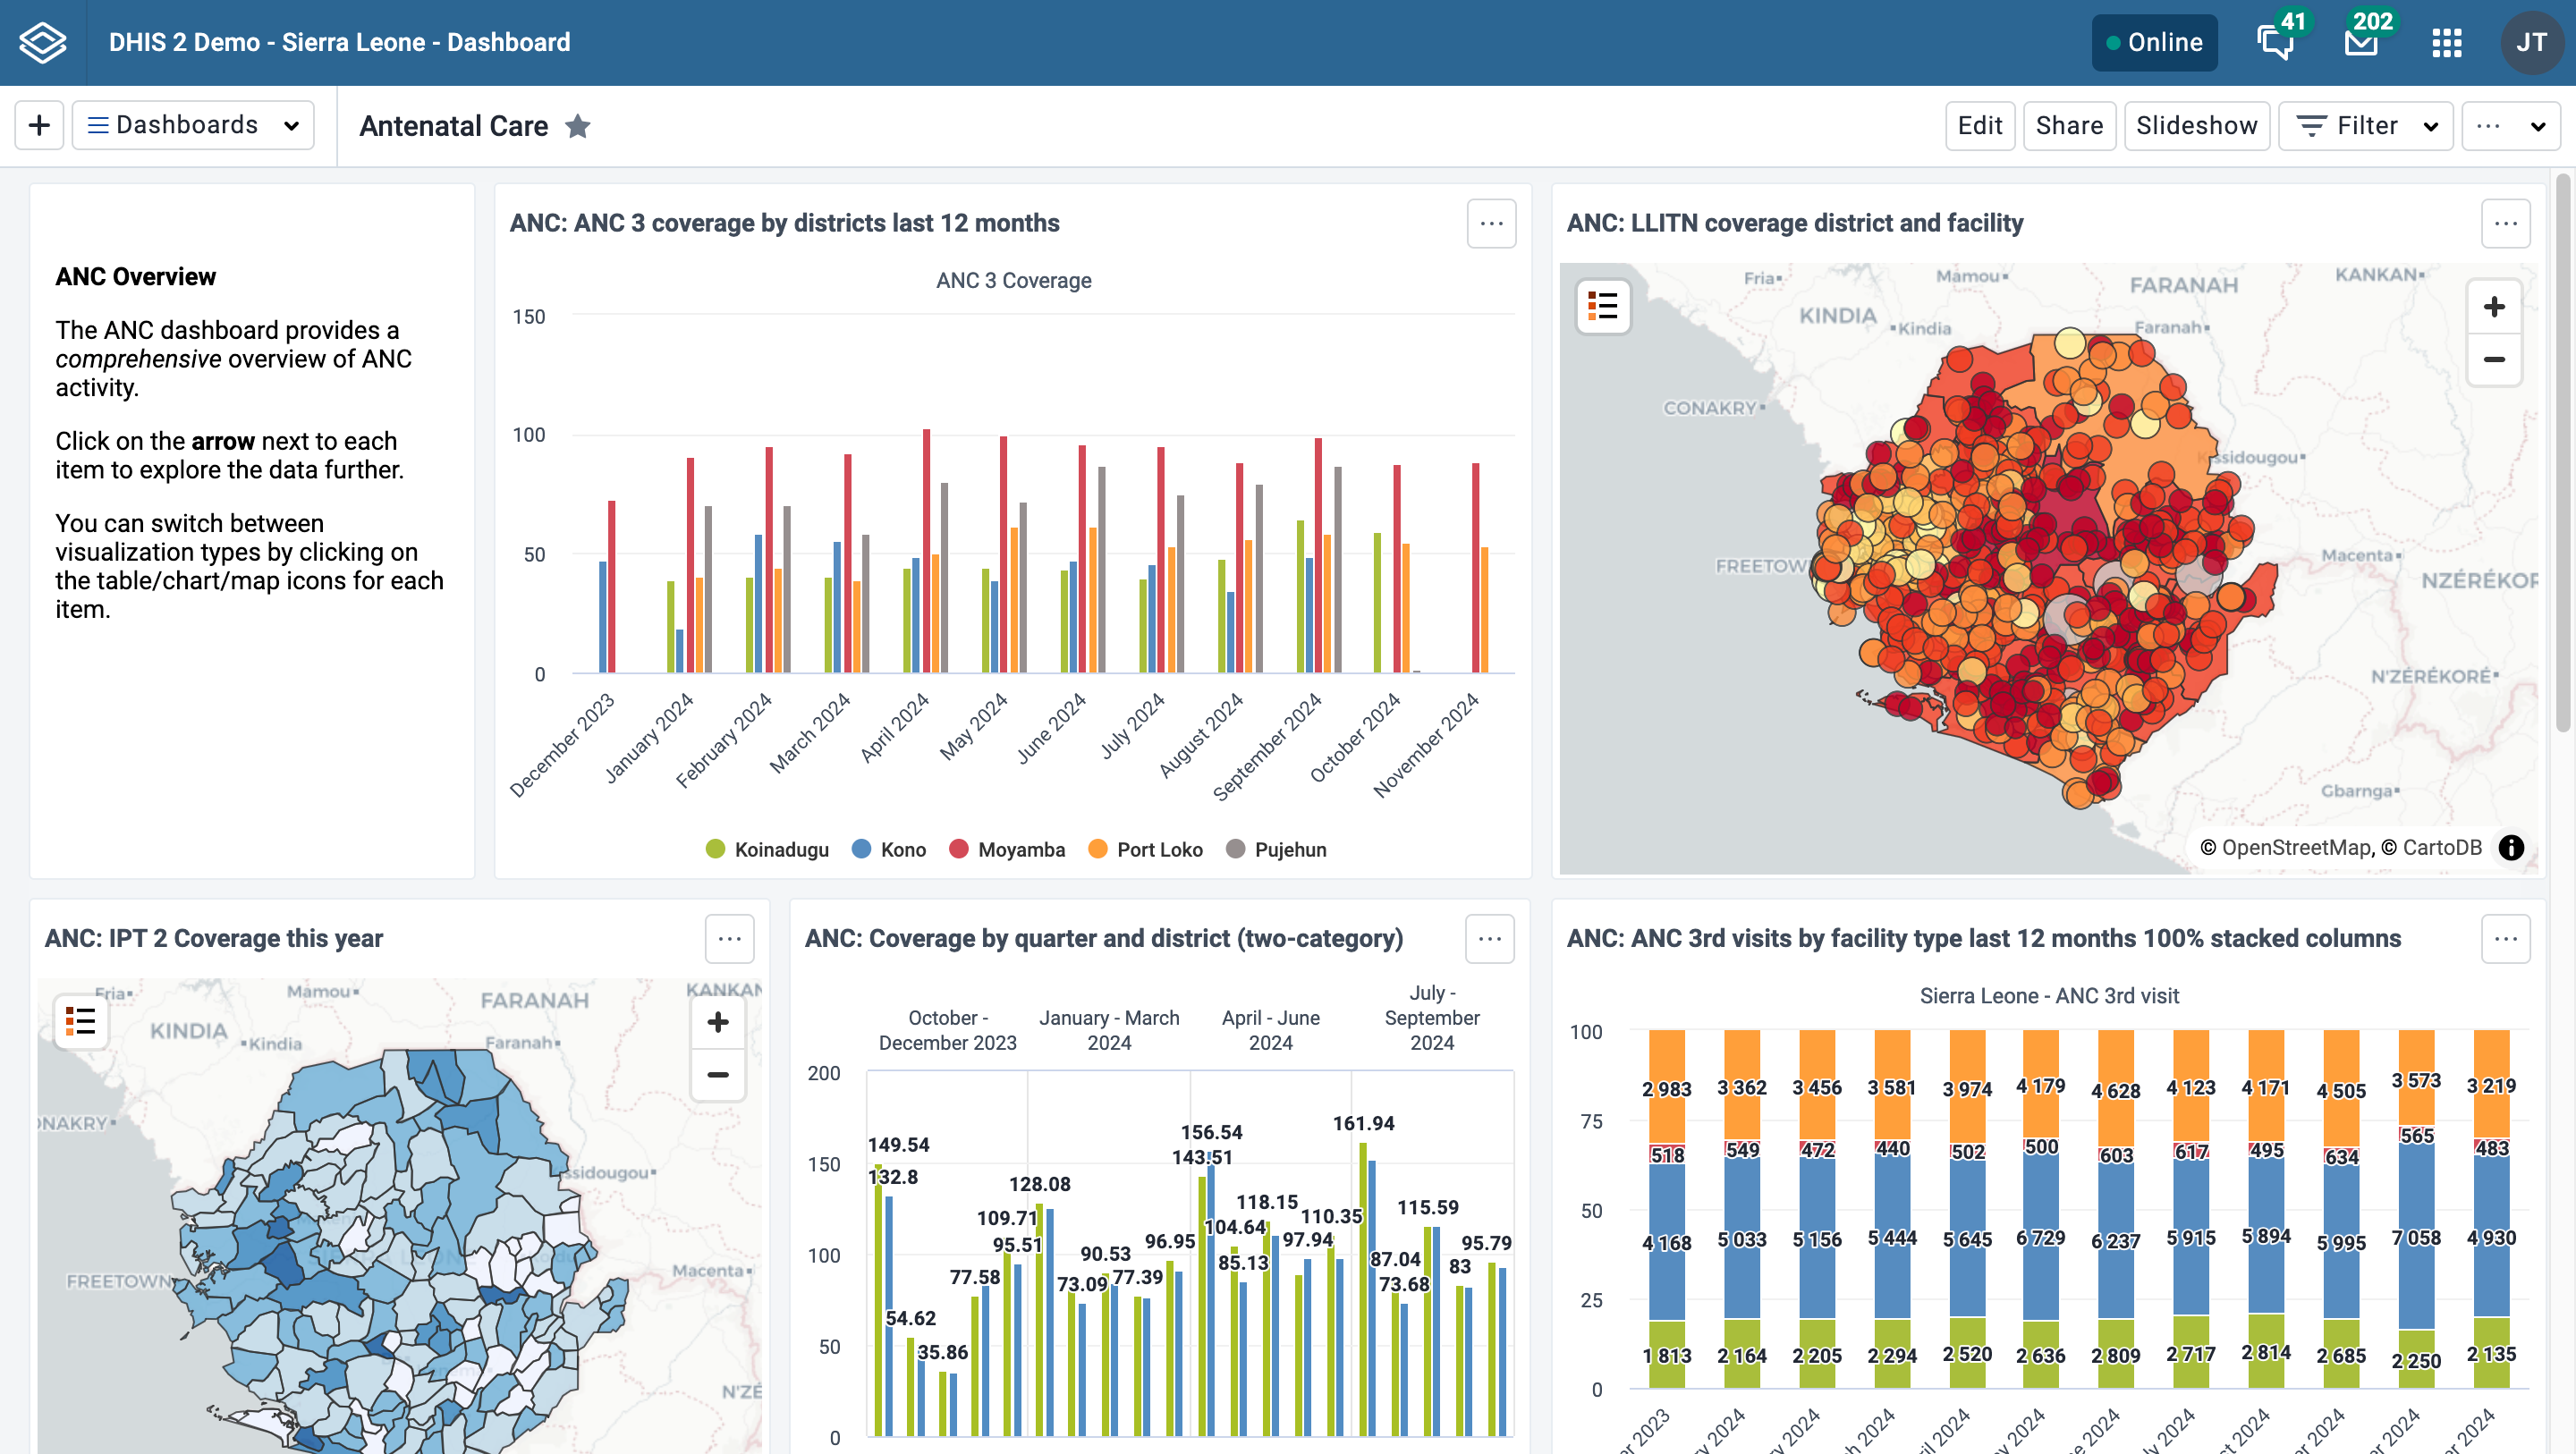
To adjust the Dashboards app to suit your needs, you can:
When viewing dashboards on small screens like mobile phones, the dashboard will adapt to the screen and show all items in a single column. Some options, including editing, filtering and sharing, will not be available.
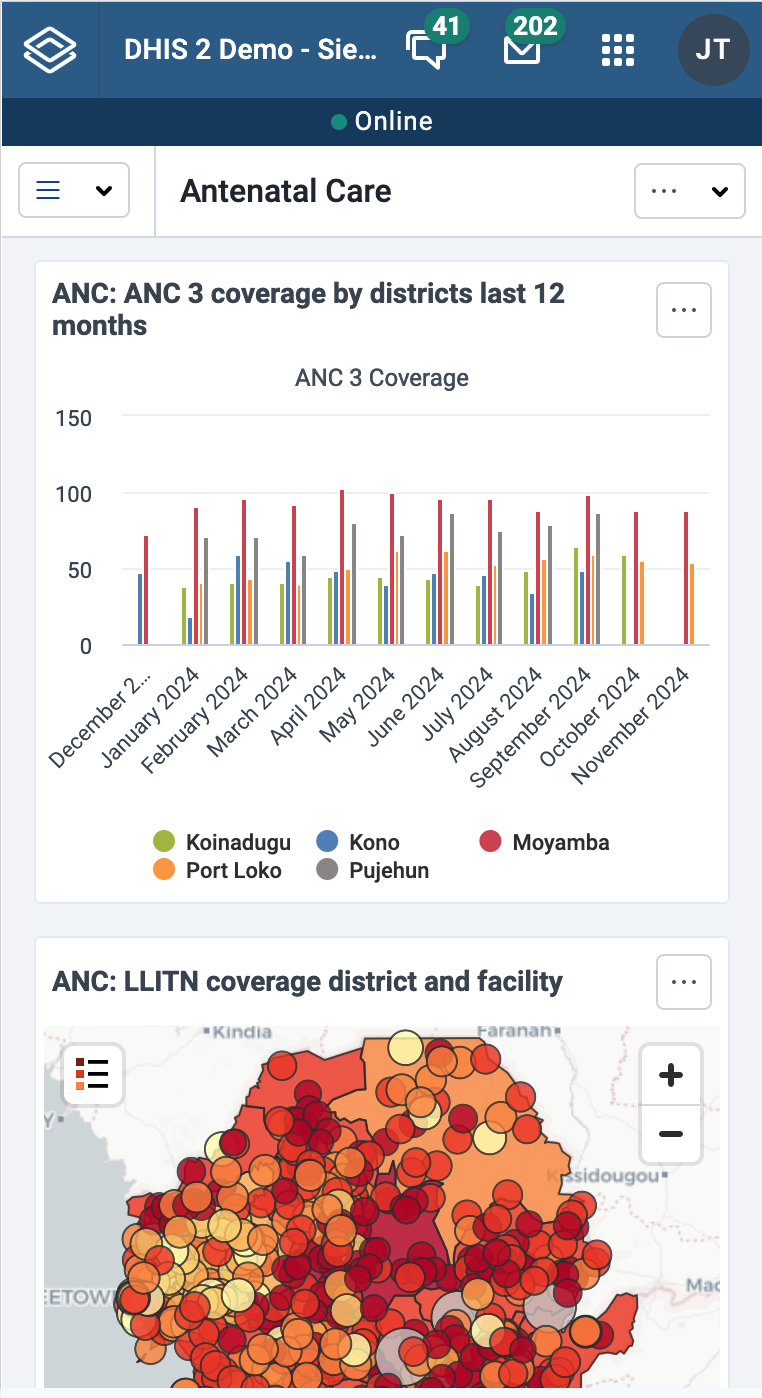
You can search for a specific dashboard using the search field available from the Dashboards dropdown selector in the title bar. The search is case insensitive, and as you type, the list of dashboards will be narrowed down to those that match your search text.

To create a new dashboard, click the + button in the upper corner of the title bar to enter create/edit mode:

To edit an existing dashboard, click the Edit button (you must have edit access to see this button):

In create/edit mode, you can add or change the dashboard title, description, dashboard code and dashboard items. If you do not add a title, the dashboard will automatically be titled "Untitled dashboard".
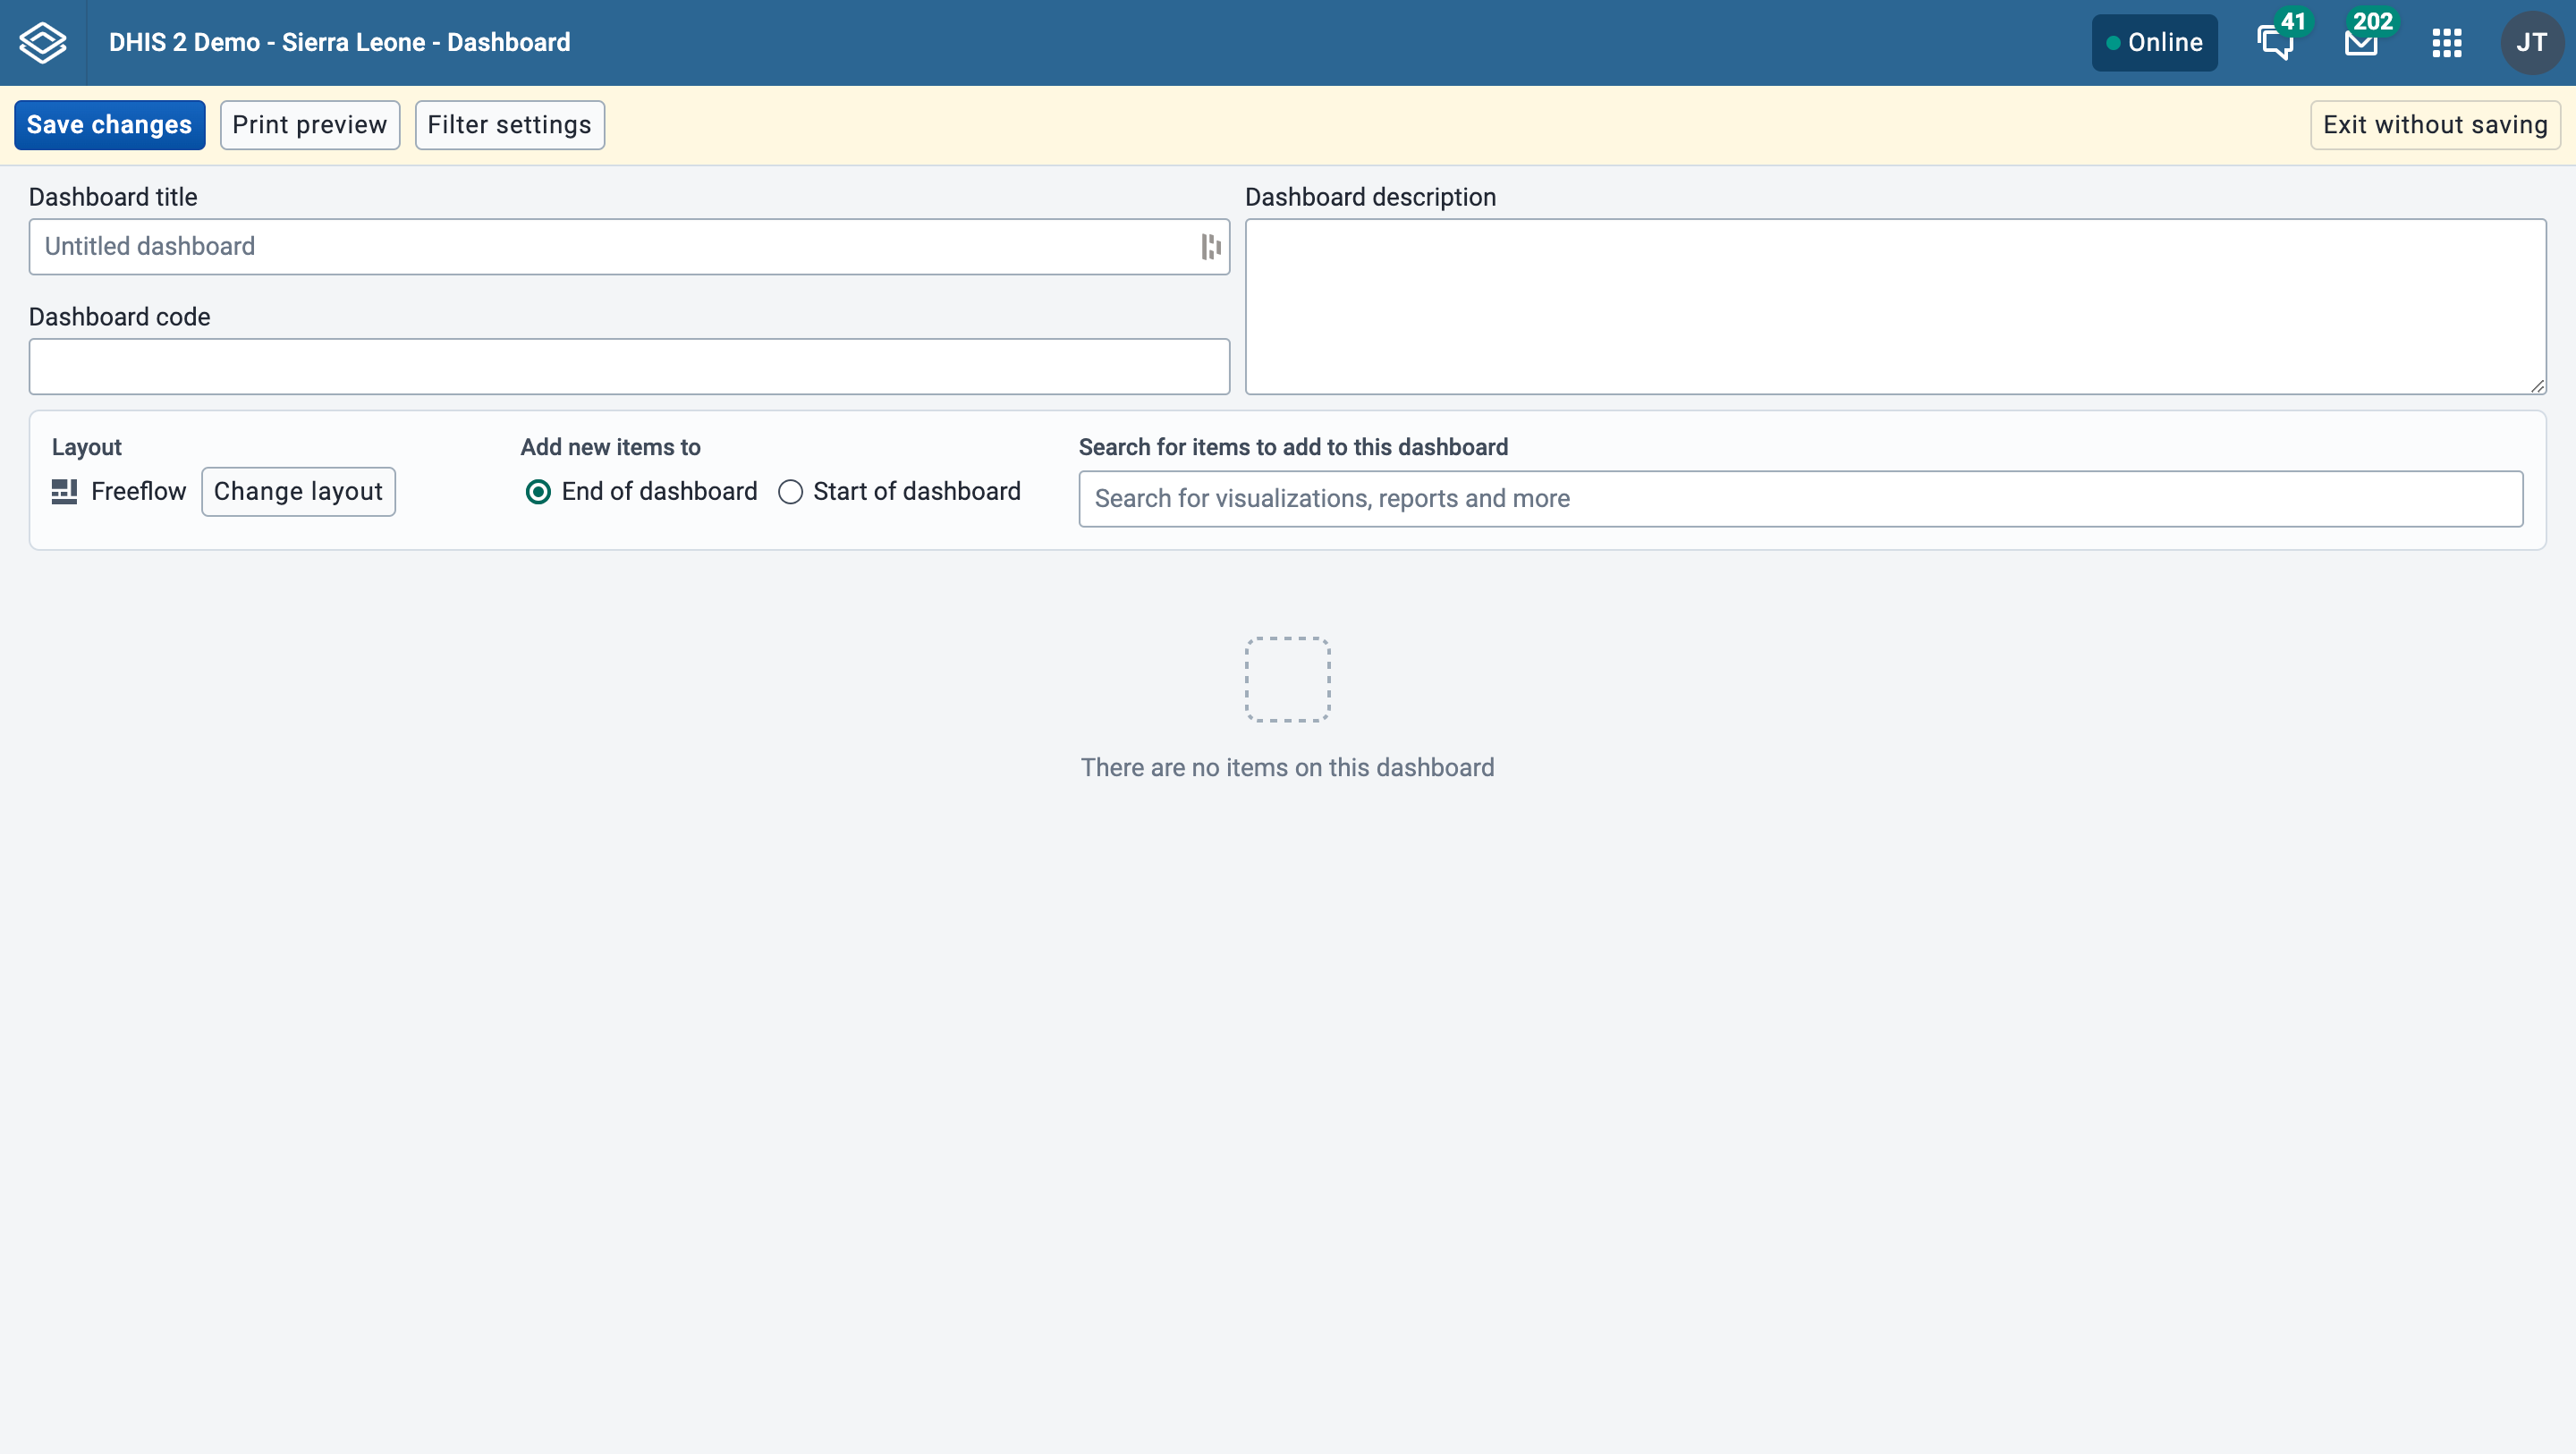
If the system has been configured to support embedded dashboards, then you will have the option of creating a regular (internal) dashboard or embedding a dashboard from an external source. See this section for more information.
Add items to the dashboard by searching for items using the Search for items to add to this dashboard dropdown selector. Item types are:
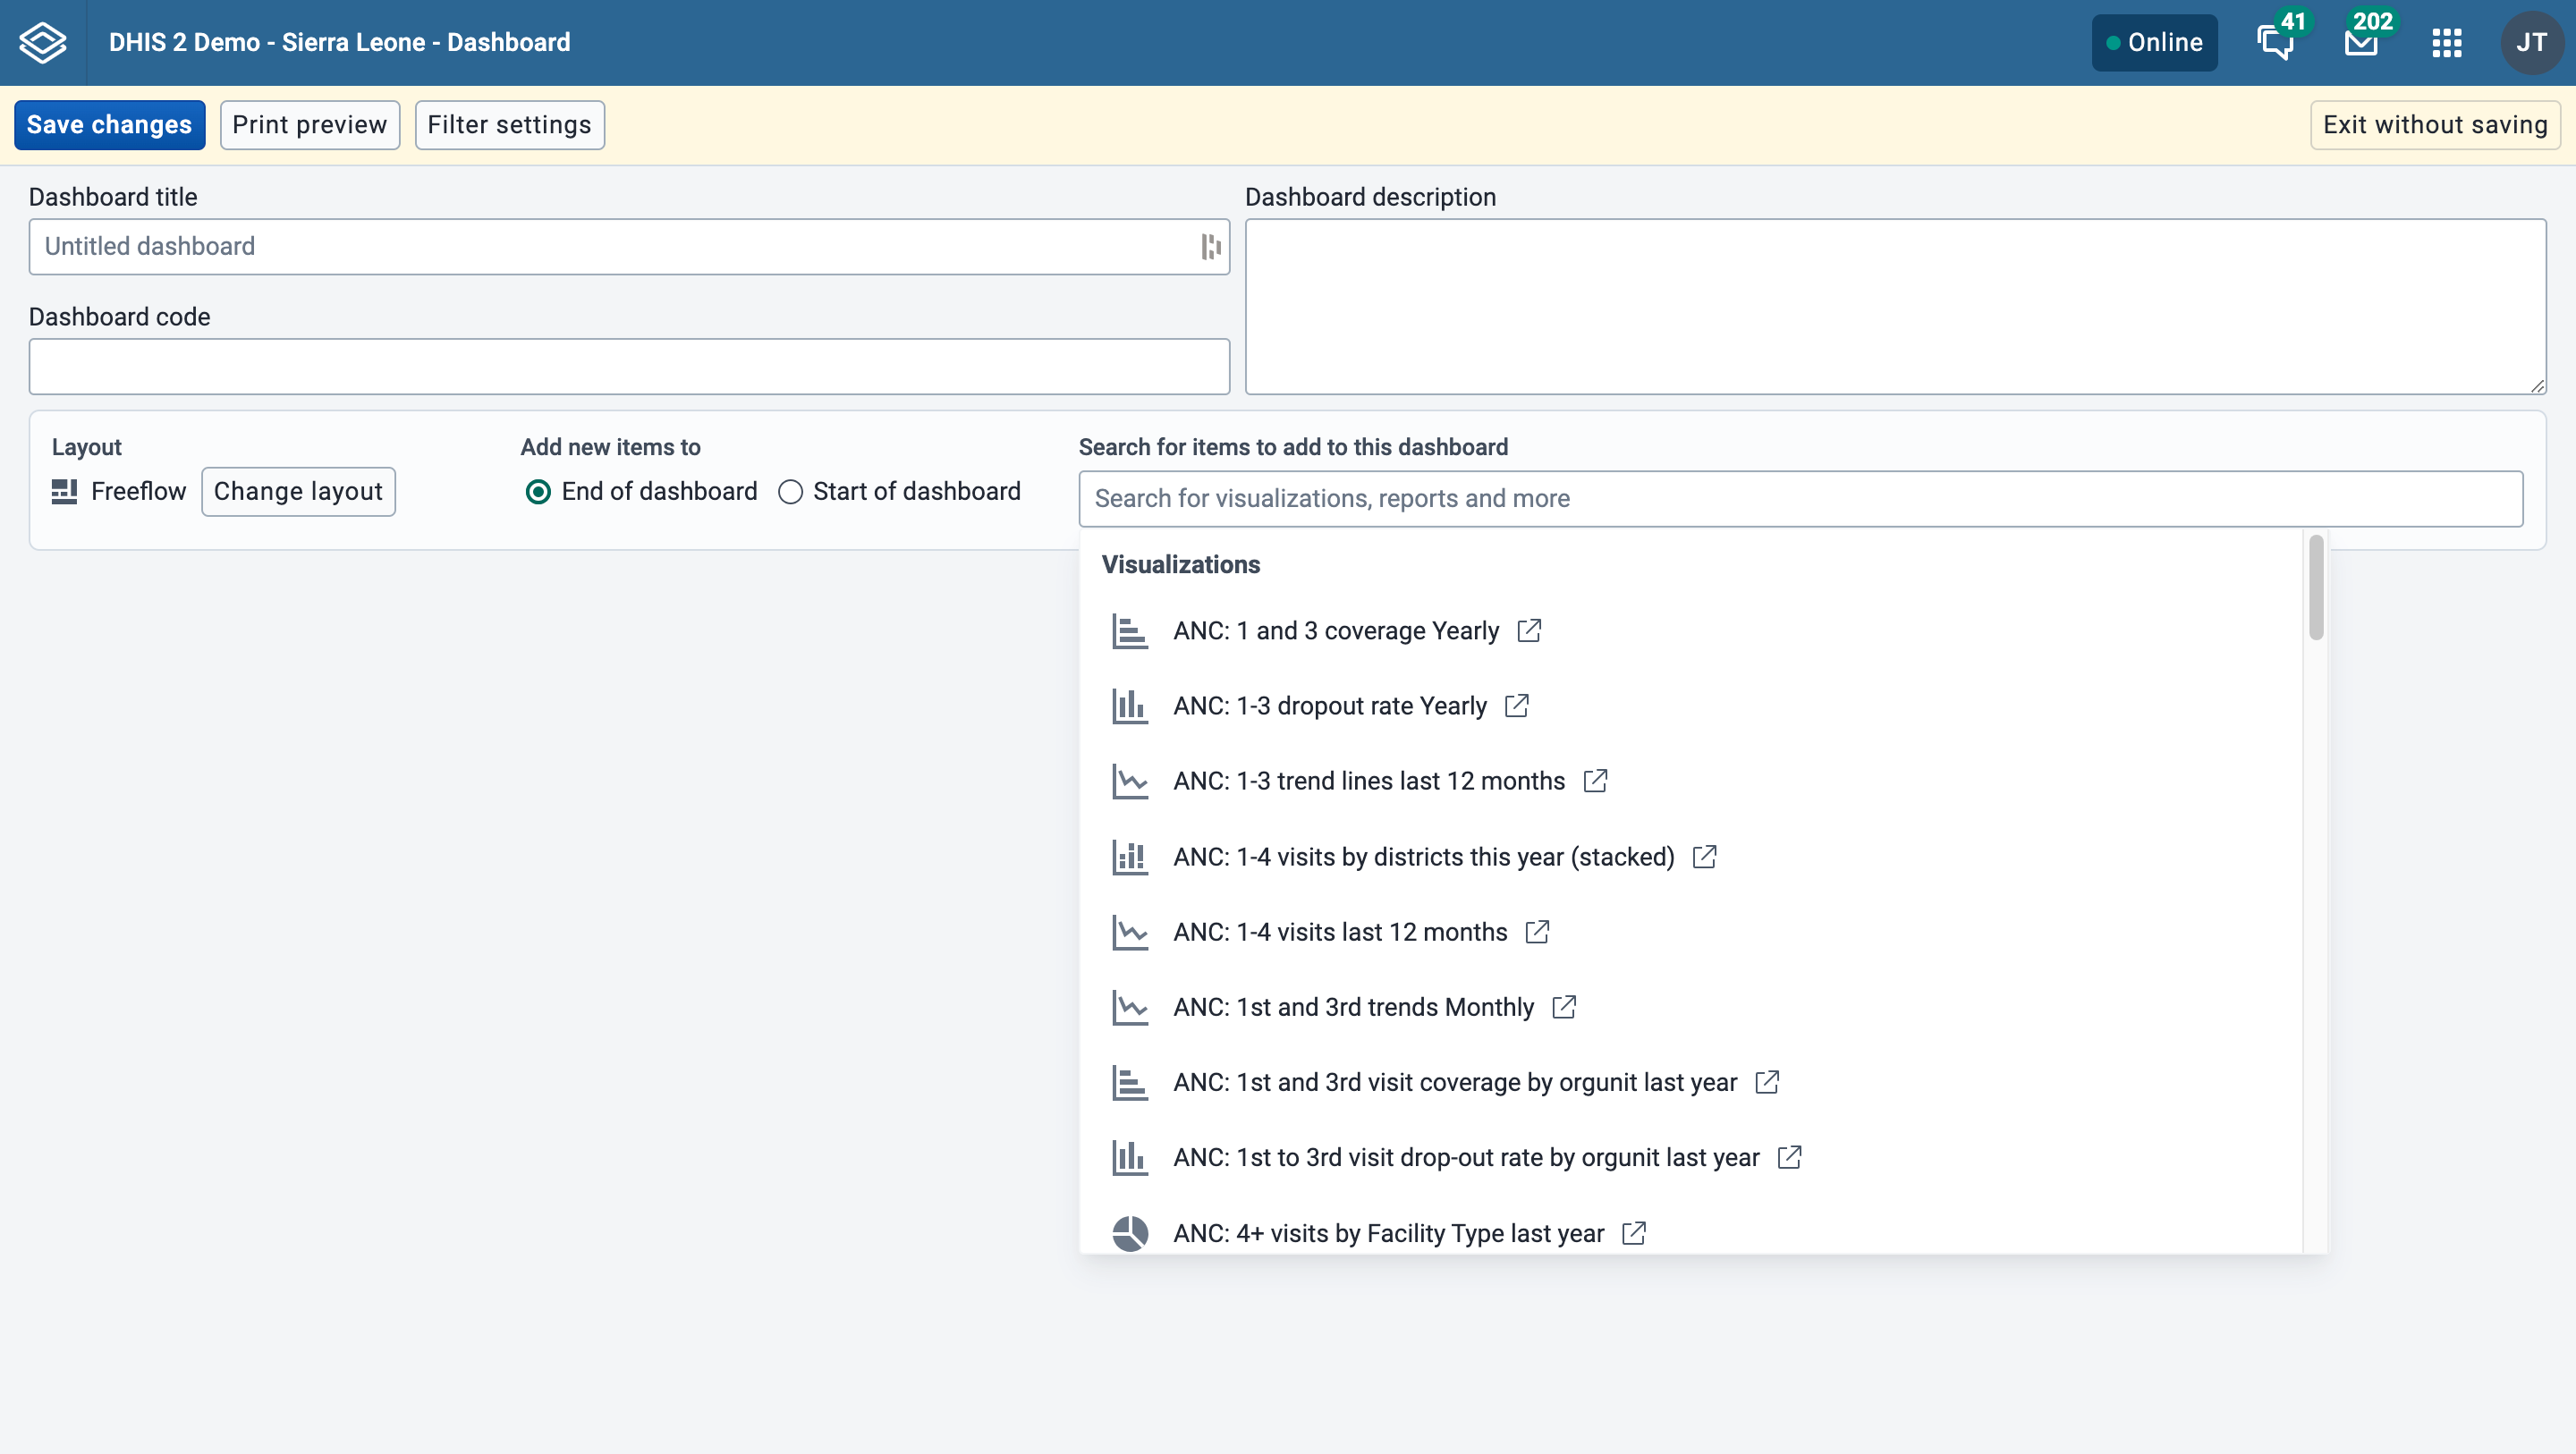
The list of items in the dropdown initially displays 10 visualizations (charts and tables), and 5 from each of the other categories, based on the search text you enter. To view more items, click on Show more, and the list for that type will be extended to 25 items. If you still do not find the item you want, try typing a more specific search text. Messages (Email), text boxes and spacer items can also be chosen from the list.
When adding items to the dashboard you can choose an overall layout by clicking on Change layout button. You can change this layout setting at any time.
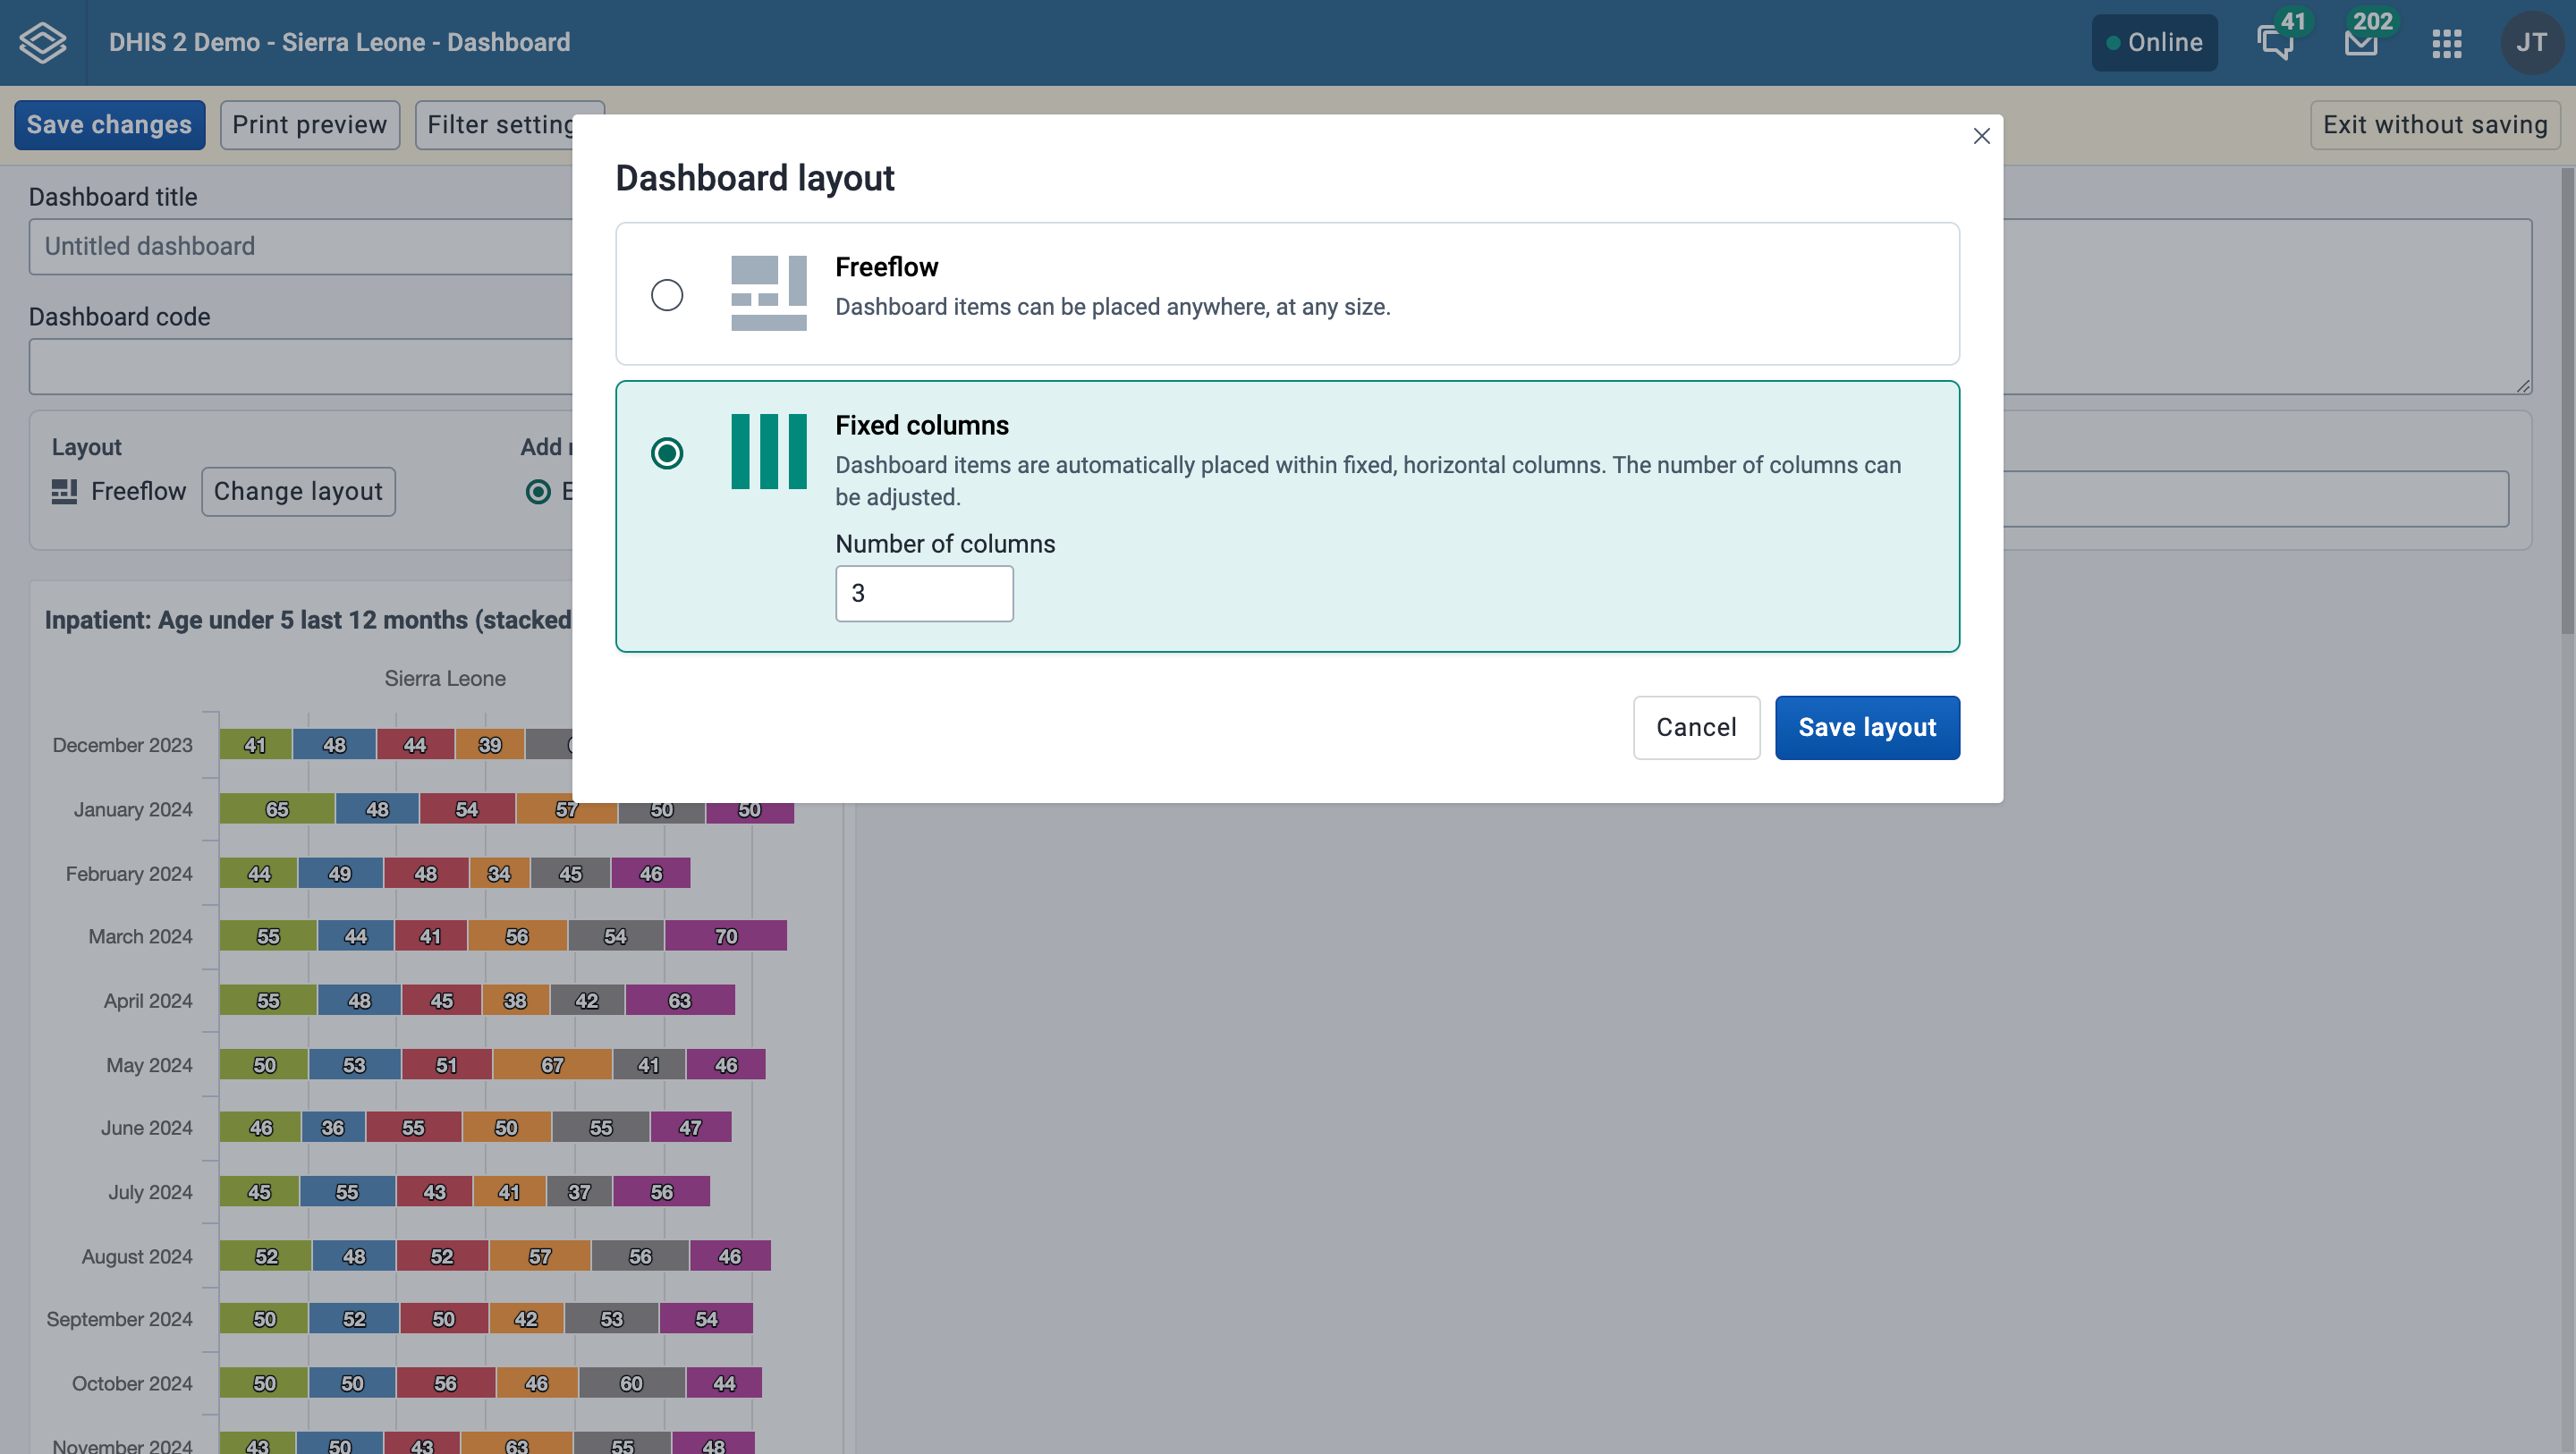
You can also configure whether newly added items are automatically placed at the start or end of the dashboard by choosing the desired option. This option can be changed at any time.
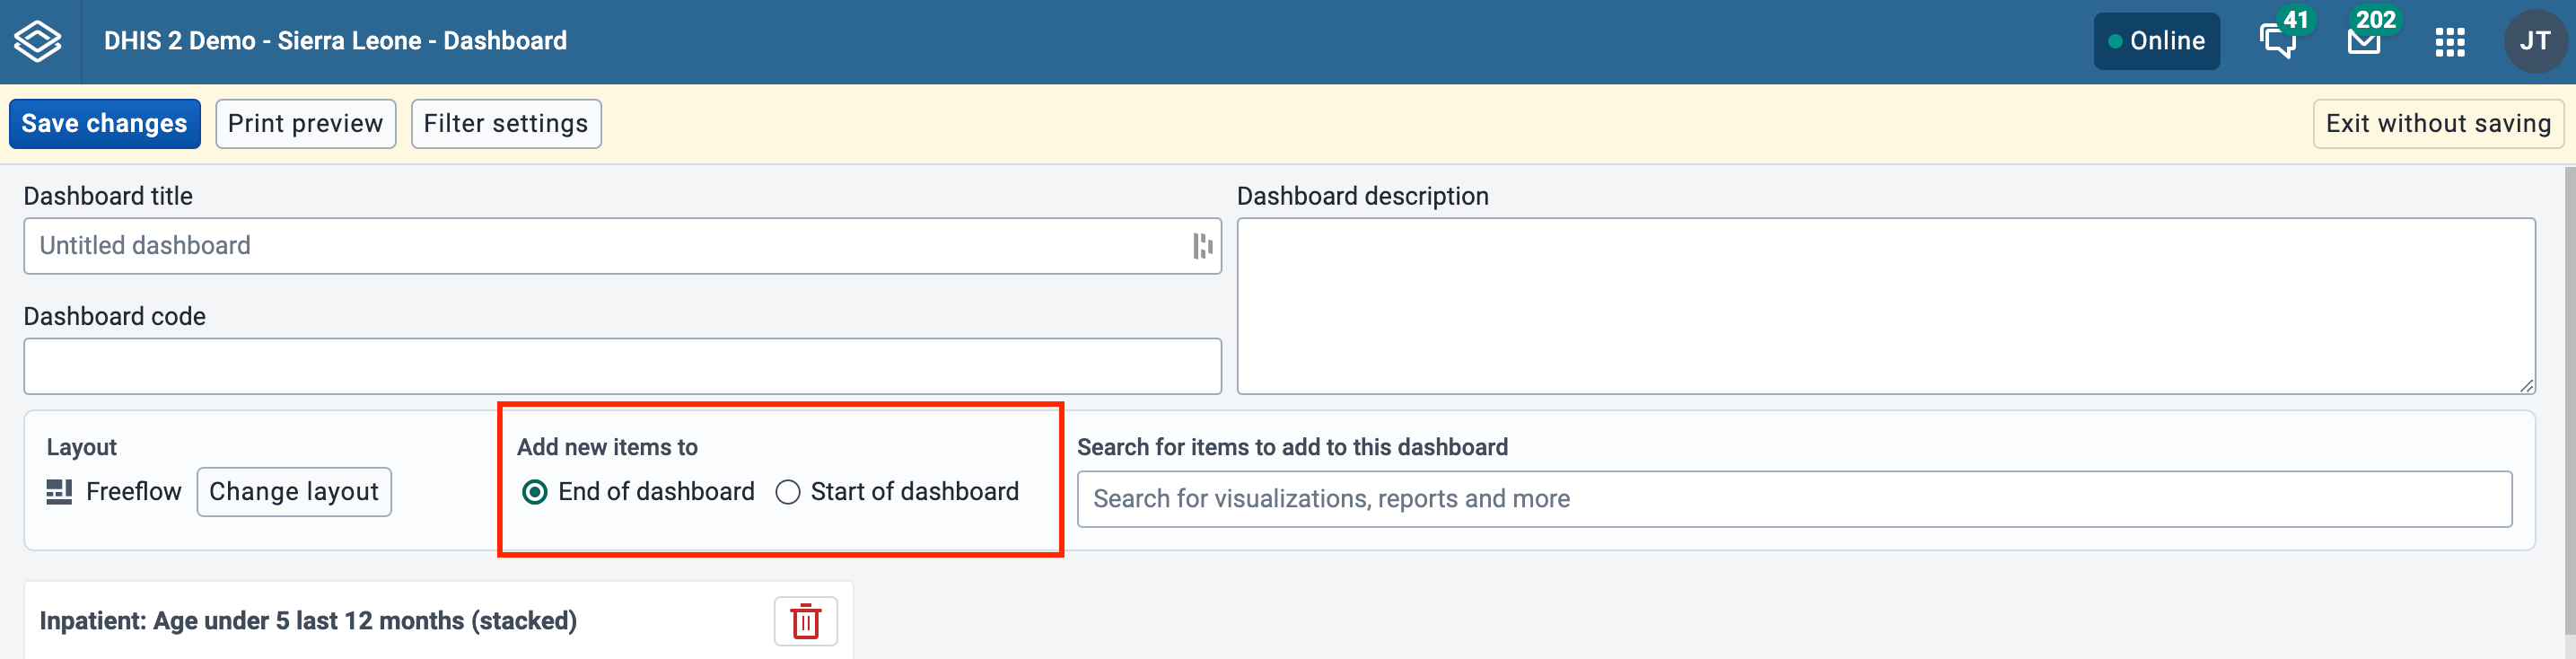
When adding items to the dashboard using Freeflow layout, they will "rise" upwards until they bump into another item. In order to force empty vertical space between items (like an empty row), you can add spacer items to the dashboard. They are only visible in edit/create mode. In view mode, they are not displayed, but take up the defined space.
Spacer in edit/create mode:
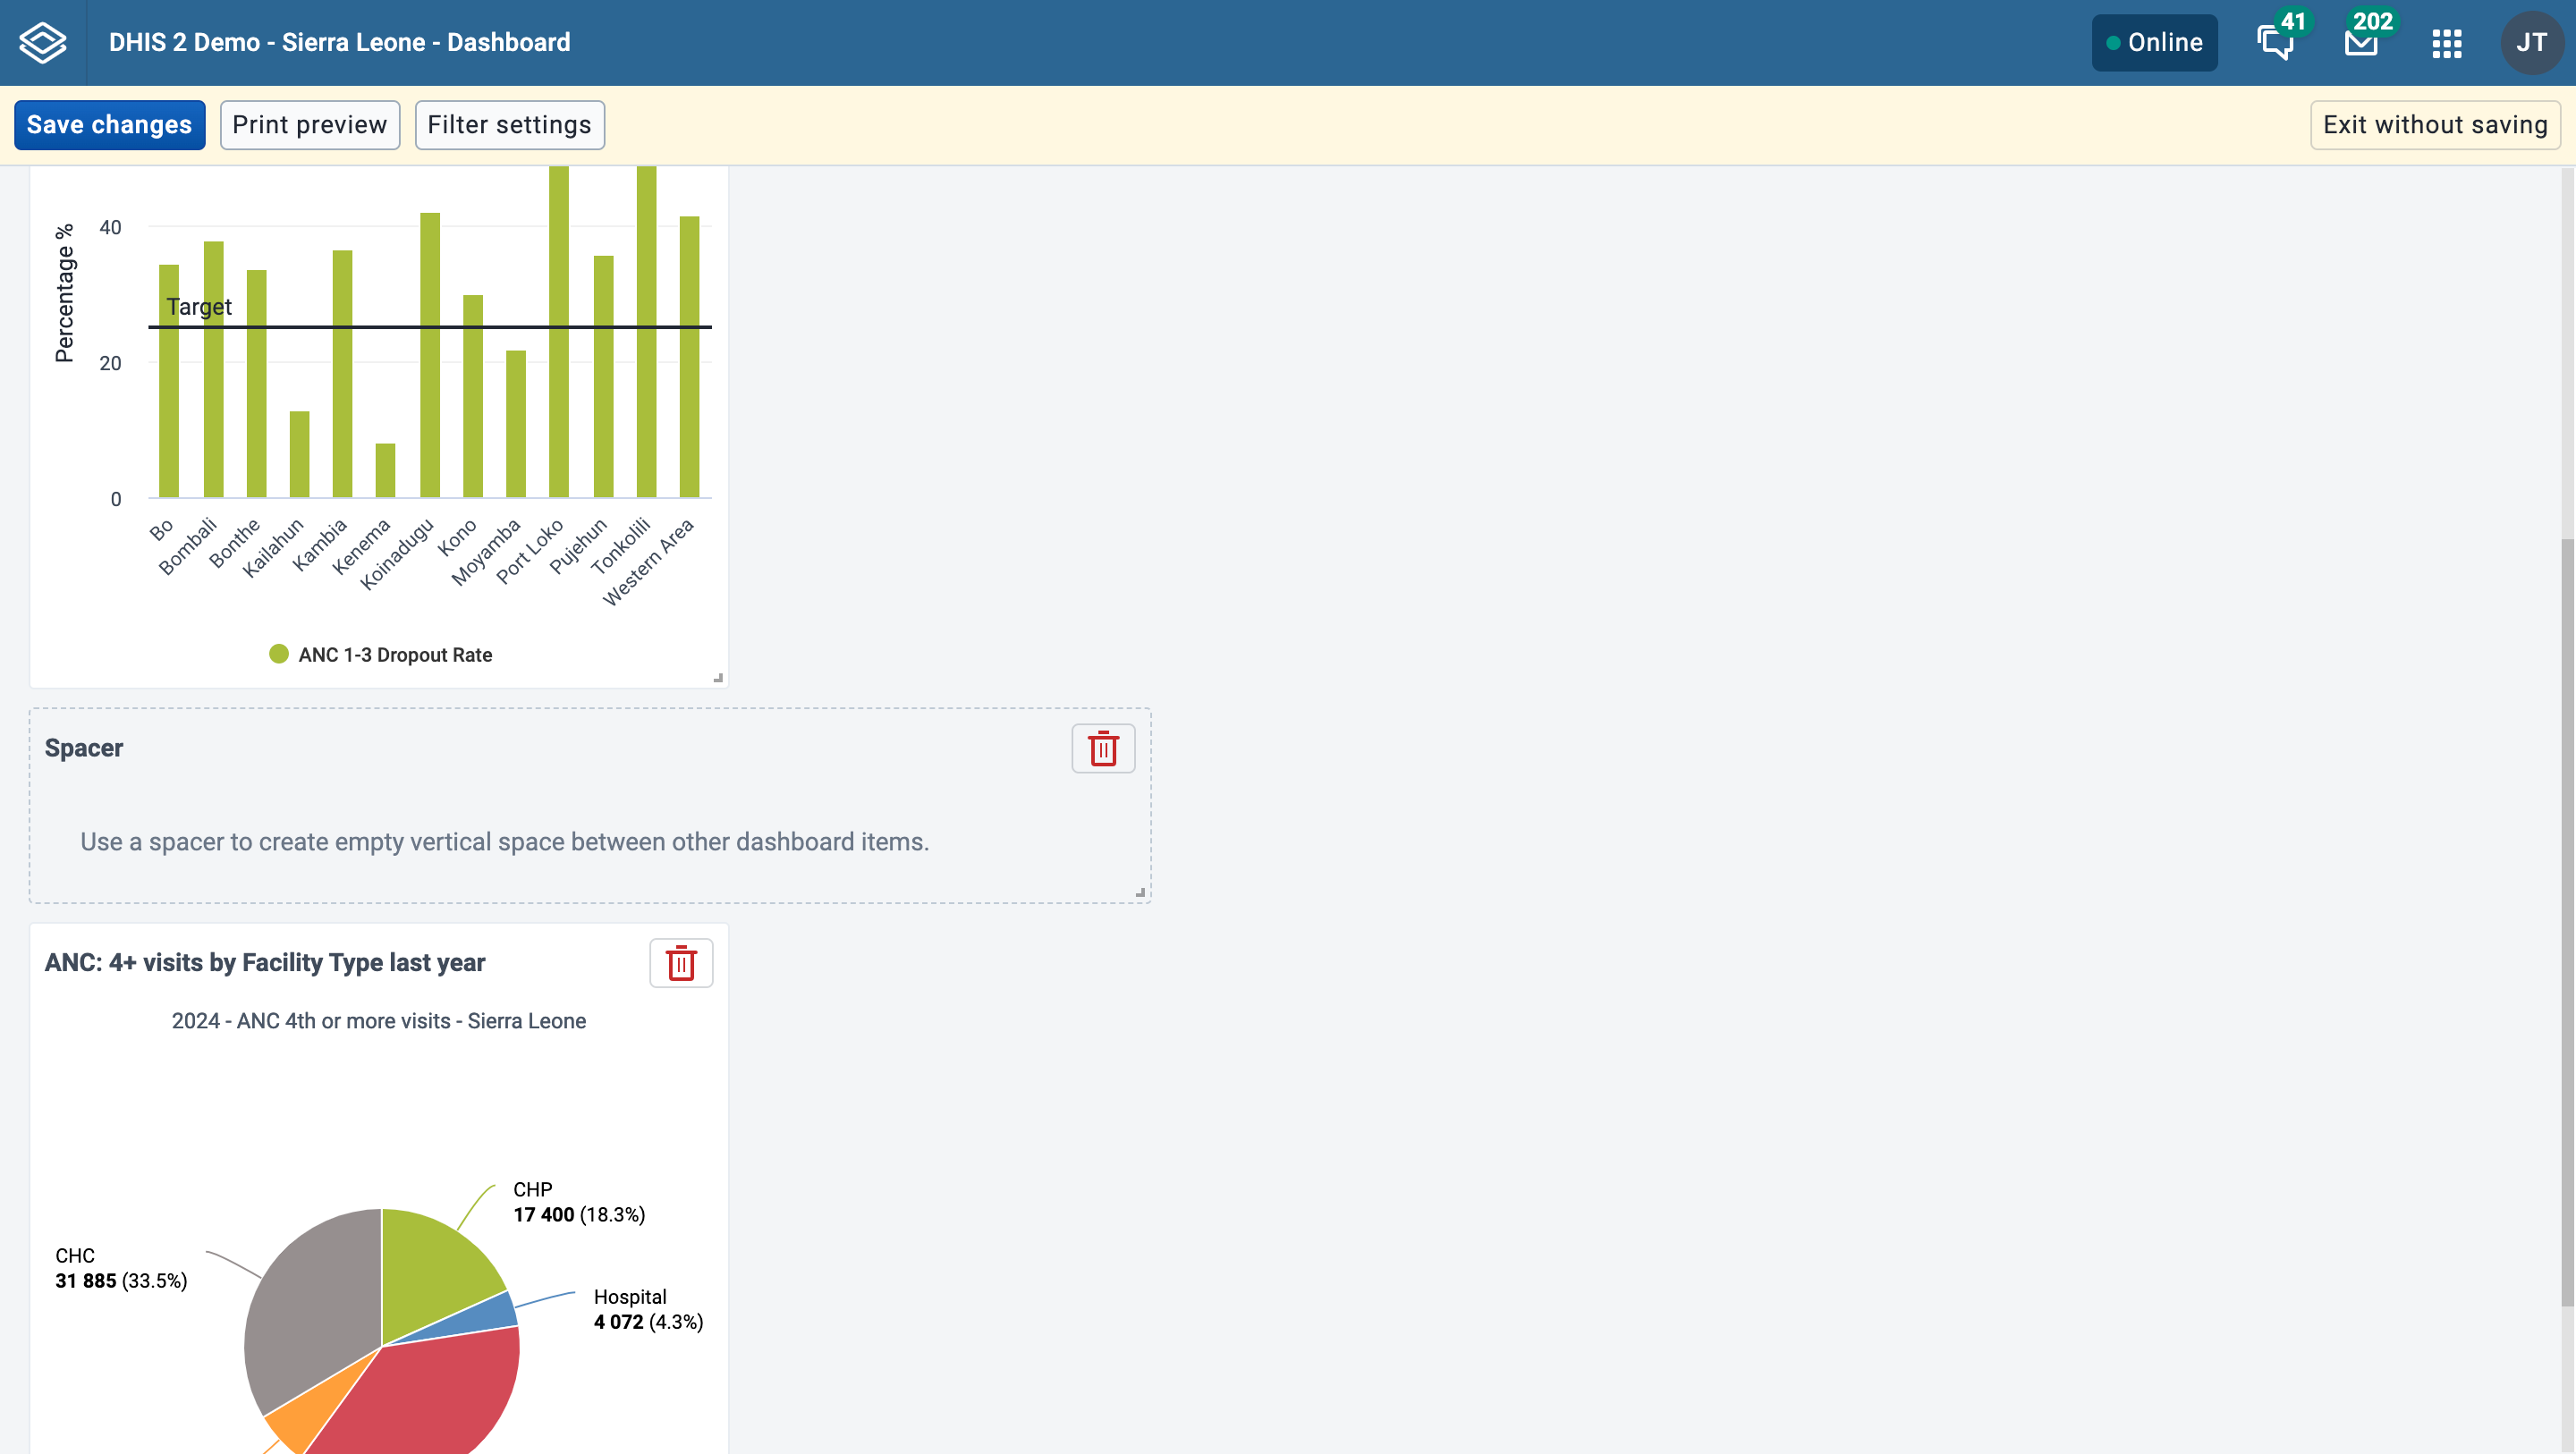
Spacer in view mode:
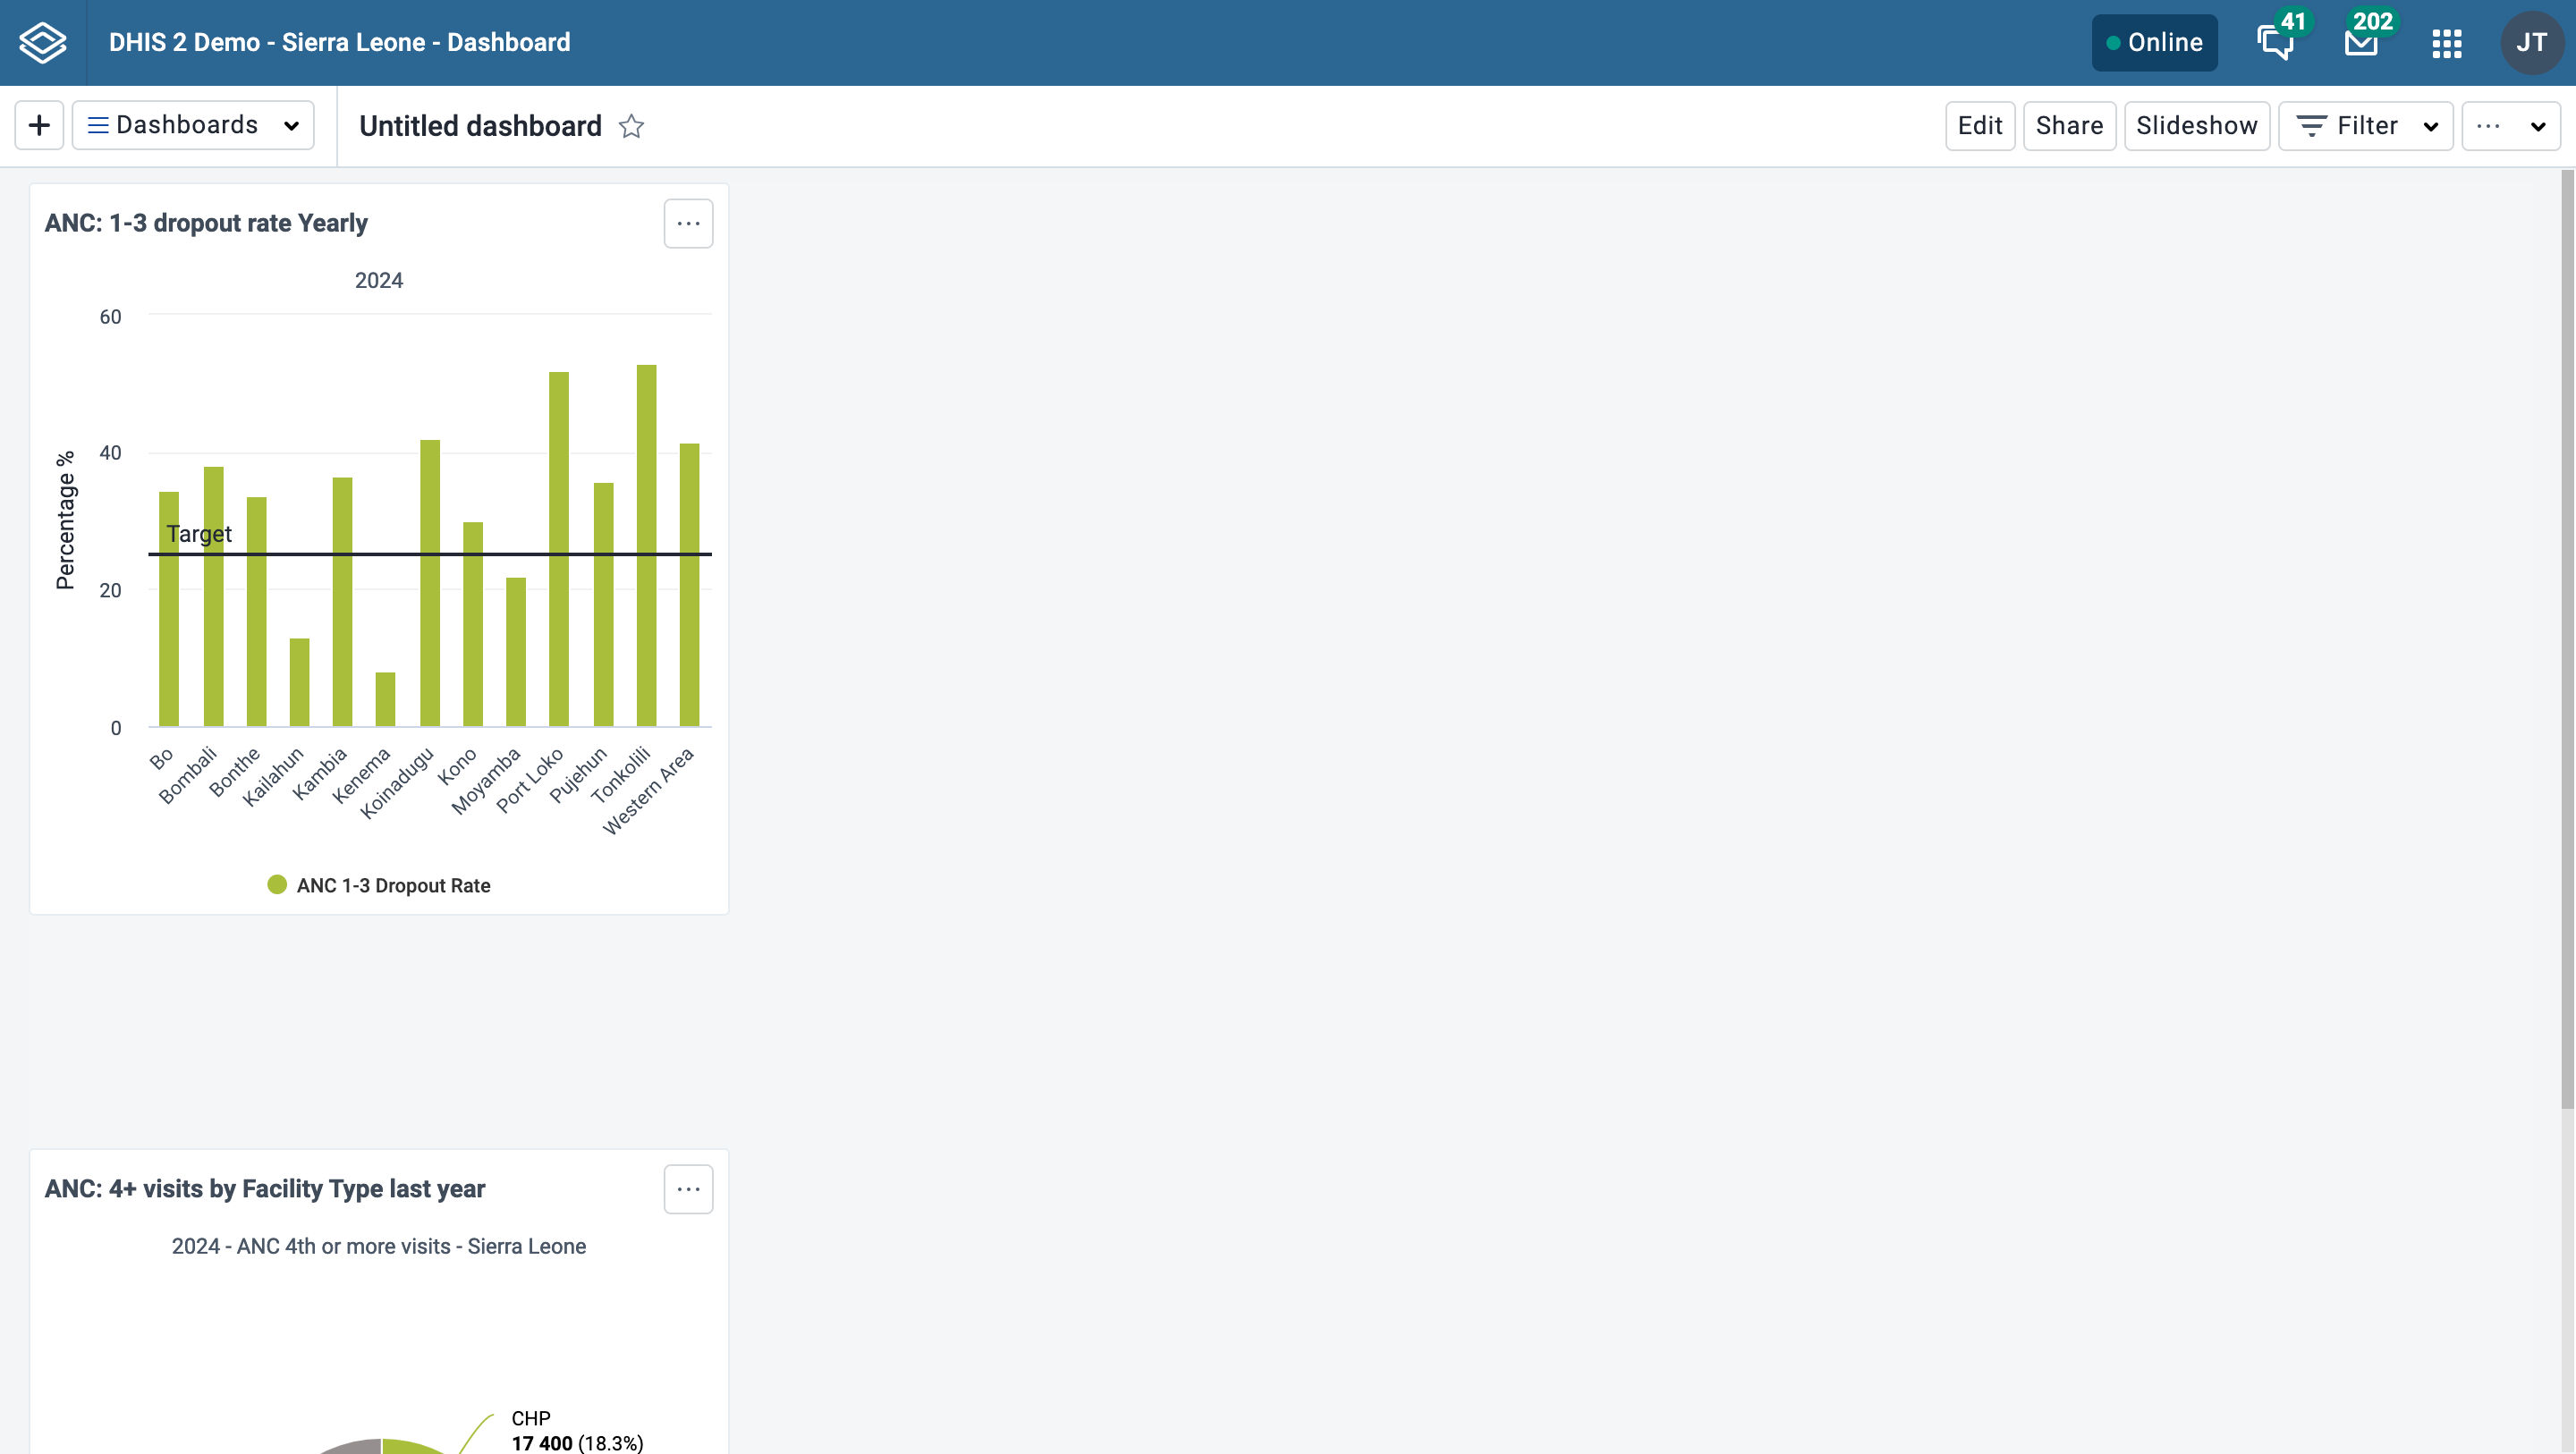
Remove items by clicking on the red trash can at the upper right of the item. Be aware that when you remove an item while in Freeflow layout, the items that are positioned below the removed item will "rise" upwards until they bump into an item above. in Fixed columns layout, the items will be adjusted to fill every column in the layout so there are no empty column slots.
In create/edit mode you will see the following buttons in the actions bar at the top of the page: Save changes, Print preview, Filter settings, Translate, Delete, and Exit without saving. The Translate and Delete buttons are only shown if you are editing an existing dashboard.
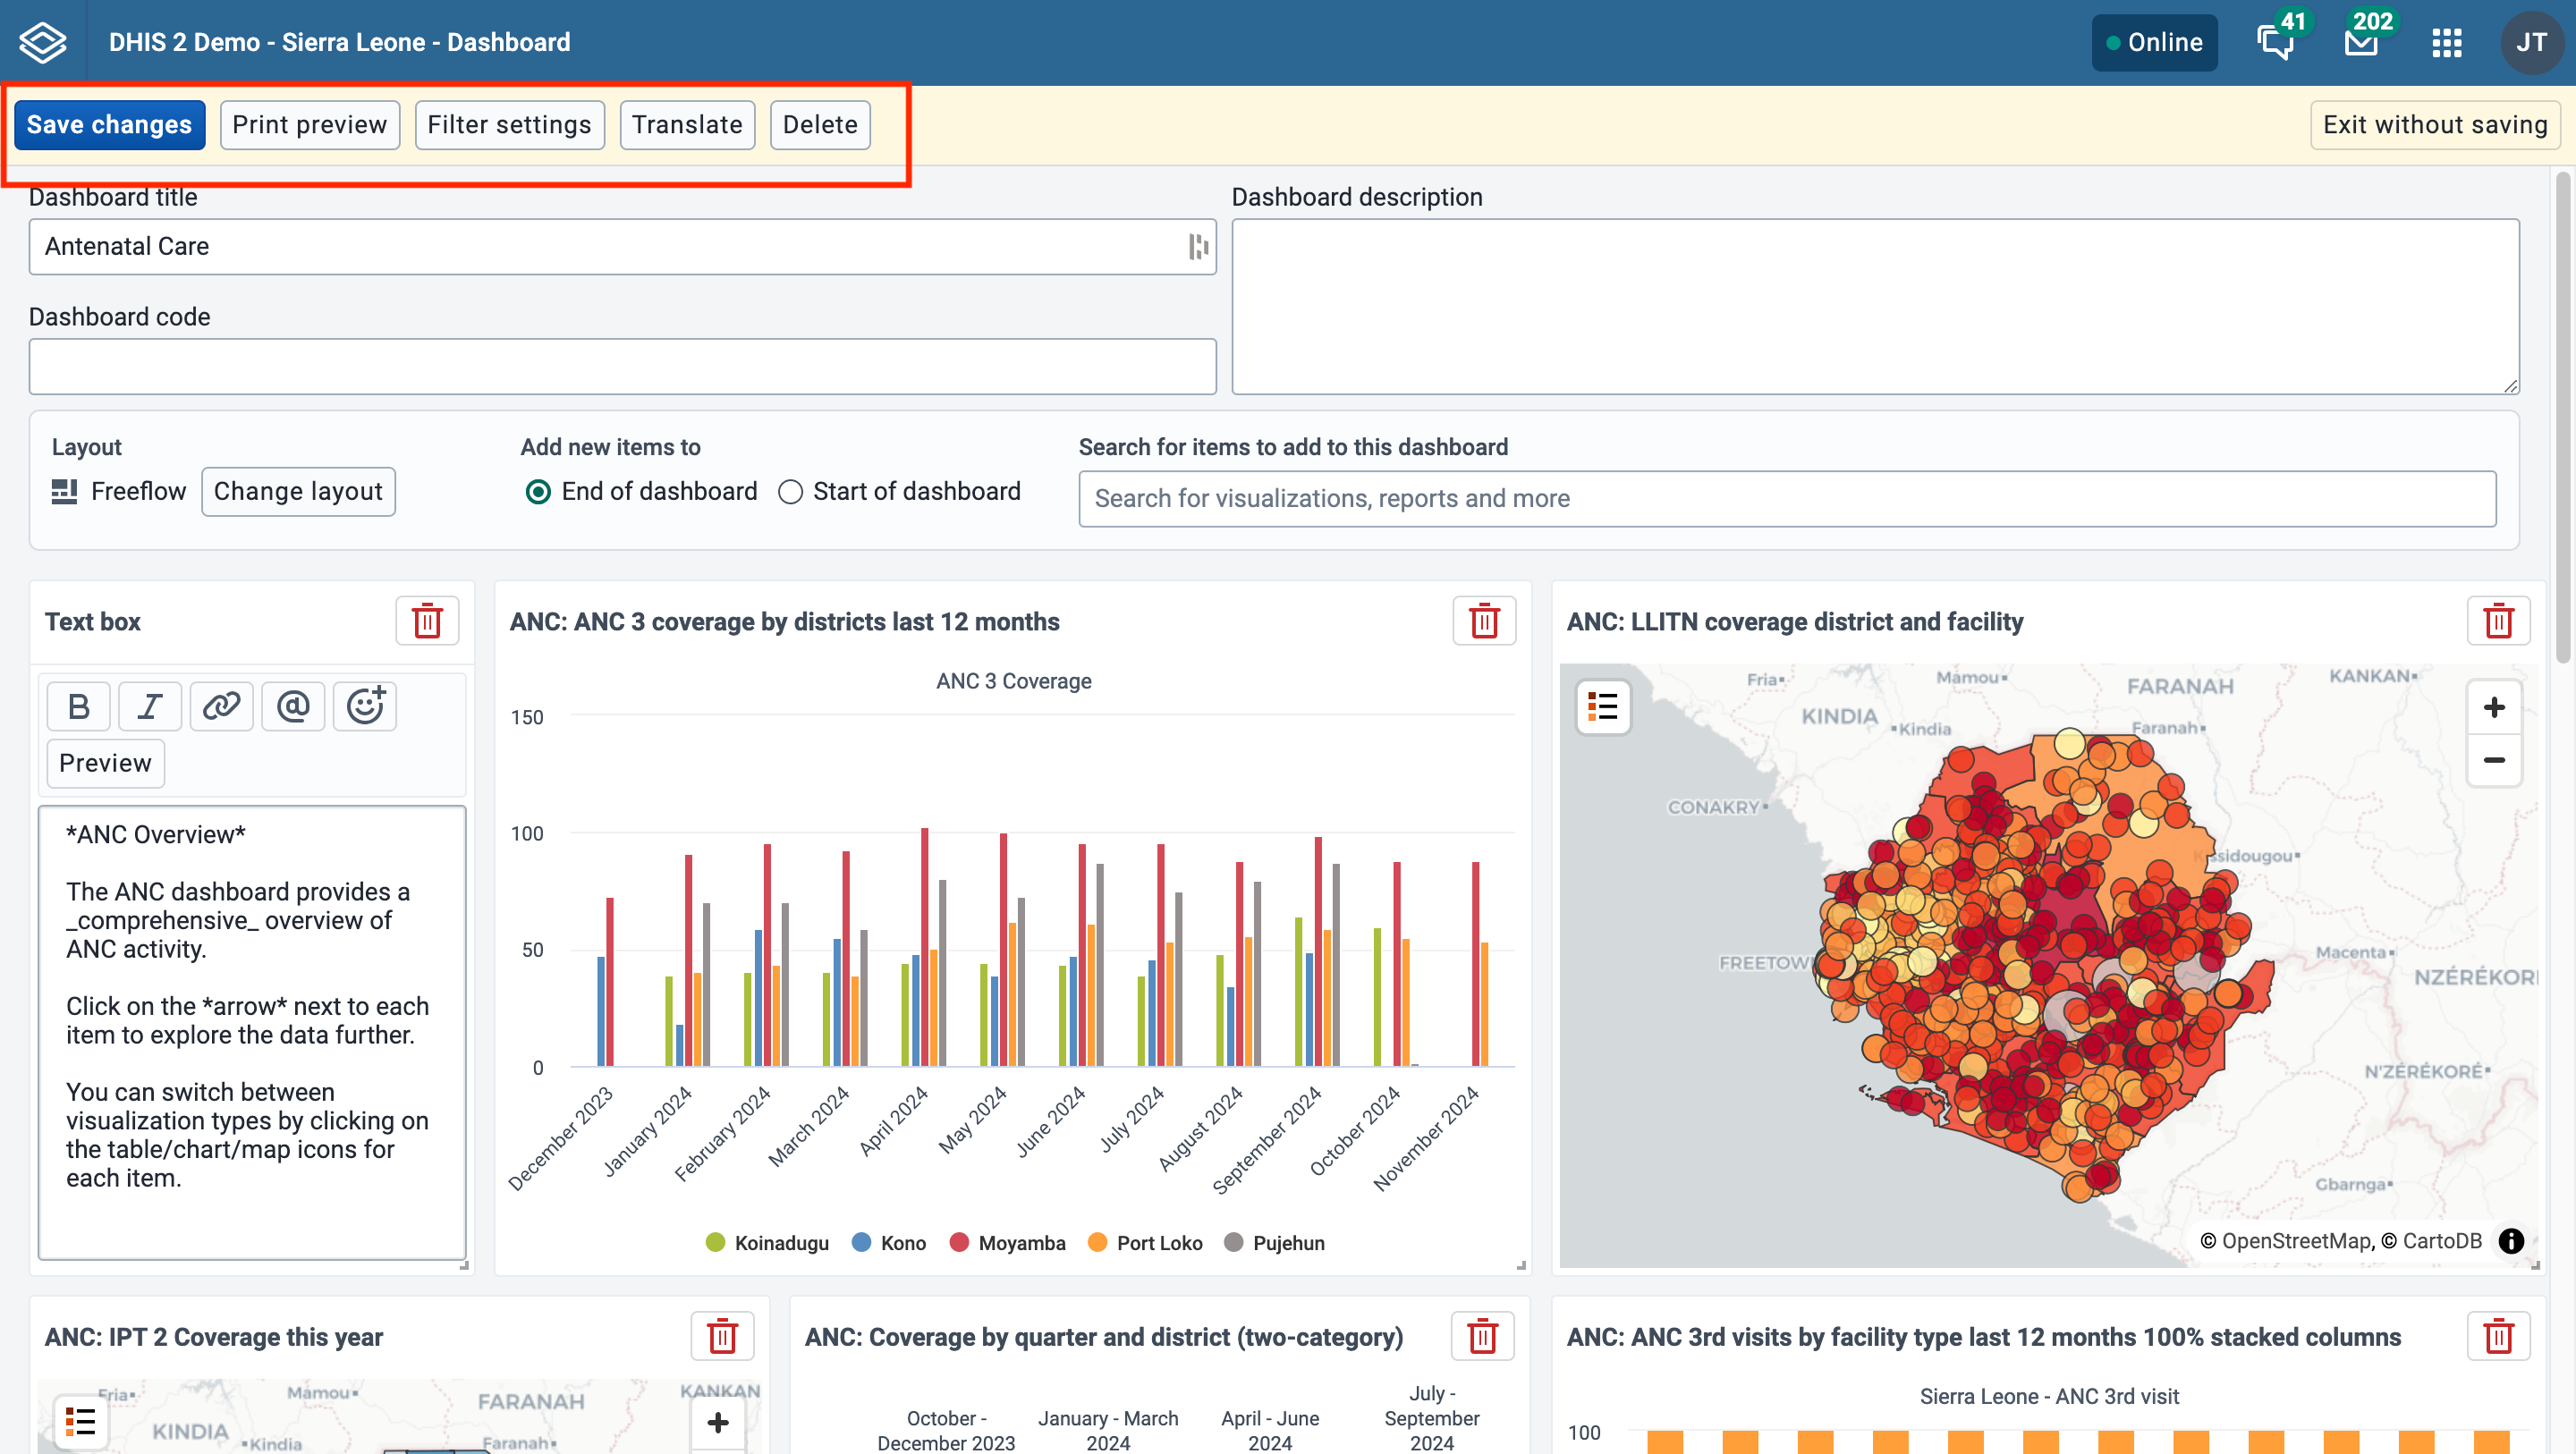
When creating or editing a dashboard, changes are saved when you click the Save changes button. If you don't want to save your changes, click the Exit without saving button. You will then be returned to view mode with the dashboard you were previously viewing.
Click on the Print preview button to view what the dashboard will look like when being printed with the Dashboard layout option.
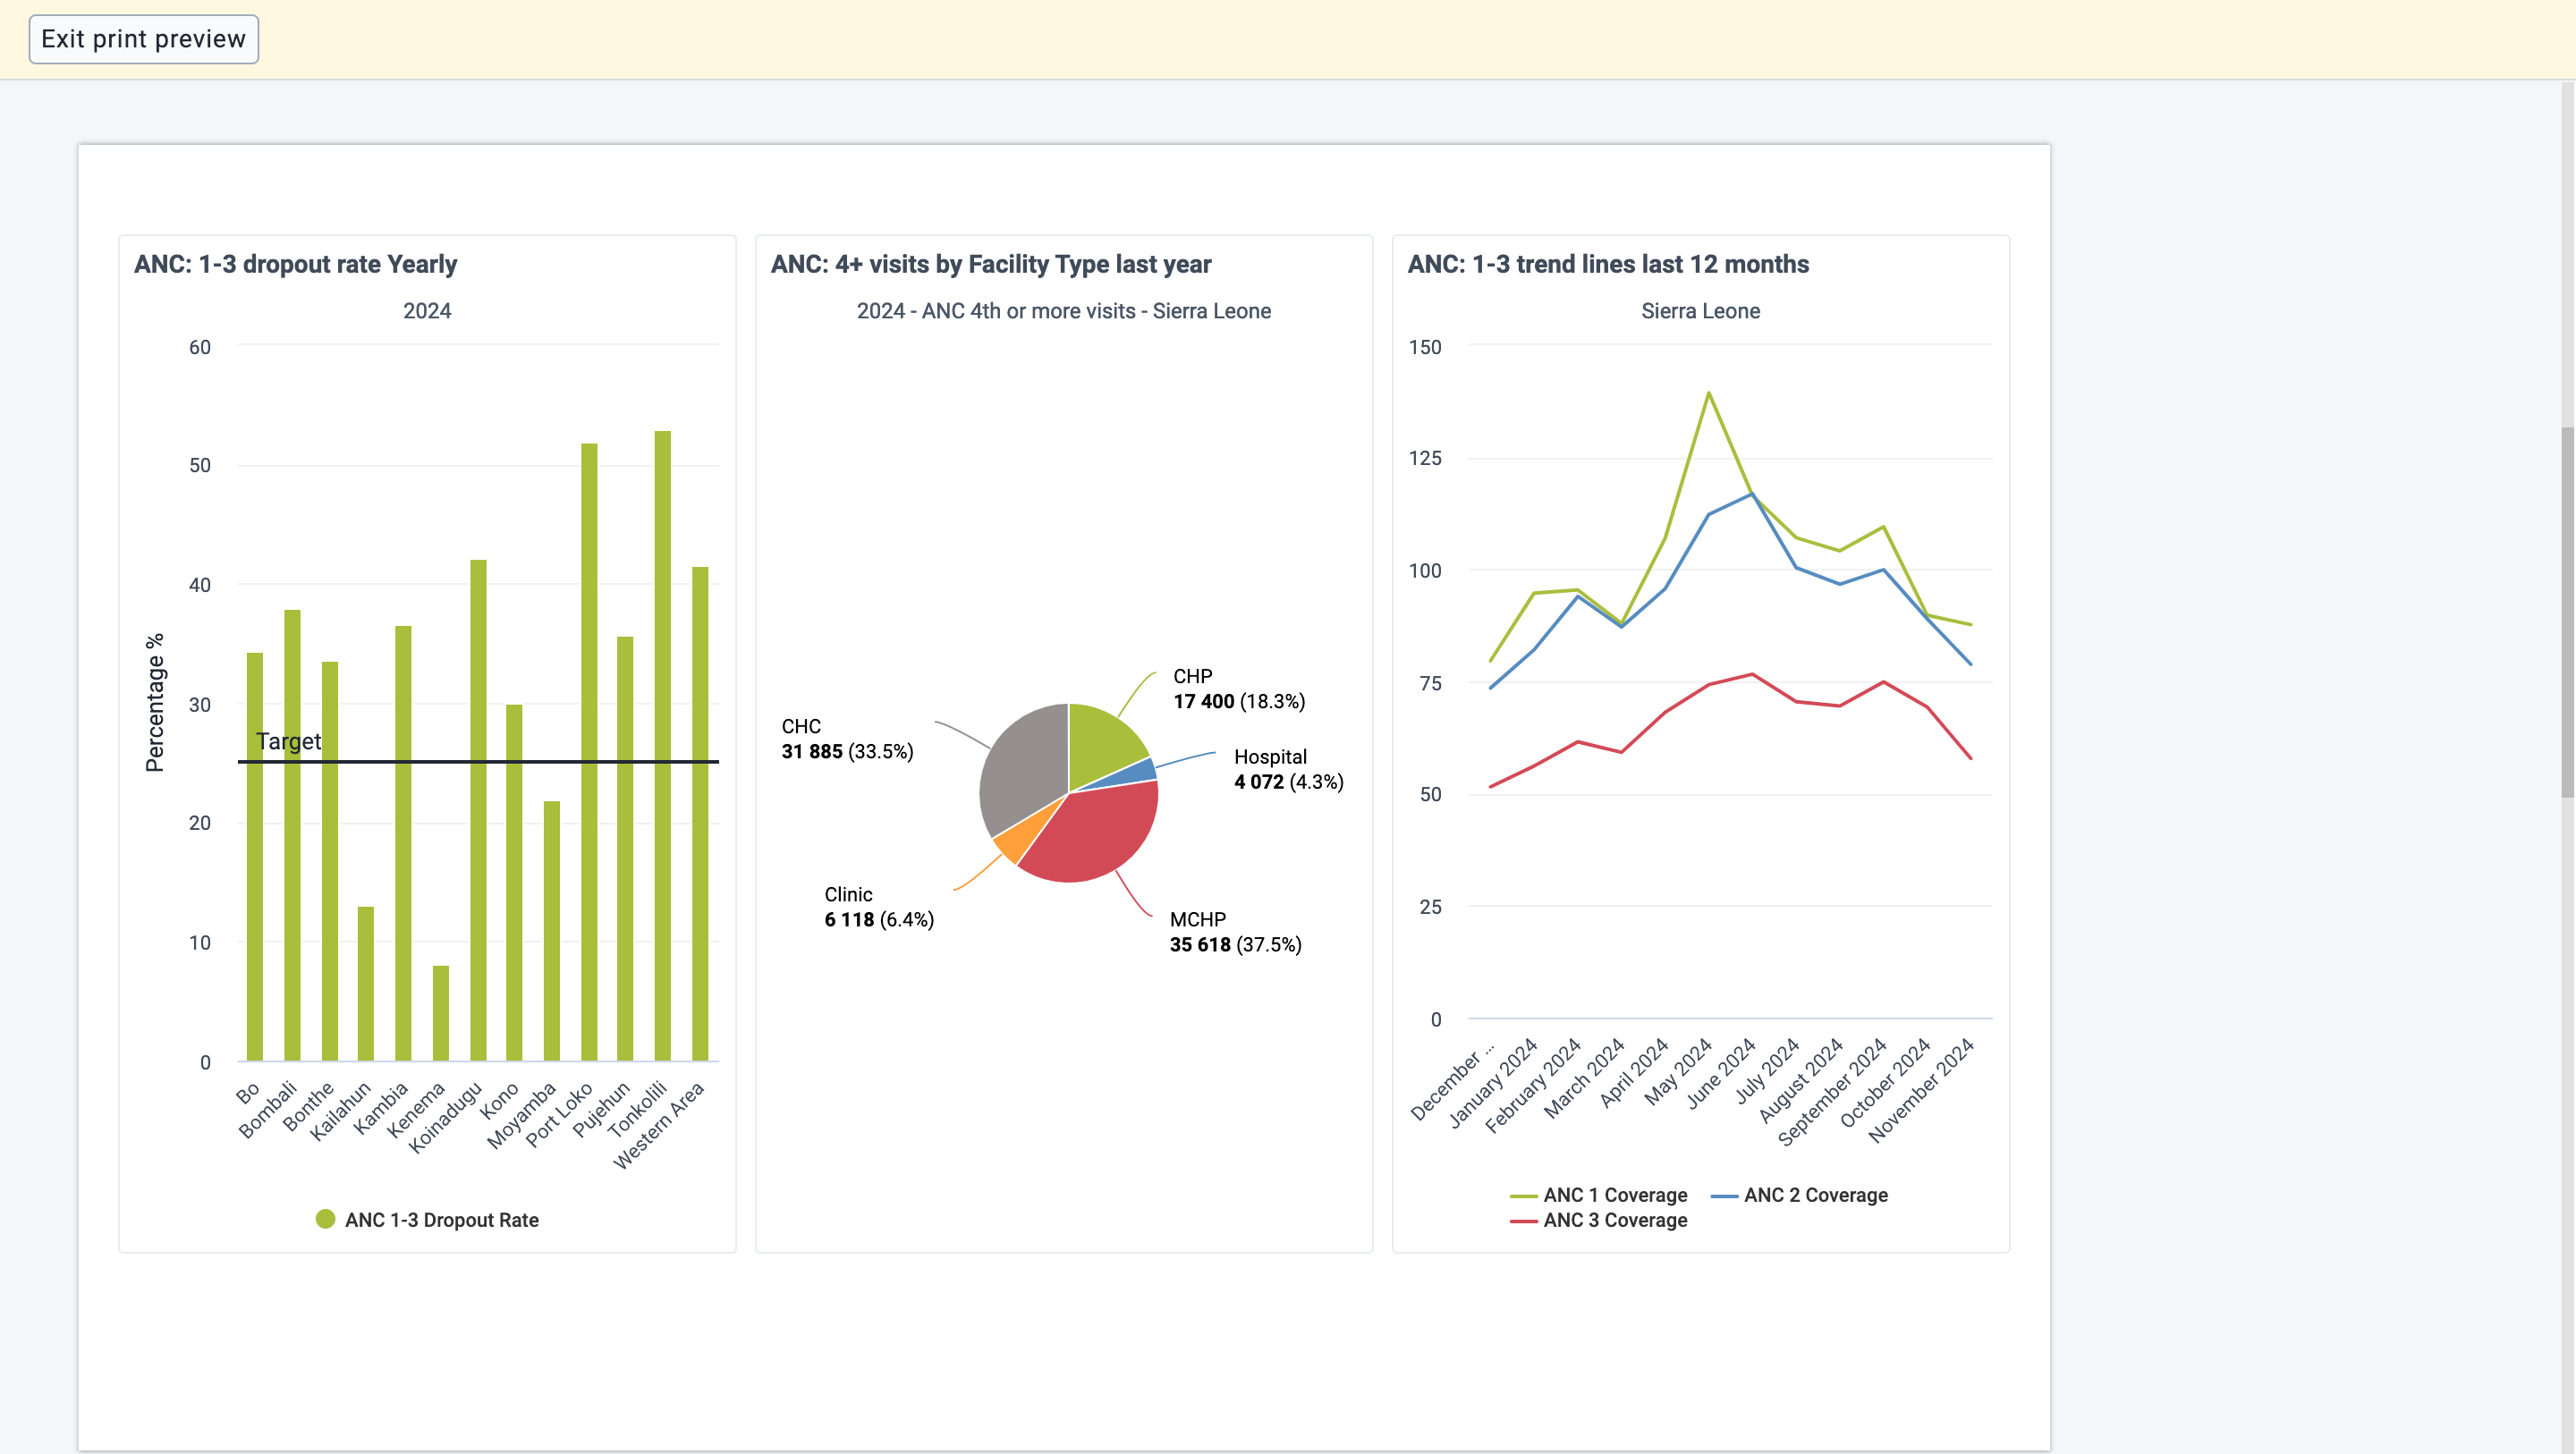
Click on Exit print preview to return to editing the dashboard.
Note that some items may be moved to the next page to avoid being split between two pages. Items may also be shortened to fit on one page. Items that are shortened show an info icon in the upper right corner of the item in preview. The info icon is not visible in the actual print.
By default, users will be able to filter dashboard items by any dimension defined in the DHIS2 instance. Dashboard filter settings can be edited for a dashboard by clicking on Filter settings.
To restrict available filters, you can click Only allow filtering by selected dimensions and select the filters you wish to allow on the dashboard. Period and Organisation Unit are selected by default but can be removed if desired. When the dashboard is viewed, users will only be able to choose from among the filters selected.

In order to save updates to filter settings, you need to first click Confirm to close the Filter settings dialog and then click Save changes to save the dashboard changes.

If you are editing an existing dashboard, then there will be a Translate button. Click on this button to open the Translation dialog, which provides a list of languages to translate to, and shows the original dashboard title and description. First choose the language you want to translate for, then fill in the dashboard name and description translation.
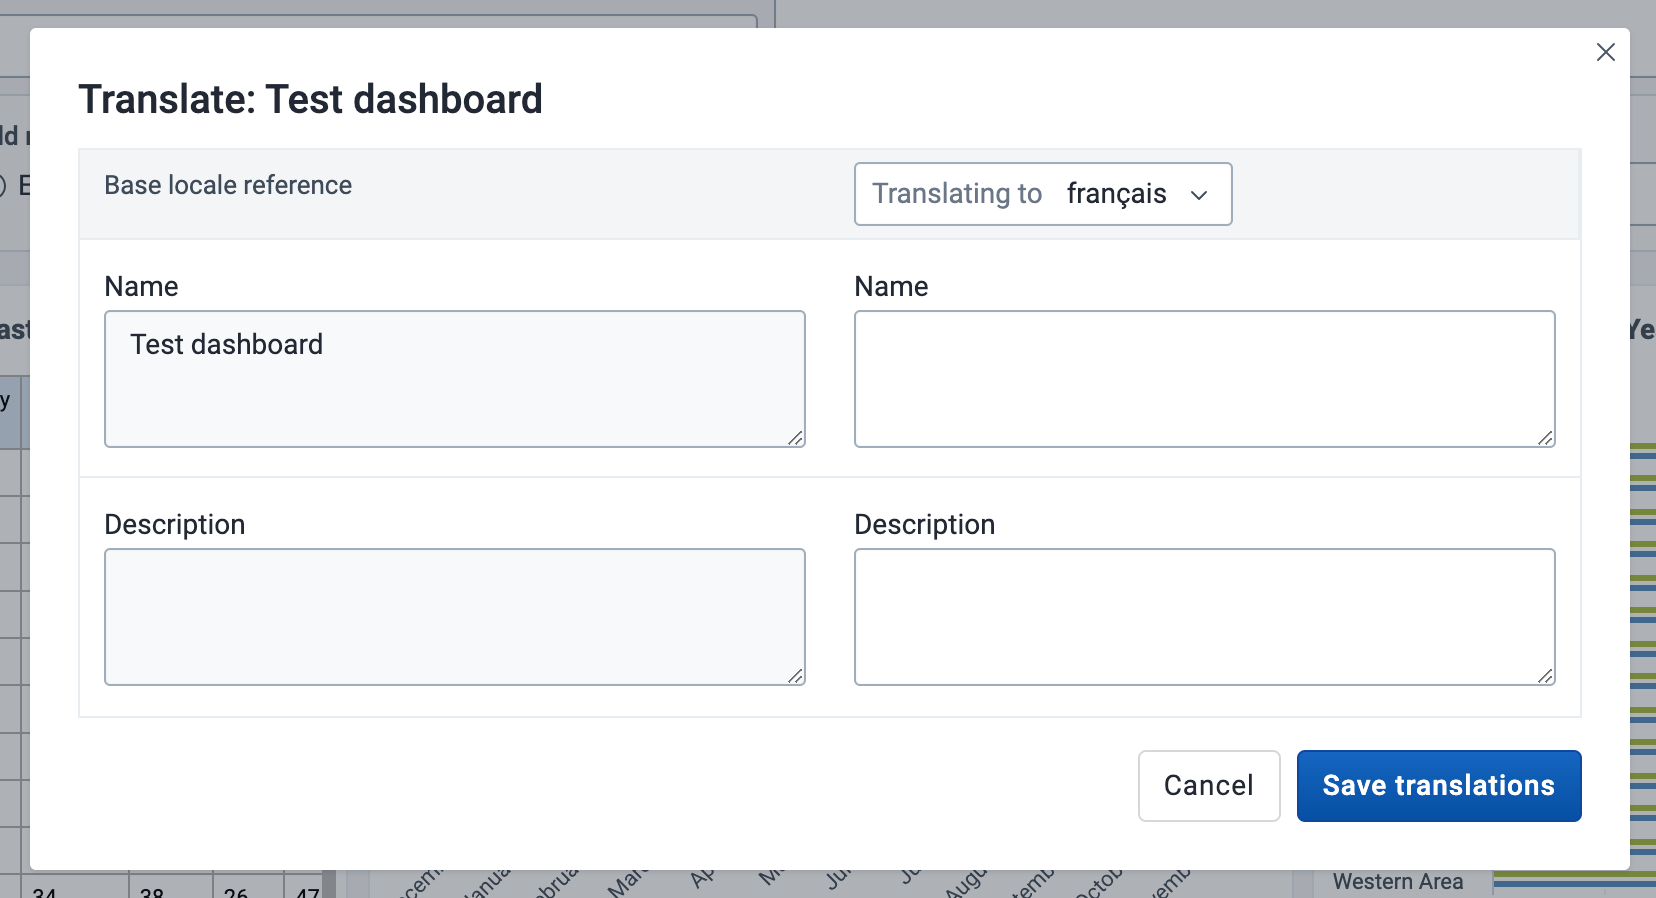
If you have access to delete the dashboard, then there will be a Delete button. When you click the Delete button, a confirmation dialog will first be displayed to confirm that you want to delete the dashboard.
If the system has been configured to support embedded (Superset) dashboards, and you start creating a new dashboard by clicking the + button, you will be presented with a choice:

If you choose the "External" option here and click "continue", you will be taken to a modal form where you can create an embedded dashboard:
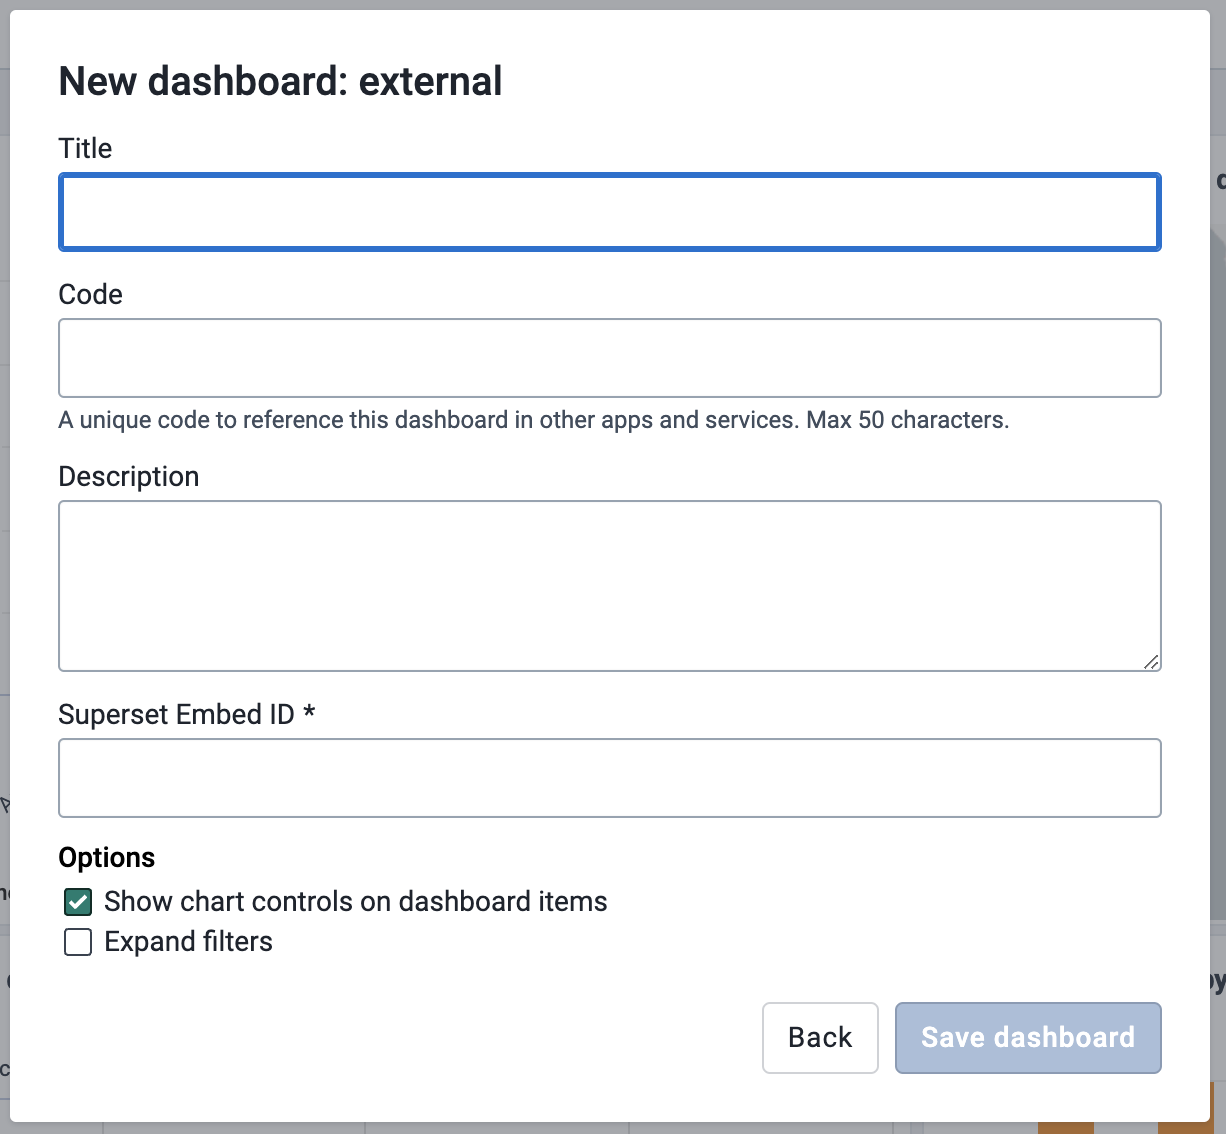
The "Title", "Code" and "Description" fields in this form are identical to the fields with the same names you see when creating a regular (internal) dashboard, but there are also some notable differences:
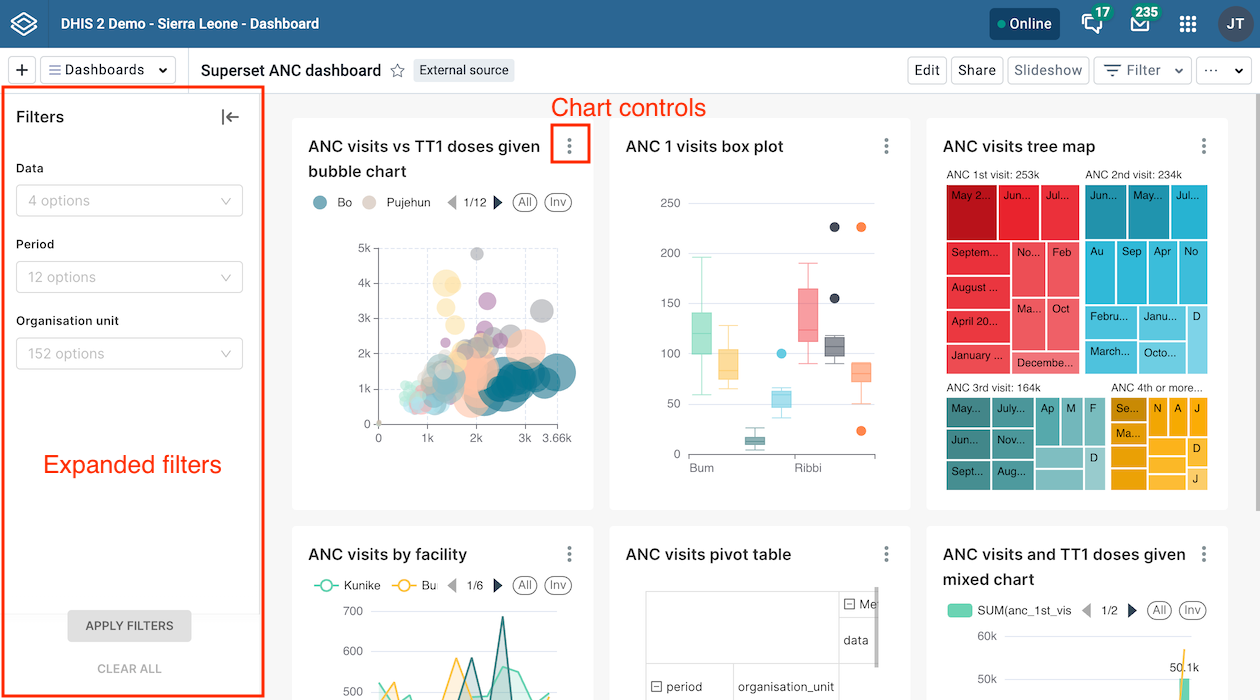
Once the dashboard is created, you can star/unstar, edit and share it. You can also show and hide the description and close the dashboard. It is not possible to show it in slideshow mode, filter it, or enter print view mode.
In order for the embedded Superset dashboards feature to work, the following prerequisites need to be met:
The following actions are available on the dashboard in view mode:
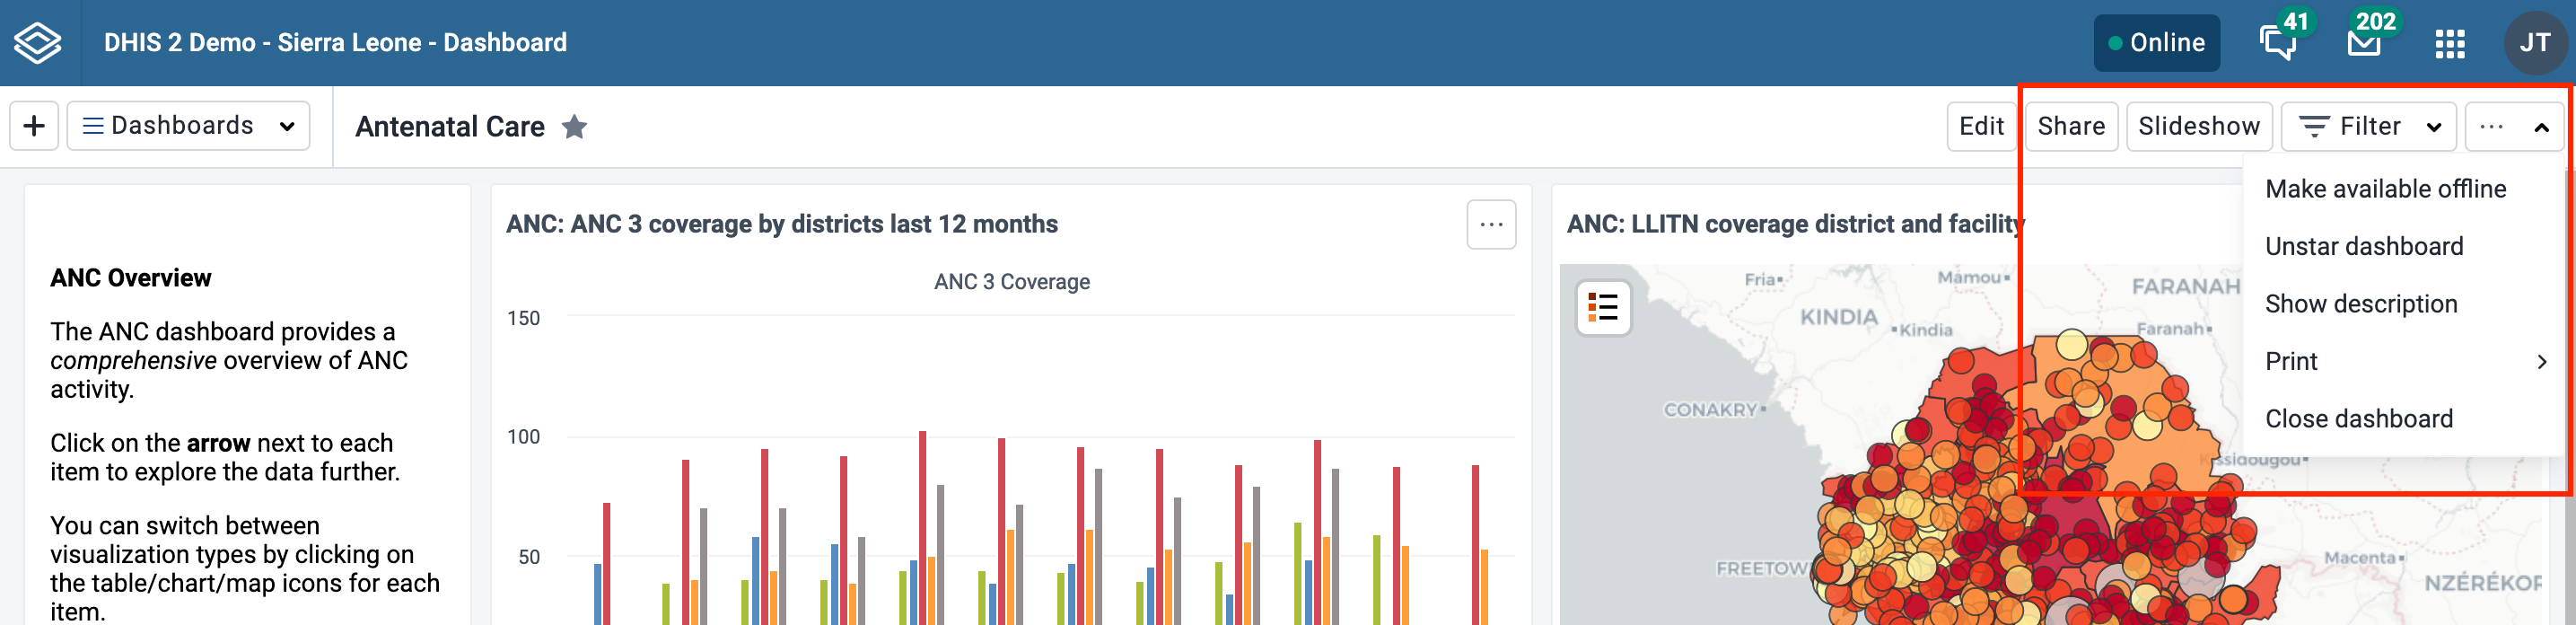
To toggle the description, open the ... menu and choose Show description (or Hide description). This setting will be remembered for all dashboards that you open. This setting applies to you, not other users.
Your starred dashboards are listed first in the list of dashboards for quick access. To star a dashboard, click on the star button to the right of the title. You can also toggle the star from the ... menu. When the star is “filled”, that means the dashboard is starred. Starring a dashboard only applies to you, not other users.
Applying filters to a dashboard change the data displayed in dashboard items containing visualizations. The filters are applied to each dashboard item in the same way: each added filter overrides the original value for that dimension in the original chart, table or map. It is possible to filter on Organisation Units and Periods, as well as dynamic dimensions, depending on the DHIS2 instance. You can apply multiple filters to the dashboard.
To add a filter, click on the Filter button and choose a dimension:

A dialog opens where the filter selection can be made.
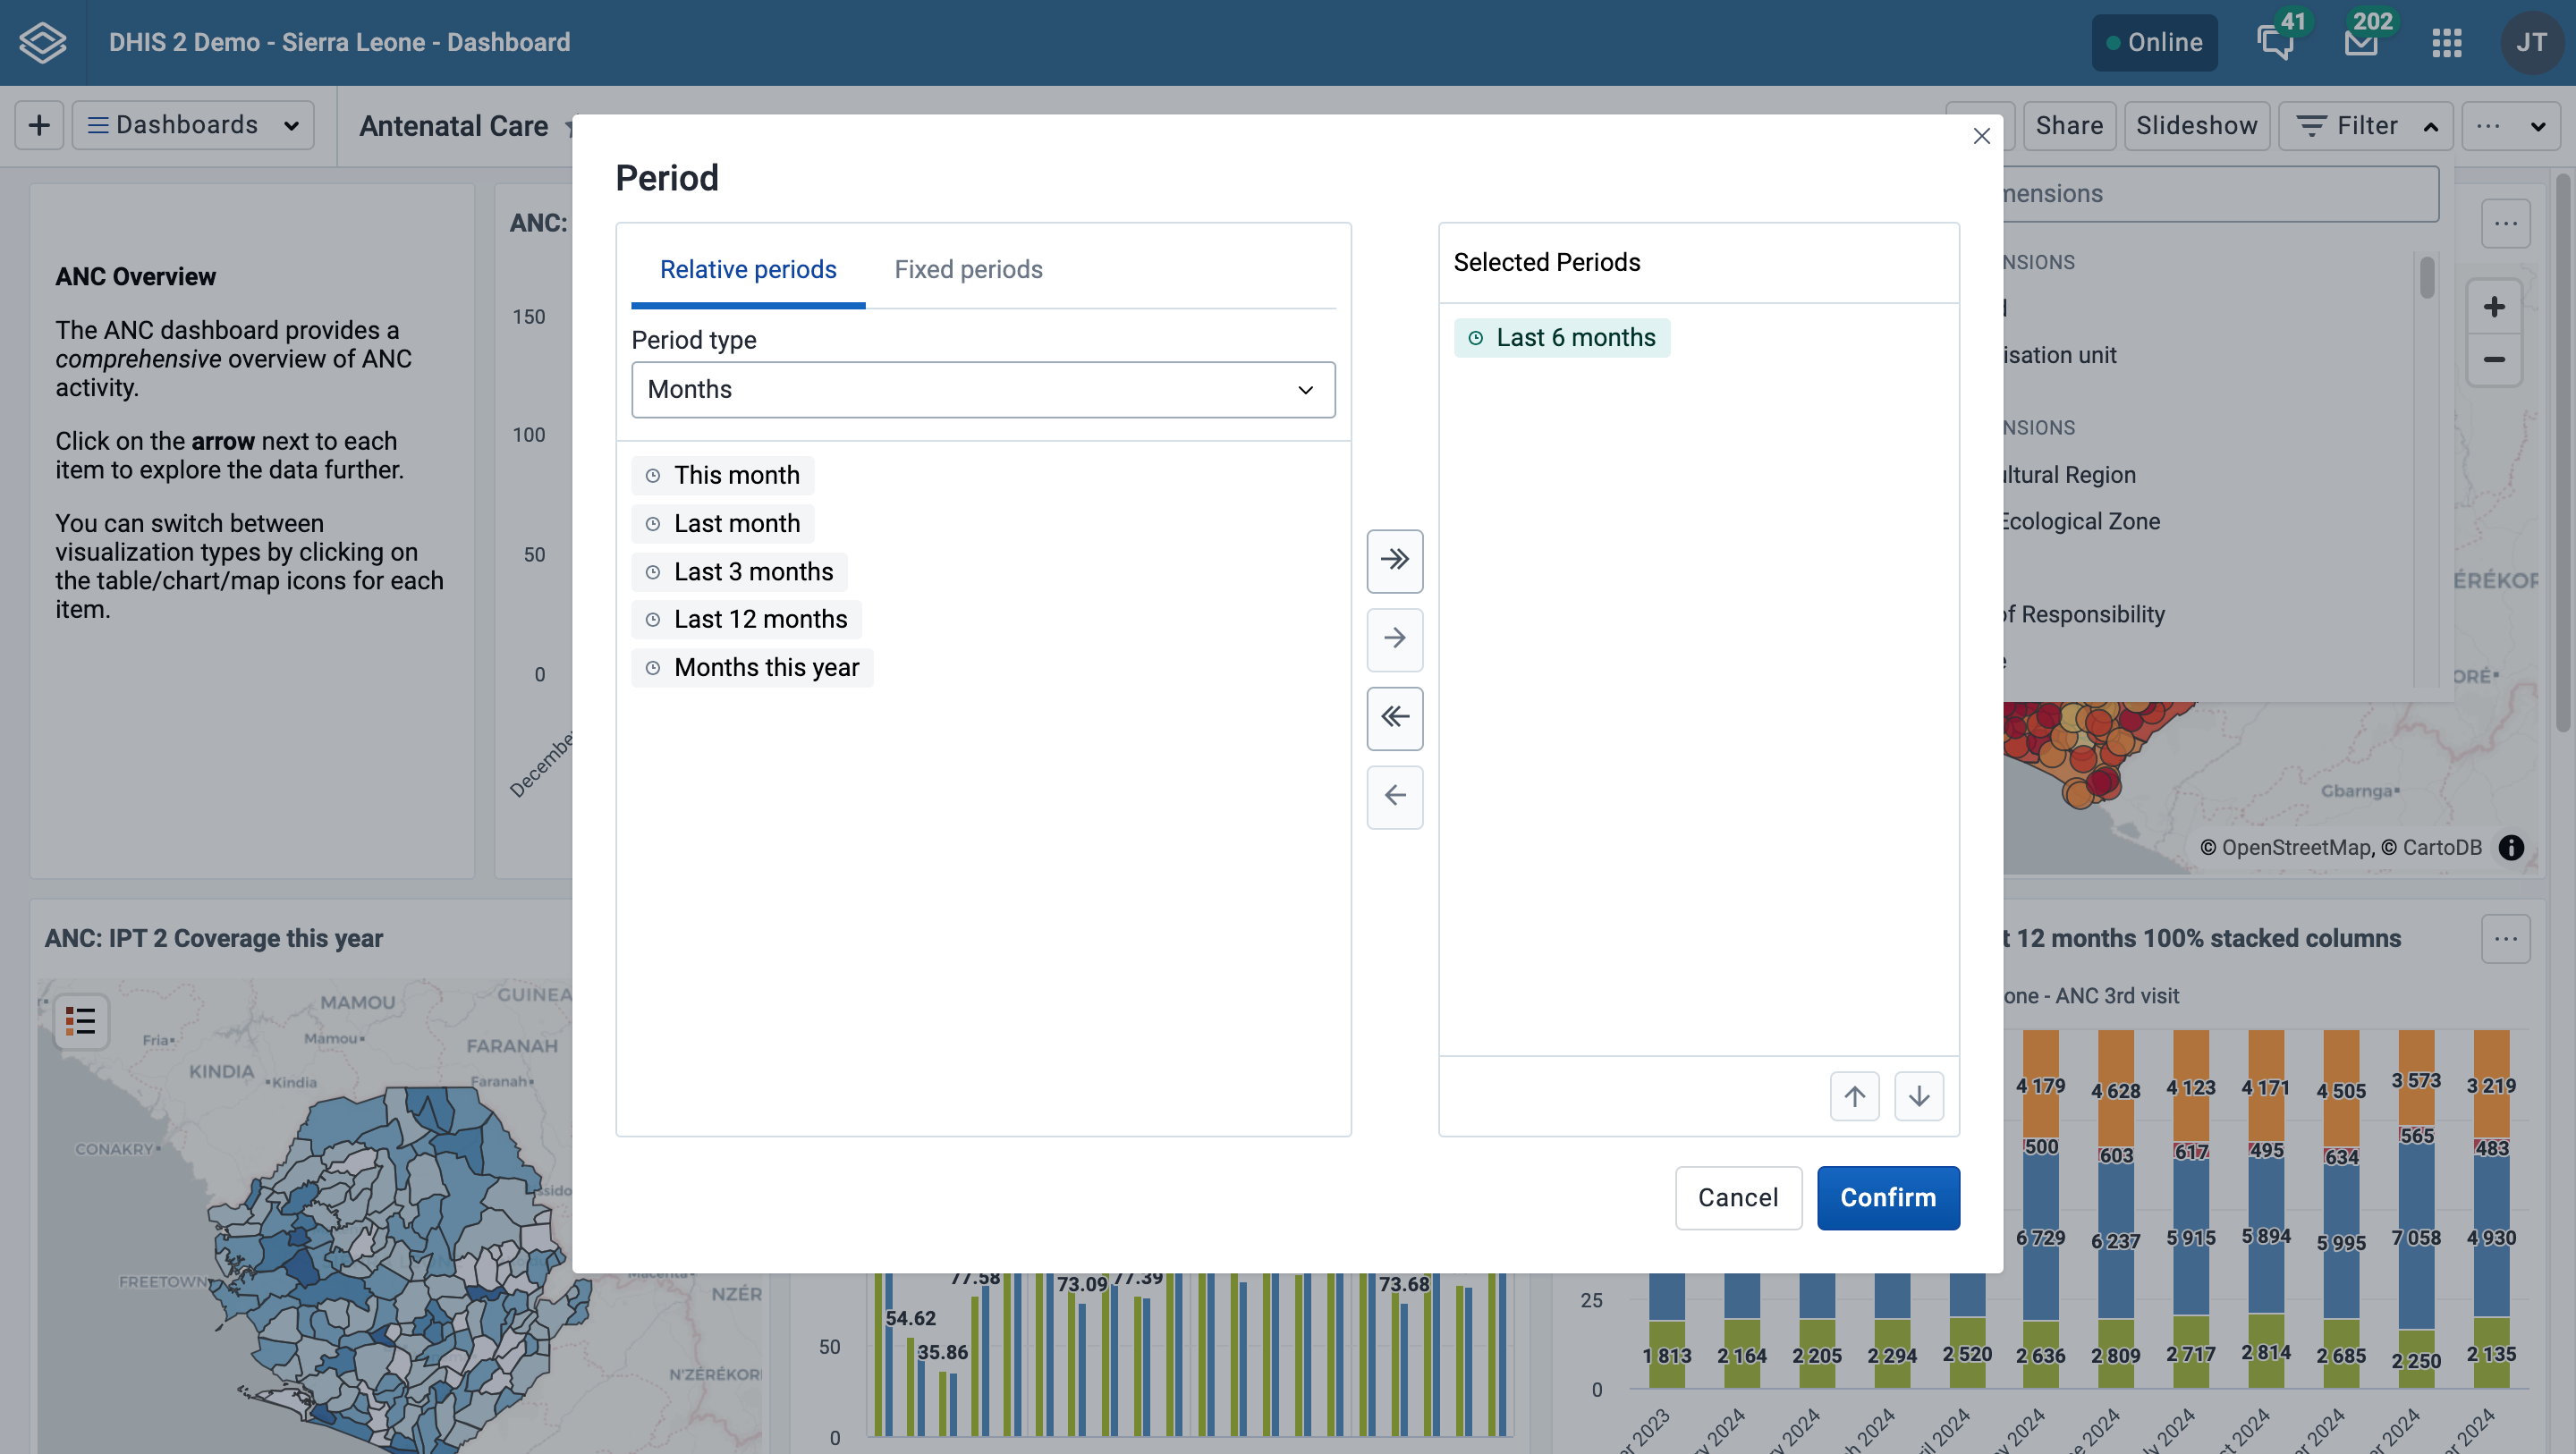
Click on Confirm in the dialog to apply the filter to the current dashboard.
Filters are not stored, so when switching to a different dashboard they are reset. Black filter badges appear above the dashboard items to indicate which filters have been applied to the dashboard's visualizations.
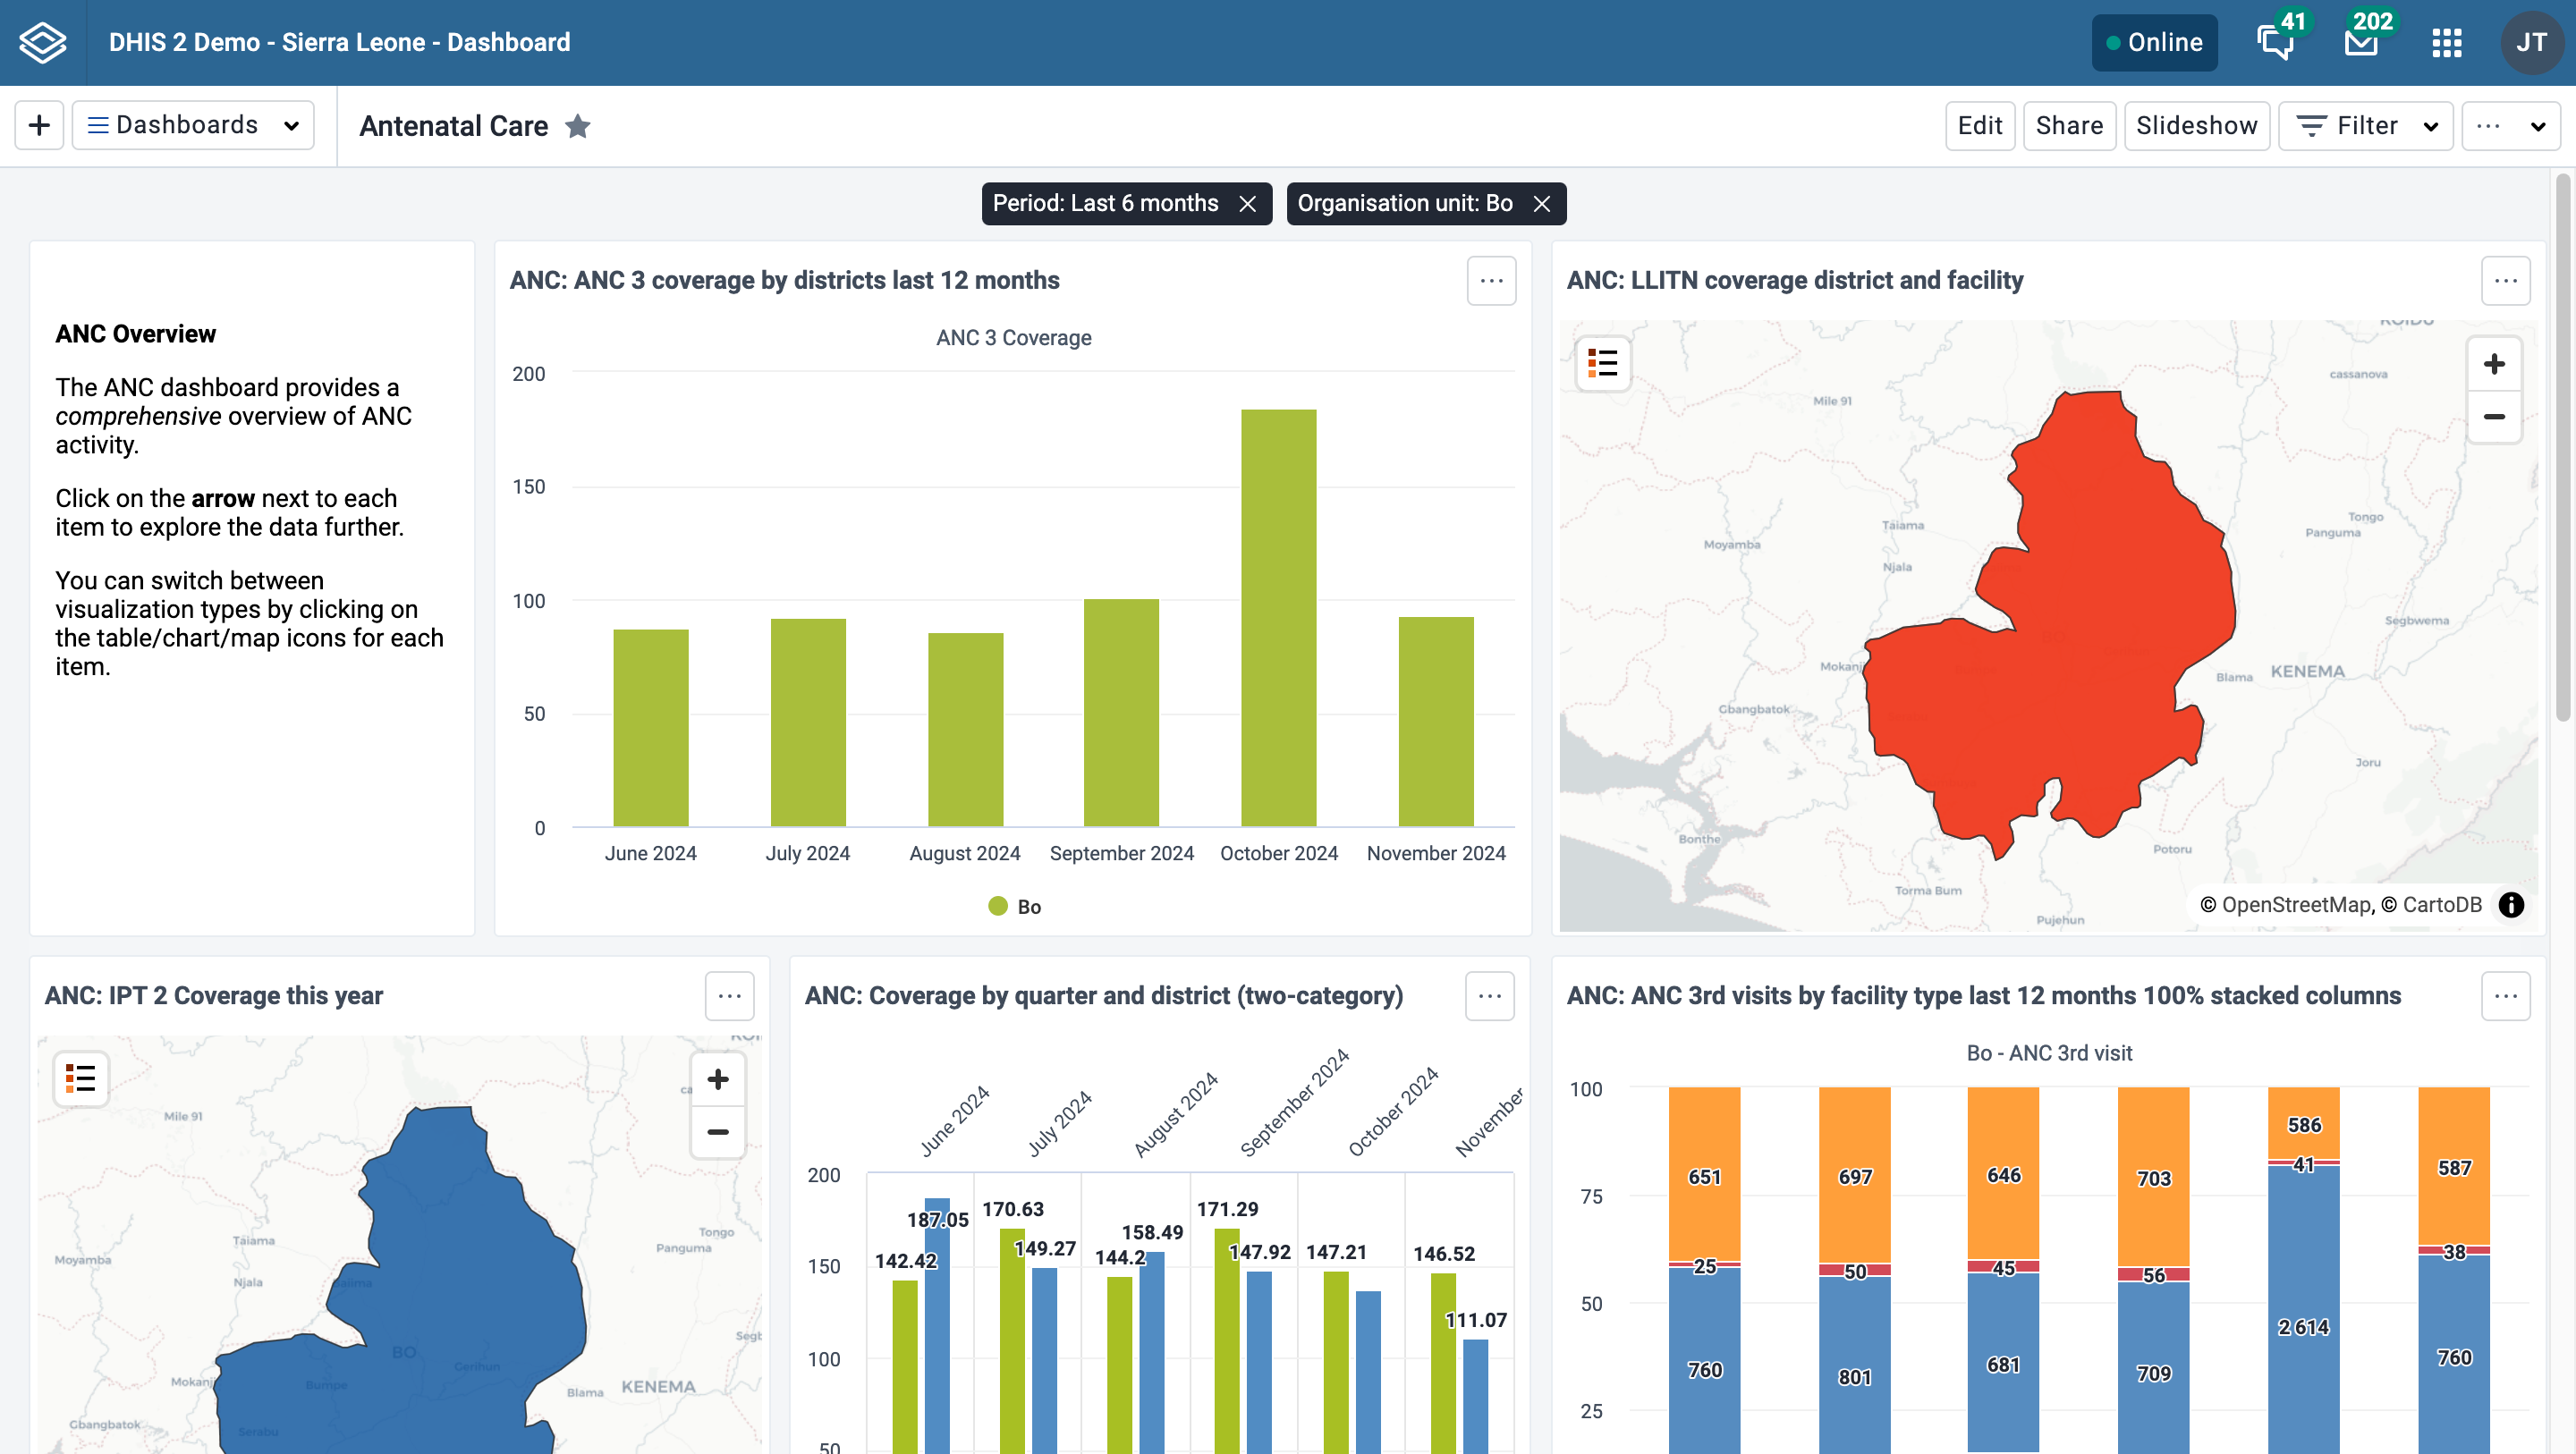
You can edit a filter by clicking on the filter badge to open the filter selection dialog. A filter can be removed by clicking on the Remove button on the badge. Whenever a filter is added, edited or removed, the dashboard items reload to show the updated data. The filter badges are always visible at the top of the page when scrolling the dashboard content.
By default, users are able to filter dashboard items by any dimension defined in the DHIS2 instance. To limit available filters, see Restricting dashboard filters.
The dashboard can be displayed in a slideshow by clicking on the Slideshow button. Once in slideshow mode, you'll find all the slideshow controls, including the manual navigation buttons, autoplay controls, and exit button in the slideshow control bar at the bottom of the page.

Slideshow control bar:

The slideshow can be autoplayed, or navigated manually.
When you enter the slideshow, it is paused. Click the play/pause button in the control bar to start the autoplay, and the slides will automatically advance according to the timing setting. A countdown bar is visible on the play/pause button while the slideshow is playing. Once the slideshow has reached the last slide, it will restart automatically. If 24 hours has passed since the slideshow began, a message stating as such will appear in the control bar, since data does not refresh during the slideshow and may be considered out of date for certain visualizations.
The autoplay controls include the play/pause button and the timing settings button. The user's most recent selected timing setting is remembered for the next time the slideshow is started.
You can also navigate the slides manually both when the slideshow is playing and paused. Use the manual navigation buttons or forward/back arrow keys on the keyboard to navigate through the slides. If the slideshow is playing, the timer resets when manually navigating, and the slideshow will automatically advance unless you click pause.
Exit the slideshow with the esc key or by pressing the exit button.
Any filters that are applied will be displayed in the slideshow control bar. Note that messages and spacer items are not displayed in the slideshow.
To make a dashboard available offline, choose the Make available offline option in the ... menu. This will cause a reload of the dashboard where requests to the server are recorded and saved in browser storage. Note that offline dashboards are only available on the computer and browser where you set it to offline. If you currently have a filter applied when requesting the dashboard be made available offline, a dialog will appear to confirm the removal of the filters.
Note that some dashboard items may not be displayed when offline. Specifically, third party plugins that have not implemented offline handling, as well as maps with Google Earth Engine layers will not be displayed when offline.
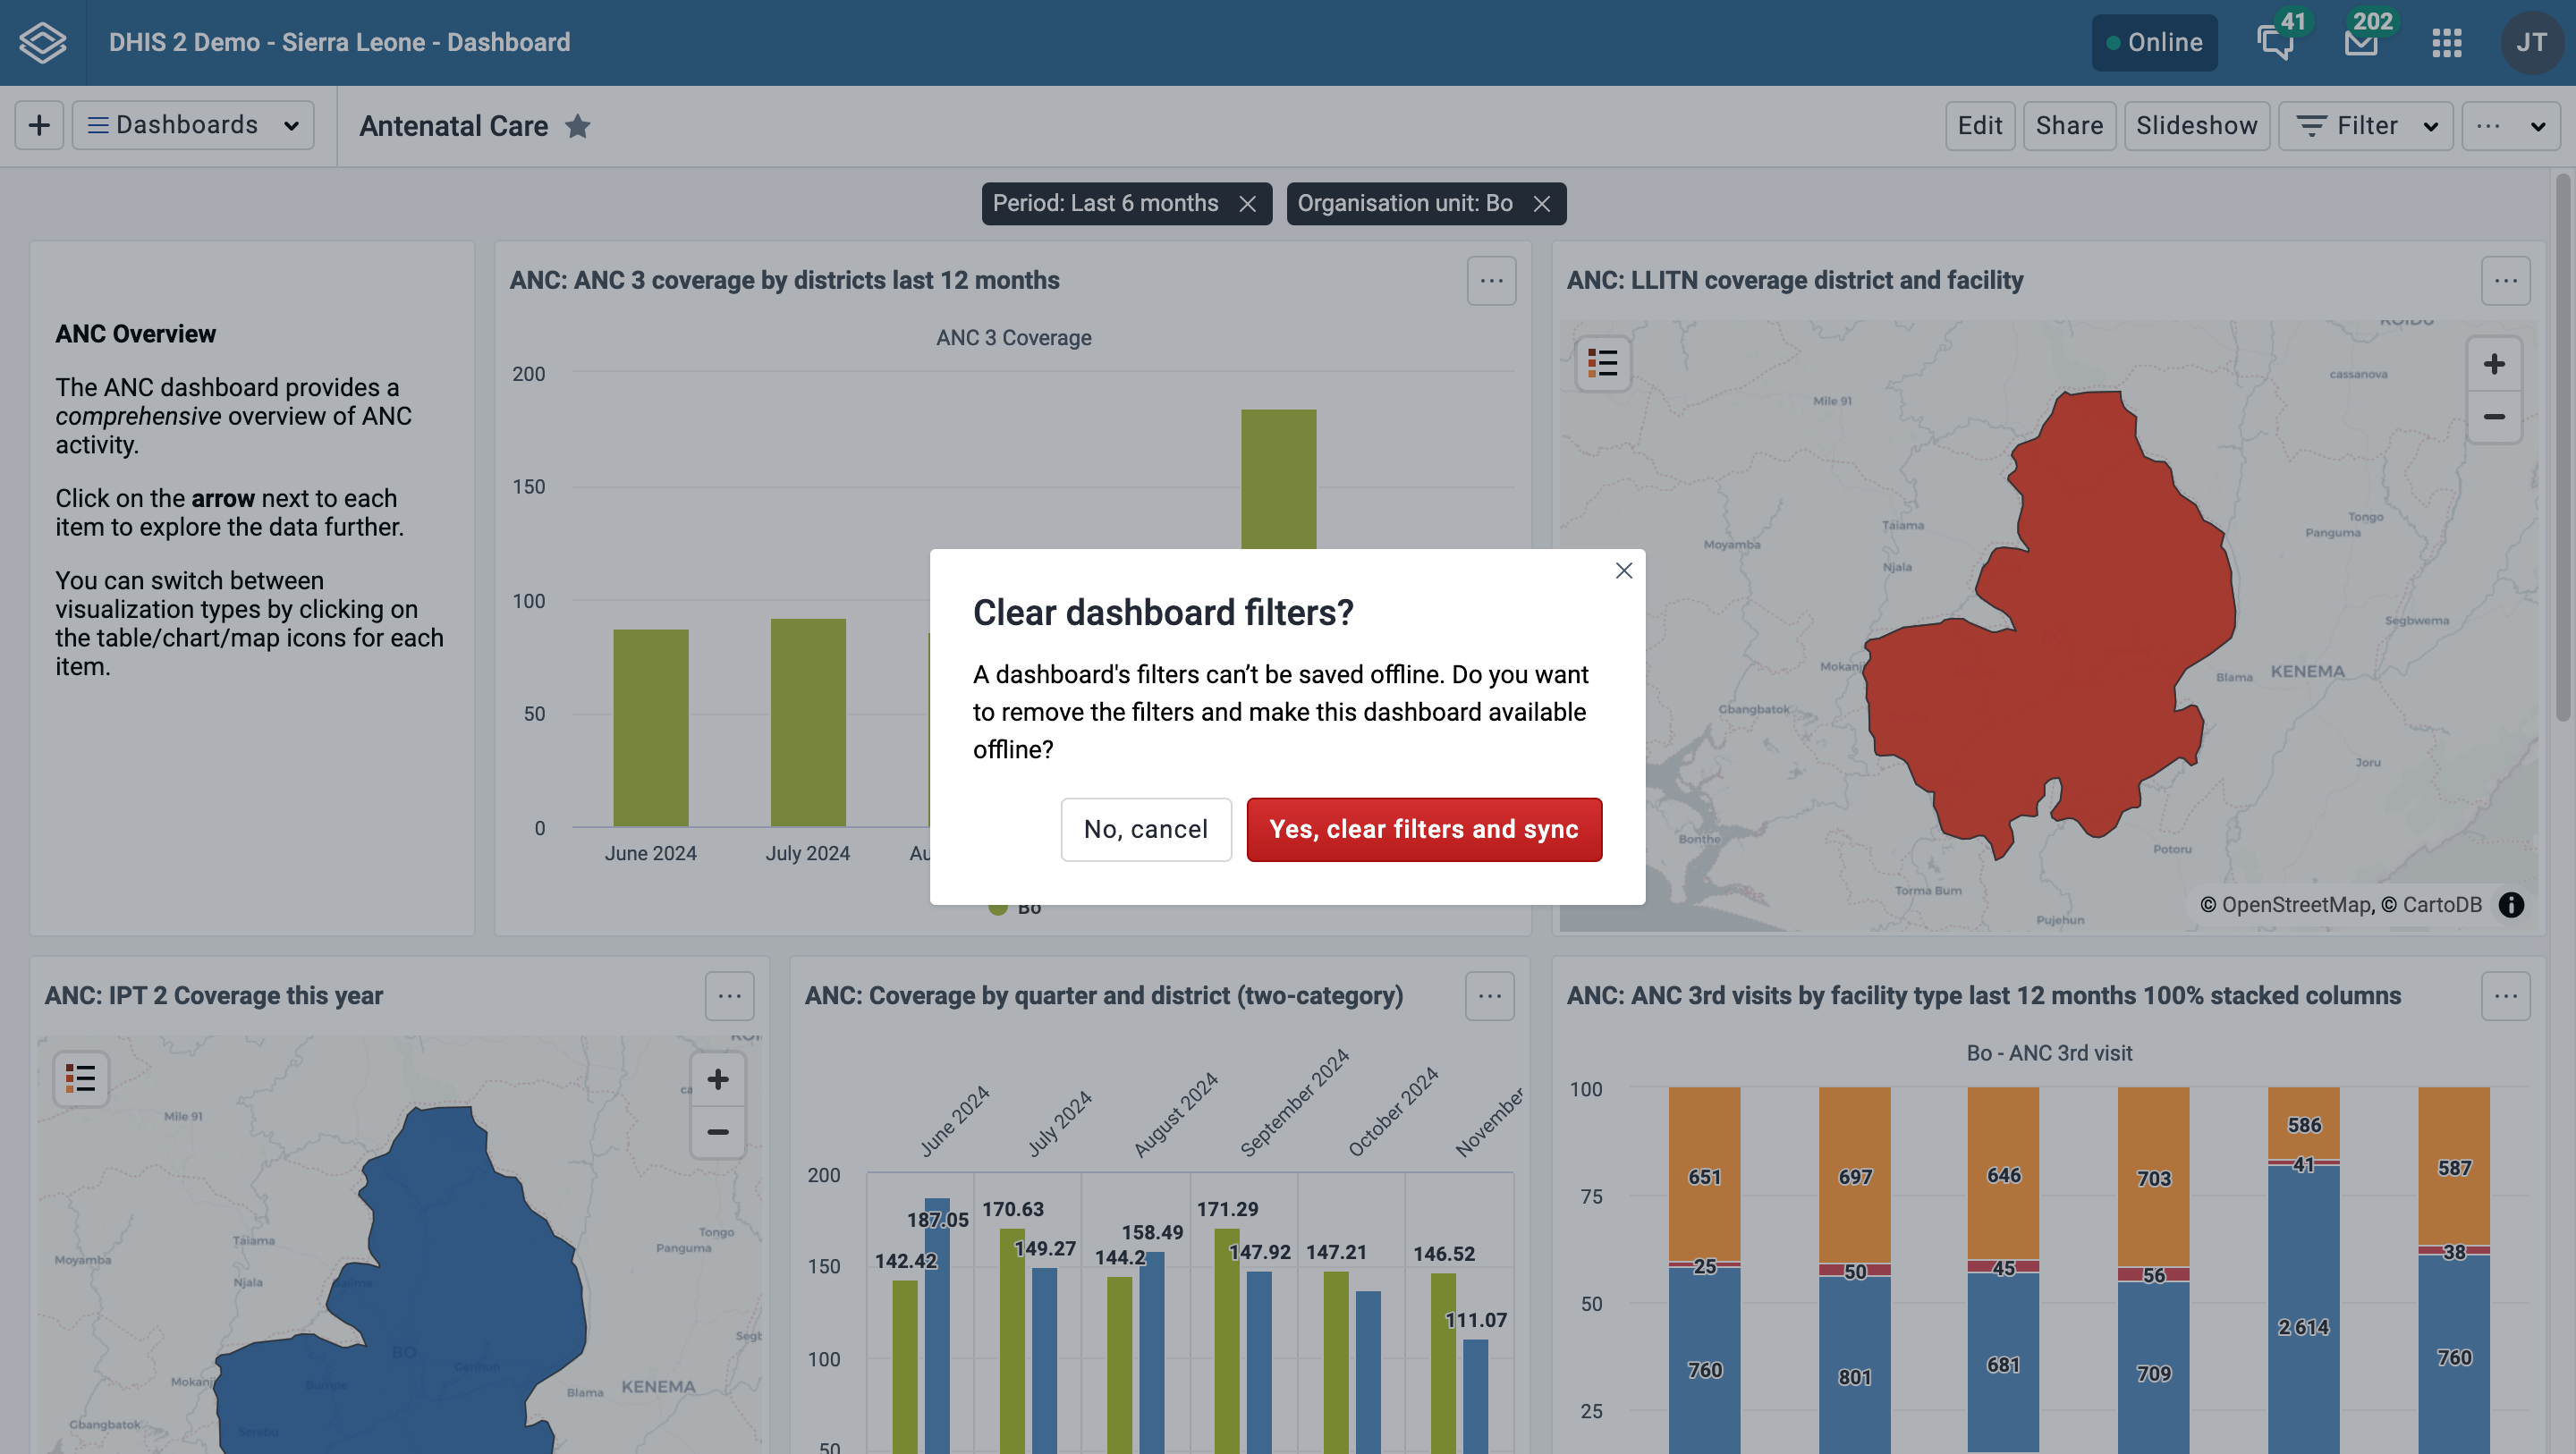
Dashboards that have been saved for offline display a tag next to the dashboard title showing the time it was saved. In the dashboard selector, an icon is displayed if the dashboard is available offline.
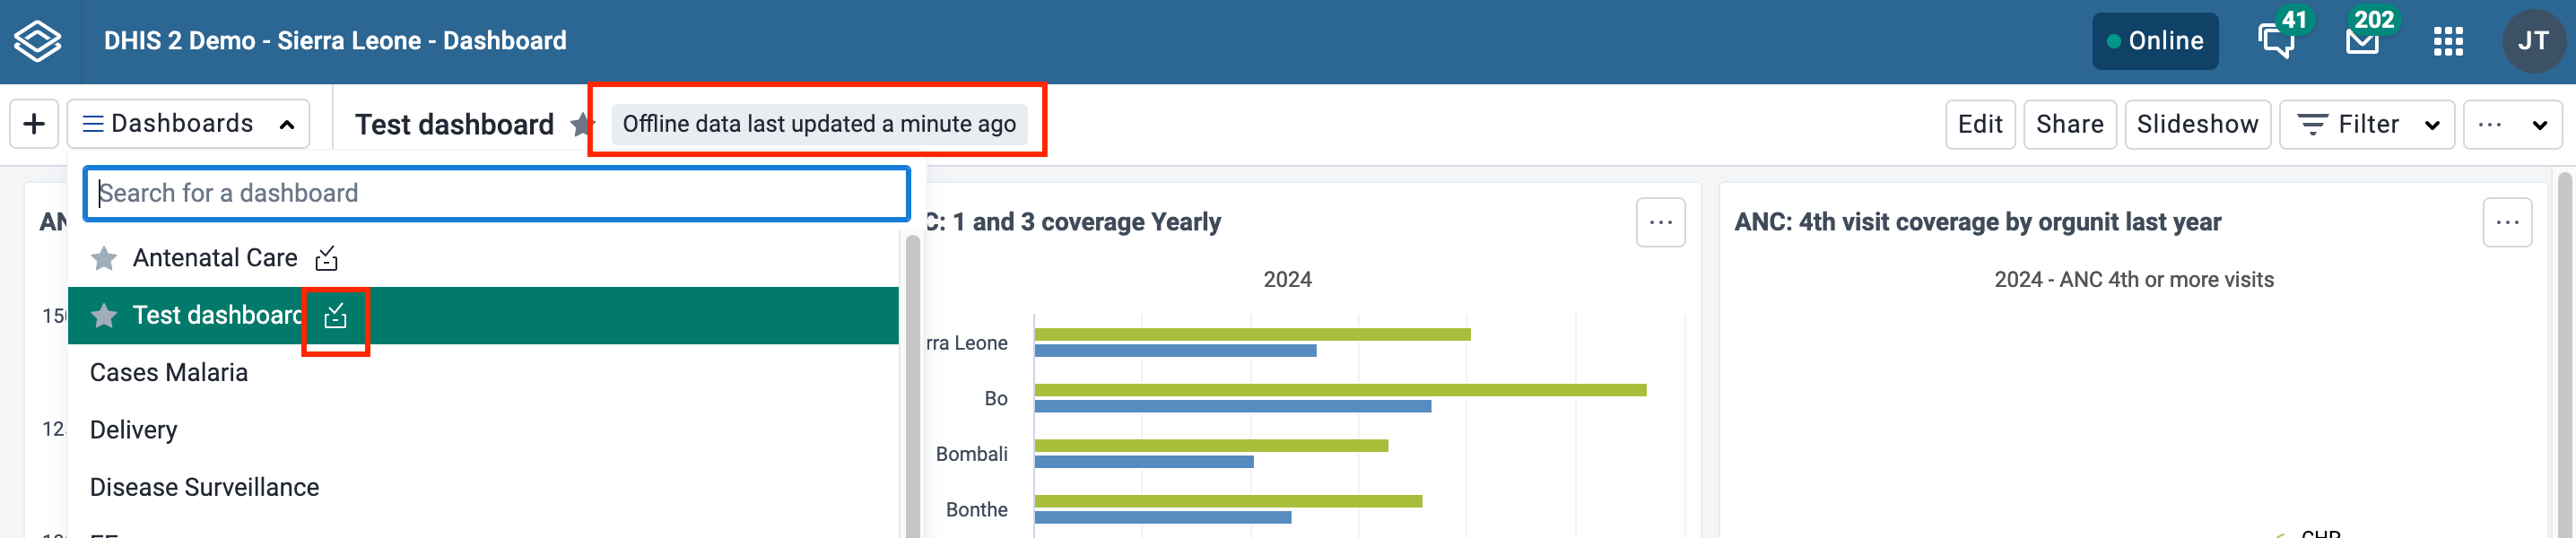
If the dashboard has been changed since you made it available offline, either by you or someone else, you'll need to choose Sync offline data now from the ... menu to save the latest version of the dashboard.
You can remove a dashboard from offline storaged by choosing Remove from offline storage in the ... menu.
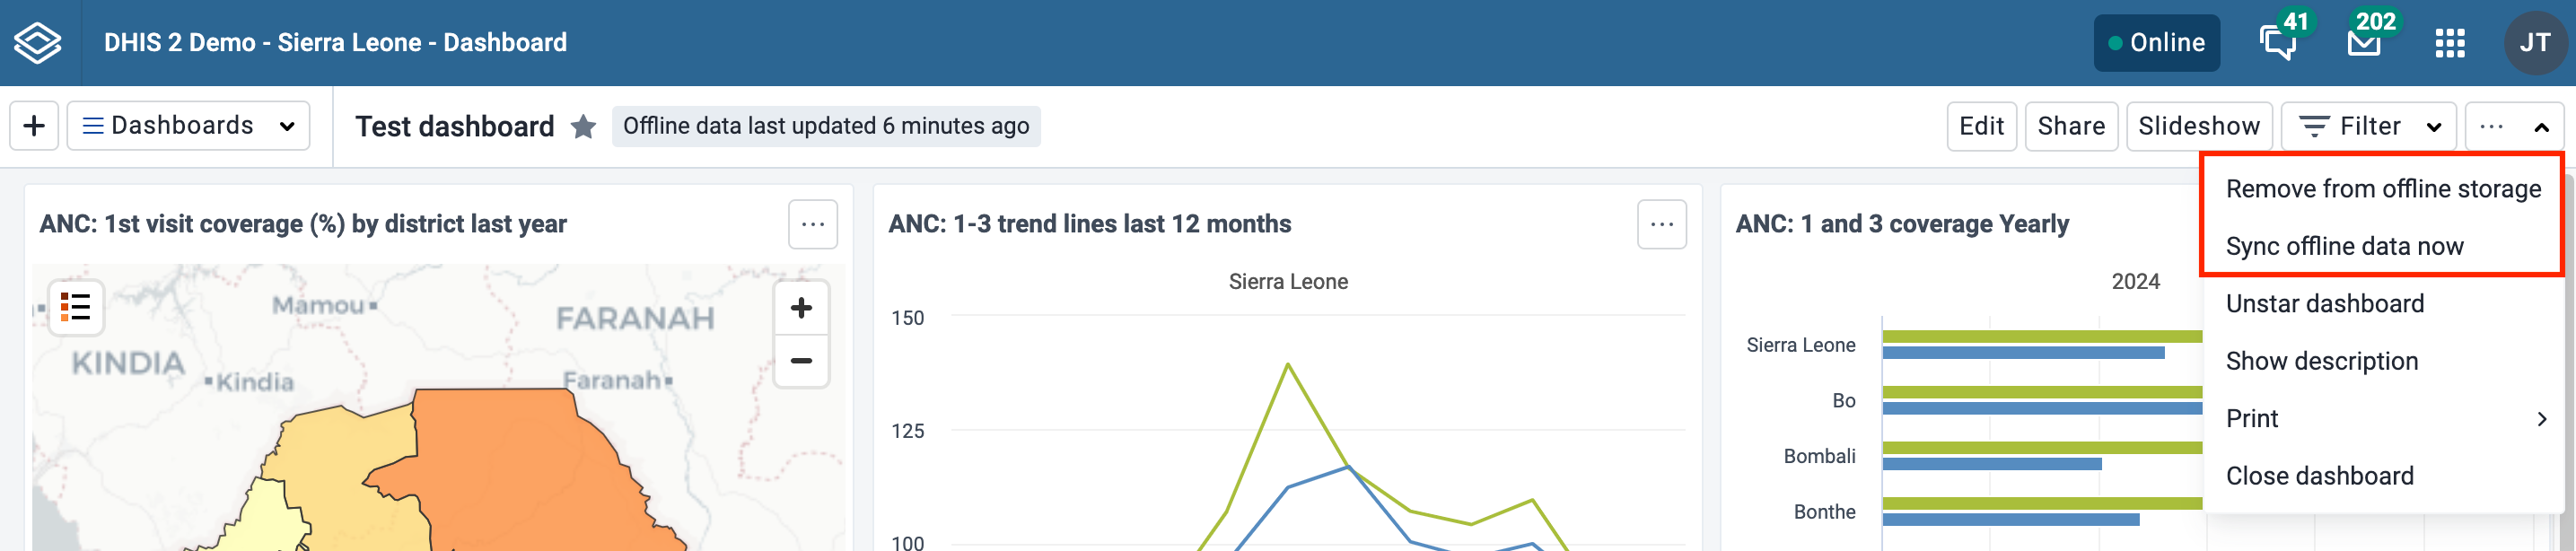
If you manually log out of the DHIS2 instance, all cached dashboards will be cleared and they will no longer be available offline.
If you are offline, any buttons or actions that require a connection to complete successfully are disabled. They will be re-enabled once connectivity is restored.
From the ... menu you can print the current dashboard. There are two styles of dashboard print: Dashboard layout and One item per page. For both styles, a title page is added that shows the dashboard title, description (if the Show description setting is enabled), and any applied dashboard filters.
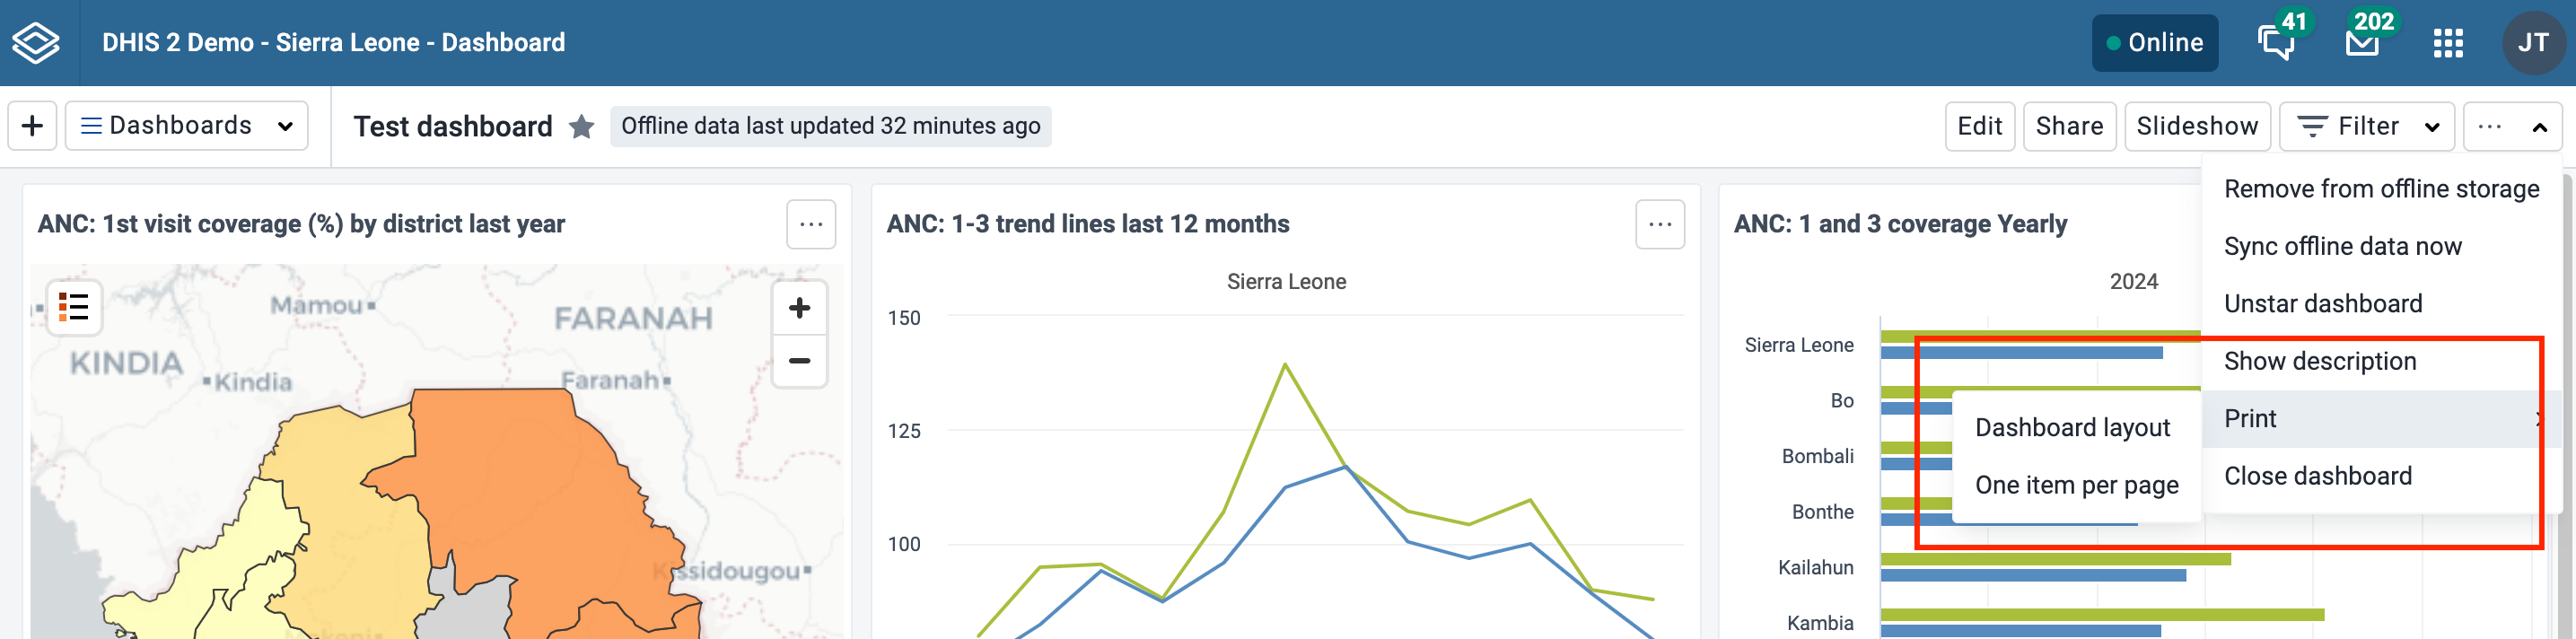
For best print results:
Dashboard layout print will approximate the dashboard layout as it is shown in the browser. Note that some adjustments may need to be made to the layout in order to prevent items being split onto multiple pages: items that would be cut off by a page break are moved to the next page, and items that are taller than one page are shortened to fit on one page.
Once in print mode, click on the Print button in the upper right to trigger the browser print functionality.
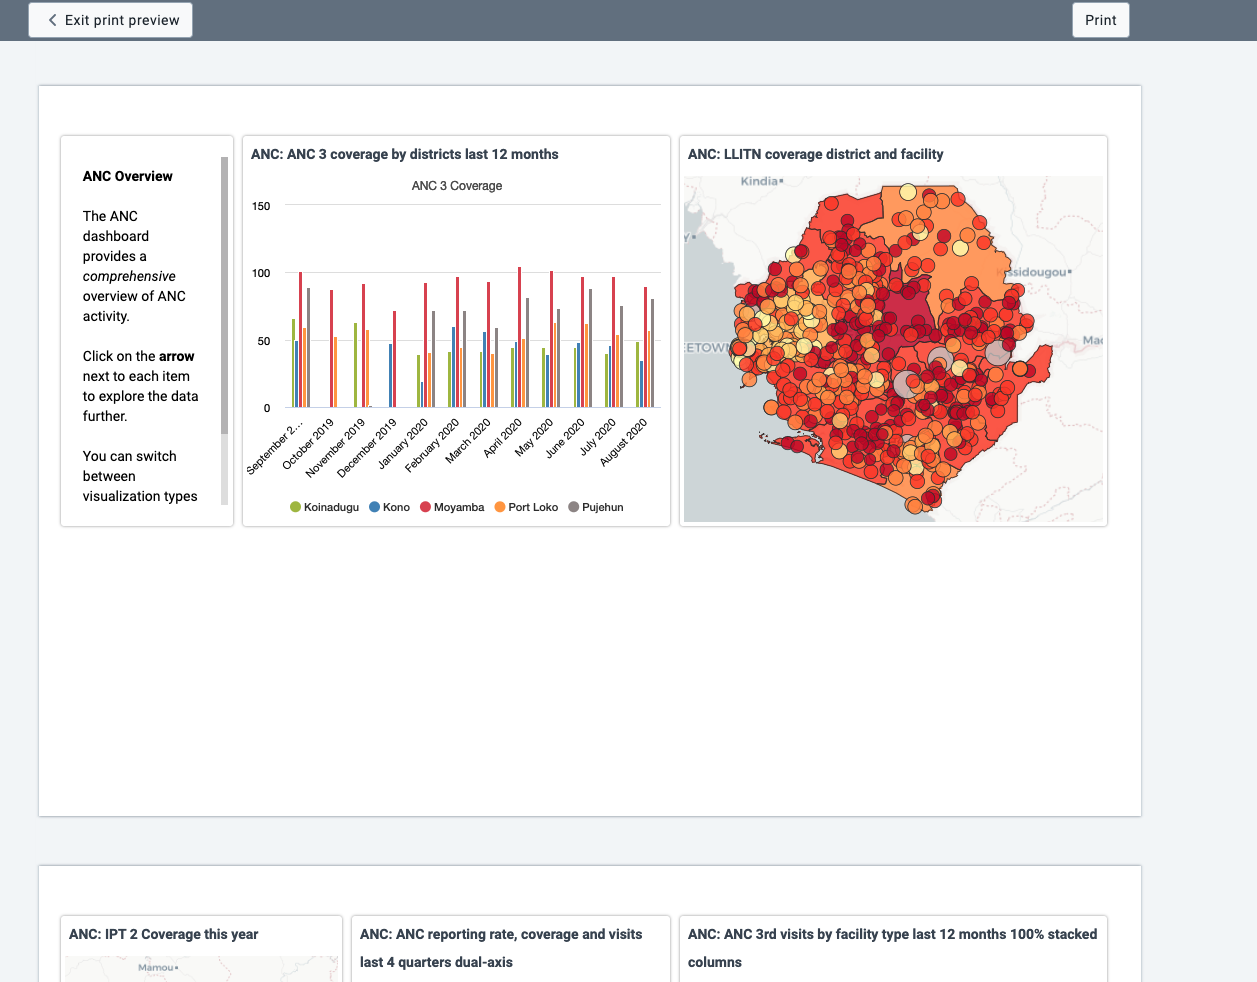
This style of print will print each dashboard item on a separate page, maximizing the use of the paper size.
Click on the Print button in the upper right to trigger the browser print functionality.
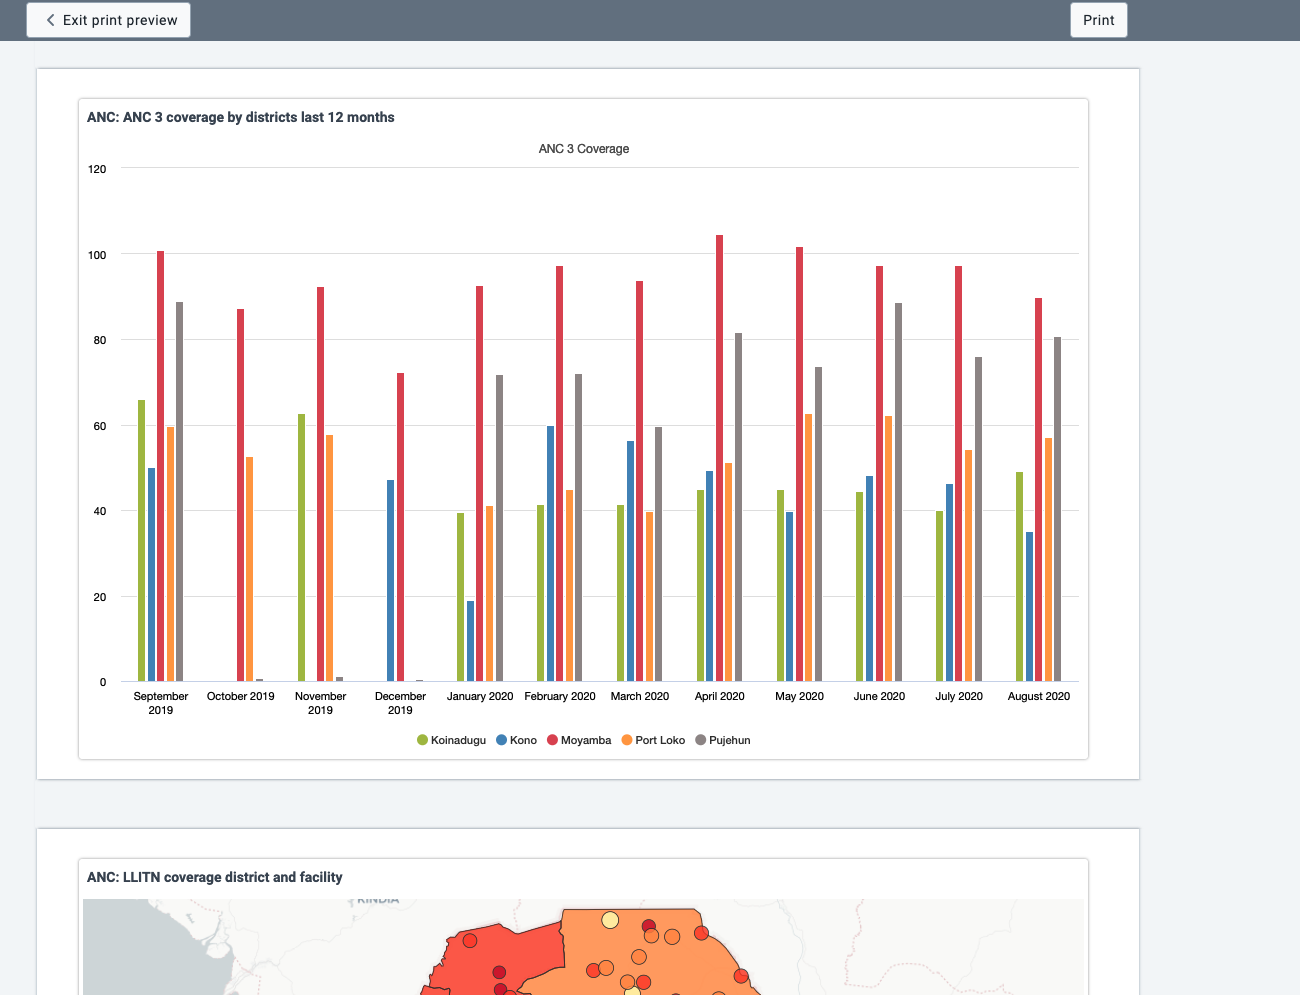
Dashboard items with charts, pivot table, maps, line lists, event reports and event charts may have an item menu button in the upper right corner of the item with additional viewing options, depending on the system settings that have been configured for the DHIS2 instance. If all the relevant system settings have been disabled by the DHIS2 instance, then there will not be an item menu button. Here are the possible item menu options:
It is possible to toggle the visualization view of charts, pivot tables and maps, and between event charts and reports. Click on the item menu button and choose the desired view (e.g., View as Table, View as Map, View as Chart):
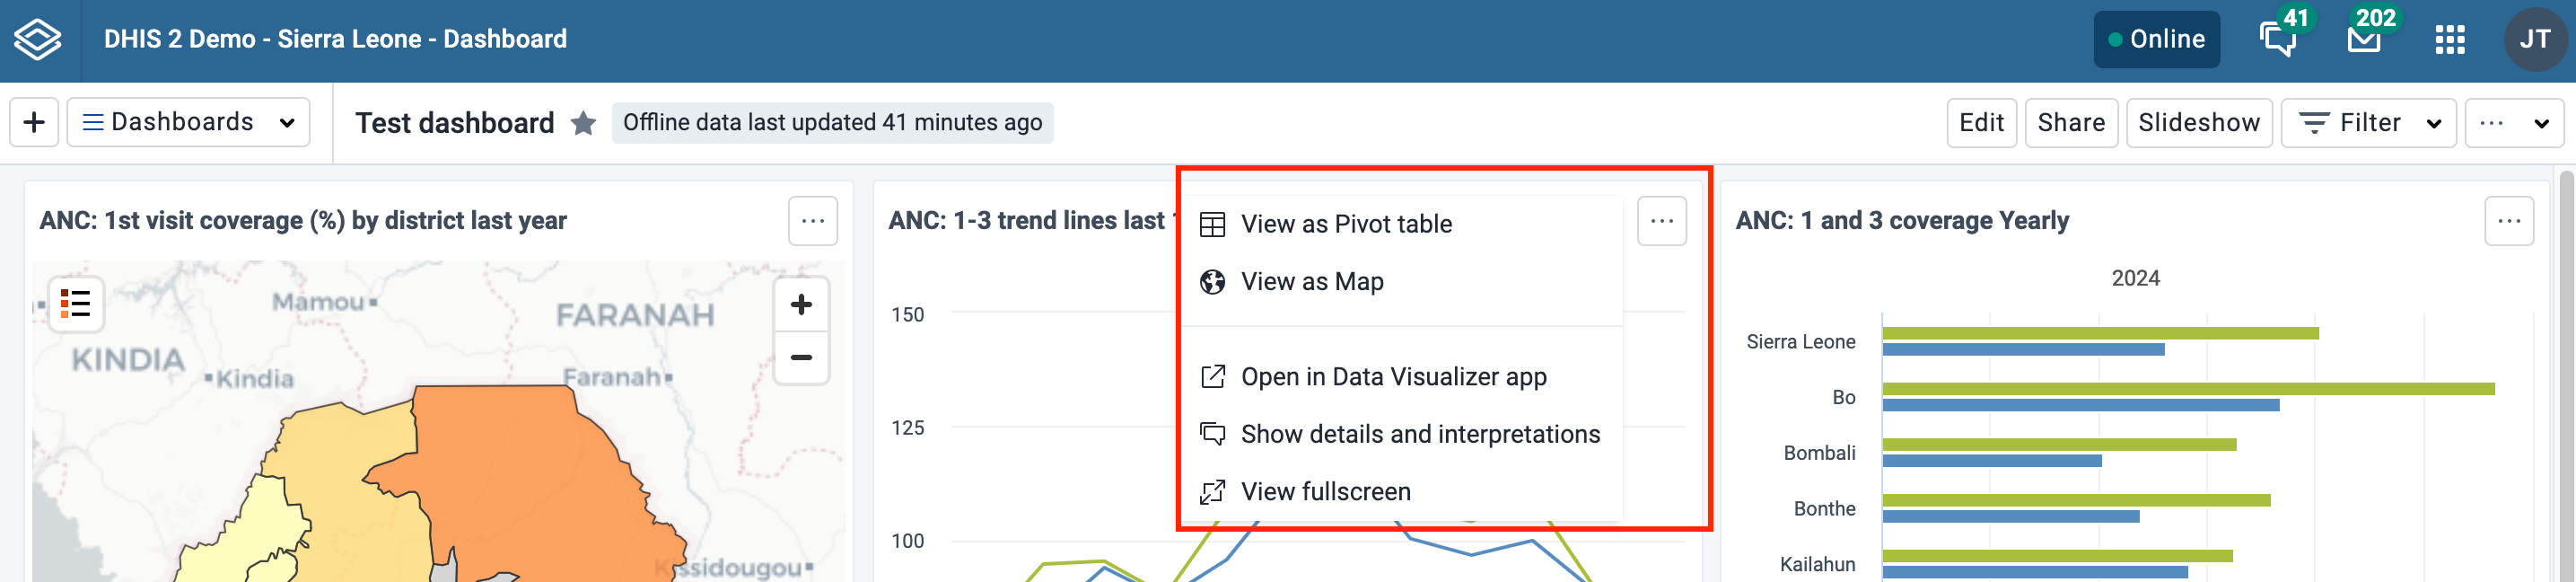
To view the chart, table, map or line list in fullscreen, click on the View fullscreen option. To exit fullscreen, you can either press esc key or click the exit button in the upper right corner of the fullscreen view. Note that you actually enter the slideshow in a paused state, and can then use the navigation bar or click the play button as described in the Slideshow section to navigate to other dashboard items in fullscreen.
To open the visualization in its corresponding app (e.g., Data Visualizer, Maps) click on the Open in [app name] app option.
You can write interpretations for charts, pivot tables, maps, line lists, event reports, and event charts by clicking on Show interpretations and details. The item will be expanded vertically underneath to show the description, interpretations and replies:
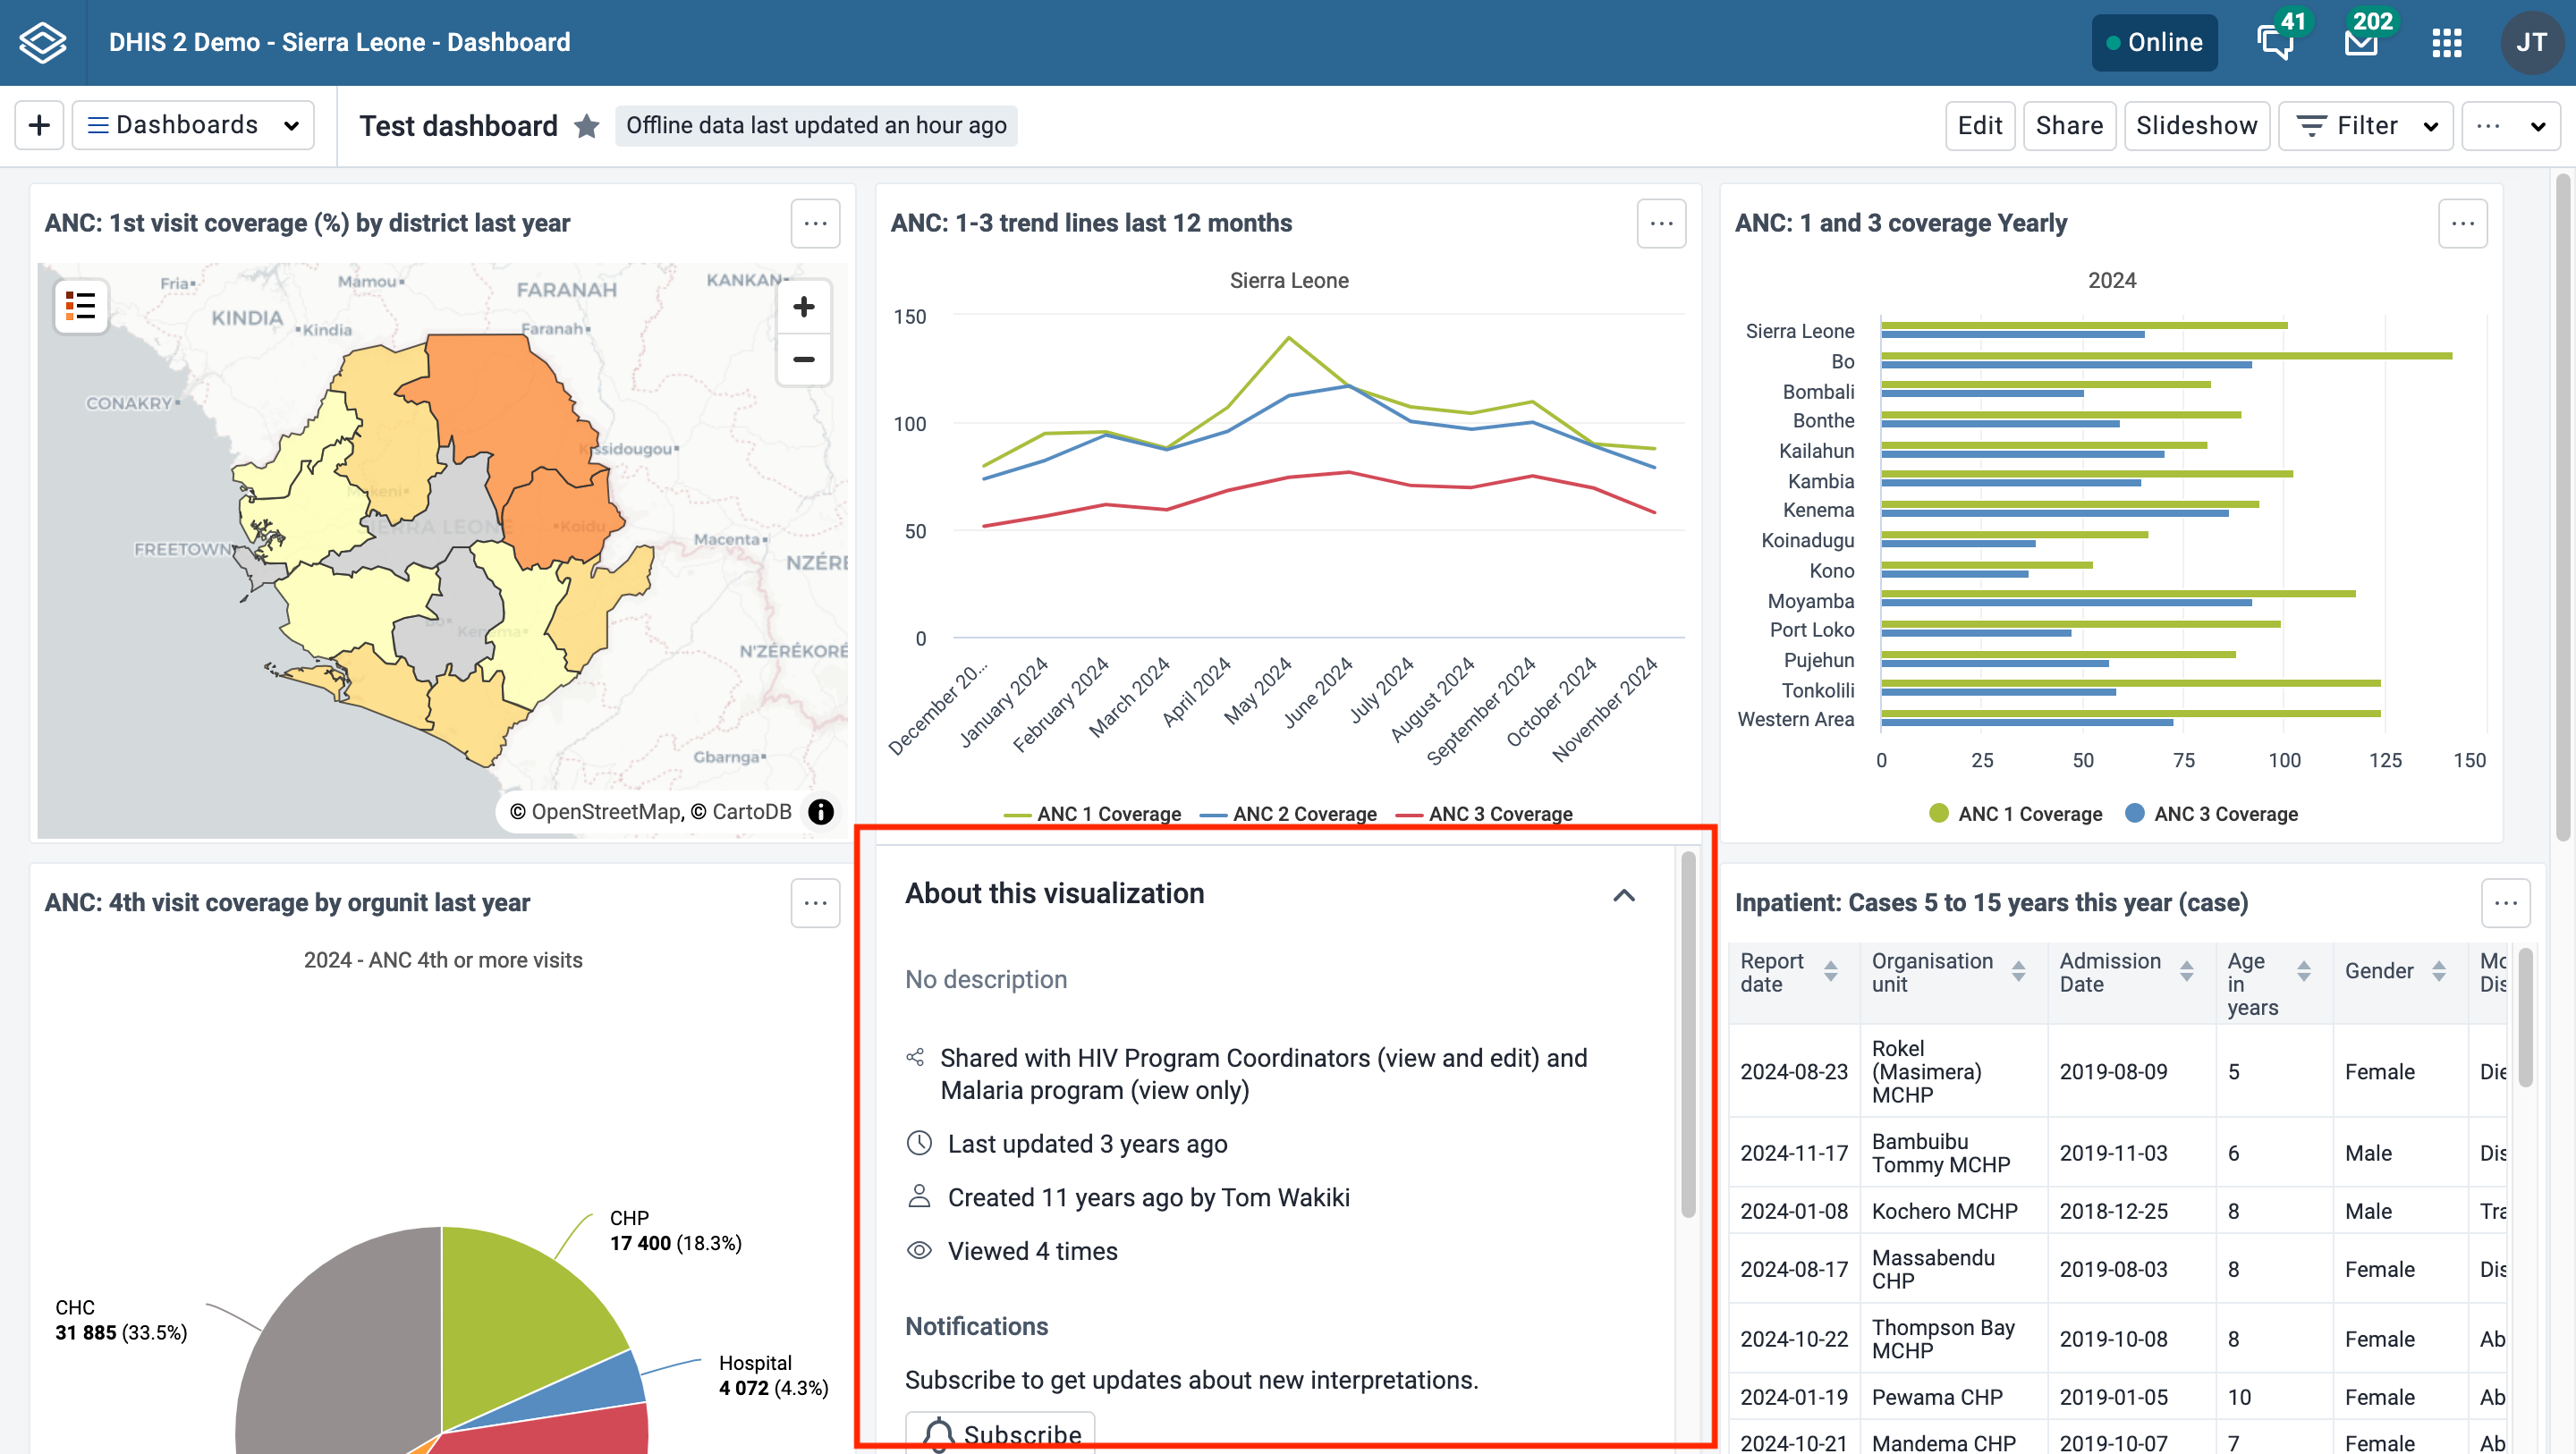
You can like an interpretation, reply to an interpretation, and add your own interpretations. You can edit, share or delete your own interpretations and replies, and if you have moderator access, you can delete others’ interpretations.
It is possible to format interpretation text with bold, italic by using the Markdown style markers * and _ for bold and italic respectively. The text field for writing new interpretations has a toolbar for adding rich text. Keyboard shortcuts are also available: Ctrl/Cmd + B and Ctrl/Cmd + I. A limited set of smilies is supported and can be used by typing one of the following character combinations: :) :-) :( :-( :+1 :-1. URLs are automatically detected and converted into a clickable link.
Interpretations are sorted in descending order by date, with the most recent shown on top. Interpretation replies are sorted in ascending order by date, with the oldest shown on top.
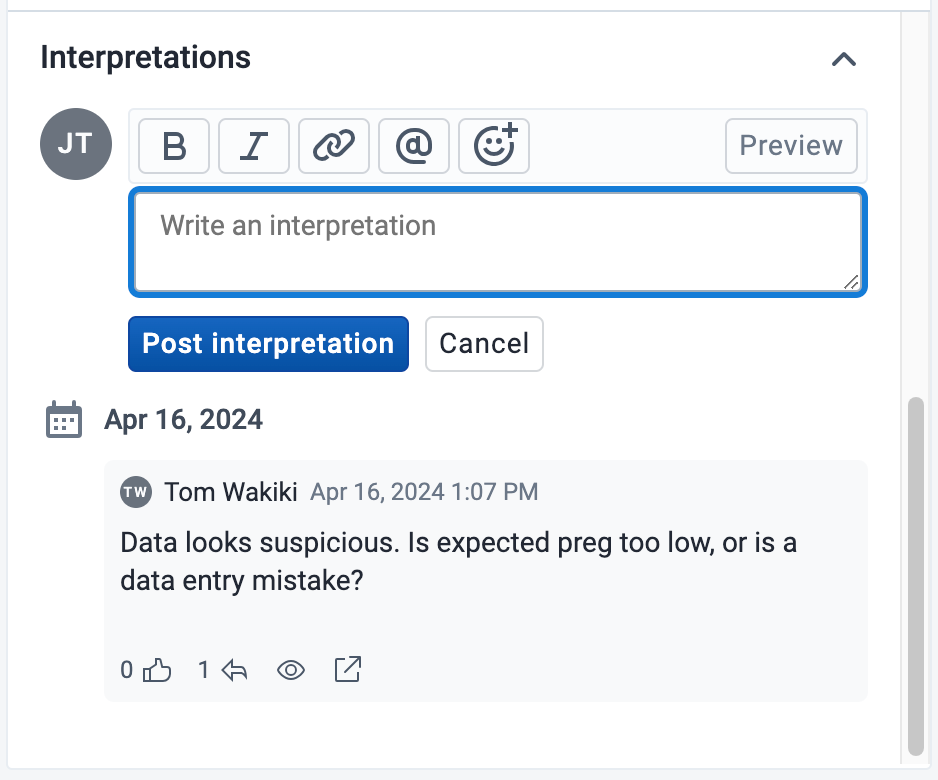
In order to share the dashboard with users and user groups, click on the Share button to the right of the dashboard title to display the Sharing and access dialog.
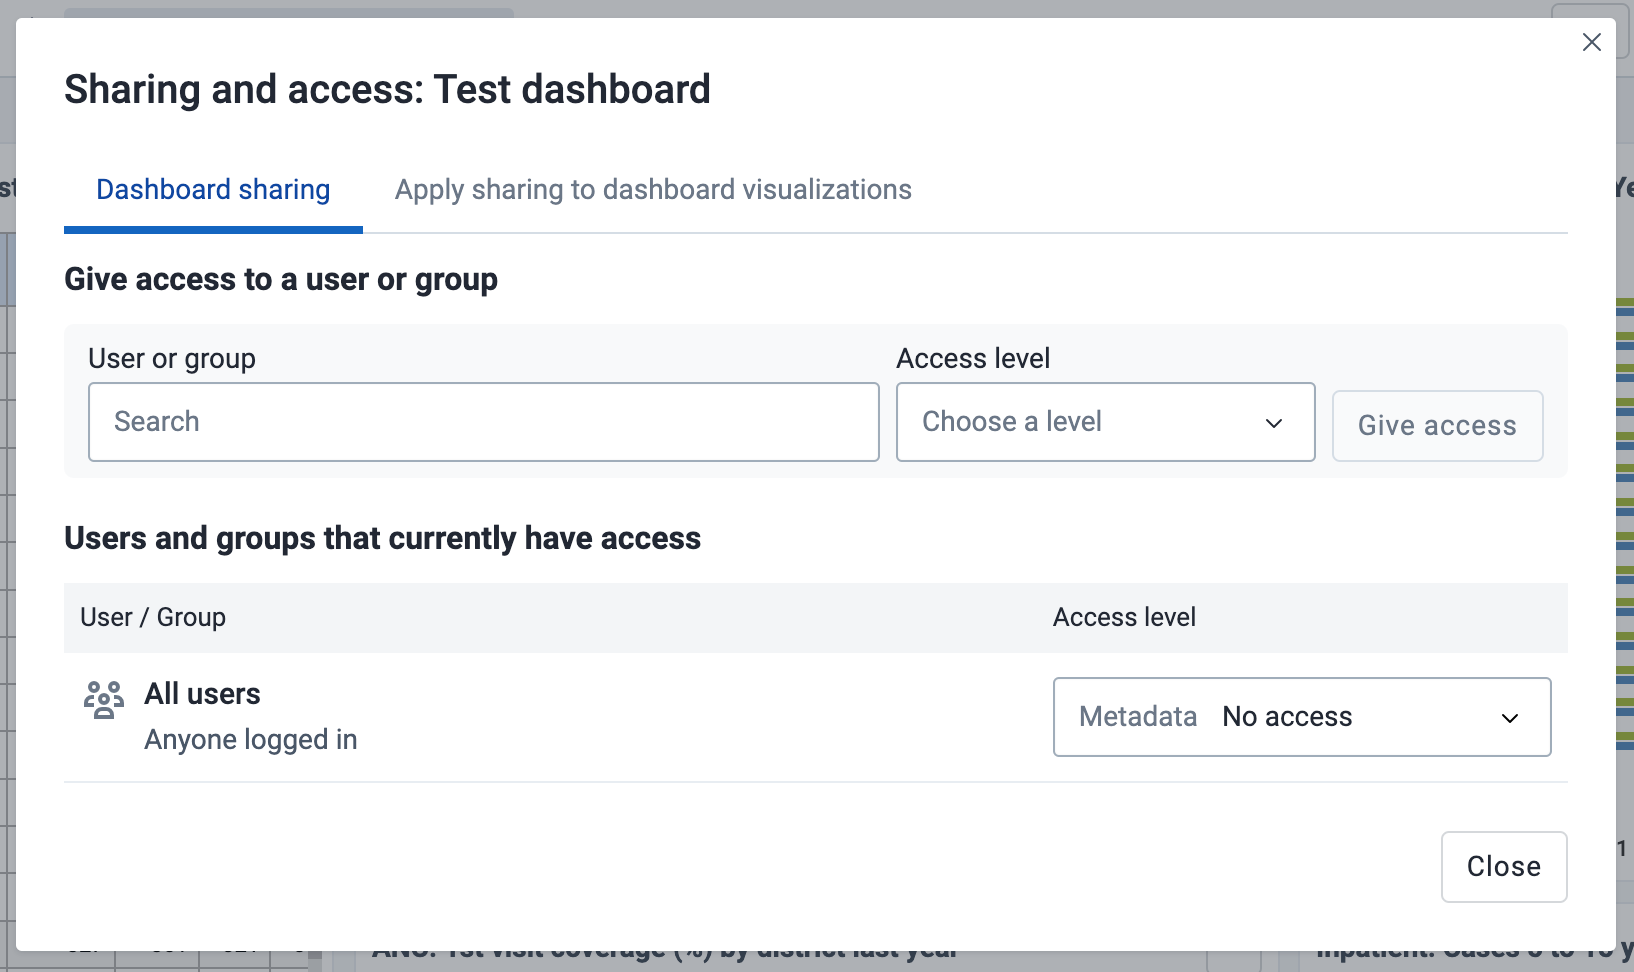
There are three levels of sharing permissions available for a dashboard:
No access
The user or user group cannot view or edit the dashboard. If they try to access the dashboard with the url, the Dashboards app will display the message "Requested dashboard not found".
View only
The user or user group can view the dashboard but cannot edit it.
View and edit
The user or user group can view and edit the dashboard. This level of sharing allows for all types of changes, including altering the layout, resizing and removing items, renaming and deleting the dashboard, etc.
All dashboards have the All users group set to No access by default. The All users group includes all logged-in users.
To share a dashboard with specific users and user groups, type the name in the input field, choose the desired access level and click on Give access.
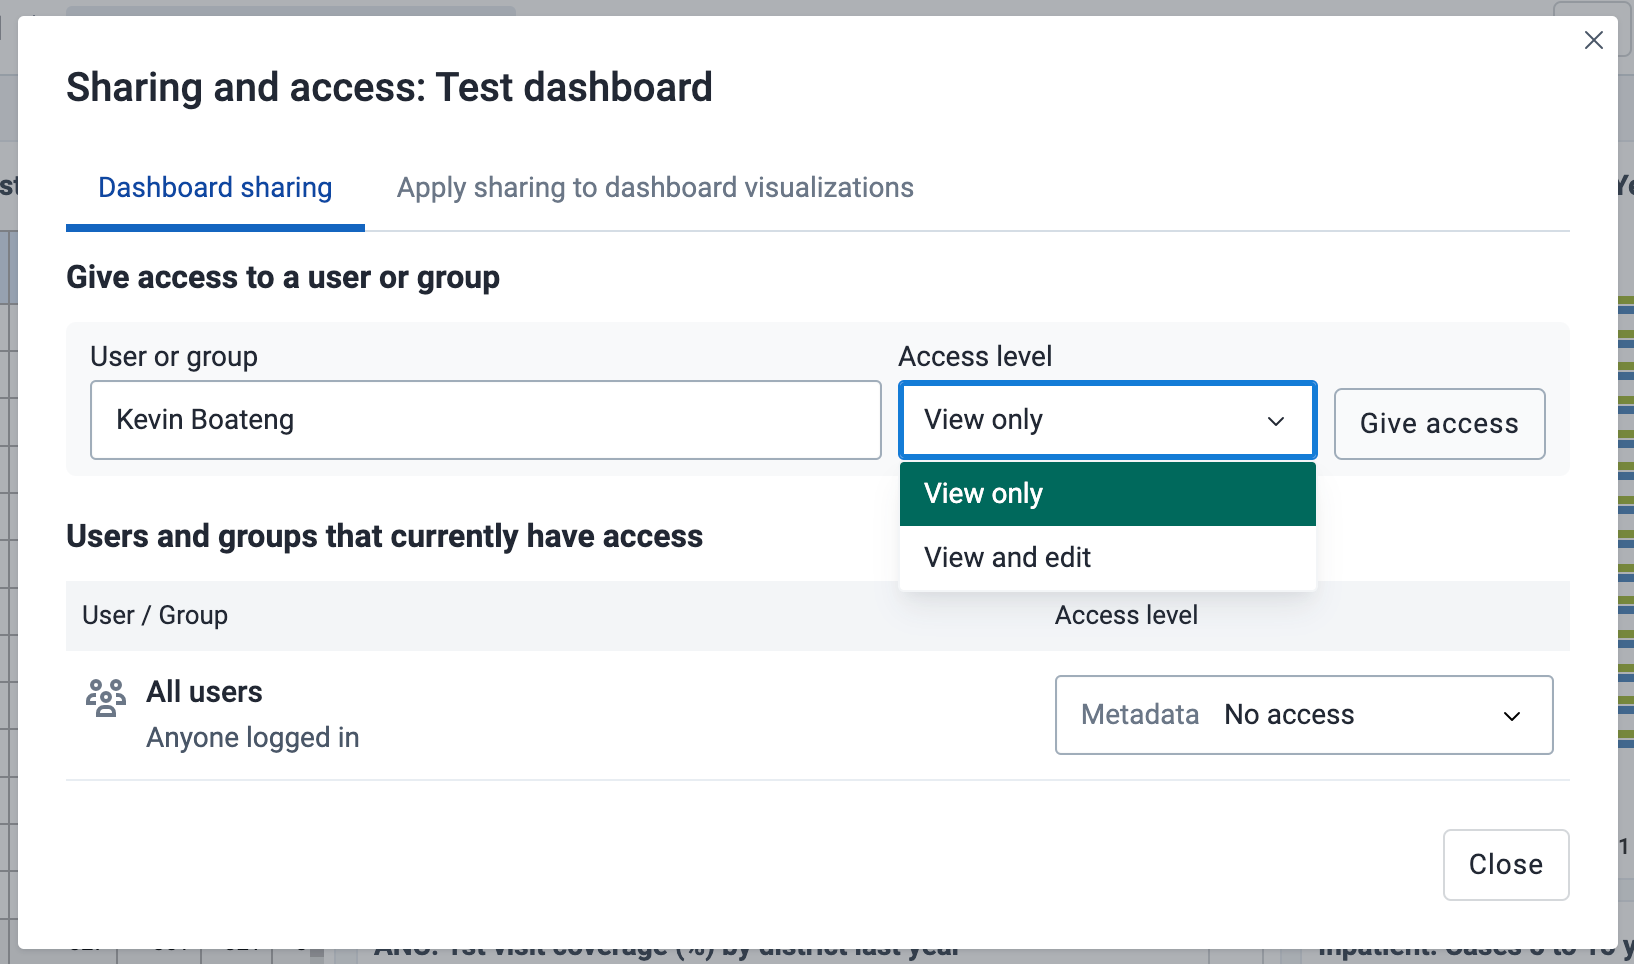
You can provide users with the url of the dashboard, allowing them to navigate directly to the dashboard. To get the dashboard url, just open the dashboard in view mode, and copy the browser url. For example, the url to the Antenatal Care dashboard in play.dhis2.org/dev is:
https://play.dhis2.org/dev/dhis-web-dashboard/#/nghVC4wtyzi
To ensure that all charts, maps and tables on the dashboard are shared with the chosen users and user groups, click on the Apply sharing to dashboard items button.
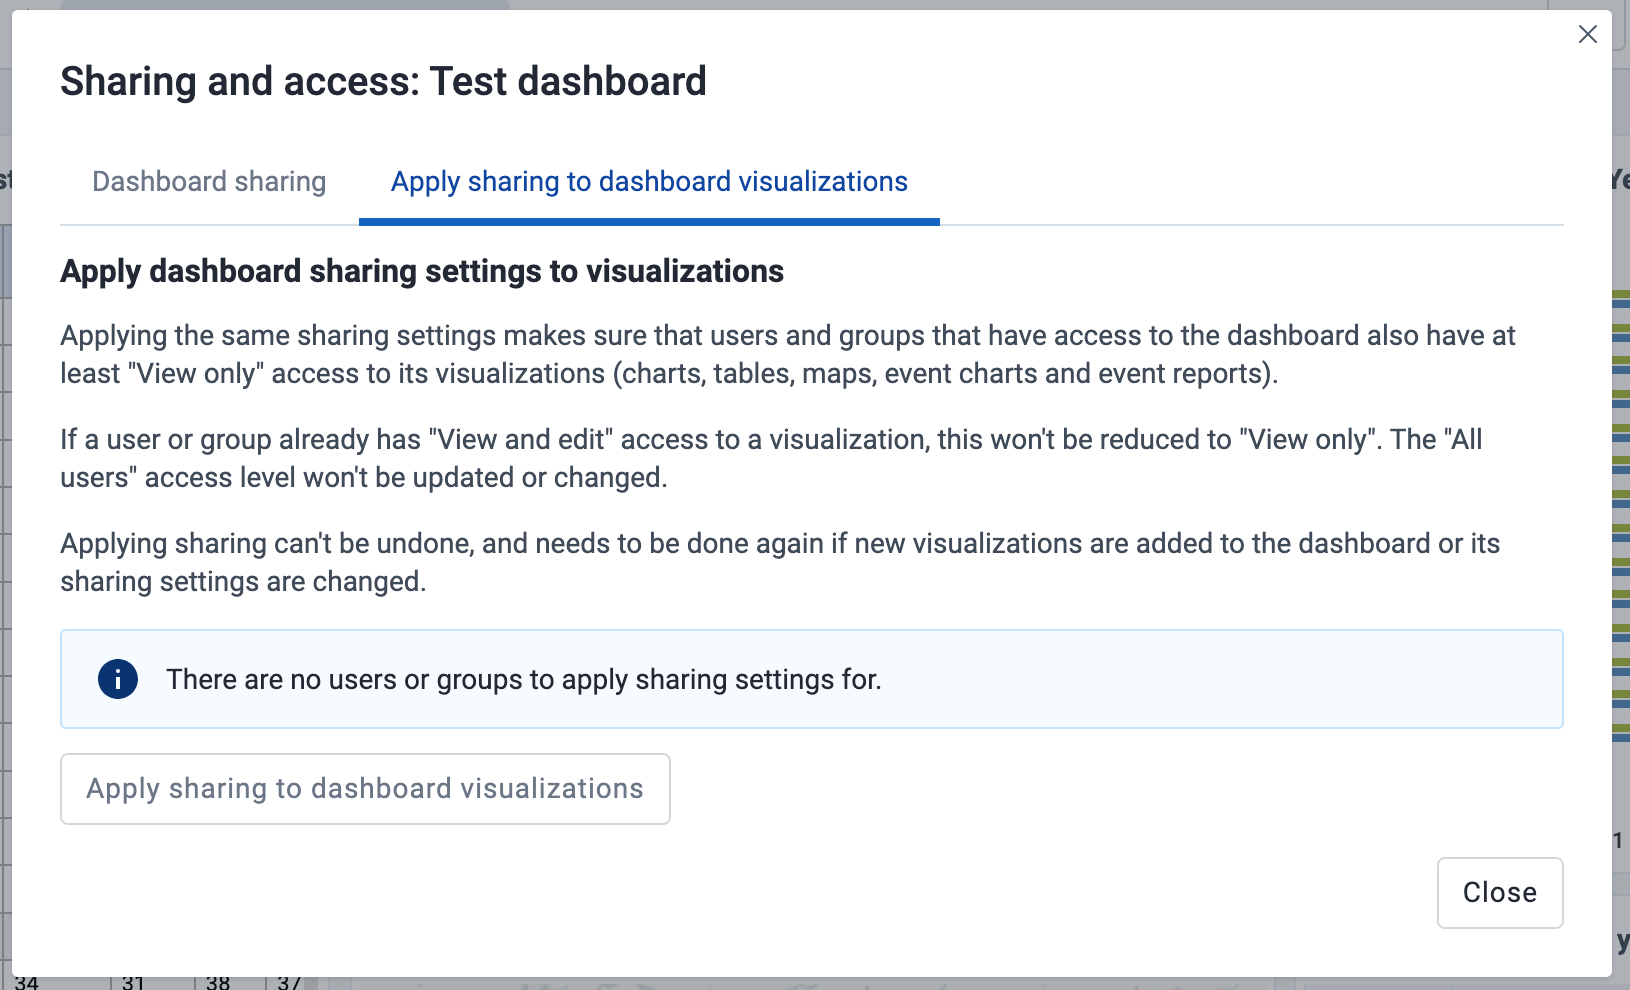
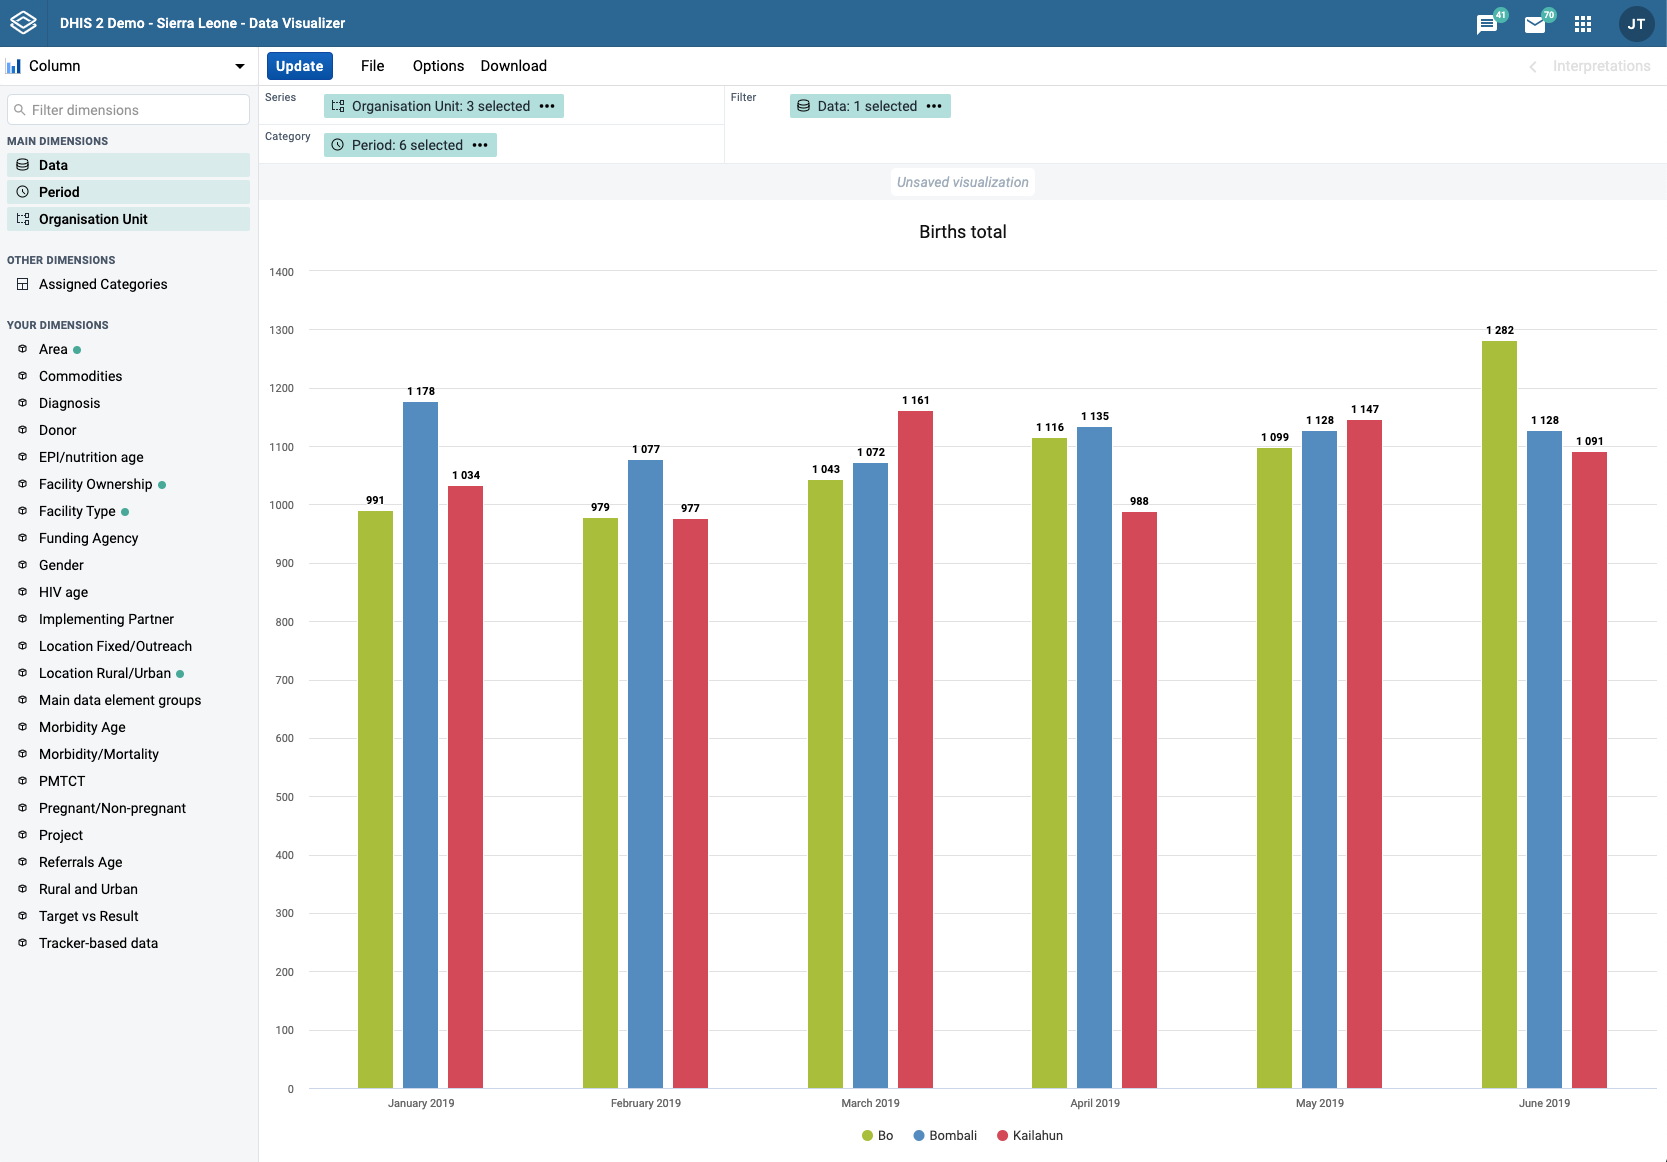
When you open the data-visualizer app from the dhis2 menu, you are presented with a blank slate and you can start creating your visualization right away.
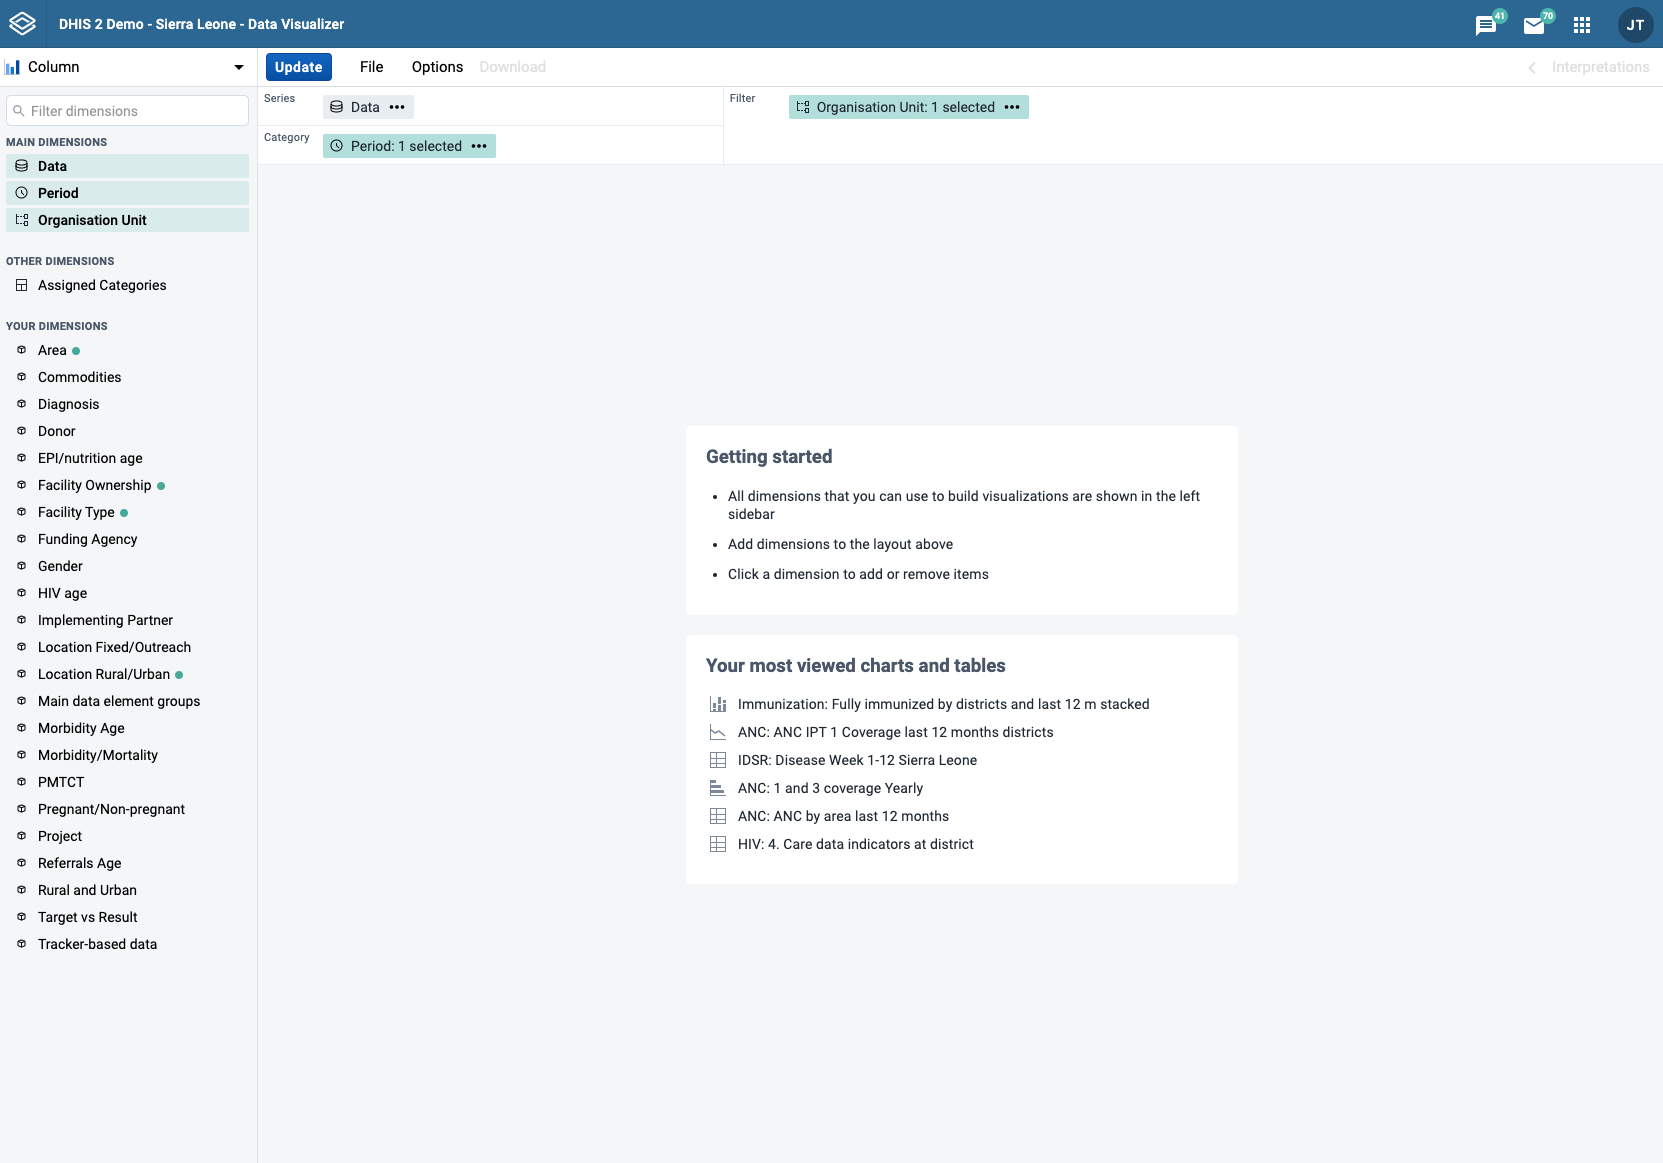
Select the desired visualization type from the selector in the upper left corner. For each visualization type there is a brief description with suggestions about where to use the main dimensions in the layout.
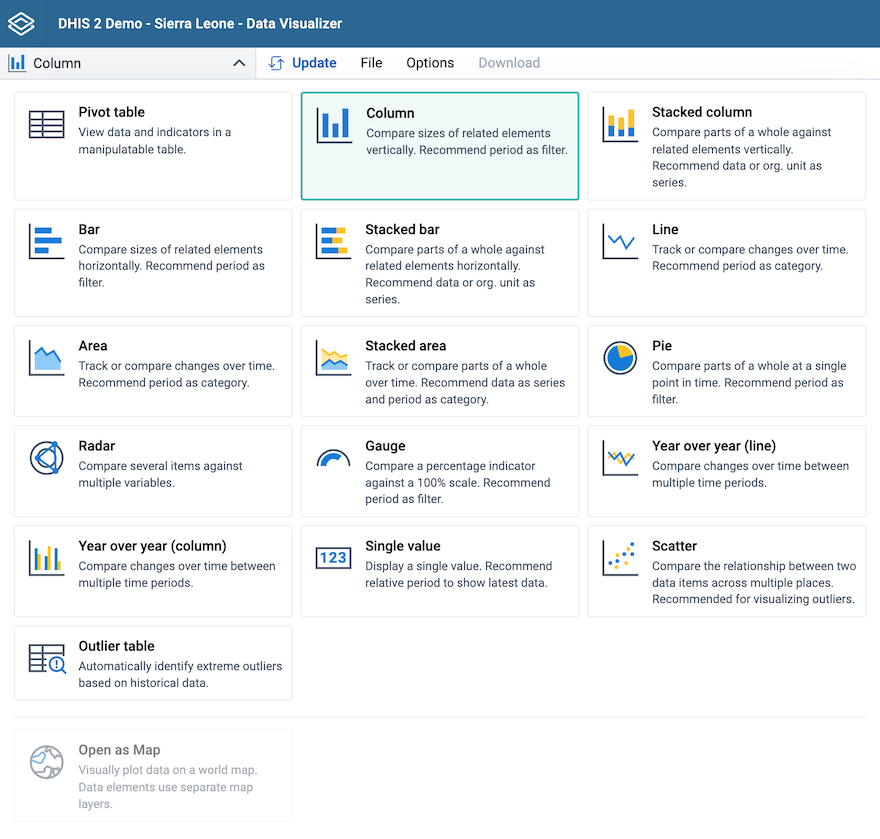
| Visualization type | Description |
|---|---|
| Column | Displays information as vertical rectangular columns with lengths proportional to the values they represent. Example: comparing performance of different districts. Layout restrictions: exactly 1 dimension as series, exactly 1 dimension as category. |
| Stacked column | Displays information as vertical rectangular columns, where bars representing multiple categories are stacked on top of each other. Example: displaying trends or sums of related data elements. Layout restrictions: same as Column. |
| Bar | Same as Column, only with horizontal bars. |
| Stacked bar | Same as Stacked column, only with horizontal bars. |
| Line | Displays information as a series of points connected by straight lines. Also referred to as time series. Example: visualizing trends in indicator data over intervals of time. Layout restrictions: same as Column. |
| Area | Is based on a line (above), with the space between the axis and the line filled with colors and the lines stacked on top of each other. Example: comparing the trends of related indicators. Layout restrictions: same as Column. |
| Stacked area | Same as Area, but the areas of the various dimension items are stacked on top of each other. Example: comparing the trends of related indicators. Layout restrictions: same as Area. |
| Pie | Circle divided into sectors (or slices). Example: visualizing the proportion of data for individual data elements compared to the total sum of all data elements. Layout restrictions: exactly 1 dimension as series, has no category. |
| Radar | Displays data on axes starting from the same point. Also known as spider chart. Layout restrictions: same as Column. |
| Gauge | Semi-circle which displays a single value, typically out of 100% (start and end values are configurable). Layout restrictions: exactly 1 dimension with exactly 1 item as series, data dimension is locked to series. |
| Year over year (line) | Useful when you want to compare one year of data to other years of data. Based on calendar years. Layout restrictions: period dimension is disabled. |
| Year over year (column) | Same as Year over year (line), only with columns. |
| Single value | Displays a single value in a dashboard friendly way. If the dimension displayed has an indicator type assigned, a % symbol or a string (per thousand, per hundred thousand, etc...) is appended to the value. If an icon is assigned to the dimension in the Maintenance app, it can be shown on the side of the value, the icon can be toggled in the Options panel. Layout restrictions: same as Gauge. |
| Pivot table | Summarizes the data of a more extensive table and might include sums, averages, or other statistics, which the pivot table groups together in a meaningful way. Layout restrictions: none. |
| Scatter | Scatter plots enable users to chart organisational units as points against two variables for a single fixed or relative period. Layout restrictions: exactly 1 item each as vertical and horizontal, data dimension is locked to vertical and horizontal, organisation unit is locked to points. |
| Outlier table | Displays a list of outliers based on historical data. Layout restrictions: organisation unit, period and data dimensions are locked to columns, no other dimensions can be added. |
From the dimensions menu on the left you can select the dimensions you want to show in your visualization, including data, period, organisation units and dynamic dimensions. These can be added by clicking on a dimension, by dragging and dropping a dimension to the layout area or by hovering over a dimension and using on its context menu (three dots).
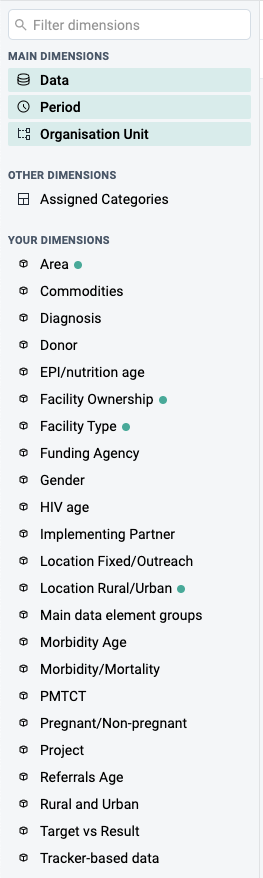
Just like in the dimensions menu, in the layout area you can also change the selections by clicking on a dimension, dragging and dropping a dimension or by using a dimension's context menu (three dots).

A dimension refers to the elements that describe the data values in the system. There are three main dimensions in the system:
Data: Includes data elements, indicators, datasets (reporting rates), event data items, program indicators and calculations, describing the phenomena or event of the data.
NOTE: Clarification of display of reporting rates:
- If a report is expected but not yet submitted, then "0" will be displayed.
- If a report is not expected because the metadata (e.g. category option, OU) date is outside of the start-end date range, then no value is displayed. (e.g. "blank")
Data Visualizer is highly flexible in terms of allowing you to use these dimensions as series, categories and filter.
To select items for a dimension, open the dimension modal window by clicking on a dimension. This window will also be opened automatically when adding a dimension without selected items to the layout. Select which items to add to the visualization by double-clicking an item or by selecting an item with a single click and using the arrows in the middle. The order of appearance will be the same as the order in which they are selected. Selected items can be reordered by dragging and dropping them in the Selected section.
When selecting data items, there are different ways to filter the displayed items. By using the search field at the top, a global search by item name, id or code is performed across the currently selected Data Type. By selecting a Data Type from the dropdown, items can be filtered by type and subtype, where the subtype available depends on the selected data type. The name search and the type/subtype filtering can be combined as well for a more detailed filter. The type of each displayed item is indicated on the right and a corresponding icon is shown on the left of the item.
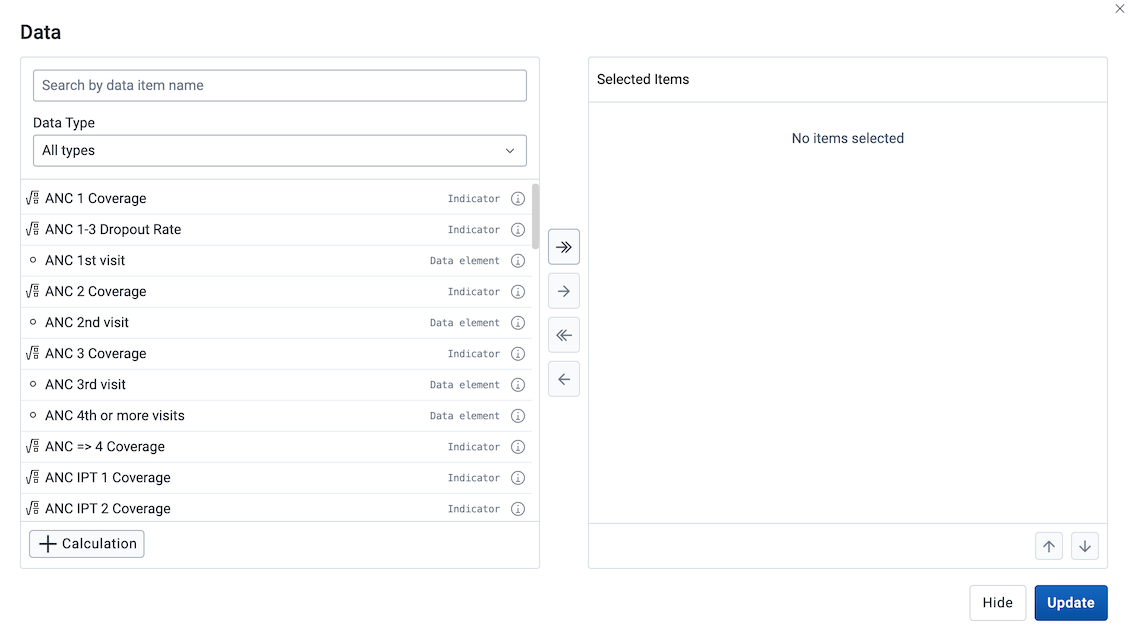
For data items that have an option set assigned it's possible to select specific options from the option set. For such data items, an icon is shown besides the data item name.
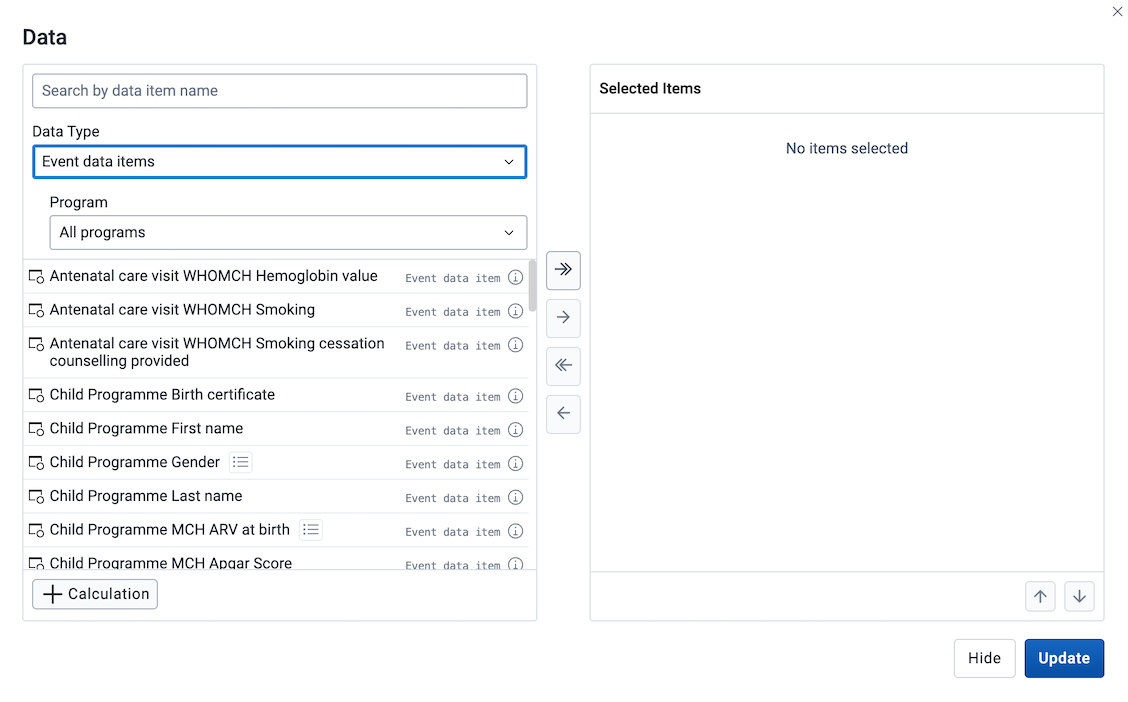
By clicking it the list of data items is replaced with the list of options from the option set. The selection of options is done in the same way as any other data item, by double clicking or using the transfer buttons. To exit the options mode, use the "Back to all items" button.
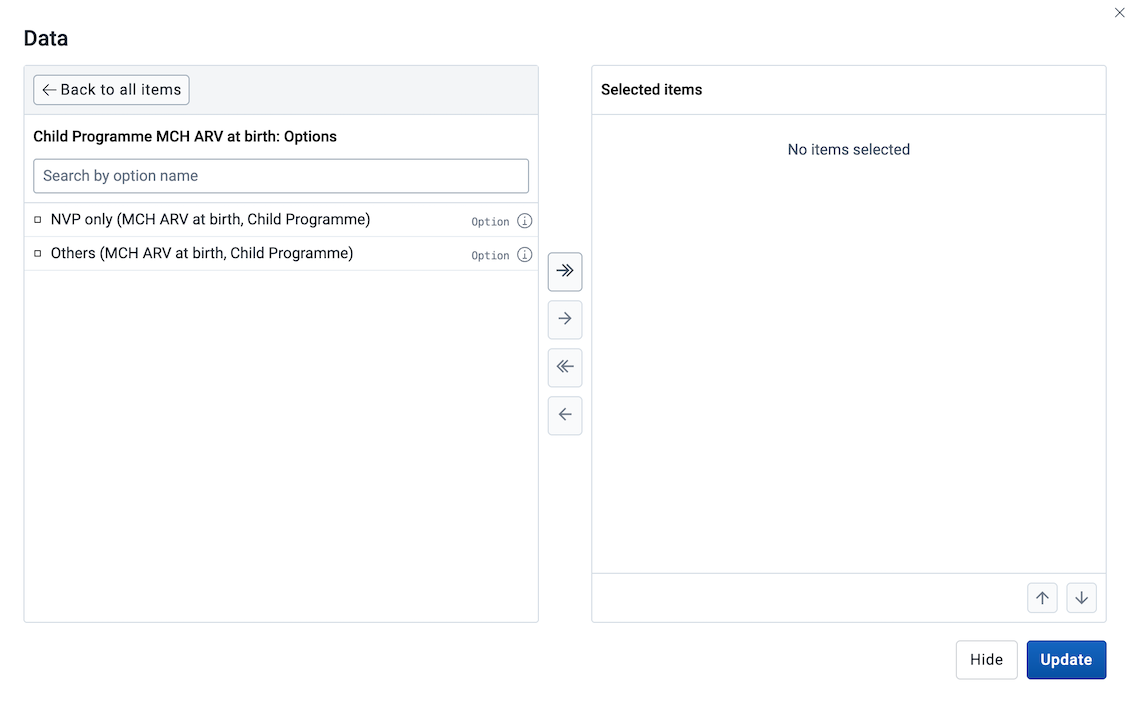
On the right of each data item there is an information icon that can be clicked and a table with relevant information is shown. The information displayed depends on the item's data type.
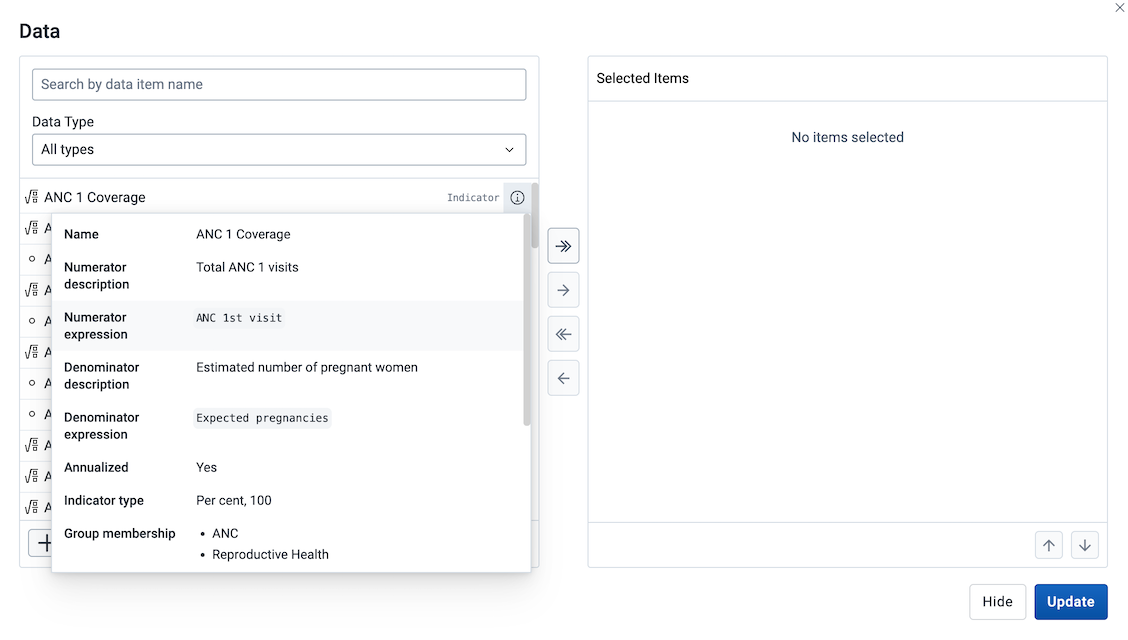
A new personal indicator, also known as a custom calculation, can be created by clicking the + Calculation button at the bottom-left of the Data modal. This will open the Calculation modal.
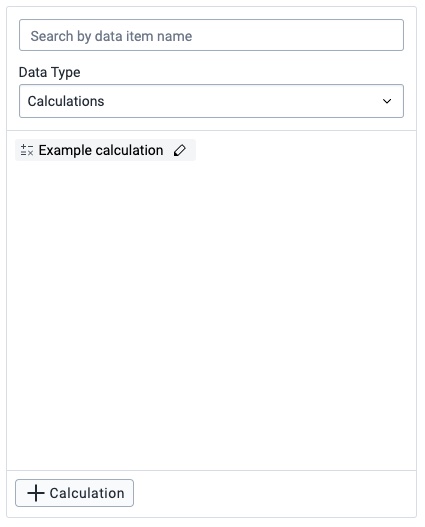
Previously created custom calculations can be found in the list of dimensions in the Data modal, either by scrolling, searching or using the Data Type filter Calculations. To edit a custom calculation, click the edit button (indicated by a pen icon) on the item itself.
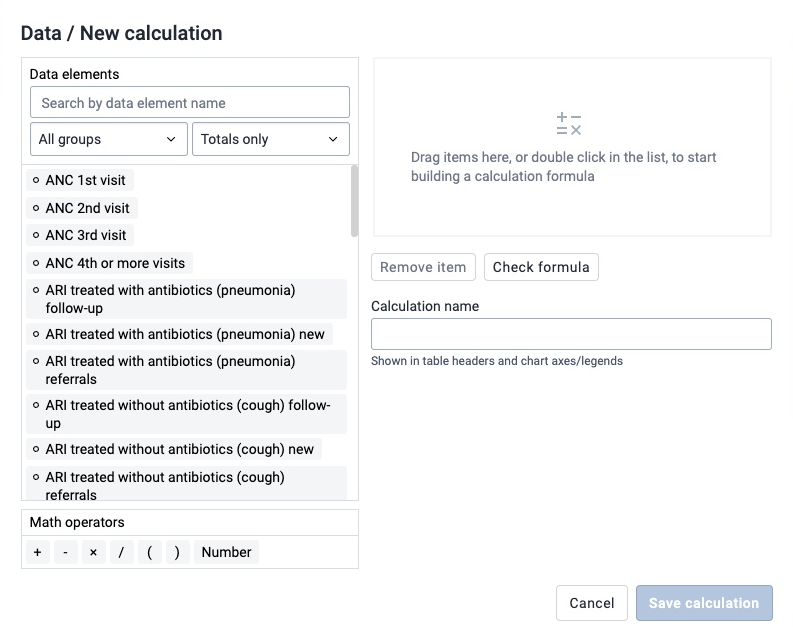
The Calculation modal has similar data element filters as seen in the Data modal, where items can be found by either scrolling, searching or filtering by groups. To add a data element or a math operator to the formula field (seen on the right), either double-click the item or drag it to the formula field.
Items in the formula field can be rearranged by drag-and-drop and removed by either double-click or by selecting an item and clicking the Remove item button.
All calculations require a name before saving.
The formula will be validated on save. Note that only valid formulas can be saved. The formula can also be validated on request by clicking the Check formula button.
When selecting a Period you have the option to choose between fixed periods and relative periods. These can also be combined. Overlapping periods are filtered so that they only appear once. For relative periods the names are relative to the current date, e.g. if the current month is March and Last month is selected, the month of February is shown in the visualization.
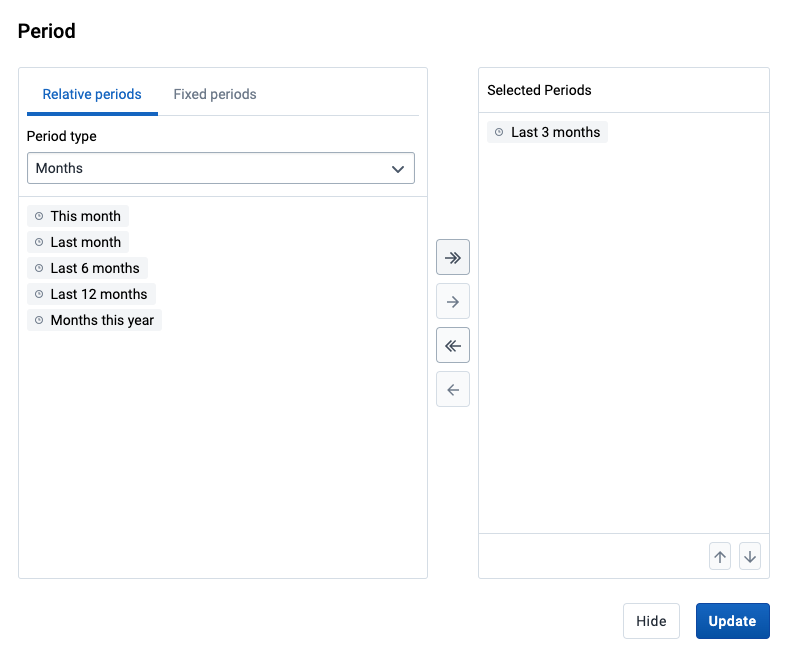
The organisation units dialog is flexible, offering essentially three ways of selecting organisation units:
Explicit selection: Use the tree to explicitly select the organisation units you want to appear in the visualization. If you right-click on an organisation unit you can easily choose to select all org units below it.
Levels and groups: The Level and Group dropdowns are a convenient way to select all units in one or more org unit groups or at specific levels. Example: select Chiefdom (level 3) to get all org units at that level.
Please note that as soon as at least one level or group has been selected the org unit tree now acts as the boundary for the levels/groups. Example: if you select Chiefdom (level 3) and Kailahun org unit (at level 2) in the tree you get all chiefdom units inside Kailahun district.
The user's organisation units:
User organisation unit: This is a way to dynamically select the org units that the logged in user is associated to.
User sub-units: Selects the sub-units of the user organisation unit.
User sub-x2-units: Selects the units two levels below the user organisation unit.
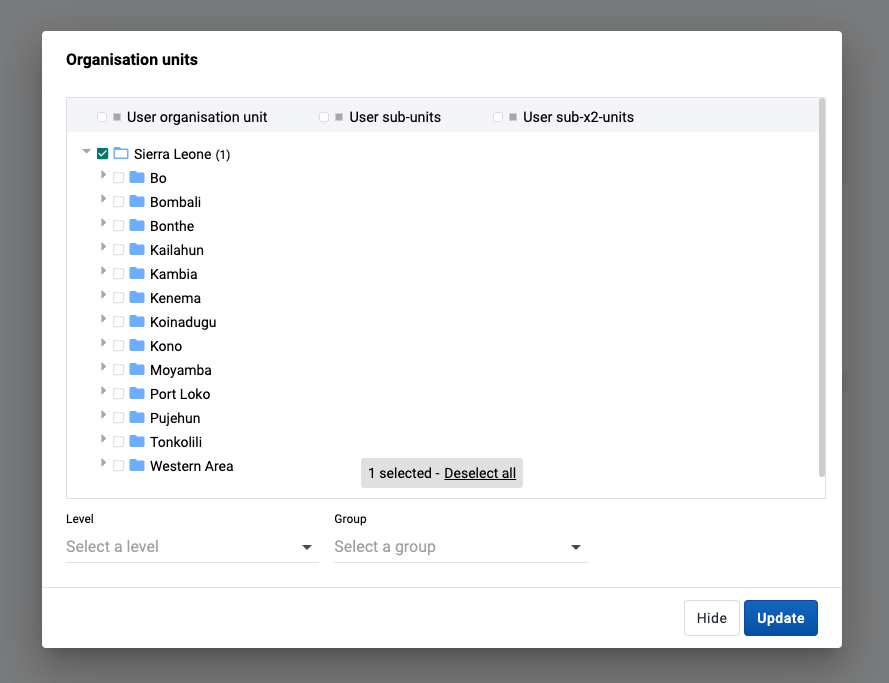
When selecting a dynamic dimension, either individual or all items can be selected. By default, the Manually select items option is selected, which allows for individual items to be picked out of a list, similar to how the Data and Period dimensions are selected above. To automatically select all items for a dimension, the Automatically include all items option can be selected. This will also include any additional items that are added in the future if the available dimension items are updated.
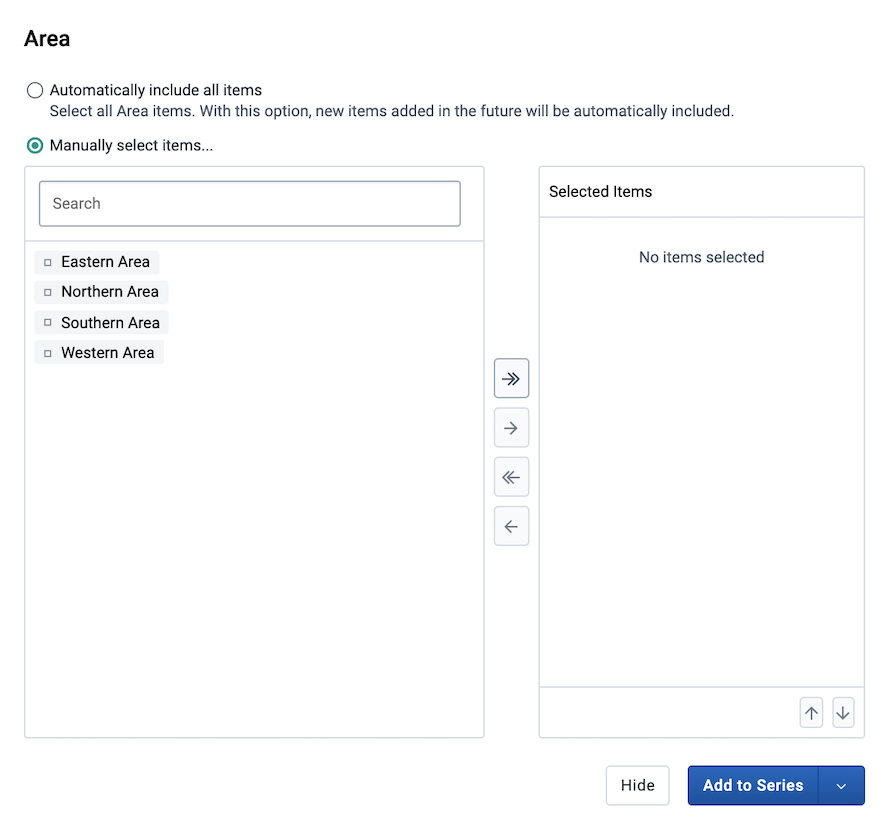
Most chart visualization types can show two categories. When switching from Pivot Table to Column, Bar, Area (and their stacked versions), or Line charts, the first two dimensions remain in Category while any additional dimensions are moved to Filter. The labels for the first dimension in Category are shown at the top of the chart, and the ones for the second dimension at the bottom. The resulting visualization is composed of separate charts, one for each item in the first dimension.
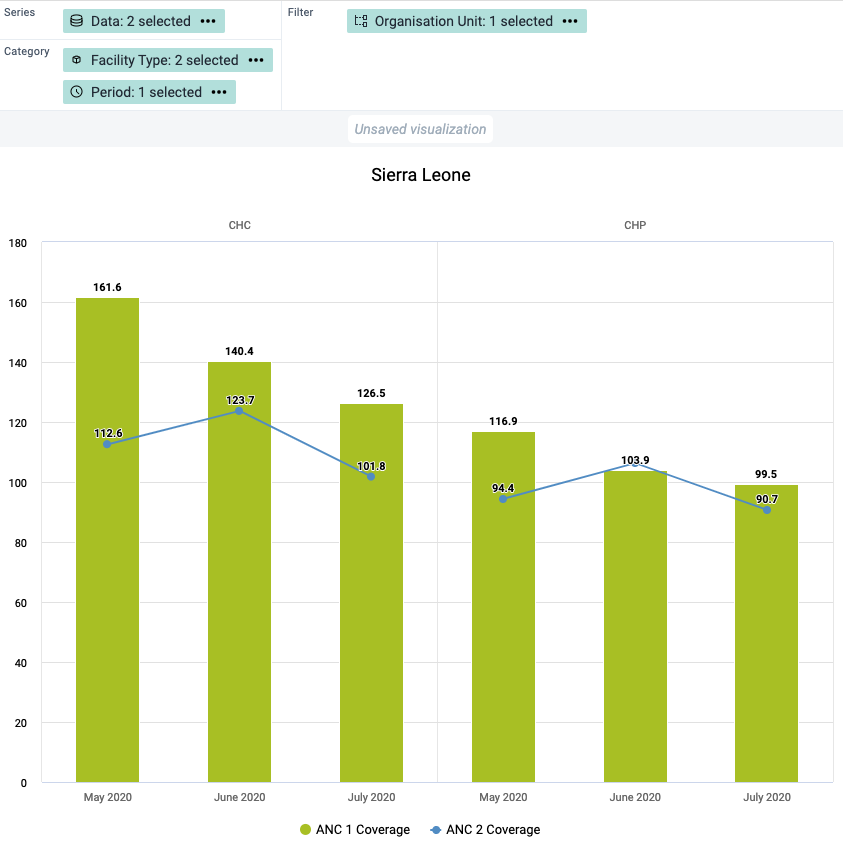
The display of a visualization can be changed by enabling/disabling and configuring several options. Each visualization type can have a different set of available options. The options are organised in tabs in the Options dialog and in sections within each tab.
Click Options to open the Options dialog.
Navigate the tabs in the dialog to see the available options.
Configure the desired options as required.
Click Update to apply the changes to the visualization.
| Option | Description |
|---|---|
| Data tab — Charts | |
| Stacked values add up to 100% | Displays 100 % stacked values in Stacked column and Stacked bar visualizations. |
| Cumulative values | Displays cumulative values in the visualization. Not available for Gauge, Pie, Single value, Scatter and Outlier table. |
| Hide empty categories | Hides the category items with no data from the visualization. Before first: hides missing values only before the first value After last: hides missing values only after the last value Before first and after last: hides missing values only before the first value and after the last value All: hides all missing values This is useful for example when you create Column and Bar visualizations. |
| Custom sort order | Controls the sort order of the values. |
| Skip rounding | Skips the rounding of data values, offering the full precision of data values. Can be useful for finance data where the full dollar amount is required. |
| Trend line | Displays the trend line that visualizes how your data evolves over time. For example if performance is improving or deteriorating. Useful when periods are selected as category. |
| Target line | Displays a horizontal line at the given domain value. Useful for example when you want to compare your performance to the current target. |
| Base line | Displays a horizontal line at the given domain value. Useful for example when you want to visualize how your performance has evolved since the beginning of a process. |
| Aggregation type | Defines how the data elements or indicators will be aggregated within the visualization. Some of the aggregation types are By data element, Count, Min and Max. |
| Only include completed events | Includes only completed events in the aggregation process. This is useful for example to exclude partial events in indicator calculations. |
| Max results (Outlier table only) | Sets the maximum number of rows to display in an Outlier table. The allowed range is 1 to 500. |
| Data tab — Pivot table | |
| Cumulative values | Displays cumulative values in the Pivot table. |
| Dimension labels | Shows the names of dimensions (e.g., Data, Period, Organisation unit) as column and row headers in the Pivot table. |
| Skip rounding | Skips the rounding of data values, offering the full precision of data values. Can be useful for finance data where the full dollar amount is required. |
| Column totals | Displays total values in a Pivot table for each column, as well as a total for all values in the table. |
| Column sub-totals | Displays sub-totals in a Pivot table for each dimension. If you only select one dimension, sub-totals will be hidden for those columns. This is because the values will be equal to the sub-totals. |
| Row totals | Displays total values in a Pivot table for each row, as well as a total for all values in the table. |
| Row sub-totals | Displays sub-totals in a Pivot table for each dimension. If you only select one dimension, sub-totals will be hidden for those rows. This is because the values will be equal to the sub-totals. |
| Hide empty columns | Hides empty columns from a Pivot table. This is useful when you look at large tables where a large portion of the dimension items don't have data in order to keep the table more readable. |
| Hide empty rows | Hides empty rows from a Pivot table. This is useful when you look at large tables where a large portion of the dimension items don't have data in order to keep the table more readable. |
| Aggregation type | Defines how the data elements or indicators will be aggregated within the visualization. Some of the aggregation types are By data element, Count, Min and Max. |
| Number type | Sets the type of value you want to display in a Pivot table: Value, Percentage of row or Percentage of column. The options Percentage of row and Percentage of column mean that you'll display values as percentages of row total or percentage of column total instead of the aggregated value. This is useful when you want to see the contribution of data elements, categories or organisation units to the total value. |
| Only include completed events | Includes only completed events in the aggregation process. This is useful for example to exclude partial events in indicator calculations. |
| Legend tab | |
| Use legend for chart colors | Applies a legend to the visualization items, which is a value-based color for each item. The legends themselves are configured in the Maintenance app. |
| Legend style (Pivot table and Single value only) | Controls where the color from the legend is applied, either to the text or the background. You can use this option for scorecards to identify high and low values at a glance. |
| Legend type | Controls which legend is applied.Use pre-defined legend per data item applies a legend to each data element or indicator individually, based on the legend assigned to each one in the Maintenance app.Select a single legend for entire visualization applies a single legend to all data items, chosen in a drop-down list of available legends. |
| Show legend key | Displays a key for the legend on the right side of the visualization, to indicate the value ranges and their respective color. If the visualization is added to a dashboard, this option can also be toggled from the top right corner of the dashboard item. |
| Axes tab | |
| Axis title | Type a title here to display a label next to the x or y axis. Useful when you want to give context information to the visualization, for example about the unit of measure.Auto generated from axis items provides a title based on the content of the axis.None removes the title. Custom allows you to type a custom title. |
| Axis range | Defines the maximum and minimum value that will be visible on the range axis. |
| Steps | Defines the number of ticks that will be visible on the range axis. |
| Decimals | Defines the number of decimals that will be used for range axis values. |
| Labels | Controls the text styling of the value labels shown on each axis. Font size, color and italic/bold variants can be customized. |
| Series tab | |
| Options for adding more axes and changing how different series are displayed are set in this tab. Please see a detailed description of how this works in the corresponding sections below. | |
| Style tab — Charts | |
| Value labels | Shows the values above the series in the visualization. |
| No space between bars/columns | Removes the space between the columns or bars in the visualization. Useful for displaying the visualization as an EPI curve. |
| Show series key | Shows a key for the series in the visualization, identifying each data series by color and name. The series key appearance can be customized using the text styling tool. |
| Digit group separator (Single value only) | Controls which character to use to separate groups of digits or "thousands". You can set it to Comma, Space or None. |
| Show data item icon (Single value only) | Toggles the icon visibility in the Single Value visualization. |
| Chart title | Controls the title that appears above the visualization.Auto generated uses the default title generated from the visualization's dimensions/filters.None removes the title. Custom allows you to type a custom title. |
| Chart subtitle | Controls the subtitle that appears above the visualization.Auto generated uses the default subtitle generated from the visualization's dimensions/filters.None removes the subtitle. Custom allows you to type a custom subtitle. |
| Color set | Controls the colors used in the chart. A list of available color sets is shown with a preview of the colors. There is also a "Mono patterns" option which uses colored patterns instead of solid colors. |
| Style tab — Pivot table Display density, Font size, Digit group separator and Display organisation unit hierarchy also apply to the Outlier table. | |
| Table title | Controls the title that appears above the visualization.Auto generated uses the default title generated from the visualization's dimensions/filters.None removes the title. Custom allows you to type a custom title. |
| Table subtitle | Controls the subtitle that appears above the visualization.Auto generated uses the default subtitle generated from the visualization's dimensions/filters.None removes the subtitle. Custom allows you to type a custom subtitle. |
| Display density | Controls the size of the cells in a Pivot table. You can set it to Comfortable, Normal or Compact. Compact is useful when you want to fit large tables into the browser screen. |
| Font size | Controls the size of a Pivot table text font. You can set it to Large, Normal or Small. |
| Digit group separator | Controls which character to use to separate groups of digits or "thousands". You can set it to Comma, Space or None. |
| Fix column headers to top of table | Freezes column headers in Pivot Tables so they are always visible when scrolling the table content. |
| Fix row headers to left of table | Freezes row headers in Pivot Tables so they are always visible when scrolling the table content. |
| Display organisation unit hierarchy | Shows the name of all ancestors for organisation units, for example "Sierra Leone / Bombali / Tamabaka / Sanya CHP" for "Sanya CHP". The organisation units are then sorted alphabetically which will order the organisation units according to the hierarchy. When you download a pivot table with organisation units as rows and you've selected Display organisation unit hierarchy, each organisation unit level is rendered as a separate column. This is useful for example when you create Excel pivot tables on a local computer. |
| Limit values tab | |
| Limit minimum/maximum values | Allows for the data to be filtered on the server side. You can instruct the system to return only records where the aggregated data value is equal, greater than, greater or equal, less than or less or equal to certain values. If both parts of the filter are used, it's possible to filter out a range of data records. |
| Parameters tab (Pivot table only) These settings control how the pivot table behaves when embedded as a standard report in the Reports app. They have no effect within Data Visualizer itself. | |
| Reporting period | Controls whether the user is prompted to enter a report period when creating a standard report in the Reports app. |
| Organisation unit | Controls whether the user is prompted to enter an organisation unit when creating a standard report in the Reports app. |
| Parent organisation unit | Controls whether the user is prompted to enter a parent organisation unit when creating a standard report in the Reports app. |
| Include regression | Includes a column with regression values in the Pivot table. |
| Include cumulative | Includes a column with cumulative values in the Pivot table. |
| Custom sort order | Controls the sort order of the values. |
| Top limit | Controls the maximum number of rows to include in a Pivot table. |
| Outliers tab (Scatter chart and Outlier table only) | |
| Outlier analysis (Scatter) | Enables outlier detection in a Scatter chart, highlighting data points that are markedly different from the rest of the data. When enabled, the outlier detection method and extreme lines options become available. |
| Outlier detection method (Scatter and Outlier table) | Outlier analysis is a process that involves identifying anomalous observations in a dataset. In Data Visualizer outliers are detected by first normalizing the data into a linear regression line and then analysing each point's distance from regression line. For Scatter charts, three methods are supported: Interquartile Range (IQR) is based on dividing a dataset into quartiles; Modified z-score is based on the Median Absolute Deviation (MAD). IQR and MAD are considered the two most common robust measures of scale. Standard z-score is based on standard deviation and is therefore considered less robust as it is greatly influenced by outliers. For Outlier table, Modified z-score and Standard z-score are supported. |
| Threshold factor (Scatter and Outlier table) | The number that the outlier thresholds are multiplied by. Controls the sensitivity of the threshold range. Default factors are 1.5 for IQR and 3 for z-scores. |
| Extreme lines (Scatter) | Marks data points at the extreme ends of the distribution as lines on the Scatter chart. Calculated as a percentage of the total values along an axis. Only available when Outlier analysis is enabled. |
| Extreme line % detection (Scatter) | The percentage threshold used to calculate which values are shown as extreme lines. Default is 1%. |
The following options can be customized using the text styling tool: Chart title, Chart subtitle, Show series key, Target line, Base line, Axis title and Labels for both horizontal and vertical axes. The text styling tool allows to choose a font size, color and italic/bold variants. It's also possible to choose the position of the text.

Assigned Categories is a composite dimension that represents associated category option combinations to the selected data element's category combination. This can be added by dragging the Assigned Categories dimension from the left side dimensions menu and into the visualization layout:
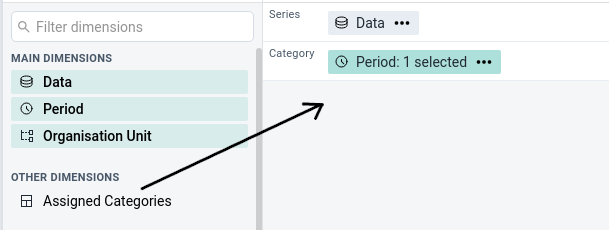
Another way of adding assigned categories is by accessing the Add Assigned Categories option from the Data dimension's context menu (not available for Gauge, Year over year or Single value).
When combining data with different measurement scales you will get a more meaningful visualization by having more than a single axis. For Column, Bar, Area and Line you can do so by clicking the Series tab in the Options dialog. If the option is disabled, make sure that the Data dimension is on the Series axis and that at least two items have been added.
Four axes are available, two on the left side (axis 1 and 3) of the chart and two on the right side (axis 2 and 4). Each axis has a different color and the chart items are going to be colored accordingly.
Note
When multiple axes are in use, the
Color setoption in theStyletab will be disabled. TheTarget lineandBase lineoptions are available on theAxestab per axis.
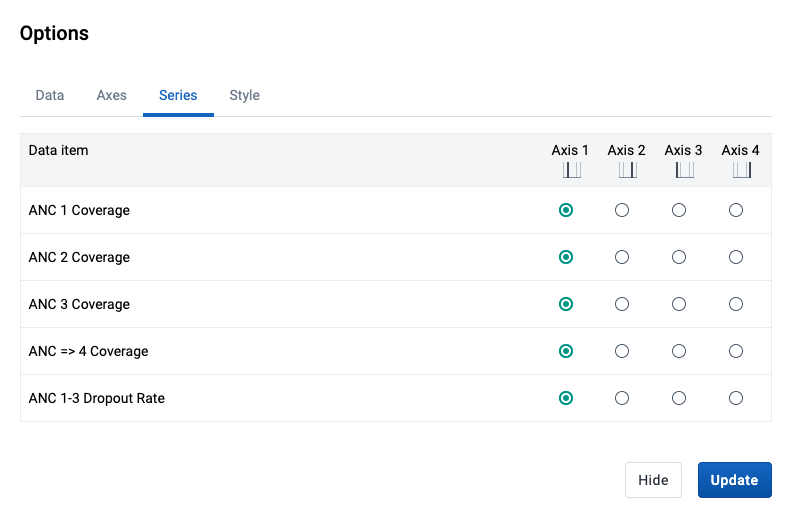
It's possible to combine a Column chart with Line items and vice versa. This is done by clicking the Series tab in the Options dialog and changing the Visualization type. This can also be combined with using multiple axes (as described in the section above).
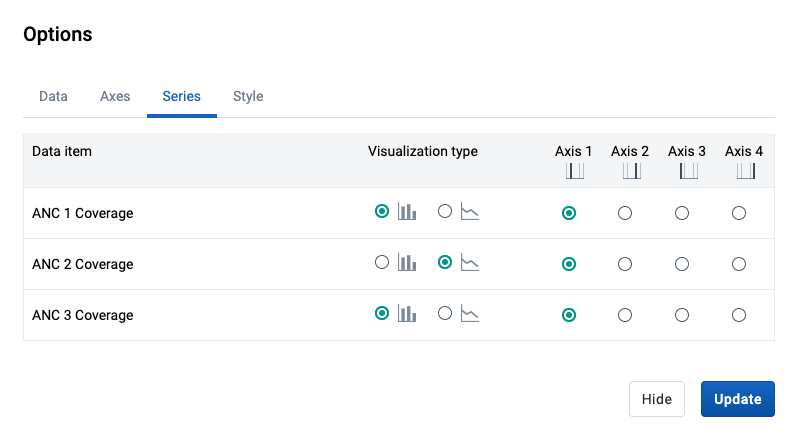
This results in a chart that combines the Column and Line types.

This feature is enabled for the Pivot Table, Column, Stacked column, Bar and Bar stacked visualization types and allows to drill in the data by clicking on a value cell / column / bar in the visualization. A contextual menu opens with various options.
You can drill the data by organisation unit, meaning navigating up and down the org unit tree. The data drill affects the current dimension selection in the layout area. The organisation unit dimension must thus be present on either the Columns / Series axis or the Rows / Category axis for the drill feature to be enabled.
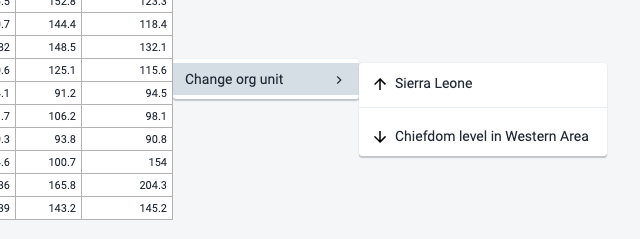
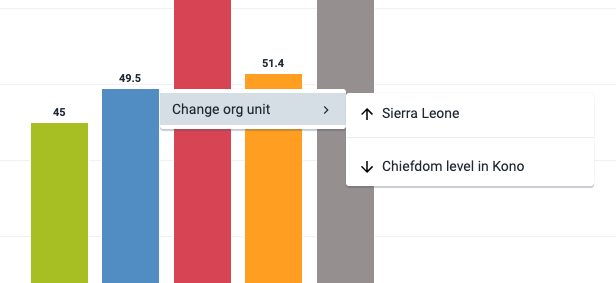
Saving your visualizations makes it easy to find them later. You can also choose to share them with other users or display them on a dashboard.
Click File > Open.
Enter the name of a visualization in the search field, or click the < and > arrows to navigate between different pages. The result can also be filtered by type and owner by using the corresponding menus in the top right corner.
Click the name of the one you want to open.
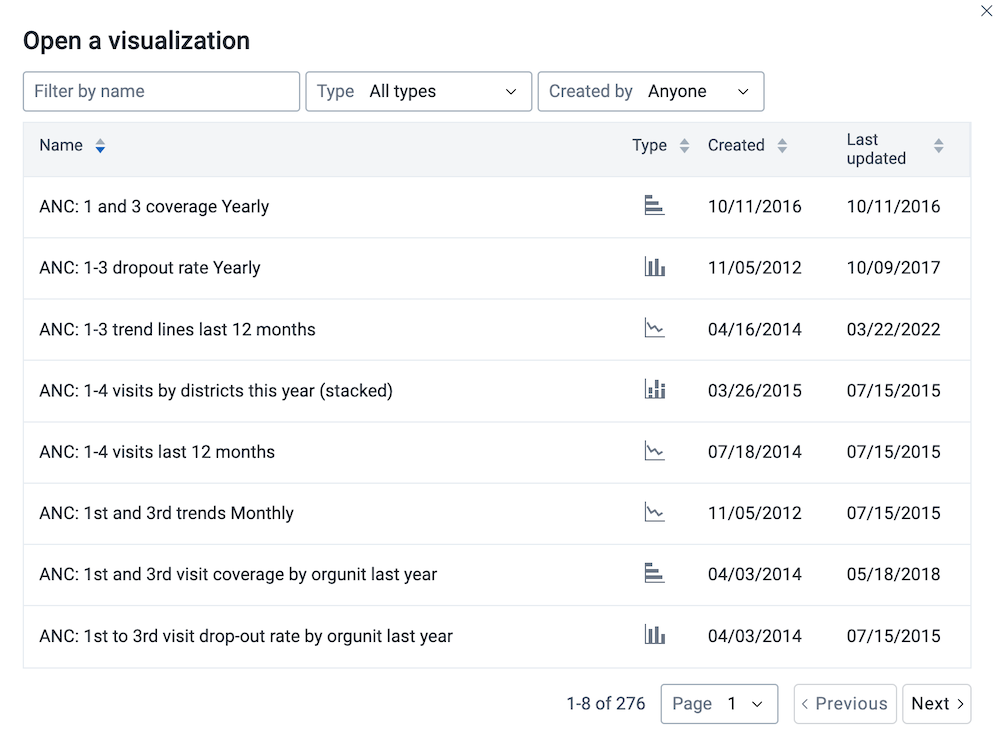
a) Click File > Save.
Enter a Name and a Description for your visualization.
Click Save.
Click File > Rename.
Enter the new name and/or description.
Click Rename.
Click File > Delete.
Click Delete.
Click File > Get Link.
The URL can be copied via the browser's context menu that opens when right clicking on the link.
When viewing a saved visualization, you can expand the interpretations on the right side by clicking on the Interpretations button in the upper right corner. The visualization description will also be shown. The description supports rich text format.
New interpretations can be added by typing in the text field in the bottom right corner. Other users can be mentioned with @username. Start by typing @ plus the first letters of the username or real name and a list of matching users will be displayed. Mentioned users will receive an internal DHIS2 message with the interpretation or comment. Interpretations can also be seen in the Dashboard app.
It is possible to format the text with bold, italic by using the Markdown style markers * and _ for bold and italic respectively (keyboard shortcuts are also available: Ctrl/Cmd + B and Ctrl/Cmd + I). A limited set of emojis is supported and can be used by typing one of the following character combinations: :) :-) :( :-( :+1 :-1. URLs are automatically detected and converted into a clickable link.
To view the visualization according to the date of a particular interpretation, click on the interpretation or its View button. This will regenerate the visualization with the relevant date, which is indicated next to the visualization title. Clicking on Back to all interpretations will regenerate the visualization with the current date.
To subscribe to the saved visualization, click the bell icon in the upper right corner. You will then receive internal messages whenever another user likes/creates/updates an interpretation in this saved visualization.
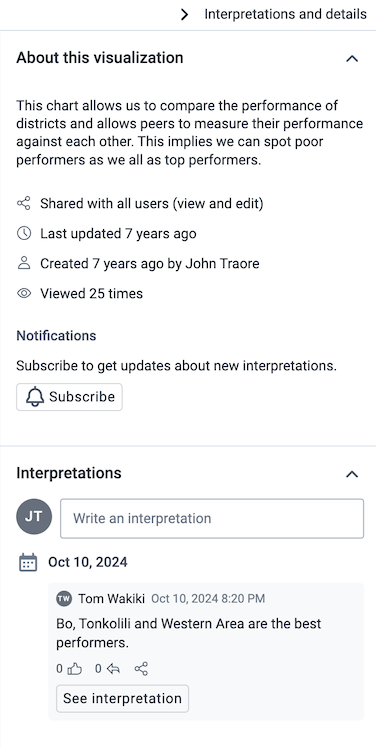
Sharing settings can be accessed by clicking File > Share. Change sharing settings for the user groups you want to modify, the available settings are:
Can edit and view: Can view and edit the visualization.
Can view only: Can only view the visualization.
No access: Won't have access to the visualization. This setting is only applicable to Public access and External access. (Note that to enable access to everyone, both Public access and External access must be set to allow view.)
New users can be added by searching for them by name under Add users and user groups.
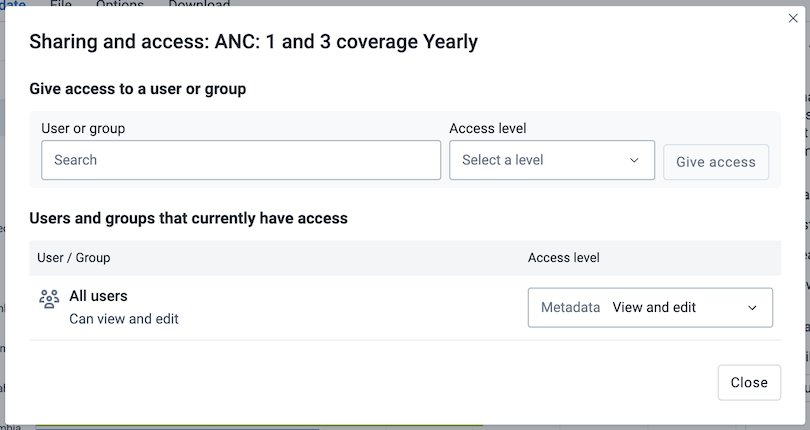
Visualizations can be downloaded using the Download menu. All visualization types support Graphics and Plain data source downloads, except for the Pivot table type, which can be downloaded as Table layout and Plain data source.
Graphics downloadDownloads an image (.png) or a PDF (.pdf) file to your computer.
Table layout downloadDownloads a Excel (.xls), CSV (.csv) or HTML (.html) file to your computer.
Plain data source downloadYou can download the data source of a visualization in JSON, XML, Excel, CSV, JXRML or Raw data SQL formats with different identification schemes (ID, Code, and Name). The data document uses identifiers of the dimension items and opens in a new browser window to display the URL of the request to the Web API in the address bar. This is useful for developers of apps and other client modules based on the DHIS2 Web API or for those who require a plan data source, for instance for import into statistical packages.
Available formats
| Format | Action | Description |
|---|---|---|
| JSON | Click JSON | Downloads JSON format based on the ID, Code or Name property. |
| XML | Click XML | Downloads XML format based on the ID, Code or Name property. |
| Microsoft Excel | Click Microsoft Excel | Downloads Microsoft Excel format based on the ID, Code or Name property. |
| CSV | Click CSV | Downloads CSV format based on the ID, Code or Name property. |
| XML data value set | Click Advanced > XML | Downloads the raw data values as XML, as opposed to data which has been aggregated along various dimensions. |
| JSON data value set | Click Advanced > JSON | Downloads the raw data values as JSON, as opposed to data which has been aggregated along various dimensions. |
| JRXML | Click Advanced > JRXML | Produces a template of a Jasper Report which can be further customized based on your exact needs and used as the basis for a standard report in DHIS 2. |
| Raw data SQL | Click Advanced > Raw data SQL | Provides the actual SQL statement used to generate the data visualization. You can use it as a data source in a Jasper report, or as the basis for a SQL view. |
To see how a visualization would look on map, select the Open as Map Visualization type after you're finished building your visualization.
The Line Listing app is a new app that replaces the line listing functionality in the Event Reports app, but also offers additional functionality.
NOTE
There will be a forward compatibility with the Event Reports app, which means that you can open the existing event reports of type line list in the Line Listing app, but you cannot save changes to them in the Line Listing app.
When you open the Line Listing app from the DHIS2 menu, you are presented with a blank slate, and you can start creating a line list.
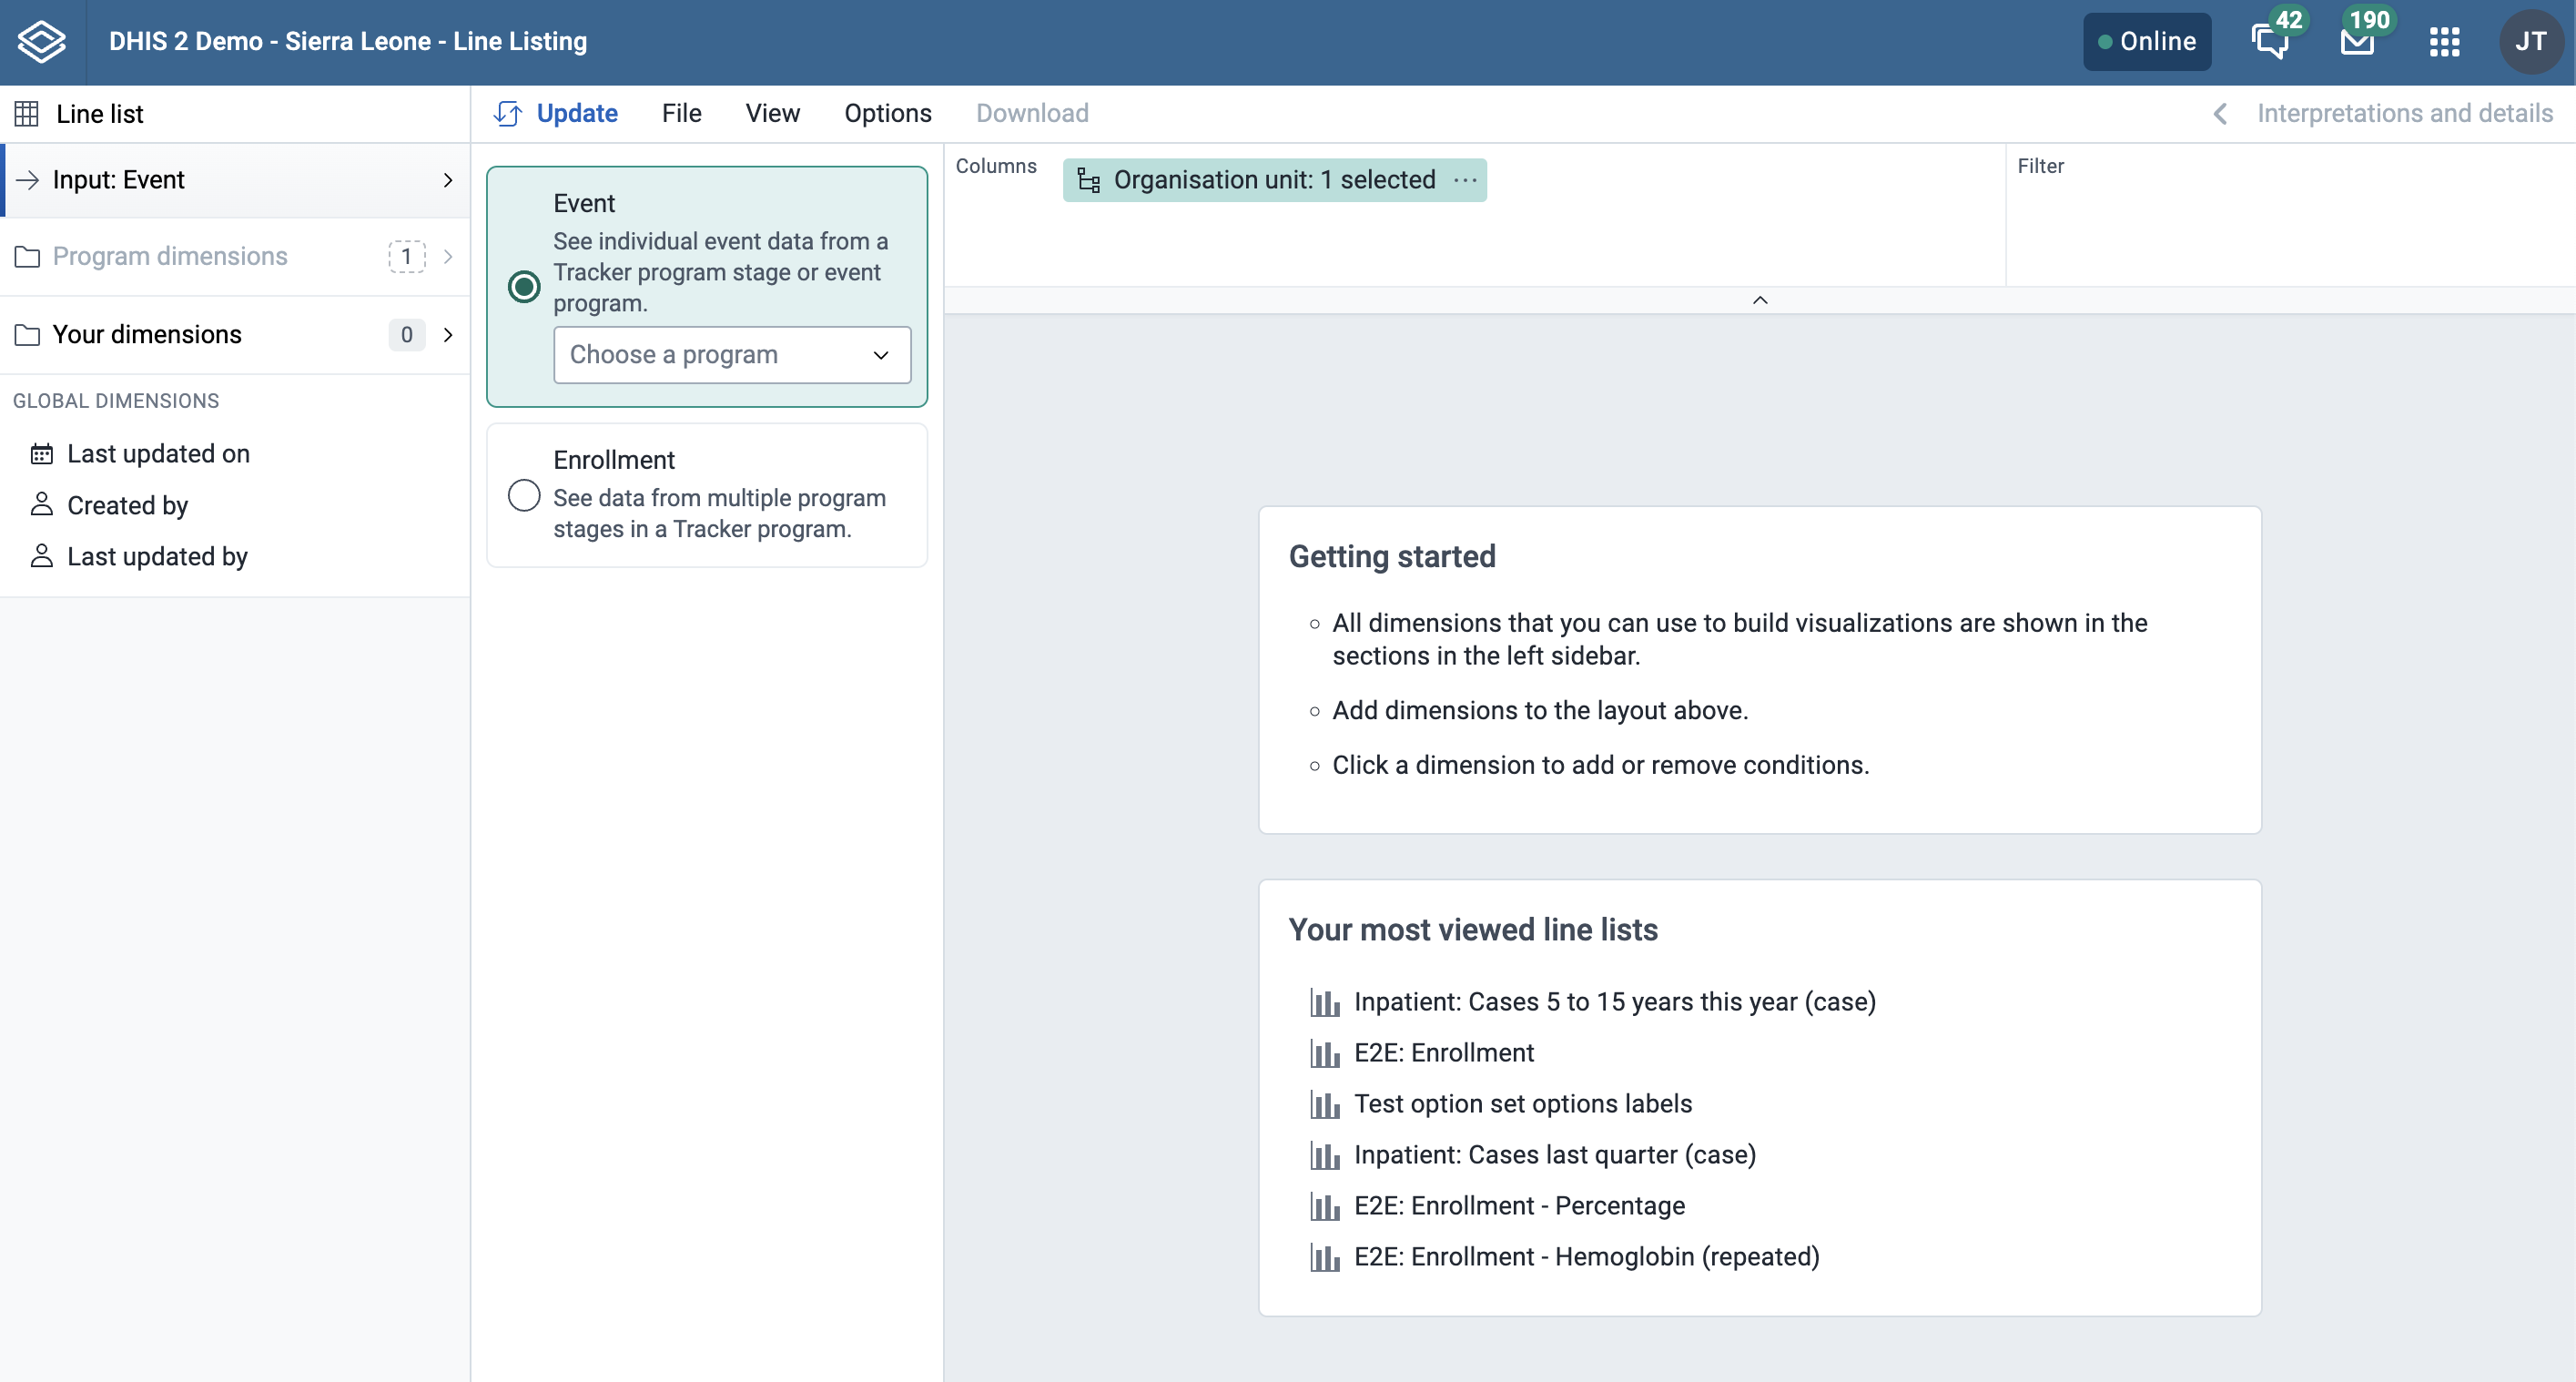
In the Line Listing app, you currently only have one type of selection which is Line list.
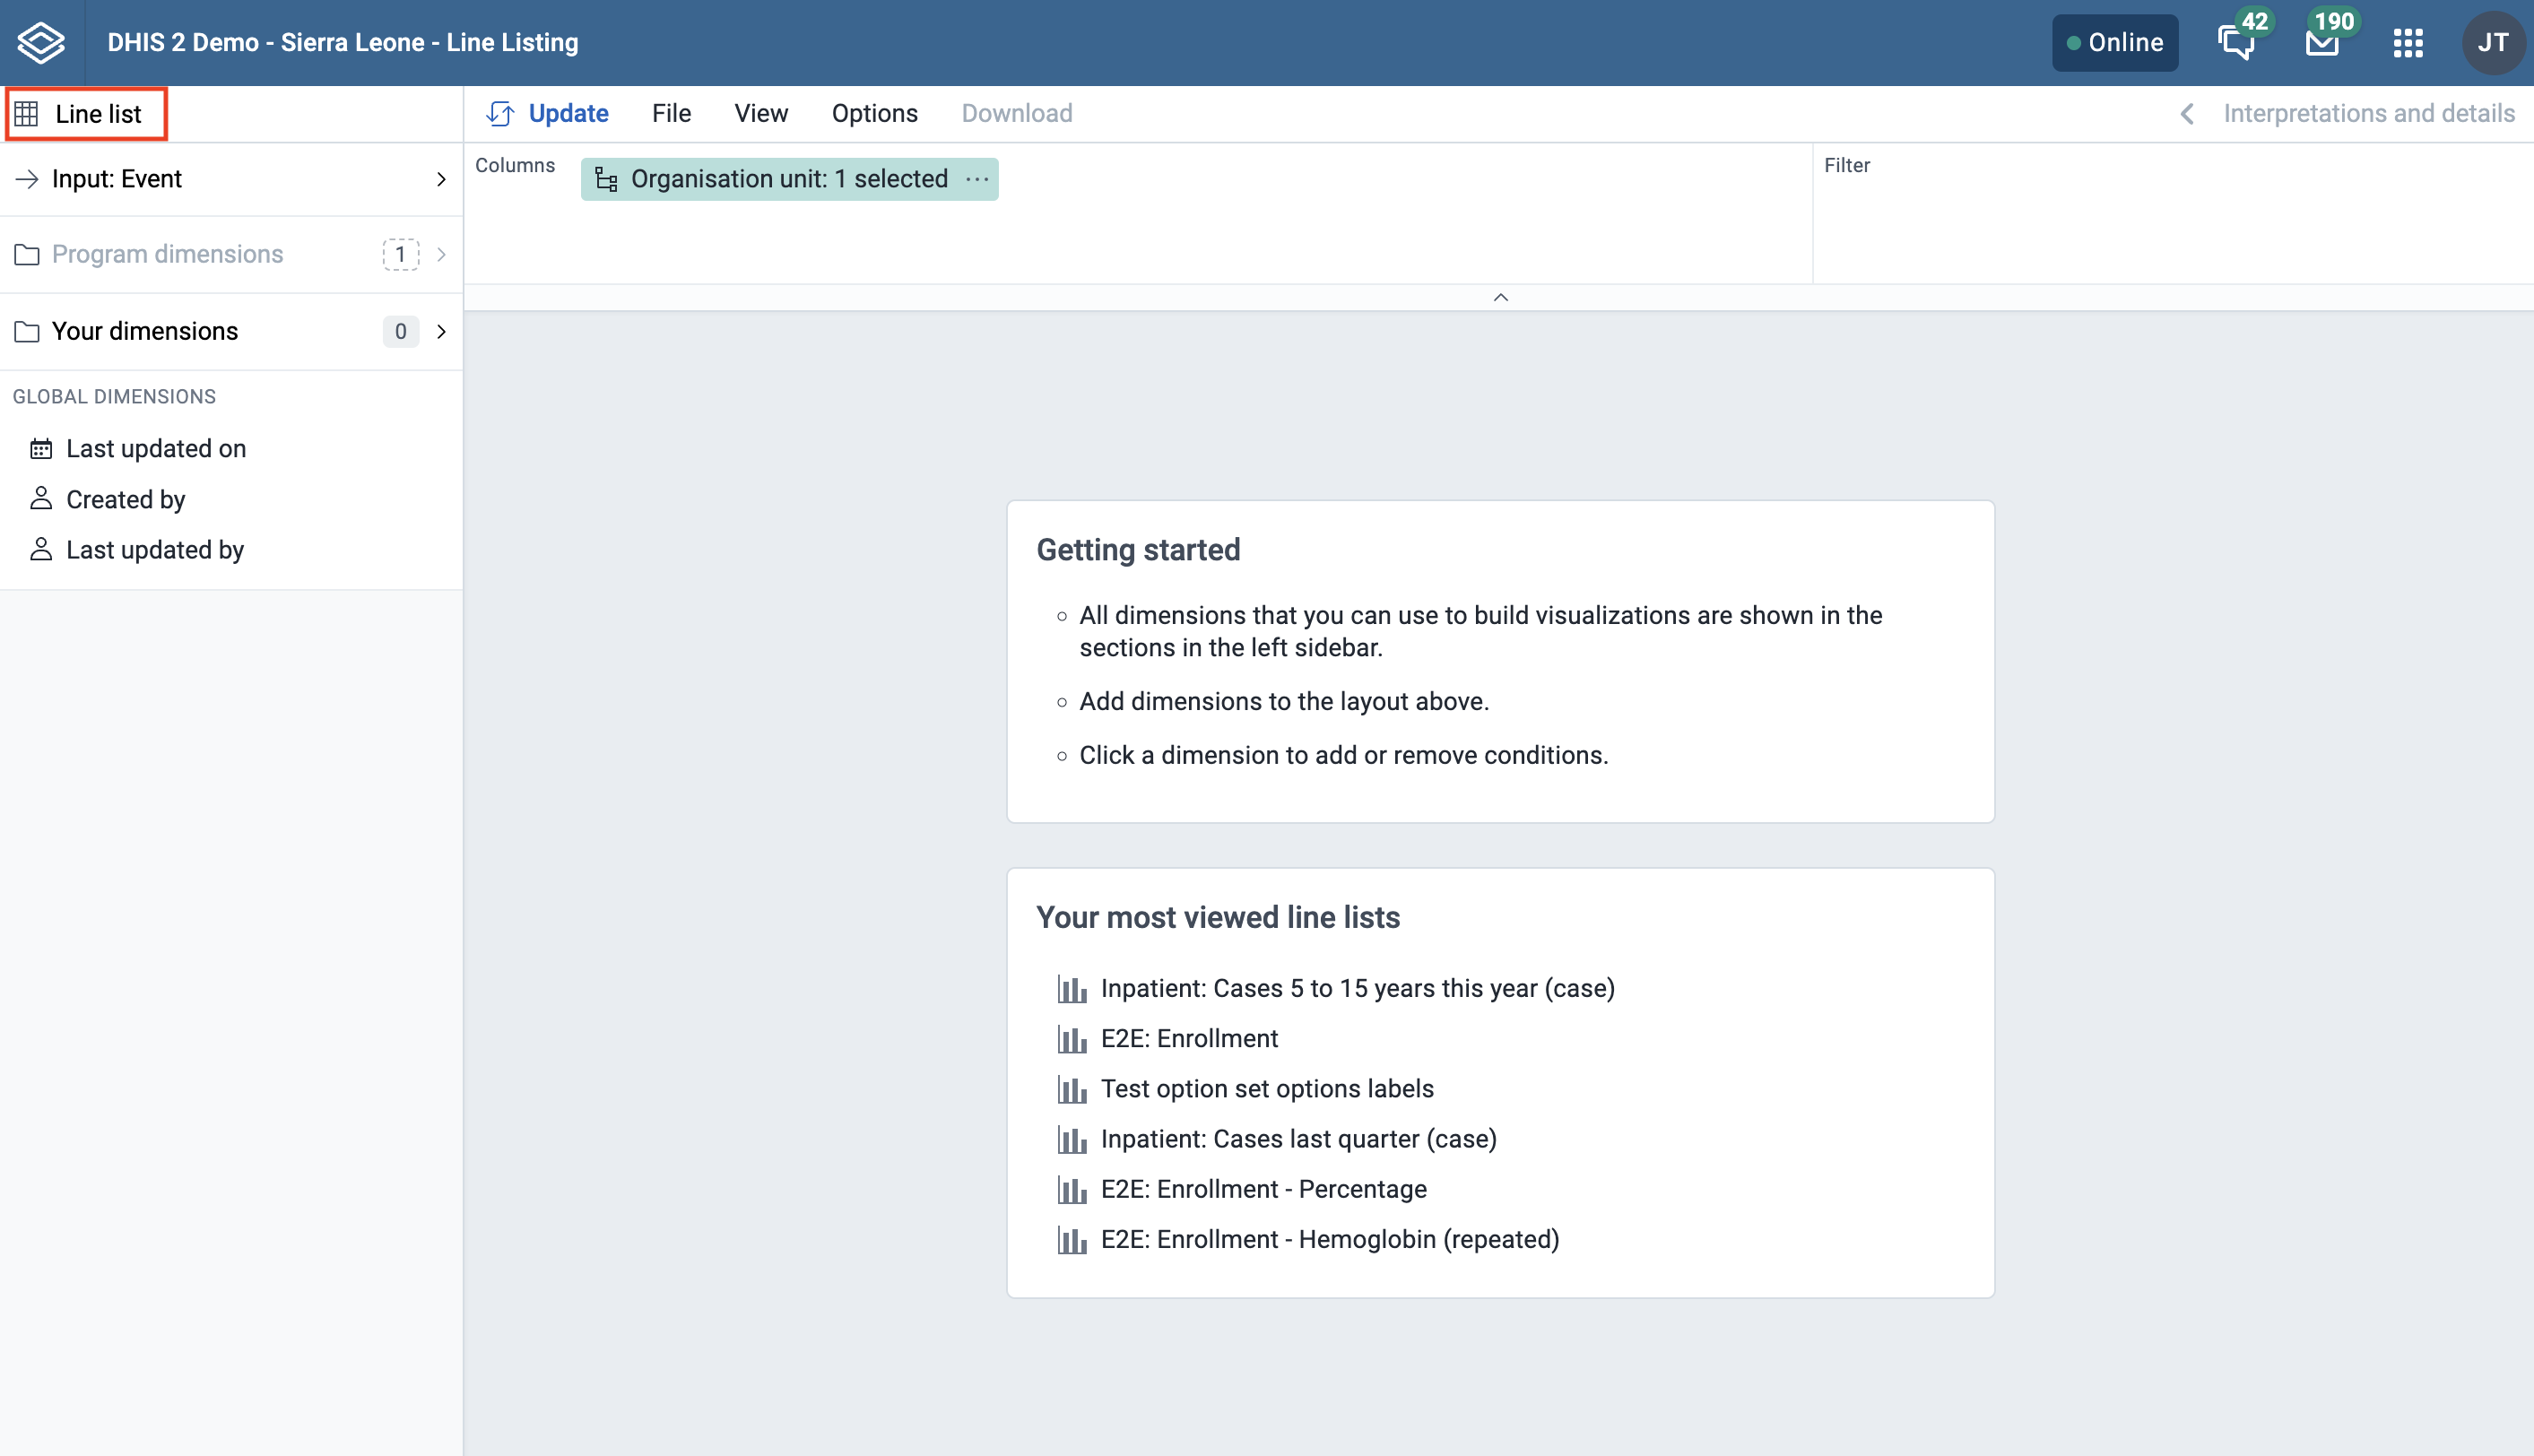
(This is the same as you see in the Event Reports app). When you open the Input tab you will see below two options:
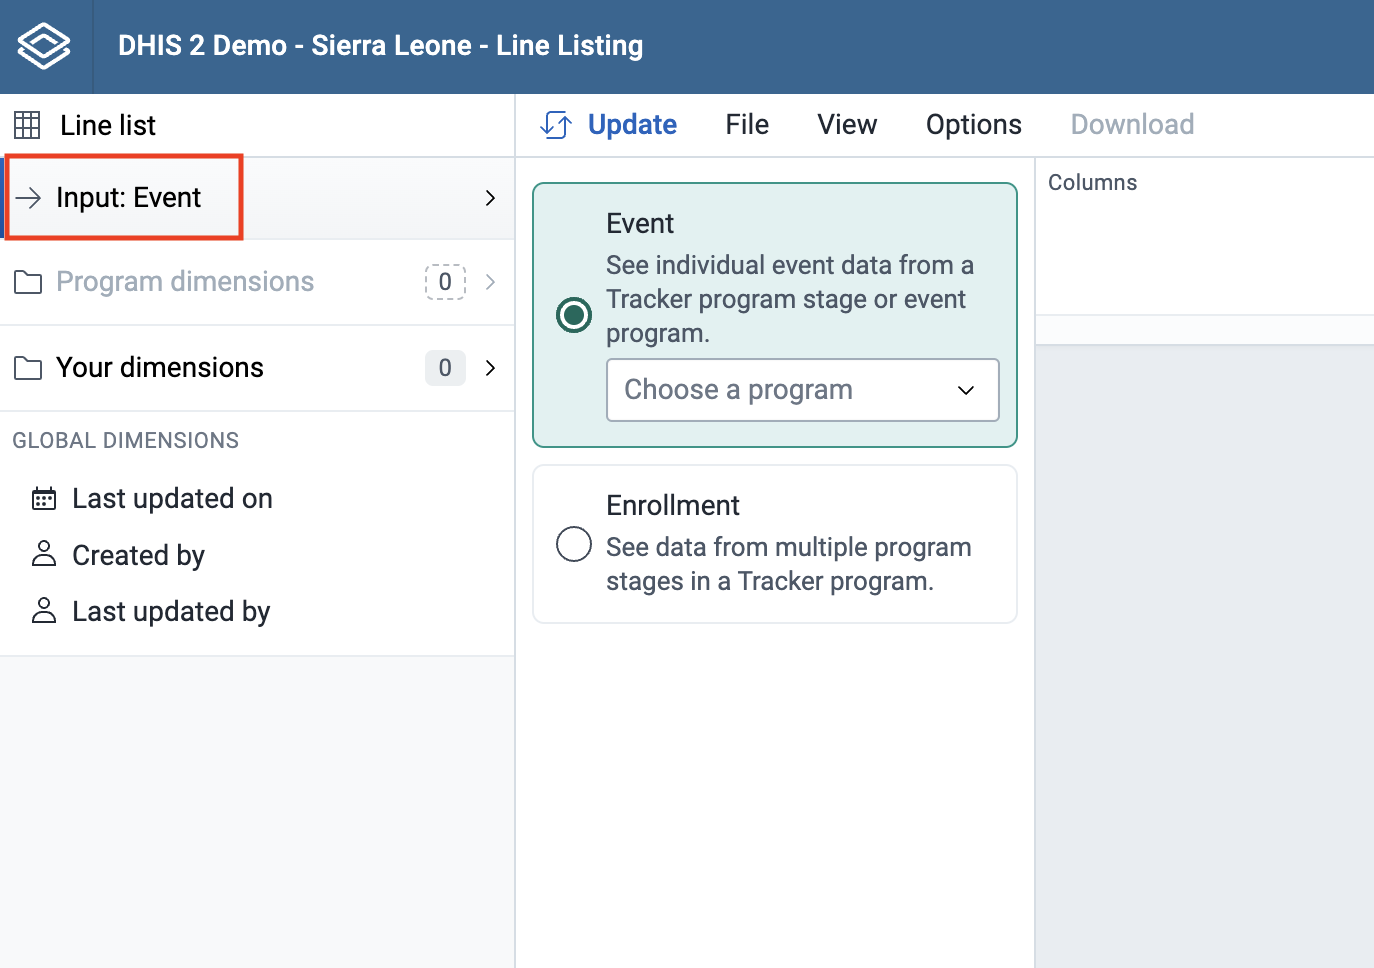
(In the Event Reports app these are called data dimensions.)
The line list will always be based on event or tracker programs and you can do analysis on a range of dimensions. For programs with category combinations, you can use program categories and category option group sets as dimensions.
Tip
In the Line Listing app, all the dimensions related to a tracker or an event program are present in the program dimension component.
Choose a program
Select program: All the event and tracker programs will be visible in the drop down.
If you have selected the Event, then for tracker programs you need to select the program stage to get all the data elements, attributes for that particular stage. To be able to select data from multiple stages you need to select "Enrollment" as the input type.
If you select an event program you don’t have to select the stage (unlike the Event Reports app).
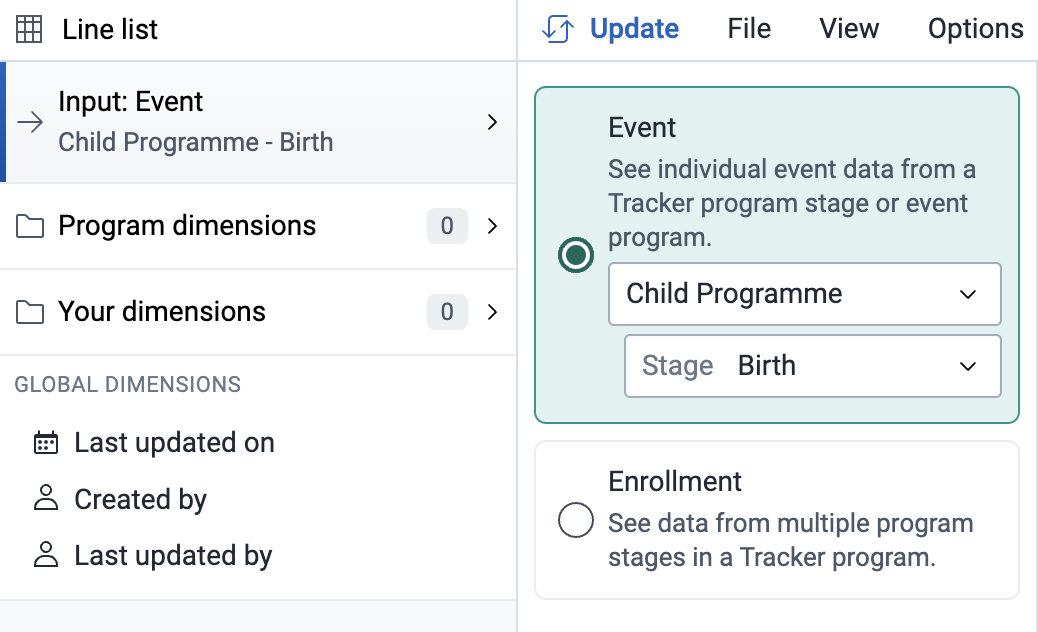
If you select Enrollment in the Input tab then all data elements associated with the program will be available from different stages within the program for the purpose of cross stage selection of data elements. Each data element will act as a dimension.
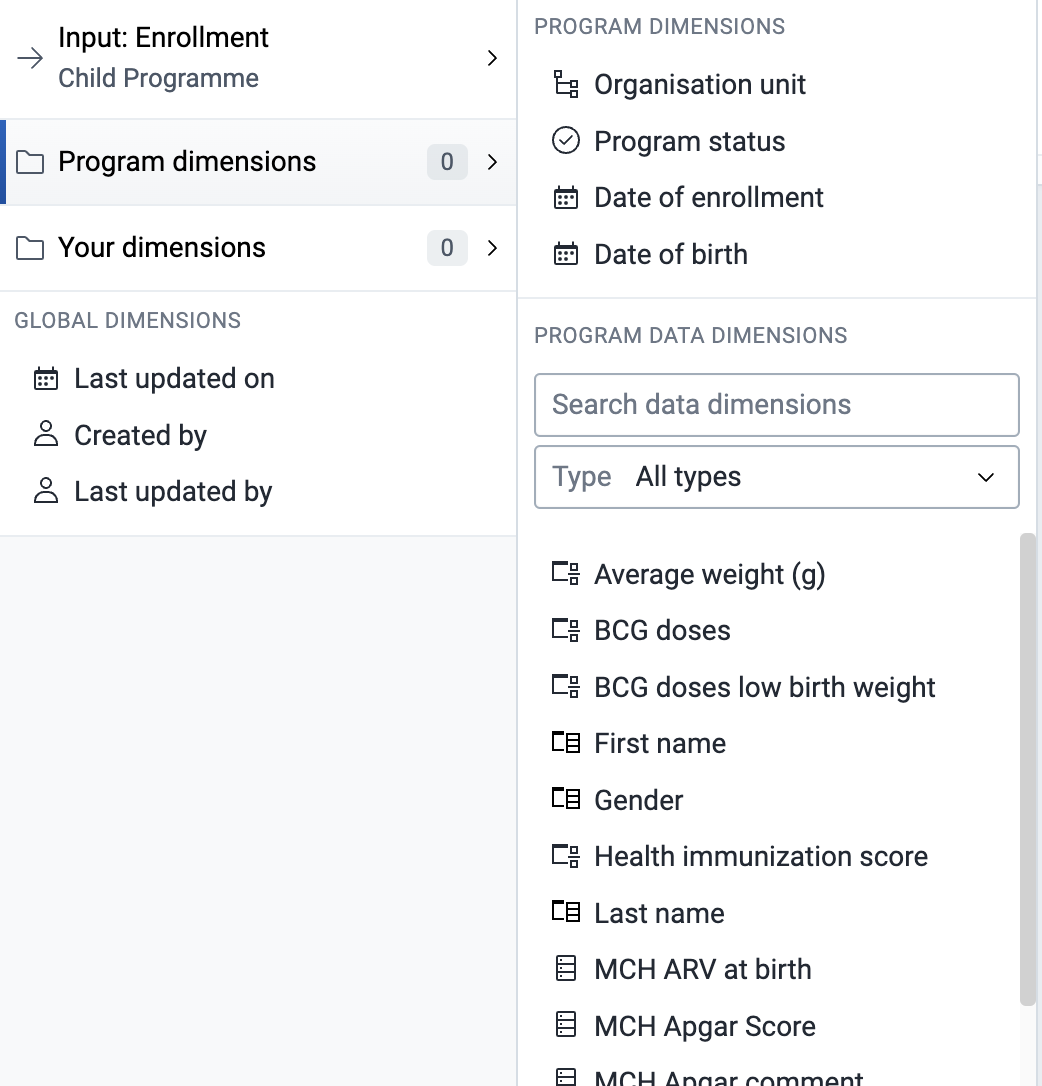
If you want to filter the data, by data elements, program attribute, program indicators, category, category option group set you can do so by clicking on the dropdown option.
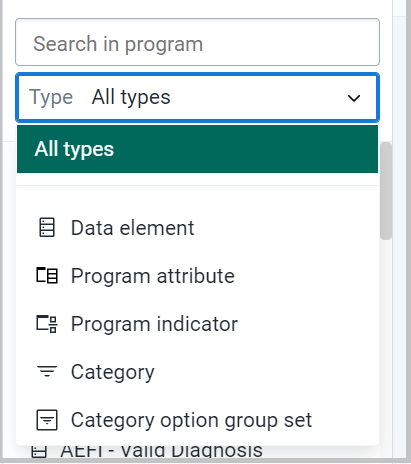
There are multiple ways to add data elements to the layout. They can be added by hovering over the dimension and clicking the plus icon or by dragging and dropping a dimension straight to the layout area.
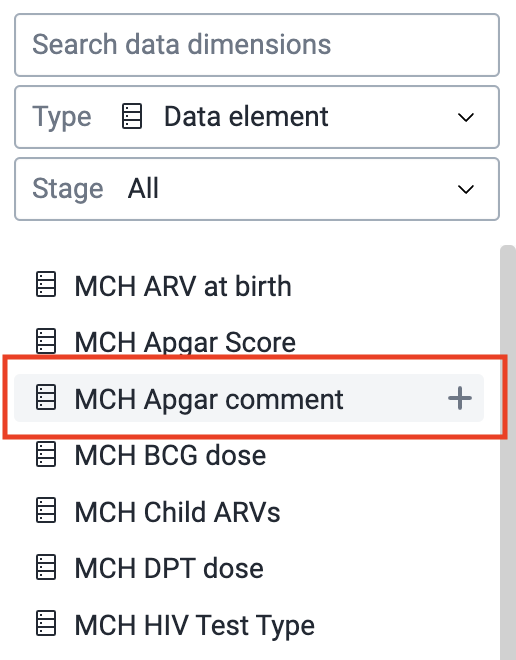
Alternatively, you can click on the respective data element and then choose to add it in column or filter as shown in below figure.
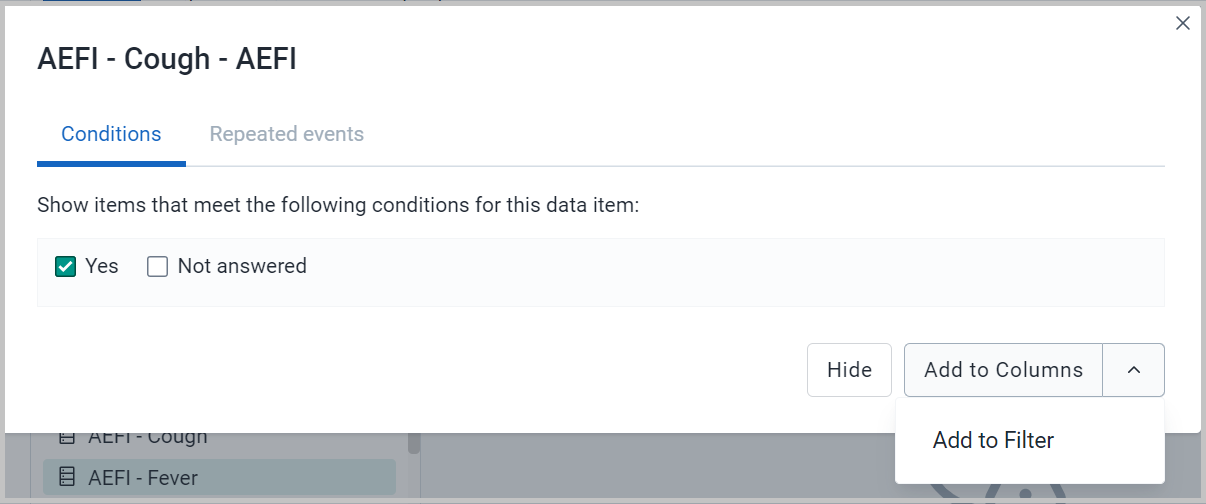
Each dimension can have criteria (filters). Data elements of the type option set allows for "in" criteria, where multiple options can be selected.
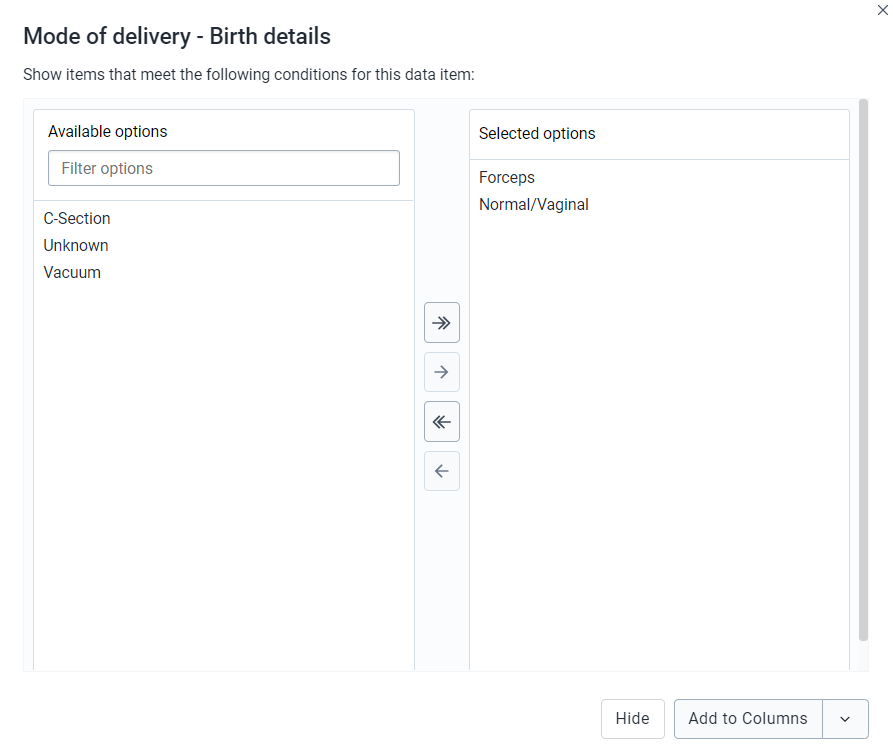
Numeric values can be compared to filter values using greater than, equal or less than operators. (Optional) For each data element, specify a filter with operators such as "greater than", "in" or "equal" together with a filter value.
Note
The enhancement in this feature is that you can add multiple conditions and there are also different operators which can be used. You can also filter by empty or not empty.
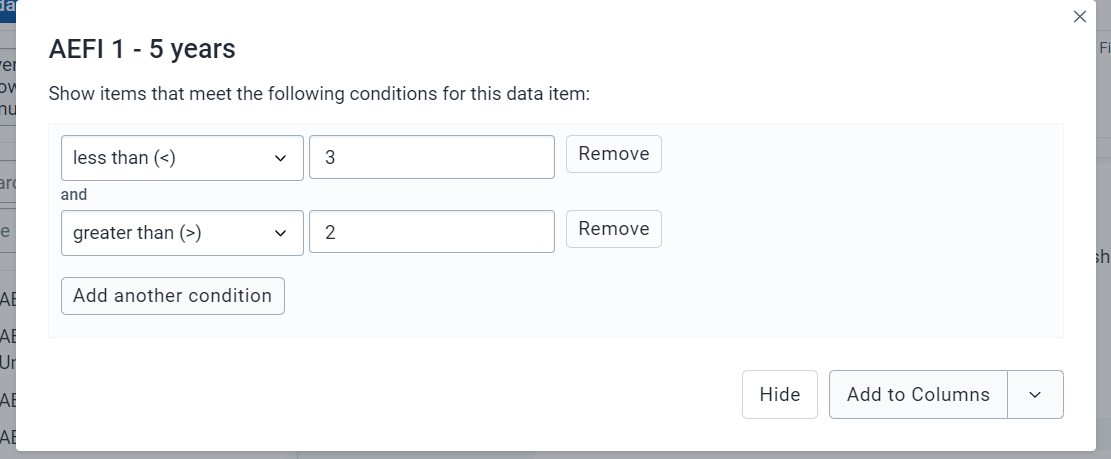
In the Line Listing app for BOOLEAN type data element, here in the analysis it will show “Yes”, ”No”, ”Not answered” instead of 0 and 1 as in the Event Reports app or the Data Visualizer app.
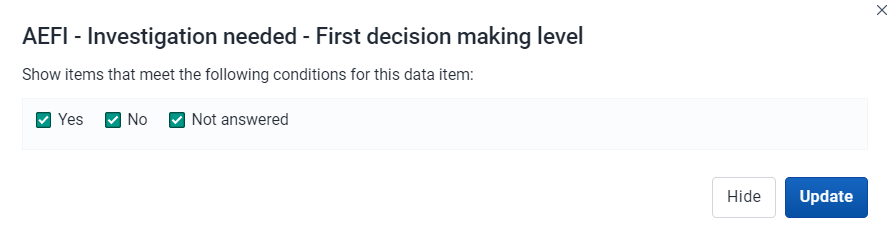
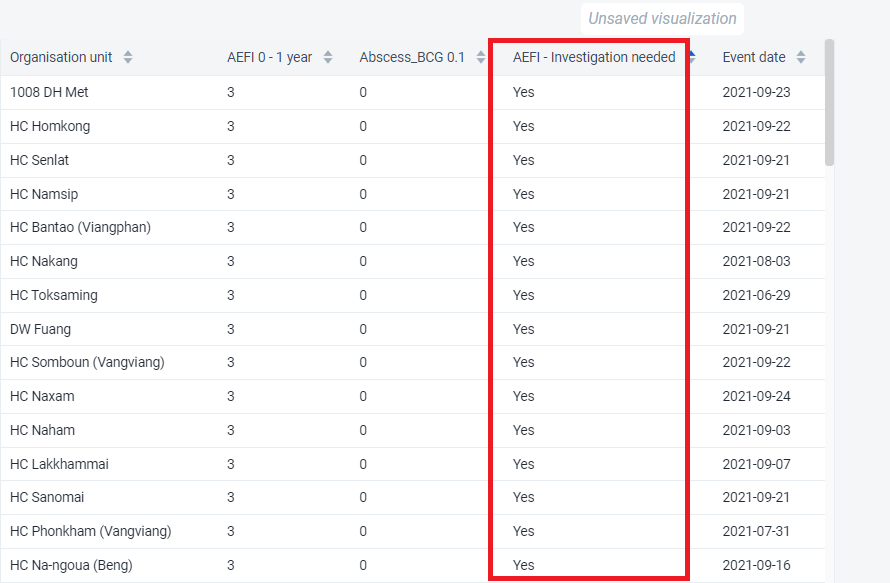
The line list will be displayed as a table with one row per event. Each dimension can be used as a column in the table or as a filter.
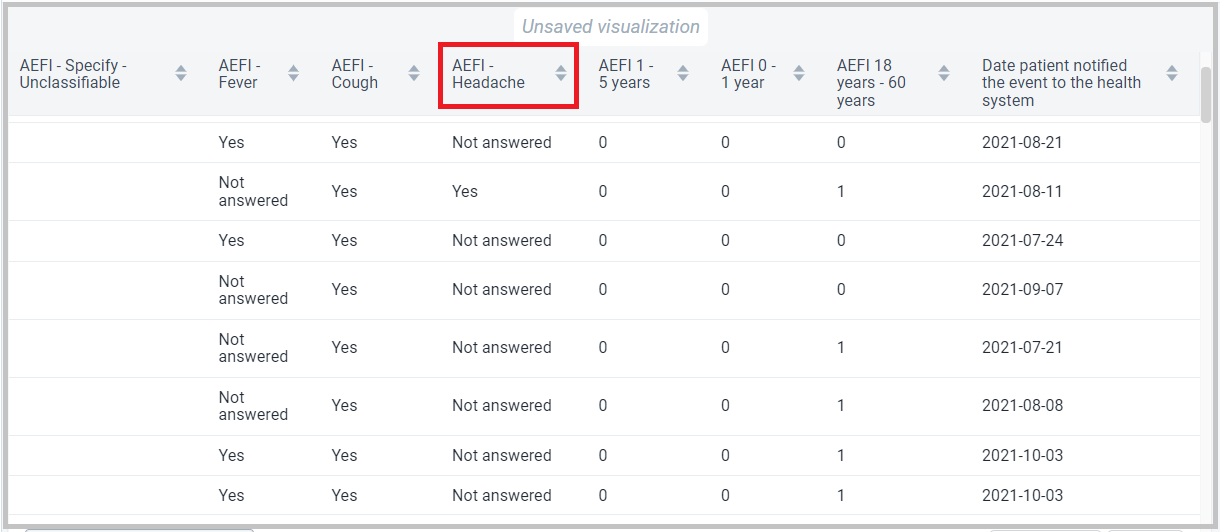
All Organisation Unit group sets are present under Your dimension component for further evaluation or analysis.
The organisation unit dialog is flexible, offering essentially three ways of selecting organisation units:
Levels and groups: The Level and Group dropdowns are a convenient way to select all units in one or more org unit groups or at specific levels. Example: select CH Mahosot (level 3) to get all org units at that level.
NOTE
Please note that as soon as at least one level or group has been selected the org unit tree now acts as the boundary for the levels/groups. Example: if you select CH Mahosot (level 3) and Vientiane Capital org unit (at level 2) in the tree you get all units inside that district._
The user's organisation units:
Filters data based on the event status: Active, Completed, Scheduled.
You can visualize the data for a particular event status
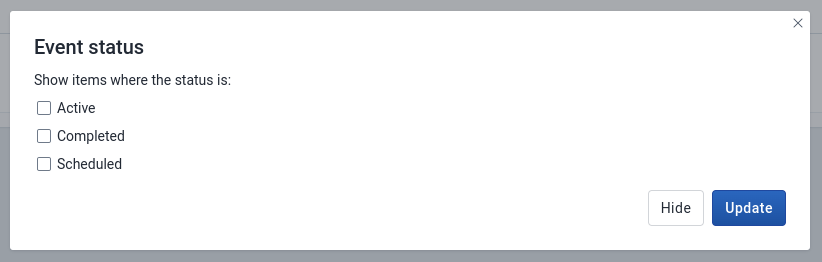
Filters data based on the program status: Active, Completed or Cancelled.
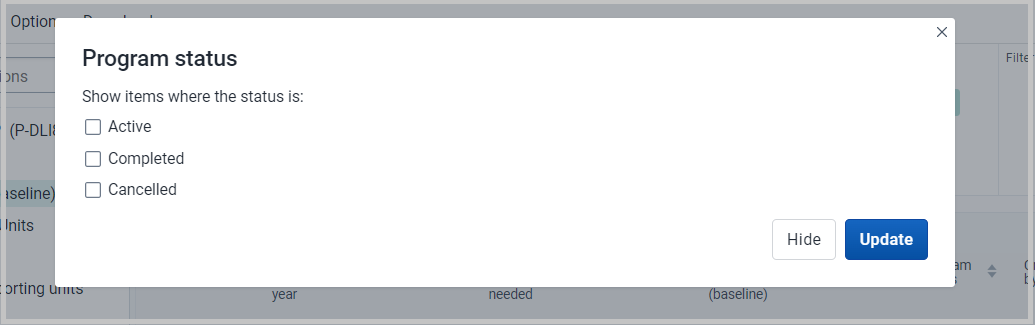
Will display the data based on who created the particular event.
This is a new feature in Line Listing app where you will be able to view the data on the basis of different time dimensions.
You can click on the above time dimension to visualize data on different period dimension, a window will open where you can select one or several periods.
You have three period options: relative periods, fixed periods and start/end dates. You can combine fixed periods and relative periods in the same table You cannot combine fixed periods and relative periods with start/end dates in the same table Overlapping periods are filtered so that they only appear once.
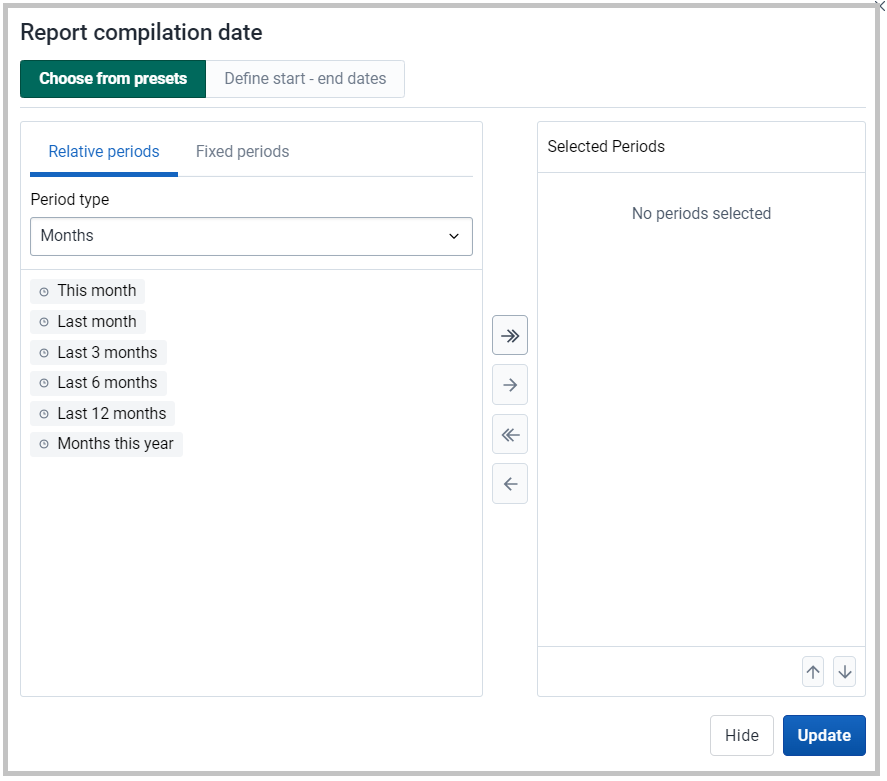
You can sort on all column headers
You can filter the specific column by directly clicking the data elements or attributes at the column and you will be able to sort the data values
Example
In the below screenshot, we have selected AEFI – Headache.
Once we click on AEFI – Headache we will get a dialog box where we need to select the option we want to filter out. In this we have selected “Yes” only.
Once we click on update, we will get the line list with only “Yes” under AEFI – Headache.
This is a new feature in the Line Listing app.
If the program stage has a data element in a repeatable event you can click on the data element and the window will open up where you will be able to see the Repeated event tab
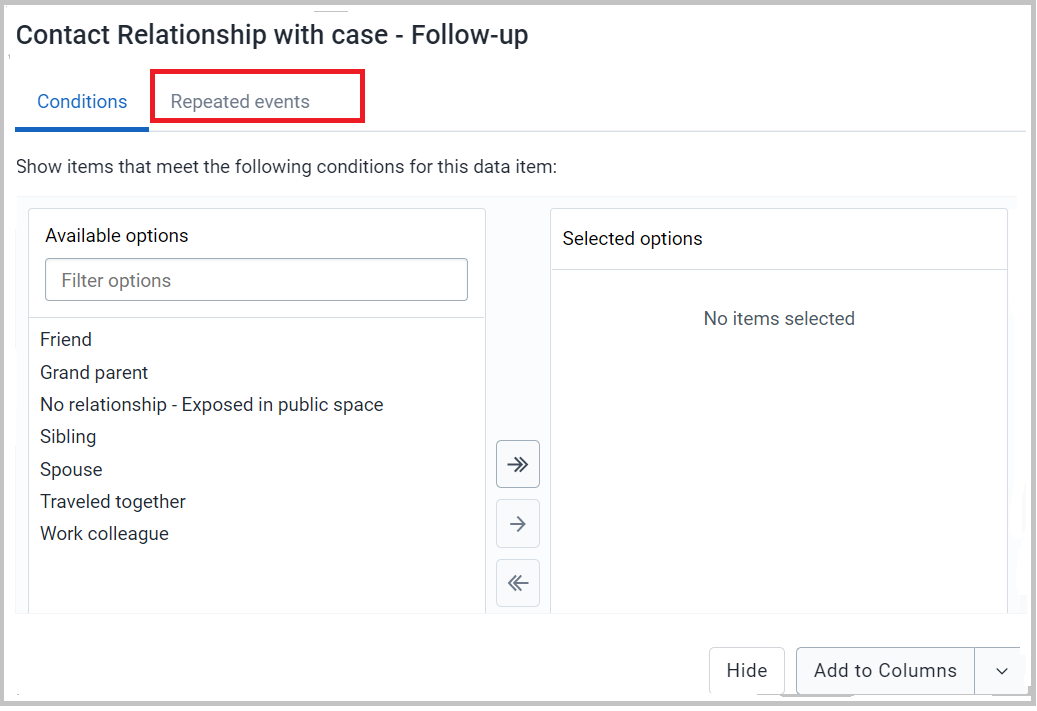
Then, you can define the most recent events and the oldest events you want in the output as displayed below.
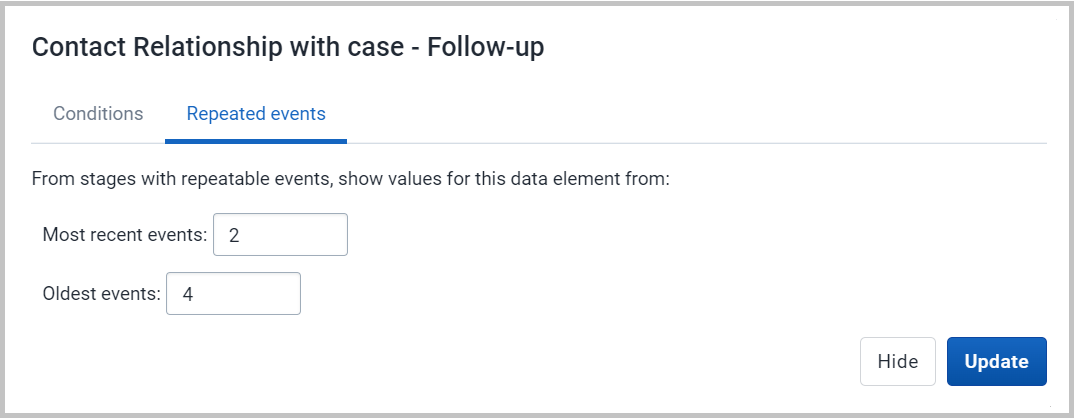
Once you click on update you will be able to visualize the events of this repeatable program stage as shown below.
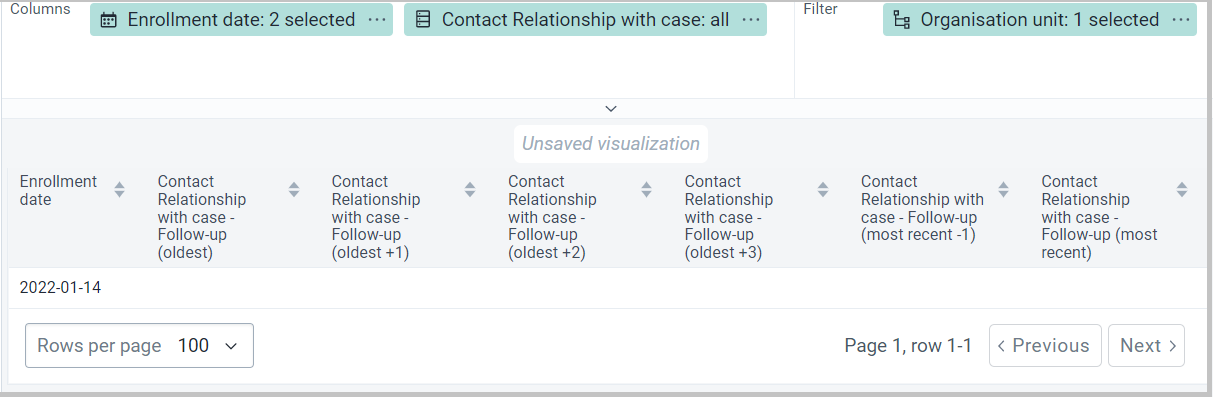
You can apply colors to a visualization by using the legend feature, which can be found under Options -> Legend
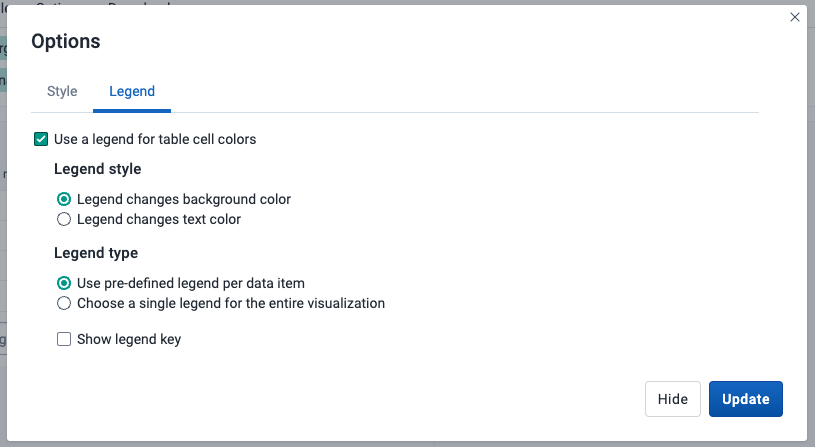
| Option | Description |
|---|---|
| Use a legend for table cell colors | Applies a legend to the visualization items, which is a value-based color for each item. The legends themselves are configured in the Maintenance app. |
| Legend style | Controls where the color from the legend is applied, either to the text or the background. You can use this option for scorecards to identify high and low values at a glance. |
| Legend type | Controls which legend is applied.Use pre-defined legend per data item applies a legend to each data element or indicator individually, based on the legend assigned to each one in the Maintenance app.Select a single legend for entire visualization applies a single legend to all data items, chosen in a drop-down list of available legends. |
| Show legend key | Displays a key for the legend on the right side of the visualization, to indicate the value ranges and their respective color. |
Below is an example of a line list with legend colors applied to the background, per data item.
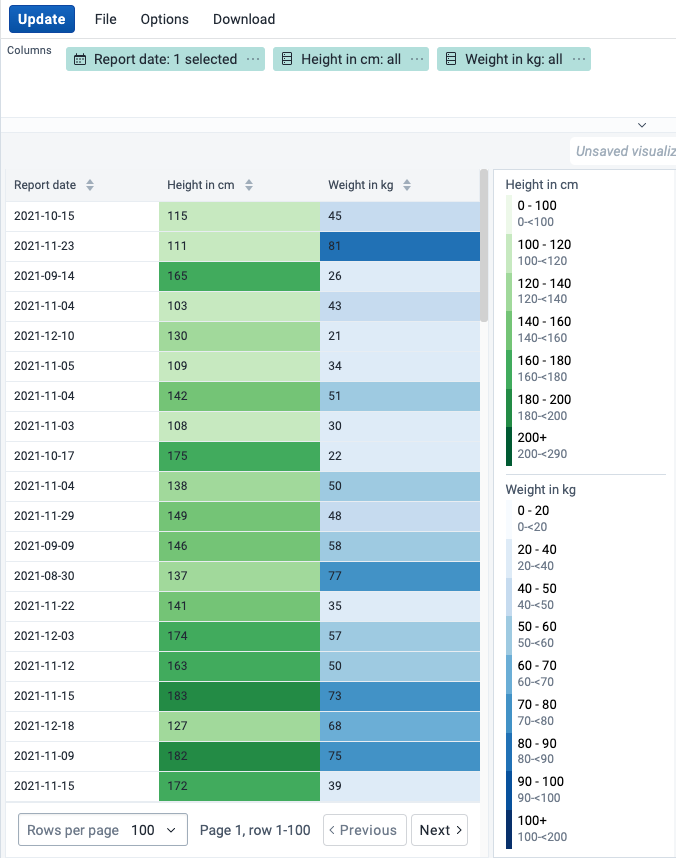
You can show the full hierarchy path for organisation units by enabling the Show organisation unit hierarchy option in Options -> Style. When this is enabled, sorting on the organisation unit column will sort the organisation units alphabetically starting from the top level.
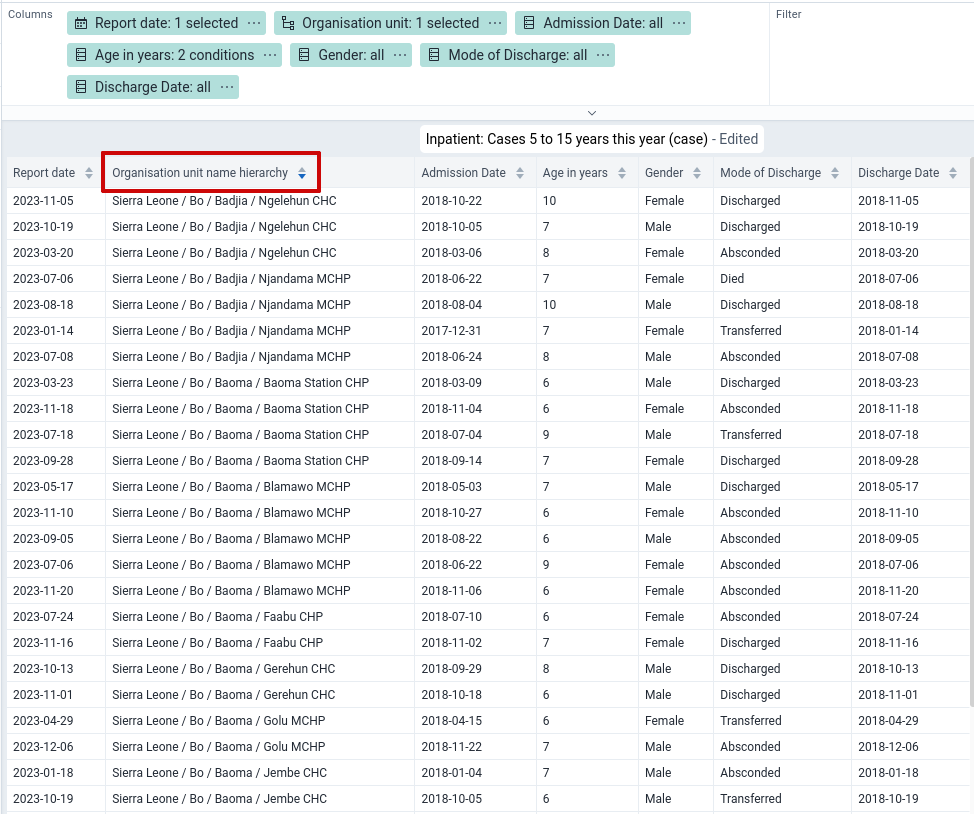
You can control how numeric values are formatted by toggling the Skip rounding option in Options -> Data. When this is enabled, the numeric values are not rounded and all decimals are shown. By default rounding is applied.
Below is an example of the same table with and without the option applied.
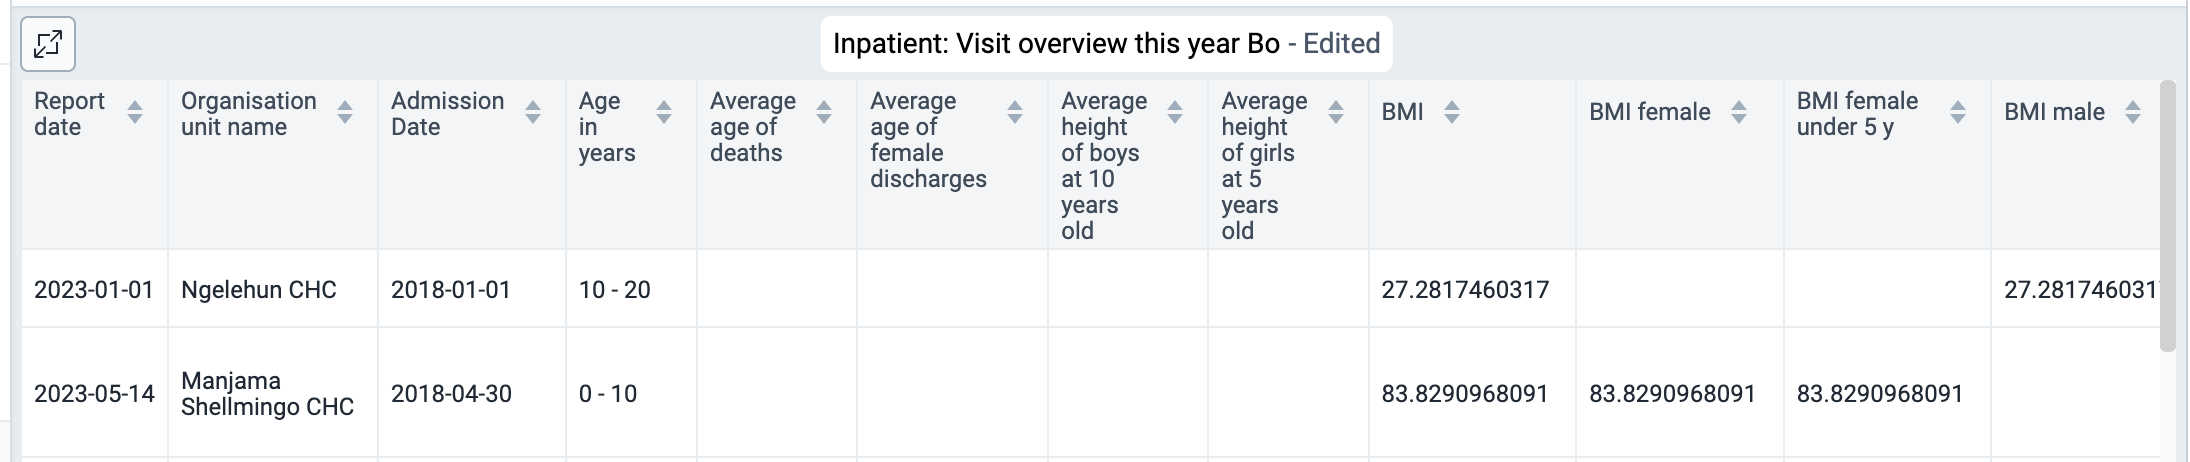
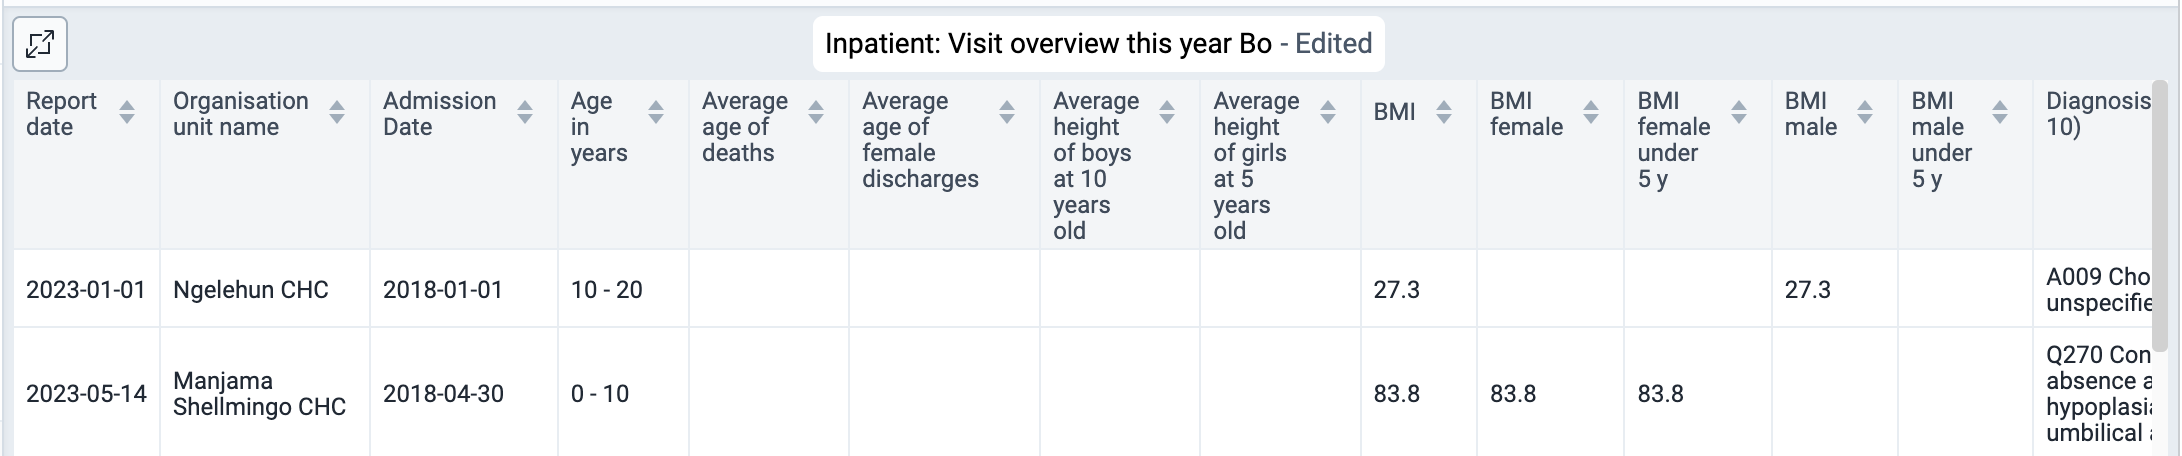
To allow more space for the line list itself, there are various ways to hide panels on the top and sides:
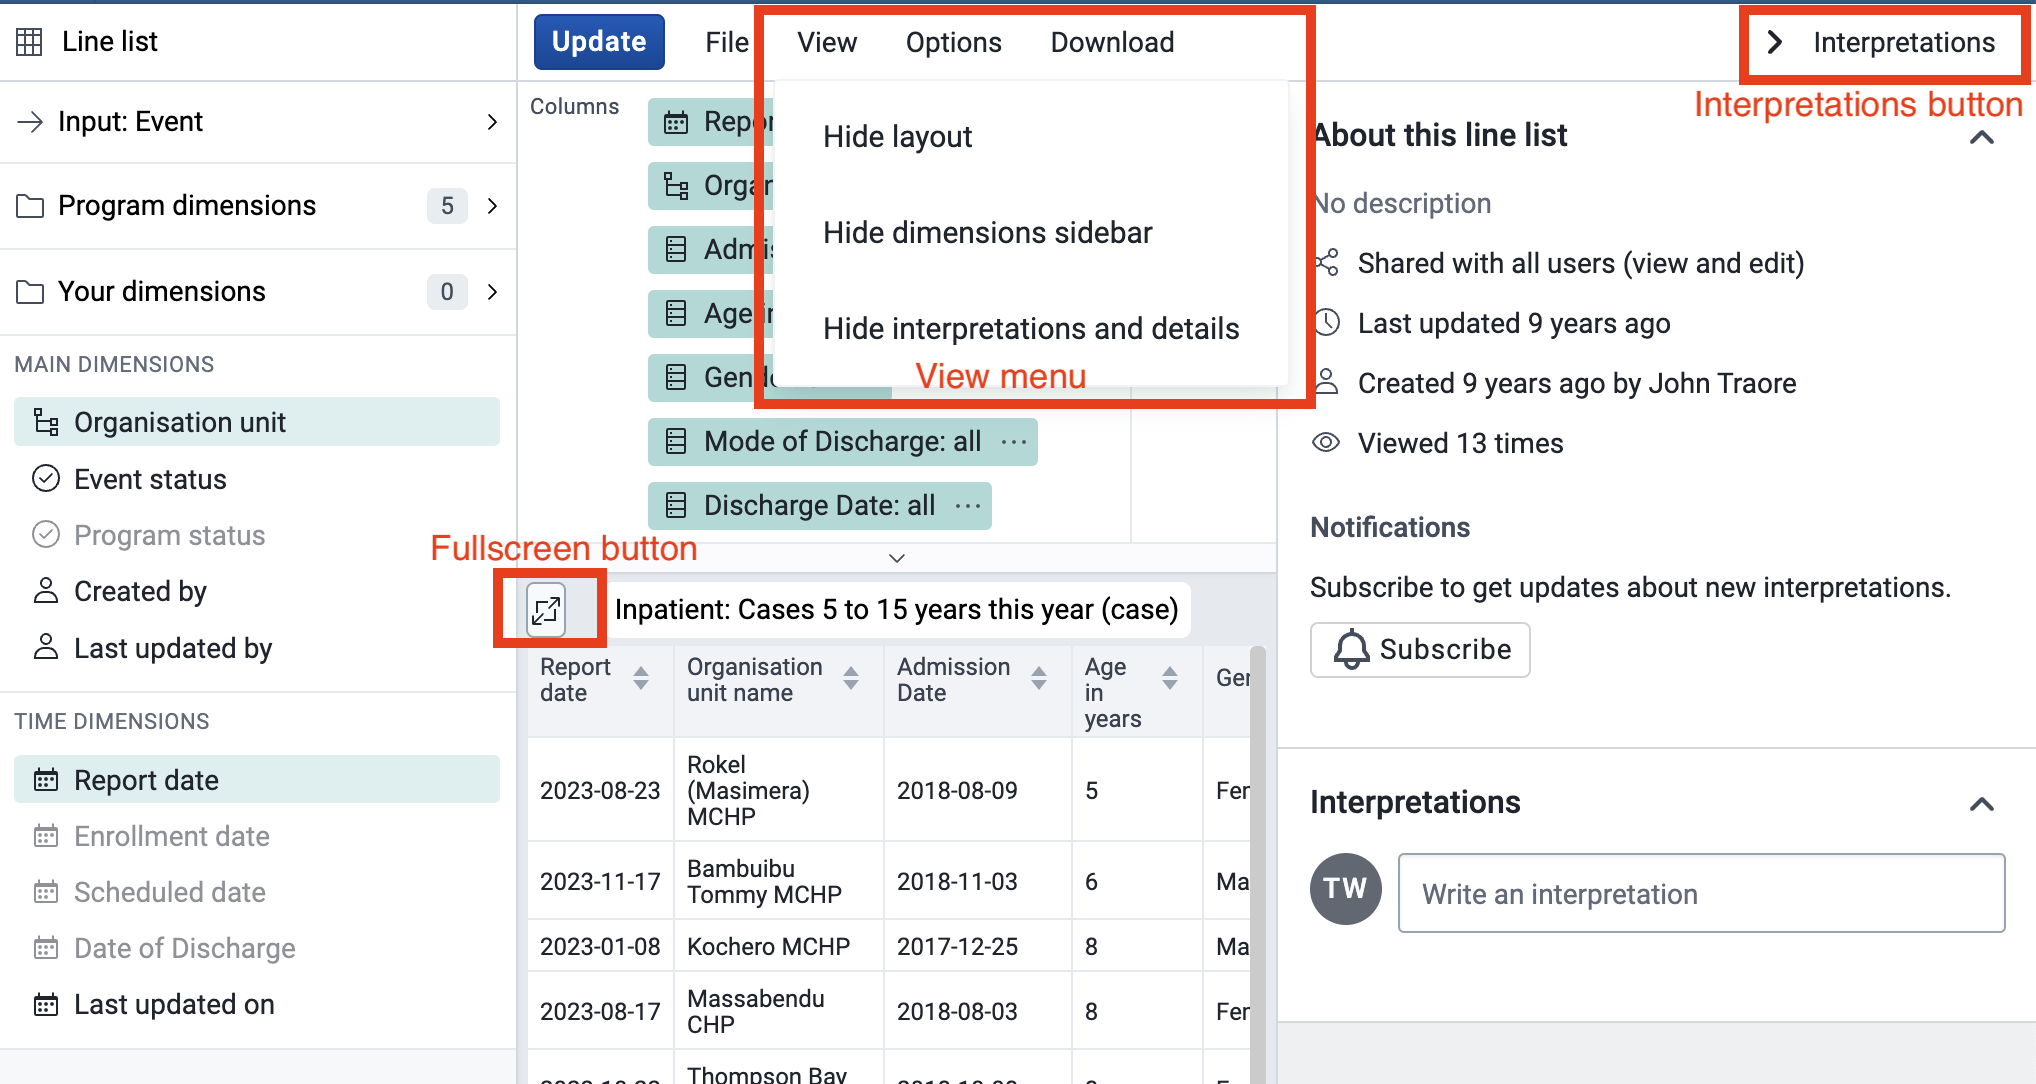
To provide more space for the content in the "Accessory Side Panel" it can be resized using the mouse as illustrated below:
Resizing can also be done using the left/right arrow key on the keyboard. These keyboard shortcuts become active after giving focus to the resize-handle (by repeatedly hitting the tab key):
The "Accessory Side Panel" can be reset to its default width, by using the "View" menu or double clicking the resize-handle.

The Maps app was introduced in release 2.29 as a replacement for the original GIS app, offering a more intuitive and user-friendly interface. Since version 2.34, the mapping engine is based on WebGL technology, capable of showing thousands of features on a map simultaneously.
Note
The Maps app requires WebGL. Visit get.webgl.org to verify that WebGL is working in your browser or to troubleshoot display issues.
With the Maps app, you can overlay multiple layers and choose from different basemaps. Supported layer types include thematic maps, events, tracked entities, facilities, org unit boundaries, and Earth Engine data such as population, elevation, or climate indicators. You can label features, search and filter data, and save or share maps with other users, or download them as an image. Saved maps can be added to dashboards in the Dashboard app. Thematic layers also integrate with the Data Visualizer app, letting you open the same data as a chart.
Note
To use predefined legends in the Maps app, you need to create them first in the Metadata Management app.
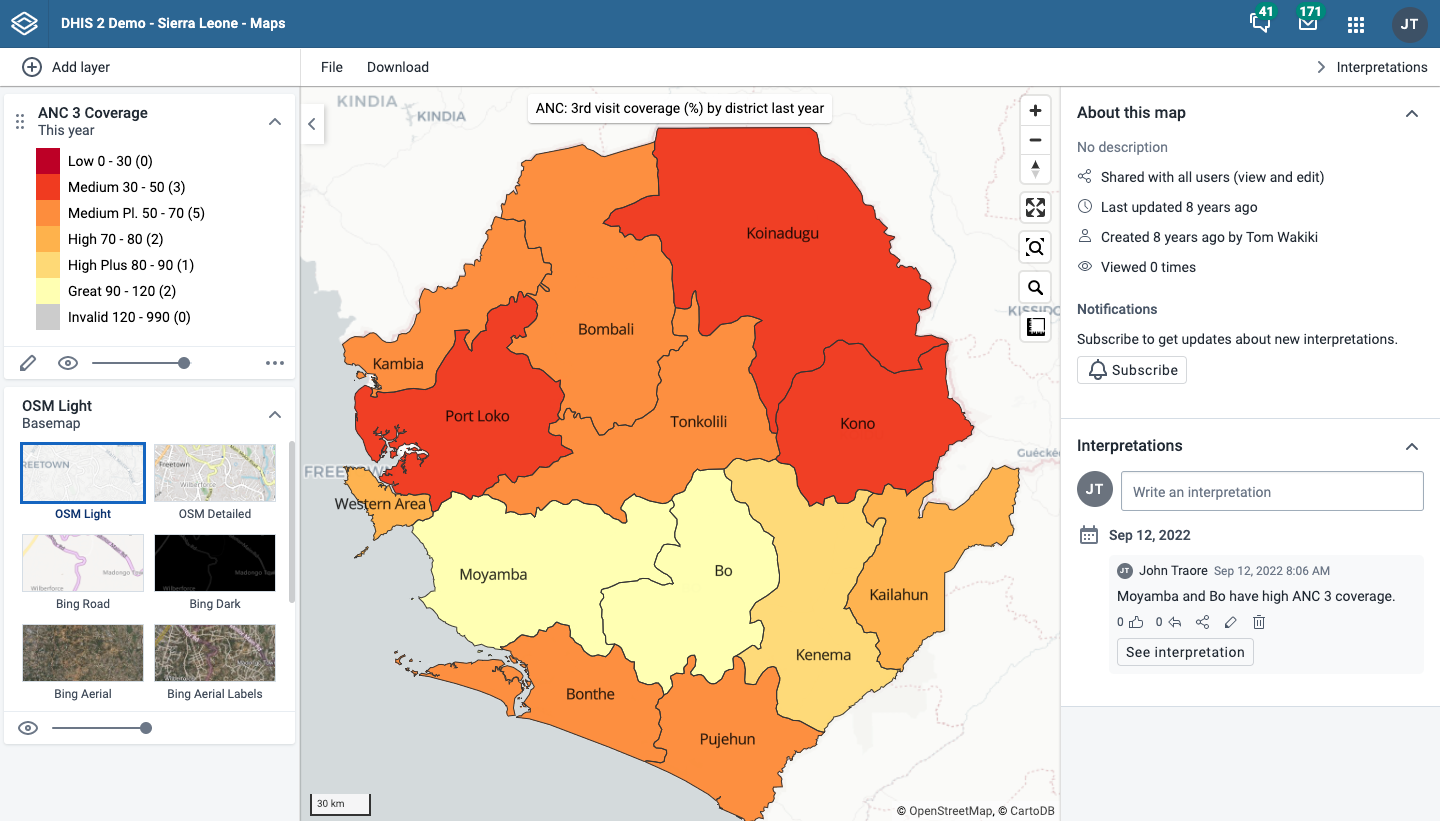
The layer panel on the left side of the workspace shows an overview of the layers for the current map:
As layers are added, using the (+) Add layer button, they are arranged and managed in this panel.
The basemap card is always shown at the bottom of the panel. See Basemaps for available options.
The small arrow button to the right of the layer panel, at the top, allows the panel to be hidden or shown.
Each layer is represented by a card in the panel. Along the top of the card are a grab handle for reordering layers with the mouse, the layer title, and an arrow to collapse or expand the card. The middle of the card shows the layer legend where applicable. Along the bottom of the card from left to right are:
An edit (pencil) button opens the layer configuration dialog.
An eye symbol toggles the visibility of the layer.
A slider modifies the layer transparency.
A more actions (three dots) button provides additional options, including showing or hiding the data table, downloading the layer data, duplicating the layer, and removing the layer.
The + and - buttons on the map allow you to zoom in and out of the map respectively. The mouse scroll wheel zoom is continuous, allowing you to fit the map perfectly to your content.
The rotate map button (triangle arrows) allows you to rotate and tilt the map to enhance the view of your data. Press and hold the button (or hold the Control key on your keyboard) while moving your mouse to change the map view. Click the button again to reset the view.
Fullscreen (four arrows) allows you to view the map in fullscreen. To exit fullscreen, click the button again or press the escape key on your keyboard.
Zoom to content (bounded magnifying glass symbol) automatically adjusts the zoom level and map center position to put the data on your map in focus.
Search (magnifying glass symbol) allows searching for and jumping to a location on the map.
The ruler button allows you to measure distances and areas on the map.
Right-click on the map to display the longitude and latitude of that location.
The File button near the top left allows you to open and save maps. See using the maps file menu for more detailed information.
The Download button next to the File button allows you to download the current map as a PNG image.
The Interpretations button at top right opens an interpretations panel on the right side of the workspace. See viewing interpretations for more information.
When you open the Maps app, you start with an empty map canvas and the default basemap selected. If a map is already open, start a new one using File > New. You can change the basemap at any time from the basemap card in the layer panel (see Basemaps).
To add a layer, click the (+) Add layer button in the top left. The layer selection dialog opens:
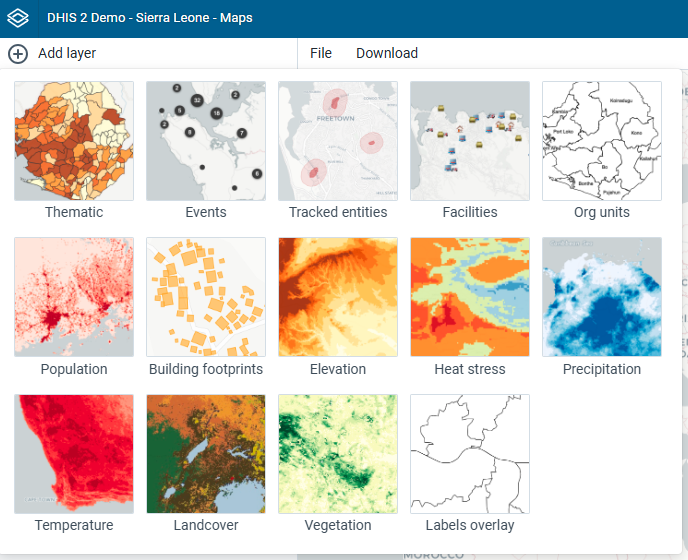
Available layer types are:
In addition, several layers may be provided by Google Earth Engine (such as population, elevation, or climate indicators) and other external services. Various Google Earth Engine layer sources are available if the Google Earth Engine API key has been set up (see documentation).
Note
The Maps app administrator can:
- Select the sources for Google Earth Engine layers available to other users via the Manage available layer sources button.
- Add external layer sources in the Maintenance app.
A basemap provides the background map on which your data layers are displayed. You can select and configure the basemap from the basemap card at the bottom of the layer panel.
The following basemaps are available by default:
If a Bing Maps or Azure Maps API key has been configured by a system administrator, four additional basemaps become available from each provider. Both providers offer the same four styles, prefixed with the provider name — for example, Bing Road and Azure Road:
A Maps app administrator can also add external basemaps via the Maintenance app. These appear in the basemap card alongside the default basemaps.
Basemap layers are represented by a card in the layer panel. The card shows the list of available basemaps with the current one highlighted. Controls at the bottom allow you to toggle the basemap visibility and adjust its transparency.
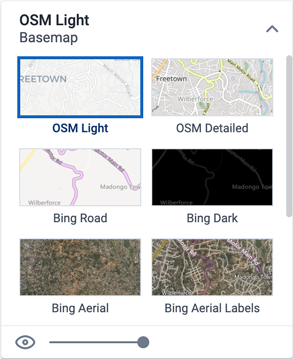
Note
Bing Maps is being retired. See the Bing Maps Blog for the retirement announcement. For migration to Azure Maps, consult the Bing Maps Migration Overview.
Thematic maps represent spatial variation of geographic distributions. They display aggregated data values for a selected data item (such as an indicator or data element), period and org unit level. Org units with coordinates and matching data values will appear on the map.
Note
You must generate the DHIS2 analytics tables to have aggregated data values available.
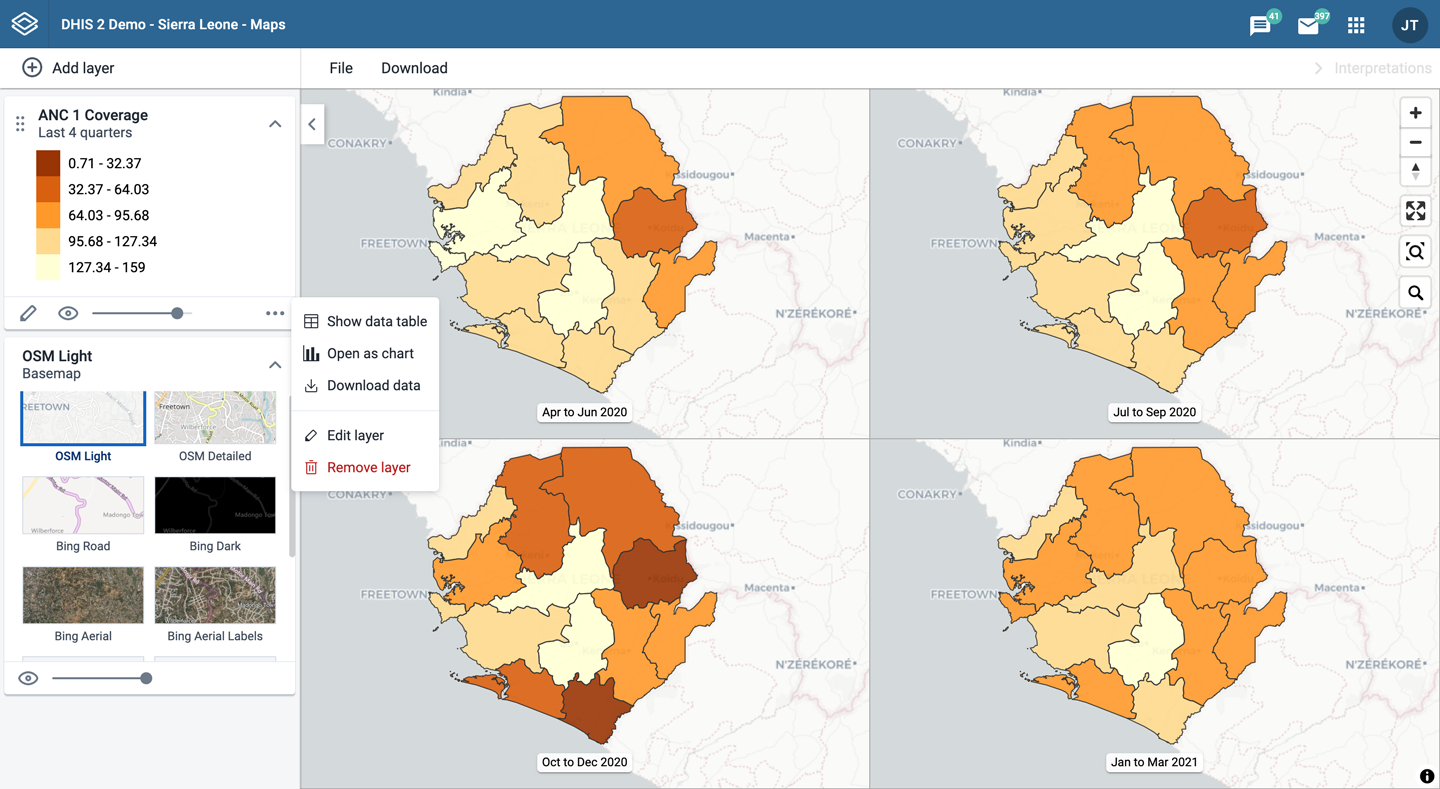
Thematic layers are represented by layer cards in the layer panel. The middle of the card shows a legend indicating the value ranges displayed on the layer. The more actions (three dots) button includes options to show or hide the data table, download the data, and open the data as a chart in the Data Visualizer app via Open as chart.
To create a thematic layer, choose Thematic on the Add layer selection. This opens the Thematic layer configuration dialog.

Select a data item.
Select a value from the Aggregation type field for the data values to be shown on the map. By default, "By data element" is selected. Alternative values are: Count, Average, Sum, Standard deviation, Variance, Min, Max. See also Aggregation operators.
Only show completed events: Includes only completed events in the aggregation process. This is useful when you want to exclude partial events in indicator calculations. Available for indicators, program indicators and event data items.
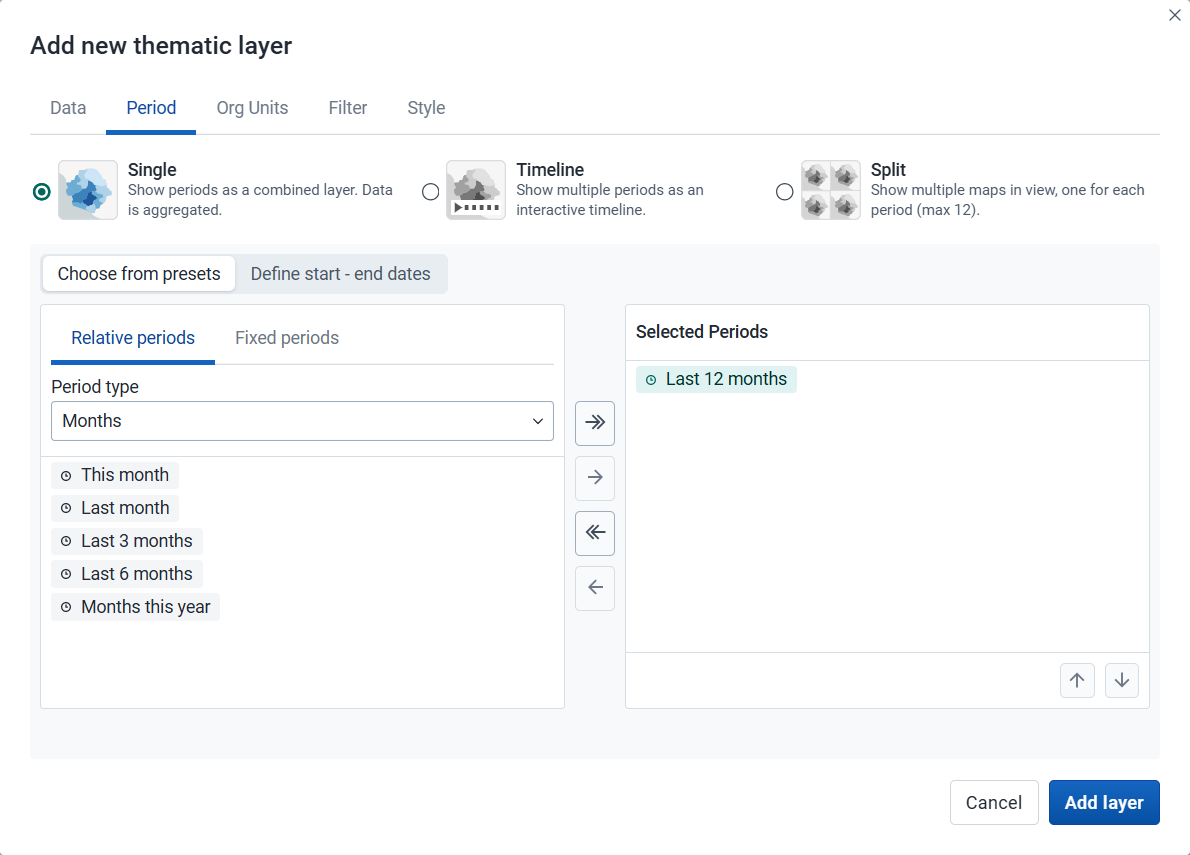
Select the time span over which the thematic data is mapped.
Period display mode: Select how the selected periods will be visualized on the map:
Single (default): Displays all selected periods as a single combined layer with aggregated data. Required when only one period is selected or when using start–end dates.
Timeline: Displays multiple periods as an interactive timeline ordered chronologically. Multiple timeline layers can be added to a map (they will all share the same periods).
Split: Displays multiple periods side by side for comparison. Supports up to 12 periods (including multi-period presets) and can only be combined with other split layers (they will all share the same periods).
After selecting a display mode, choose how to define the periods:
Choose from presets: Available for all display modes. You can combine one or more relative and fixed periods.
Relative period: Select Relative periods, then the Period type (Years, Months, etc.) and choose one or more relative periods, such as This year and Last year or Last 12 months. A default relative period for analysis can be set in the System Settings app.
Fixed period: Select Fixed periods, then choose the Period type (Yearly, Monthly, etc.) and choose one or more fixed periods, such as 2024 or January 2025 and February 2025.
Define start–end dates: Available only when the Single display mode is selected. Specify exact start and end dates. Both dates are inclusive and will be reflected in the outputs.

Select the org units you want to include in the layer. You can freely combine specific org units, org unit levels, org unit groups, and relative user org units (User organisation unit, User sub-units, User sub-x2-units). When user org units are selected, the map data will appear according to the assigned org units for each user in the org unit hierarchy.
Tip: Levels and groups act as filters within the org units you select - combining them will show only org units at those levels or in those groups that are descendants of your selected org units.
Use associated geometry: This dropdown will only show if there are any additional geometries available for your org units. This is typically used to show facility catchment areas.
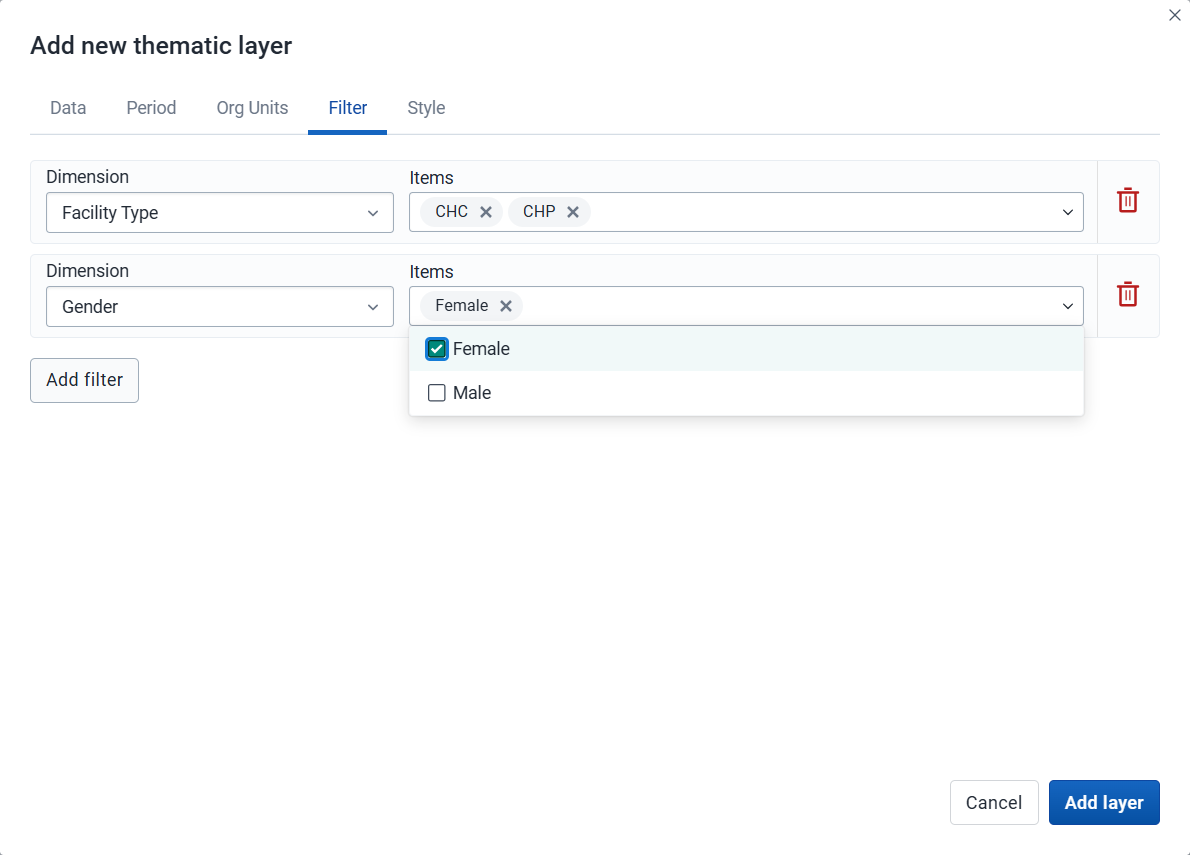
Click Add filter and select an available data item to add a new filter to the data set.
Select a data dimension from the dropdown box. You can reduce the number of dimensions shown by using the search field. Click the name to select a dimension.
When a dimension is selected you get a second dropdown with dimension items. Check the items you want to include in the filter.
Multiple filters may be added. Click the trash button on the right of the filter to remove it.
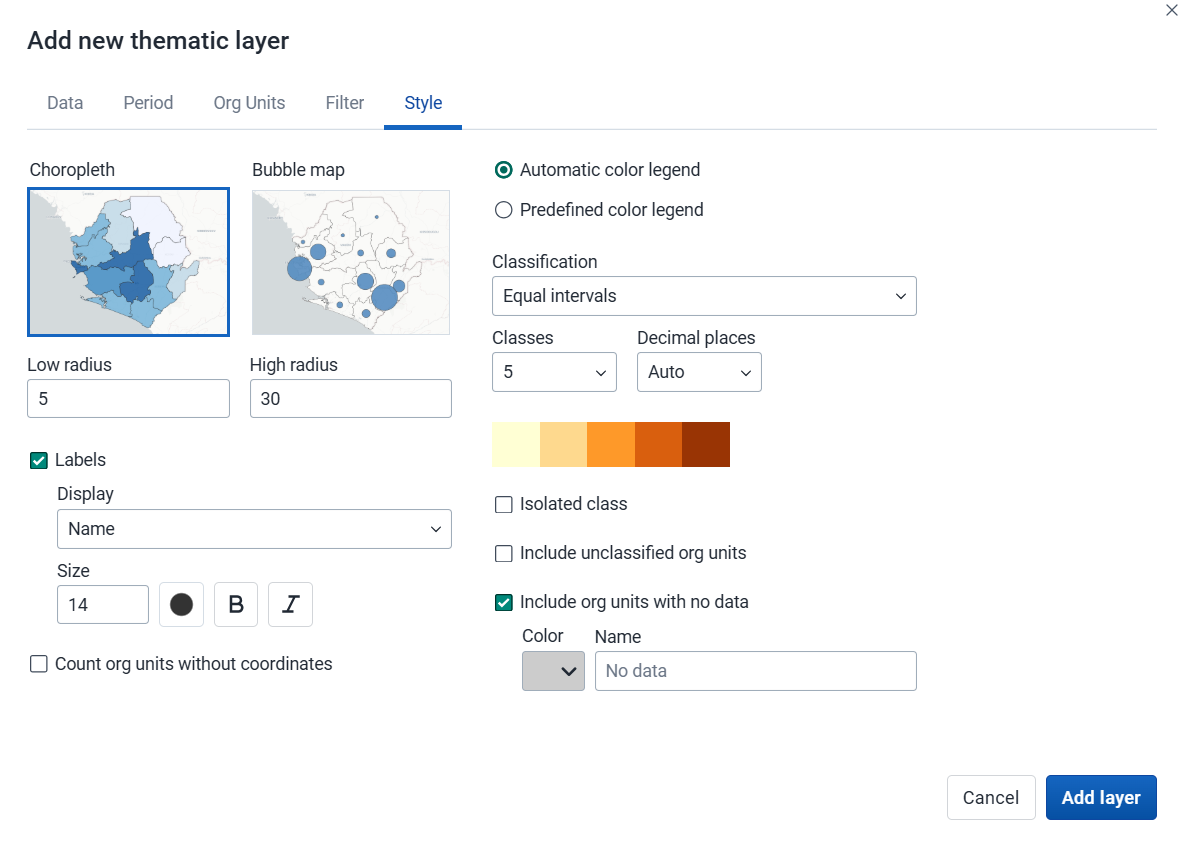
Select either Choropleth or Bubble map.
A choropleth map assigns a color to each org unit shape according to the data value. This is the recommended technique if the data is normalized (per capita).
A bubble map shows data values as proportional circles. Use this technique if the data is not normalized (absolute numbers). The circles are placed in the center of each org unit. Set the Low radius and High radius for the proportional circles. The circles will be scaled between low and high radius according to the data value. The radius must be between 0 and 50 pixels.
Show labels: Show org unit names and/or values on the layer. Select Name, Name and value, or Value. Font size, weight, style and color can also be modified.
Count org units without coordinates: Org units without map coordinates are counted and shown in a Data quality section of the legend. They also appear in the data table. These org units may or may not have data.
Select the legend type:
Automatic color legend: A legend is automatically created based on the classification method, number of classes and color scale you select. Set Classification to one of:
Decimal places: Number of decimal places shown in legend labels. Auto lets the app decide based on the data range, or choose a fixed value from 0 to 6 (also available for single color legends).
Isolated class: Define a value range (min–max) with a fixed color and optional label. Org units in that range are shown separately and excluded from automatic classification.
Predefined color legend: Select from the predefined legends.
Single color legend: Select the color of the bubbles or circles. Only available for bubble maps.
Include unclassified org units: Org units whose values fall outside all classification ranges are shown with a configurable color and label (default: "Unclassified").
Include org units with no data: Org units with no data value are shown with a configurable color and label (default: "No data").
Note: All legend items and their counts - including No data and Unclassified - only include org units with coordinates.
Note
Most classes use half-open intervals (
startValue ≤ value < endValue): a value sitting exactly on a boundary belongs to the upper class, not the one whose label ends there. The exceptions - where the upper bound is inclusive - are the last class, isolated classes, single-value classes, and clusters (natural breaks).If the exact class a boundary value belongs to matters for your analysis, use Show labels to overlay values directly on each feature. If it still matters after that, consider whether a different legend, maybe with more classes or higher decimal precision, is the right tool for the decision you are trying to make.
Click Add layer.
In the layer panel, click the edit (pencil) icon on the thematic layer card.
Modify the settings on any of the tabs as desired.
Click Update layer.
Thematic layers have a Show/hide data table option that can be toggled on or off from the thematic layer card.
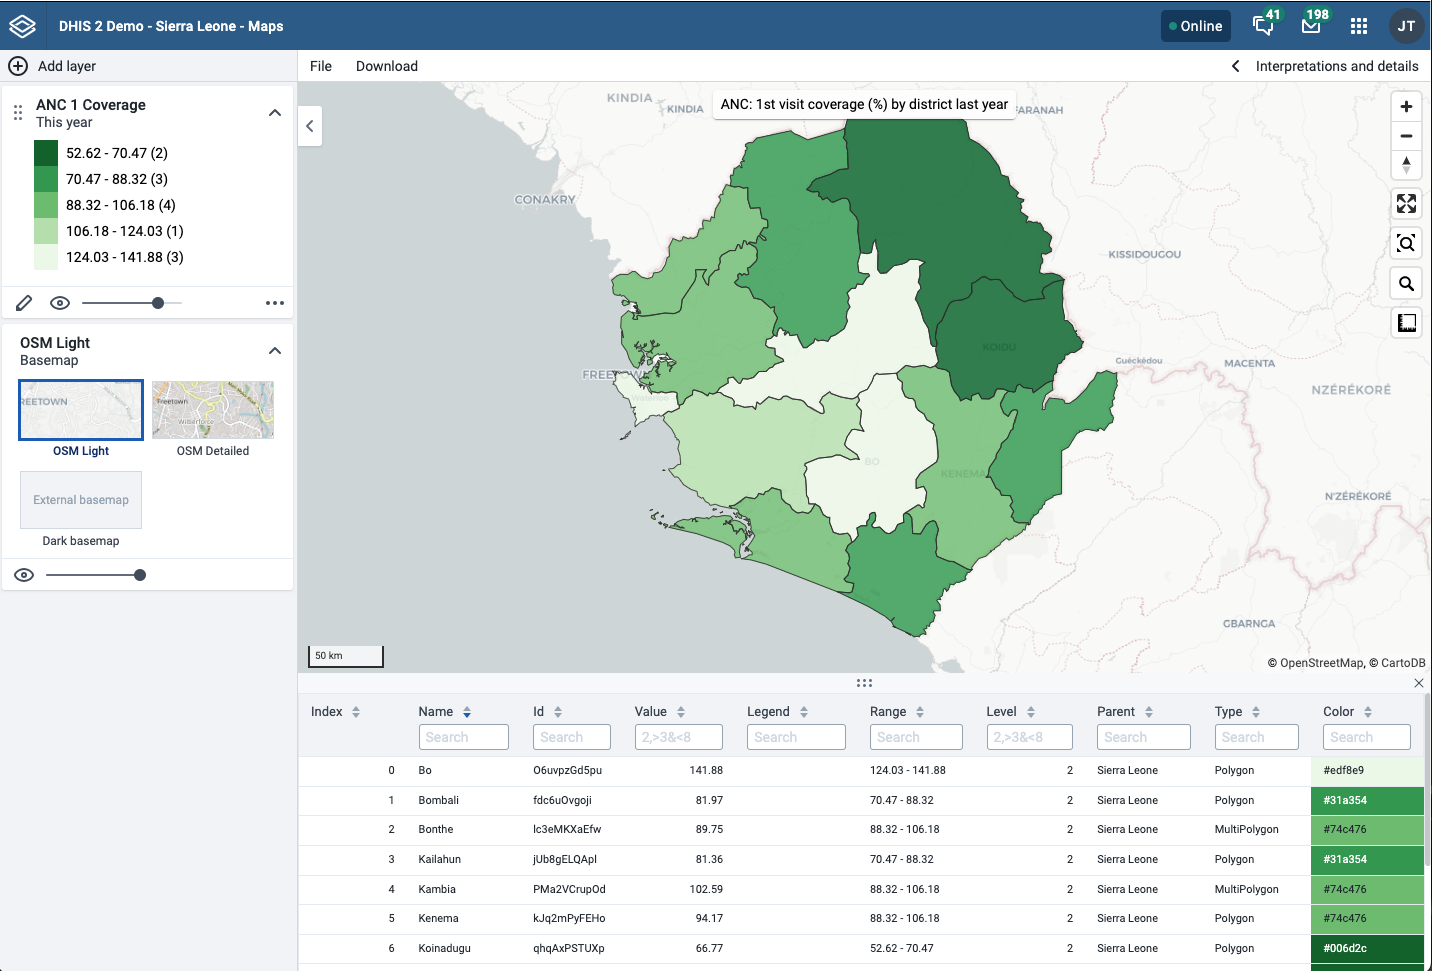
The data table displays the data associated with the thematic layer. Click the arrow buttons in a column header to sort by that column. Type in the filter fields below each column header to filter the displayed rows.
The name filter field is an effective way to search for individual org units.
For numeric columns, you can filter using comparison operators: >, <, >=, and <=. Use , for OR logic and & for AND logic — for example: 2,>3&<8 matches the value 2 or any value greater than 3 and less than 8.
Note
Data table filters are temporary and are not saved with the map.
You can open the org unit profile in three ways:
Click an org unit on the map, then click the View profile button in the popup.
Right-click one of the org units on the map, and select View profile from the menu.
Click an org unit row in the data table.
When there are visible org units on the map, you can easily navigate up and down in the hierarchy without changing the org unit selection.
Right-click one of the org units.
Select Drill up one level or Drill down one level.
The drill down option is disabled if you are on the lowest level or if there are no coordinates available on the level below. Likewise, the drill up option is disabled from the highest level.
To remove a thematic layer from the map, in the layer card to the left, click the more actions (three dots) icon and then click Remove layer.
The event layer displays the geographical location of events recorded in DHIS2 programs. While in thematic layers you can visualize event data aggregated to org unit level, with event layers you can display the individual events or cases when they have their own point or polygon coordinates. Alternative coordinate fields also let you plot events using locations other than the event itself, such as the org unit or enrollment location.
To display aggregated event statistics at the org unit level, use a thematic layer with event data items instead.
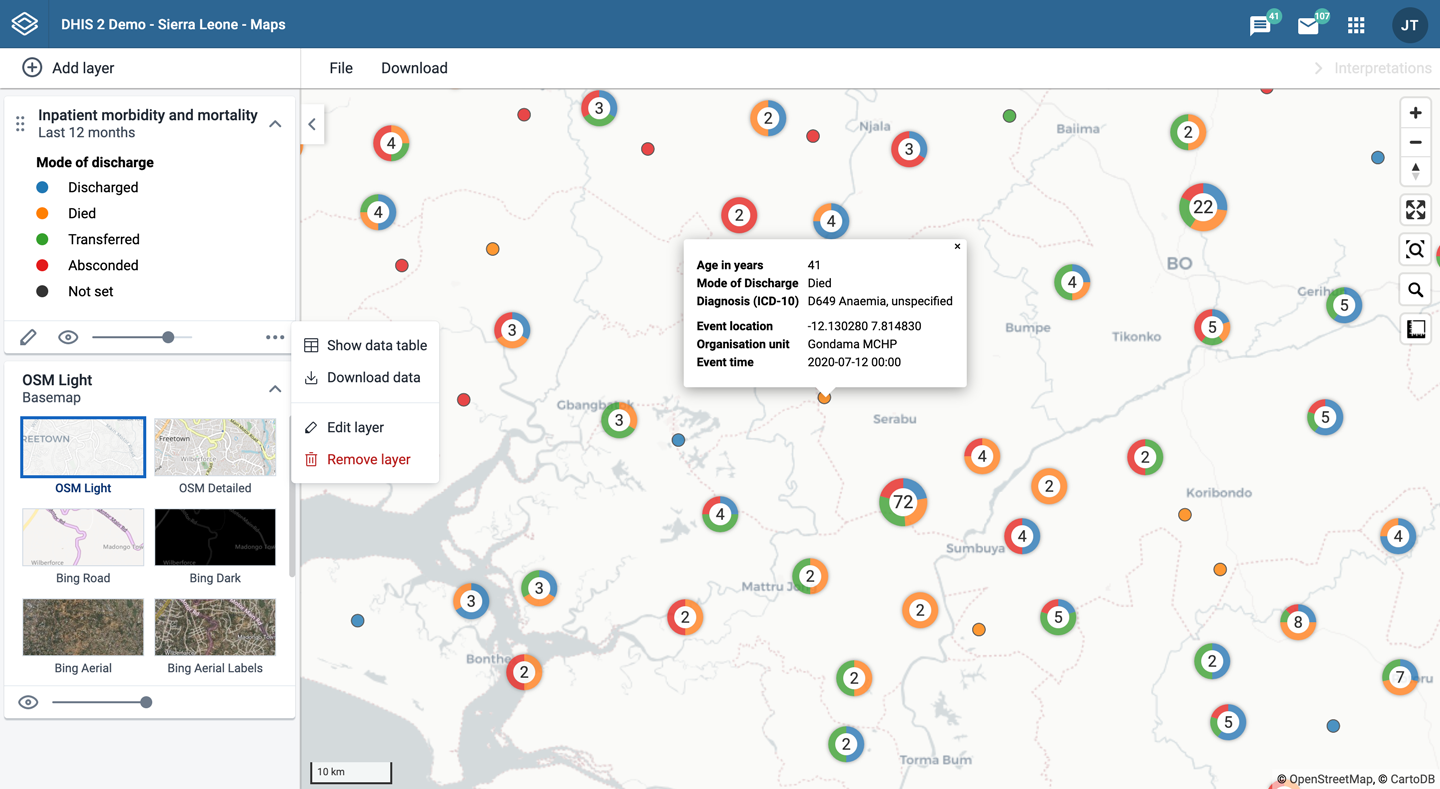
Event layers are represented by layer cards in the layer panel. The middle of the card shows a legend indicating the styling of the layer. The more actions (three dots) button includes options to show or hide the data table and to download the data in GeoJSON format.
To create an event layer, choose Events on the Add layer selection. This opens the Events layer configuration dialog.
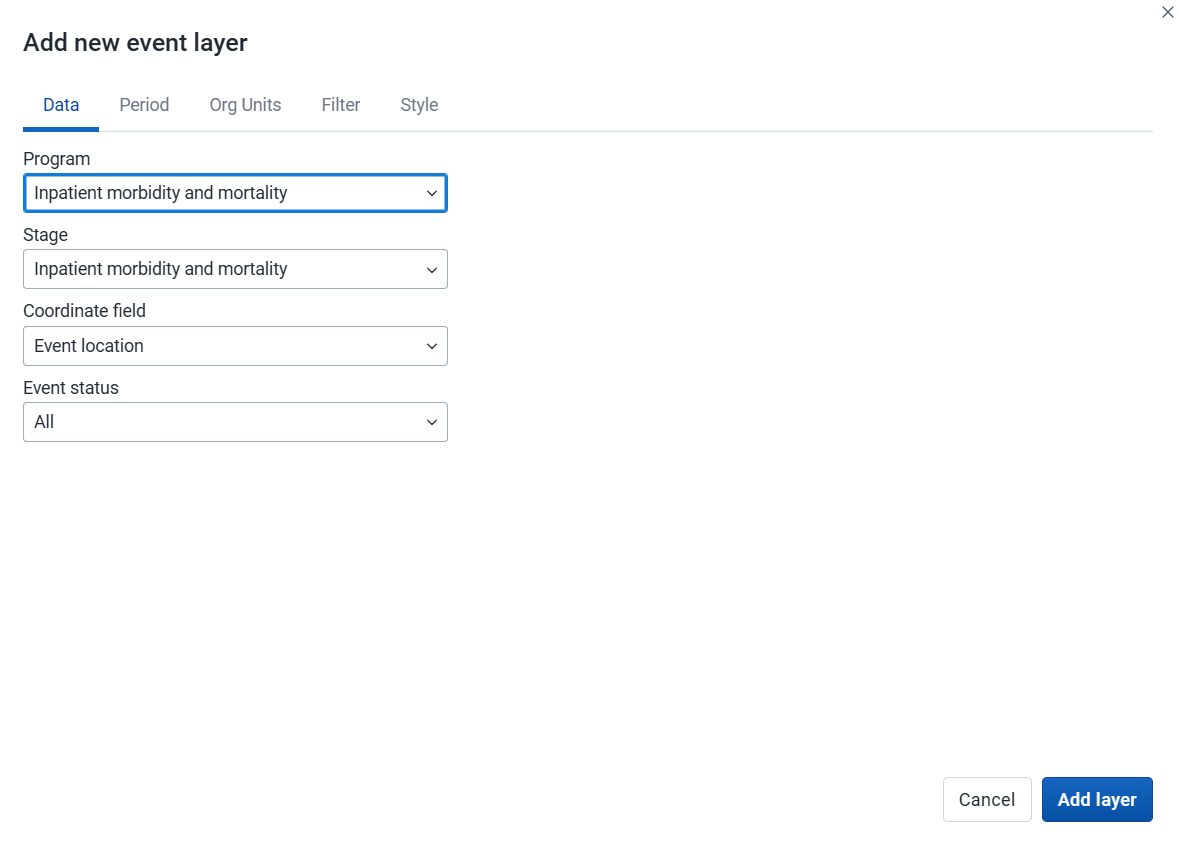
Select a program and then select a program stage. The Stage field is only shown once a program is selected.
If there is only one stage available for the selected program, the stage is automatically selected.
Select a value from the Coordinate field to determine which positions are displayed on the map. By default, "Event location" is selected. You can also choose "Org unit location". Depending on the selected program, additional options may include "Tracked entity location", "Enrollment location", and coordinate or org unit type data elements or attributes, such as "Household location" or "Referral facility". The number of events represented on the map may vary depending on the selected option and the availability of coordinates. When org unit location is used, polygons are represented by their centroids.
By default, all events with coordinates are shown on the map. Use the Event status field to only show events having one status: Active or Completed.

Select the time span for when the events took place. You can select either a fixed period or a relative period.
Relative period: Select one of the relative periods, for example This month or Last year. A default relative period for analysis can be set in the System Settings app.
Fixed period: Select Start/end dates and fill in a start date and an end date.
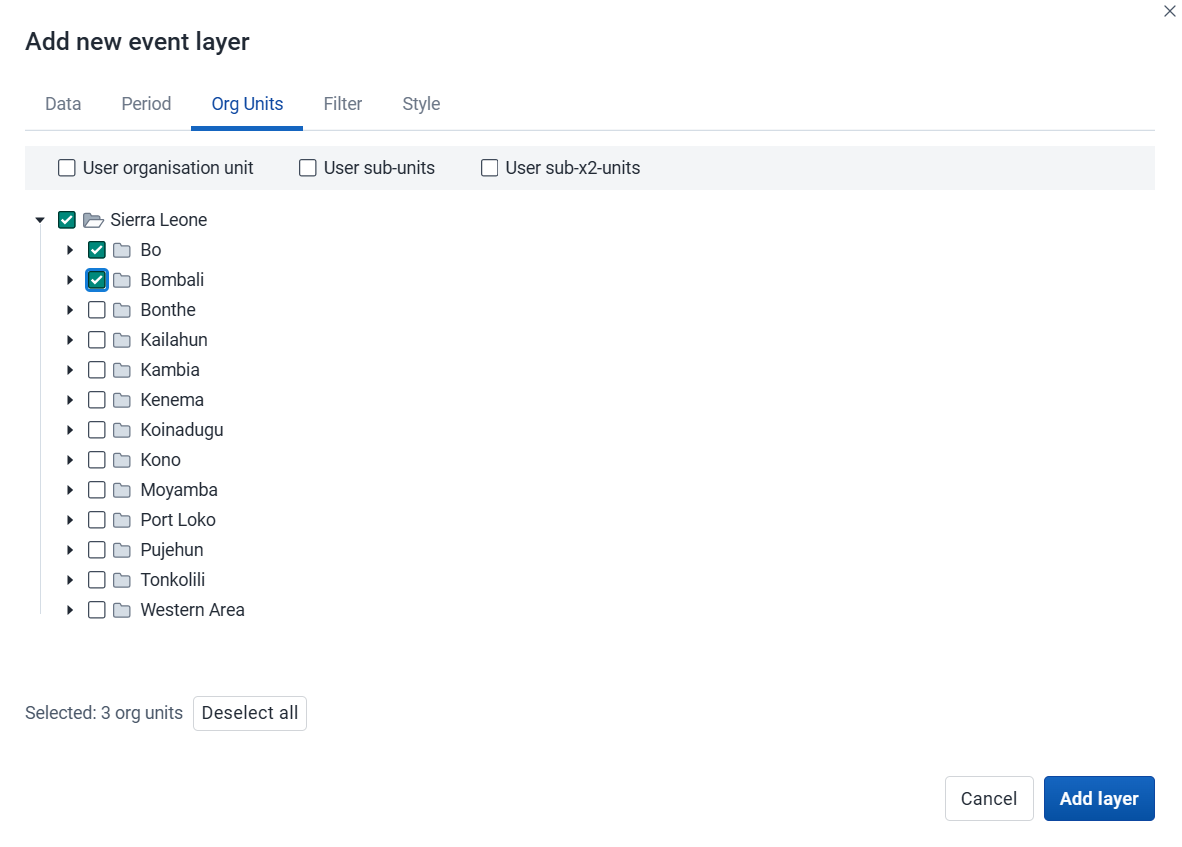

Click Add filter and select an available data item to add a new filter to the data set.
For data item of type option set, you can select any of the options from the dropdown box, or type to filter.
For data item of type number, you can select operators like equal, not equal, greater than or less than.
For data item of type boolean (yes/no), you can check the box if the condition should be true.
For data item of type text, select Contains (matches any value containing the search text) or Is exact (matches only identical values).
Multiple filters may be added. Click the trash button on the right of the filter to remove it.
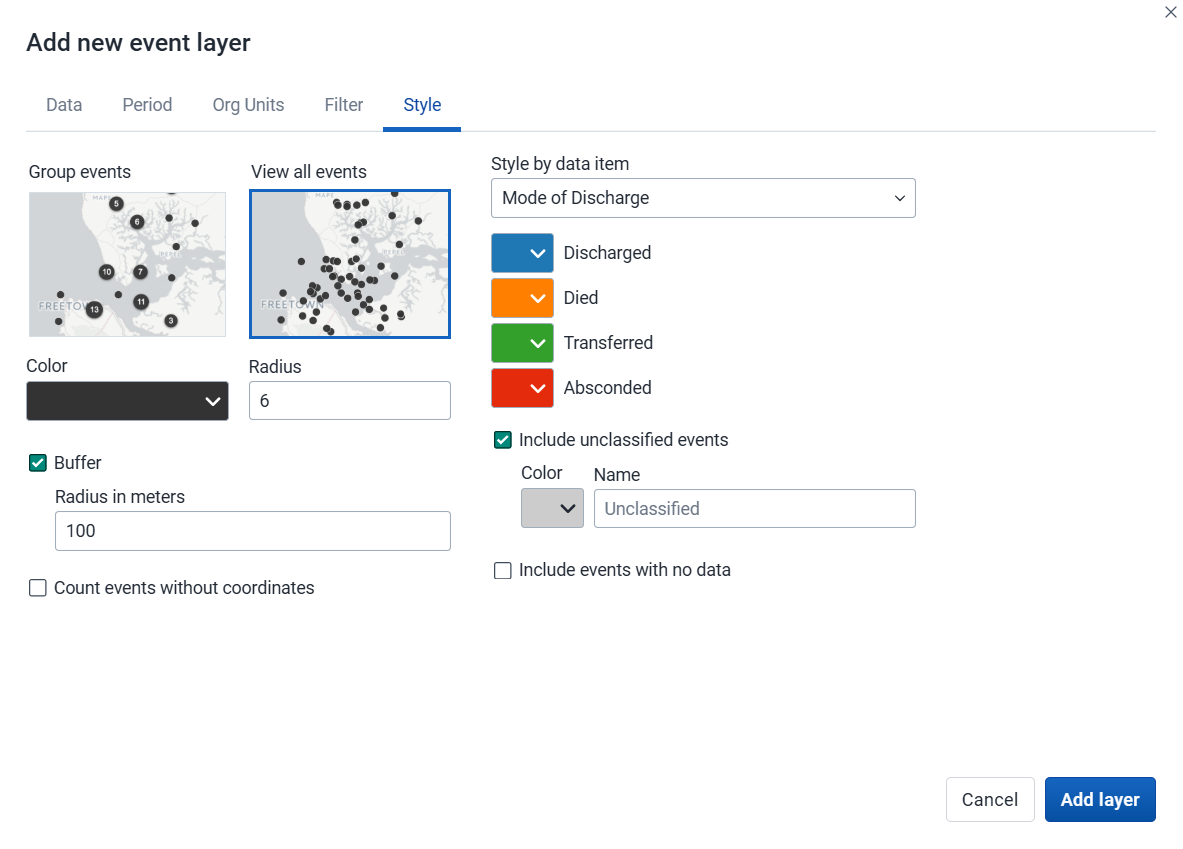
Select Group events to group nearby events (cluster), or View all events to display events individually.
Select a color and radius for the event or cluster points.
Select Show buffer to display a visual buffer around each event. The radius of the buffer can be modified here. Only available when View all events is selected.
Count events without coordinates: Events without coordinates are counted and shown in a Data quality section of the legend. They also appear in the data table. These events may or may not have data.
Select Style by data item (data element or attribute) to colorize the events according to a data value. If events are grouped, clusters are displayed as small donut charts showing the distribution of the data values. The available options vary for different data types:
Option sets: Select a color for each option in an option set. You can set default colors for an option in the Metadata Management app.
Numbers: You can style a numeric data item in the same way as thematic layers using automatic or predefined legends.
Booleans: Select a color for true/yes and another for false/no.
Include unclassified events: Events whose values fall outside all classification ranges are shown with a configurable color and label (default: "Unclassified").
Include events with no data: Events with no data value are shown with a configurable color and label (default: "No data").
Note: All legend items and their counts - including No data and Unclassified - only include events with coordinates.
Click Add layer.
In the layer panel, click the edit (pencil) icon on the event layer card.
Modify the settings on the Data, Period, Filter, Org units and Style tabs as desired.
Click Update layer.
Event layers have a Show/hide data table option that can be toggled on or off from the event layer card.
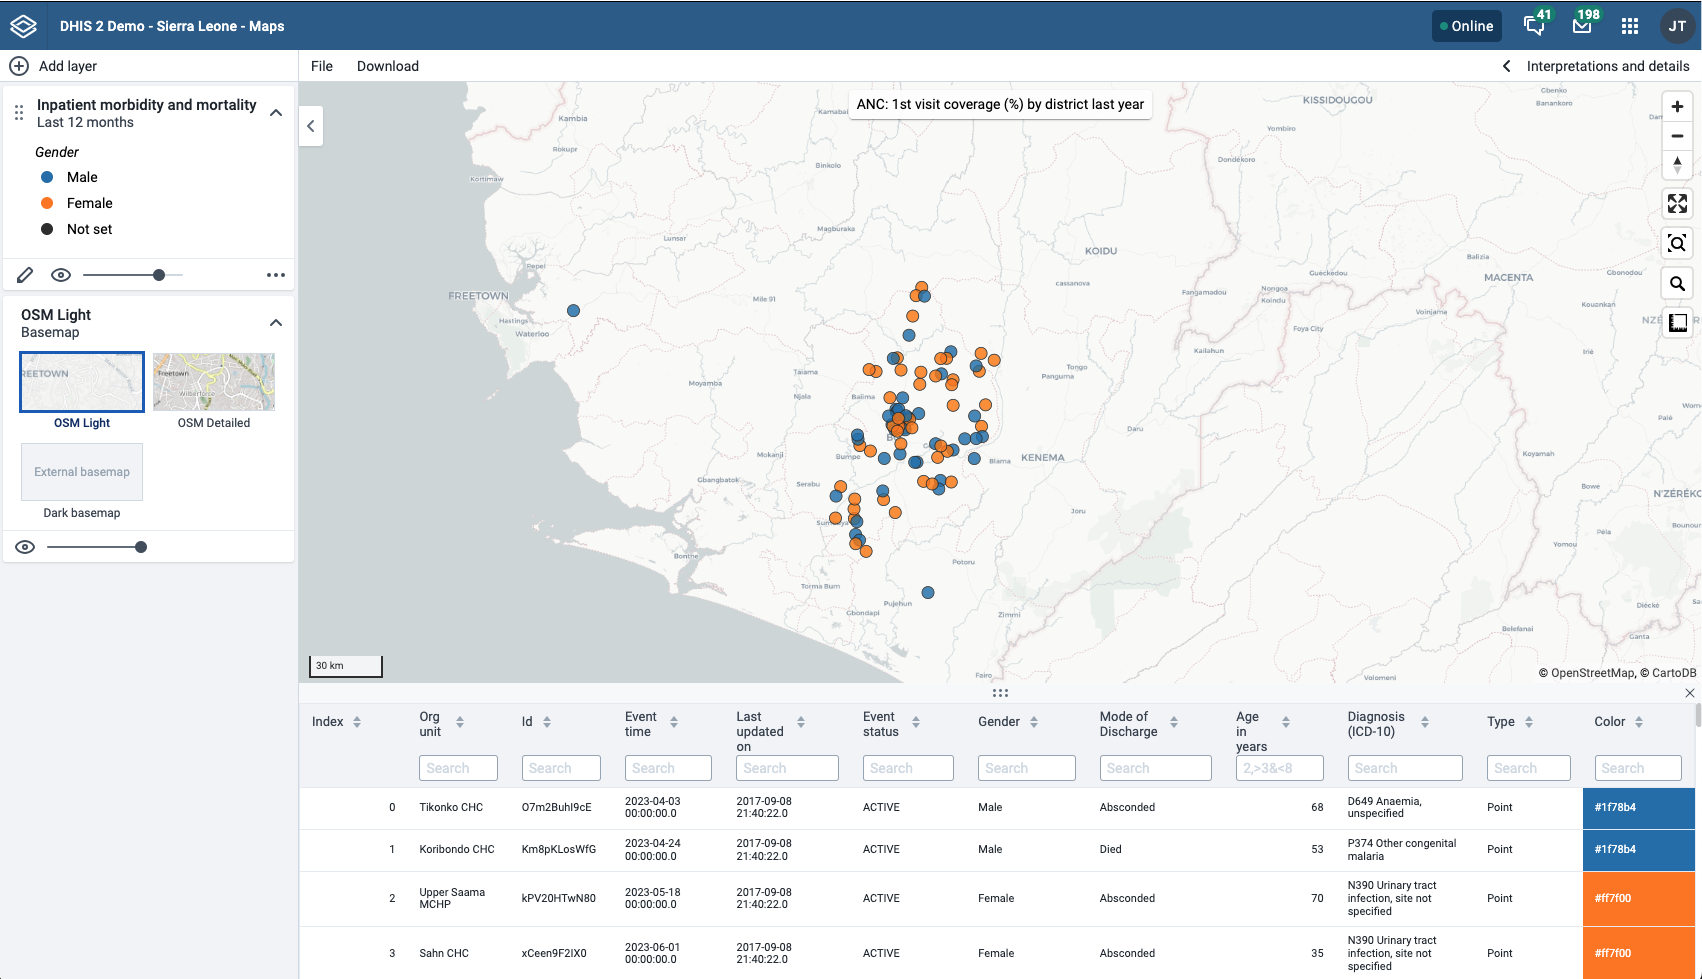
The data table displays the data associated with the event layer. Click the arrow buttons in a column header to sort by that column. Type in the filter fields below each column header to filter the displayed rows.
Additional columns appear for data elements configured to display in reports, and for any data item used to style the events — both the data value and the color can be filtered in those columns. Numeric columns support comparison operators: >, <, >=, and <=, with , for OR and & for AND logic — for example: 2,>3&<8.
Note
Data table filters are temporary and are not saved with the map.
If you have access to the selected program in the Metadata Management app, you can modify the information displayed in the event popup window.
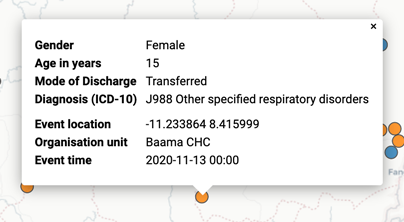
Open the Metadata Management app.
Select Programs.
Click the program you want to modify and select Data or the stage first then Data in the case of a Tracker program.
For every data element you want to display in the popup window, select corresponding Display in reports.
Click Save.
The raw data for event layers can be downloaded in GeoJSON format for more advanced geo-analytics and processing in desktop GIS software such as QGIS. The downloaded data includes all individual events as GeoJSON features, including attributes for each data element selected for Display in reports.
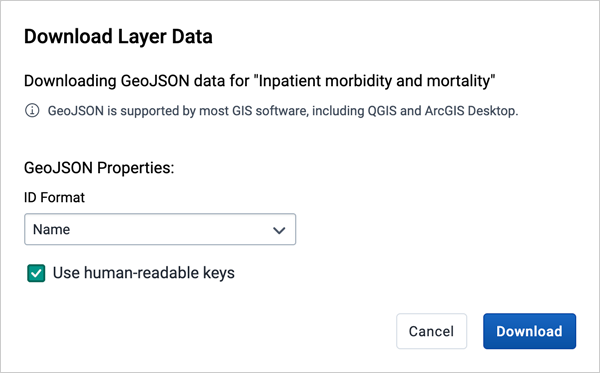
In the layer card to the left, click the more actions (three dots) icon and then click Download data.
Select the ID format to use as the key for data element values in the downloaded GeoJSON file:
Select whether or not to Use human-readable keys for other event attributes, such as Program Stage, Latitude, Longitude, Event Data, and Org Unit ID, Name, and Code. When this option is not selected, these values will be computer-friendly IDs instead of human-readable (translated) names.
Click the Download button to generate and download a GeoJSON file. The data will be requested from the DHIS2 server and processed by the maps application. This operation may take several minutes to complete.
Once the GeoJSON file has been downloaded, it can be imported into most standard GIS software.
Note
The downloaded data does not include style information as it is not natively supported by the GeoJSON format. Styles can optionally be recreated in external GIS applications using the attributes of each feature.
To remove an event layer from the map, in the layer card to the left, click the more actions (three dots) icon and then click Remove layer.
The tracked entity layer displays the geographical location of tracked entities registered in DHIS2. Tracked entities with associated point or polygon coordinates appear on the map.
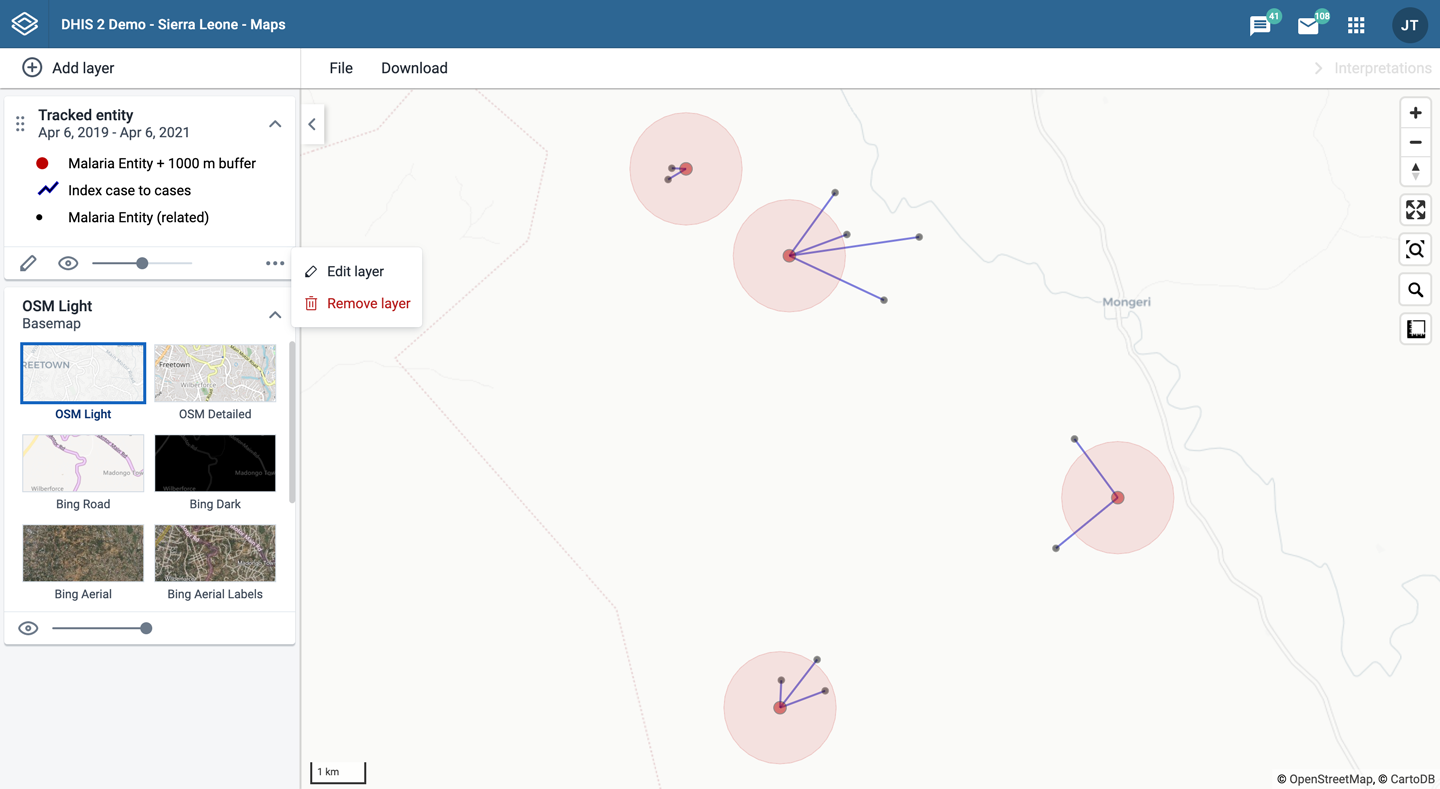
Tracked entity layers are represented by layer cards in the layer panel. The middle of the card shows a legend indicating the styling of the layer.
To create a tracked entity layer, choose Tracked entities on the Add layer selection. This opens the Tracked entity layer configuration dialog.
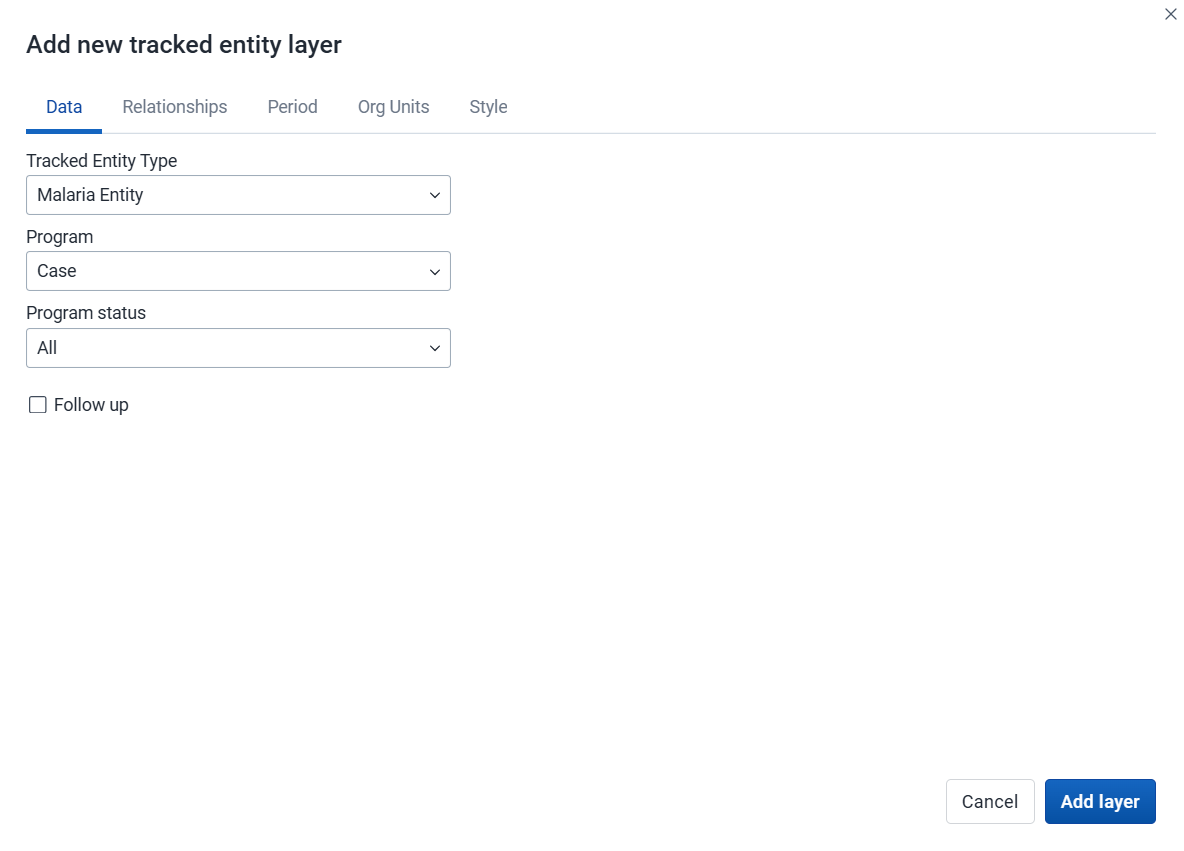
Select the Tracked entity type you want to show on the map.
Select a Program to filter tracked entities by enrollment.
Use the Program status field to select the enrollment status of tracked entities to include: All, Active, Completed, or Cancelled.
Filter by the Follow-up flag to include only tracked entities marked for follow-up.
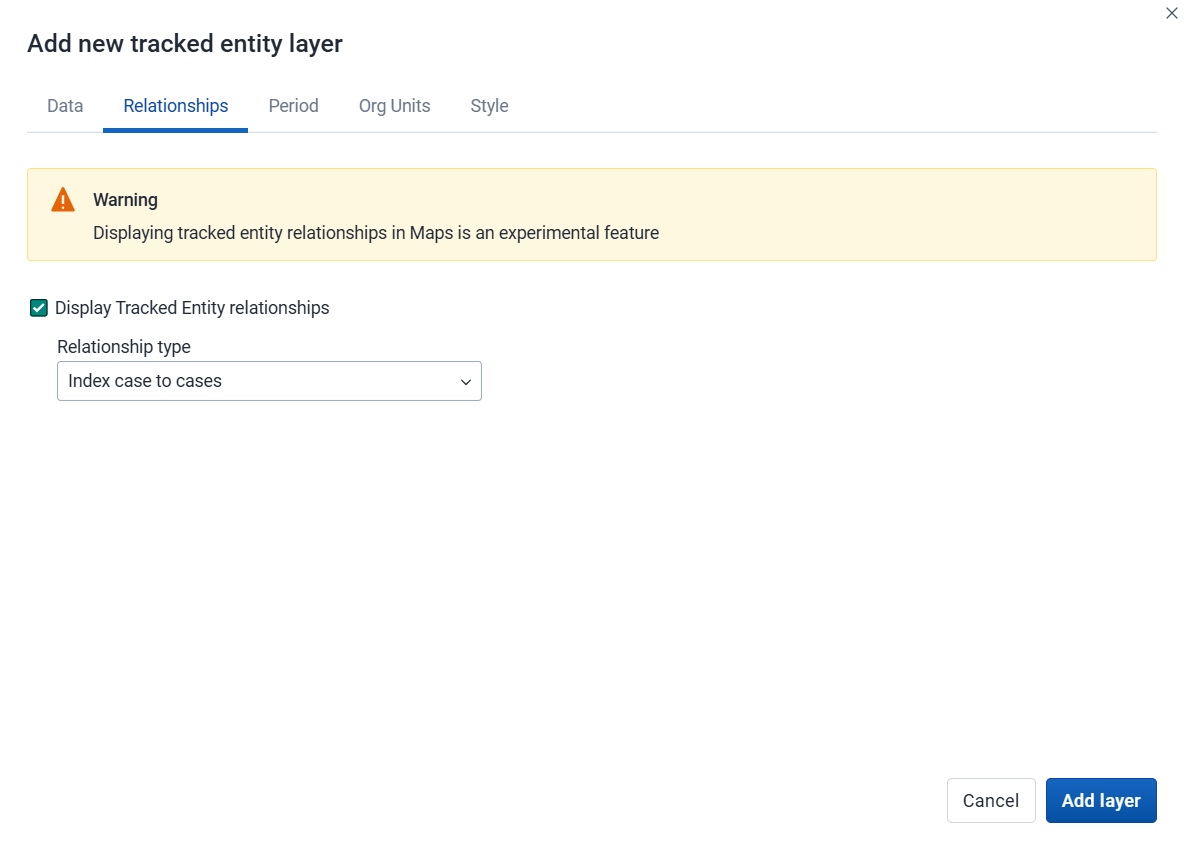
Caution
Displaying tracked entity relationships in Maps is an experimental feature.
Select the Display tracked entity relationships checkbox to show relationships on the map.
Select the Relationship type to display from the dropdown list. Only relationships defined for the selected tracked entity type are available.

If no program is selected, you can set start and end dates for when the tracked entities were last updated.
If a program is selected, you can set the period when tracked entities were last updated or when they were enrolled in the program.
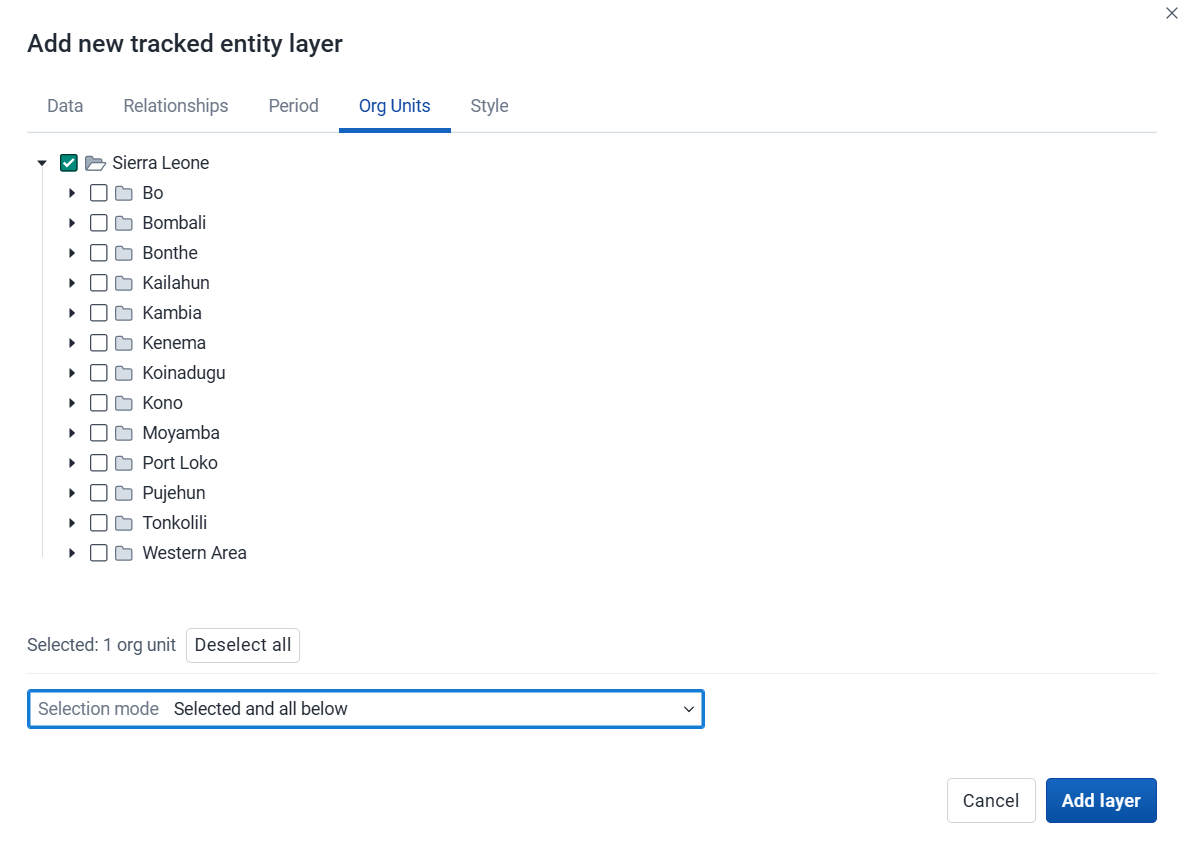
Select the org units you want to include in the layer. Only specific org units can be selected. A selection mode determines how the org unit tree is traversed:
Selected only: Include tracked entities belonging to selected org units only.
Selected and below: Include tracked entities in and right below selected org units.
Selected and all below: Include tracked entities in and all below selected org units.
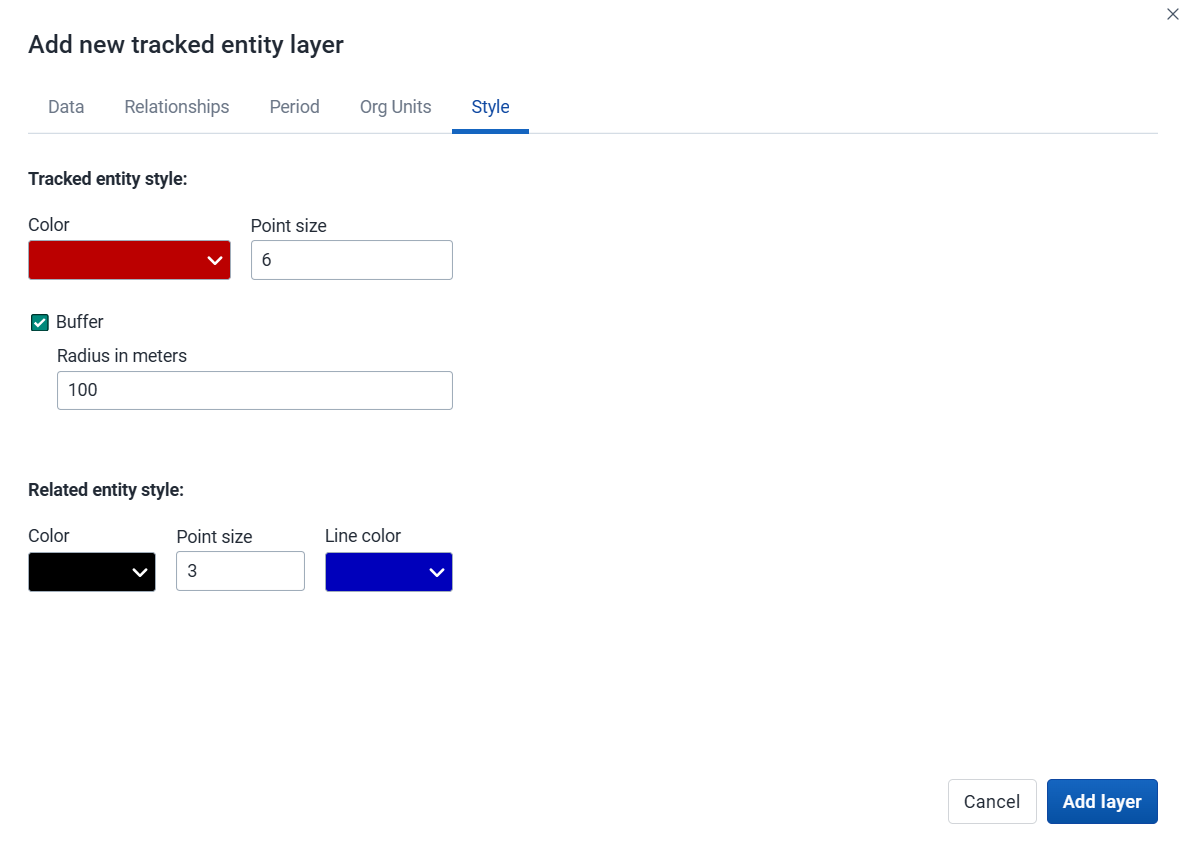
Select a Color for tracked entity points and polygons.
Select the Point size for the points.
Select Buffer to display a visual buffer around each tracked entity. The buffer distance in meters can be modified here.
If a relationship type has been selected on the Relationships tab, you can select a Color and Point size for related tracked entities and a Line color for the relationship lines.
Click Add layer.
In the layer panel, click the edit (pencil) icon on the tracked entity layer card.
Modify the settings on the Data, Relationships, Period, Org units and Style tabs as desired.
Click Update layer.
If you have access to the selected program in the Metadata Management app, you can modify the information displayed in the tracked entity popup window.
Open the Metadata Management app.
Select Program.
Click the program you want to modify and select Enrollment: Data.
For every attribute you want to display in the popup window, enable Display in list.
Click Save.
To remove a tracked entity layer from the map, in the layer card to the left, click the more actions (three dots) icon and then click Remove layer.
The facility layer displays icons representing types of facilities. Only point-type org units are shown - polygon org units such as districts or regions are not displayed.
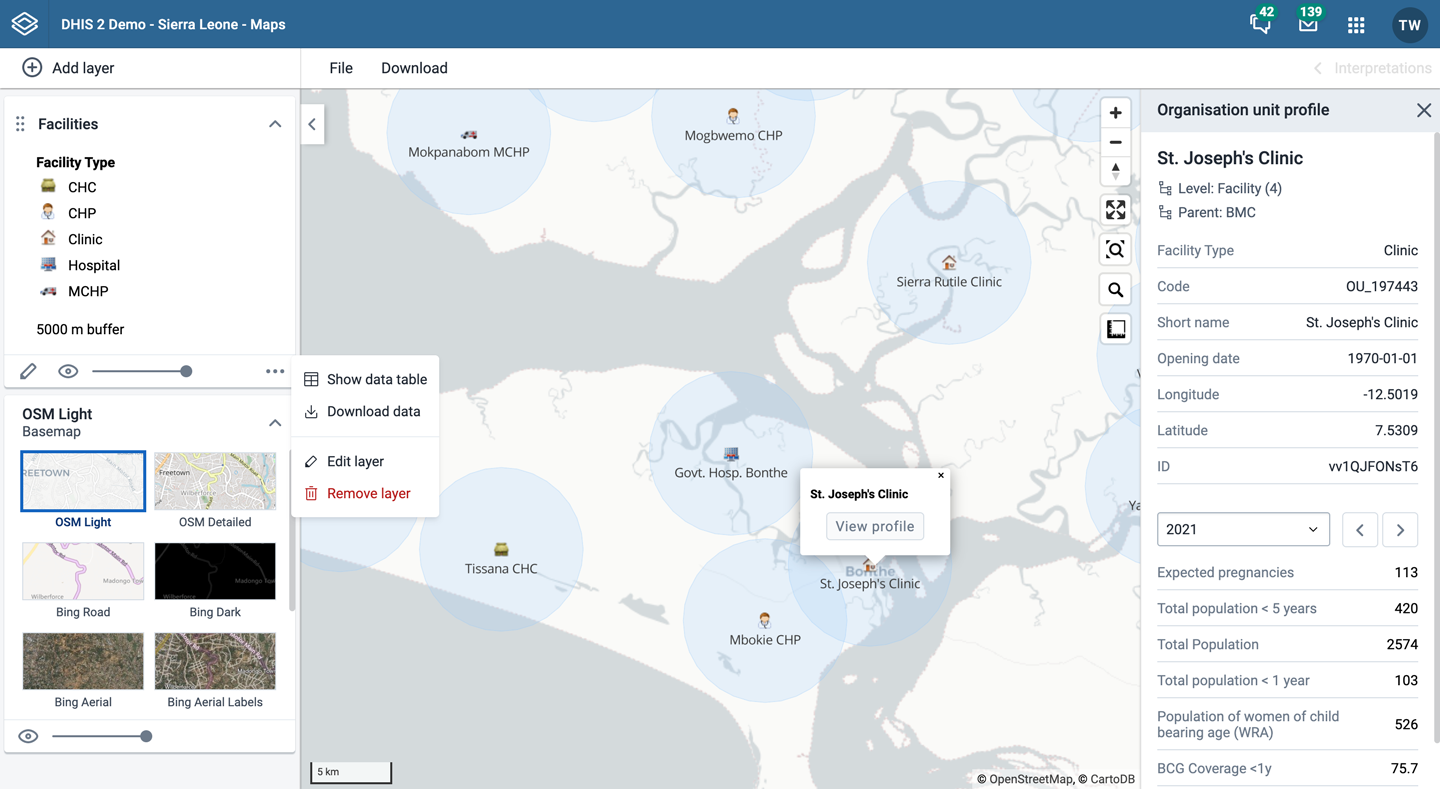
Facility layers are represented by layer cards in the layer panel. The middle of the card shows a legend indicating the group set representation. The more actions (three dots) button includes options to show or hide the data table and to download the data in GeoJSON format.
To create a facility layer, choose Facilities on the Add layer selection. This opens the Facility layer configuration dialog.
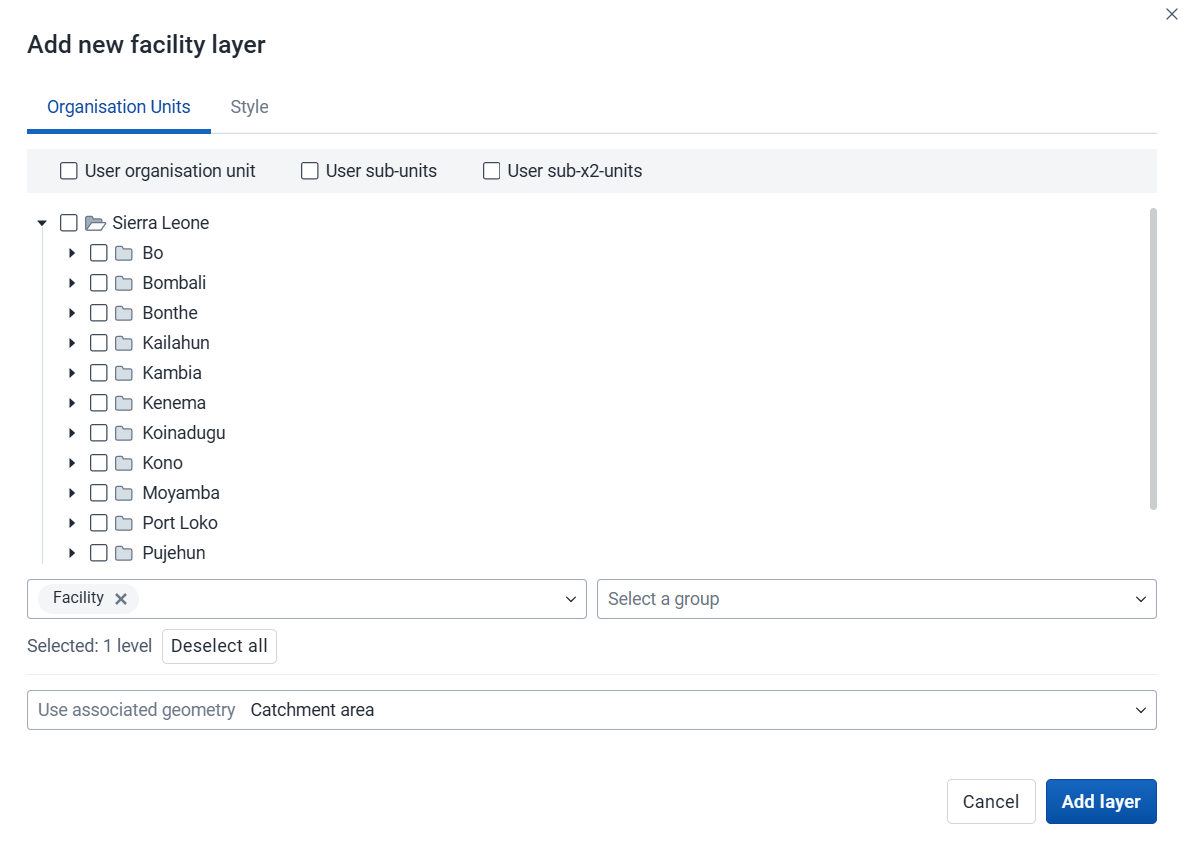
Select the org units you want to include in the layer. You can freely combine specific org units, org unit levels, org unit groups, and relative user org units (User organisation unit, User sub-units, User sub-x2-units). When user org units are selected, the map data will appear according to the assigned org units for each user in the org unit hierarchy. Only org units with a point location are displayed.
Tip: Levels and groups act as filters within the org units you select - combining them will show only org units at those levels or in those groups that are descendants of your selected org units.
The system administrator can set the default org unit level containing facilities in the System Settings app.
Use associated geometry: This dropdown will only show if there are any additional geometries available for your org units. This is typically used to show facility catchment areas.

Labels: Allows labels to be shown on the layer. Font size, weight and color can be modified here.
Buffer: Displays a visual buffer around each facility. The radius of the buffer can be modified here. Not available if associated geometry is used.
Count org units without a point location: Org units without point coordinates are counted and shown in a Data quality section of the legend. They also appear in the data table.
Facilities with a point location can be styled with an org unit group set using different icons. Select a group set from the list of org unit group sets defined for your DHIS2 instance. The system administrator can set the default org unit group set in the System Settings app.
Include unclassified org units: Org units not belonging to any group in the selected group set are shown with a configurable color and label (default: "Unclassified").
If no group set is selected, the facilities will be shown as filled circles. The color and radius can be changed.
Click Add layer.
In the layer panel, click the edit (pencil) icon on the facility layer card.
Modify the settings on the Org units and Style tabs as desired.
Click Update layer.
Facility layers have a Show/hide data table option that can be toggled on or off from the facility layer card.

The data table displays the data associated with the facility layer. Click the arrow buttons in a column header to sort by that column. Type in the filter fields below each column header to filter the displayed rows. The name filter field is an effective way to search for individual facilities.
Note
Data table filters are temporary and are not saved with the map.
You can open the org unit profile in three ways:
Click an org unit on the map, then click the View profile button in the popup.
Right-click one of the org units on the map, and select View profile from the menu.
Click an org unit row in the data table.
To remove a facility layer from the map, in the layer card to the left, click the more actions (three dots) icon and then click Remove layer.
The org unit layer displays the borders and locations of your org units. This layer is particularly useful if you are offline and don't have access to background maps.
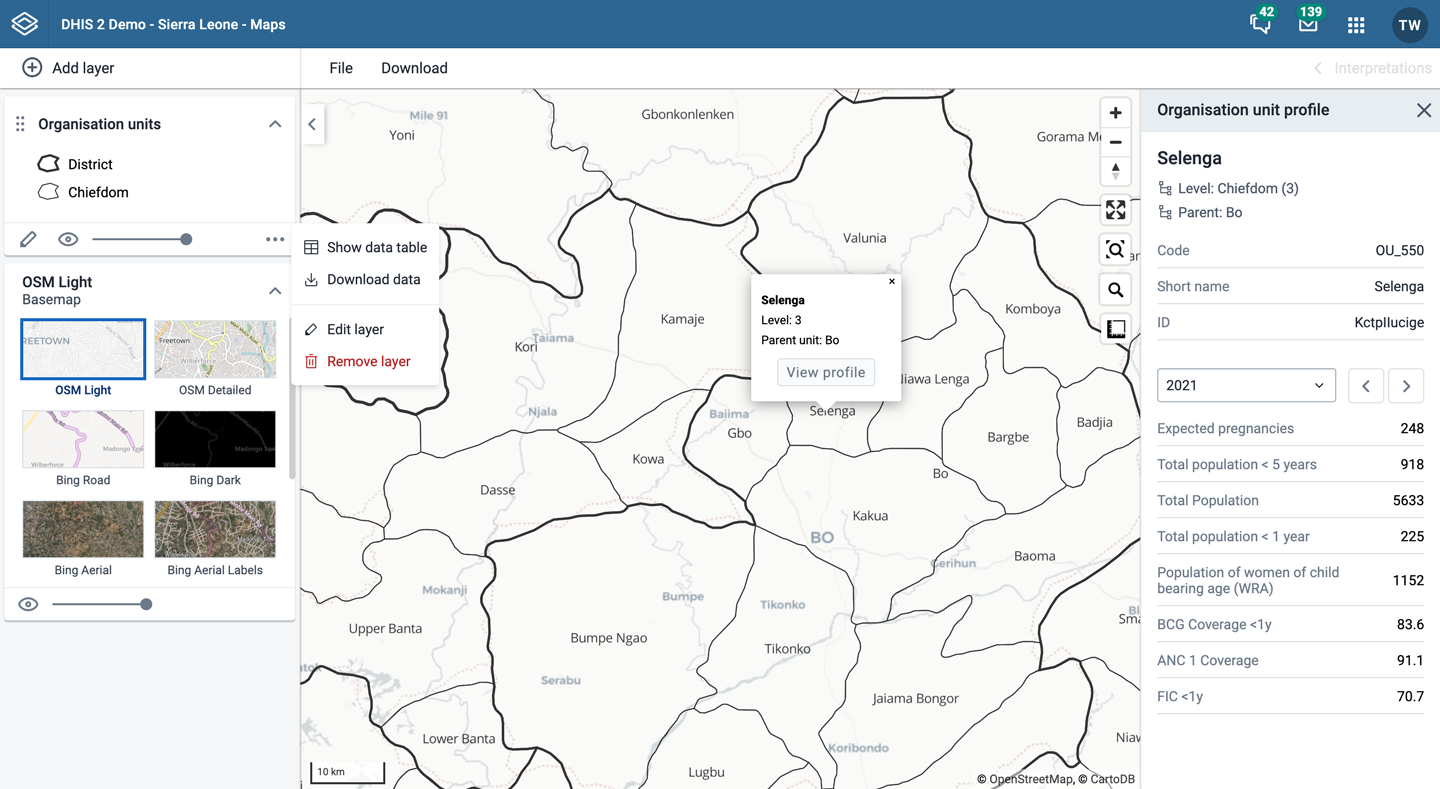
Org unit layers are represented by layer cards in the layer panel. The more actions (three dots) button includes options to show or hide the data table and to download the data in GeoJSON format.
To create an org unit layer, choose Org units on the Add layer selection. This opens the Org unit layer configuration dialog.
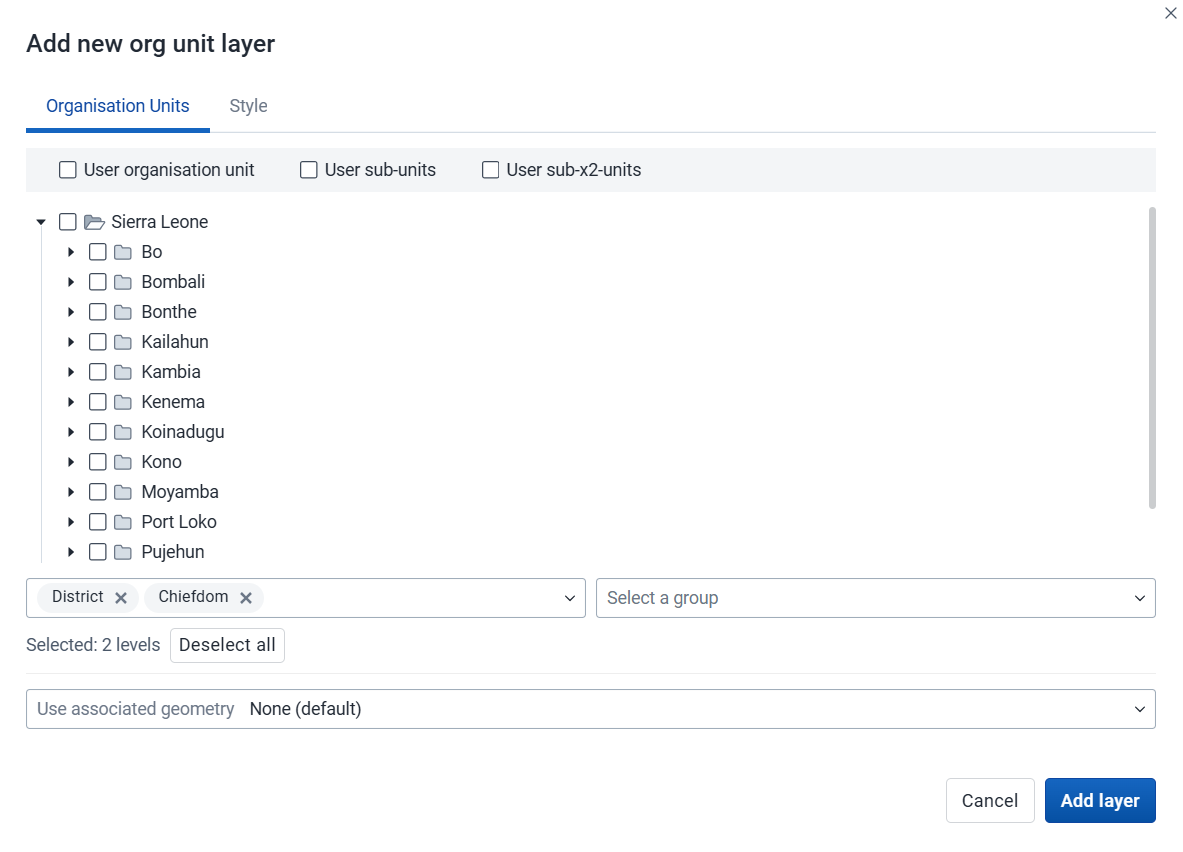
Select the org units you want to include in the layer. You can freely combine specific org units, org unit levels, org unit groups, and relative user org units (User organisation unit, User sub-units, User sub-x2-units). When user org units are selected, the map data will appear according to the assigned org units for each user in the org unit hierarchy.
Tip: Levels and groups act as filters within the org units you select - combining them will show only org units at those levels or in those groups that are descendants of your selected org units.
Use associated geometry: This dropdown will only show if there are any additional geometries available for your org units. This is typically used to show facility catchment areas.

Labels: Allows labels to be shown on the layer. Font style can be modified here.
Boundary color: Allows the boundary or outline color of the org units to be changed.
Point radius: Sets the base radius when point type elements, such as facilities, are presented on the org unit layer.
Count org units without coordinates: Org units without coordinates are counted and shown in a Data quality section of the legend. They also appear in the data table.
Org units with coordinates can be styled with an org unit group set using different colors. Select a group set from the list of org unit group sets defined for your DHIS2 instance.
Include unclassified org units: Org units not belonging to any group in the selected group set are shown with a configurable color and label (default: "Unclassified").
Click Add layer.
In the layer panel, click the edit (pencil) icon on the org unit layer card.
Modify the settings on the Org units and Style tabs as desired.
Click Update layer.
Org unit layers have a Show/hide data table option that can be toggled on or off from the org unit layer card.

The data table displays the data associated with the org unit layer. Click the arrow buttons in a column header to sort by that column. Type in the filter fields below each column header to filter the displayed rows. The name filter field is an effective way to search for individual org units.
The level column supports numeric filtering using comparison operators: >, <, >=, and <=, with , for OR and & for AND logic — for example: 2,>3&<8.
Note
Data table filters are temporary and are not saved with the map.
You can open the org unit profile in three ways:
Click an org unit on the map, then click the View profile button in the popup.
Right-click one of the org units on the map, and select View profile from the menu.
Click an org unit row in the data table.
When there are visible org units on the map, you can navigate up and down in the hierarchy without changing the org unit selection.
Right-click one of the org units.
Select Drill up one level or Drill down one level.
The drill down option is disabled if you are on the lowest level. Likewise, the drill up option is disabled from the highest level.
To remove an org unit layer from the map, in the layer card to the left, click the more actions (three dots) icon and then click Remove layer.
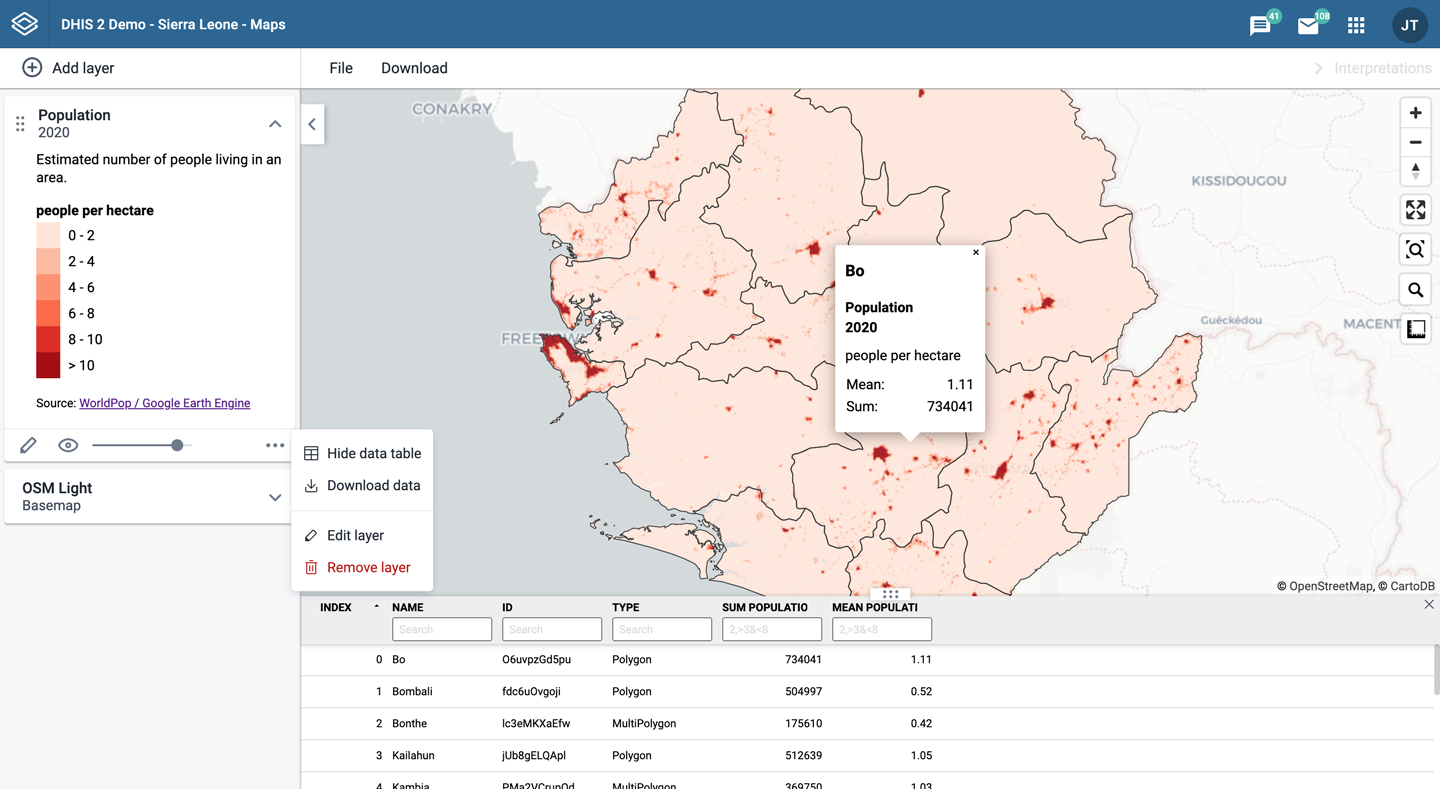
Google Earth Engine layers are enabled if a Google Earth Engine API key has been configured for your system. Contact your system administrator if you need access to these layers.
The layers from Google Earth Engine let you display and aggregate external data for your org units. Aggregated values can be viewed either in popups or in the data table.
Earth Engine layers are represented by layer cards in the layer panel. The more actions (three dots) button includes an option to show or hide the data table.
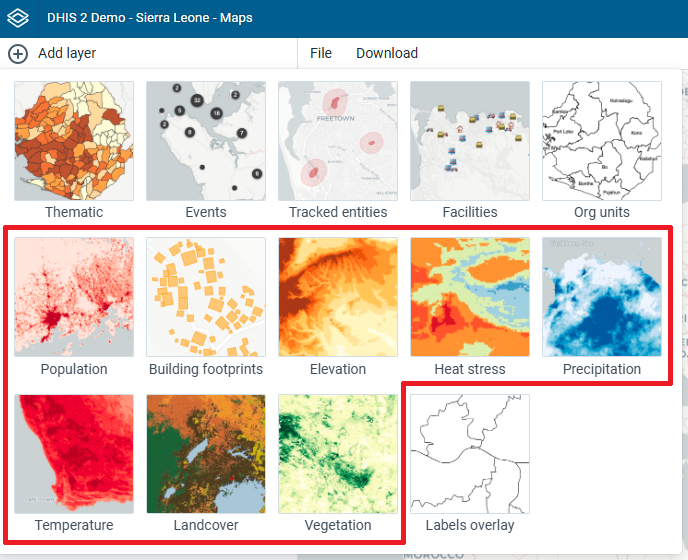
Note
The Maps app administrator can configure available layer sources.
The following layer sources are supported (sources marked with an asterisk "*" are available by default):
Population (group): Detailed population data from WorldPop. Estimates are provided annually and include current, historical, and projected population values. Available between 2015 and 2030.
Building footprints *: The outlines of buildings derived from high-resolution satellite imagery. Only for sub-Saharan Africa, South and Southeast Asia, Latin America and the Caribbean.
Elevation *: Elevation above sea level.
Heat stress (group): Universal Thermal Climate Index (UTCI), a measure of the thermal stress experienced by a person in a given environment. Available from 1950.
Humidity (group): Relative humidity is the amount of water vapour present in air. Available from 1950.
Precipitation (group): Accumulated water that falls to the surface. Combines model data with observations from across the world. Two sources are available:
Temperature (group): Temperature at 2m above the surface. Combines model data with observations from across the world. Available from 1950.
Land cover *: 17 distinct landcover types collected from satellites by NASA. Available yearly, between 2001 and 2022.
Vegetation: Normalized difference vegetation index (NDVI) and Enhanced Vegetation Index (EVI), used to quantify vegetation greenness. Collected from satellites by NASA. Available at 16-day intervals, from 2000.
To create an Earth Engine layer, choose the desired layer from the Add layer selection. This opens the layer configuration dialog.

Dataset (if within a data group):
Data subset:
Select the spatial aggregation methods to use when calculating values for the selected org units. This only affects results in popups and the data table (some options might not be available depending on the layer source).
Sum: Calculates the total number within each org unit. Recommended to use for the population layers.
Min: Returns the minimum value in the layer unit displayed below the selection. For population layers it will be the minimum people per hectare. For the elevation layer it will return the lowest elevation (meters above sea level).
Max: Returns the maximum value in the layer unit. For population layers it will be the maximum people per hectare. For the elevation layer it will return the highest elevation for each org unit.
Mean: Returns the mean value in the layer unit. For population layers it will be the mean people per hectare. For the precipitation layer it will be the mean rainfall in millimeters across the org unit.
Median: Returns the median value in the layer unit. For population layers it will be the median people per hectare. For the temperature layer it will be the median °C across the org unit.
Standard deviation: Returns the standard deviation value in the layer unit.
Variance: Returns the variance value in the layer unit.
Special cases:

Select the period type (if multiple sources are enabled for Heat stress, Precipitation, Temperature, or Vegetation).
Select the period for the data source. The available periods are set by the layer source. Some sources are only available at a single point in time.
Select the org units where you want to see aggregated data values. You can freely combine specific org units, org unit levels, org unit groups, and relative user org units (User organisation unit, User sub-units, User sub-x2-units). When user org units are selected, the map data will appear according to the assigned org units for each user in the org unit hierarchy.
Tip: Levels and groups act as filters within the org units you select - combining them will show only org units at those levels or in those groups that are descendants of your selected org units.
Use associated geometry: This dropdown will only show if there are any additional geometries available for your org units. This is typically used to calculate values for facility catchment areas.
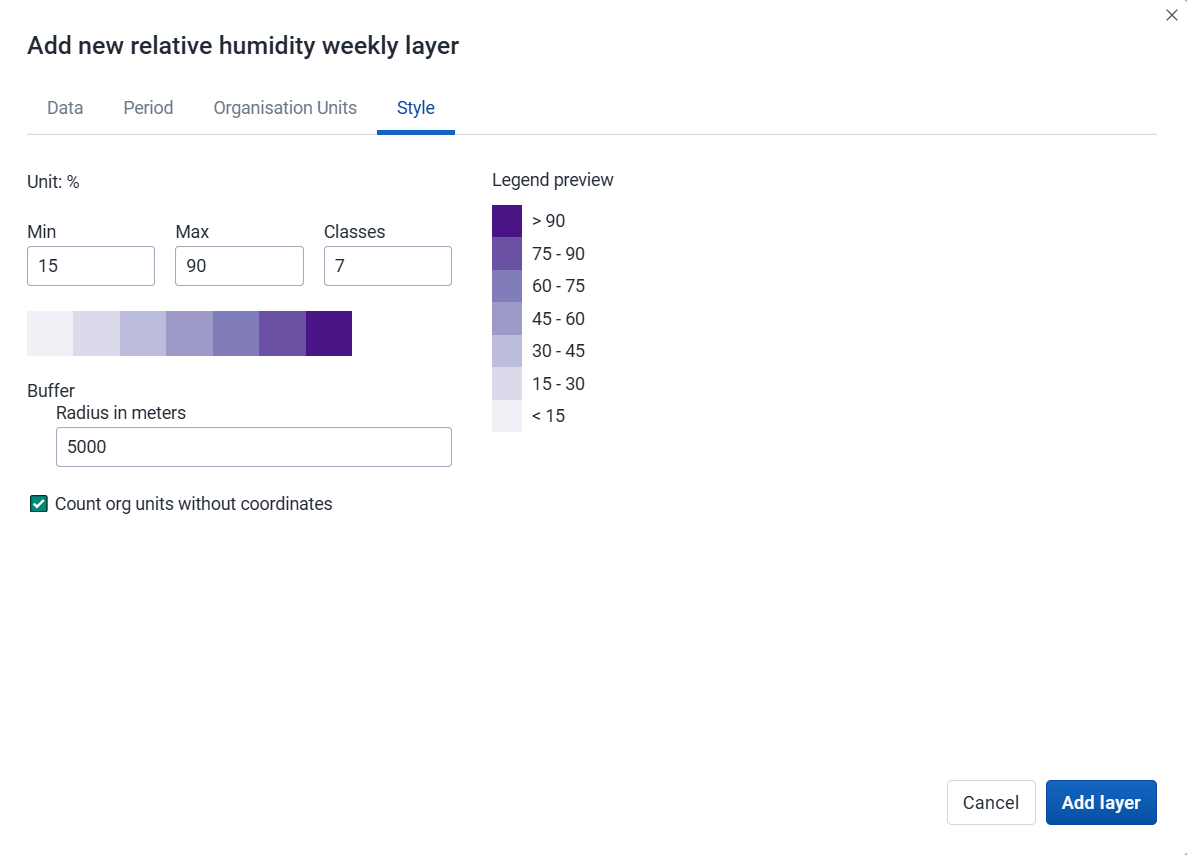
Adjust the legend Min, Max, number of Classes, and color map, as desired.
Buffer: If you select org units with a single point coordinate (facilities), you can set a radius buffer to calculate the data value within. A radius of 5000 meters will aggregate all values available within a 5 km distance from a facility. Buffer option is not available if associated geometry is used.
Count org units without coordinates: Org units without coordinates are counted and shown in a Data quality section of the legend. They also appear in the data table.
Click Add layer.
Click an org unit or facility on the map to see the aggregation result.
In the layer panel, click the edit (pencil) icon on the Earth Engine layer card.
Modify the settings on the Data, Period, Org units, and Style tabs as desired.
Click Update layer.
Earth Engine layers have a Show/hide data table option that can be toggled on or off from the layer card.

The data table displays all the aggregated values for the selected org units. Click the arrow buttons in a column header to sort by that column. Type in the filter fields below each column header to filter the displayed rows.
There is one column for each selected aggregation type. These numeric columns support comparison operators: >, <, >=, and <=, with , for OR and & for AND logic — for example: 2,>3&<8.
Note
Data table filters are temporary and are not saved with the map.
You can open the org unit profile in three ways:
Click an org unit on the map, then click the View profile button in the popup.
Right-click one of the org units on the map, and select View profile from the menu.
Click an org unit row in the data table.
To remove an Earth Engine layer from the map, in the layer card to the left, click the more actions (three dots) icon and then click Remove layer.
External map layers are represented as either basemaps or overlays.
Note
The Maps app administrator can add external map layers.
Basemaps
These are available in the basemap card in the layers panel and are selected as any other basemap.
Overlays
These are available in the Add layer selection. Unlike basemaps, overlays can be placed above or below any other overlay layers.
Overlay layers are represented by additional layer cards in the layer panel.
Along the top of the overlay card from left to right are:
A grab field to allow dragging and re-ordering layers with the mouse
The title of the external map layer
An arrow symbol to collapse or expand the overlay card
In the middle of the card is a legend if the layer has one.
Along the bottom of the overlay card from left to right are:
A slider for modifying the layer transparency
A delete icon to remove the layer from the current map
If you add a GeoJSON external layer to your map, you will have a few style choices:
Once the GeoJSON layer is displayed, you can view its data table:
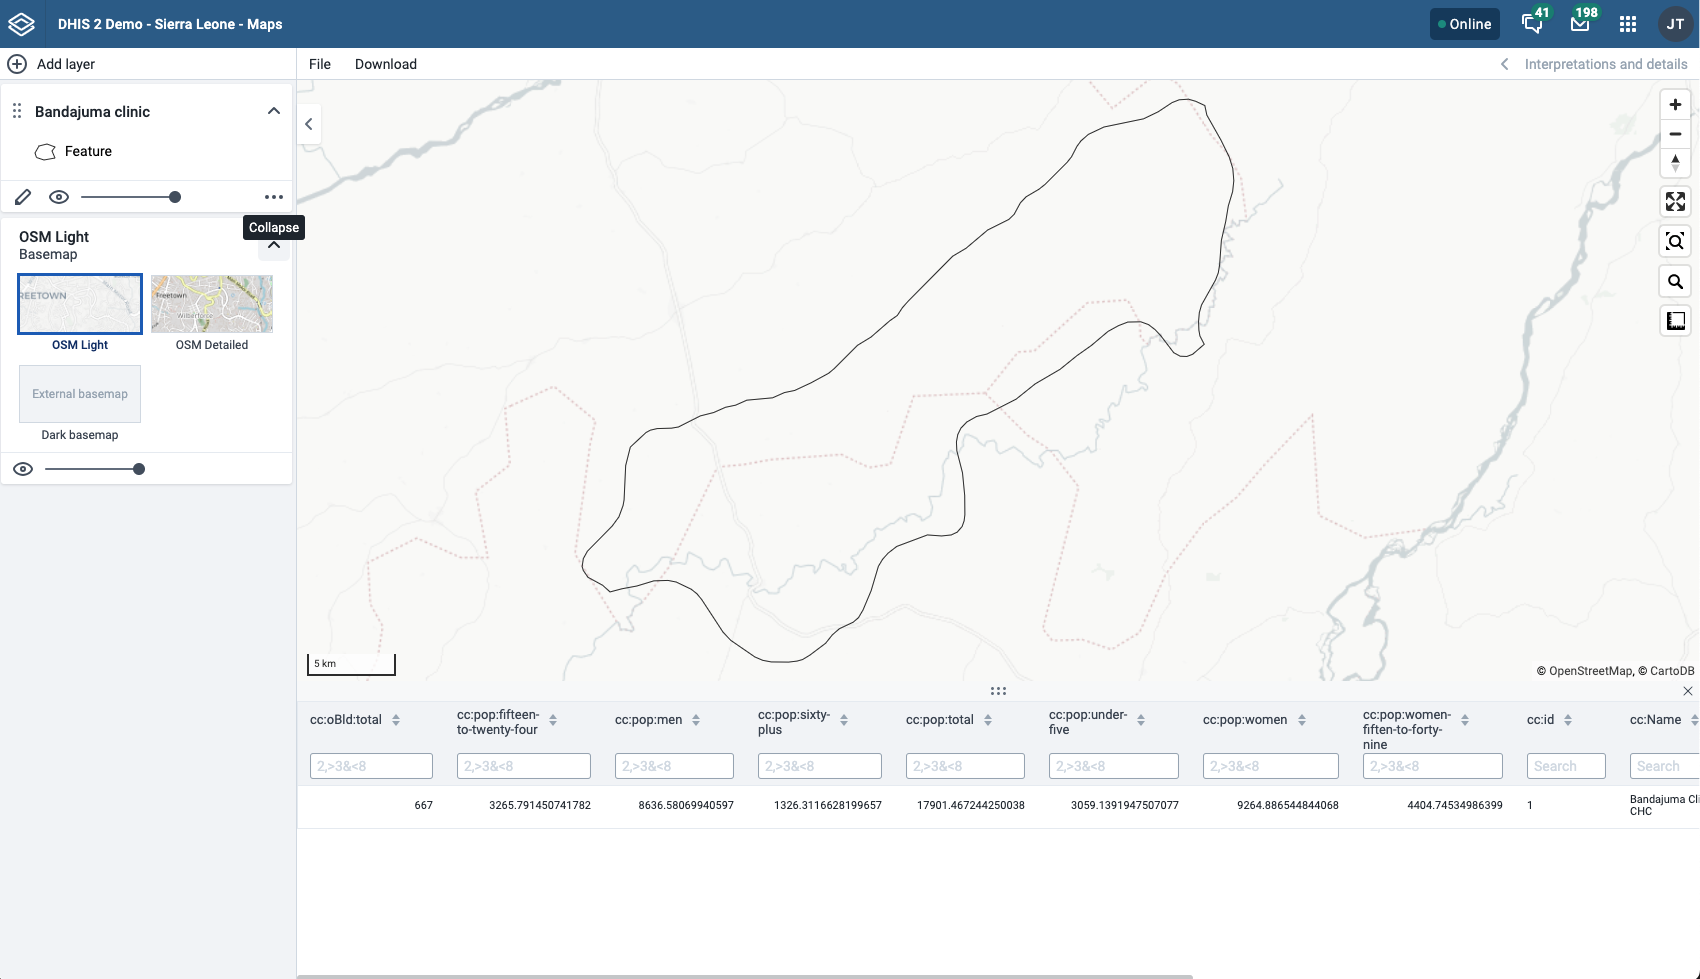
As with other layers, you can sort and filter the data. If you want to view the data for one row, click the row to open the Feature Profile:
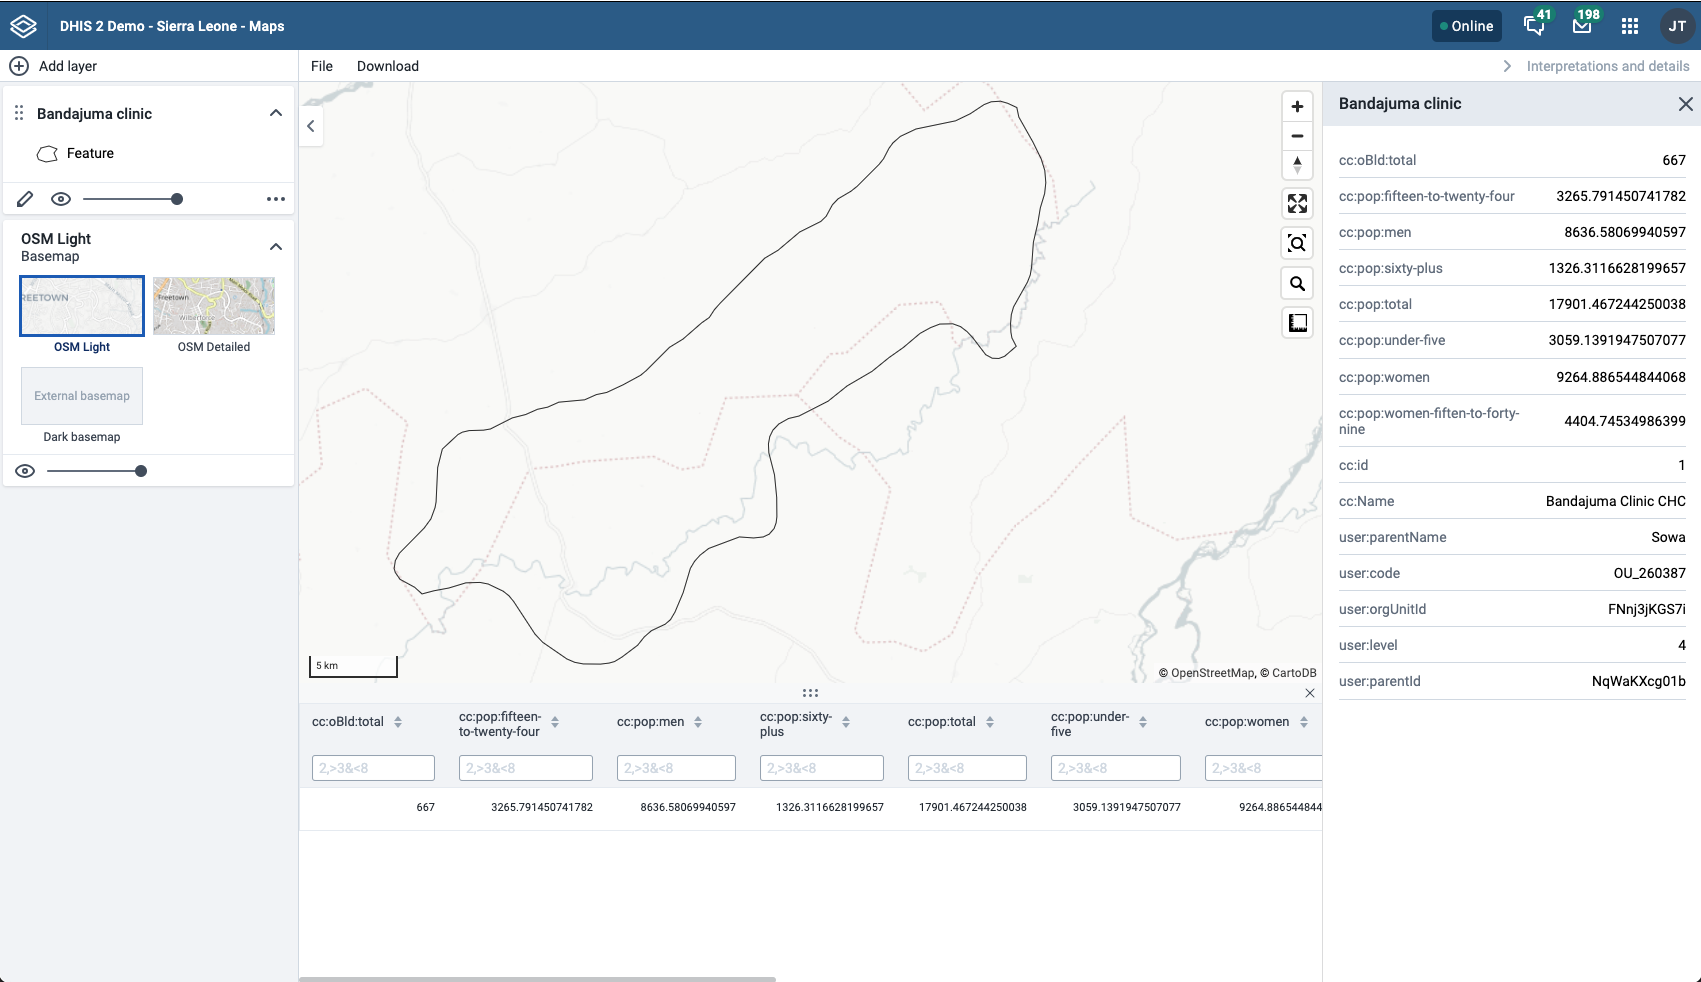
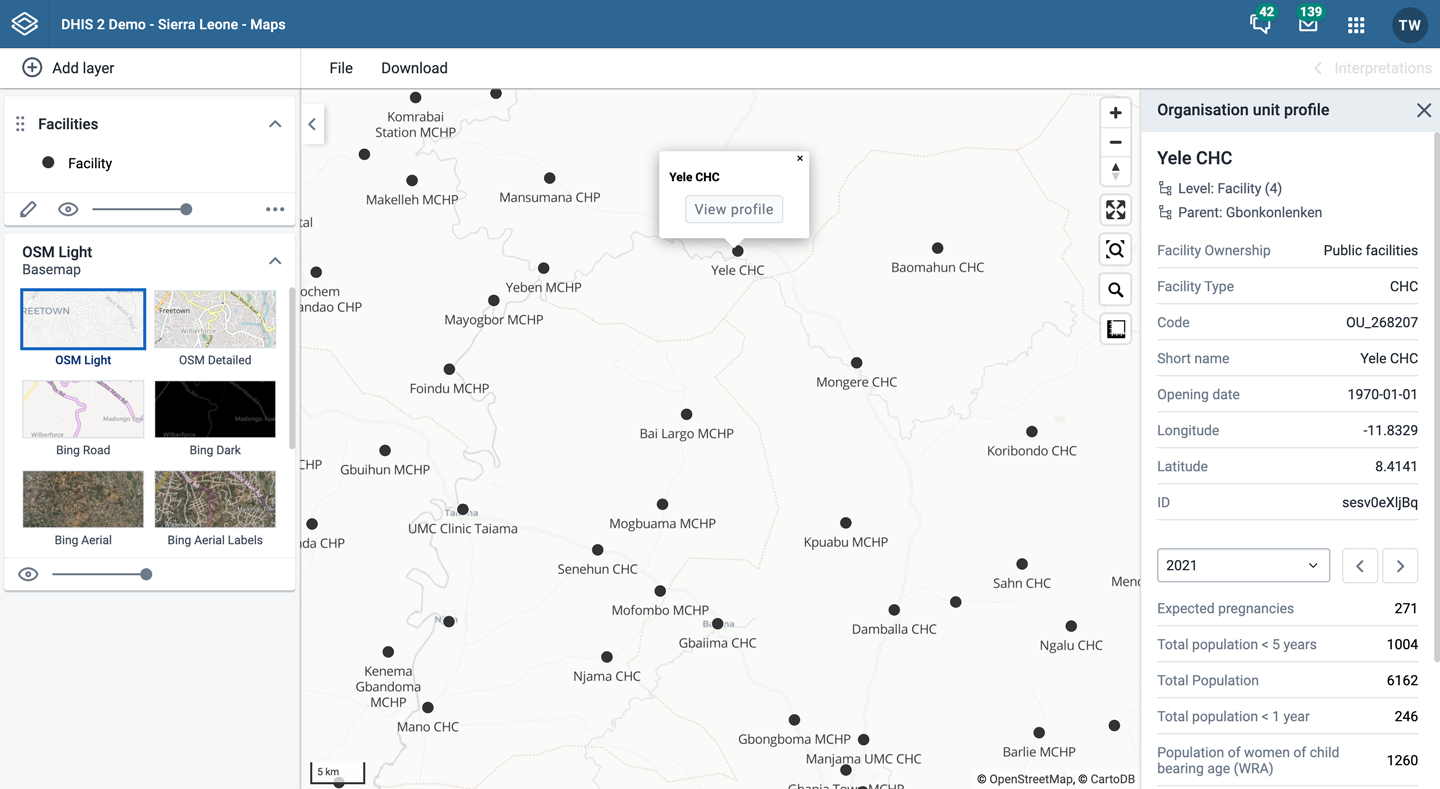
The org unit profile shows detailed information about each org unit. You can open the profile from org unit layers, facility layers, thematic layers, and Earth Engine layers.
You can open the org unit profile in three ways:
Click an org unit on the map, then click the View profile button in the popup.
Right-click one of the org units on the map, and select View profile from the menu.
Click an org unit row in the data table.
The profile will show on the right side of the map. The profile content is set by the system administrator.
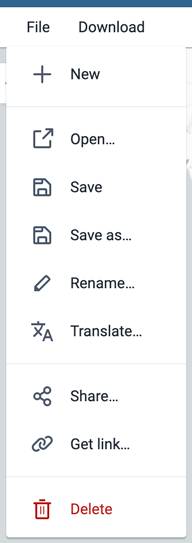
Use the File menu to manage your maps. Several menu items will be disabled until you open or save a map.
Saving your maps makes it easy to restore them later. It also gives you the opportunity to share them with other users as an interpretation or add them to a dashboard. You can save all types of layer configurations as a saved map.
Click File > New.
Note
This will discard the current map without saving.
Click File > Open. A dialog box opens with a list of maps.
Find the saved map you want to open. You can either use \< and > or the search field to find a saved map. The list is filtered on every character that you enter. You can filter the list by selecting Show all, Created by me or Created by others.
Click the name of the map you want to open.
When you have created a map it is convenient to save it for later use:
Click File > Save.
Enter a Name (required) and a Description (optional) the first time you save a map.
Click Save.
Click File > Save as...
Enter a Name (required) and a Description (optional) for the map.
Click Save.
Click File > Rename.
Enter a new Name and/or Description for your map.
Click Rename. The map is updated.
Click File > Translate.
Select the Locale (language) for your translation.
Enter a translated Name and Description. The original text will show below the field.
Click Save.
After you have created a map and saved it, you can share the map with everyone or a user group. To modify the sharing settings:
Click File > Share. The sharing settings dialog opens.
Give access to a user or group: In the text box, search for the name of the user or group you want to share your saved map with and select it.
Select the access level and click Give access.
Repeat the step to add more users or groups.
Users and groups that currently have access: For each user or group, choose the access level. The options are:
No access: The public won't have access to the map. This setting is only applicable to All users.
View only: Users can view but not edit the map.
View and edit: Users can view and edit the map.
Remove access: Remove the access for groups or individuals.
Click Close to close the dialog.
Click File > Get link. A link dialog opens.
Copy the link.
Click File > Delete. A confirmation dialog is displayed.
Click Delete to confirm that you want to delete the saved map. Your map is deleted and the layers are cleared from the view.
An interpretation is a description of a map for a given period. This information is also visible in the Dashboard app. Click Interpretations and details in the top right of the workspace to open the interpretations panel. The button is only available when the map has been saved.
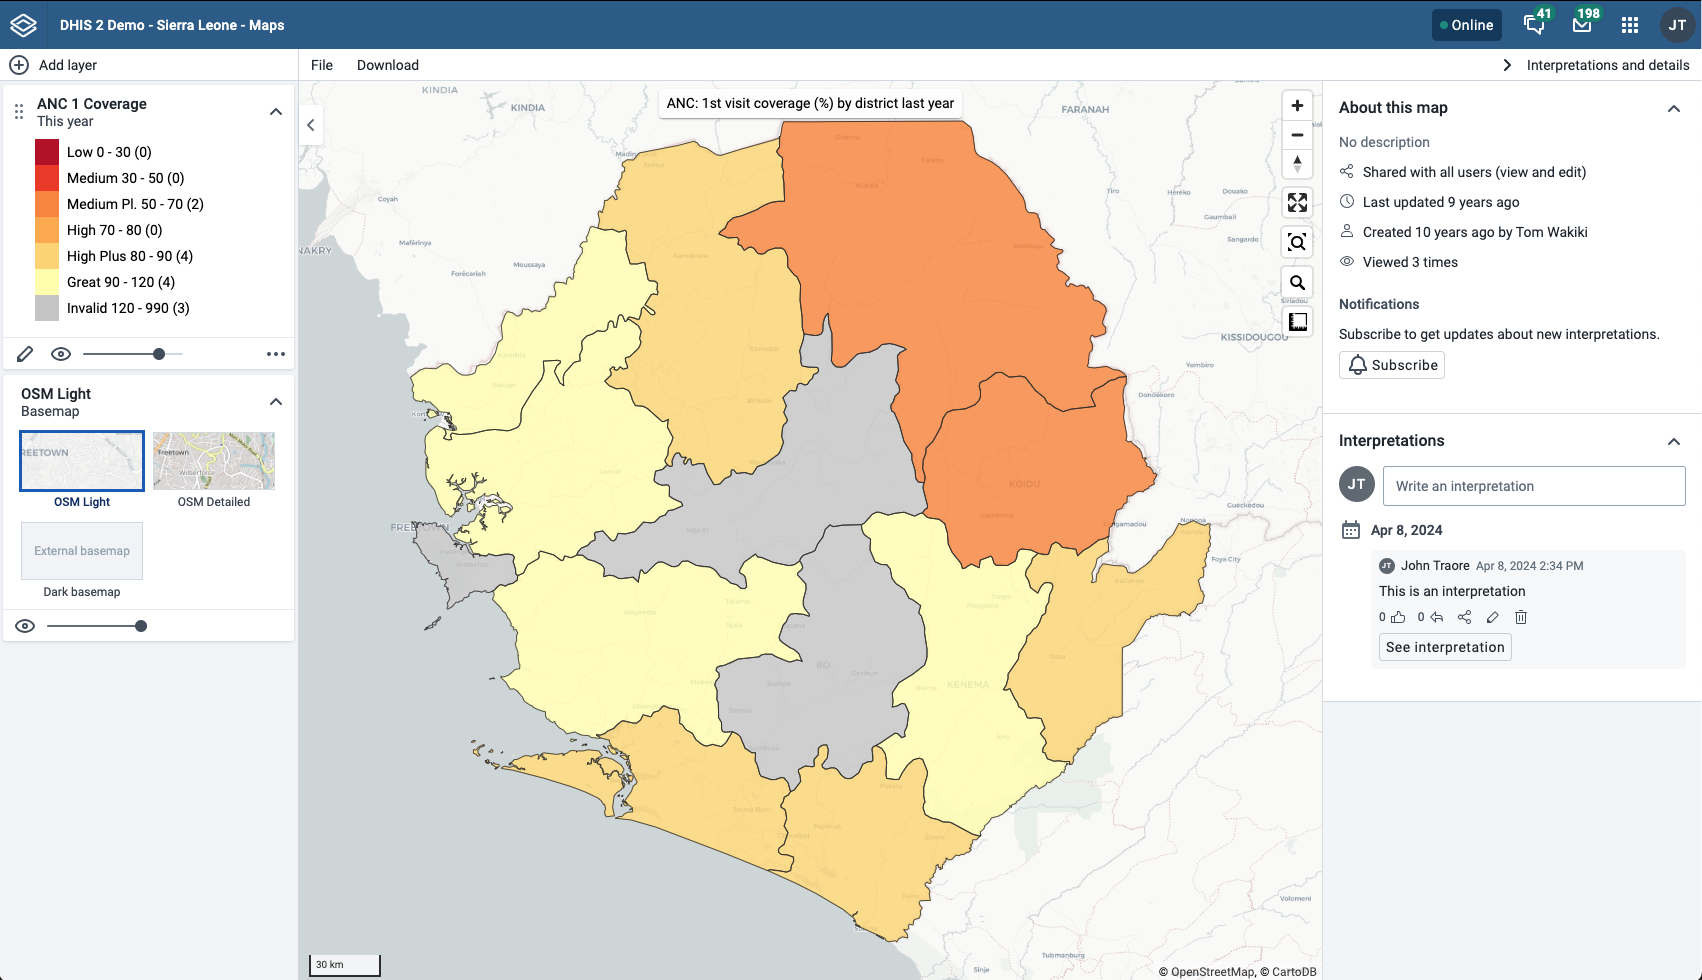
To view interpretations for relative periods, such as a year ago:
Open a saved map with interpretations.
Click Interpretations and details in the top right of the workspace to open the interpretations panel.
Click See interpretation. Your map displays the data and the date based on when the interpretation was created. To view other interpretations, click them.
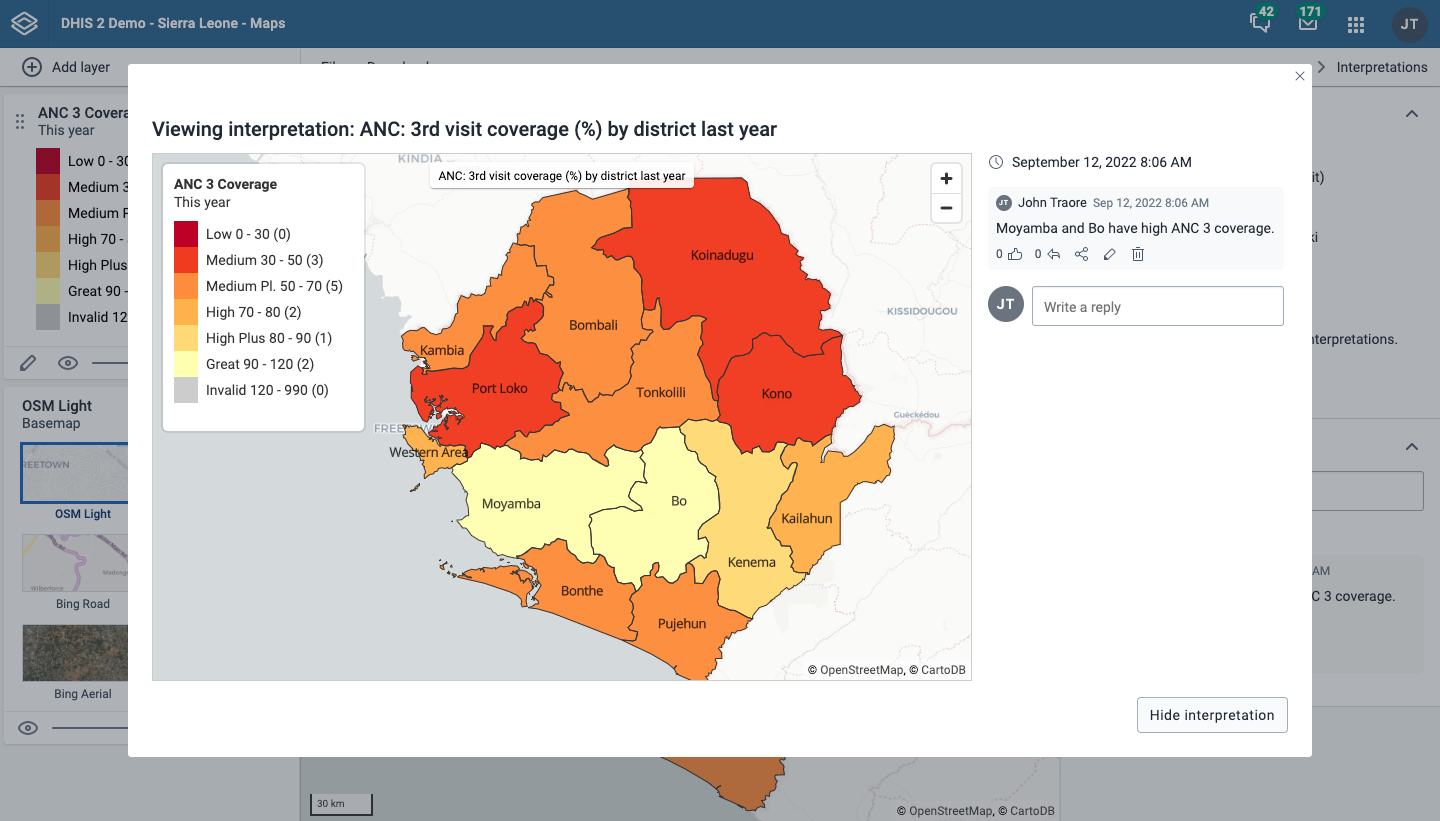
To create an interpretation, you first need to create a map and save it. If you've shared your map with other people, the interpretation you write is visible to those people.
Open a saved map.
Click Interpretations and details in the top right of the workspace to open the interpretations panel.
A text field appears where you can write an interpretation.
In the text field, type a comment, question or interpretation. You can also mention other users with '@username'. Start by typing '@' followed by the first letters of the username or real name, and a list of matching users will appear. Mentioned users will receive an internal DHIS2 message with the interpretation or comment. You can see the interpretation in the Dashboard app.
Click Post interpretation to save the interpretation.
Click an interpretation (see how to view an interpretation above).
Click the share icon below the interpretation. The sharing settings dialog opens.
Search for and add users and user groups that you want to share your map with, and set the access level. Click Give access.
Change the access level for the users you want to modify:
No access: The public won't have access to the map. This setting is only applicable to All users.
View only: Users can view but not edit the map.
View and edit: Users can view and edit the map.
Remove access: Remove the access for groups or individuals.
Click Close when sharing settings are updated.
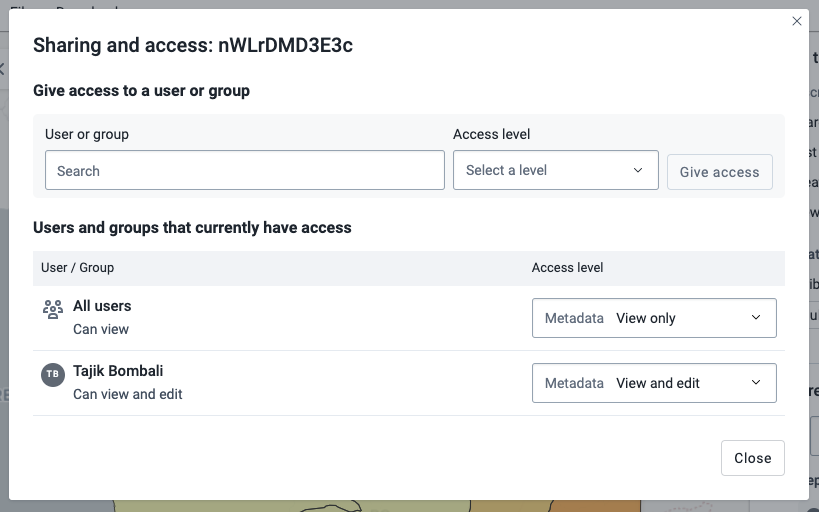
You can download your map as an image by clicking the Download button in the top menu.
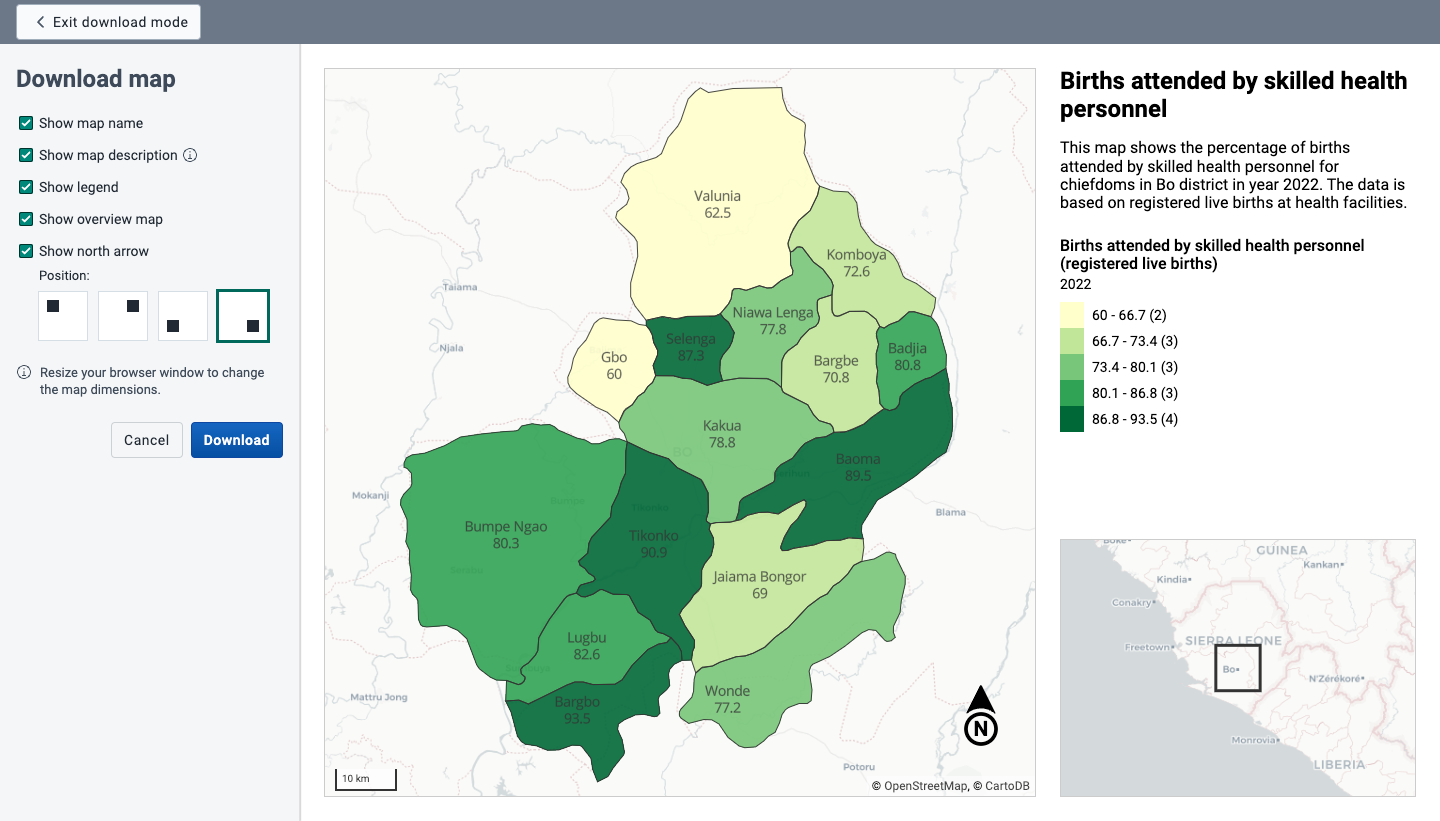
You will enter Download mode where you can adjust the map layout before you download the image. The left column gives you the following options:
Click Download to download your map.
Resize your browser window to change the map dimensions. You can also reposition both the main map and the overview map.
The place search function allows you to search for almost any location or address. This is useful to locate sites, facilities, villages or towns on the map.
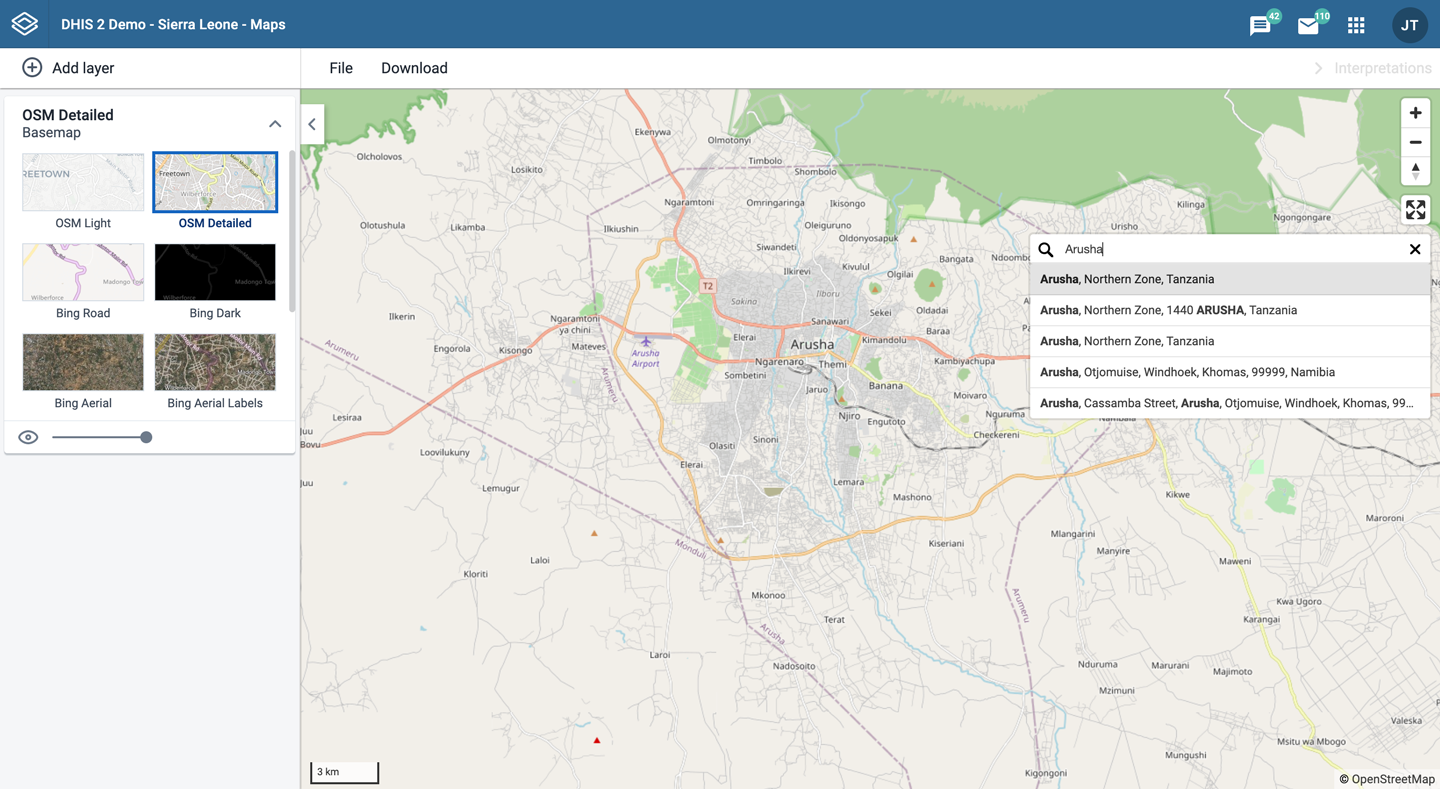
On the right side of the Maps window, click the magnifier icon.
Type the location you're looking for.
A list of matching locations appear as you type.
From the list, select a location. A pin indicates the location on the map.
In the upper left part of the map, put the cursor on the Measure distances and areas (ruler) icon and click Create new measurement.
Add points to the map.
Click Finish measurement.
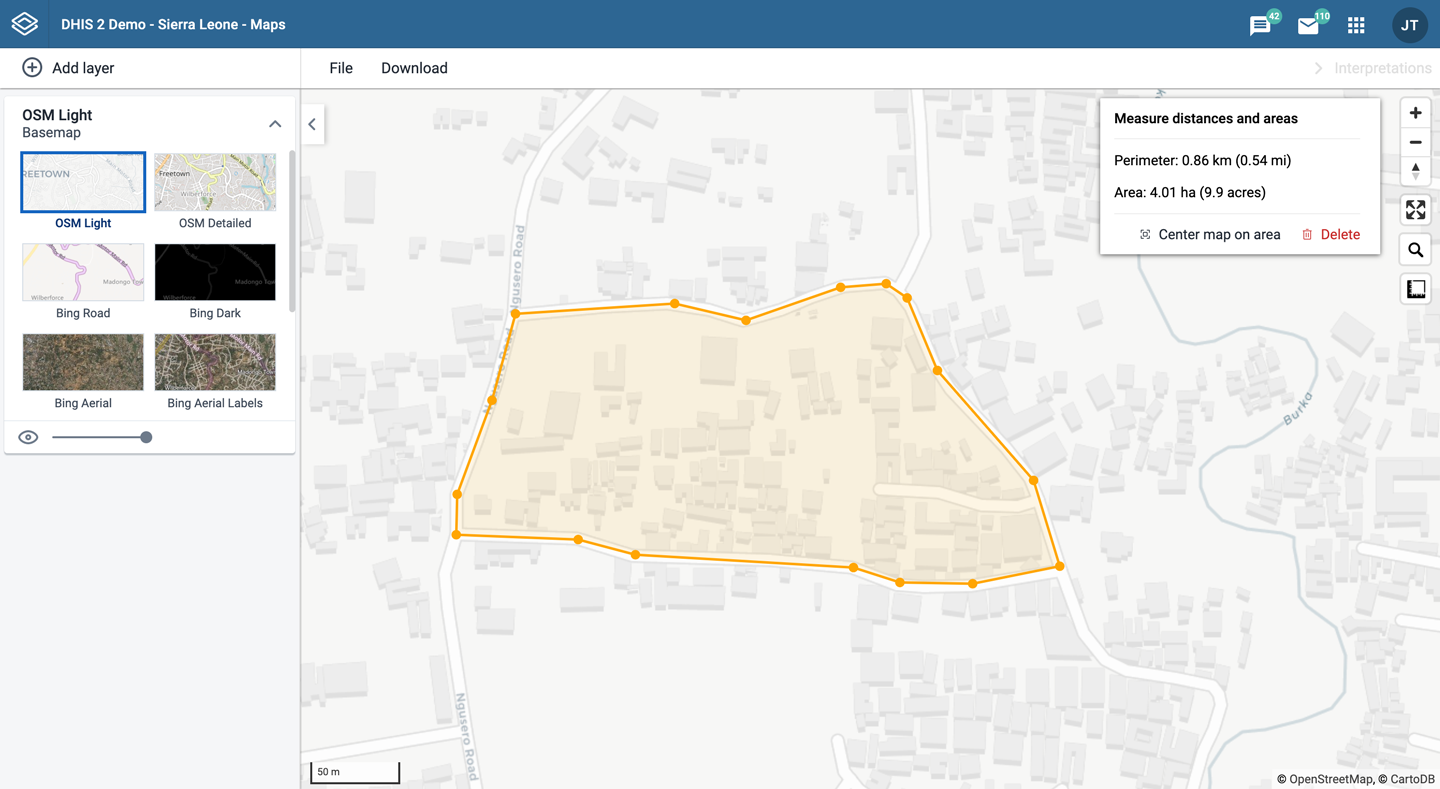
Right-click a point on the map and select Show longitude/latitude. The values are displayed in a popup window.
A Maps app administrator can be defined by the system administrator assigning the F_EXTERNAL_MAP_LAYER_PUBLIC_ADD authority.
The Maps app administrator is able to:
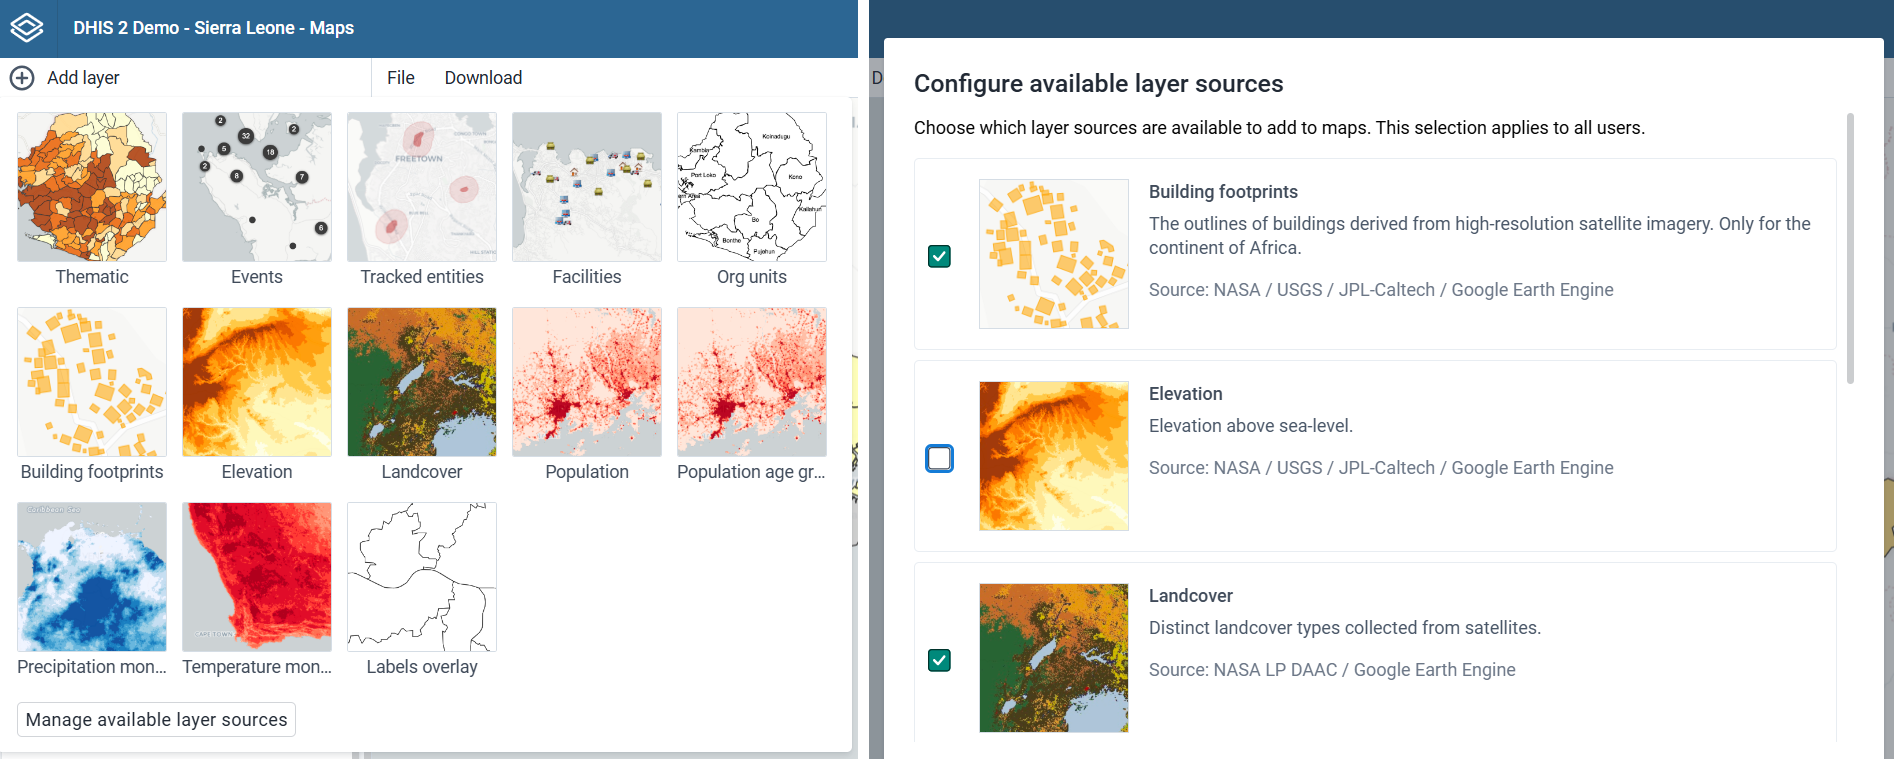
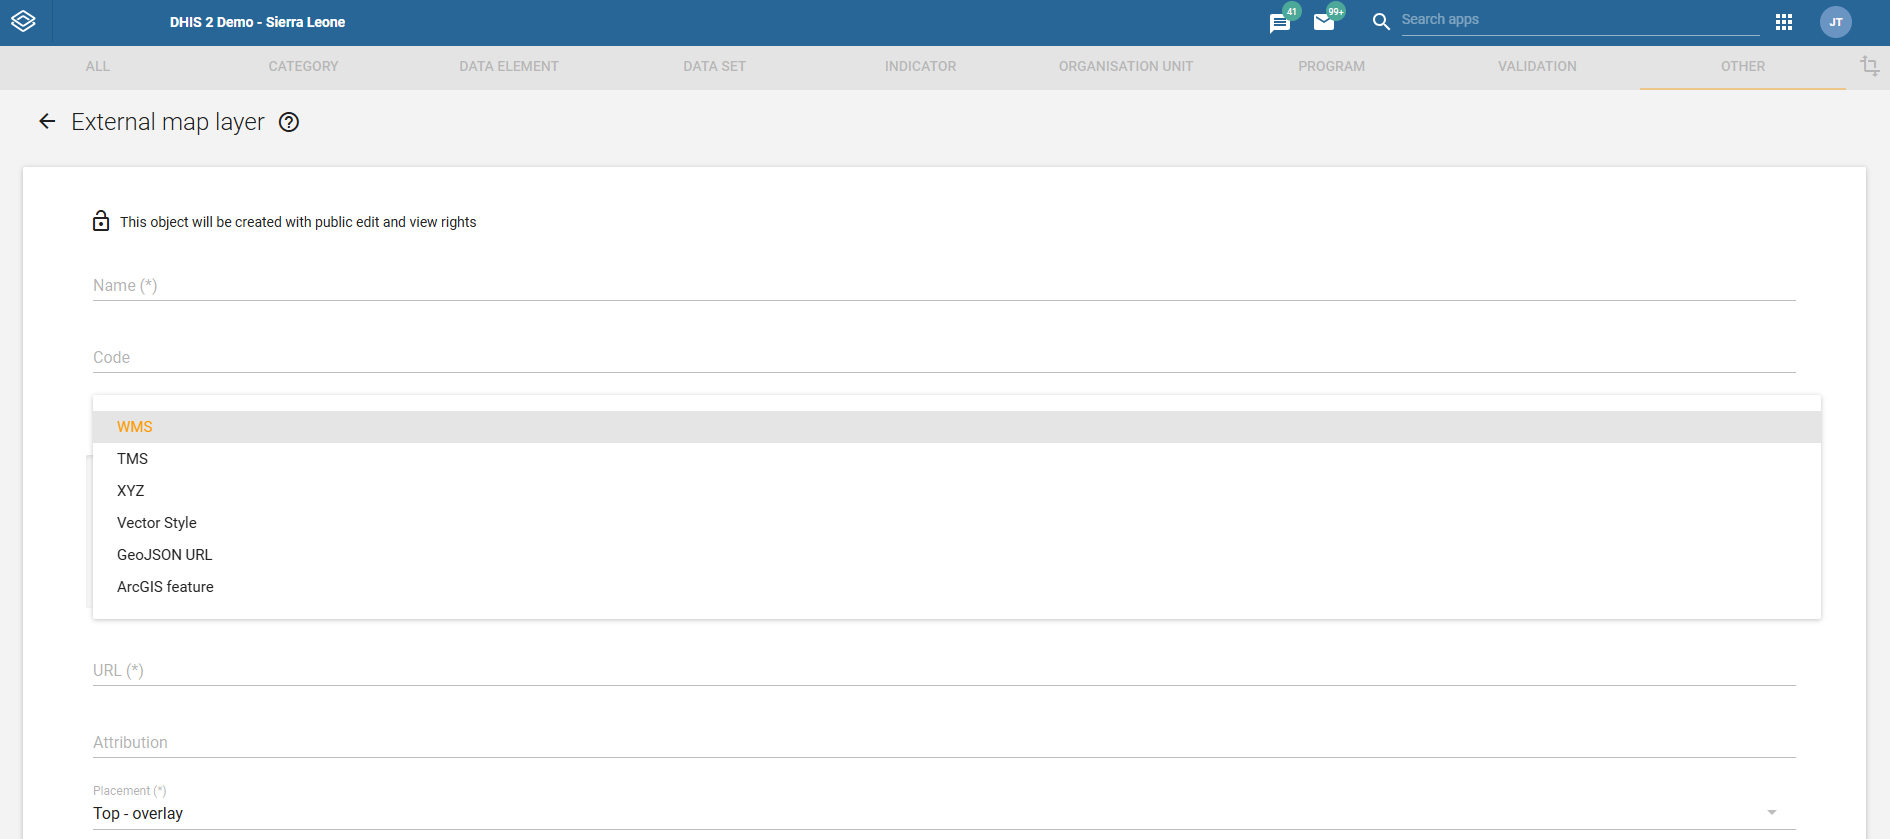
Configuration:
Settings:
Metadata management:
Training:
With the Pivot Table app, you can create pivot tables based on all available data dimensions in DHIS2. A pivot table is a dynamic tool for data analysis which lets you summarize and arrange data according to its dimensions. Examples of data dimensions in DHIS2 are:
data dimension itself (for example data elements, indicators and events)
periods (representing the time period for the data)
organisation hierarchy (representing the geographical location of the data)
From these dimensions you can freely select dimension items to include in the pivot table. You can create additional dimensions in DHIS2 with the group set functionality. This allows for different aggregation pathways, such as aggregation by "Partner" or facility type.
A pivot table can arrange data dimensions on columns, rows, and as filters. When you place a data dimension on columns, the pivot table will display one column per dimension item. If you place multiple data dimensions on columns, the pivot table displays one column for all combinations of the items in the selected dimensions. When you place a data dimension on rows, the pivot table displays one row per dimension item in a similar fashion. The dimensions you select as filters will not be included in the pivot table, but will aggregate and filter the table data based on the selected filter items.
Tip
You must select at least one dimension on columns or rows.
You must include at least one period.
Data element group sets and reporting rates can't appear in the same pivot table.
A pivot table can't contain more than the maximum number of analytic records which have been specified in the system settings. The maximum number of records could also be constrained by the maximum RAM which is available to your browser. You will be prompted with a warning if your requested table exceeds a particular size. From this prompt, you can either cancel the request or continue building the table. Consider making smaller tables instead of one table which displays all of your data elements and indicators together.
The Pivot Table app supports drill-down and up for periods and organisation unit. This means that you can for example drill down from yearly periods to quarters, months and weeks inside a pivot table. You can also drill down from the global organisation unit to countries, provinces and facilities.
Open the Pivot Table app.
In the menu to the left, select the dimension items you want to analyse, for example data elements or indicators.
Click Layout and arrange the data dimensions as columns, rows and filters.
You can keep the default selection if you want.
Click Update.
In this example, indicators are listed as columns and periods as rows.
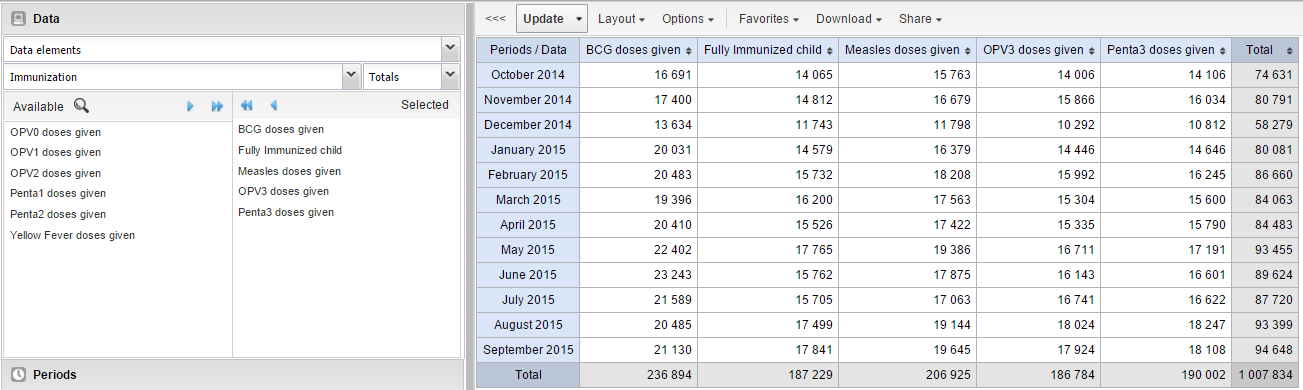
The left menu lists sections for all available data dimensions. From each section you can select any number of dimension items. As an example, you can open the section for data elements and select any number of data elements from the available list. You can select an item by marking it and clicking on the arrow in the section header or simply double-clicking on the item. Before you can use a data dimension in your pivot table you must at least select one dimension item. If you arrange a dimension as columns or rows but do not select any dimension items, the dimension is ignored.
You must choose at least one data dimension type to create a pivot table. The available types are described in this table:
| Data dimension type | Definition | Examples |
|---|---|---|
| Indicators | An indicator is a calculated formula based on data elements. | Coverage of immunization across a specific district. |
| Data elements | Represents the phenomenon for which data has been captured. | Number of malaria cases; number of BCG doses given. |
| Data sets | A collection of data elements grouped for data collection. You can select : * Reporting rates: the percentage of actual reports compared to the expected number of reports * Reporting rates on time: the reporting rates based on timely form submissions. A timely submission must happen within a number of days after the reporting period. * Actual reports: the actual number of reports * Actual reports on time: the actual number of reports based on timely form submissions. A timely submission must happen within a number of days after the reporting period. * Expected reports: the number of expected reports based on organisation units where the data set and the reporting frequency has been assigned. | Reporting rates for immunization and morbidity forms. |
| Event data items | A data element that is part of a program representing events that have been captured. | Average weight and height for children in a nutrition program. |
| Program indicators | A calculated formula based on data elements in a program representing events. | Average BMI score for children in a nutrition program. |
You can combine these dimensions to display for example aggregate data with reporting rates, or event data items together with program indicators, all in the same pivot tables. For the "data element" data dimension, you are also able to select "Totals" and "Details", which will allow you to view different category combination options together on the same pivot table.
For the period dimension you can choose between using fixed periods or relative periods. An example of a fixed period is "January 2012". To select fixed periods start by selecting a period type from the period type list. You can then select periods from the list of available periods.
Relative periods are periods relative to the current date. Examples of relative periods are "Last month", "Last 12 months", "Last 5 years". Relative periods can be selected by ticking the check-boxes next to each period. The main advantage of using relative periods is that when you save a pivot table favorite, it will stay updated with the latest data as time goes by without the need for constantly updating it.
For the organisation unit dimension you can select any number of organisation units from the hierarchy. To select all organisation units below a specific parent organisation unit, right click and click "Select all children". To manually select multiple organisation units, click and hold the Ctrl key while clicking on organisation units. You can tick "User org unit", "User sub-units" or "User sub-x2-units" in order to dynamically insert the organisation unit or units associated with your user account. This is useful when you save a pivot table favorite and want to share it with other users, as the organisation units linked with the other user's account will be used when viewing the favorite.
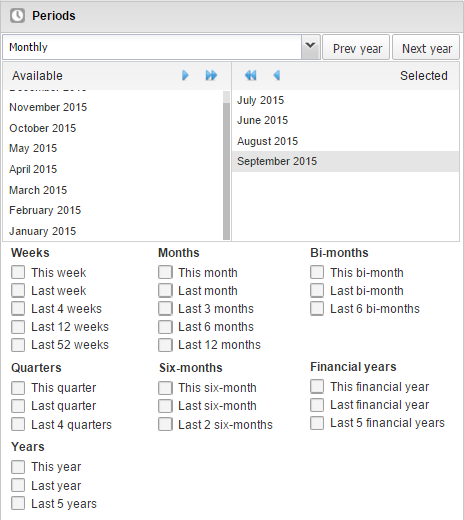
Dynamic dimensions can consist of organisation unit group sets, data element group sets, or category option group sets which have been configured with the type of "Disaggregation". Once the group sets have been configured, they will be come available in the pivot tables, and can be used as additional analysis dimensions, for instance to analyse aggregate data by Type of organisation unit or Implementing partner. Dynamic dimensions work the same as fixed dimensions.
Tip
Some dynamic dimensions may contain many items. This can cause issues with certain browsers due to the length of the URL when many dimension members are selected. A special "All" check box is available for dynamic dimensions, which allows you to include all available dimensions implicitly in your pivot table, without specifying each and every dimension member.
After selecting data dimensions it is time to arrange your pivot table. Click "Layout" in the top menu to open the layout screen. In this screen you can position your data dimensions as table columns, rows or filters by clicking and dragging the dimensions from the dimensions list to the respective column, row and filter lists. You can set any number of dimensions in any of the lists. For instance, you can click on "Organisation units" and drag it to the row list in order to position the organisation unit dimension as table rows. Note that indicators, data elements and data set reporting rates are part of the common "Data" dimension and will be displayed together in the pivot table. For instance, after selecting indicators and data elements in the left menu, you can drag "Organisation Unit" from the available dimensions list to the row dimension list in order to arrange them as rows in the pivot table.
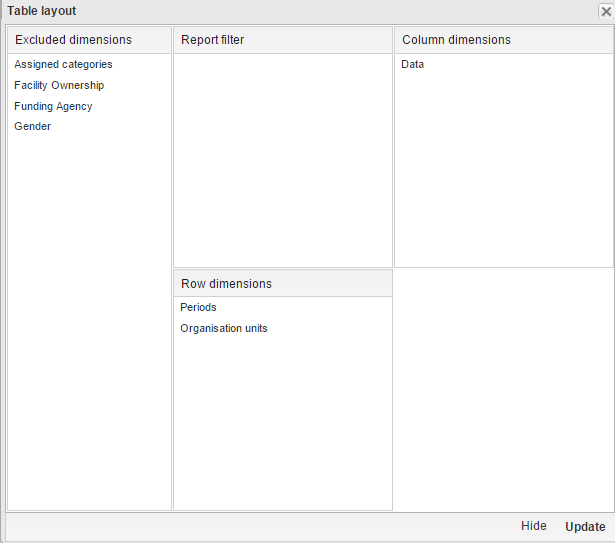
After you have set up your pivot table you can click "Update" to render your pivot table, or click "Hide" to hide the layout screen without any changes taking effect. Since we in our example have selected both the period and organisation unit dimension as rows, the pivot table will generate all combinations of the items in these dimensions and produce a table like this:
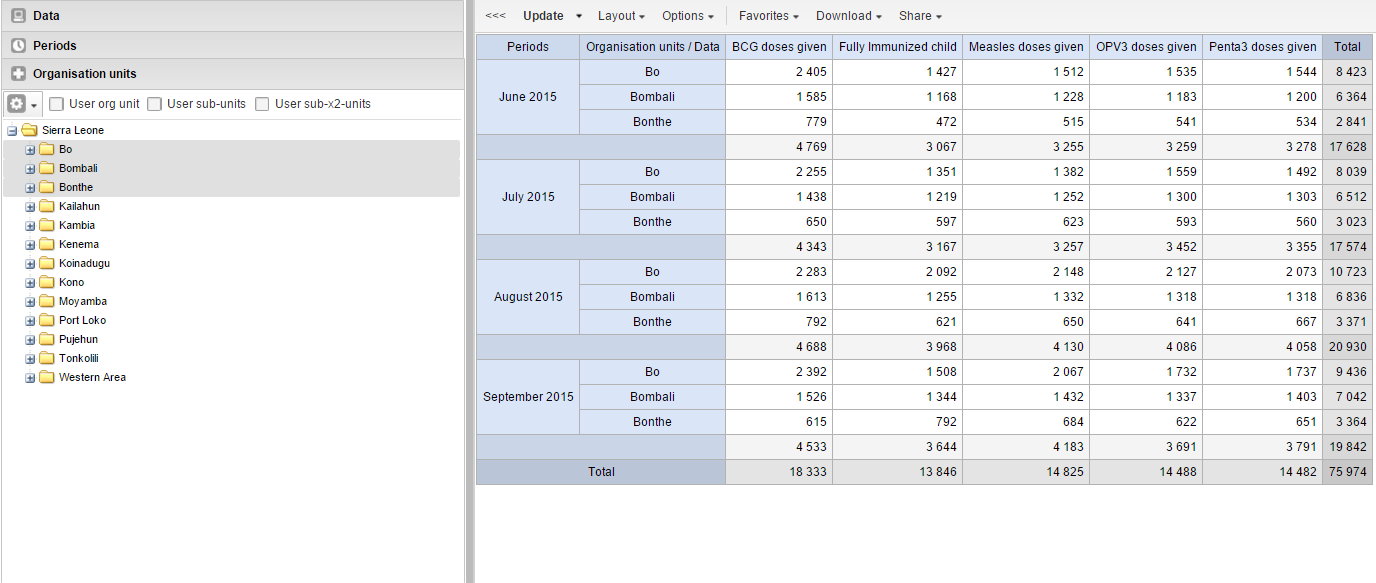
Open the Pivot Table app.
Create a new pivot table or open a favorite.
Click Options.
Set the options as required.
| Option | Description | |
|---|---|---|
| Data | Show column totals Show row totals | Displays total values in the table for each row and column, as well as a total for all values in the table. |
| Show column sub-totals Show row sub-totals | Displays subtotals in the table for each dimension. If you only select one dimension, subtotals will be hidden for those columns or rows. This is because the values will be equal to the subtotals. | |
| Show dimension labels | Shows the dimension names as part of the pivot tables. | |
| Hide empty rows | Hides empty rows from the table. This is useful when you look at large tables where a big part of the dimension items don't have data in order to keep the table more readable. | |
| Hide empty columns | Hides empty columns from the table. This is useful when you look at large tables where a big part of the dimension items don't have data in order to keep the table more readable. | |
| Skip rounding | Skips the rounding of data values, offering the full precision of data values. Can be useful for finance data where the full dollar amount is required. | |
| Aggregation type | The default aggregation operator can be over-ridden here, by selecting a different aggregation operator. Some of the aggregation types are Count, Min and Max. | |
| Number type | Sets the type of value you want to display in the pivot table: Value, Percentage of row or Percentage of column. The options Percentage of row and**Percentage of column** mean that you'll display values as percentages of row total or percentage of column total instead of the aggregated value. This is useful when you want to see the contribution of data elements, categories or organisation units to the total value. | |
| Measure criteria | Allows for the data to be filtered on the server side. You can instruct the system to return only records where the aggregated data value is equal, greater than, greater or equal, less than or less or equal to certain values. If both parts of the filter are used, it's possible to filter out a range of data records. | |
| Events | Include only completed events | Includes only completed events in the aggregation process. This is useful for example to exclude partial events in indicator calculations. |
| Organisation units | Show hierarchy | Shows the name of all ancestors for organisation units, for example "Sierra Leone / Bombali / Tamabaka / Sanya CHP" for Sanya CHP. The organisation units are then sorted alphabetically which will order the organisation units according to the hierarchy. When you download a pivot table with organisation units as rows and you've selected Show hierarchy, each organisation unit level is rendered as a separate column. This is useful for example when you create Excel pivot tables on a local computer. |
| Legend | Apply legend | Applies a legend to the values. This mean that you can apply a colour to the values. Select By data item to color the table cells individually according to each data element or indicator. You configure legends in the Maintenance app. |
| Style | Colors the text or background of cells in pivot tables based on the selected legend. You can use this option for scorecards to identify high and low values at a glance. | |
| Style | Display density | Controls the size of the cells in the table. You can set it to Comfortable, Normal or Compact. Compact is useful when you want to fit large tables into the browser screen. |
| Font size | Controls the size of the table text font. You can set it to Large, Normal or Small. | |
| Digit group separator | Controls which character to separate groups of digits or "thousands". You can set it to Comma, Space or None. | |
| General | Table title | Type a title here to display it above the table. |
| Parameters (for standard reports only) | Note You create standard reports in the Reports app. In the Pivot Table app you set which parameters the system should prompt the user for. | |
| Reporting period | Controls whether to ask user to enter a report period. | |
| Organisation unit | Controls whether to ask user to enter an organisation unit. | |
| Parent organisation unit | Controls whether to ask user to enter a parent organisation unit. | |
| Include regression | Includes a column with regression values to the pivot table. | |
| Include cumulative | Includes a column with cumulative values to the pivot table. | |
| Sort order | Controls the sort order of the values. | |
| Top limit | Controls the maximum number of rows to include in the pivot table. |
Click Update.
Saving your charts or pivot tables as favorites makes it easy to find them later. You can also choose to share them with other users as an interpretation or display them on the dashboard.
You view the details and interpretations of your favorites in the Pivot Table, Data Visualizer, Event Visualizer, Event Reports apps. Use the Favorites menu to manage your favorites.
Click Favorites > Open.
Enter the name of a favorite in the search field, or click Prev and Next to display favorites.
Click the name of the favorite you want to open.
Click Favorites > Save as.
Enter a Name and a Description for your favorite. The description field supports a rich text format, see the interpretations section for more details.
Click Save.
Click Favorites > Rename.
Enter the new name for your favorite.
Click Update.
An interpretation is a link to a resource with a description of the data at a given period. This information is visible in the Dashboard app. To create an interpretation, you first need to create a favorite. If you've shared your favorite with other people, the interpretation you write is visible to those people.
Click Favorites > Write interpretation.
In the text field, type a comment, question or interpretation. You can also mention other users with '@username'. Start by typing '@' plus the first letters of the username or real name and a mentioning bar will display the available users. Mentioned users will receive an internal DHIS2 message with the interpretation or comment. You can see the interpretation in the Dashboard app.
It is possible to format the text with bold, italic by using the Markdown style markers * and _ for bold and italic respectively. Keyboard shortcuts are also available: Ctrl/Cmd + B and Ctrl/Cmd + I. A limited set of smilies is supported and can be used by typing one of the following character combinations: :) :-) :( :-( :+1 :-1. URLs are automatically detected and converted into a clickable link.
Search for a user group that you want to share your favorite with, then click the + icon.
Change sharing settings for the user groups you want to modify.
Can edit and view: Everyone can view and edit the object.
Can view only: Everyone can view the object.
None: The public won't have access to the object. This setting is only applicable to Public access.
Click Share.
When you are subscribed to a favorite, you receive internal messages whenever another user likes/creates/updates an interpretation or creates/update an interpretation comment of this favorite.
Open a favorite.
Click >>> in the top right of the workspace.
Click on the upper-right bell icon to subscribe to this favorite.
Click Favorites > Get link.
Select one of the following:
Open in this app: You get a URL for the favorite which you can share with other users by email or chat.
Open in web api: You get a URL of the API resource. By default this is an HTML resource, but you can change the file extension to ".json" or ".csv".
Click Favorites > Delete.
Click OK.
To view interpretations for relative periods, such as a year ago:
Open a favorite with interpretations.
Click >>> in the top right of the workspace.
Click an interpretation. Your chart displays the data and the date based on when the interpretation was created.To view other interpretations, click them.
To download the data in the current pivot table:
Click Download.
Under Table layout, click the format you want to download: Microsoft Excel, CSV or HTML.
The data table will have one column per dimension and contain names of the dimension items.
Tip
When you download a pivot table with organisation units as rows and you've selected Show hierarchy in Table options, each organisation unit level is rendered as a separate column. This is useful for example when you create Excel pivot tables on a local computer.
Tip
You can create a pivot table in Microsoft Excel from the downloaded Excel file.
You can download data in the current pivot table in JSON, XML, Excel, and CSV as plain data formats with different identification schemes (ID, Code, and Name). The data document uses identifiers of the dimension items and opens in a new browser window to display the URL of the request to the Web API in the address bar. This is useful for developers of apps and other client modules based on the DHIS2 Web API or for those who require a plan data source, for instance for import into statistical packages.
To download plain data source formats:
Click Download.
Under Plain data source, click the format you want to download.
| Format | Action | Description |
|---|---|---|
| JSON | Click JSON | Downloads JSON format based on ID property. You can also download JSON format based on Code or Name property. |
| XML | Click XML | Downloads XML format based on ID property. You can also download XML format based on Code or Name property. |
| Microsoft Excel | Click Microsoft Excel | Downloads XML format based on ID property. You can also download Microsoft Excel format based on Code or Name property. |
| CSV | Click CSV | Downloads CSV format based on ID property. You can also download CSV format based on Code or Name property. |
| JRXML | Put the cursor on Advanced and click JRXML | Produces a template of a Jasper Report which can be further customized based on your exact needs and used as the basis for a standard report in DHIS2. |
| Raw data SQL | Put the cursor on Advanced and click Raw data SQL | Provides the actual SQL statement used to generate the pivot table. You can use it as a data source in a Jasper report, or as the basis for an SQL view. |
You can download data in CSV format directly without rendering the data in the web browser. This helps to reduce any constraints in the system settings that has been set with regards to the maximum number of analytic records. This lets you download much larger batches of data that you can use for later offline analysis.
To download data in CSV format without first rendering data in the web browser:
Click the arrow beside Update.
Click CSV to download the format based on ID property.
The file downloads to your computer.
Tip
You can also download CSV format based on Code or Name property.
Certain analysis-related resources in DHIS2, like pivot tables, charts and maps, can be embedded in any web page by using a plug-in. You will find more information about the plug-ins in the Web API chapter in the DHIS2 Developer Manual.
To generate a HTML fragment that you can use to display the pivot table in an external web page:
Click Embed.
Click Select to highlight the HTML fragment.
When you have made a pivot table you can switch between pivot table, chart and map visualization of your data.
Click Chart > Open this table as chart.
Your current pivot table opens as a chart.
If you want to visualize a small part of your pivot table as a chart you can click directly on a value in the table instead opening the whole table.
In the pivot table, click a value.
To verify the selection, hold the cursor over Open selection as chart. The highlighted dimension headers in the table indicate what data will be visualized as a chart.
Click Open selection as chart.
Click Chart > Open this table as map
Your current pivot table opens as a map.
In the pivot table, click a value.
A menu displays.
Click Open selection as map.
Your selection opens as a map.

With the Event Reports app you can analyse events in two types of reports:
Aggregated event reports: Pivot table-style analysis with aggregated numbers of events
By selecting Aggregated values from the top-left menu you can use the Event Reports app to create pivot tables with aggregated numbers of events. An event report is always based on a program. You can do analysis based on a range of dimensions. Each dimension can have a corresponding filter. Dimensions can be selected from the left-side menu. Similar to the pivot tables app, aggregated event reports may be limited by the amount of RAM accessible by the browser. If your requested table exceeds a set size, you will recieve a warning prompt asking whether or not you want to continue.
Individual event reports: Lists of events
By selecting Events from the top-left menu you can use the Event Reports app to make searches or queries for events based on a flexible set of criteria. The report will be displayed as a table with one row per event. Each dimension can be used as a column in the table or as a filter. Each dimension can have a criteria (filter). Data elements of type option set allows for "in" criteria, where multiple options can be selected. Numeric values can be compared to filter values using greater than, equal or less than operators.
Open the Event Reports app.
Select Aggregated values or Events.
In the menu to the left, select the meta data you want to analyse.
Click Layout and arrange the dimensions.
You can keep the default selection if you want.
Click Update.
An event report is always based on a program and you can do analysis based on a range of dimensions. For programs with category combinations, you can use program categories and category option group sets as dimensions for tables and charts. Each dimension item can have a corresponding filter.
Select data elements:
Click Data.
Select a program and a program stage.
The data elements associated with the selected program are listed under Available. Each data element acts as a dimension.
Select the data elements you need by double-clicking their names.
Data elements can be filtered by type (Data elements, Program attributes, Program indicators) and are prefixed to make them easily recognizable.
After selecting a data element, it is visible under Selected data items.
(Optional) For each data element, specify a filter with operators such as "greater than", "in" or "equal" together with a filter value.
Select periods.
Click Periods.
Select one or several periods.
You have three period options: relative periods, fixed periods and start/end dates. You can combine fixed periods and relative periods in the same chart. You cannot combine fixed periods and relative periods with start/end dates in the same chart. Overlapping periods are filtered so that they only appear once.
Fixed periods: In the Select period type box, select a period type. You can select any number of fixed periods from any period type. Fixed periods can for example be "January 2014".
Relative periods: In the lower part of the Periods section, select as many relative periods as you like. The names are relative to the current date. This means that if the current month is March and you select Last month, the month of February is included in the chart. Relative periods has the advantage that it keeps the data in the report up to date as time goes.
Start/end dates: In the list under the Periods tab, select Start/end dates. This period type lets you specify flexible dates for the time span in the report.
Select organisation units.
Click Organisation units.
Click the gearbox icon.
Select a Selection mode and an organisation unit.
There are three different selection modes:
| Selection mode | Description |
|---|---|
| Select organisation units | Lets you select the organisation units you want to appear in the chart from the organization tree. Select User org unit to disable the organisation unit tree and only select the organisation unit that is related to your profile. Select User sub-units to disable the organisation unit tree and only select the sub-units of the organisation unit that is related to your profile. Select User sub-x2-units to disable the organisation unit tree and only select organisation units two levels down from the organisation unit that is related to your profile. This functionality is useful for administrators to create a meaningful "system" favorite. With this option checked all users find their respective organisation unit when they open the favorite. |
| Select levels | Lets you select all organisation units at one or more levels, for example national or district level. You can also select the parent organisation unit in the tree, which makes it easy to select for example, all facilities inside one or more districts. |
| Select groups | Lets you select all organisation units inside one or several groups and parent organisation units at the same time, for example hospitals or chiefdoms. |
Click Update.
You can define which data dimension you want to appear as columns, rows and filters in the pivot table. Each data element appears as individual dimensions and can be placed on any of the axes.
Note
Data elements of continuous value types (real numbers/decimal numbers) can only be used as filters, and will automatically be positioned as filters in the layout dialog. The reason for this is that continuous number cannot be grouped into sensible ranges and used on columns and rows.
Click Layout.
Drag and drop the dimensions to the appropriate space.
Click Update.
You can customize the display of an event report.
Click Options.
Set the options as required. Available options are different between aggregated event reports and individual event reports.
| Option | Description | Available for report type | |
|---|---|---|---|
| Data | Show column totals | Displays totals at the end of each column in the pivot table. | Aggregated event report |
| Show column sub-totals | Displays sub-totals for each column in the pivot table. | Aggregated event report | |
| Show row totals | Displays totals at the end of each row in the pivot table. | Aggregated event report | |
| Show row sub-totals | Displays sub-totals for each row in the pivot table. | Aggregated event report | |
| Show dimension labels | Displays labels for dimensions. | Aggregated event report | |
| Hide empty rows | Hides empty rows in the pivot table. | Aggregated event report | |
| Hide n/a data | Hides data tagged as N/A from the chart. | Aggregated event report | |
| Include only completed events | Includes only completed events in the aggregation process. This is useful when you want for example to exclude partial events in indicator calculations. | Aggregated event report Individual event report | |
| Limit | Sets a limit of the maximum number of rows that you can display in the table, combined with a setting for showing top or bottom values. | Aggregated event report | |
| Output type | Defines the output type. The output types are Event, Enrollment and Tracked entity instance. | Aggregated event report | |
| Program status | Filters data based on the program status: All, Active, Completed or Cancelled. | Aggregated event report | |
| Event status | Filters data based on the event status: All, Active, Completed, Scheduled, Overdue or Skipped. | Aggregated event report | |
| Organisation units | Show hierarchy | Includes the names of all parents of each organisation unit in labels. | Aggregated event report |
| Style | Display density | Controls the size of the cells in the table. You can set it to Comfortable, Normal or Compact. Compact is useful when you want to fit large tables into the browser screen. | Aggregated event report Individual event report |
| Font size | Controls the size of the table text font. You can set it to Large, Normal or Small. | Aggregated event report Individual event report | |
| Digit group separator | Controls which character to separate groups of digits or "thousands". You can set it to Comma, Space or None. | Aggregated event report Individual event report |
Click Update.
You can download the data source behind an event report in HTML, JSON, XML, Microsoft Excel or CSV formats.
Click Download.
Under Plain data source, click the format you want to download.
| Format | Description |
|---|---|
| HTML | Creates HTML table based on selected meta data |
| JSON | Downloads data values in JSON format based on selected meta data |
| XML | Downloads data values in XML format based on selected meta data |
| Microsoft Excel | Downloads data values in Microsoft Excel format based on selected meta data |
| CSV | Downloads data values in CSV format based on selected meta data |
Saving your charts or pivot tables as favorites makes it easy to find them later. You can also choose to share them with other users as an interpretation or display them on the dashboard.
You view the details and interpretations of your favorites in the Pivot Table, Data Visualizer, Event Visualizer, Event Reports apps. Use the Favorites menu to manage your favorites.
Click Favorites > Open.
Enter the name of a favorite in the search field, or click Prev and Next to display favorites.
Click the name of the favorite you want to open.
Click Favorites > Save as.
Enter a Name and a Description for your favorite. The description field supports a rich text format, see the interpretations section for more details.
Click Save.
Click Favorites > Rename.
Enter the new name for your favorite.
Click Update.
An interpretation is a link to a resource with a description of the data at a given period. This information is visible in the Dashboard app. To create an interpretation, you first need to create a favorite. If you've shared your favorite with other people, the interpretation you write is visible to those people.
Click Favorites > Write interpretation.
In the text field, type a comment, question or interpretation. You can also mention other users with '@username'. Start by typing '@' plus the first letters of the username or real name and a mentioning bar will display the available users. Mentioned users will receive an internal DHIS2 message with the interpretation or comment. You can see the interpretation in the Dashboard app.
It is possible to format the text with bold, italic by using the Markdown style markers * and _ for bold and italic respectively. Keyboard shortcuts are also available: Ctrl/Cmd + B and Ctrl/Cmd + I. A limited set of smilies is supported and can be used by typing one of the following character combinations: :) :-) :( :-( :+1 :-1. URLs are automatically detected and converted into a clickable link.
Search for a user group that you want to share your favorite with, then click the + icon.
Change sharing settings for the user groups you want to modify.
Can edit and view: Everyone can view and edit the object.
Can view only: Everyone can view the object.
None: The public won't have access to the object. This setting is only applicable to Public access.
Click Share.
When you are subscribed to a favorite, you receive internal messages whenever another user likes/creates/updates an interpretation or creates/update an interpretation comment of this favorite.
Open a favorite.
Click >>> in the top right of the workspace.
Click on the upper-right bell icon to subscribe to this favorite.
Click Favorites > Get link.
Select one of the following:
Open in this app: You get a URL for the favorite which you can share with other users by email or chat.
Open in web api: You get a URL of the API resource. By default this is an HTML resource, but you can change the file extension to ".json" or ".csv".
Click Favorites > Delete.
Click OK.
To view interpretations for relative periods, such as a year ago:
Open a favorite with interpretations.
Click >>> in the top right of the workspace.
Click an interpretation. Your chart displays the data and the date based on when the interpretation was created.To view other interpretations, click them.
When you have made an event report you can open it as a chart:
Click Chart > Open this chart as table.
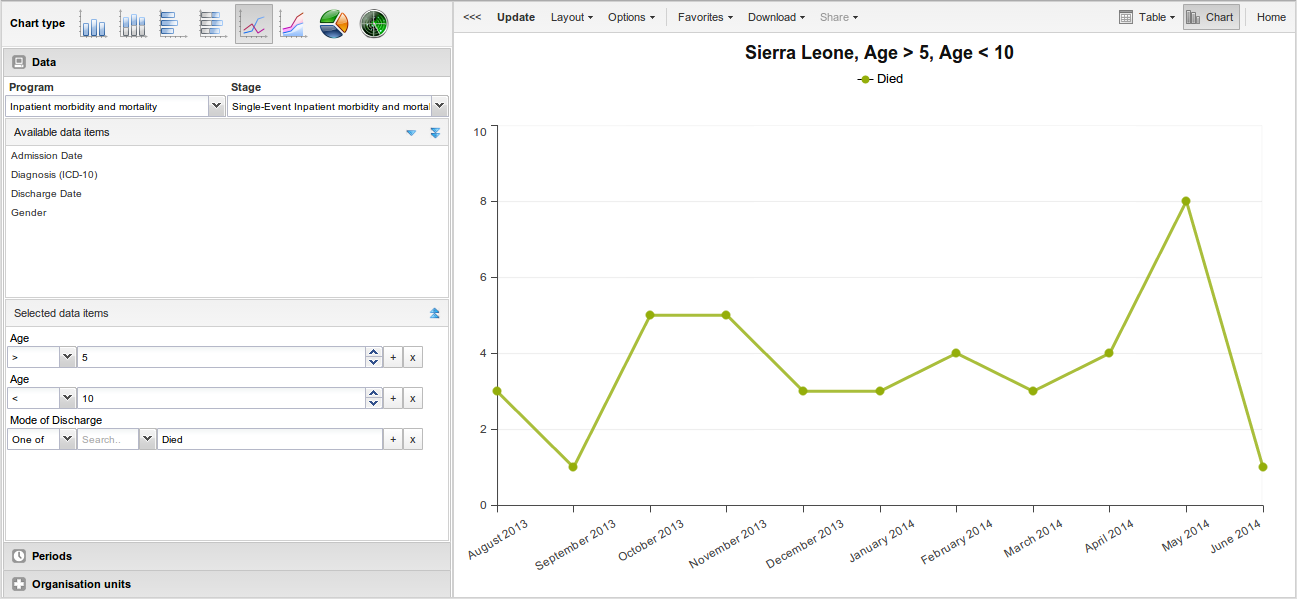
With the Event Visualizer app, you can create charts based on event data.
Open the Event Visualizer app and select a chart type.
In the menu to the left, select the meta data you want to analyse.
Click Layout and arrange the dimensions.
You can keep the default selection if you want.
Click Update.
The Event Visualizer app has eight different chart types, each with different characteristics. To select a chart type:
In Chart type, click the chart type you need.
| Chart type | Description |
|---|---|
| Column chart | Displays information as vertical rectangular columns with lengths proportional to the values they represent. Useful when you want to, for example, compare performance of different districts. |
| Stacked column chart | Displays information as vertical rectangular columns, where bars representing multiple categories are stacked on top of each other. Useful when you want to, for example, display trends or sums of related data elements. |
| Bar chart | Same as column chart, only with horizontal bars. |
| Stacked bar chart | Same as stacked column chart, only with horizontal bars. |
| Line chart | Displays information as a series of points connected by straight lines. Also referred to as time series. Useful when you want to, for example, visualize trends in indicator data over multiple time periods. |
| Area chart | Is based on line chart, with the space between the axis and the line filled with colors and the lines stacked on top of each other. Useful when you want to compare the trends of related indicators. |
| Pie chart | Circular chart divided into sectors (or slices). Useful when you want to, for example, visualize the proportion of data for individual data elements compared to the total sum of all data elements in the chart. |
| Radar chart | Displays data on axes starting from the same point. Also known as spider chart. |
Click Update.
An event chart is always based on a program and you can do analysis based on a range of dimensions. For programs with category combinations, you can use program categories and category option group sets as dimensions for tables and charts. Each dimension item can have a corresponding filter. You select dimension items from the left-side menu.
Select data elements:
Click Data.
Select a program and a program stage.
The data elements associated with the selected program are listed under Available. Each data element acts as a dimension.
Select the data elements you need by double-clicking their names.
Data elements can be filtered by type (Data elements, Program attributes, Program indicators) and are prefixed to make them easily recognizable.
After selecting a data element, it is visible under Selected data items.
(Optional) For each data element, specify a filter with operators such as "greater than", "in" or "equal" together with a filter value.
Select periods.
Click Periods.
Select one or several periods.
You have three period options: relative periods, fixed periods and start/end dates. You can combine fixed periods and relative periods in the same chart. You cannot combine fixed periods and relative periods with start/end dates in the same chart. Overlapping periods are filtered so that they only appear once.
Fixed periods: In the Select period type box, select a period type. You can select any number of fixed periods from any period type. Fixed periods can for example be "January 2014".
Relative periods: In the lower part of the Periods section, select as many relative periods as you like. The names are relative to the current date. This means that if the current month is March and you select Last month, the month of February is included in the chart. Relative periods has the advantage that it keeps the data in the report up to date as time goes.
Start/end dates: In the list under the Periods tab, select Start/end dates. This period type lets you specify flexible dates for the time span in the report.
Select organisation units.
Click Organisation units.
Click the gearbox icon.
Select a Selection mode and an organisation unit.
There are three different selection modes:
| Selection mode | Description |
|---|---|
| Select organisation units | Lets you select the organisation units you want to appear in the chart from the organization tree. Select User org unit to disable the organisation unit tree and only select the organisation unit that is related to your profile. Select User sub-units to disable the organisation unit tree and only select the sub-units of the organisation unit that is related to your profile. Select User sub-x2-units to disable the organisation unit tree and only select organisation units two levels down from the organisation unit that is related to your profile. This functionality is useful for administrators to create a meaningful "system" favorite. With this option checked all users find their respective organisation unit when they open the favorite. |
| Select levels | Lets you select all organisation units at one or more levels, for example national or district level. You can also select the parent organisation unit in the tree, which makes it easy to select for example, all facilities inside one or more districts. |
| Select groups | Lets you select all organisation units inside one or several groups and parent organisation units at the same time, for example hospitals or chiefdoms. |
Click Update.
You can define which data dimension you want to appear as series, category and filter. Each data element appears as individual dimensions and can be placed on any of the axes. Series and category panels can only have one dimension at the time.
Note
Data elements of continuous value types (real numbers/decimal numbers) can only be used as filters, and will automatically be positioned as filters in the layout dialog. The reason for this is that continuous number cannot be grouped into sensible ranges and used on columns and rows.
Click Layout.
Drag and drop the dimensions to the appropriate space. Only one dimension can be in each section.
Click Update.
You can customize the display of an event report.
Click Options.
Set the options as required.
| Option | Description | |
|---|---|---|
| Data | Show values | Displays values as numbers on top of each series. |
| Use 100% stacked values | Displays 100 % stacked values in column charts. | |
| Use cumulative values | Displays cumulative values in line charts. | |
| Hide n/a data | Hides data tagged as N/A from the chart. | |
| Include only completed events | Includes only completed events in the aggregation process. This is useful when you want for example to exclude partial events in indicator calculations. | |
| Hide empty categories | Hides the category items with no data from the chart. None: doesn't hide any of the empty categories Before first: hides missing values only before the first value After last: hides missing values only after the last value Before first and after last: hides missing values only before the first value and after the last value All: hides all missing values This is useful for example when you create column and bar charts. | |
| Trend line | Displays the trend line which visualizes how your data evolves over time. For example if performance is improving or deteriorating. Useful when periods are selected as category. | |
| Target line value/title | Displays a horizontal line and title (optional) at the given domain value. Useful for example when you want to compare your performance to the current target. | |
| Base line value/title | Displays a horizontal line and title (optional) at the given domain value. Useful for example when you want to visualize how your performance has evolved since the beginning of a process. | |
| Sort order | Allows you to sort the values on your chart from either low to high or high to low. | |
| Output type | Defines the output type. The output types are Event, Enrollment and**Tracked entity instance**. | |
| Program status | Filters data based on the program status: All, Active, Completed or Cancelled. | |
| Event status | Filters data based on the event status: All, Active, Completed, Scheduled, Overdue or Skipped. | |
| Axes | Range axis min/max | Defines the maximum and minimum value which will be visible on the range axis. |
| Range axis tick steps | Defines the number of ticks which will be visible on the range axis. | |
| Range axis decimals | Defines the number of decimals which will be used for range axis values. | |
| Range axis title | Type a title here to display a label next to the range axis (also referred to as the Y axis). Useful when you want to give context information to the chart, for example about the unit of measure. | |
| Domain axis title | Type a title here to display a label below the domain axis (also referred to as the X axis). Useful when you want to give context information to the chart, for example about the period type. | |
| General | Hide chart legend | Hides the legend and leaves more room for the chart itself. |
| Hide chart title | Hides the title (default or custom) of your chart. | |
| Chart title | Type a title here to display a custom title above the chart. If you don't enter a title, the default title is displayed. | |
| Hide chart subtitle | Hides the subtitle of your chart. | |
| Chart subtitle | Type a subtitle here to display a custom subtitle above the chart but below the title. If you don't enter a subtitle, no subtitle is displayed in the chart. |
Click Update.
After you have created a chart you can download it to your local computer as an image or PDF file.
Click Download.
Under Graphics, click PNG (.png) or PDF (.pdf).
The file is automatically downloaded to your computer. Now you can for example embed the image file into a text document as part of a report.
You can download the data source behind a chart in HTML, JSON, XML, Microsoft Excel or CSV formats. The data document uses identifiers of the dimension items and opens in a new browser window to display the URL of the request to the Web API in the address bar. This is useful for developers of apps and other client modules based on the DHIS2 Web API or for those who require a plan data source, for instance for import into statistical packages.
To download plain data source formats:
Click Download.
Under Plain data source, click the format you want to download.
| Format | Description |
|---|---|
| HTML | Creates HTML table based on selected meta data |
| JSON | Downloads data values in JSON format based on selected meta data |
| XML | Downloads data values in XML format based on selected meta data |
| Microsoft Excel | Downloads data values in Microsoft Excel format based on selected meta data |
| CSV | Downloads data values in CSV format based on selected meta data |
Saving your charts or pivot tables as favorites makes it easy to find them later. You can also choose to share them with other users as an interpretation or display them on the dashboard.
You view the details and interpretations of your favorites in the Pivot Table, Data Visualizer, Event Visualizer, Event Reports apps. Use the Favorites menu to manage your favorites.
Click Favorites > Open.
Enter the name of a favorite in the search field, or click Prev and Next to display favorites.
Click the name of the favorite you want to open.
Click Favorites > Save as.
Enter a Name and a Description for your favorite. The description field supports a rich text format, see the interpretations section for more details.
Click Save.
Click Favorites > Rename.
Enter the new name for your favorite.
Click Update.
An interpretation is a link to a resource with a description of the data at a given period. This information is visible in the Dashboard app. To create an interpretation, you first need to create a favorite. If you've shared your favorite with other people, the interpretation you write is visible to those people.
Click Favorites > Write interpretation.
In the text field, type a comment, question or interpretation. You can also mention other users with '@username'. Start by typing '@' plus the first letters of the username or real name and a mentioning bar will display the available users. Mentioned users will receive an internal DHIS2 message with the interpretation or comment. You can see the interpretation in the Dashboard app.
It is possible to format the text with bold, italic by using the Markdown style markers * and _ for bold and italic respectively. Keyboard shortcuts are also available: Ctrl/Cmd + B and Ctrl/Cmd + I. A limited set of smilies is supported and can be used by typing one of the following character combinations: :) :-) :( :-( :+1 :-1. URLs are automatically detected and converted into a clickable link.
Search for a user group that you want to share your favorite with, then click the + icon.
Change sharing settings for the user groups you want to modify.
Can edit and view: Everyone can view and edit the object.
Can view only: Everyone can view the object.
None: The public won't have access to the object. This setting is only applicable to Public access.
Click Share.
When you are subscribed to a favorite, you receive internal messages whenever another user likes/creates/updates an interpretation or creates/update an interpretation comment of this favorite.
Open a favorite.
Click >>> in the top right of the workspace.
Click on the upper-right bell icon to subscribe to this favorite.
Click Favorites > Get link.
Select one of the following:
Open in this app: You get a URL for the favorite which you can share with other users by email or chat.
Open in web api: You get a URL of the API resource. By default this is an HTML resource, but you can change the file extension to ".json" or ".csv".
Click Favorites > Delete.
Click OK.
To view interpretations for relative periods, such as a year ago:
Open a favorite with interpretations.
Click >>> in the top right of the workspace.
Click an interpretation. Your chart displays the data and the date based on when the interpretation was created.To view other interpretations, click them.
When you have made a chart you can open it as a pivot table:
Click Chart > Open this chart as table.
The reports app allows for canned, standard reports, data set reports, resources and org unit distribution reports.
You access the available reports by navigating to Apps->Reports. In the report menu in the left bar, click Standard Report. A list of all pre-defined reports will appear in the main window.
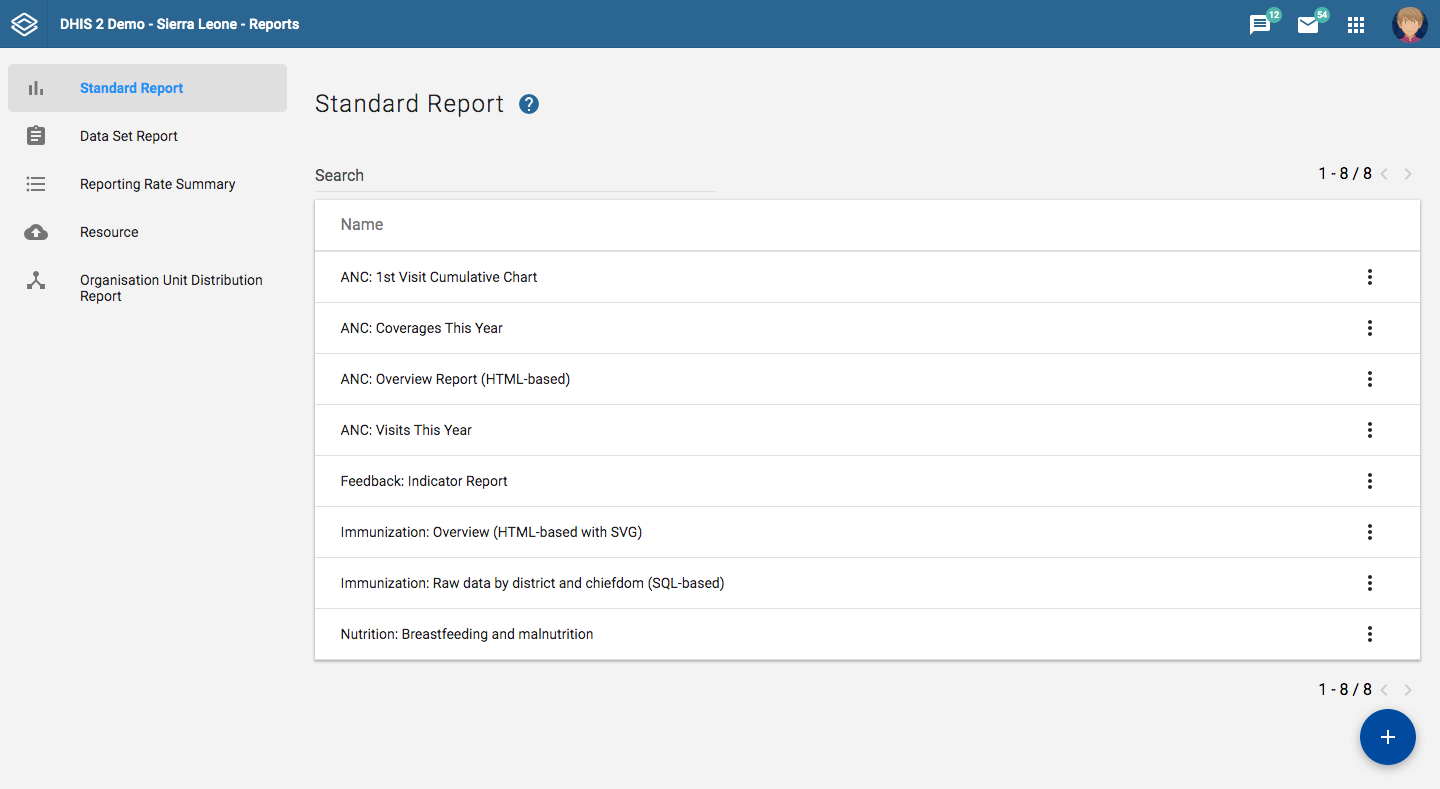
You run/view a report by clicking on the triple-dot icon of the report and then selecting "Create" from the contextual menu. If there are any pre-defined parameters, you will see a report parameter window where you must fill in the values needed for orgunit and/or reporting month, depending on what has been defined in the underlying report table(s). Click on "Generate Report" when you are ready. The report will either appear directly in your browser or be available as a PDF file for download, depending on your browser settings for handling PDF files. You can save the file and keep it locally on your computer for later use.
Dataset reports are printer friendly views of the data entry screen filled with either raw or aggregated data.
You can access data set reports from Apps->Reports.
A Criteria window will appear where you fill in the details for your report:
Dataset: The data set you want to display.
Report period: The actual period you want data for. This can be aggregated as well as raw periods. This means that you can ask for a quarterly or annual report even though the data set is collected monthly. A data set's period type (collection frequency) is defined in data set maintenance. First select the period type (Monthly, Quarterly, Yearly etc.) in the drop down next to Prev and Next buttons, and then select one of the available periods from the dropdown list below. Use Prev and Next to jump one year back or forward.
Use data for selected unit only: Use this option if you want a report for an orgunit that has children, but only want the data collected directly for this unit and not the data collected by its children. If you want a typical aggregated report for an orgunit you do not want to tick this option.
Report Organisation unit: Here you select the orgunit you want the report for. This can be at any level in the hierarchy as the data will be aggregated up to this level automatically (if you do not tick the option above).
When you are done filling in the report criteria you click on "Generate". The report will appear as HTML in a printer-friendly format. Use the print and save as functions in the browser to print or save (as HTML) the report.You can also export the data set report in Excel and PDF formats.
Access the reporting rate summary from the Apps->Reports menu. Reporting rate summaries will show how many datasets (forms) that have been submitted by organisation unit and period.
The reporting rate is calculation is based on complete data set registrations. A complete data set registration refers to a user marking a data entry form as complete, typically by clicking the complete button in the data entry screen, hereby indicating to the system that she considers the form to be complete. This is i.e. a subjective approach to calculating completeness.
The reporting rate summary will for each row show a range of measures:
Actual reports: Indicates the number of data entry complete registrations for the relevant data set.
Expected reports: Indicates how many data entry complete registrations are expected. This number is based on the number of organisation units the relevant data set has been assigned to (enabled for data entry).
Reporting rate: The percentage of reports registered as complete based on the number expected.
Reports on time: Same as actual reports, only reports registered as complete within the maximum number of days after the end of the reporting period. This number of days after reporting period can be defined per data set in the data set management.
Reporting rate on time: Same as percentage, only reports registered as complete on time used as numerator.
To run the report you can follow these steps:
Select an orgunit from the tree.
Select a data set.
Select a period type and a period from the list of available periods for that period type.
The report will then be rendered. Change any of the parameters above and click "Get report" again see the corresponding results.
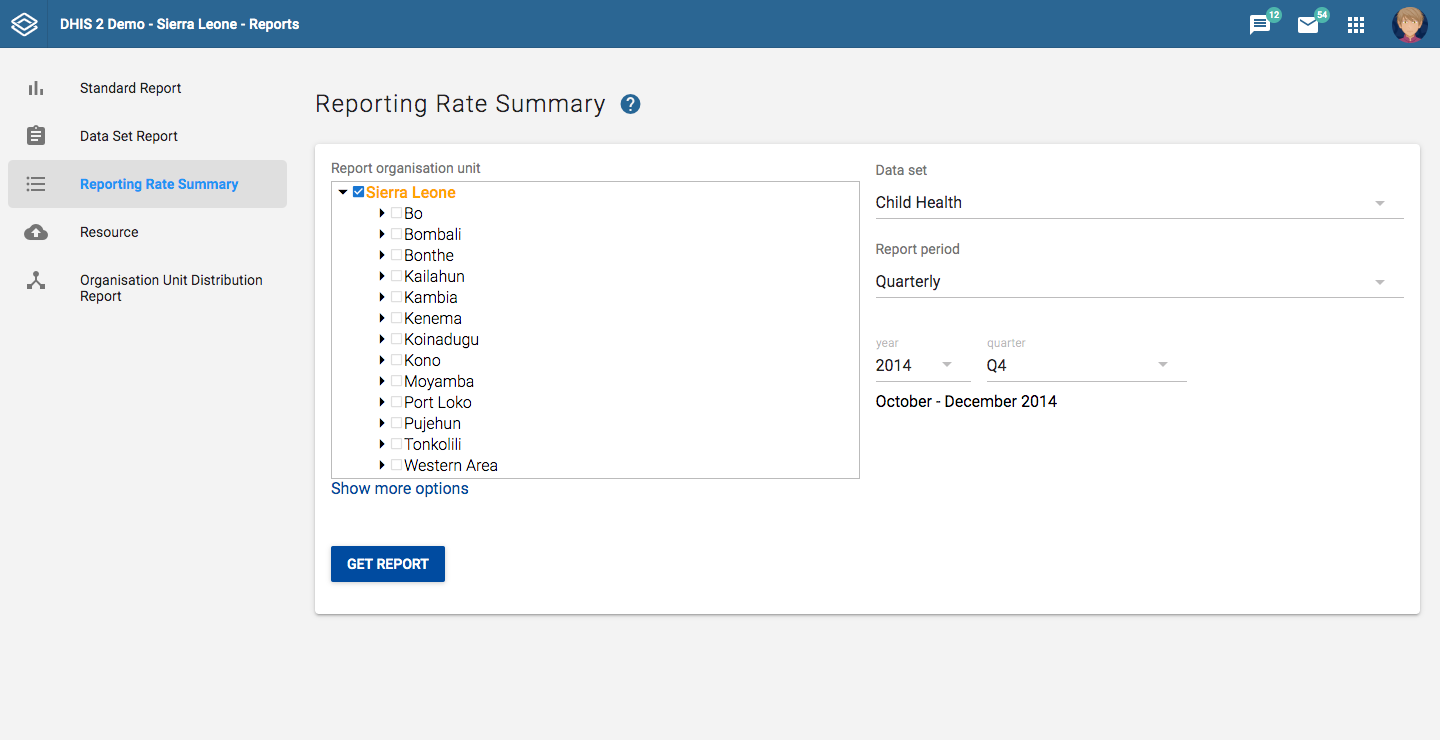
The resource tool allows you to upload both files from your local computer to the DHIS server and to add links to other resources on the Internet through URLs. If cloud storage is configured for your system, resources will be saved there.
To create a new resource:
Open the Reports app and click Resource.
Click Add new.
Enter a Name.
Select a Type: Upload file or External URL.
Click Save.
You can access the Orgunit Distribution reports from the left side menu in the Apps->Reports.
Orgunit distribution reports are reports that show how the orgunits are distributed on various properties like type and ownership, and by geographical areas.
The result can be presented in a table-based report or in a chart.
Running a report:
To run a report first select an orgunit in the upper left side orgunit tree. The report will be based on orgunits located under the selected orgunit. The select the orgunit group set that you want to use, typically these are Type, Ownership, Rural/Urban, but can be any user-defined orgunit group set. The you can click on either Get Report to get the table-based presentation or Get chart to get the same result in a chart. You can also download the table-based report as Excel or CSV.
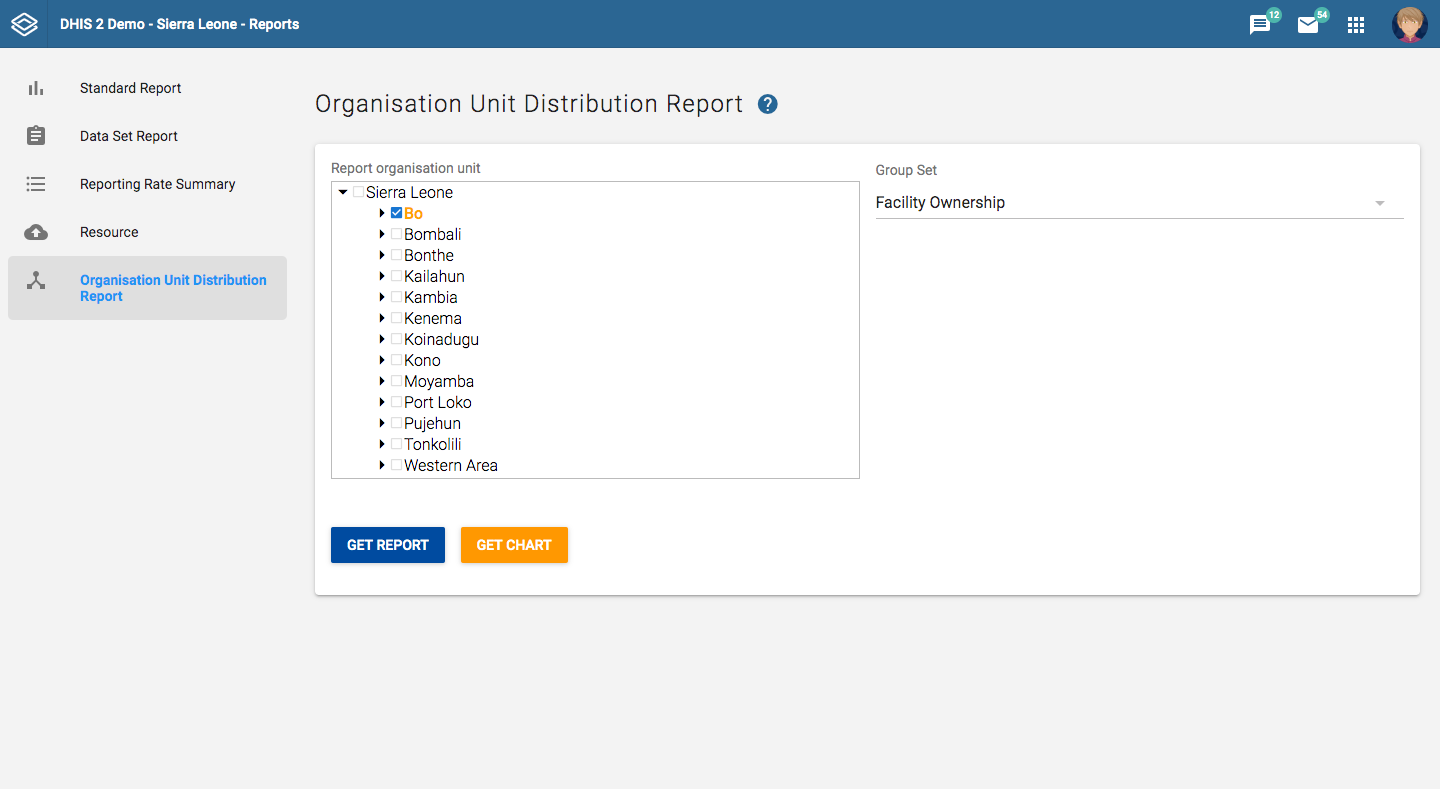
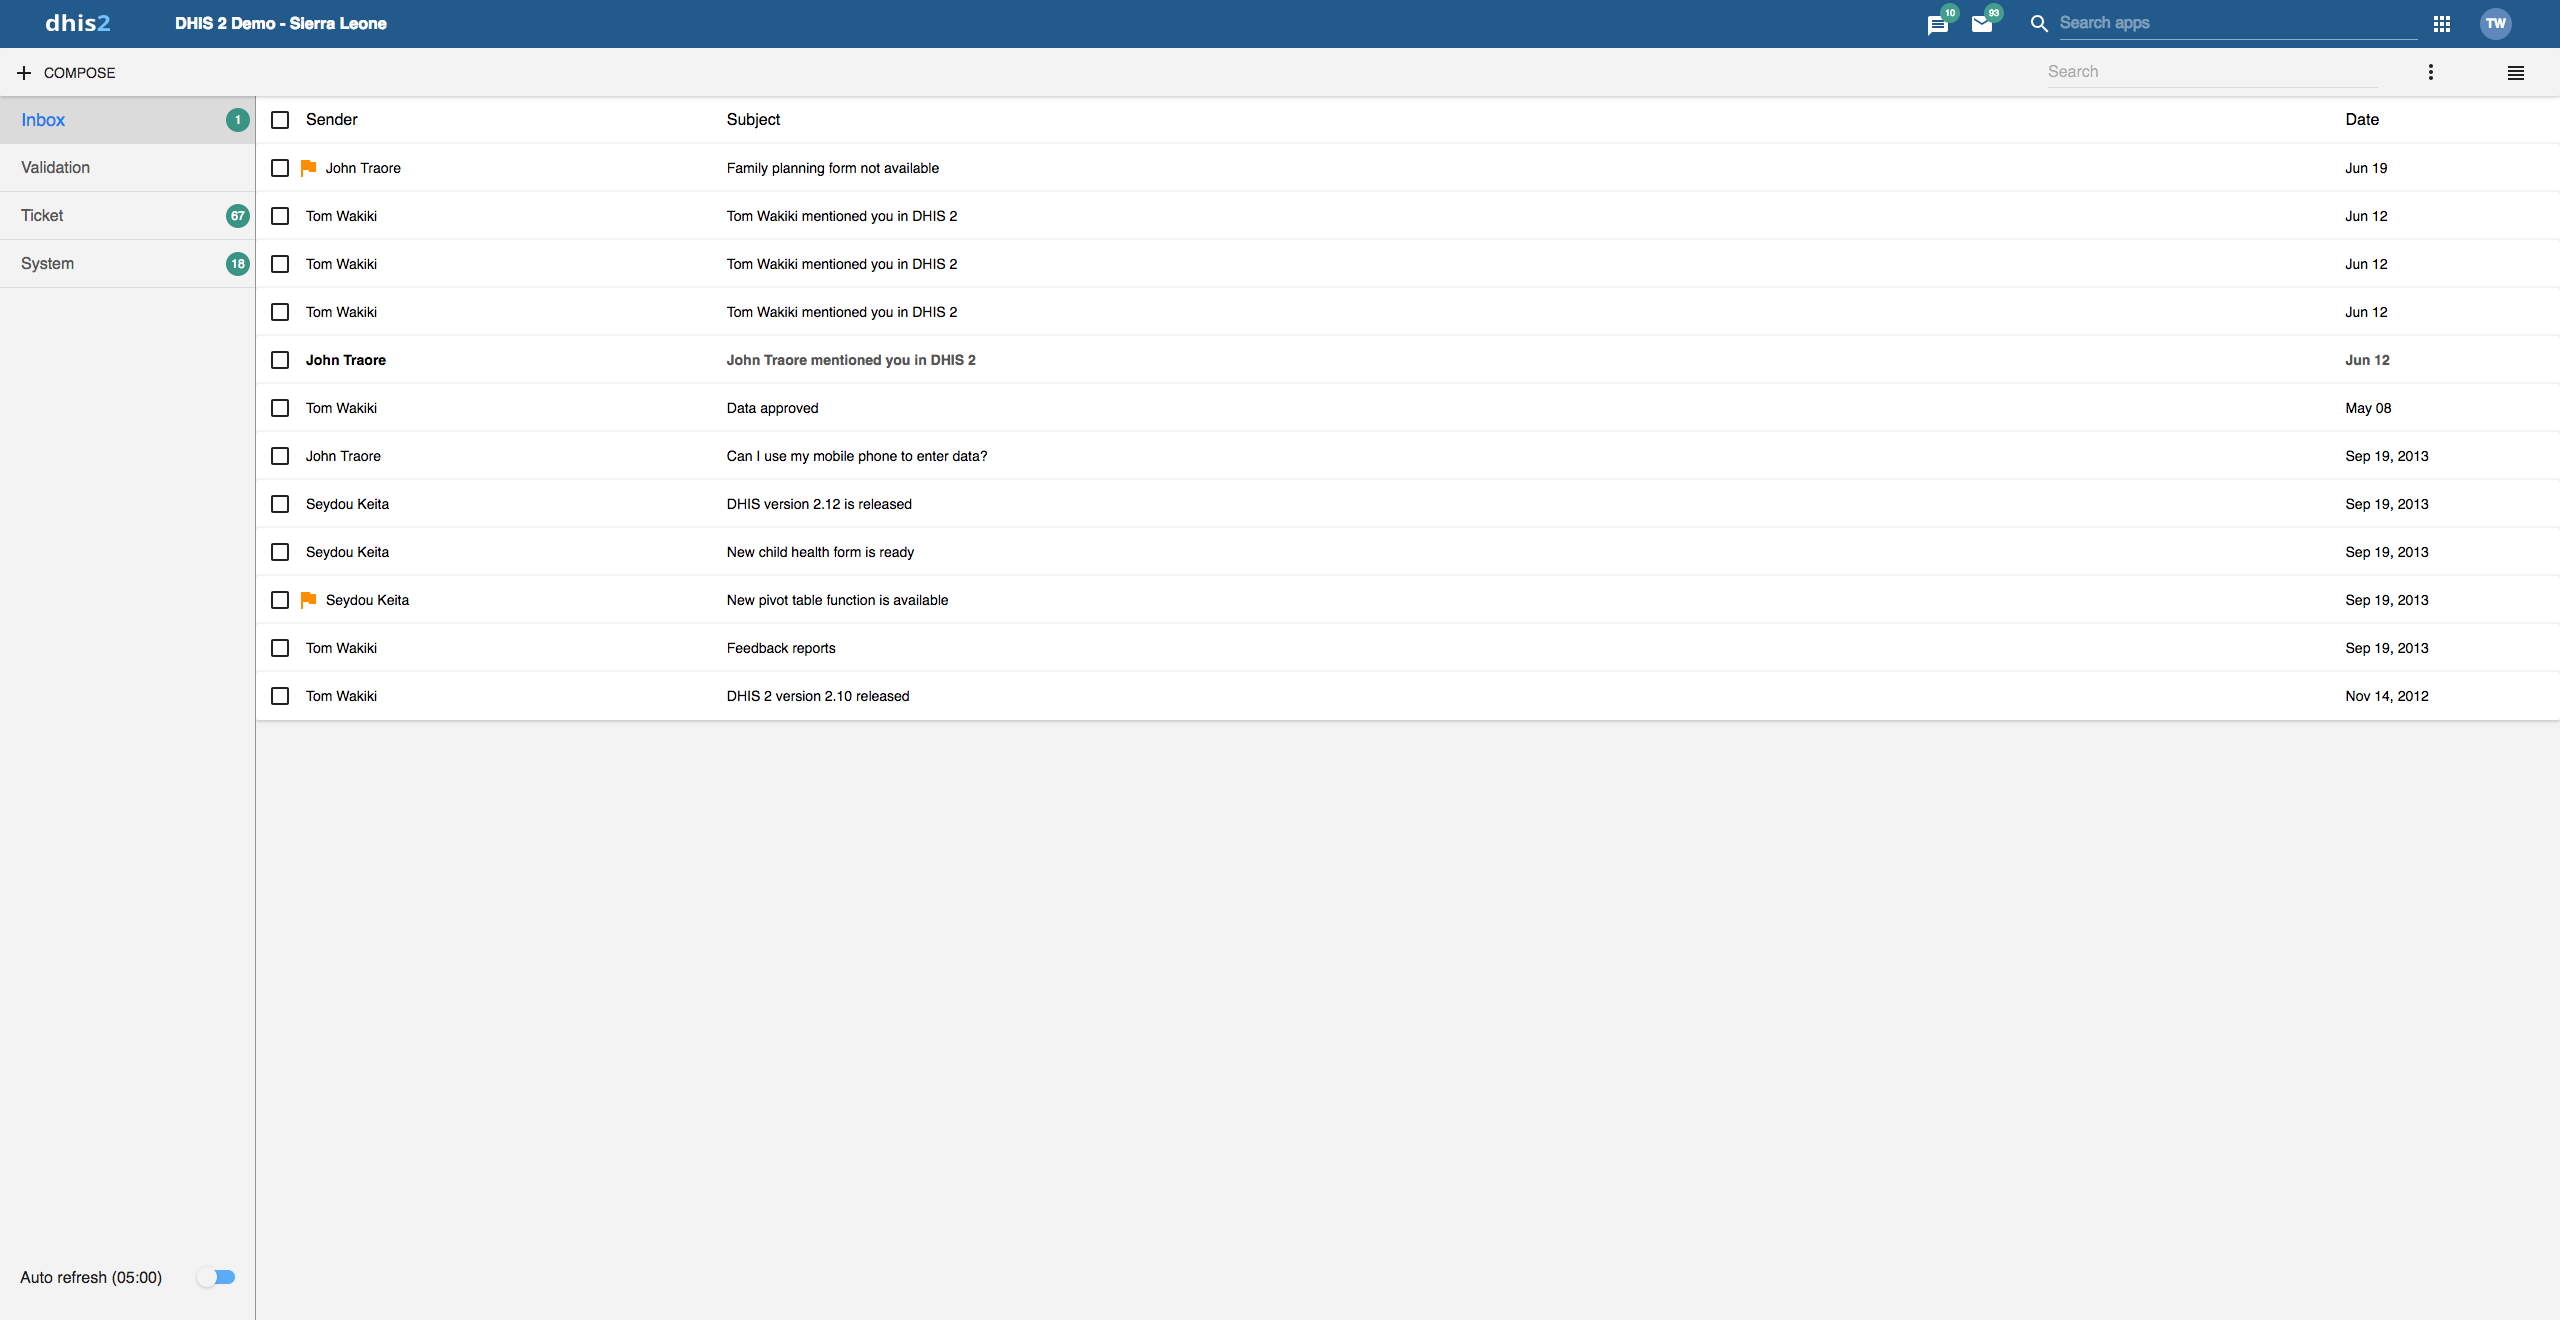
Within DHIS2 you can send messages and feedback messages to users, user groups and organisation units. When you send a feedback message, it is routed to a particular user group called the feedback recipient group. If you are a member of this user group, you have access to feedback handling tools. You can, for example, set the status of an incoming feedback to "Pending" while you are waiting for information.
In addition to the user-to-user and feedback messages, depending on your configuration the system will also send you system-generated messages. These messages could be triggered by different events, including system or background job failures and validation analysis results. Feedback handling tools are also available for validation results and the priority will be set to the importance of the validation rule violated.
To visit the app click message icon in header bar or find the Messaging app in the app search box.
Note
Messages and feedback messages are not sent to users' e-mail addresses, the messages only appear within DHIS2.
With 2.30 we introduced a new messaging app which offers a richer messaging experience. Specifically:
- Switch between list view and compact view by clicking the icon in the top right corner.
- The list view is simplistic and gives a good overview of all messages and is especially suited for feedback and validation messages.
- The compact view is a modern way of view messages where the user has more information in one view, hence viewing and replying several messages is easier.
The first screenshot in this section displays list view, while the screenshot in section Read a message displays the compact view.
A new search field is added which enables the user to search for messages. The search filters messages on different message attributes; subject, text and senders. This implies that you are able to narrow down the message conversation list by entering a search.
A auto refresh feature is added so that the app fetches new messages at a set interval, every 5 minutes. This feature is disabled by default.
For every message conversation you are able to add participants to the conversation. This is very useful if you want input on that particular conversation or if someone should also see the information. It is not possible to delete participants from a conversation.
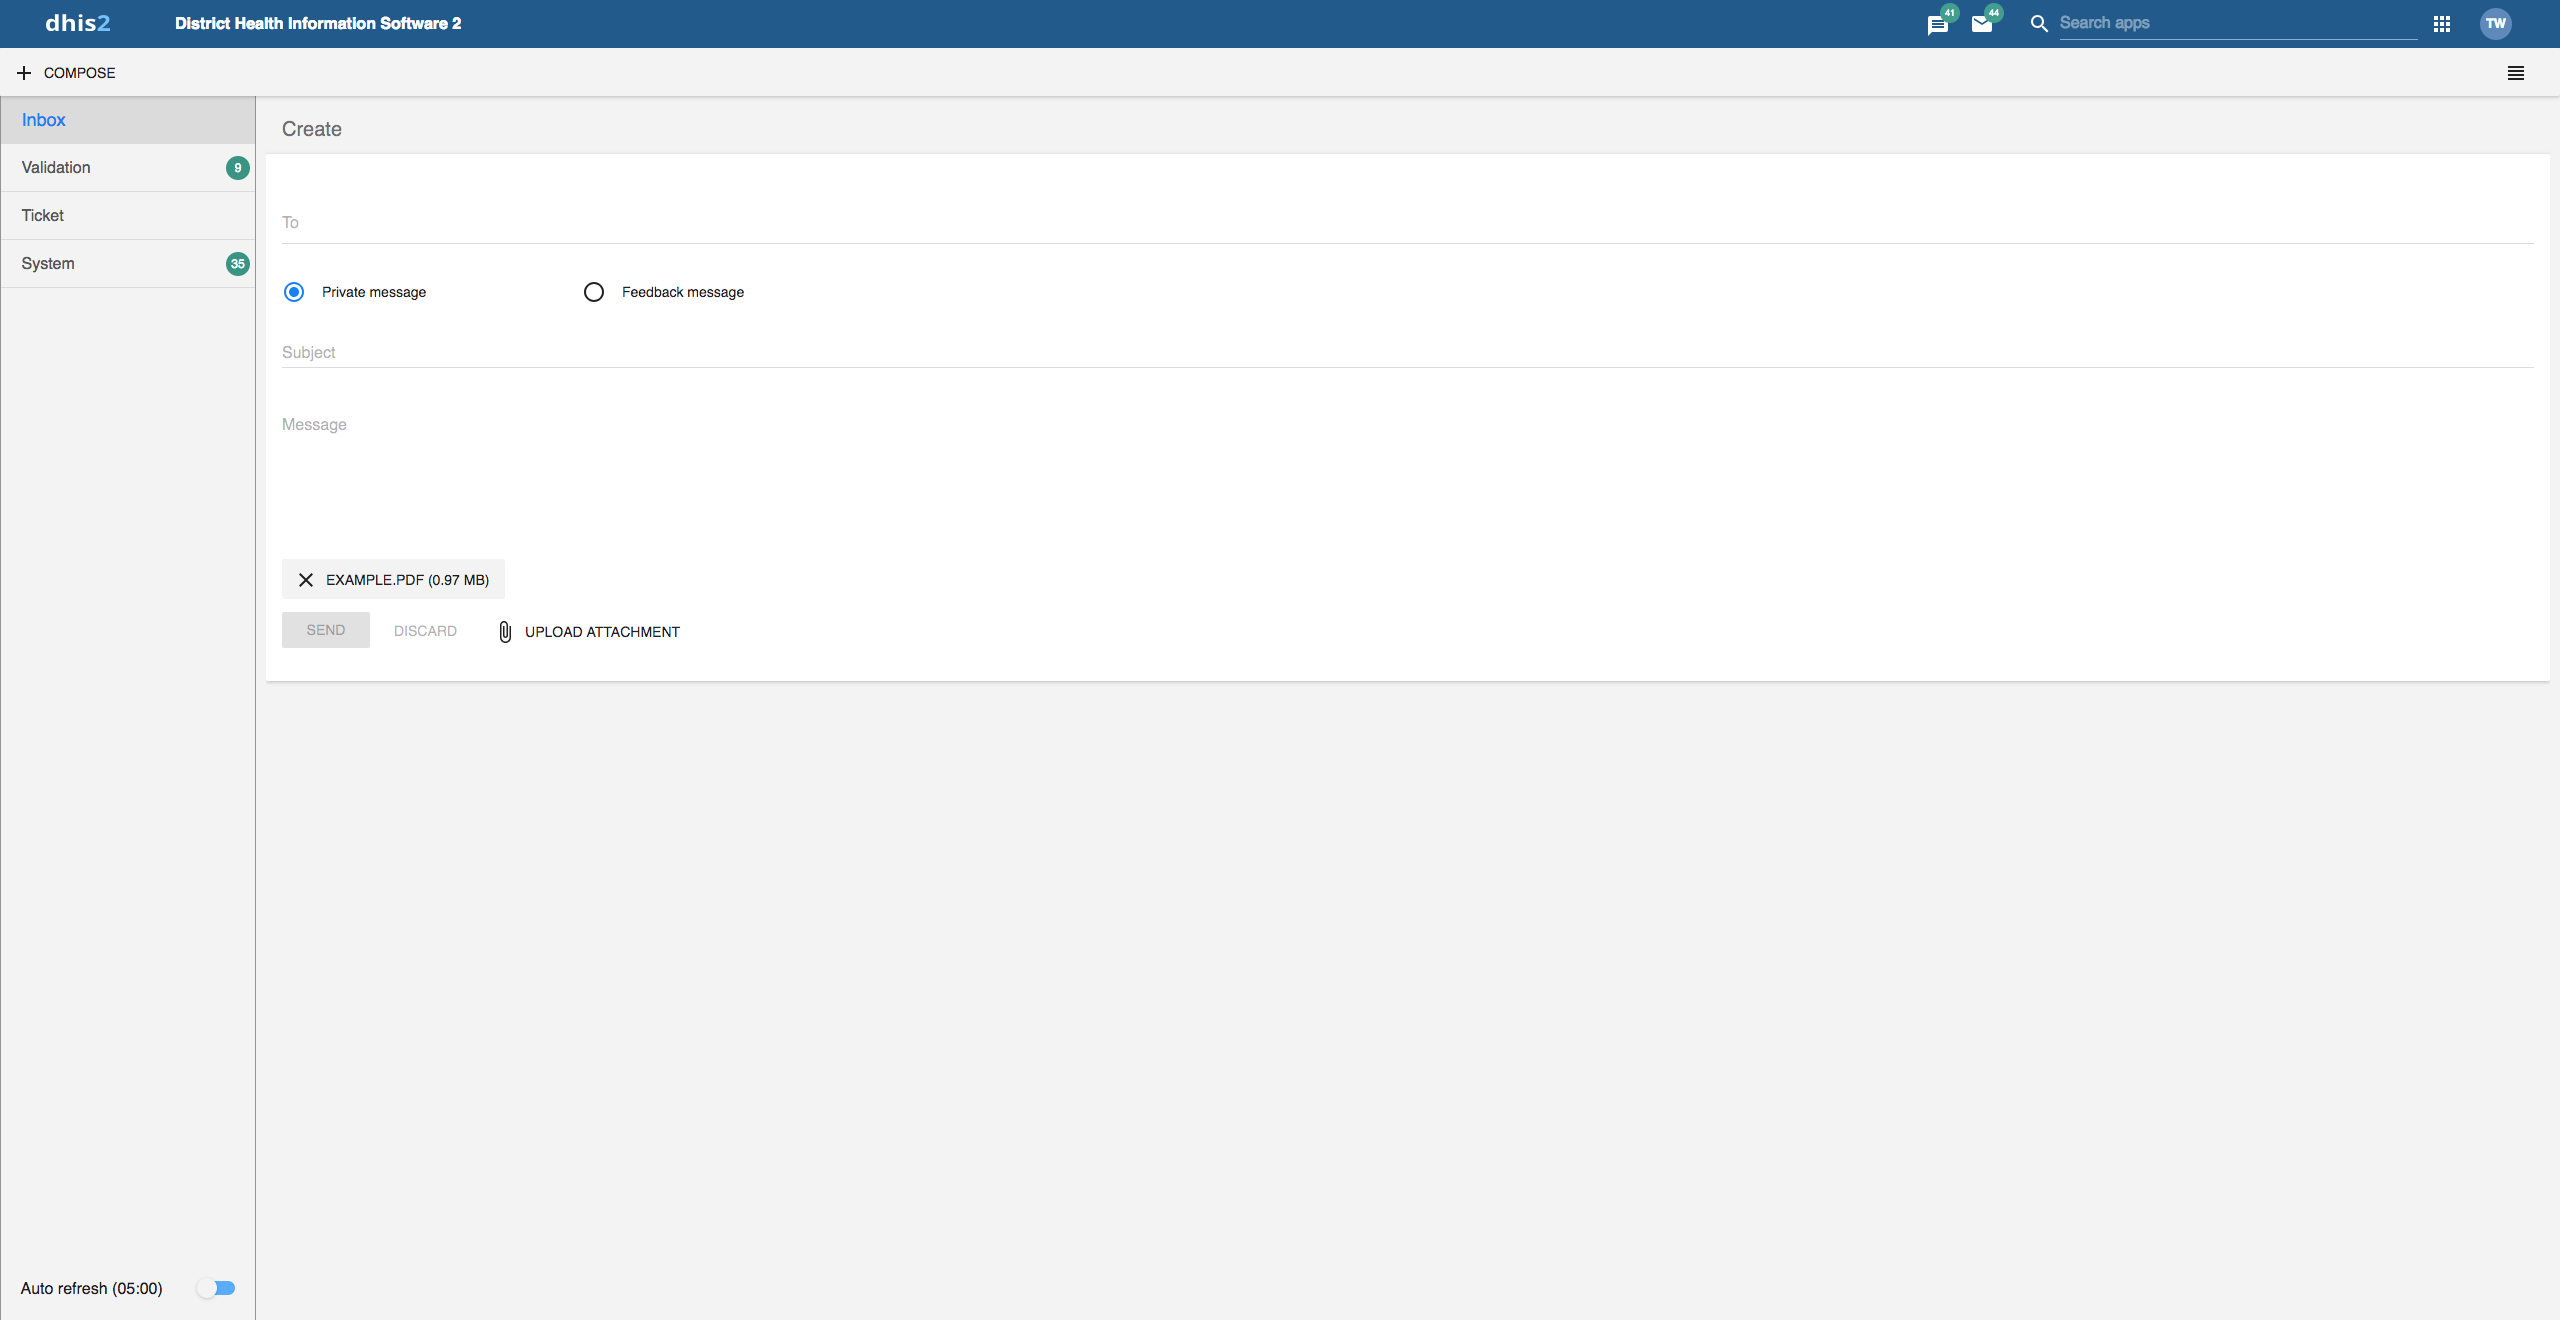
Click Compose.
Define who you want to receive the message. You can send a message to organisation units, users and user groups.
Type a subject and a message.
Click Send.
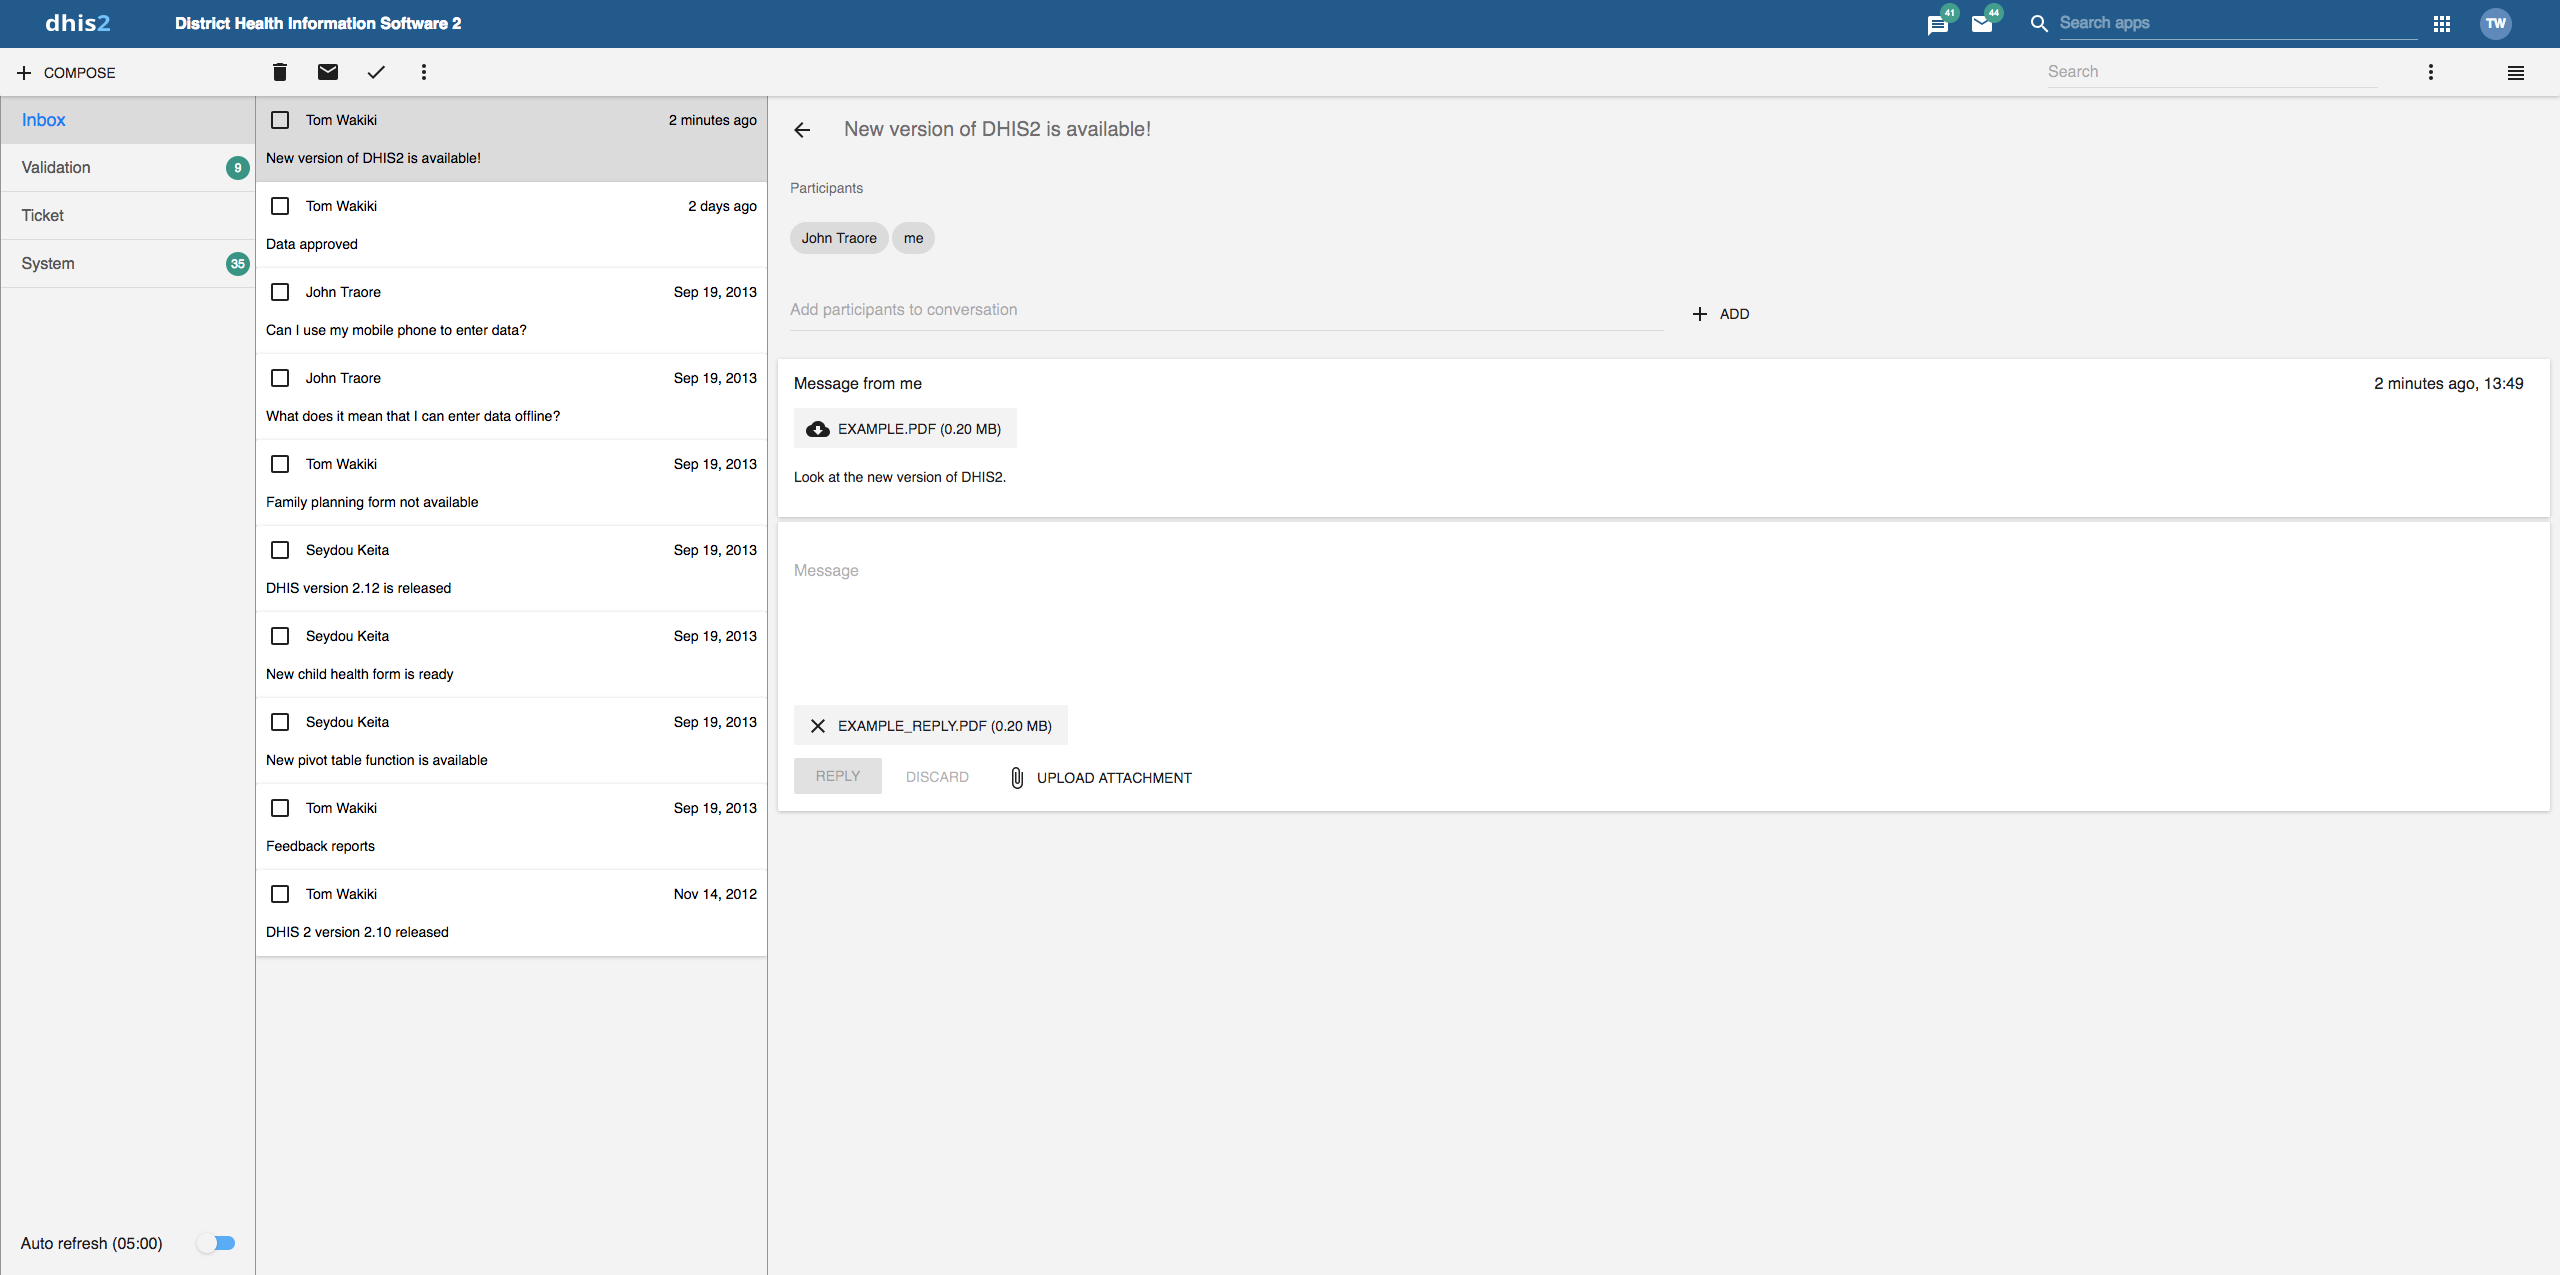
Select the appropriate message type to the left.
Click a message.
If the message is part of a conversation, you will see all messages in this conversation.
Follow the steps as for creating a message, only selecting Feedback message instead of entering recipients.
The message will be created as a feedback message and will appear in all of the specified users' Ticket folder.
With 2.31 we introduced attachments to messages. When creating or replying to a message conversation you have the possibility to add attachments. Currently there are no limitations to type or size of the file.
Note
You will only see feedback messages and have access to the extended handling tools if you are a member of the user group that is set up to handle feedback messages.
With the new app you manage extended tools for tickets and validation messages through the icon menu which appears when viewing a message or checking of messages in the conversation list.
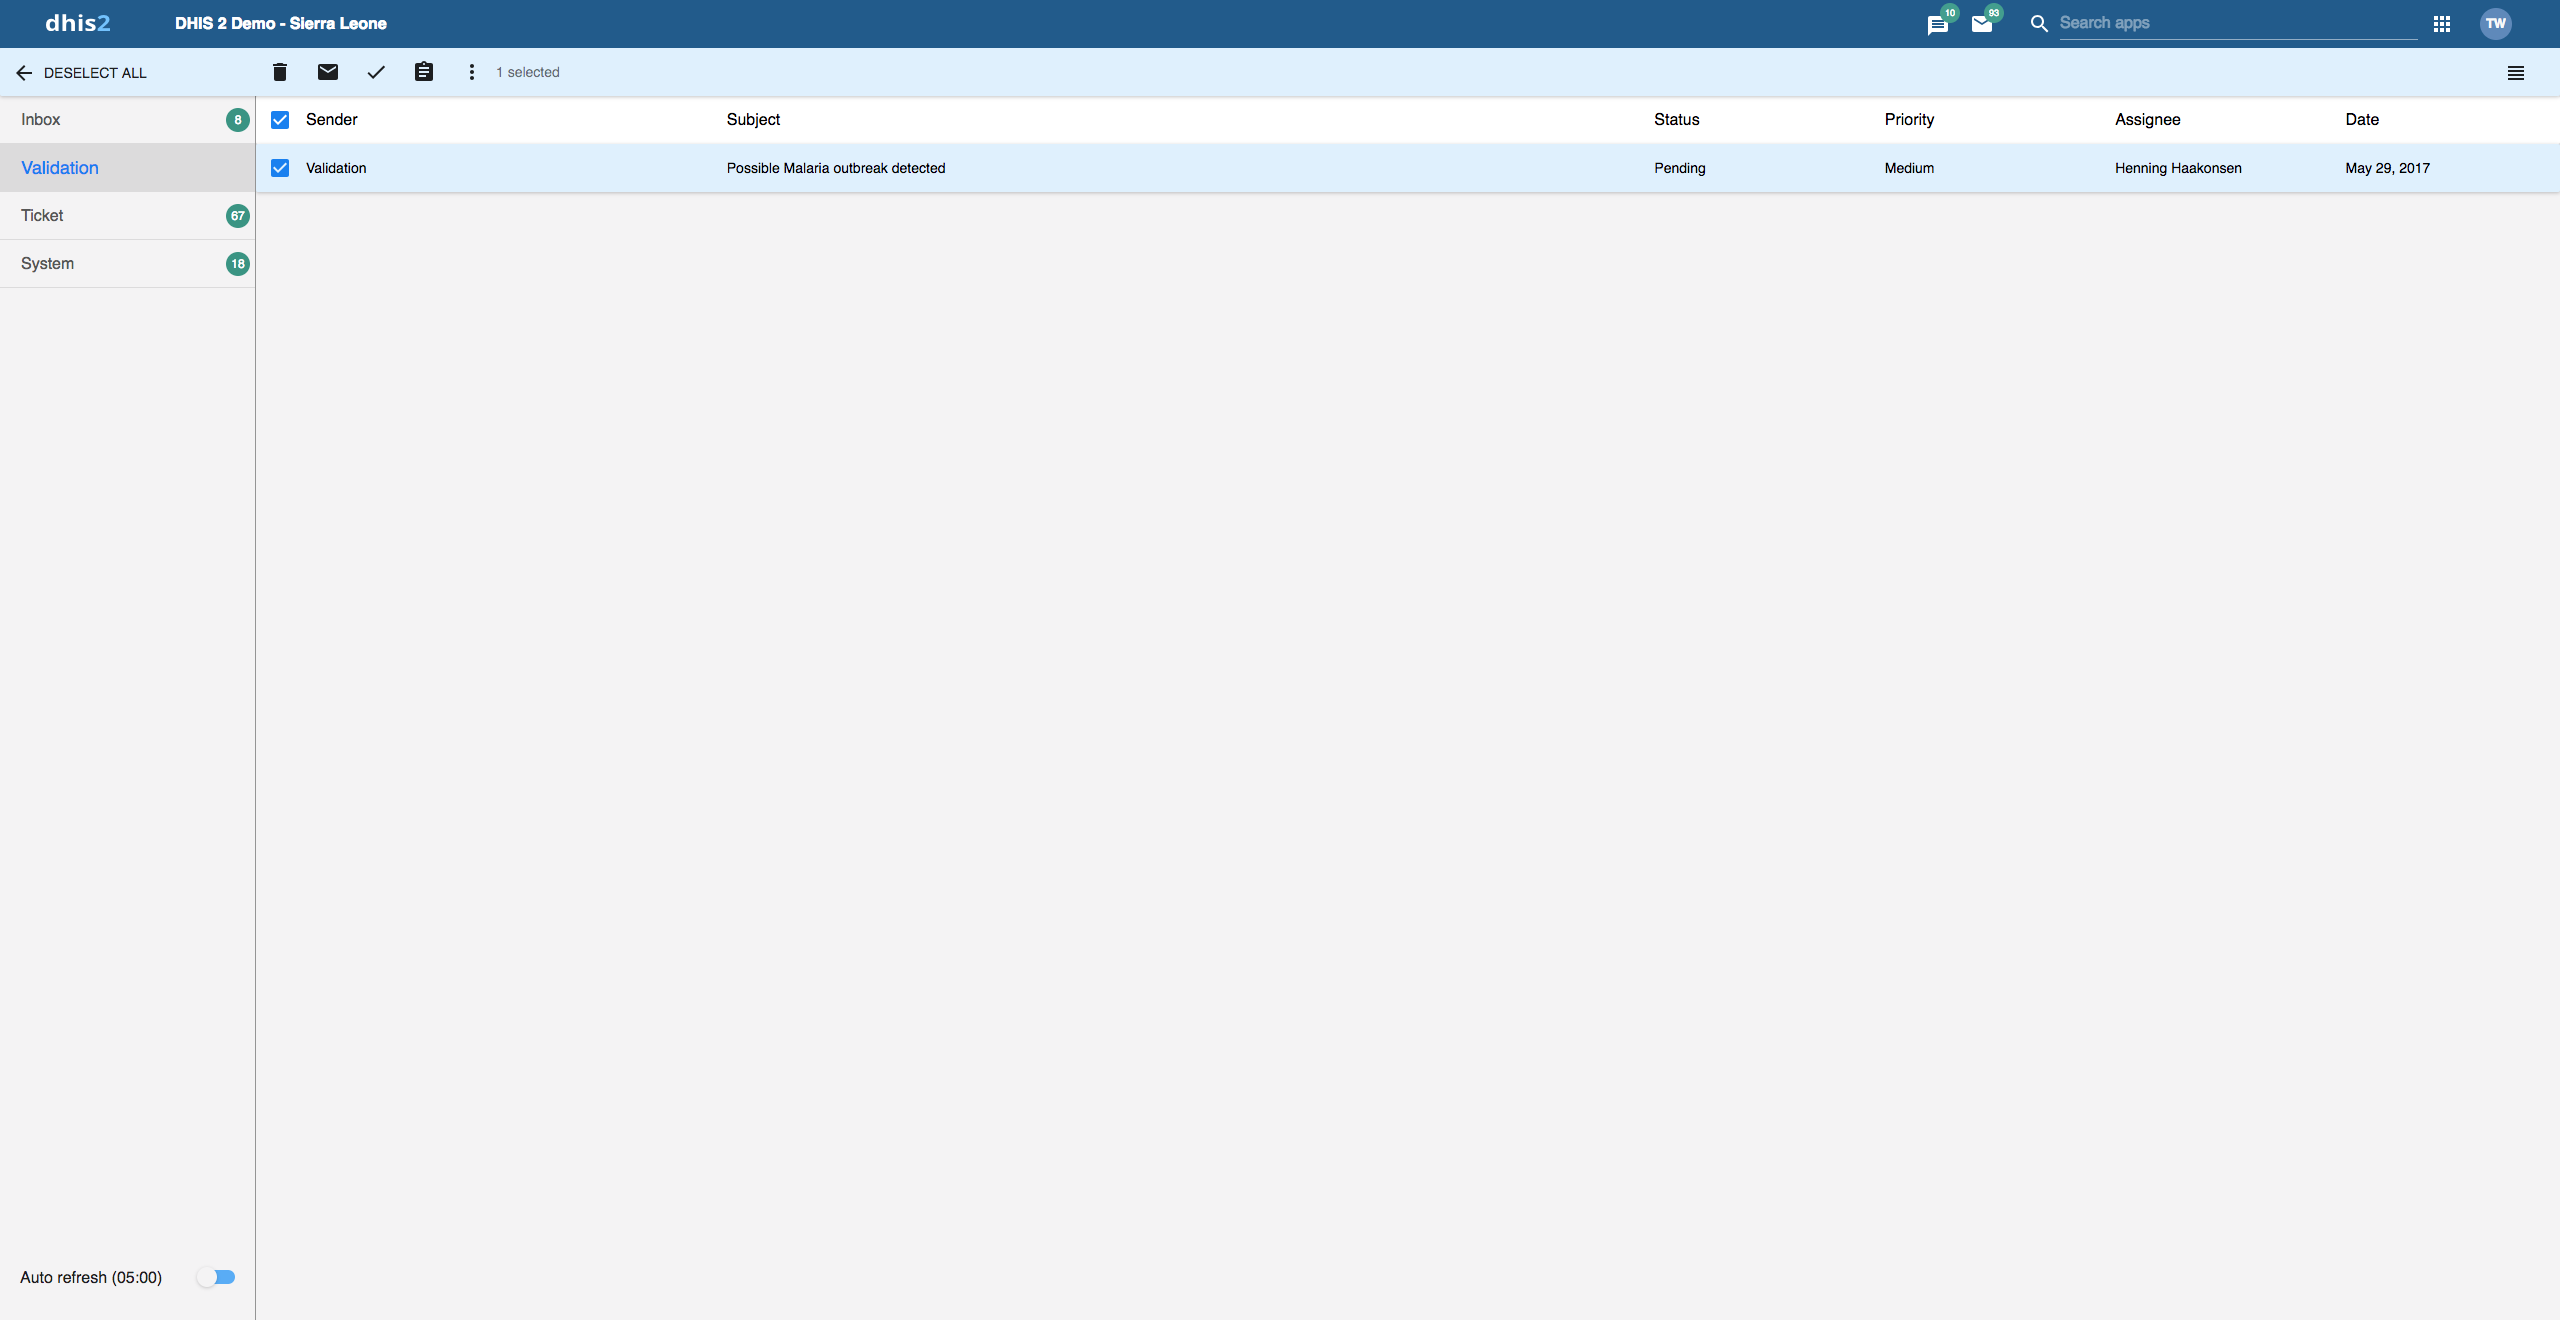

You will receive feedback messages to your Ticket folder and validation messages to your Validation folder. For feedback and validation messages you have the following options in addition to the messages options:
| Function | Description |
|---|---|
Priority | You can mark a feedback/validation message with different priorities: None, Low, Medium or High. Setting the priority makes it easier to keep track of which feedback message you need resolved first, and which feedback messages that can wait. |
Status | All feedback/validation messages get the status Open when created. To keep track of existing feedback messages, you can change the status to Pending, Invalid or Solved. You can filter feedback/validation messages based on their status with the two drop down menus in the internal header bar. |
Assigned to | You can assign a feedback message to any member of the user group that is set up to handle feedback messages. You can assign a validation message to any user in the system. - means that you haven't assigned a user to the feedback message. |
Internal reply | When you work in a feedback handling team you might want to discuss the feedback before sending an answer to the sender. You can keep this discussion in the same message conversation as the feedback itself. To send a reply that within the feedback handling user group, click INTERNAL REPLY. |
To configure the feedback message function, you must:
Create a user group (for example "Feedback message recipients") that contains all the users who should receive feedback messages.
Open the System Settings app and click General > Feedback recipients and select the user group you created in the previous step.
In Edit user profile, you can update personal information like your email address, mobile number, date of birth, profile picture, and more. These details are visible to others when you send messages. You can also provide account names for direct messaging services used by the system. If your email address is set and the system is configured to send emails, a Verify Email button will appear next to your email address.
If your email is set and email notifications are enabled, you can verify your email here. An unverified email will trigger a warning, and you may be restricted from certain actions that require verification.
In Edit user settings, you can change the display language of DHIS2 and the language of the database. The database language is the translated content of the metadata, such as data elements and indicators. You can also choose a display style, and enable or disable SMS and email notifications. If you wish to, you can choose to display a short name, such as "Joe" in the analysis modules, rather than your full name.
In Edit account settings, you can reset your password and set up 2-Factor Authentication (2FA). Depending on your system configuration, you can choose between methods like TOTP or email-based verification to complete the setup.
In the View full profile section, you find a summary of your profile details. This section includes a few fields that you cannot edit yourself, such as user roles and user organisation units.
In Manage personal access tokens you can view the existing personal access tokens, revoke existing tokens and generate new ones. Personal access tokens are an alternative to using passwords for authentication and useful for providing (restricted) access to scripts and external applications. Note that the values of newly generated personal access tokens are only visible right after generating.
In the About DHIS2 section, you find a list of details about the DHIS2 instance.
Two-Factor Authentication (2FA) is an extra layer of security for your DHIS2 account. When 2FA is enabled, you’ll need to provide a second verification method (in addition to your password) to access your account. The available methods for 2FA are:
Note: 2FA is highly recommended for added account security.
To enable or disable 2FA on your account, follow these steps:
Depending on your DHIS2 instance’s configuration, you may have one or both of the following 2FA options available:
The system will display the available 2FA options based on what has been configured by your administrator.
Tip: If both TOTP and email-based 2FA are available, you’ll need to choose which one to set up.
If you have not set up 2FA yet, you will be presented with the following flow:
If you choose to set up email-based 2FA, the following steps will apply:
Email Verification: If your email has not been verified yet, you will receive a warning informing you that you must first verify your email address before enabling email-based 2FA.
Enter the Code: After verifying your email, a code will be sent to your email address. Enter the code into the provided field on the 2FA settings page to complete the setup.
If you have already enabled 2FA, the system will show the current method that is set up. If the system allows both TOTP and email-based 2FA, you will see a radio button with your current selection (either TOTP or email). The option will be disabled, indicating your current 2FA method.
If you wish to disable 2FA, follow these steps:
Important Notes
Single 2FA Configuration at a Time: You can only have one method of 2FA enabled at a time (either TOTP or email). If both methods are available, you will be required to choose one to configure and use.
Email Verification Required for Email-based 2FA: Before enabling email-based 2FA, make sure your email address is verified. You won’t be able to set up email-based 2FA until this step is completed.
For detailed information on the 2FA setup for your system, refer to the system settings section or contact your DHIS2 administrator.
In the Maintenance app you configure all the metadata objects you need to collect and analyze data:
Categories
Data elements
Data sets and data entry forms
Indicators
Organisation units
Validation rules
Attributes
Constants
Options sets
Legends
Predictors
Push reports
External map layers
SQL views
Locales
Analytics table hooks
Note
The functions you have access to depend on your user role's access permissions.
Metadata objects are presented in a list with predefined columns that are relevant for each object. You may customize which columns are shown in the list for the current object. These customizations are per user, and therefore will not affect other users. Note that these changes do not edit any metadata, just how the list is presented.
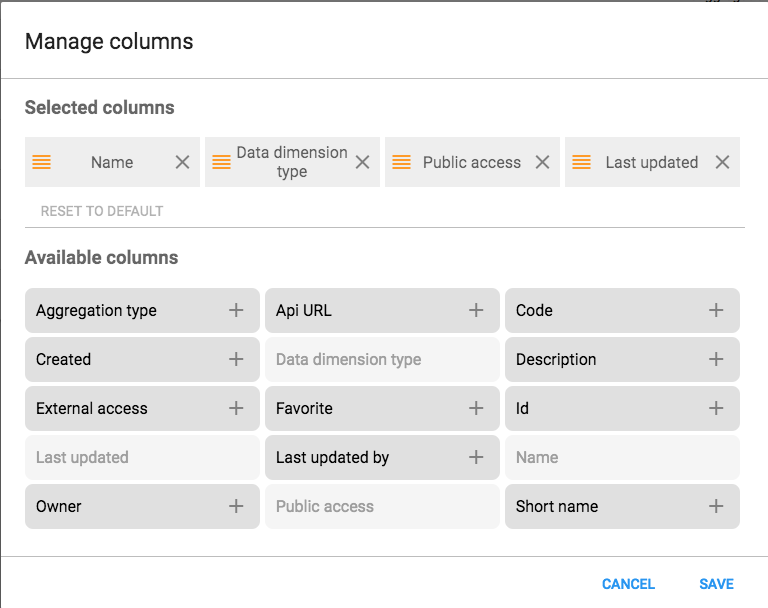
 icon to the top right of the list of objects you want to configure.
 icon.
icon.You may easily reset to the default values by clicking the Reset to default button.
You can download the metadata for the object you are currently viewing. The metadata download will respect any filters you have active for the list.
icon to the top right of the list of objects you want to configure.Categories are typically a concept, for example "Gender", "Age" or "Disease Status". Data elements such as "Number of cases of confirmed malaria" are often broken into smaller component parts to determine, for example, the number of confirmed malaria cases of particular age groups.
Use categories to disaggregate data elements into individual components. You can also use categories to assign metadata attributes to all data recorded in a specific dataset, such as "Implementing partner" or "Funding agency."
Create three categories: "Under 1", "1-5" and "Over 5". Assign them as categories to the data element. This creates three separate fields for this data in the data entry forms:
Number of confirmed malaria cases (Under 1)
Number of confirmed malaria cases (1-5)
Number of confirmed malaria cases (Over 5)
Without categories, you would have had to create each of the data elements listed above separately.
In the Maintenance app, you manage the following and category objects:
| Object type | Available functions |
|---|---|
| Category option | Create, edit, clone, share, delete, show details and translate |
| Category | Create, edit, clone, share, delete, show details and translate |
| Category combination | Create, edit, clone, share, delete, show details and translate |
| Category option combination | Edit and show details |
| Category option group | Create, edit, clone, share, delete, show details and translate |
| Category option group set | Create, edit, clone, share, delete, show details and translate |
Create all category options.
Create categories composed by the multiple category options you've created.
Create category combinations composed by either one or multiple categories.
Create data elements and assign them to a category combination.
When possible, recycle category options. For instance, there might be two categories which might share a particular category option (for example \<1 year of age). When creating the categories, this category option could be reused. This is important if particular category options (or category option combinations) that need to be analyzed together.
Open the Maintenance app and click Category > Category option.
Click the add button.
Fill in the form:
Name
Short name (optional)
Code (optional)
Form name (optional) Category options can have a form name. These will be displayed in the data entry app as a column header instead of the display name for the respective category option.
Description
Start date (optional)
End date (optional)
Select organisation units and assign them.
Tip
You can automatically select all organisation units that belong to an organisation unit level or organisation unit group, for example "Chiefdom" or "Urban". To do this:
Select an Organisation unit level or Organisation unit group and click Select.
Click Save.
When you have created all category options for a particular category, you can create that category.
Open the Maintenance app and click Category > Category.
Click the add button.
Fill in the form:
Name
Short name
Code
Description
Data dimension type
A category can either be of type "Disaggregation" or "Attribute". For disaggregation of data elements, you select Disaggregation. The data dimension type "Attribute" allows the category to be used to assign a combination of categories to data recorded through a data set.
Data dimension
If you select Data dimension, the category will be available to the analytics as another dimension, in addition to the standard dimensions of "Period" and "Organisation unit".
Select category options and assign them.
Click Save.
Category combinations let you combine multiple categories into a related set.
You can disaggregate the data element "Number of new HIV infections" into the following categories:
HIV Service: "Other", "PMTCT", "TB"
Gender: "Male", "Female"
In this example, there are two levels of disaggregation that consist of two separate data element categories. Each data element category consists of several data element category options.
In DHIS2, different data elements are disaggregated according to a common set of categories. By combining these different categories into a category combination and assigning these combinations to data elements, you can apply the appropriate disaggregation levels quickly to a large number of data elements.
Open the Maintenance app and click Category > Category combination.
Click the add button.
Fill in the form:
Name
Code
Data dimension type
Skip category total in reports
Select categories and assign them.
Click Save.
You can group and classify category options by using category option groups. The main purpose of the category option group set is to add more dimensionality to your captured data for analysis in for example the Pivot table or Data Visualizer apps.
Consider a system where data is collected by "projects", and projects are modelled as category options. The system must be able to analyse data based on which donor supports the project. In this case, create a category option group set called "Donor". Each donor can be created as a category option group, where each category option / project is put in the appropriate group. In the data analysis applications, the "Donor" group set will appear as a data dimension, while each donor appears as a dimension item, ready to be included in reports.
To create a category option group:
Open the Maintenance app and click Category > Category option group.
Click the add button.
Fill in the form:
Name
Short name: Define a short name for the data element.
Code
Description
Data dimension type
Select Category options and assign them.
Click Save.
You can group category option groups in category option group sets. The main purpose of the category option group set is to add more dimensionality to your captured data for analysis in for example the Pivot table or Data Visualizer apps.
Open the Maintenance app and click Category > Category option group set.
Click the add button.
Fill in the form:
Name
Short name
Description
Data dimension
Data dimension type
Select Category option groups and assign them.
Click Save.
When categories and category combinations have the data dimension type "Attribute", they can apply a common set of attributes to a related set of data values contained in a data set. When category combinations are used as an attribute, they serve as another dimension (similar to "Period" and "Organisation unit") which you can use in your analysis.
Suppose that an NGO is providing ART services in a given facility. They would need to report each month on the "ART monthly summary", which would contain a number of data elements. The NGO and project could potentially change over time. In order to attribute data to a given NGO and project at any point in time, you need to record this information with each data value at the time of data entry.
Create two categories with the data dimension type "Attribute": "Implementing partner" and "Projects".
Create a category combination with the data dimension type "Attribute": "Implementing partners and projects".
Assign the categories you've created to the category combination.
Create a data set called "ART monthly summary" and select the "Implementing partners and projects" category combination.
When you enter data in the Data entry app, you can select an "Implementing partner" and a "Project". Each recorded data value is assigned a specific combination of these categories as an attribute. These attributes (when specified as a dimension) can be used in the analysis applications similar to other dimensions, for example the period and organisation unit.
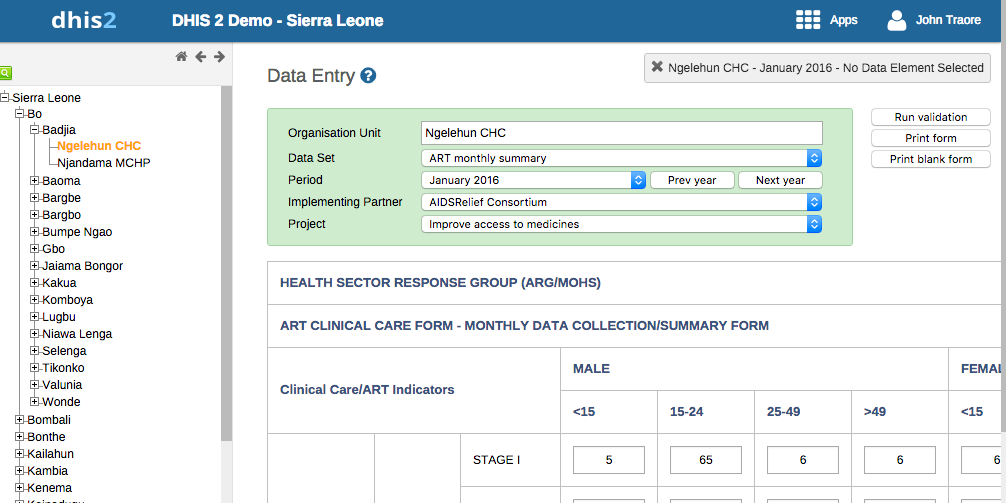
You can assign a code to category option combinations. This makes data exchange between DHIS2 and external systems easier. The system creates the category option combinations automatically.
Open the Maintenance app and click Category > Category option combination.
In the list, find the object you want to modify.
Click the options menu and select Edit.
Enter a code.
Click Save.
Cloning a data element or other objects can save time when you create many similar objects.
Open the Maintenance app and find the type of metadata object you want to clone.
In the object list, click the options menu and select Clone.
Modify the options you want.
Click Save.
You can assign different sharing settings to metadata objects, for example organisation units and tracked entity attributes. These sharing settings control which users and users groups that can view or edit a metadata object.
Some metadata objects also allow you to change the sharing setting of data entry for the object. These additional settings control who can view or enter data in form fields using the metadata.
Note
The default setting is that everyone (Public access) can find, view and edit metadata objects.
Open the Maintenance app and find the type of metadata object you want to modify.
In the object list, click the context menu and select Sharing settings.
(Optional) Add users or user groups: search for a user or a user group and select it. The user or user group is added to the list.
Change sharing settings for the access groups you want to modify.
Can edit and view: The access group can view and edit the object.
Can view only: The access group can view the object.
No access (only applicable to Public access): The public won't have access to the object.
Change data sharing settings for the access groups you want to modify.
Can capture data: The access group can view and capture data for the object.
Can view data: The access group can view data for the object.
No access: The access group won't have access to data for the object.
Click Close.
Note
You can only delete a data element and other data element objects if no data is associated to the data element itself.
Warning
Any data set that you delete from the system is irrevocably lost. All data entry forms, and section forms which may have been developed will also be removed. Make sure that you have made a backup of your database before deleting any data set in case you need to restore it at some point in time.
Open the Maintenance app and find the type of metadata object you want to delete.
In the object list, click the options menu and select Delete.
Click Confirm.
Open the Maintenance app and find the type of metadata object you want to view.
In the object list, click the options menu and select Show details.
DHIS2 provides functionality for translations of database content, for example data elements, data element groups, indicators, indicator groups or organisation units. You can translate these elements to any number of locales. A locale represents a specific geographical, political, or cultural region.
Tip
To activate a translation, open the System Settings app, click > Appearance and select a language.
Open the Maintenance app and find the type of metadata object you want to translate.
In the object list, click the options menu and select Translate.
Tip
If you want to translate an organisation unit level, click directly on the Translate icon next to each list item.
Select a locale.
Type a Name, Short name and Description.
Click Save.
Data elements are the base of DHIS2. Data elements define what is actually recorded in the system, for example number of immunisations or number of cases of malaria.
Data elements such as "Number of cases of confirmed malaria" are often broken into smaller component parts to determine, for example, the number of confirmed malaria cases of particular age groups.
In the Maintenance app, you manage the following data elements objects:
| Object type | Available functions |
|---|---|
| Data element | Create, edit, clone, share, delete, show details and translate |
| Data element group | Create, edit, clone, share, delete, show details and translate |
| Data element group set | Create, edit, clone, share, delete, show details and translate |
Create all category options.
Create categories composed by the multiple category options you've created.
Create category combinations composed by either one or multiple categories.
Create data elements and assign them to a category combination.
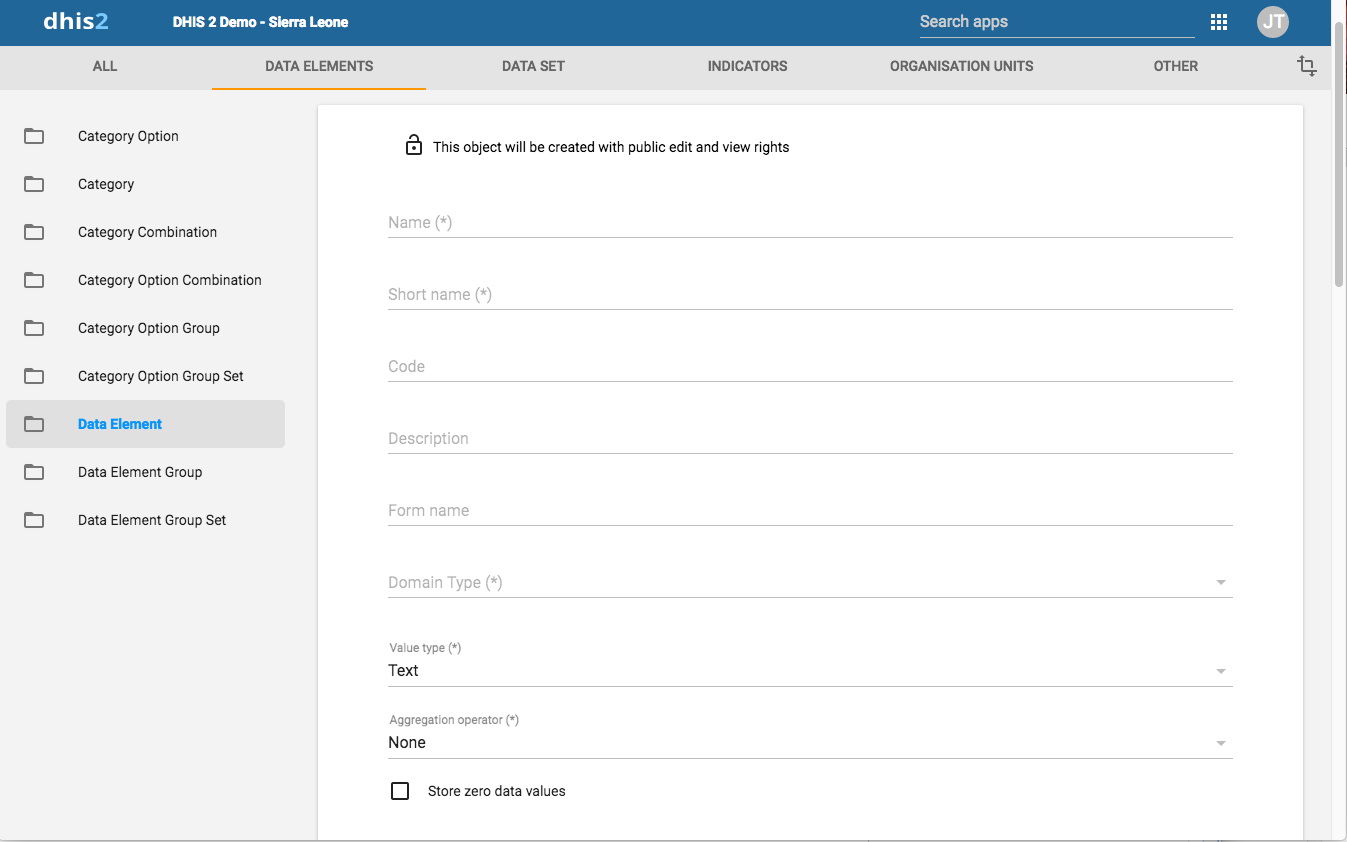
Open the Maintenance app and click Data elements > Data element.
Click the add button.
In the Name field, define the precise name of the data element.
Each data element must have a unique name.
In the Short name field, define a short name for the data element.
Typically, the short name is an abbreviation of the full data element name. This attribute is often used in reports to display the name of the data element, where space is limited.
(Optional) In the Code field, assign a code.
In many countries data elements are assigned a code.
(Optional) In the Color field, assign a color which will be used for this data element in the data capture apps.
(Optional) In the Icon field, assign an icon which will be used for this data element in the data capture apps.
In the Description field, type a description of the data element. Be as precise as possible and include complete information about how the data element is measured and what its purpose is.
(Optional) In the Field mask field, you may type a template that's used to provide hints for correct formatting of the data element.
NOTE
So far this is only implemented in the DHIS2 Android Capture app; not in the Capture and Tracker Capture web apps.
The following are special characters that can be used in the mask. The special characters match exactly one character of the given type.
| Character | Match |
|---|---|
| \d | digit |
| \x | lower case letter |
| \X | capital letter |
| \w | any alphanumeric character |
For example, the pattern can be used to show hyphens as needed in the input field of the data element. E.g "\d\d\d-\d\d\d-\d\d\d, would show a hyphen for every third digit.
In the Form name field, type an alternative name of the data element. This name can be used in either section or automatic data entry forms. The form name is applied automatically.
In the Domain type field, select whether the data element is an aggregate or tracker type of data element.
In the Value type field, select the type of data that the data element will record.
| Value type | Description |
|---|---|
| Age | Dates rendered as calendar widget OR by entering number of years, months and/or days which calculates the date value based on current date. The date will be saved in the backend. |
| Coordinate | A point coordinate specified as longitude and latitude in decimal degrees. All coordinate should be specified in the format [-19.23 , 56.42] with brackets and a comma separating the longitude and latitude. |
| Date | Dates rendered as calendar widget in data entry. |
| Date & time | Is a combination of the DATE and TIME data elements. |
| Email. | |
| File | A file resource where you can store external files, for example documents and photos. |
| Image | A file resource where you can store photos. Unlike the FILE data element, the IMAGE data element can display the uploaded image directly in forms. |
| Integer | Any whole number (positive and negative), including zero. |
| Letter | A single letter. |
| Long text | Textual value. Renders as text area with no length constraint in forms. |
| Negative integer | Any whole number less than (but not including) zero. |
| Number | Any real numeric value with a single decimal point. Thousands separators and scientific notation is not supported. |
| Percentage | Whole numbers inclusive between 0 and 100. |
| Phone number | Phone number. |
| Positive integer | Any whole number greater than (but not including) zero. |
| Positive or zero integer | Any positive whole number, including zero. |
| Organisation unit | Organisation units rendered as a hierarchy tree widget. If the user has assigned "search organisation units", these will be displayed instead of the assigned organisation units. |
| Unit interval | Any real number greater than or equal to 0 and less than or equal to 1. |
| Text | Textual value. The maximum number of allowed characters per value is 50,000. |
| Time | Time is stored in HH:mm format. HH is a number between 0 and 23 mm is a number between 00 and 59 |
| Username | DHIS2 user. Rendered as a dialog with a list of users and a search field. The user will need the "View User" authority to be able to utilise this data type |
| Yes/No | Boolean values, renders as drop-down lists in data entry. |
| Yes only | True values, renders as check-boxes in data entry. |
In the Aggregation type field, select the default aggregation operation that will be used on the data element.
Most data elements should have the Sum operator. This includes all data elements which should be added together. Other data elements, such as staffing levels, should be set to use the Average operator, when values along the time dimension should not be added together, but rather averaged.
| Aggregation operator | Description |
|---|---|
| Average | Average the values in both the period as and the organisation unit dimensions. |
| Average (sum in organisation unit hierarchy) | Average of data values in the period dimension, sum in the organisation unit dimensions. |
| Count | Count of data values. |
| Min | Minimum of data values. |
| Max | Maximum of data values. |
| None | No aggregation is performed in any dimension. |
| Sum | Sum of data values in the period and organisation unit dimension. |
| Standard deviation | Standard deviation (population-based) of data values. |
| Variance | Variance (population-based) of data values. |
If you want to save zeros for a particular reason, select Store zero data values. By default, DHIS2 does not store zeros entered in the data entry module.
In the URL field, enter a link to an in-depth description of the data element.
For example a link to a metadata repository or registry that contains detailed technical information about the definition and measurement of the data element.
In the Category combination field, define which category combination the data element should have. This is also known as the "disaggregation".
Select an Option set.
Option sets are predefined lists of options which can be used in data entry.
Select an Option set for comments.
Option sets for comments are predefined lists of options which can be used to specify standardized comments for data values in data entry.
Assign one or multiple Legends.
Legends are used in for example the Maps app to display certain data elements with certain icons.
Set the Aggregation levels to allow the data element to be aggregated at one or more levels:
In the left pane, select the levels you want to assign to the data element.
Click the right arrow to assign the aggregation levels.
By default, the aggregation will start at the lowest assigned organisation unit. If you for example select "Chiefdom", it means that "Chiefdom", "District", and "National" aggregates use "Chiefdom" (the highest aggregation level available) as the data source, and PHU data will not be included. PHU data will still be available for the PHU level, but not included in aggregations to the levels above.
If you select both "District" and "Chiefdom", it means that the "District" and "National" level aggregates use District data as their source, "Chiefdom" will use Chiefdom, and "PHU" will use PHU.
If applicable, enter custom attributes values, for example Classification or Collection method.
Note
You create custom attributes in the Maintenance app: Other > Attributes.
If applicable, select compulsory data element group sets, for example Main data element group or Tracker-based data.
Note
You'll only see data element group sets in this form if you've created them and set them to Compulsory.
You create data element group sets in the Maintenance app: Data element > Date element group set.
Click Save.
Data element groups lets you classify related data elements into a common theme. For example, two data elements "Measles immunisation" and "BCG Immunisation" might be grouped together into a data element group "Childhood immunisation".
To create a data element group:
Open the Maintenance app and click Data elements > Data element group.
Click the add button.
Fill in the form:
Name
Short name
Code
Select data elements and assign them.
Click Save.
Data element group sets allows you to categorise multiple data element groups into a set. The system uses data element group sets during analysis and reporting to combine similar data element groups into a common theme. A data element group can be part of multiple data element group sets.
Open the Maintenance app and click Data elements > Data element group set.
Click the add button.
Fill in the form:
Select data element groups and assign them.
Available data element groups are displayed in the left panel. Data element groups that are currently members of the data element group set are displayed in the right hand panel.
Click Save.
Cloning a data element or other objects can save time when you create many similar objects.
Open the Maintenance app and find the type of metadata object you want to clone.
In the object list, click the options menu and select Clone.
Modify the options you want.
Click Save.
You can assign different sharing settings to metadata objects, for example organisation units and tracked entity attributes. These sharing settings control which users and user groups can view or edit a metadata object.
Some metadata objects also allows you to change the sharing setting of data entry for the object. These additional settings control who can view or enter data in form fields using the metadata.
Note
The default setting is that everyone (Public access) can find, view and edit metadata objects.
Open the Maintenance app and find the type of metadata object you want to modify.
In the object list, click the context menu and select Sharing settings.
(Optional) Add users or user groups: search for a user or a user group and select it. The user or user group is added to the list.
Change sharing settings for the access groups you want to modify.
Can edit and view: The access group can view and edit the object.
Can view only: The access group can view the object.
No access (only applicable to Public access): The public won't have access to the object.
Change data sharing settings for the access groups you want to modify.
Can capture data: The access group can view and capture data for the object.
Can view data: The access group can view data for the object.
No access: The access group won't have access to data for the object.
Click Close.
Note
You can only delete a data element and other data element objects if no data is associated to the data element itself.
Warning
Any data set that you delete from the system is irrevocably lost. All data entry forms, and section forms which may have been developed will also be removed. Make sure that you have made a backup of your database before deleting any data set in case you need to restore it at some point in time.
Open the Maintenance app and find the type of metadata object you want to delete.
In the object list, click the options menu and select Delete.
Click Confirm.
Open the Maintenance app and find the type of metadata object you want to view.
In the object list, click the options menu and select Show details.
DHIS2 provides functionality for translations of database content, for example data elements, data element groups, indicators, indicator groups or organisation units. You can translate these elements to any number of locales. A locale represents a specific geographical, political, or cultural region.
Tip
To activate a translation, open the System Settings app, click > Appearance and select a language.
Open the Maintenance app and find the type of metadata object you want to translate.
In the object list, click the options menu and select Translate.
Tip
If you want to translate an organisation unit level, click directly on the Translate icon next to each list item.
Select a locale.
Type a Name, Short name and Description.
Click Save.
All data entry in DHIS2 is organised in data sets. A data set is a collection of data elements grouped together for data entry and data export between instances of DHIS2. To use a data set to collect data for a specific organisation unit, you must assign the organisation unit to the data set. Once you have assigned the data set to an organisation unit, that data set is available in the Data entry app. Only the organisation units that you have assigned the data set to can use the data set for data entry.
A category combination can link to both data elements and data sets. If you use a category combination for a data set, the category combinations is applicable for the whole form. This means that you can use categories to capture information which is common to an entire form, for example the name of the a project or grant. When a data set is linked to a category combination, those categories will be displayed as drop-down boxes in the Data entry app. Data captured in the form will then be linked to the selected category options from those drop-down boxes. For information about how to create categories and category combinations, see section "Manage data elements and categories". Make sure that you set the type of categories and category combinations to "Attribute".
A scenario for when categories are useful is when you need to capture a data entry form for an implementing partner organisation and a project. In that case:
Create category options and categories for all partner organisations and projects and link them in a new category combination.
Assign the category combination to the data set (form) for which you need to capture this information.
When opening this data set in data entry module, the partner organisation and project categories will automatically be rendered as drop-down boxes, allowing you to select a specific implementing partner organisation and project before continuing to do data entry.
You create and edit data sets in the Maintenance app. Here you define, for example, which data elements you want to include in the data set and the data collection frequency.
You enter data in the Data entry app. The Data entry app uses data entry forms to display the data sets. There are three types of data entry forms:
| Data entry form type | Description |
|---|---|
| Default form | Once you have assigned a data set to an organisation unit, a default form is created automatically. The default form is then available in the Data entry app for the organisation units you have assigned it to. A default form consists of a list of the data elements belonging to the data set together with a column for inputting the values. If your data set contains data elements with a non-default category combination, for example age groups or gender, additional columns are automatically created in the default form based on the different categories. If you use more than one category combination you get multiple columns in the default form with different column headings for the options. |
| Section form | If the default form doesn't meet your needs, you can modify it to create a section form. Section forms give you more flexibility when it comes to using tabular forms. In a section form you can, for example, create multiple tables with subheadings and disable (grey out) cells in a table. When you have added a section form to a data set, the section form is available in the Data entry app. |
| Custom form | If the form you want to design is too complicated for default or section forms, you can create a custom form. A custom form takes more time to create than a section form, but you have full control over the design. You can, for example, mimic an existing paper aggregation form with a custom form. This makes data entry easier, and should reduce the number of incorrectly entered data elements. When you have added a custom form to a data set, the custom form is available in the Data entry app. |
Note
If a data set has both a section form and a custom form, the system displays the custom form during data entry. Users who enter data can't select which form they want to use. In web-based data entry the order of display preference is:
Custom form (if it exists)
Section form (if it exists)
Default form
Mobile devices do not support custom forms. In mobile-based data entry the order of display preference is:
Section form (if it exists)
Default form
In the Maintenance app, you manage the following data set objects:
| Object type | Available functions |
|---|---|
| Data set | Create, assign to organisation units, edit, share, delete, show details and translate Edit compulsory data elements Add and remove multiple data sets to organisation units at once |
| Section form | Create, edit and manage grey fields |
| Section | Change display order, delete and translate |
| Custom form | Create, edit and script |
You need to have data elements and categories to create data sets and data entry forms.
Create a data set.
Assign the data set to organisation units.
A default form is created automatically.
Create a section form or a custom form.
Now you can register data in the Data entry app.
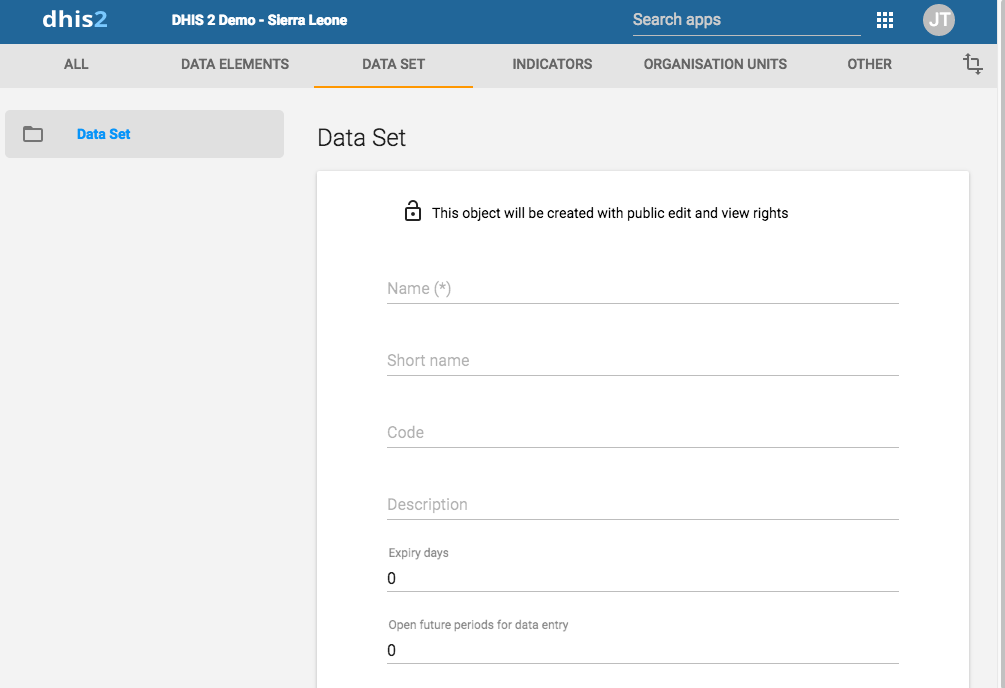
Open the Maintenance app and click Data set > Data set.
Click the add button.
In the Name field, type the precise name of the data set.
In the Short name field, define a short name for the data set.
Typically, the short name is an abbreviation of the full data set name. This attribute is often used to display the name of the data set where space is limited.
(Optional) In the Code field, assign a code.
In the Description field, type a description of the data set.
Enter the number of Expiry days.
The number of expiry days controls for how long it should be possible to enter data in the Data entry app for this data set. Expiry days refer to the number of days after the end date of the selected data entry period where the data entry form should be open for entry. After the number of days has expired, the data set will be locked for further entry.
You can set manual exceptions to this using the lock exception functionality in the Data Administration app.
Note
To allow data entry into all possible historical time periods, set the number of expiry days to zero.
If you want it to be possible to enter data for future periods, type the number of periods in the Open future periods for data entry field.
The value is the number of future periods which are available for data entry.
For a monthly data set a value of 2 allows you to enter data for 2 months in advance. This is useful for, by example, population, target and planning data.
In the Days after period to qualify for timely submission field, type the number of days in which data can be entered to be considered reported on time.
To verify the number of timely reports submitted, go to Reports > Reporting rate summary.
Select a Period type.
The period type defines the frequency of reporting for the particular data set. The frequency can for example be daily, quarterly or yearly.
Select a Category combination to assign it to the data set.
Tip
Click Add new to create category combinations that you're missing. In the form that opens, create the category combinations you need. When you're done, click Refresh values.
If you selected a category combination other than None, you may enter zero or a positive number for Open periods after category option end date. This lets you enter data in this data set for a category option up to the specified number of periods after that category option's end date.
In the Complete notification recipients list, select a user group that should receive a message when the data set is marked as complete in the Data Entry app.
The message is delivered through the DHIS2 messaging system.
If you want the user who entered the data to receive a message when the data set is marked as complete in the Data entry app, select Send notification to completing user.
The message is delivered through the DHIS2 messaging system.
If applicable, select, a Data approval workflow.
If you want it to be possible to use the data set within the Java mobile DHIS2 application, select Enable for Java mobile client.
If you want it to be mandatory to fill all values for a data element in data entry if one or more values have been filled, select All fields for data elements required.
This means that if you enter one data value for a data element in an entry field (that is for a category option combination), then you must enter data for all fields belonging to that data element (that is all category option combinations).
If you want it to be possible to mark a data entry form as complete only if the validation of that form is successful, select Complete allowed only if validation passes.
If you select this option, you can't mark the form as complete if validation fails.
If you want it to be mandatory that any missing values require a comment to justify their absence, select Missing values requires comment on complete.
(Optional) Assign one or multiple Legends.
If applicable, select Skip offline.
This option controls whether this data entry form should be downloaded and saved in the user's web browser. Normally you shouldn't select Skip offline. This is the default setting. If you have big forms which are rarely used you can consider selecting this option to speed up initial loading in the data entry module.
If applicable, select Data element decoration
If you select this option, descriptions of data elements render in call-outs in downloaded data sets in offline mode in the Data entry app.
If applicable, select Render sections as tabs.
This option is only applicable for section forms. The option allows you to render each section as a tab above the data set. You can choose whether to render the tabs horizontally or vertically. This is useful for long data sets as it allows appropriate sections to be selected quickly without going through the entire form.
If applicable, select Add custom title/subtitle.
This option allows you to add a title and/or subtitle to the dataset. You can choose whether to display the title and subtitle in the center, at line start or at line end. For security reasons, only basic styling and HTML link elements are allowed, specifically these tags: a for adding a link, u for underlining a text, and b, strong or em for styling text in bold format.
If applicable, select Render vertically.
This option is only applicable for section forms that are multi-organisation unit forms.
Select data elements and assign them.
You can override the category combination for each selected data set by clicking on the gear icon above the list of selected data elements. This allows you to utilize a specific category combination (disaggregation) within the current data set instead of the category combination associated directly with the data element itself.
Select indicators and assign them.
In the organisation unit tree, select the organisation units you want to assign the data set to.
Tip
Click Organisation unit level to select all organisation units that belong to a certain organisation level.
Click Organisation unit group to select all organisation units that belong to a certain organisation unit group.
Click Save.
You can now use the data set in the Data Entry app for the organisation units that you have assigned to and for periods according to the selected frequency (period type).
Open the Maintenance app and click Data set > Data set notification.
Click the add button.
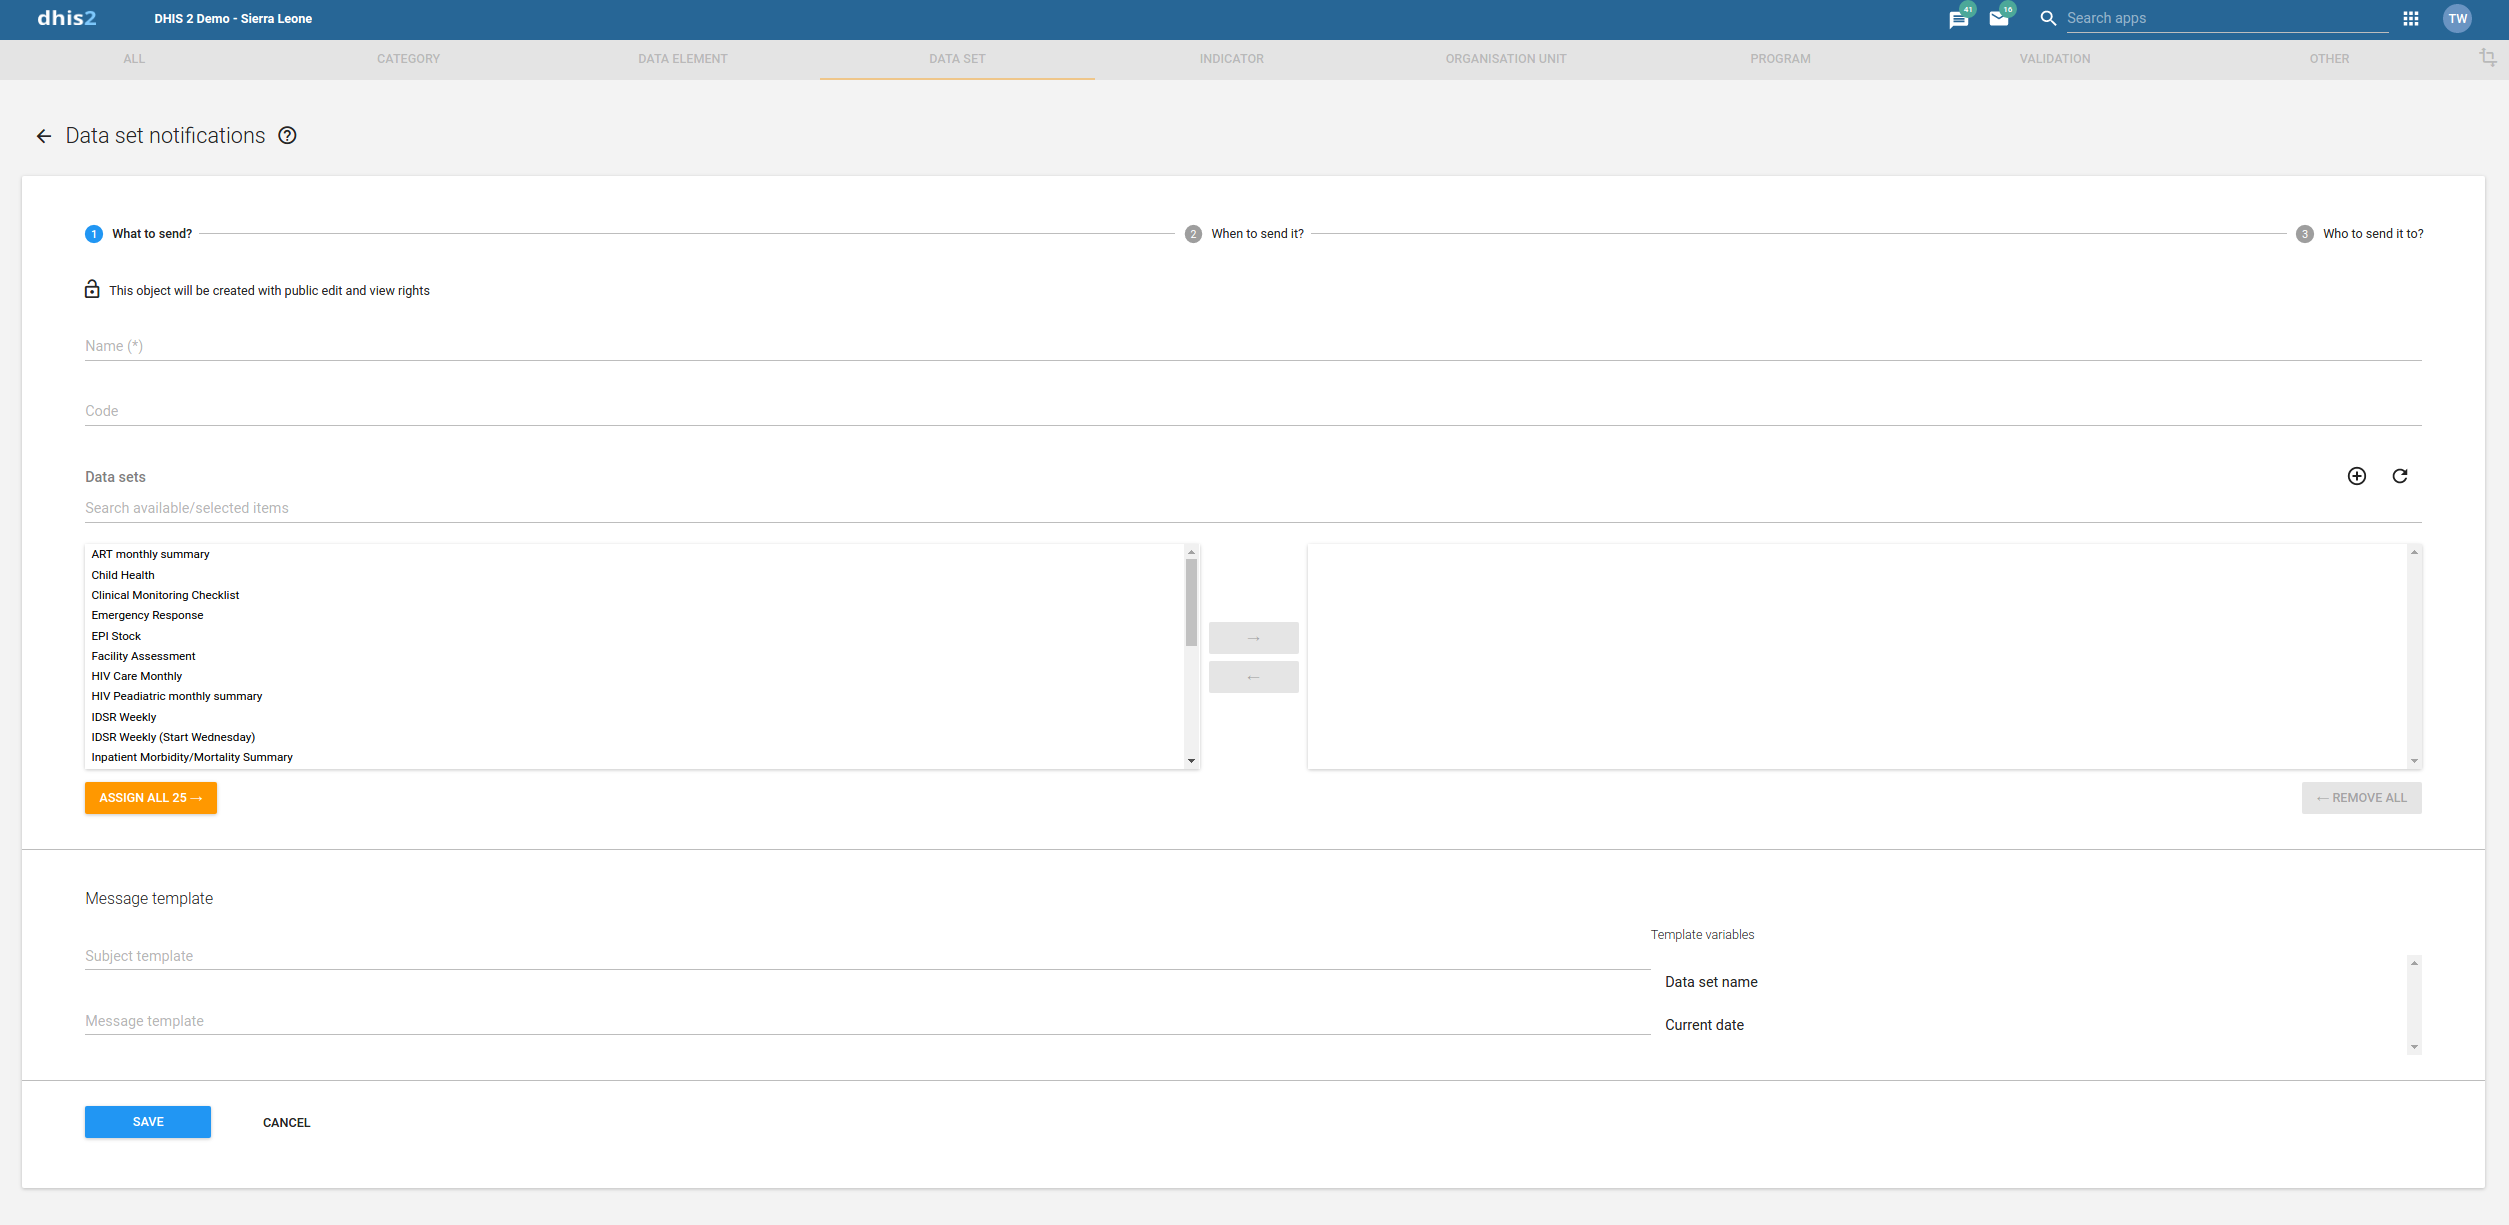
In the Name field, type the precise name of the data set notification.
(Optional) In the Code field, assign a code.
Enter Data sets.
These data sets will be associated to this notification. In case any of them is completed for a certain period and organisation unit, notification will be generated by the system.
Note
Nothing will happen if no data set is selected
In Message template section there are two parameters.
Subject template subject of the notification sent in notification. It can have values from the list of variables available on the right side.
Message template actual message sent in notification. It can have values from the list of variables available on the right side.
Note
Subject is only relevant in case of Email and internal DHIS2 messages. It is ignored in case of SMS.
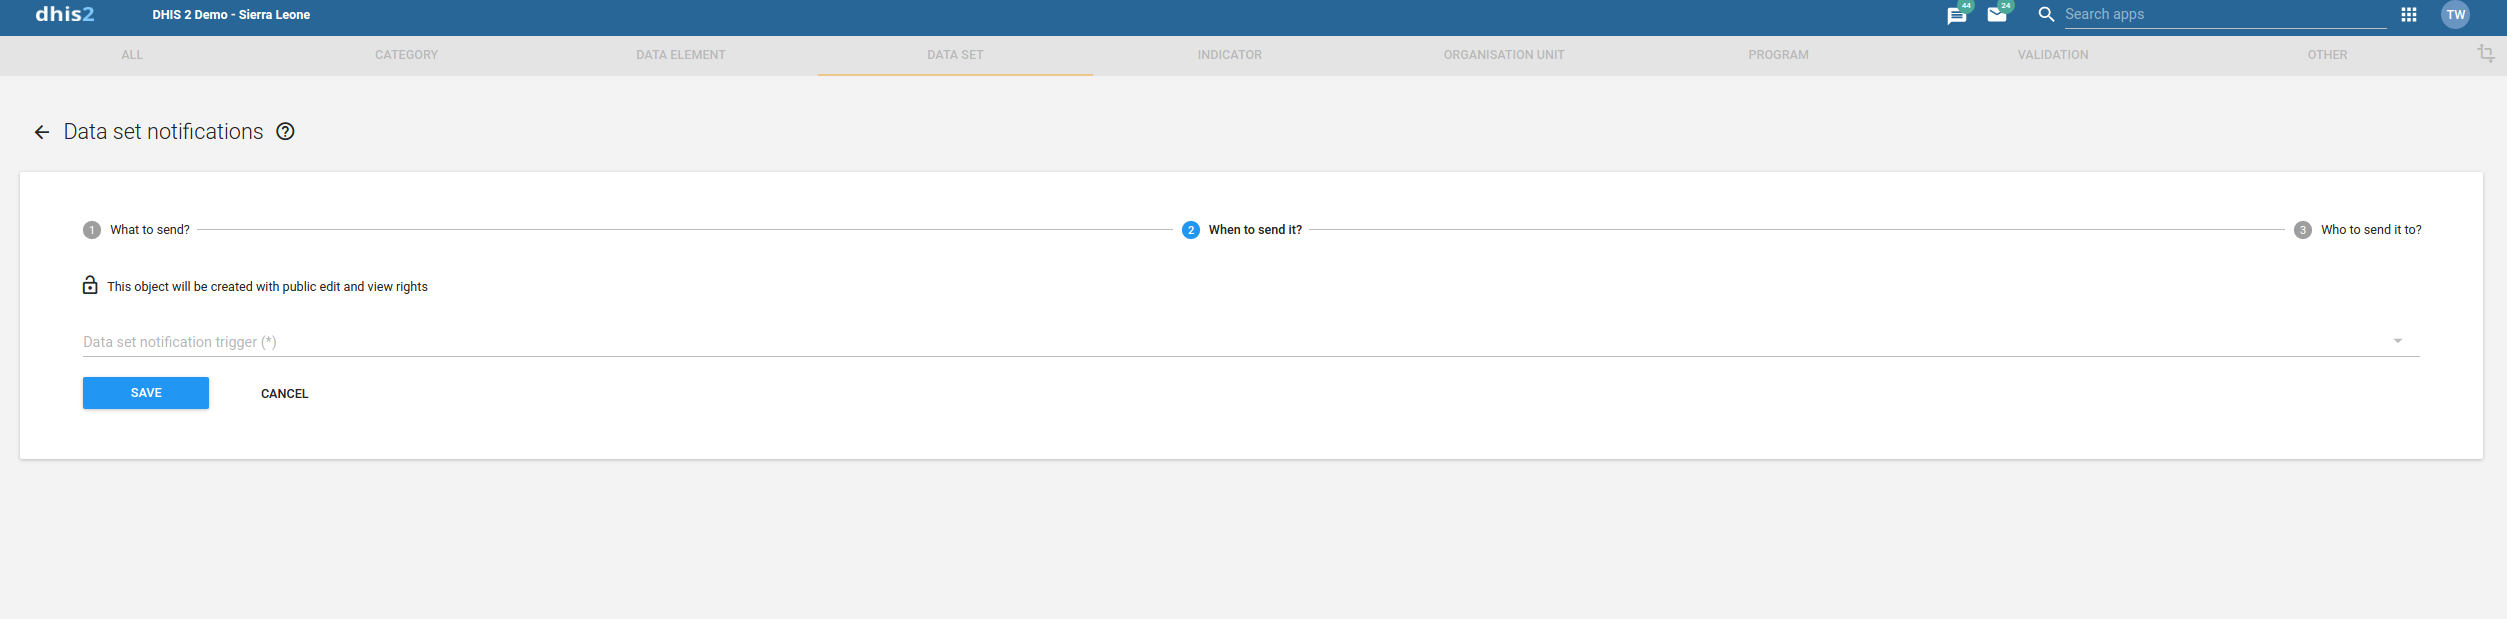
Data set notification trigger field determine when to send notification.
Data Set Completion will trigger notification as soon as data set is completed.
Schedule Days will schedule notification based on number days relative to scheduled date. Schedule date will be decided by Period associated with Data set.
Send notification as provides two different types of notifications
Collective summary send notification in summary mood
Single notification sends notification in single mood
Note
Send notification as option is only available in case of scheduled notification. This option is set to default which is Single notification in case of completion notification
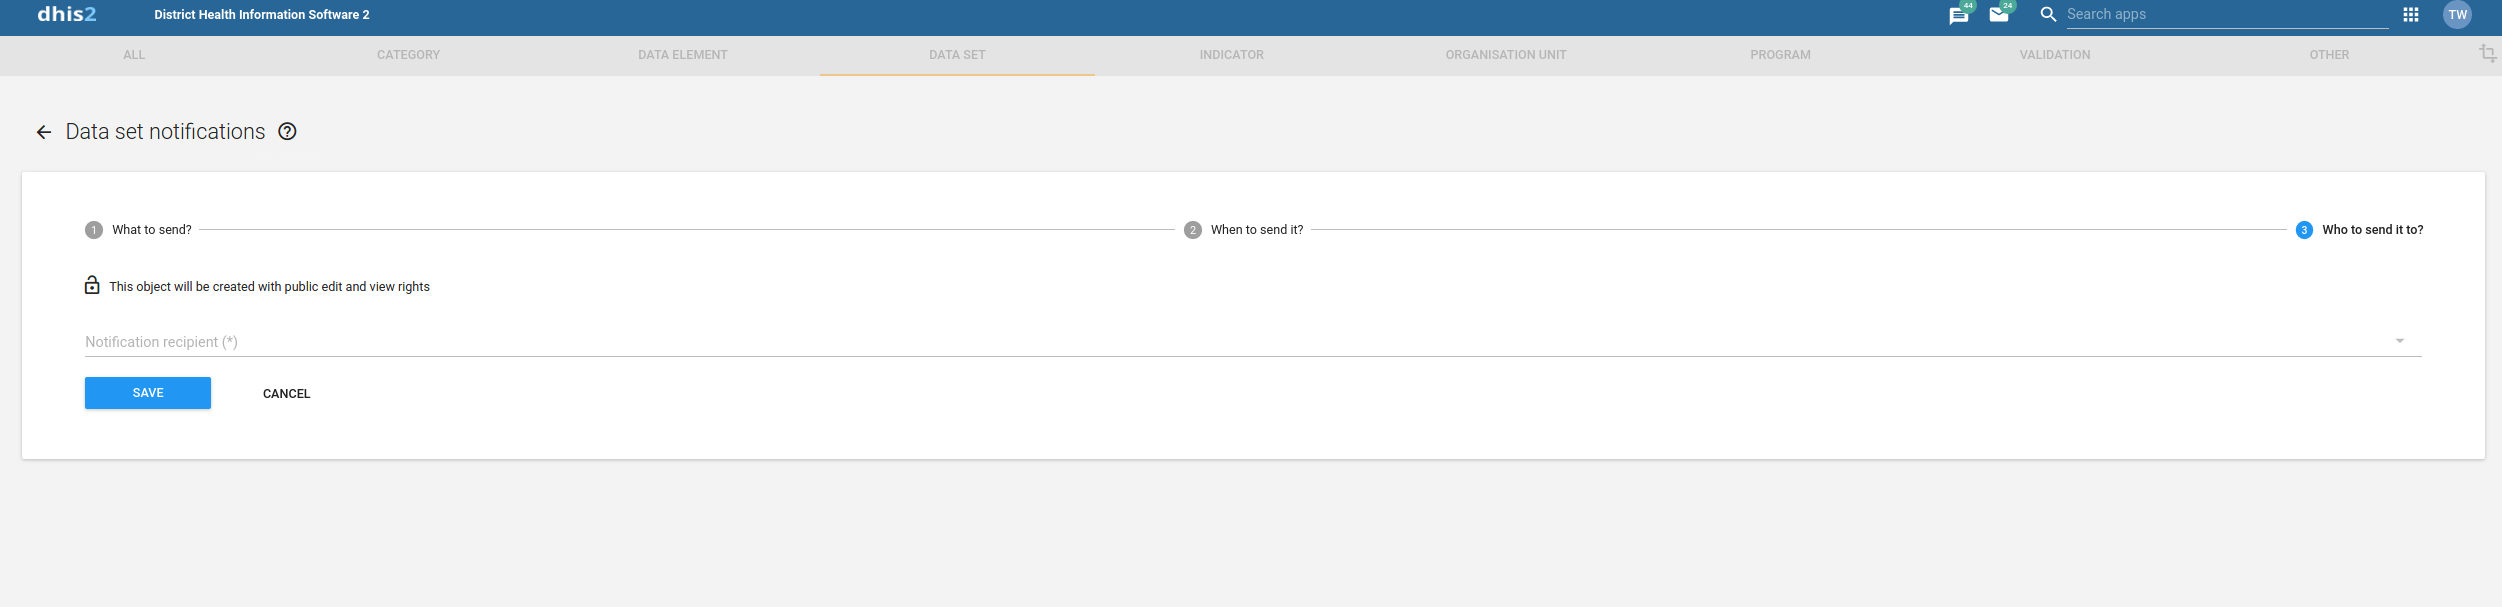
Notification recipient field determine recipients of the notification.
Organisation Unit contact will send notification to contact assigned to organisation unit which the data has been collected from.
UserGroup will send notification to all the member of the selected UserGroup.
Note
An internal DHIS2 message will be sent in case if recipient is UserGroup. Moreover user will also receive SMS/EMAIL if phone number and email address exist for that user and SMS/EMAIL notifications are enabled in SystemSettings
You can override which category combination to use for a data element within the context of a data set. This means that a data element can use different category combinations within different data sets. This is useful when you want to reuse a data element since you don't have to replicate the data element to allow multiple category combinations.
If different regions within your organisation unit hierarchy use different disaggregations, or if the disaggregations change over time, you can represent this by creating different data sets with the appropriate category combinations.
Open the Maintenance app and click Data set > Data set.
In the list, find the data set you want to modify.
Click the options menu and select Edit.
Go to the data elements section and click the spanner icon.
Select new category combinations and click Close.
Click Save.
You can add or remove data elements which will be marked as compulsory during data entry.
Open the Maintenance app and click Data set > Data set.
In the list, find the data set you want to edit.
Click the options menu and select Edit compulsory data elements.
Assign the compulsory data elements.
Click Save.
You can download a default data from in PDF format for offline data entry.
Open the Maintenance app and click Data set > Data set.
In the list, find the object you want to download.
Click the options menu and select Get PDF for data entry.
Section forms are separated automatically by data element category combinations, which produce a spreadsheet like data entry form for each section.
Open the Maintenance app and click Data set > Data set.
In the list, find the data set you want to create a section form for.
Click the options menu and select Manage sections.
Click the add button.
(Optional) In the Name field, type the name of the section.
(Optional) In the Description field, type a description of the section.
(Optional) To display totals for rows in the section form during data entry, select Show row totals.
(Optional) To display totals for columns in the section form during data entry, select Show column totals.
(Optional) To prevent automatic grouping of data of data elements with the same category combo, select Disable automatic grouping of data elements. This is useful if you want the order of the data elements to be respected regardless of differing category combos.
Assign data elements to the section:
(Optional) Select a Category combination filter.
Note
You can only use one category combination per section.
| Option | Description |
|---|---|
| None | Displays all data elements that don't have a category combination. |
| <No filter> | Displays all data elements. |
Select data elements and assign them.
(Optional) Sort the data elements within the section by using the up and down arrows to the left of the assigned data elements field.
Click Save.
Repeat add section steps for each section you want to have in your section form.
In the Data Entry app you can now use the section form. The section form appears automatically when sections are available for the selected data set. Data sets which have section forms will automatically display the section form.
Note how each data element category has been separated into a separate section, and a data entry table has been automatically generated by the system. Use of section forms in combination with data element categories can drastically reduce the amount of time which is required to create data entry forms for data sets.
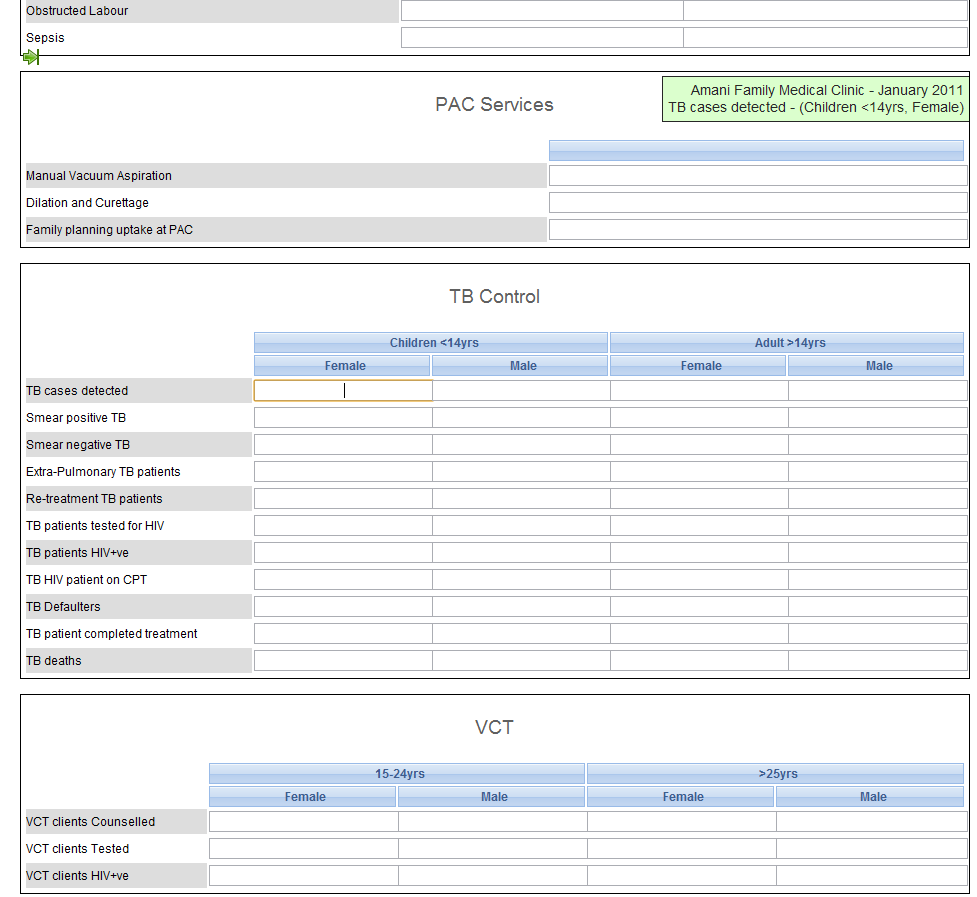
Open the Maintenance app and click Data set > Data set.
In the list, find the data set you want to edit the section form for.
Click the options menu and select Manage sections.
In the list, find the section you want to edit.
Click the options menu and select Edit.
Edit the section and click Save.
Repeat edit section steps for each section you want to edit.
You can disable data elements and category options for data entry. That means it won't be possible to enter data into these fields during data entry.
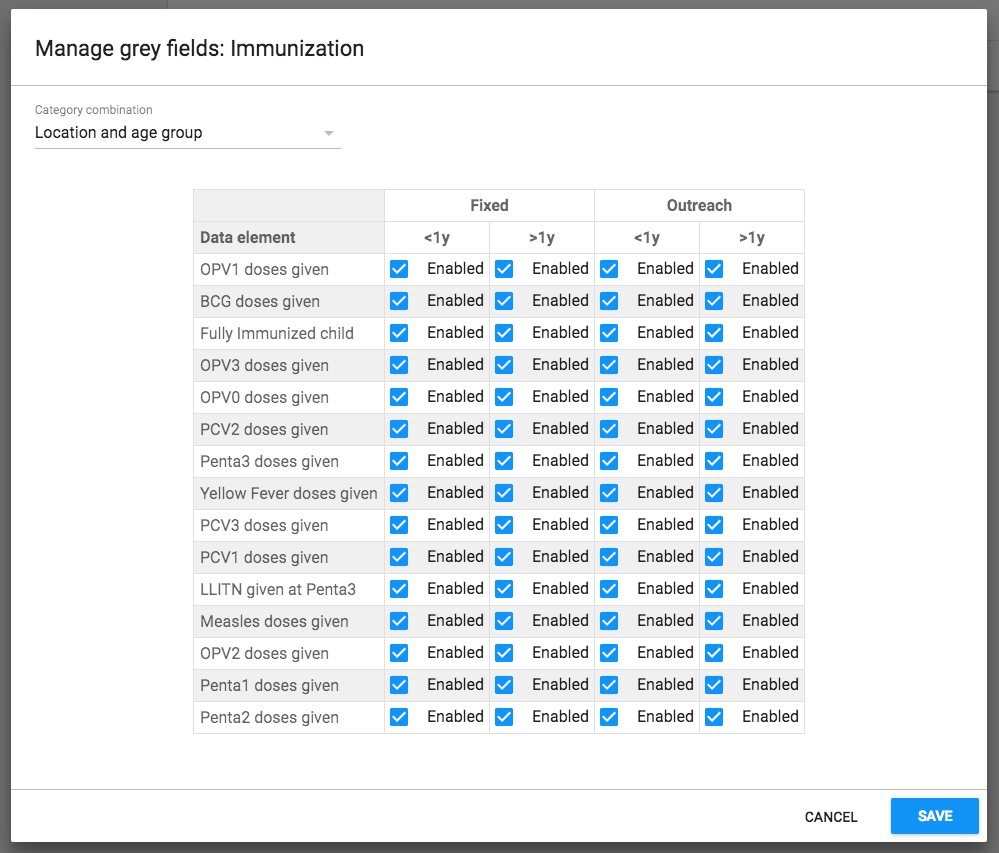
Open the Maintenance app and click Data set > Data set.
In the list, find the data set you want to edit the section form for.
Click the options menu and select Manage sections.
In the list, find the section you want to edit.
Click the options menu and select Manage grey fields.
Select which fields you want to disable.
Note
If you've sections that contain data elements assigned to multiple category combinations, switch between the category combinations to view all fields.
Click Save.
You can control in which order sections are displayed in a section form.
Open the Maintenance app and click Data set > Data set.
In the list, find the data set you want to edit the section form for.
Click the options menu and select Manage sections.
In the list, find the section you want to move.
Click the options menu and select Move up or Move down.
If the section you want to move is the first or last section in the list, you'll only see one of the move options.
Open the Maintenance app and click Data set > Data set.
In the list, find the data set you want to edit the section form for.
Click the options menu and select Manage sections.
In the list, find the section you want to delete.
Click the options menu and select Delete.
Open the Maintenance app and click Data set > Data set.
In the list, find the data set you want to edit the section form for.
Click the options menu and select Translate.
Select a locale.
Enter the required information.
Click Close.
In version 41, we have added extra form configuration options that change how a section form is displayed in the new Data Entry App (beta). These options allow users to apply functionality that was not possible before without custom forms. We will be adding more options in the future releases.
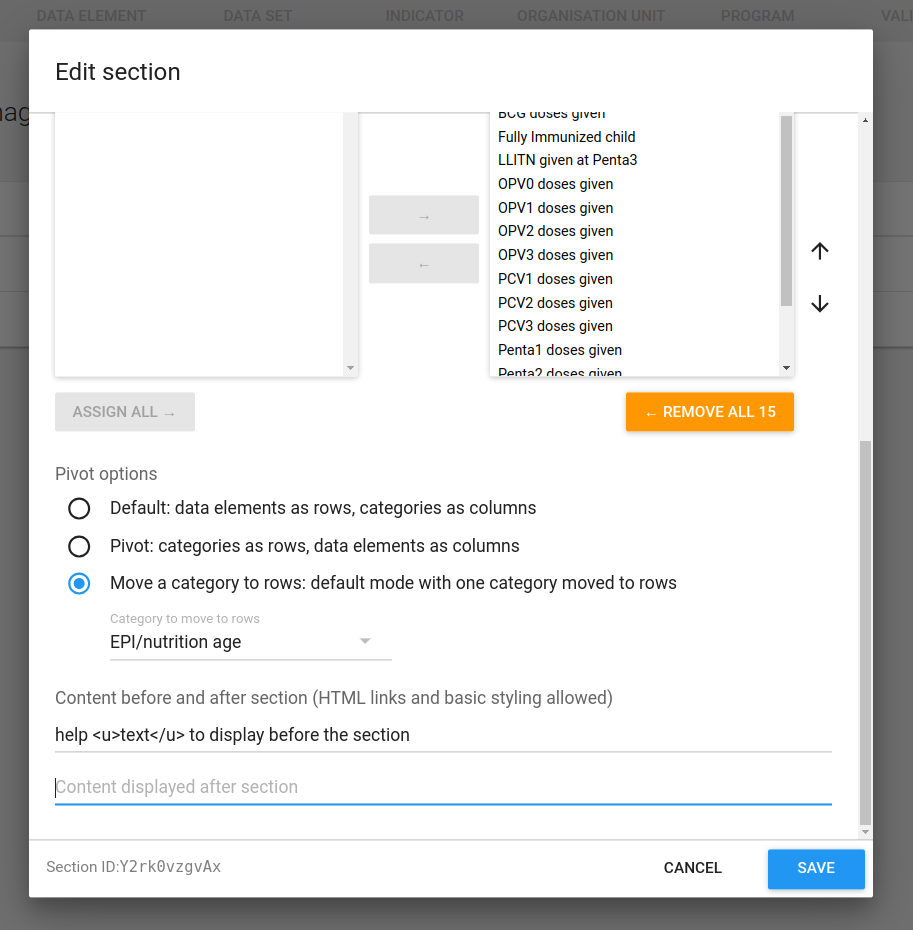
The options available in v41 are:
Users are able to choose to transpose (pivot) a form when displayed in the new Data Entry (beta) app. They are able to either fully transpose the form, i.e. move categories to be displayed as rows and data elements as columns, or move a certain category to be displayed as rows. The default display mode is for data elements to be displayed as rows and categories as columns.
Users are able to display custom text before and/or after a section. This is helpful for adding help text, for example. For security reasons, only basic styling and HTML link elements are allowed, specifically these tags: a for adding a link, u for underlining a text, b, strong for styling text in bold format, or em to style it in italic.
You design custom forms in a built-in WYSIWYG HTML editor. If you select Source, you can paste HTML code directly in the editing area. For a complete guide on how to use the editor, refer to http://docs.ckeditor.com/.

To create a custom form:
Open the Maintenance app and click Data set.
In the list, find the data set you want to add a custom form to.
Click the options menu and select Design data entry form.
In the editing area, create the custom form.
Double-click on a object in the left-hand list to insert it in the form.
If you already have the HTML code for your form, click Source and paste the code.
Select a Form display style.
Click Save.
In custom data entry form you can use JavaScript to create dynamic behaviour and customizations. As an example, you can hide form sections based on specific user input for data elements, or show specific information when a form loads.
The DHIS2 data entry module provides a range of events which you can register for and use to perform actions at certain times. The events are registered on the document element. The jQuery event object and the data set identifier are always the first two arguments provided to the callback functions. The table below provides an overview of the events and when they are triggered.
| Key | Description | Arguments |
|---|---|---|
| dhis2.de.event.formLoaded | Triggered after the data entry form is rendered, but before data values are set in entry fields. | Event | Data set ID |
| dhis2.de.event.dataValuesLoaded | Triggered after data values are set in entry fields. | Event | Data set ID |
| dhis2.de.event.formReady | Triggered when the data entry form is completely rendered and loaded with all elements. | Event | Data set ID |
| dhis2.de.event.dataValueSaved | Triggered when a data value is saved successfully. | Event | Data set ID | Data value object |
| dhis2.de.event.completed | Triggered when a data set is successfully marked as complete. | Event | Data set ID | Complete registration object |
| dhis2.de.event.validationSuccess | Triggered when validation is done and there were no violations. | Event | Data set ID |
To register for an event:
<script type="text/javascript">

dhis2.util.on( 'dhis2.de.event.formReady', function( event, ds ) {
  console.log( 'The form with id: ' + ds + ' is loaded!' );
} );

dhis2.util.on( 'dhis2.de.event.dataValueSaved', function( event, ds, dv ) {
  console.log( 'Data value: ' + dv.value + ' was saved with data element: ' + dv.de );
} );

dhis2.util.on( 'dhis2.de.event.completed', function( event, ds, cr ) {
  console.log( 'Form was completed for org unit: ' + cr.ou );
} );

</script>
Note
Be careful to only use "namespaced" events like the ones in the example above and not general ones like "click" as the dhis2.util.on method will deregister the event first.
If your function only applies to certain data sets you can use the supplied data set identifier and shortcut your function for unwanted data sets like this:
dhis2.de.on( 'dhis2.de.event.validationSuccess', function( event, ds ) {
  if ( $.inArray( ds, ['utXOiGbEj14', 'Re7qzHEThSC'] ) == -1 ) {
    return false;
  }
  console.log( 'Form with id: ' + ds + ' validated successfully!' );
} );
The identifiers of the input fields in the data entry form is on the format described below. This format can be used to select the input fields in your script and perform actions on them:
<dataelementid>-<optioncomboid>-val
Since the data set identifier is provided for all events a feasible alternative is to utilize the "files" Web API resource and keep your callback functions in a single file, where you let the JavaScript code take action based on which data set is currently loaded.
The DHIS2 data entry module contains JavaScript API functions which can be accessed from custom data entry forms.
dhis2.de.api.getSelections: This function returns a JavaScript object which contains properties for all dimensions with corresponding values for the identifiers of the selected options. It contains properties for "ds" (data set), "pe" (period), "ou" (organisation unit) and identifiers for all data set categories.
An example response looks like this:
{
 +  ds: "lyLU2wR22tC",
 +  pe: "201605",
 +  ou: "g8upMTyEZGZ",
 +  LFsZ8v5v7rq: "CW81uF03hvV",
 +  yY2bQYqNt0o: "yMj2MnmNI8L"
 +}
Example JavaScript usage of this function:
var sel = dhis2.de.api.getSelections();
 +var orgUnit = sel["ou"];
 +var partner = sel["LFsZ8v5v7rq"];
You can assign different sharing settings to metadata objects, for example organisation units and tracked entity attributes. These sharing settings control which users and users groups that can view or edit a metadata object.
Some metadata objects also allows you to change the sharing setting of data entry for the object. These additional settings control who can view or enter data in form fields using the metadata.
Note
The default setting is that everyone (Public access) can find, view and edit metadata objects.
Open the Maintenance app and find the type of metadata object you want to modify.
In the object list, click the context menu and select Sharing settings.
(Optional) Add users or user groups: search for a user or a user group and select it. The user or user group is added to the list.
Change sharing settings for the access groups you want to modify.
Can edit and view: The access group can view and edit the object.
Can view only: The access group can view the object.
No access (only applicable to Public access): The public won't have access to the object.
Change data sharing settings for the access groups you want to modify.
Can capture data: The access group can view and capture data for the object.
Can view data: The access group can view data for the object.
No access: The access group won't have access to data for the object.
Click Close.
Note
You can only delete a data element and other data element objects if no data is associated to the data element itself.
Warning
Any data set that you delete from the system is irrevocably lost. All data entry forms, and section forms which may have been developed will also be removed. Make sure that you have made a backup of your database before deleting any data set in case you need to restore it at some point in time.
Open the Maintenance app and find the type of metadata object you want to delete.
In the object list, click the options menu and select Delete.
Click Confirm.
Open the Maintenance app and find the type of metadata object you want to view.
In the object list, click the options menu and select Show details.
DHIS2 provides functionality for translations of database content, for example data elements, data element groups, indicators, indicator groups or organisation units. You can translate these elements to any number of locales. A locale represents a specific geographical, political, or cultural region.
Tip
To activate a translation, open the System Settings app, click > Appearance and select a language.
Open the Maintenance app and find the type of metadata object you want to translate.
In the object list, click the options menu and select Translate.
Tip
If you want to translate an organisation unit level, click directly on the Translate icon next to each list item.
Select a locale.
Type a Name, Short name and Description.
Click Save.
An indicator is a formula that can consist of multiple data elements, constants, organisation unit group counts and mathematical operators. The indicator consist typically of a numerator and denominator. You use indicators to calculate coverage rates, incidence and other values that are a result of data element values that have been entered into the system. Calculated totals do not have a denominator.
Note
You never enter indicator values directly in DHIS2, you calculate them.
An indicator formula can consist of mathematical operators, for example plus and minus; functions (see below); and of the following elements:
| Indicator element | Type | Description |
|---|---|---|
| Constant | Component | Constants are numerical values which remain the same for all indicator calculations. This is useful in order to have a single place to change values that might change over time. Constants are applied AFTER data element values have been aggregated. |
| Data elements | Component | Data elements are substituted by the data value captured for the data element. |
| Days | Operator | "Days" is special operator that always provides the number of days for a given indicator calculation. For example: if you want to calculate the "Percentage of time vaccine refrigerator was non-functional", you could define the numerator as: ("Days-"Number of days vaccine refrigerator was available"")/"Days" If the fridge was available 25 days in June, the indicator would be calculated as: (30-25/25)*100 = 17 % If you want to calculate the total for Quarter 1, the number of days ("Days") would be: 31+28+31 = 90 The "Days" parameter will always be the number of days in the period of interest. |
| Organisation unit counts | Component | You can use organisation unit groups in formulas. They will be replaced by the number of organisation units in the group. During aggregation, the organisation units in the group will be intersected with the part of the organisation unit hierarchy being requested. This lets you use the number of public facilities in a specific district in indicators. This is useful for example when you create facility infrastructure surveys and reports. |
| Programs | Component | Click Programs and select a program to view all data elements, attributes and indicators related to a specific program. The program components you include in your formula will have a program tag assigned to them. |
You can use the following functions in an indicator formula:
| Indicator Function | Arguments | Description |
|---|---|---|
| contains | (expr, sub1, ...) | Searches an expression for one or more substrings. Returns true if the expression contains all the substrings. For example, the following are all true: contains("abcd", "abcd"); contains("abcd", "b"); and contains("abcd", "ab", "bc"). Comparisons are case-sensitive. |
| containsItems | (expr, item1, ...) | Searches an expression for one or more items. The expression is made up of comma-separated elements. containsItems returns true if every item exactly matches an element in the expression. For example, containsItems("abcd", "abcd") and containsItems("ab,cd", "ab", "cd") are true, but containsItems("abcd", "b") and containsItems("abcd", "ab", "bc") are false. Comparisons are case-sensitive. containsItems can be used for multi-valued data elements to see if an item is contained in the data element values. |
| if | (boolean-expr, true-expr, false-expr) | Evaluates the boolean expression and if true returns the true expression value, if false returns the false expression value. The arguments must follow the rules for any indicator expression. |
| is | (expr1 in expression [, expression ...]) | Returns true if expr1 is equal to any of the following expressions, otherwise false. |
| isNull | (element) | Returns true if the element value is missing (null), otherwise false. |
| isNotNull | (element) | Returns true if the element value is not missing (not null), otherwise false. |
| firstNonNull | (element [, element ...]) | Returns the value of the first element that is not missing (not null). Can be provided any number of arguments. Any argument may also be a numeric or string literal, which will be returned if all the previous objects have missing values. |
| greatest | (expression [, expression ...]) | Returns the greatest (highest) value of the expressions given. Can be provided any number of arguments. |
| least | (expression [, expression ...]) | Returns the least (lowest) value of the expressions given. Can be provided any number of arguments. |
| log | (expression [, base ]) | Returns the natural logarithm (base e) of the numeric expression. If an integer is given as a second argument, returns the logarithm using that base. |
| log10 | (expression) | Returns the common logarithm (base 10) of the numeric expression. |
| null | Returns no result. For example, if( #{FH8ab5Rog83}<0, null, 1 ) returns nothing if the data element value is less than 0, otherwise 1. | |
| removeZeros | (expression) | Returns nothing if the expression value is 0, otherwise returns the expression value. |
| subExpression | (expression) | Evaluates part of an expression before aggregating. See Indicator SubExpressions below. |
| [periodInYear] | The number of this period within the year (1, 2, 3, ...). For examples, see the Indicator Year-to-date section below. | |
| [yearlyPeriodCount] | The count of periods of this type within the year. For examples, see the Indicator Year-to-date section below. | |
| .aggregationType | (aggregation type) | Overrides the default data element aggregation type for aggregate data (not for program data). |
| .maxDate | (yyyy-mm-dd) | For a data element (not program data), value from periods ending on or before a maximum date. |
| .minDate | (yyyy-mm-dd) | For a data element (not program data), value from periods starting on or after a minimum date. |
| .periodOffset | (integer constant) | Placed after a data value or expression, returns the value from a period offset relative to the reported period. It can be nested. Note that this shifts data only for aggregate data, not tracker or event data. See examples below. |
| .yearToDate() | Summs the values of all periods from the start of the yaer through the current period. Note that any weekly period is considered to be part of the current year if it has four or more days in the year. For examples, see the Indicator Year-to-date section below. |
Valid aggregation types:
| Aggregation type | Description |
|---|---|
| AVERAGE | Average value in both period and organisation unit hierarchy |
| AVERAGE_SUM_ORG_UNIT | Average value, sum in organisation unit hierarchy |
| COUNT | Count of values |
| FIRST | First value, sum in organisation unit hierarchy |
| FIRST_AVERAGE_ORG_UNIT | First value, average in organisation unit hierarchy |
| LAST | Last value, sum in organisation unit hierarchy |
| LAST_AVERAGE_ORG_UNIT | Last value, average in organisation unit hierarchy |
| LAST_IN_PERIOD | Last value in period, sum in organisation unit hierarchy |
| LAST_IN_PERIOD_AVERAGE_ORG_UNIT | Last value in period, average in organisation unit hierarchy |
| MAX | Maximum value |
| MIN | Minimum value |
| NONE | No aggregation is performed in any dimension |
| SUM | Sum of values in both period and organisation unit hierarchy |
| STDEEV | Standard deviation (population-based) of values |
| VARIANCE | Variance (population-based) of values |
Examples of .aggregationType, .maxDate, .minDate, and .periodOffset functions:
| Indicator expression | Means |
|---|---|
| #{FH8ab5Rog83}.aggregationType(COUNT) | count of values |
| #{FH8ab5Rog83}.aggregationType(LAST) - #{FH8ab5Rog83}.aggregationType(FIRST) | the difference between first and last values |
| #{FH8ab5Rog83}.maxDate(2021-6-30) | values until 30-Jun-2021 |
| #{FH8ab5Rog83}.minDate(2021-1-1) | values from 1-Jan-2021 onwards |
| #{FH8ab5Rog83}.minDate(2021-1-1) .maxDate(2021-6-30) | values between 1-Jan-2021 and 30-Jun-2021 |
| #{FH8ab5Rog83}.periodOffset(-1) | value from the period before |
| #{FH8ab5Rog83}.periodOffset(+1) | value from the period after |
| #{FH8ab5Rog83}.periodOffset(1) | value from the period after |
| #{FH8ab5Rog83} - 2 * D{IpHINAT79UW.uf3svrmp8Oj}.periodOffset(-1) | data element FH8ab5Rog83 from the reported period minus twice program data element IpHINAT79UW.uf3svrmp8Oj from the period before |
| ( #{FH8ab5Rog83} - #{QOlfIKgNJ3D2} ).periodOffset(-2) | data element FH8ab5Rog83 from 2 periods before minus data element QOlfIKgNJ3D2 from 2 periods before |
| #{FH8ab5Rog83}.periodOffset(-2) + #{FH8ab5Rog83}.periodOffset(-1) | data element FH8ab5Rog83 from 2 periods before plus the value from 1 period before |
| ( #{FH8ab5Rog83}.periodOffset(-1) + #{FH8ab5Rog83} ).periodOffset(-1) | data element FH8ab5Rog83 from 2 periods before plus the value from 1 period before (note that the functions are nested) |
| N{IndicatorID}.periodOffset(-1) | indicator value from the period before (applies to aggregate data in the indicator) |
When fetching data for a data element, indicators usually aggregate the data before evaluating it in the expression. For example, consider the indicator expression:
if( #{nYahlae7fe6} > 10, 1, 0 )
If the data element has aggregation type SUM, this will sum all the values of the data element nYahlae7fe6 for the relevant period and then test to see if the sum is greater than 10. It will return 1 if the sum of all the data element values is greater than 10, otherwise it will return 0.
Sometimes you may wish to evaluate a data value in an expression before aggregating it. For example, you may want to show at a district level how many facilities within the district have a data value greater than 10. This can be done by using the subExpression function as follows:
subExpression( if( #{nYahlae7fe6} > 10, 1, 0 ) )
This will test each data element value to see if it is greater than 10. If it is greater than 10, the if statement will return 1, otherwise 0. Then, assuming that data element nYahlae7fe6 has aggregation type SUM, it will sum the 1's and 0's, resulting in a count of how many data elements had a value greater than 10.
SubExpression notes:
An example such as the one above will sum the 1's and 0's only if the data element has an aggregation type of SUM. If the data element has a different aggregation type and you want to sum the 1's and 0's, you can override the aggregation type inside the subexpression by using the .aggregationType() function as follows:
subExpression( if( #{nYahlae7fe6} > 10, 1, 0 ) ).aggregationType(SUM)
A SubExpression may reference only one data element, but it may reference it multiple times. For example:
subExpression( if( #{nYahlae7fe6} > 10 && #{nYahlae7fe6} <= 20, 1, 0 ) )
A SubExpression may reference a data element with a category option combination and/or an attribute option combination, but it must be exactly the same reference each time. For example:
subExpression( if( #{nYahlae7fe6.beec4Dewah8} > 10 && #{nYahlae7fe6.beec4Dewah8} <= 20, 1, 0 ) )
If you wish to evaluate an expression before aggregating that involves other types of data such as program data, or that involves more than one data element, category option combination or attribute option combination, you can use a Predictor to do so and store the result as a different data element. Then you can reference the predicted data element in an indicator or directly in analytics.
Indicators can compute year-to-date values using the expression elements yearToDate(), [periodInYear], and [yearlyPeriodCount].
In the examples below, #{a} can be: #{dataElementUID}, or any valid indicator expression item that returns a data value such as #{dataElementUID.catOptionComboUid}, I{programIndicatorUID}, N{indicatorUID}, etc.
| Indicator expression | Means |
|---|---|
| #{a} | current period value |
| #{a}.yearToDate() | sum of values year to date. For example, if the period is March gives the value for Jan+Feb+Mar |
| #{a}.yearToDate() / [periodInYear] | average year-to-date value. For example, if the period is March gives the value for Jan+Feb+Mar / 3 |
| #{a} - | difference between current period and average year to date |
| #{b} * [periodInYear] / [yearlyPeriodCount] | If #{b} represents the annual target population (for example, the number of people who should be vaccinated during this year), then this can show the number of people who should be vaccinated by the current period. For example, in February this gives #{b} * 2 / 12. |
For monthly periods, [yearlyPeriodCount] is always 12, for quarters is always 4, etc. There are two advantages of using [yearlyPeriodCount] rather than hard-coding numbers like 12 or 4:
For weekly periods [yearlyPeriodCount] will be 52 or 53 depending on the year. For biweekly periods it will be 26 or 27.
If the user chooses a different period type in analytics, [periodInYear] and [yearlyPeriodCount] will adjust accordingly. For example if monthly data is collected, the user can choose to report monthly where [periodInYear] is 1: Jan, 2: Feb, ..., and [yearlyPeriodCount] is 12; or the user can report quarterly where [periodInYear] is 1: Q1, 2: Q2, ..., and [yearlyPeriodCount] is 4.
.yearToDate() returns a value if there is any data in the year before or during the period. For example, if the values of #{a} are:
Jan: (no data)
Feb: 1
Mar: 2
Apr: (no data)
May: 3
Jun: (no data)
then the values of #{a}.yearToDate() are:
Jan: (no data)
Feb: 1
Mar: 3
Apr: 3
May: 6
Jun: 6
In the Maintenance app, you manage the following indicator objects:
| Object type | Available functions |
|---|---|
| Indicator | Create, edit, clone, share, delete, show details and translate |
| Indicator type | Create, edit, clone, delete, show details and translate |
| Indicator group | Create, edit, clone, share, delete, show details and translate |
| Indicator group set | Create, edit, clone, share, delete, show details and translate |
Create indicator types.
Create indicators.
Create indicator groups.
Create indicator group sets.
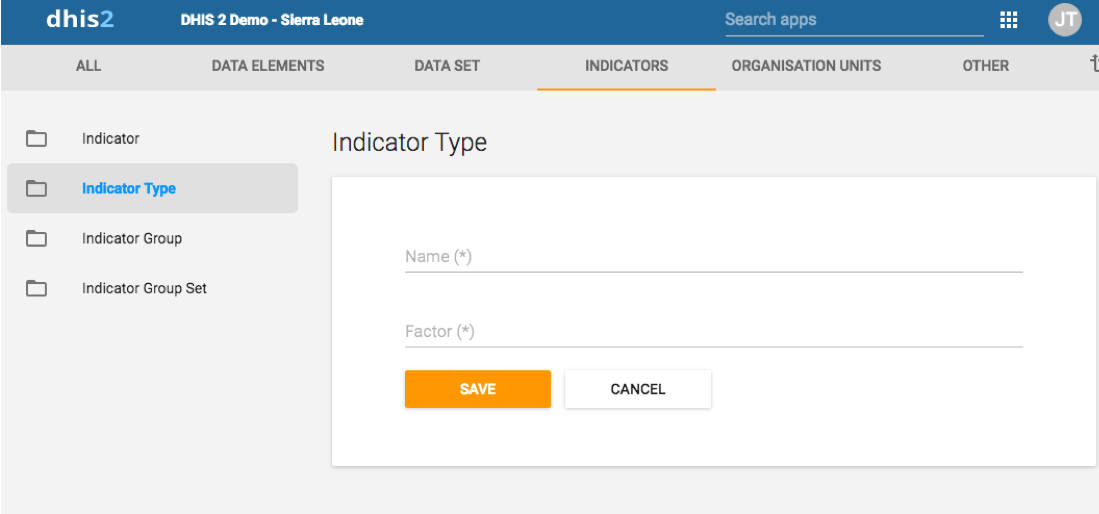
Indicator types define a factor that is applied during aggregation. Indicator values that are calculated during a data mart export or report table generation process will appear properly formatted, and will therefore not require an additional multiplier (for example 100 in the case of percent) for the values to appear correctly formatted.
Note
As of version 2.4 of DHIS2, the "Calculated data element" object has been deprecated. Instead, you can create a calculated data element by creating an indicator type with a factor of "1" and by setting the "Number" option to "Yes". The effect of setting the "Number" option to "Yes" will be that the indicator will effectively not have a denominator. You will therefore only be able to define a numerator, which will serve as the formula of the calculated data element.
Open the Maintenance app and click Indicator > Indicator type.
Click the add button.
In the Name field, type the name of the indicator type, for example "Per cent", "Per thousand", "Per ten thousand".
Type a Factor.
The factor is the numeric factor that will be multiplied by the indicator formula during the calculation of the indicator.
Click Save.
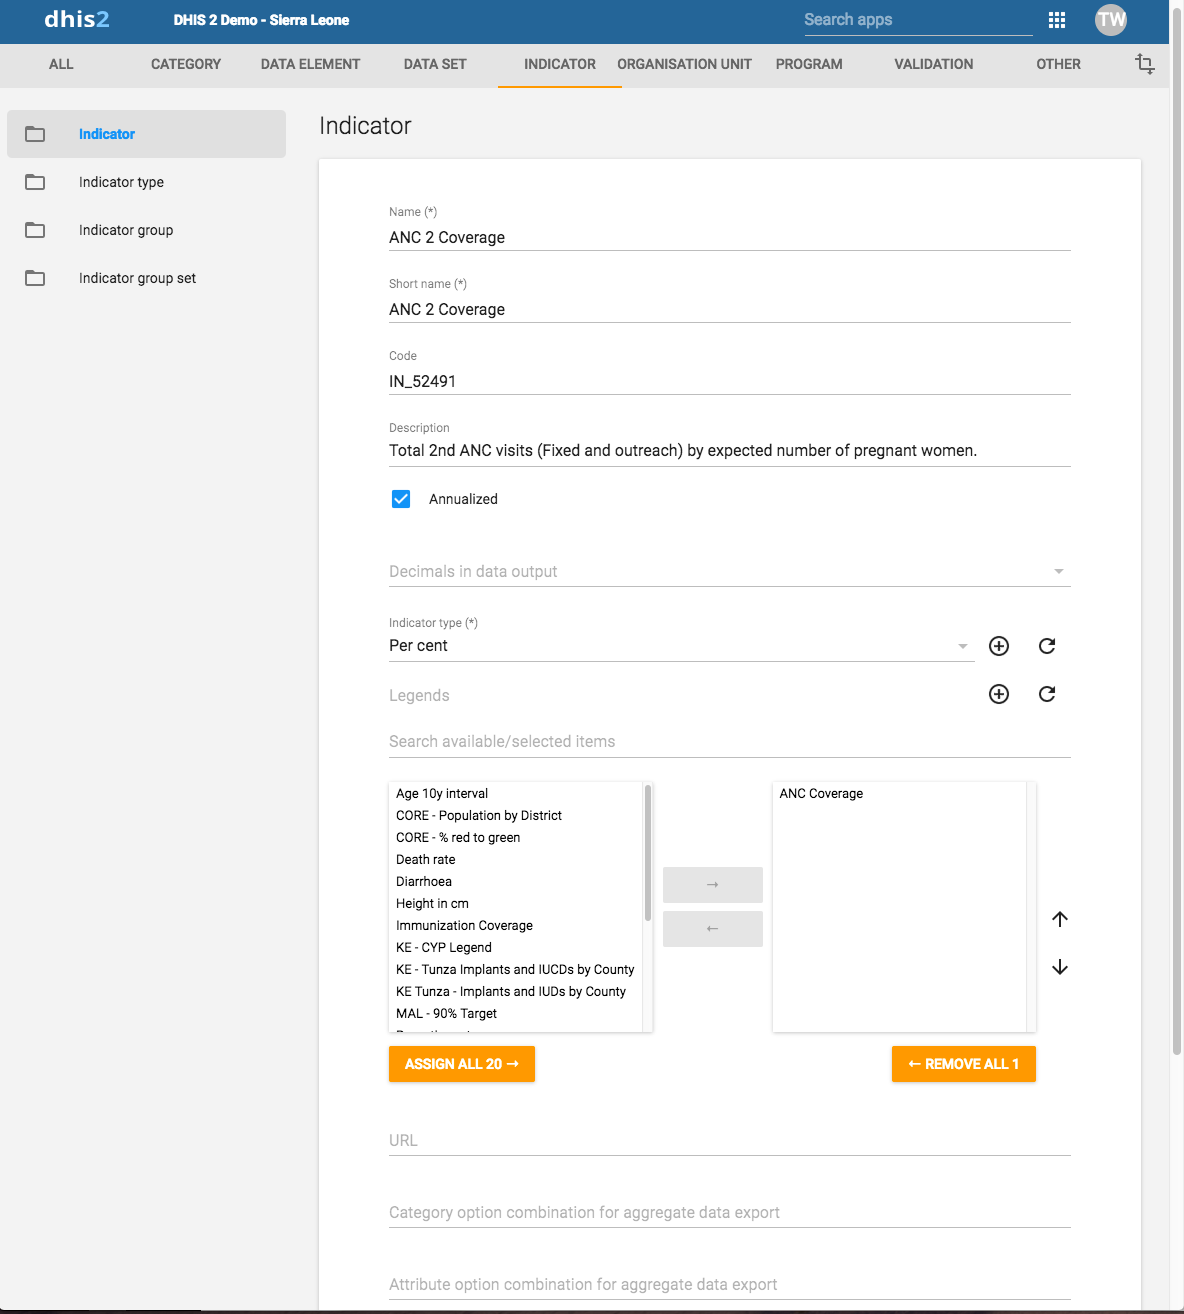
Open the Maintenance app and click Indicator > Indicator.
Click the add button.
In the Name field, type the full name of the indicator, for example "Incidence of confirmed malaria cases per 1000 population".
In the Short name field, type an abbreviated name of the indicator, for example "Inc conf. malaria per 1000 pop".
The short name must be less than or equal to 25 characters, including spaces.
(Optional) In the Code field, assign a code.
In many countries indicators are assigned a code.
(Optional) In the Color field, assign a color to reprersent the indicator.
(Optional) In the Icon field, assign an icon to illustrate the meaning of the indicator.
In the Description field, type a brief, informative description of the indicator and how it is calculated.
If you want to apply an annualization factor during the calculation of the indicator, select Annualized.
Typically, an annualized indicator's numerator is multiplied by a factor of 12, and the denominator is for instance a yearly population figure. This allows for monthly coverage values to be calculated with yearly population figures.
Select the number of Decimals in data output.
Select an Indicator type.
This field determines a factor that will automatically be applied during the calculation of the indicator. Possible choices are determined by the indicator types. For example, a "Percent" indicator will automatically be multiplied by a factor of 100 when exported to the data mart, so that it will display as a percentage.
(Optional) Assign one or multiple Legends.
In the URL field, enter a link, for example a link to an indicator registry, where a full metadata description of the indicator can be made available.
(Optional) Enter a Category option combination for aggregate data export..
You use this setting to map aggregated data exported as raw data to another server. Typically you do this type of data exchange mapping when you want to create anonymous aggregated data from patient data recorded in programs (event data).
(Optional) Enter an Attribute option combination for aggregate data export..
You use this setting to map aggregated data exported as raw data to another server. Typically you do this type of data exchange mapping when you want to create anonymous aggregated data from patient data recorded in programs (event data).
If applicable, enter custom attributes values, for example Classification or Collection method.
Note
You create custom attributes in the Maintenance app: Other > Attributes.
Click Edit numerator.
Type a clear description of the numerator.
Define the numerator by double-clicking components in the right-hand field. The components then appears as part of the formula in the left-hand field. Add mathematical operators by double-clicking the icons below the left-hand field.
You formula must be mathematically valid. This includes correct use of parentheses when necessary.
Click Done to save all changes to the numerator.
Click Edit denominator.
Type a clear description of the denominator.
Define the denominator by double-clicking components in the right-hand field. The components then appears as part of the formula in the left-hand field. Add mathematical operators by double-clicking the icons below the left-hand field.
You formula must be mathematically valid. This includes correct use of parentheses when necessary.
Click Done to save all changes to the denominator.
If applicable, select compulsory indicator group sets, for example Human resources.
Note
You'll only see indicator group sets in this form if you've created them and set them to Compulsory.
You create indicator group sets in the Maintenance app: Indicator > Indicator group set.
Click Save.
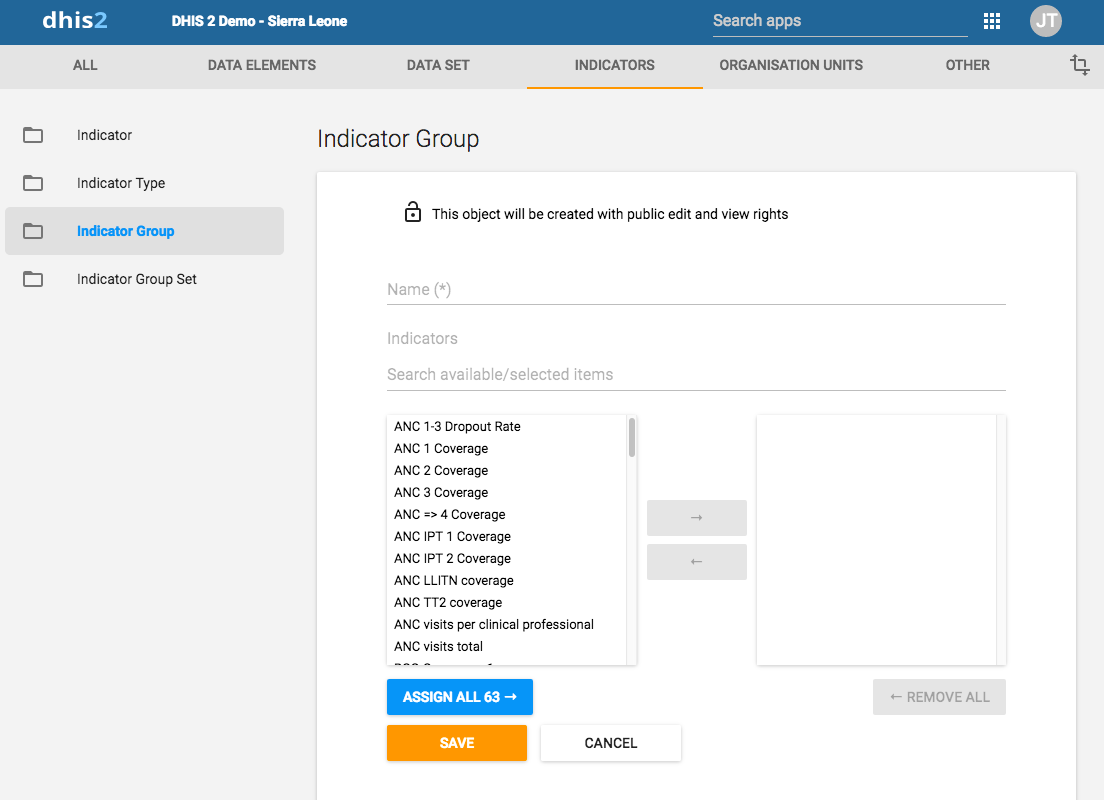
Open the Maintenance app and click Indicator > Indicator group.
Click the add button.
Type a name.
Select indicators and assign them.
Click Save.
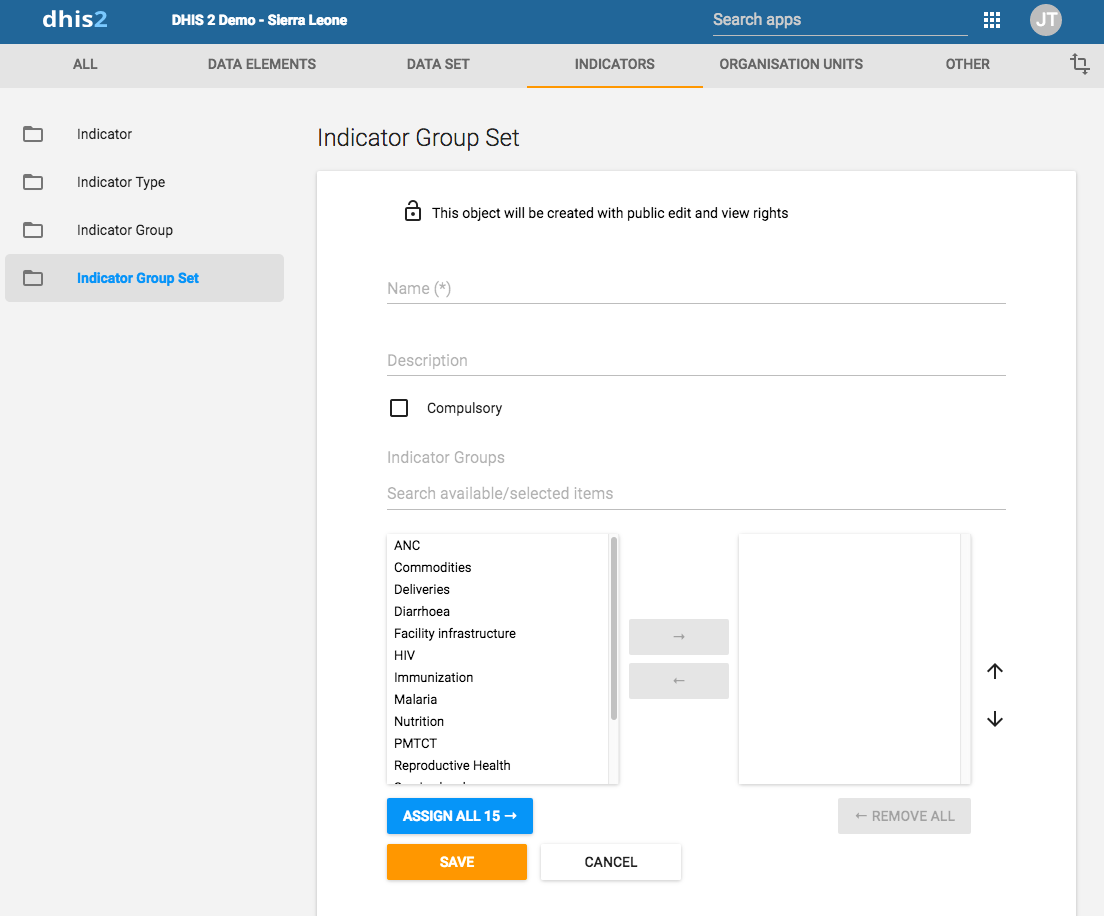
Indicator group sets create combined groups of similar indicators. For example, you might have a group of indicators called "Malaria" and "Leishmaniasis". Both of these groups could be combined into a group set called "Vector-borne diseases". Indicator groups sets are used during analysis of data to combine similar themes of indicators.
Open the Maintenance app and click Indicators > Indicator group.
Click the add button.
Fill in the form:
Select indicator groups and assign them.
Available indicator groups are displayed in the left panel. Indicator groups that are currently members of the indicator group set are displayed in the right hand panel.
Click Save.
Cloning a data element or other objects can save time when you create many similar objects.
Open the Maintenance app and find the type of metadata object you want to clone.
In the object list, click the options menu and select Clone.
Modify the options you want.
Click Save.
You can assign different sharing settings to metadata objects, for example organisation units and tracked entity attributes. These sharing settings control which users and users groups that can view or edit a metadata object.
Some metadata objects also allows you to change the sharing setting of data entry for the object. These additional settings control who can view or enter data in form fields using the metadata.
Note
The default setting is that everyone (Public access) can find, view and edit metadata objects.
Open the Maintenance app and find the type of metadata object you want to modify.
In the object list, click the context menu and select Sharing settings.
(Optional) Add users or user groups: search for a user or a user group and select it. The user or user group is added to the list.
Change sharing settings for the access groups you want to modify.
Can edit and view: The access group can view and edit the object.
Can view only: The access group can view the object.
No access (only applicable to Public access): The public won't have access to the object.
Change data sharing settings for the access groups you want to modify.
Can capture data: The access group can view and capture data for the object.
Can view data: The access group can view data for the object.
No access: The access group won't have access to data for the object.
Click Close.
Note
You can only delete a data element and other data element objects if no data is associated to the data element itself.
Warning
Any data set that you delete from the system is irrevocably lost. All data entry forms, and section forms which may have been developed will also be removed. Make sure that you have made a backup of your database before deleting any data set in case you need to restore it at some point in time.
Open the Maintenance app and find the type of metadata object you want to delete.
In the object list, click the options menu and select Delete.
Click Confirm.
Open the Maintenance app and find the type of metadata object you want to view.
In the object list, click the options menu and select Show details.
DHIS2 provides functionality for translations of database content, for example data elements, data element groups, indicators, indicator groups or organisation units. You can translate these elements to any number of locales. A locale represents a specific geographical, political, or cultural region.
Tip
To activate a translation, open the System Settings app, click > Appearance and select a language.
Open the Maintenance app and find the type of metadata object you want to translate.
In the object list, click the options menu and select Translate.
Tip
If you want to translate an organisation unit level, click directly on the Translate icon next to each list item.
Select a locale.
Type a Name, Short name and Description.
Click Save.
In this section you will learn how to:
Create a new organisation unit and build up the organisation unit hierarchy
Create organisation unit groups, group sets, and assign organisation units to them
Modify the organisation unit hierarchy
The organisation unit hierarchy defines the organisation structure of DHIS2, for example how health facilities, administrative areas and other geographical areas are arranged with respect to each other. It is the where dimension of DHIS2, similar to how periods represent the when dimension.
The organisation unit hierarchy is built up by parent-child relations. In DHIS2, each of these nodes is an organisation unit. A country might for example have eight provinces, and each province might have a number of districts as children. Normally, the lowest levels consist of facilities where data is collected. Data collecting facilities can also be located at higher levels, for example national or provincial hospitals. Therefore, you can create skewed organisation trees in DHIS2.
You can only have one organisation hierarchy at the same time.
You can have any number of levels in a hierarchy.
Typically national organisation hierarchies in public health have four to six levels.
You can create additional classifications by using organisation groups and organisation group sets.
For example to create parallel administrative boundaries to the health care sector.
It is recommended to use organisation unit groups to create a non-geographical hierarchy.
An organisation unit can only be a member of a single organisation unit group within an organisation unit group set.
An organisation unit group can be part of multiple organisation unit group sets.
The organisation unit hierarchy is the main vehicle for data aggregation on the geographical dimension.
When you close an organisation unit, you can't register or edit events to this organisation unit in the Event Capture and Tracker Capture apps.
Important
You can change the organisation unit hierarchy after you've created it, even organisation units that collect data. However, DHIS2 always uses the latest hierarchy for data aggregation. So if you change the hierarchy, you loose the temporal representation of the hierarchy across time.
District A is sub-divided into District B and District C. Facilities which belonged to District A are reassigned to District B and C. Any historical data, which you entered before the split occurred, is still registered as belonging to District B and C, not to the obsolete District A.
In the Maintenance app, you manage the following organisation unit objects:
| Object type | Available functions |
|---|---|
| Organisation unit | Create, edit, clone, delete, show details and translate |
| Organisation unit group | Create, edit, clone, share, delete, show details and translate |
| Organisation unit group set | Create, edit, clone, share, delete, show details and translate |
| Organisation unit level | Edit and translate |
| Hierarchy operations | Move organisation units |
The recommended workflow is:
Create organisation units.
Create organisation unit groups.
Create organisation unit group sets.

You add organisation units to the hierarchy one by one, either as a root unit or as a child of a selected organisation unit. You can only have one root unit.
Open the Maintenance app and click Organisation unit > Organisation unit.
Click the add button.
Select which organisation unit your new organisation unit will belong to:
Click Parent organisation unit.
In the organisation unit tree, locate the parent organisation unit and select it. Your selection is marked in yellow.
Tip
Click the arrows to expand the organisation unit tree.
Click Select.
Enter a Name of the organisation unit.
Each organisation unit must have an unique name.
Enter a Short name for the organisation unit.
Typically, the short name is an abbreviation of the full organisation unit name. This attribute is often used in reports to display the name of the organisation unit, where space is limited.
(Optional) Assign a Code.
In many countries organisation units are assigned a code.
(Optional) Upload a / remove the Organisation unit image
(Optional) Type a Description of the organisation unit.
Select an Opening date.
The opening dates control which organisation units that existed at a point in time, for example when analysing historical data.
If applicable, select a Closed date.
In the Comment field, enter any additional information that you would like to add.
(Optional) In the URL field, enter a link to an external web site that has additional information about the organisation unit.
Enter contact information:
Contact person
Address
Phone number
(Optional) Enter Latitude and Longitude.
You must have latitude and longitude values to create maps in the Maps app. Then your organisation units can be represented as points on a map, for example a health facility. Without this information, the Maps app will not work.
It might be more efficient to import coordinates later as a batch job for all organisation units using the Import-Export app. You also use the Import-Export app to create polygons. A polygon is an organisation unit that represent an administrative boundary.
If applicable, select Data sets and assign them.
Note
You control whether a user should be able to assign data sets to an organisation unit in the System Settings app:
Open the System Settings app, click Access and select Allow assigning object to related objects during add or update.
If applicable, select Programs and assign them.
Note
You control whether a user should be able to assign programs to an organisation unit in the System Settings app:
Open the System Settings app, click Access and select Allow assigning object to related objects during add or update.
If applicable, enter custom attributes values, for example HR identifier.
Note
You configure the custom attributes in the Maintenance app:
Open the Maintenance app and click Other > Attribute.
Click Save.
Organisation unit groups allow you to classify related organisation units into a common theme. You can for example group all organisation units that are hospitals in an Hospital group.
Open the Maintenance app and click Organisation unit > Organisation unit group.
Click the add button.
Fill in the form:
Name: Provide a precise, unique and descriptive name for the organisation unit group.
Short name: The short name should be less than 25 characters. Typically, the short name is an abbreviation of the full organisation unit name. This attribute is used in certain places in DHIS2 where space is limited.
Code
Symbol: Select a symbol which will be used to display the organisation unit (points only) when the layer is displayed in the Maps app.
In the organisation tree, click the organisation units you want to add to the organisation unit group.
You can locate an organisation unit in the tree by expanding the branches (click on the arrow symbol), or by searching for it by name.
The selected organisation units display in orange.
Click Save.
Organisation unit group sets allows you to create additional classifications of organisation units. The group sets create new dimensions so that you can make a more detailed data analysis. You an easily filter, organise or aggregate data by groups within a group set.
You can have any number of organisation unit group sets.
The default organisation unit group sets are Type and Ownership.
An organisation unit can only be a member of a single organisation unit group within an organisation unit group set.
An organisation unit group can be part of multiple organisation unit group sets.
You can define whether an organisation unit group set is compulsory or not, which will affect the completeness of the data. Compulsory means that all organisation units must be member of a group in that group set.
Note
In the Data integrity part of the Data administration app you can verify if you've accidentally assigned the same organisation unit to multiple groups within the same group set. In this app you also find information about organisation units that are not members of a compulsory organisation unit group set.
Open the Maintenance app and click Organisation unit > Organisation unit group set.
Click the add button.
Fill in:
Name: Provide a precise name for the organisation unit group set.
Short name: Provide a short name for the organisation unit group set.
Code
Description: Describe what the organisation unit group set measures or captures.
If you want all organisation units to be members of a group within the group set, select Compulsory.
(Optional) Select Data dimension.
If you select **Data dimension**, the group set will be available to the analytics as another dimension, in addition to the standard dimensions of "Period" and "Organisation unit".
(Optional) Select Include subhierarchy in analytics.
If you select this, a sub-organisation unit will inherit the organisation unit group property from its closest "parent" organisation unit. Any property on the sub-organisation unit will override the inherit value.
If an organisation unit have no associated organisation unit group, the organisation unit can inherit its closest parent's organisation unit group. If none of the parent organisation unit groups have an organisation unit group for a given org unit group set, the result will still be "blank", but if at least one parent has an organisation unit group, sub-organisation unit will inherit it.
include subhierarchy in analytics" is enabled, which means the org units inherit their closest parents org unit group IF the org unit is white (no org unit group associated with it).
Select organisation unit groups and assign them.
In the left-hand list, you find the available organisation unit groups. Use the arrows to move selected groups between the two lists.
If there are no organisation unit groups in the left-hand list, click Add new. In the form that opens, create the organisation units group you need. When you're done, click Refresh values.
Note
An organisation unit can only be a member of a single organisation unit group within an organisation unit group set.
Click Save.

You want to analyse data based on the ownership of the facilities. All facilities have an owner so you need to make sure that all organisation units get this classification. To do that you can use the Compulsory option:
Create a group for each ownership type, for example "MoH", "Private" and "Faith-based".
Assign all facilities in the database to one of these groups.
Create an organisation unit group set called "Ownership" and select Compulsory.
Assign the organisation unit groups "MoH", "Private" and "Faith-based" to the "Ownership" organisation group set.
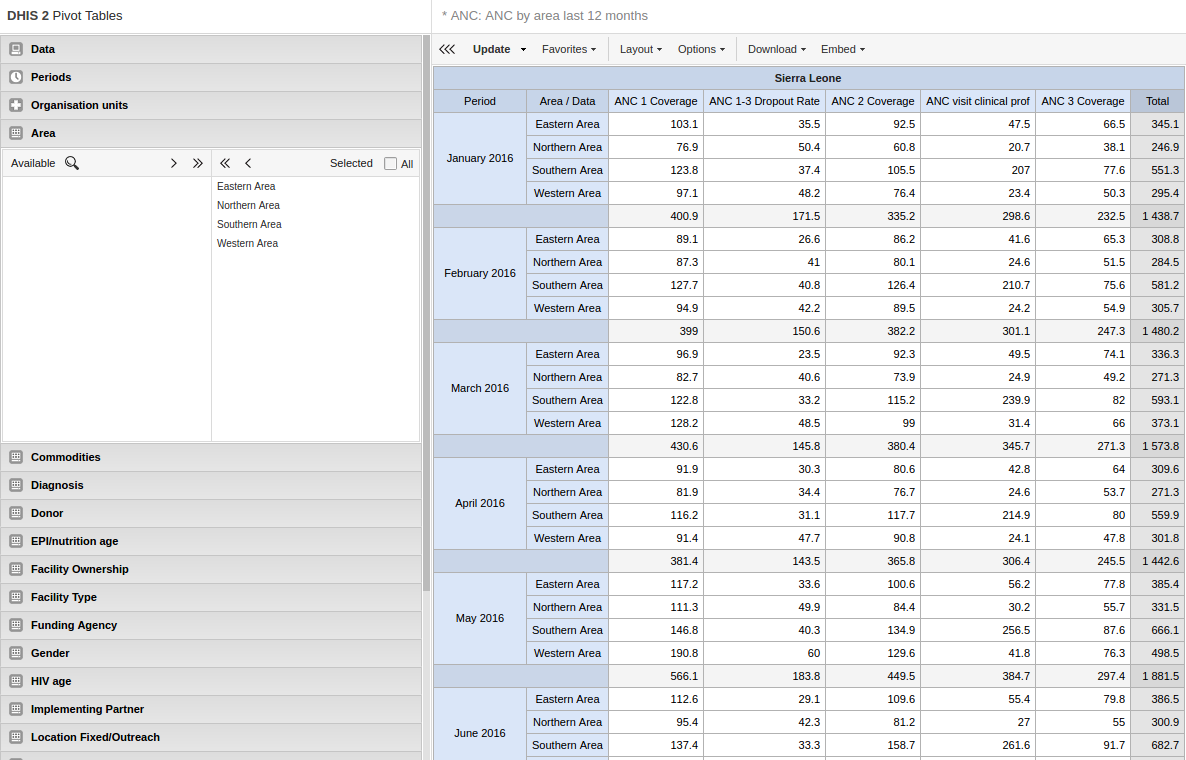
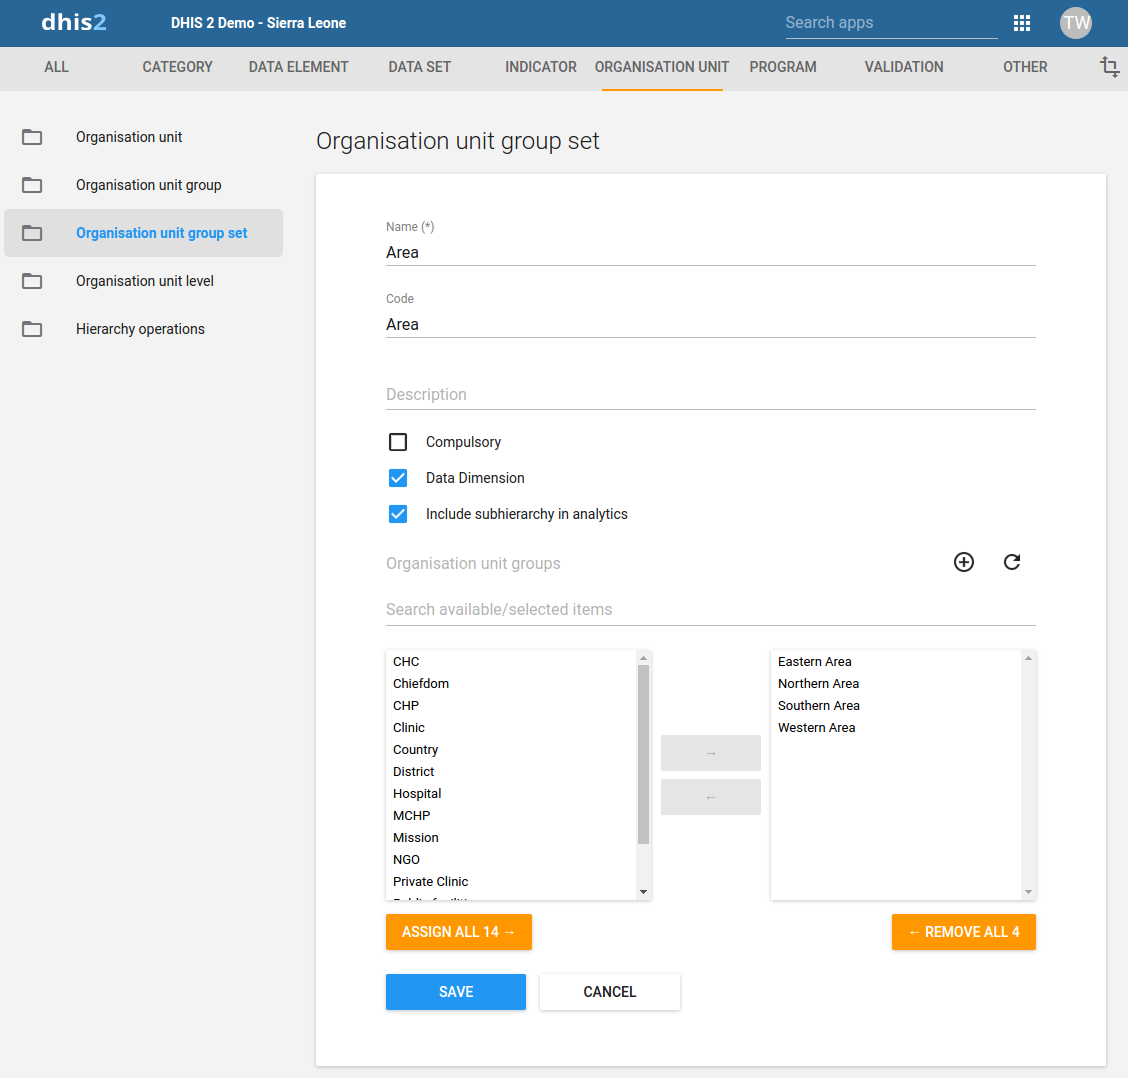
Group you organisation unit in two ways and aggregate data on these two parallel hierarchies
Use to aggregate data (only in analytics apps)
An additional setting to the organisation unit group set, creates a dynamic "membership" to a organisation unit group set.
You don't change the organisation unit hierarchy
Scalable and dynamic
Dynamic inclusion of hierarchy
Dynamic additional classification
When you add children to an organisation unit, DHIS2 automatically creates a new organisation unit level if necessary. The system also assigns a generic name to this level, for example "Level 5". You can replace the generic name with a contextual name, for example "Country", "Province", "District" or "Health Facility". DHIS2 uses the contextual names anywhere levels are referred to, for example in the Maps app.
Open the Maintenance app and click Organisation unit > Organisation unit level.
The loading time of the list depends on the depth of the organisation unit hierarchy tree.
For the organisation unit levels you want to modify, type a name.
Select the number of offline levels.
Note
You configure the default value in the System Settings app:
Open the System Settings app, click General and select a level in the Max offline organisation unit levels list.
Click Save.
You can move organisation units within in the hierarchy by changing the parent of a selected organisation unit.
Open the Maintenance app and click Organisation unit > Hierarchy operations.
In the left-hand hierarchy tree, select the organisation unit(s) you want to move.
Note
If the selected organisation unit is has sub-organisation units, all of them move to the new parent organisation unit.
In the right-hand hierarchy tree, select which organisation unit you want to move the selected organisation unit(s) to.
Click Move x organisation units, where x stands for the number of organisation units you have selected.
Your changes are immediately reflected in the left-hand side hierarchy tree.
When you close an organisation unit, you can't register or edit events to this organisation unit in the Event Capture and Tracker Capture apps.
Open the Maintenance app and click Organisation unit > Organisation unit.
In the object list, click the options menu and select Edit.
Select a Closed date.
Click Save.
Cloning a data element or other objects can save time when you create many similar objects.
Open the Maintenance app and find the type of metadata object you want to clone.
In the object list, click the options menu and select Clone.
Modify the options you want.
Click Save.
You can assign different sharing settings to metadata objects, for example organisation units and tracked entity attributes. These sharing settings control which users and users groups that can view or edit a metadata object.
Some metadata objects also allows you to change the sharing setting of data entry for the object. These additional settings control who can view or enter data in form fields using the metadata.
Note
The default setting is that everyone (Public access) can find, view and edit metadata objects.
Open the Maintenance app and find the type of metadata object you want to modify.
In the object list, click the context menu and select Sharing settings.
(Optional) Add users or user groups: search for a user or a user group and select it. The user or user group is added to the list.
Change sharing settings for the access groups you want to modify.
Can edit and view: The access group can view and edit the object.
Can view only: The access group can view the object.
No access (only applicable to Public access): The public won't have access to the object.
Change data sharing settings for the access groups you want to modify.
Can capture data: The access group can view and capture data for the object.
Can view data: The access group can view data for the object.
No access: The access group won't have access to data for the object.
Click Close.
Note
You can only delete a data element and other data element objects if no data is associated to the data element itself.
Warning
Any data set that you delete from the system is irrevocably lost. All data entry forms, and section forms which may have been developed will also be removed. Make sure that you have made a backup of your database before deleting any data set in case you need to restore it at some point in time.
Open the Maintenance app and find the type of metadata object you want to delete.
In the object list, click the options menu and select Delete.
Click Confirm.
Open the Maintenance app and find the type of metadata object you want to view.
In the object list, click the options menu and select Show details.
DHIS2 provides functionality for translations of database content, for example data elements, data element groups, indicators, indicator groups or organisation units. You can translate these elements to any number of locales. A locale represents a specific geographical, political, or cultural region.
Tip
To activate a translation, open the System Settings app, click > Appearance and select a language.
Open the Maintenance app and find the type of metadata object you want to translate.
In the object list, click the options menu and select Translate.
Tip
If you want to translate an organisation unit level, click directly on the Translate icon next to each list item.
Select a locale.
Type a Name, Short name and Description.
Click Save.
A validation rule is based on an expression. The expression defines a relationship between data element values. The expression forms a condition with certain logical criteria.
The expression consists of:
A left side
A right side
An operator
A validation rule asserting that the total number of vaccines given to infants is less than or equal to the total number of infants.
The left and right sides must return numeric values.
In the Maintenance app, you manage the following validation rule objects:
| Object type | What you can do |
|---|---|
| Validation rule | Create, edit, clone, delete, show details, and translate |
| Validation rule group | Create, edit, clone, delete, share, show details, and translate |
| Validation notification | Create, edit, clone, delete, show details, and translate |
You can use sliding windows to group data across multiple periods as opposed to selecting data for a single period. Sliding windows have a size, that is to say, the number of days to cover, a starting point and an end point. The example below shows disease surveillance data:.
The data in the orange section, selects data based on the current period. There is a threshold, which is calculated once for each week or period, and this is shown in the "Result" section.
The data in the blue section is the sliding window. It selects data from the past 7 days. The "Result" shows the total number of confirmed cases of a disease.
The validation rule makes sure users are notified when the total number of cases breaks the threshold for the period.
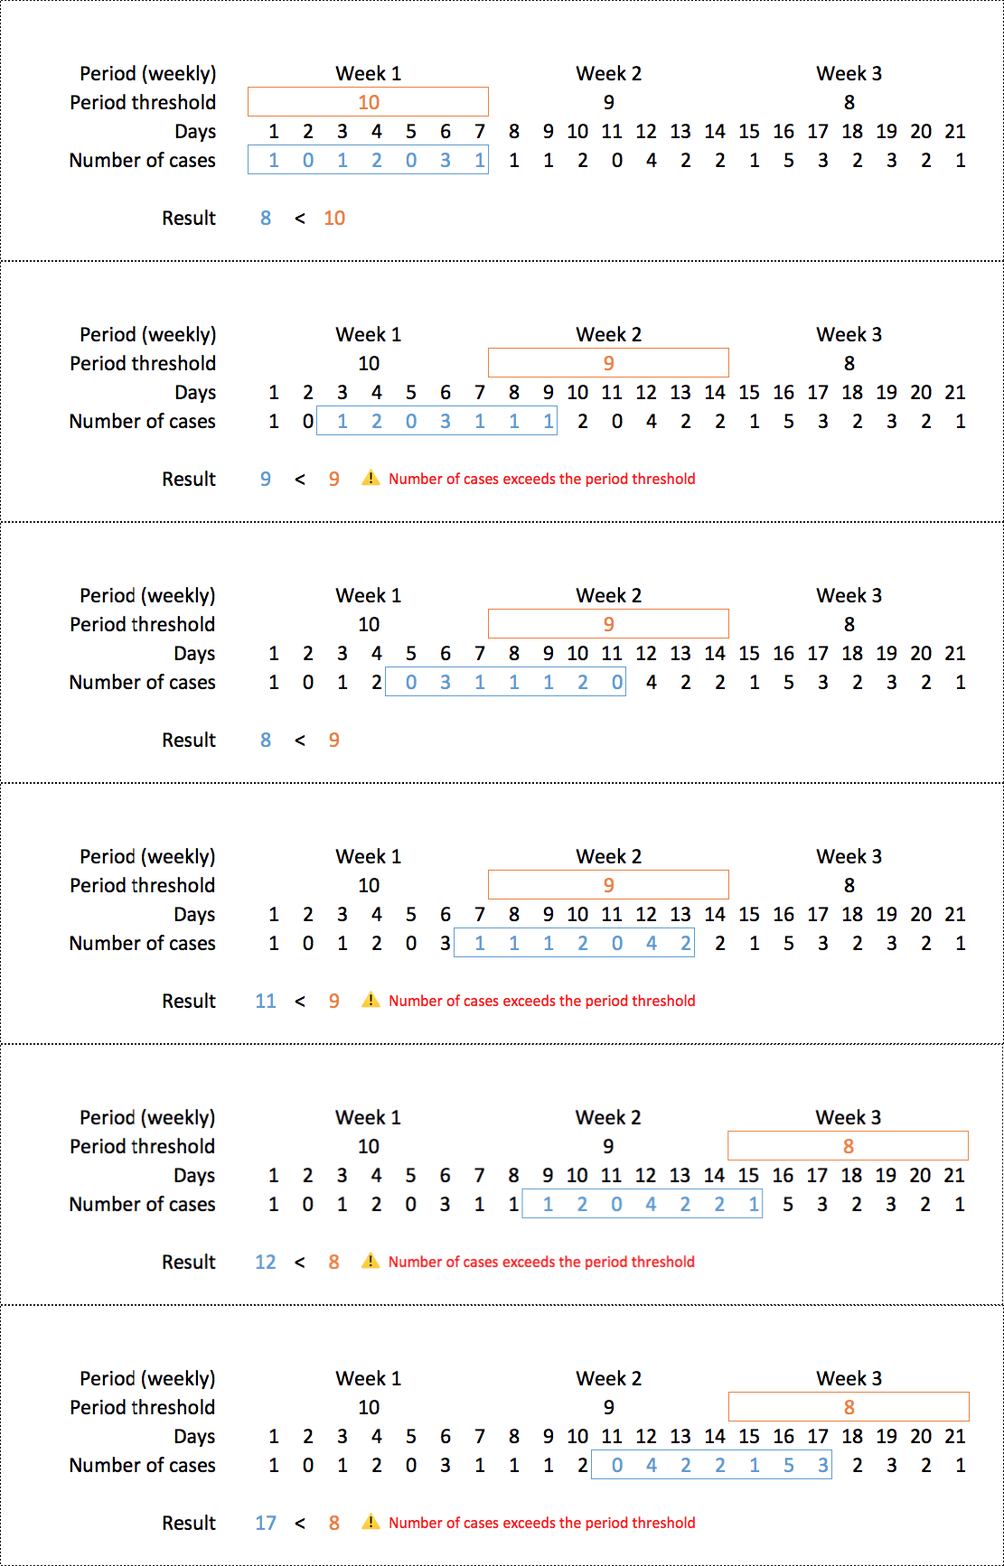
| With sliding windows | Without sliding windows |
|---|---|
| Used only for event data. | Used for event data and aggregate data. |
| Data selection is based on a fixed number of days (periodType). | Data selection is always based on a period. |
| The position of the sliding window is always relative to the period being compared. | Data is always selected for the same period as the period being compared. |
See also: How to use sliding windows when you're Creating or editing a validation rule.
A validation rule group allows you to group related validation rules. When you run a validation rule analysis, you can choose to run all of the validation rules in your system, or just the validation rules in one group.
You can configure a validation rule analysis to automatically send notifications about validation errors to selected user groups. These messages are called validation notifications. They are sent via the internal DHIS2 messaging system.
You can send validation rule notifications as individual messages or as message summaries. This is useful, for example, if you want to send individual messages for high-priority disease outbreaks, and summaries for low-priority routine data validation errors.
You can use the following functions in a validation rule left side or right side:
| Validation Rule Function | Arguments | Description |
|---|---|---|
| contains | (expr, sub1, ...) | Searches an expression for one or more substrings. Returns true if the expression contains all the substrings. For example, the following are all true: contains("abcd", "abcd"); contains("abcd", "b"); and contains("abcd", "ab", "bc"). Comparisons are case-sensitive. |
| containsItems | (expr, item1, ...) | Searches an expression for one or more items. The expression is made up of comma-separated elements. containsItems returns true if every item exactly matches an element in the expression. For example, containsItems("abcd", "abcd") and containsItems("ab,cd", "ab", "cd") are true, but containsItems("abcd", "b") and containsItems("abcd", "ab", "bc") are false. Comparisons are case-sensitive. containsItems can be used for multi-valued data elements to see if an item is contained in the data element values. |
| if | (boolean-expr, true-expr, false-expr) | Evaluates the boolean expression and if true returns the true expression value, if false returns the false expression value. The arguments must follow the rules for any indicator expression. |
| is | (expr1 in expression [, expression ...]) | Returns true if expr1 is equal to any of the following expressions, otherwise false. |
| isNull | (element) | Returns true if the element value is missing (null), otherwise false. |
| isNotNull | (element) | Returns true if the element value is not missing (not null), otherwise false. |
| firstNonNull | (element [, element ...]) | Returns the value of the first element that is not missing (not null). Can be provided any number of arguments. Any argument may also be a numeric or string literal, which will be returned if all the previous objects have missing values. |
| greatest | (expression [, expression ...]) | Returns the greatest (highest) value of the expressions given. Can be provided any number of arguments. |
| least | (expression [, expression ...]) | Returns the least (lowest) value of the expressions given. Can be provided any number of arguments. |
| log | (expression [, base ]) | Returns the natural logarithm (base e) of the numeric expression. If an integer is given as a second argument, returns the logarithm using that base. |
| log10 | (expression) | Returns the common logarithm (base 10) of the numeric expression. |
| null | Returns no result. For example, if( #{FH8ab5Rog83}<0, null, 1 ) returns nothing if the data element value is less than 0, otherwise 1. | |
| orgUnit.ancestor | (orgUnitUid [, orgUnitUid ...]) | Returns true if the organisation unit is a descendant of any of the (1 or more) organisation units, otherwise false. |
| orgUnit.dataSet | (dataSetUid [, dataSetUid ...]) | Returns true if the organisation unit is assigned to any of the (1 or more) data sets, otherwise false. |
| orgUnit.group | (ouGroupUid [, ouGroupUid ...]) | Returns true if the organisation unit is a member of any of the (1 or more) organisation unit groups, otherwise false. |
| orgUnit.program | (programUid [, programUid ...]) | Returns true if the organisation unit is assigned to any of the (1 or more) programs, otherwise false. |
| removeZeros | (expression) | Returns nothing if the expression value is 0, otherwise returns the expression value. |
Open the Maintenance app and click Validation > Validation rule.
Click the add button.
Type a Name.
The name must be unique among the validation rules.
(Optional) In the Code field, assign a code.
(Optional) Type a Description.
Select an Importance: High, Medium or Low.
Select a Period type.
Select an Operator: Compulsory pair, Equal to, Exclusive pair, Greater than, Greater than or equal to or Not equal to.
The Compulsory pair operator allows to require that data values must be entered for a form for both left and right sides of the expression, or for neither side. This means that you can require that if one field in a form is filled, then one or more other fields must also be filled.
The Exclusive pair allows to assert that if any value exist on the left side then there should be no values on the right side (or vice versa). This means that data elements which compose the rule on either side should be mutually exclusive from each other, for a given time period / organisation unit /attribute option combo.
Create the left side of the expression:
Click Left side.
Select Sliding window if you want to view data relative to the period you are comparing. See also About validation rules.
Select a Missing value strategy. This selection sets how the system evaluates a validation rule if data is missing.
| Option | Description |
|---|---|
| Skip if any value is missing | The validation rule will be skipped if any of the values which compose the expression are missing. This is the default option. Always select this option you use the Exclusive pair or Compulsory pair operator. |
| Skip if all values are missing | The validation rule will be skipped only if all of the operands which compose it are missing. |
| Never skip | The validation rule will never be skipped in case of missing data, and all missing operands will be treated effectively as a zero. |
Type a Description.
Build an expression based on the available data elements, program objects, organisation units, counts and constants.
In the right pane, double-click the data objects you want to include in the expression. Combine with the mathematical operators located below the left pane.
Click Save.
Create the right side of the expression:
Click Right side.
Select a Missing value strategy. This selection sets how the system evaluates a validation rule if data is missing.
| Option | Description |
|---|---|
| Skip if any value is missing | The validation rule will be skipped if any of the values which compose the expression are missing. This is the default option. Always select this option you use the Exclusive pair or Compulsory pair operator. |
| Skip if all values are missing | The validation rule will be skipped only if all of the operands which compose it are missing. |
| Never skip | The validation rule will never be skipped in case of missing data, and all missing operands will be treated effectively as a zero. |
Select Sliding window if you want to view data relative to the period you are comparing. See also About validation rules.
Type a Description.
Build an expression based on the available data elements, program objects, organisation units, counts and constants.
In the right pane, double-click the data objects you want to include in the expression. Combine with the mathematical operators located below the left pane.
Click Save.
(Optional) Choose which Organisation unit levels this rule should be evaluated for. Leaving this empty will cause the validation rule to be evaluated at all levels.
(Optional) Click Skip this rule during form validation to avoid triggering this rule while doing data entry
Click Save.
Open the Maintenance app and click Validation > Validation rule group.
Click the add button.
Type a Name.
(Optional) In the Code field, assign a code.
(Optional) Type a Description.
Double-click the Validation rules you want to assign to the group.
Click Save.
Open the Maintenance app and click Validation > Validation notification.
Click the add button.
Type a Name.
(Optional) In the Code field, assign a code.
Select Validation rules.
Select Recipient user groups.
(Optional) Select Notify users in hierarchy only.
If you select this option, the system will filter the recipient users. (The system derives the recipient users from the recipient user groups.) The filter is based on which organisation unit the recipient user belongs to. The users linked to organisation units which are ancestors of the organisation unit where the violation took place will receive validation notifications. The system will ignore other users and these users won't receive validation notifications.
Create the message template:
Create the Subject template.
Double-click the parameters in the Template variables field to add them to your subject.
Create the Message template.
Double-click the parameter names in the Template variables field to add them to your message.
Click Save.
Cloning a data element or other objects can save time when you create many similar objects.
Open the Maintenance app and find the type of metadata object you want to clone.
In the object list, click the options menu and select Clone.
Modify the options you want.
Click Save.
You can assign different sharing settings to metadata objects, for example organisation units and tracked entity attributes. These sharing settings control which users and users groups that can view or edit a metadata object.
Some metadata objects also allows you to change the sharing setting of data entry for the object. These additional settings control who can view or enter data in form fields using the metadata.
Note
The default setting is that everyone (Public access) can find, view and edit metadata objects.
Open the Maintenance app and find the type of metadata object you want to modify.
In the object list, click the context menu and select Sharing settings.
(Optional) Add users or user groups: search for a user or a user group and select it. The user or user group is added to the list.
Change sharing settings for the access groups you want to modify.
Can edit and view: The access group can view and edit the object.
Can view only: The access group can view the object.
No access (only applicable to Public access): The public won't have access to the object.
Change data sharing settings for the access groups you want to modify.
Can capture data: The access group can view and capture data for the object.
Can view data: The access group can view data for the object.
No access: The access group won't have access to data for the object.
Click Close.
Note
You can only delete a data element and other data element objects if no data is associated to the data element itself.
Warning
Any data set that you delete from the system is irrevocably lost. All data entry forms, and section forms which may have been developed will also be removed. Make sure that you have made a backup of your database before deleting any data set in case you need to restore it at some point in time.
Open the Maintenance app and find the type of metadata object you want to delete.
In the object list, click the options menu and select Delete.
Click Confirm.
Open the Maintenance app and find the type of metadata object you want to view.
In the object list, click the options menu and select Show details.
DHIS2 provides functionality for translations of database content, for example data elements, data element groups, indicators, indicator groups or organisation units. You can translate these elements to any number of locales. A locale represents a specific geographical, political, or cultural region.
Tip
To activate a translation, open the System Settings app, click > Appearance and select a language.
Open the Maintenance app and find the type of metadata object you want to translate.
In the object list, click the options menu and select Translate.
Tip
If you want to translate an organisation unit level, click directly on the Translate icon next to each list item.
Select a locale.
Type a Name, Short name and Description.
Click Save.
You can use metadata attributes to add additional information to metadata objects. In addition to the standard attributes for each of these objects it may be useful to store information for additional attributes, for example the collection method for a data element.
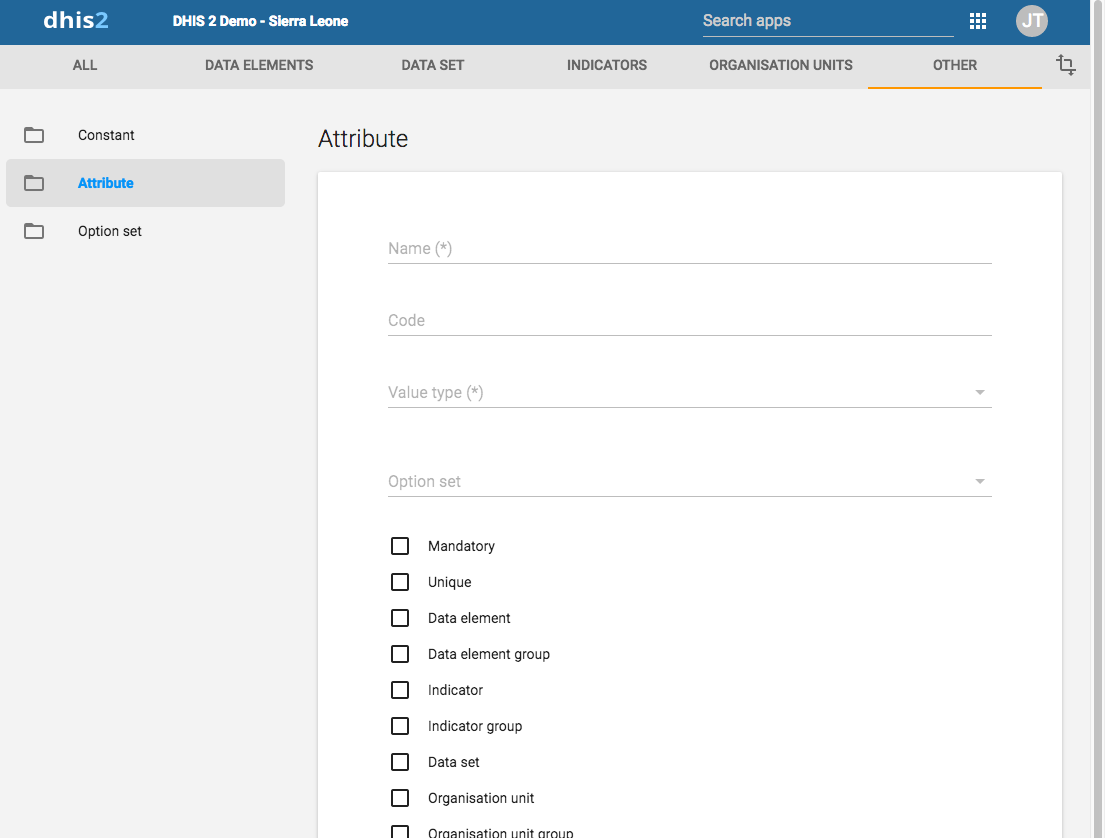
In the Maintenance app, you manage the following attribute objects:
| Object type | Available functions |
|---|---|
| Attribute | Create, edit, clone, delete, show details and translate |
Open the Maintenance app and click Attribute.
Click the add button.
In the Name field, type the name of the attribute.
Each attribute must have a unique name
(Optional) In the Code field, assign a code.
Select a Value type.
If the value supplied for the attribute does not match the value type you will get a warning.
Select an Option set.
Select the options you want, for example:
Select Mandatory if you want an object to always have the dynamic attribute.
Select Unique if you want the system to enforce that values are unique for a specific object type.
Click Save.
The dynamic attribute is now available for the objects you assigned it to.
Cloning a data element or other objects can save time when you create many similar objects.
Open the Maintenance app and find the type of metadata object you want to clone.
In the object list, click the options menu and select Clone.
Modify the options you want.
Click Save.
Note
You can only delete a data element and other data element objects if no data is associated to the data element itself.
Warning
Any data set that you delete from the system is irrevocably lost. All data entry forms, and section forms which may have been developed will also be removed. Make sure that you have made a backup of your database before deleting any data set in case you need to restore it at some point in time.
Open the Maintenance app and find the type of metadata object you want to delete.
In the object list, click the options menu and select Delete.
Click Confirm.
Open the Maintenance app and find the type of metadata object you want to view.
In the object list, click the options menu and select Show details.
DHIS2 provides functionality for translations of database content, for example data elements, data element groups, indicators, indicator groups or organisation units. You can translate these elements to any number of locales. A locale represents a specific geographical, political, or cultural region.
Tip
To activate a translation, open the System Settings app, click > Appearance and select a language.
Open the Maintenance app and find the type of metadata object you want to translate.
In the object list, click the options menu and select Translate.
Tip
If you want to translate an organisation unit level, click directly on the Translate icon next to each list item.
Select a locale.
Type a Name, Short name and Description.
Click Save.
Constants are static values which can be made available to users for use in data elements and indicators. Some indicators, such as "Couple year protection rate" depend on constants which usually do not change over time.
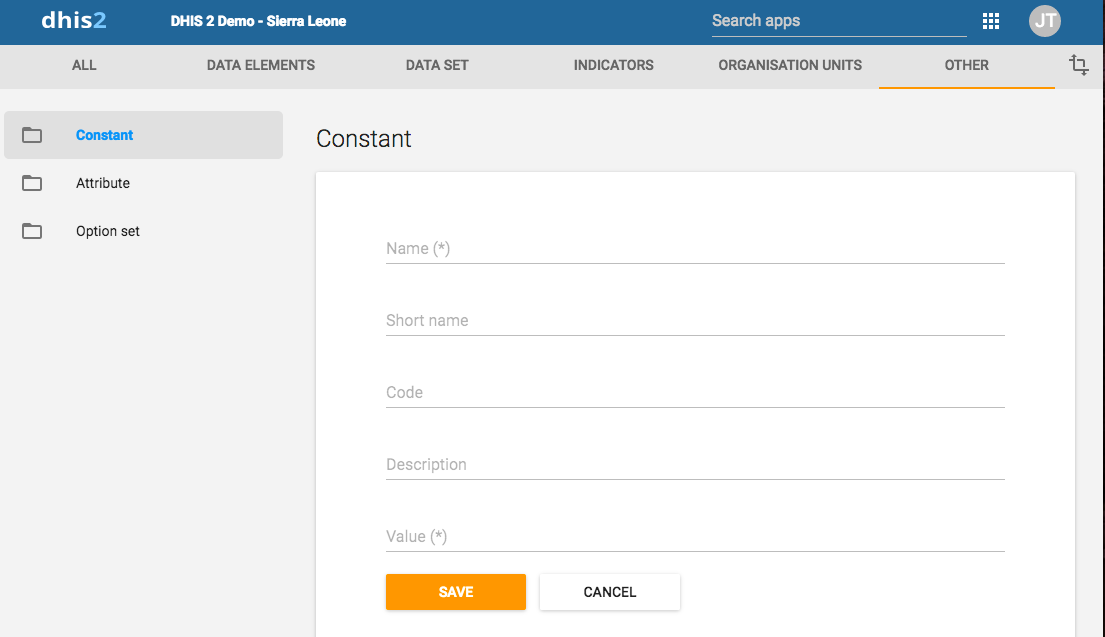
In the Maintenance app, you manage the following constant objects:
| Object type | Available functions |
|---|---|
| Constant | Create, edit, clone, share, delete, show details and translate |
Open the Maintenance app and click Other > Constant.
Click the add button.
In the Name field, type the name of the constant.
(Optional) In the Short name field, type an abbreviated name of the constant.
(Optional) In the Code field, assign a code.
In the Description field, type a brief, informative description of the constant.
In the Value field, define the constant's value.
Click Save.
The constant is now available for use.
Cloning a data element or other objects can save time when you create many similar objects.
Open the Maintenance app and find the type of metadata object you want to clone.
In the object list, click the options menu and select Clone.
Modify the options you want.
Click Save.
You can assign different sharing settings to metadata objects, for example organisation units and tracked entity attributes. These sharing settings control which users and users groups that can view or edit a metadata object.
Some metadata objects also allows you to change the sharing setting of data entry for the object. These additional settings control who can view or enter data in form fields using the metadata.
Note
The default setting is that everyone (Public access) can find, view and edit metadata objects.
Open the Maintenance app and find the type of metadata object you want to modify.
In the object list, click the context menu and select Sharing settings.
(Optional) Add users or user groups: search for a user or a user group and select it. The user or user group is added to the list.
Change sharing settings for the access groups you want to modify.
Can edit and view: The access group can view and edit the object.
Can view only: The access group can view the object.
No access (only applicable to Public access): The public won't have access to the object.
Change data sharing settings for the access groups you want to modify.
Can capture data: The access group can view and capture data for the object.
Can view data: The access group can view data for the object.
No access: The access group won't have access to data for the object.
Click Close.
Note
You can only delete a data element and other data element objects if no data is associated to the data element itself.
Warning
Any data set that you delete from the system is irrevocably lost. All data entry forms, and section forms which may have been developed will also be removed. Make sure that you have made a backup of your database before deleting any data set in case you need to restore it at some point in time.
Open the Maintenance app and find the type of metadata object you want to delete.
In the object list, click the options menu and select Delete.
Click Confirm.
Open the Maintenance app and find the type of metadata object you want to view.
In the object list, click the options menu and select Show details.
DHIS2 provides functionality for translations of database content, for example data elements, data element groups, indicators, indicator groups or organisation units. You can translate these elements to any number of locales. A locale represents a specific geographical, political, or cultural region.
Tip
To activate a translation, open the System Settings app, click > Appearance and select a language.
Open the Maintenance app and find the type of metadata object you want to translate.
In the object list, click the options menu and select Translate.
Tip
If you want to translate an organisation unit level, click directly on the Translate icon next to each list item.
Select a locale.
Type a Name, Short name and Description.
Click Save.
Option sets provide a pre-defined drop-down (enumerated) list for use in DHIS2. You can define any kind of options.
An option set called "Delivery type" would have the options: "Normal", "Breach", "Caesarian" and "Assisted".
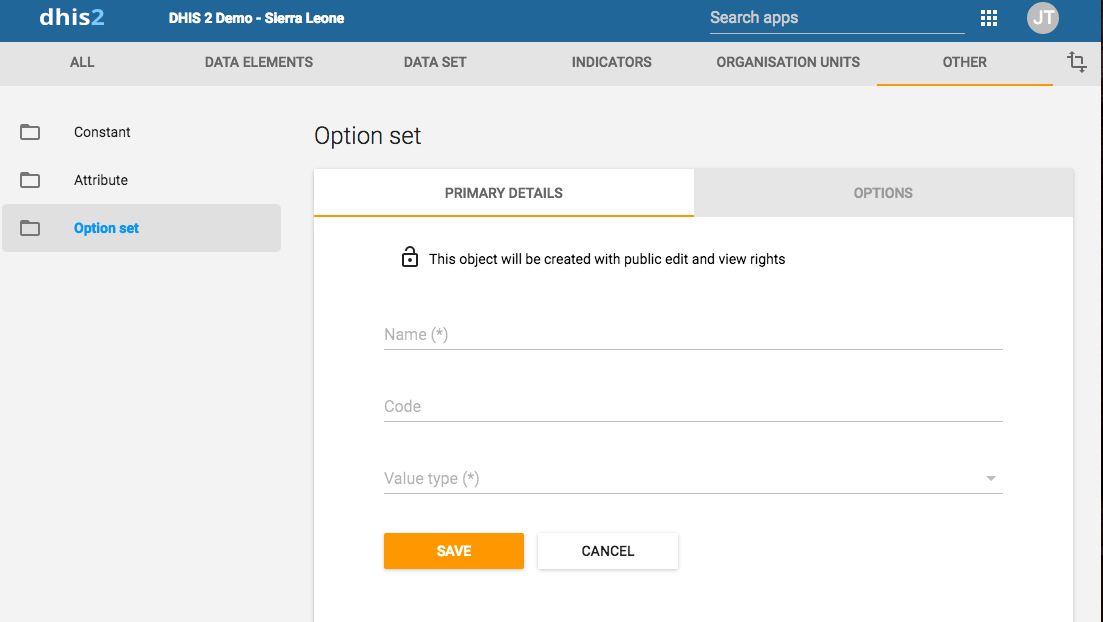
| Object type | Available functions |
|---|---|
| Option set | Create, edit, clone, share, delete, show details and translate |
| Option group | Create, edit, clone, share, delete, show details and translate |
| Option group set | Create, edit, clone, share, delete, show details and translate |
Important
Option sets must have a code as well as a name. You can change the names but you can't change the codes. Both names and codes of all options must be unique, even across different option sets.
Open the Maintenance app and click Other > Option set.
Click the add button.
In the Primary details tab, define the option set:
In the Name field, type the name of the constant.
In the Code field, assign a code.
Select a Value type.
Click Save.
For each option you need, perform the following tasks:
Click the Options tab.
Click the add button.
Type a Name and a Code. Optionally also select a Color and an Icon which will be used for this option in the data capture apps.
Sort the options by name, code/value or manually.
Click Save.
You can group and classify options within an option set by using option groups. This way you can create a subset of options in an option set. The main purpose of this is to be able to filter huge option sets into smaller, related parts.
Options that are grouped can be hidden or shown together in tracker and event capture through program rules.
Note
You cannot change the Option set selected in an Option group once it has been created.
Open the Maintenance app and click Other > Option group.
Click the add button.
Fill in the form:
Once an Option set is selected, you can assign the Options you want to group.
Click Save.
Option group sets allows you to categorise multiple option groups into a set. The main purpose of the option group set is to add more dimensionality to your captured data for analysis.
Note
You cannot change the Option set selected in an Option group set once it has been created.
Open the Maintenance app and click Other > Option group set.
Click the add button.
Fill in the form:
Data dimension
If you select Data dimension, the group set will be available to the analytics as another dimension, in addition to the standard dimensions of "Period" and "Organisation unit".
Select option groups and assign them.
Available option groups are displayed in the left panel. Option groups that are currently members of the option group set are displayed in the right hand panel.
Click Save.
Cloning a data element or other objects can save time when you create many similar objects.
Open the Maintenance app and find the type of metadata object you want to clone.
In the object list, click the options menu and select Clone.
Modify the options you want.
Click Save.
You can assign different sharing settings to metadata objects, for example organisation units and tracked entity attributes. These sharing settings control which users and users groups that can view or edit a metadata object.
Some metadata objects also allows you to change the sharing setting of data entry for the object. These additional settings control who can view or enter data in form fields using the metadata.
Note
The default setting is that everyone (Public access) can find, view and edit metadata objects.
Open the Maintenance app and find the type of metadata object you want to modify.
In the object list, click the context menu and select Sharing settings.
(Optional) Add users or user groups: search for a user or a user group and select it. The user or user group is added to the list.
Change sharing settings for the access groups you want to modify.
Can edit and view: The access group can view and edit the object.
Can view only: The access group can view the object.
No access (only applicable to Public access): The public won't have access to the object.
Change data sharing settings for the access groups you want to modify.
Can capture data: The access group can view and capture data for the object.
Can view data: The access group can view data for the object.
No access: The access group won't have access to data for the object.
Click Close.
Note
You can only delete a data element and other data element objects if no data is associated to the data element itself.
Warning
Any data set that you delete from the system is irrevocably lost. All data entry forms, and section forms which may have been developed will also be removed. Make sure that you have made a backup of your database before deleting any data set in case you need to restore it at some point in time.
Open the Maintenance app and find the type of metadata object you want to delete.
In the object list, click the options menu and select Delete.
Click Confirm.
Open the Maintenance app and find the type of metadata object you want to view.
In the object list, click the options menu and select Show details.
DHIS2 provides functionality for translations of database content, for example data elements, data element groups, indicators, indicator groups or organisation units. You can translate these elements to any number of locales. A locale represents a specific geographical, political, or cultural region.
Tip
To activate a translation, open the System Settings app, click > Appearance and select a language.
Open the Maintenance app and find the type of metadata object you want to translate.
In the object list, click the options menu and select Translate.
Tip
If you want to translate an organisation unit level, click directly on the Translate icon next to each list item.
Select a locale.
Type a Name, Short name and Description.
Click Save.
You can create, edit, clone, delete, show details and translate legends to make the maps you're setting up for your users meaningful. You create maps in the Maps app.
Note
Continuous legends must consist of legend items that end and start with the same value, for example: 0-50 and 50-80. Do not set legend items like this: 0-50 and 51-80. This will create gaps in your legend.
Note
It is not allowed to have gaps in a legend.
It is not allowed to have overlapping legend items.
Open the Maintenance app and click Other > Legend.
Click the add button.
In the Name field, type the legend name.
(Optional) In the Code field, assign a code.
Create the legend items you want to have in your legend:
Select Start value and End value.
Select Number of legend items.
Select a color scheme.
Click Create legend items.
Tip
Click the options menu to edit or delete a legend item.
(Optional) Add more legend items:
Click the add button.
Enter a name and select a start value, an end value and a color.
Click OK.
(Optional) Change the color scales.
Click the colour scale to view a list of color scale options, and select a color scale.
To customize a color scale, click the add button. In the Edit legend item dialog, click the color scale button and hand-pick colors, or enter your color values.
Click Save.
| Legend item | Start value | End value |
|---|---|---|
| Low bad | 0 | 50 |
| Medium | 50 | 80 |
| High good | 80 | 100 |
| Too high | 100 | 1000 |
Cloning a data element or other objects can save time when you create many similar objects.
Open the Maintenance app and find the type of metadata object you want to clone.
In the object list, click the options menu and select Clone.
Modify the options you want.
Click Save.
You can assign different sharing settings to metadata objects, for example organisation units and tracked entity attributes. These sharing settings control which users and users groups that can view or edit a metadata object.
Some metadata objects also allows you to change the sharing setting of data entry for the object. These additional settings control who can view or enter data in form fields using the metadata.
Note
The default setting is that everyone (Public access) can find, view and edit metadata objects.
Open the Maintenance app and find the type of metadata object you want to modify.
In the object list, click the context menu and select Sharing settings.
(Optional) Add users or user groups: search for a user or a user group and select it. The user or user group is added to the list.
Change sharing settings for the access groups you want to modify.
Can edit and view: The access group can view and edit the object.
Can view only: The access group can view the object.
No access (only applicable to Public access): The public won't have access to the object.
Change data sharing settings for the access groups you want to modify.
Can capture data: The access group can view and capture data for the object.
Can view data: The access group can view data for the object.
No access: The access group won't have access to data for the object.
Click Close.
Note
You can only delete a data element and other data element objects if no data is associated to the data element itself.
Warning
Any data set that you delete from the system is irrevocably lost. All data entry forms, and section forms which may have been developed will also be removed. Make sure that you have made a backup of your database before deleting any data set in case you need to restore it at some point in time.
Open the Maintenance app and find the type of metadata object you want to delete.
In the object list, click the options menu and select Delete.
Click Confirm.
Open the Maintenance app and find the type of metadata object you want to view.
In the object list, click the options menu and select Show details.
DHIS2 provides functionality for translations of database content, for example data elements, data element groups, indicators, indicator groups or organisation units. You can translate these elements to any number of locales. A locale represents a specific geographical, political, or cultural region.
Tip
To activate a translation, open the System Settings app, click > Appearance and select a language.
Open the Maintenance app and find the type of metadata object you want to translate.
In the object list, click the options menu and select Translate.
Tip
If you want to translate an organisation unit level, click directly on the Translate icon next to each list item.
Select a locale.
Type a Name, Short name and Description.
Click Save.
You can assign a legend to an indicator or a data element in the Maintenance app, either when you create the object or edit it. When you then select the indicator or data element in the Maps app, the system automatically selects the assigned legend.
A predictor defines how to generate an aggregate data value from an expression containing aggregate and/or event data. The predicted value may be based on:
Data from the same period as the predicted value, and/or
Data from periods previous to the predicted value
A predictor can use data from the same period as the predicted value. For example, you can count the number of organisation units having a non-zero value of a data element by using a predictor expression such as:
if( #{ji7o0ILHuU2} != 0, 1, 0 )When you run this predictor at the organisation unit level where the data is collected, it will store 1 as the predicted value if the data element has a nonzero value for that organisation unit, otherwise 0. (If the data element that you predict into does not store zeros, then zeros will not be stored in the database, to save space.) You can then sum this predicted value in analytics at a higher organisation unit level, to count the number of organisation units with a nonzero value that are under each organisation unit in the report.
A predictor will use data from previous periods when you specify an aggregation function such as sum() or avg(). For example, the following generator expression identifies a value that is the average plus twice the standard deviation of previous period data:
avg( #{ji7o0ILHuU2} ) + 2 * stddev( #{ji7o0ILHuU2} )A predictor expression can access data both from same period as the prediction and previous periods by accessing data both within an agregate function (for previous periods), and outside any aggregate function (for the same period). For example, an expression like the following can be used to take a balance of something from the previous period (#{KOh02hHko7C}), add to that the net change in this period (#{ji7o0ILHuU2}), resulting in the balance for this period:
sum( #{KOh02hHko7C} ) + #{ji7o0ILHuU2}The first data value is inside an aggregate expression (sum) to indicate that it is sampling previous period data (even if there is only one previous period), while the second data value is not in an aggreate function to indicate that it is referencing data from the same period.
If you want to, a predictor's output data element can be referenced in the same predictor's expression. For instance, the expression in this example could be used to predict the balance in a period, and then combine that value with the change in the next period to compute the balance for the next period. When a predictor is run across multiple periods, the periods are processed in chronological order, and the result from an earlier period may be used as input for a later period.
You need to select one or more organisation unit levels for a predictor's output. All values generated by the predictor are stored for organisation units at the level(s) you select. Each item in the predictor expression is the sum of the value stored for that organisation unit (if any) plus any values stored in organisation units below that one (if any).
Note
In configuring a predictor, you must choose one or more organisation unit levels at which predicted data will be output. If no level is selected, no predicted values will be generated.
Warning
If you want to use the predicted values in analytics reporting, or to make other predictions, do not select more than one organisation unit level. When you select more than one level, predictions at the higher level(s) will also include any data used in lower level(s) predictions. If the predictions from multiple levels are subsequently used in analytics, or in the expressions of other predictors, this can result in double counting because the predicted values for a higher level include the predicted values from a lower level.
You may select multiple organisation unit levels if you use the predicted values only in validation rules. For example in disease surveillance, you could have a validation rule alert if an actual value is higher than the range of expected values for that period based on previous period data. To do this, you could create a predictor to compute the average plus twice the standard deviation of previous period data. You could use a validation rule to compare this higest expected value with the actual value. You could run the predictor and validation rule at multiple levels to detect different outbreak scenarios. In one scenario, there might be a significant increase in one facility that exceeds its expected range, but the district containing that facility might not exceed its expected range because the district values are combined with many other facilities. Yet in another scenario, there may be a moderate increase in several facilities that does not exceed the expected range for each facility (because the standard deviation for each facility may be high), but it does exceed the expected range for the district (because the standard deviation for the district as a whole may be lower).
If you want to generate predictions at multiple levels, you could also use different predictors at different levels. For example, you might want to be alerted if the value at one level exceeds the average plus twice the standard deviation, but alerted at another level if it exceeds the average plus 1.8 times the standard deviation. If you want, you could configure the different predictors to have the same output data element. If you use the same output data element, this will still work with validaiton rules at different organisaiton unit levels, but you also must be careful not to use the results in analytics or in other predictor calculations to avoid double counting.
In the Maintenance app, you manage the following predictor objects:
| Object type | Available functions |
|---|---|
| Predictor | Create, edit, clone, delete, show details and translate |
Predictors can generate data values for periods that are in the past, present, or future. These values are based on data from the predicted period, and/or sampled data from periods previous to the predicted period.
If you need data only from the same period in which the prediction is made, then you don't need to read this section. This section describes how to sample data from periods previous to the predicted period.
A predictor's Sequential sample count gives the number of immediate previous periods to sample. For example, if a predictor's period type is Weekly and the Sequential sample count is 4, this means to sample four previous weeks immediately preceding the predicted value week. So the predicted value for week 9 would use samples from weeks 5, 6, 7, and 8:

If a predictor's period type is Monthly and the Sequential sample count is 4, this means to sample four previous months immediately preceding the predicted value month. So the predicted value for May would use samples from weeks January, February, March, and April:

The Sequential sample count can be greater than the number of periods in a year. For example, if you want to sample the 24 months immediately preceding the predicted value month, set the Sequential sample count to 24:
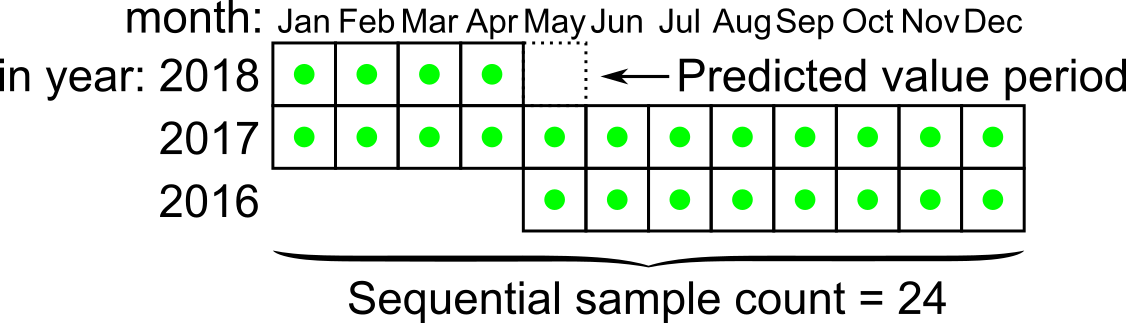
A predictor's Sequential skip count tells how many periods should be skipped immediately previous to the predicted value period, within the Sequential sample count. This could be used, for instance, in outbreak detection to skip one or more immediately preceding samples that might in fact contain values from the beginning of an outbreak that you are trying to detect.
For example, if the Sequential sample count is 4, but the Sequential skip count is 2, then the two samples immediately preceding the predicted period will be skipped, resulting in only two periods being sampled:

A predictor's Annual sample count gives the number of previous years for which samples should be collected at the same time of year. This could be used, for instance, for disease surveillance in cases where the expected incidence of the disease varies during the year and can best be compared with the same relative period in previous years. For example, if the Annual sample count is 2 (and the Sequential sample count is zero), then samples would be collected from periods in the immediately preceding two years, at the same time of year.

You can use the sequential and annual sample counts together to collect samples from a number of sequential periods over a number of past years. When you do this, samples will be collected in previous years during the period at the same time of year as the predicted value period, and also in previous years both before and after the same time of year, as determined by the Sequential sample count number.
For example, if the Sequential sample count is 4 and the Annual sample count is 2, samples will be collected from the 4 periods immediately preceding the predicted value period. In addition samples will be collected in the previous 2 years for the corresponding period, as well as 4 periods on either side:

You can use the Sequential skip count together with the sequential and annual sample counts. When you do this, the Sequential skip count tells how many periods to skip in the same year as the predicted value period. For example, if the Sequential sample count is 4 and the Sequential skip count is 2, then the two periods immediately preceding the predicted value period period will be skipped, but the two periods before that will be sampled:

If the Sequential skip count is equal to or greater than the Sequential sample count, then no samples will be collected for the year containing the predicted value period; only periods from past years will be sampled:

You can use the Sample skip test to skip samples from certain periods that would otherwise be included, based on the results of testing an expression within those periods. This could be used, for instance, in disease outbreak detection, where the sample skip test could identify previous disease outbreaks, to exclude those samples from the prediction of a non-outbreak baseline expected value.
The Sample skip test is an expression that should return a value of true or false, to indicate whether or not the period should be skipped. It can be an expression that tests any data values in the previous period. For example, it could test for a data value that was explicitly entered to indicate that a previous period should be skipped. Or it could compare a previously predicted value for a period with the actual value recorded for that period, to determine if that period should be skipped.
Any periods for which the Sample skip test is true will not be sampled. For example:
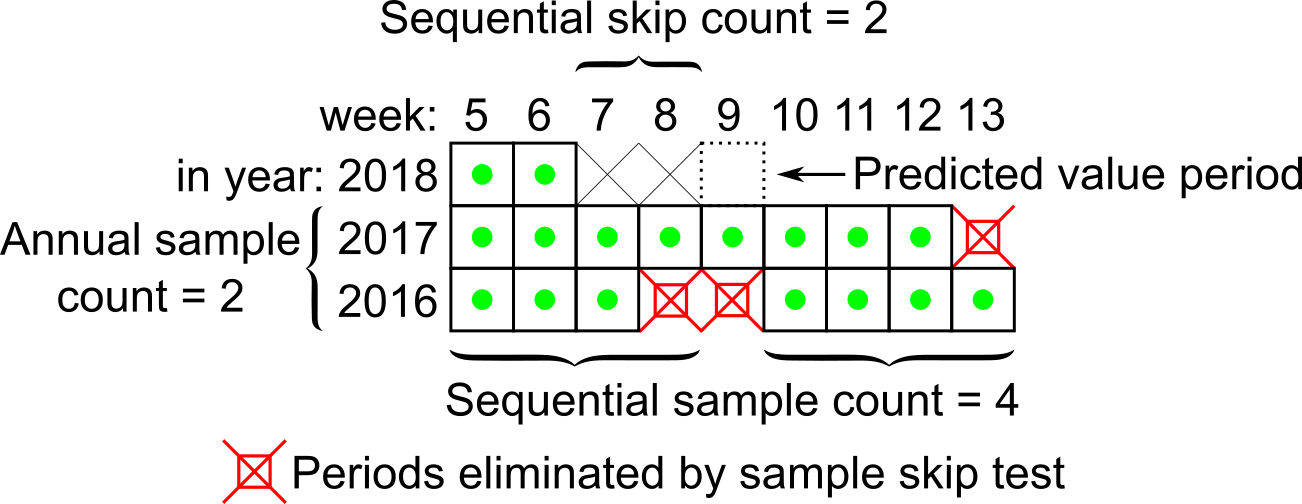
The category option combination (disaggregation) for predictor output data is chosen in one of three ways:
If the predictor's output data element has no disaggregations (category combination "None", also known as the default category combination), then all predictor output data will be made in the default category option combination. In this case, predictor output data is not disaggregated.
If the predictor's output data element has a category combination other than "None", you can choose a fixed disaggregation for the predictor "Output category option combo". If you do so, all output from this predictor will have this category option combination.
For example, if the output data element has a category combination of "Sex and Age", you can decide that all predictor output will go to a category option combination such as "Female under 5", "Male 5 - 10", or any other.
If the predictor's output data element has a category combination other than "None", you can choose "Predict according to input category option combo" as the value for "Output category option combo". If you do so, a different prediction is made for each category option combo in the output data element's category combination (that is, one prediction for "Female under 5", a second for "Male under 5", a third for "Female 5 - 10", and so on).
(In v40.1, this feature is enabled by selecting the choice "\<no value>" for "Output category option combo".)
> **Tip**
>
> In some installations, the options in a category may have changed over time.
For example, a category "Age" may have had three options "1-5", "6-10", and "over 10",
but then was changed to only have two options "10 and under" and "over 10".
Historical data may have values with any of these options.
To use a predictor with such data, you can define another category
such as "Reporting Age" with all the options ever used, such as "1-5", "6-10",
"10 and under", and "over 10". Use this category in the category combination
for the predictor's output data element. This means that all the input category
options will be reflected in the output.
>
> If you then want a single report for the output data that covers
all the disaggregations, you can use category option groups
in a category option group set. For example use a category option group
"10 and under" that contains category options "1-5", "6-10", and "10 and under".
If the input data to a prediction has attribute option combinations, a different prediction will be made for each attribute option combination where there is data.
For example, you could use attribute option combinations to represent different projects on your system. The predictor will generate a value with the attribute option combination for Project A when it finds input data for Project A; it will generate a value with the attribute option combination for Project B when it finds input data for Project B; and so on.
For any input data without attribute option combinations (in other words, with the default attribute option combination), predictions are generated using the default attribute option combination. If you don't use attribute option combinations in the data, they will not be used in predictor output data.
If you use attribute option combinations and also "Predict according to input category option combo", there will be a separate prediction for each combination of disaggregation and attribute option combination. For example, there could be a prediction for Project A data for "Female under 5", a prediction for Project A data for "Male under 5", a prediction for Project B data for "Female under 5", and so on.
Open the Maintenance app and click Other > Predictor.
Click the add button.
In the Name field, type the predictor name.
(Optional) In the Code field, assign a code.
(Optional) Type a Description.
Select an Output data element. Values generated by this predictor are stored as aggregate data associated with this data element and the predicted period.
The value is rounded according to the value type of the data element: If the value type is an integer type, the predicted value is rounded to the nearest integer. For all other value types, the number is rounded to four significant digits. (However if there are more than four digits to the left of the decimal place, they are not replaced with zeros.)
(Optional) Select an Output category option combo. This dropdown will only show if the selected data element has a category combination other than "None". If so, you can select which disaggregation category option combo you would like to output to, or you can select "Predict according to input category option combo" (see the discussion above).
Select a Period type.
Assign one or more organisation unit levels. The output value will be assigned to an organisation unit at this level (or these levels). For aggregate data, the input values depends on the selection below; organisation units providing data. For tracker based data, the input values will come from the organisation unit to which the output is assigned, or from any level lower under the output organisation unit.
Organisation units providing data controls where the input values comes from for aggregate data. If "at selected levels only", only organisation units at the selected levels are included. If "At selected levels and all levels below" is selected, organisation units at the selected level(s) and all organisation units below are also included.
Create a Generator. The generator is the expression that is used to calculate the predicted value.
Type a Description of the generator expression.
Select a Missing value strategy. This selection sets how the system evaluates a validation rule if data is missing.
| Option | Description |
|---|---|
| Skip if any value is missing | The validation rule will be skipped if any of the values which compose the expression are missing. This is the default option. Always select this option you use the Exclusive pair or Compulsory pair operator. |
| Skip if all values are missing | The validation rule will be skipped only if all of the values which compose it are missing. |
| Never skip | The validation rule will never be skipped in case of missing data, and all missing values will be treated effectively as a zero. |
Enter the generator expression. You can build the expression by selecting data elements for aggregate data, or program data elements, attributes or indicators. Organisation unit counts are not yet supported.
To use sampled, past period data, you should enclose any items you select in one of the following aggregate functions (note that these function names are case-sensitive):
| Aggregate function | Means |
|---|---|
| avg(x) | Average (mean) value of x |
| count(x) | Count of the values of x |
| max(x) | Maximum value of x |
| median(x) | Median value of x |
| min(x) | Minimum value of x |
| percentileCont(p, x) | Continuous percentile of x, where p is the percentile as a floating point number between 0 and 1. For example, p = 0 will return the lowest value, p = 0.5 will return the median, p = 0.75 will return the 75th percentile, p = 1 will return the highest value, etc. Continuous means that the value will be interpolated if necessary. For example, percentileCont( 0.5, #{FTRrcoaog83} ) will return 2.5 if the sampled values of data element FTRrcoaog83 are 1, 2, 3, and 4. |
| stddev(x) | Standard deviation of x. This function is eqivalent to stddevSamp. It's suggested that you use the function stddevSamp instead for greater clarity. |
| stddevPop(x) | Population standard deviation of x: sqrt( sum( (x - avg(x))^2 ) / n ) |
| stddevSamp(x) | Sample standard deviation of x: sqrt( sum( (x - avg(x))^2 ) / ( n - 1 ) ). Note that this value is not computed when there is only one sample. |
| sum(x) | Sum of the values of x |
Note
Any items inside an aggregate function will be evaluated for all sampled past periods, and then combined according to the formula inside the aggregate function. Any items outside an aggregate function will be evaluated for the period in which the prediction is being made.
You can build more complex expressions by clicking on (or typing) any of the elements below the expression field: ( ) * / + - Days. Constant numbers may be added by typing them. The Days option inserts [days] into the expression which resolves to the number of days in the period from which the data came.
You can also use the following non-aggregating functions in your expression, either inside aggregate functions, or containing aggregate functions, or independent of aggregate functions:
| Function | Means |
|---|---|
| contains(expr, sub1, ...) | Searches an expression for one or more substrings. Returns true if the expression contains all the substrings. For example, the following are all true: contains("abcd", "abcd"); contains("abcd", "b"); and contains("abcd", "ab", "bc"). Comparisons are case-sensitive. |
| containsItems(expr, item1, ...) | Searches an expression for one or more items. The expression is made up of comma-separated elements. containsItems returns true if every item exactly matches an element in the expression. For example, containsItems("abcd", "abcd") and containsItems("ab,cd", "ab", "cd") are true, but containsItems("abcd", "b") and containsItems("abcd", "ab", "bc") are false. Comparisons are case-sensitive. containsItems can be used for multi-valued data elements to see if an item is contained in the data element values. |
| if(test, valueIfTrue, valueIfFalse) | Evaluates test which is an expression that evaluates to a boolean value -- see Boolean expression notes below. If the test is true, returns the valueIfTrue expression. If it is false, returns the valueIfFalse expression. |
| is(expr1 in expression [, expression ...]) | Returns true if expr1 is equal to any of the following expressions, otherwise false. |
| isNull(item) | Returns the boolean value true if the item is null (missing), otherwise returns false. The item can be any selected item from the right (data element, program data element, etc.). |
| isNotNull(item) | Returns true if the item value is not missing (not null), otherwise false. |
| firstNonNull(item [, item ...]) | Returns the value of the first item that is not missing (not null). Can be provided any number of arguments. Any argument may also be a numeric or string literal, which will be returned if all the previous items have missing values. |
| greatest(expression [, expression ...]) | Returns the greatest (highest) value of the expressions given. Can be provided any number of arguments. |
| least(expression [, expression ...]) | Returns the least (lowest) value of the expressions given. Can be provided any number of arguments. |
| log(expression [, base ]) | Returns the natural logarithm (base e) of the numeric expression. If an integer is given as a second argument, returns the logarithm using that base. |
| log10(expression) | Returns the common logarithm (base 10) of the numeric expression. |
| normDistCum(x [,mean [,stddev]]) | Returns the cumulative distribution function (CDF) value for x given the normalized distribution described by the mean and stddev. Equivalent to Excel NORM.DIST(x,mean,stddev,TRUE) or LibreOffice NORMDIST(x,mean,stddev,1). If stddev is not given, it is computed from past sampled values of x. If neither mean nor stddev are given, they are computed from past sampled valeus of x. See examples. |
| normDistDen(x [,mean [,stddev]]) | Returns the probability density function (PDF) value for x given the normalized distribution described by the mean and stddev. Equivalent to Excel NORM.DIST(x,mean,stddev,FALSE) or LibreOffice NORMDIST(x,mean,stddev,0). If stddev is not given, it is computed from past sampled values of x. If neither mean nor stddev are given, they are computed from past sampled valeus of x. See examples. |
| null | Returns no result. For example, if( #{FH8ab5Rog83}<0, null, 1 ) returns nothing if the data element value is less than 0, otherwise 1. |
| orgUnit.ancestor(orgUnitUid [, orgUnitUid ...]) | Returns true if the organisation unit is a descendant of any of the (1 or more) organisation units, otherwise false. |
| orgUnit.dataSet(dataSetUid [, dataSetUid ...]) | Returns true if the organisation unit is assigned to any of the (1 or more) data sets, otherwise false. |
| orgUnit.group(ouGroupUid [, ouGroupUid ...]) | Returns true if the organisation unit is a member of any of the (1 or more) organisation unit groups, otherwise false. |
| orgUnit.program(programUid [, programUid ...]) | Returns true if the organisation unit is assigned to any of the (1 or more) programs, otherwise false. |
| removeZeros(expression) | Returns nothing if the expression value is 0, otherwise returns the expression value. |
| .maxDate(yyyy-mm-dd) | For a data element (not program data), value from periods ending on or before a maximum date. |
| .minDate(yyyy-mm-dd) | For a data element (not program data), value from periods starting on or after a minimum date. |
Boolean expression notes: A boolean expression must evaluate to true or false. The following operators may be used to compare two values resulting in a boolean expression: \<, >, !=, ==, >=, and \<=. The following operators may be used to combine two boolean expressions: && or the keyword and (logical and), and || or the keyword or (logical or). The unary operator ! or the keyword not may be used to negate a boolean expression.
Generator expression examples:
| Generator expression | Means |
|---|---|
| sum(#{FTRrcoaog83.tMwM3ZBd7BN}) | Sum of the sampled values of data element FTRrcoaog83 and category option combination (disaggregation) tMwM3ZBd7BN |
| avg(I{GSae40Fyppf}) + 2 * stddevSamp(I{GSae40Fyppf}) | Average of the sampled values of of program indicator GSae40Fyppf plus twice its sample standard deviation |
| sum(D{IpHINAT79UW.eMyVanycQSC}) / sum([days]) | Sum of all sampled values of data element eMyVanycQSC from porgram IpHINAT79UW divided by the number of days in all sample periods (resulting in the overall average daily value) |
| sum(#{FTRrcoaog83}) + #{T7OyqQpUpNd} | Sum of all sampled values of data element FTRrcoaog83 plus the value of data element T7OyqQpUpNd in the period being predicted for (includes all disaggregations) |
| 1.2 * A{IpHINAT79UW.RKLKz1H20EE} | 1.2 times the value of attribute RKLKz1H20EE of program IpHINAT79UW, in the period being predicted for |
| if(isNull(#{T7OyqQpUpNd}), 0, 1) | If the data element T7OyqQpUpNd is null in the period being predicted, then 0, otherwise 1 |
| if(is(#{jeiTh8ahyae} in 'NEGATIVE','UNKNOWN'), 0, 1) | If the data element jeiTh8ahyae has value 'NEGATIVE' or 'UNKNOWN' then 0, otherwise 1 |
| percentileCont(0.5, #{T7OyqQpUpNd}) | Continuous 50th percentile of the sampled values for data element T7OyqQpUpNd. Note that this is the same as median(#{T7OyqQpUpNd}) |
| if(count(#{T7OyqQpUpNd}) == 1, 0, stddevSamp(#{T7OyqQpUpNd})) | If there is one sample value present for data element T7OyqQpUpNd, then 0, otherwise the sample standard deviation of these sample values. (Note that if no samples are present then the stddevSamp returns no value, so no value is predicted.) |
| normDistCum(#{T7OyqQpUpNd}) | The cumulative distribution function for the current period value of data element T7OyqQpUpNd based on the normalized distribution defined by the mean and standard deviation of past sampled periods of data element T7OyqQpUpNd |
| normDistCum( #{T7OyqQpUpNd}, median(#{T7OyqQpUpNd}) ) | The cumulative distribution function for the current period value of data element T7OyqQpUpNd based on the distribution defined by the median (instead of the mean) and standard deviation of past sampled periods of data element T7OyqQpUpNd |
| normDistCum( #{T7OyqQpUpNd}, median(#{T7OyqQpUpNd}) ) | The cumulative distribution function for the current period value of data element T7OyqQpUpNd based on the distribution defined by the median (instead of the mean) and standard deviation of past sampled periods of data element T7OyqQpUpNd |
| normDistCum( #{T7OyqQpUpNd}, avg(#{T7OyqQpUpNd}), stddev(#{T7OyqQpUpNd}) ) | Same as normDistCum( #{T7OyqQpUpNd} ) |
| normDistDen( #{T7OyqQpUpNd}, avg(#{IKahz1Quie3}), stddev(#{IKahz1Quie3}) ) | The probability density function for the current period value of data element T7OyqQpUpNd based on the distribution defined by the mean and standard deviation of past sampled periods of the different data element IKahz1Quie3 |
| normDistDen( median(#{T7OyqQpUpNd}), avg(#{IKahz1Quie3}), stddev(#{IKahz1Quie3}) ) | The probability density function for the median of past sampled values of data element T7OyqQpUpNd based on the distribution defined by the mean and standard deviation of past sampled periods of the different data element IKahz1Quie3 |
| #{T7OyqQpUpNd}.minDate(2022-10-1) | Value on or after 1-Oct-2022 |
| #{T7OyqQpUpNd}.maxDate(2022-12-31) | Value on or before 31-Dec-2022 |
| #{T7OyqQpUpNd}.minDate(2022-10-1).maxDate(2022-12-31) | Value bewteen 1-Oct-2022 and 31-Dec-2022 |
(Optional) Create a Sample skip test. The sample skip test tells which previous periods if any to exclude from the sample.
Type a Description of the skip test.
Enter the sample skip test expression. You can build the expression by selecting data elements for aggregate data, or program data elements, attributes or indicators. Organisation unit counts are not yet supported. As with the generator function, you may click on (or type) any of the elements below the expression field: ( ) * / + - Days.
The non-aggregating functions described above for generator expressions may also be used in skip tests.
The expression must evaluate to a boolean value of true or false. See Boolean expression notes above.
Skip test expression examples:
| Skip test expression | Means |
|---|---|
| #{FTRrcoaog83} > #{M62VHgYT2n0} | The value of data element FTRrcoaog83 (sum of all disaggregations) is greater than the value of data element M62VHgYT2n0 (sum of all disaggregations) |
| #{uF1DLnZNlWe} > 0 | The value of data element uF1DLnZNlWe (sum of all disaggregations) is greater than the zero |
| #{FTRrcoaog83} > #{M62VHgYT2n0} || #{uF1DLnZNlWe} > 0 | The value of data element FTRrcoaog83 (sum of all disaggregations) is greater than the value of data element M62VHgYT2n0 (sum of all disaggregations) or the value of data element uF1DLnZNlWe (sum of all disaggregations) is greater than the zero |
Enter a Sequential sample count value.
This is for how many sequential periods the calculation should go back in time to sample data for the calculations.
Enter an Annual sample count value.
This is for how many years the calculation should go back in time to sample data for the calculations.
(Optional) Enter a Sequential skip count value.
This is how many sequential periods, immediately preceding the predicted value period, should be skipped before sampling the data.
Click Save.
You can use a single predictor to operate on all the data elements in a group instead of a different predictor for each data element. This can be used, for example, in logistics management when a data element is used for each commodity and a category option combination is used for each count related to that commodity.
The syntax is:
forEach ?de in :DEG:degUid --> main expression
where:
| part | means |
|---|---|
| forEach | required keyword at the start of the expression |
| ?de | any variable name starting with '?', then one letter, then optionally any number of additional letters or digits (case sensitive). Examples: ?de, ?X, ?dataElement, etc. |
| in | required keyword |
| :DEG:degUid | the notation :DEG: followed by the UID of the data element group containing the data elements to be processed |
| → | required before the main expression |
| main expression | the expression to operate on each data element in the group. Within this expression use the variable name (such as ?de) as a placeholder for each data element |
The predictor will execute once for each data element in the data element group. For each data element, instances of the variable in the main expression are replaced by that data element. The same data element is also used as the predictor output data element. The predicted value will be written to that data element using the configured output category option combination.
The predictor must be configured with an output data element, but it is effectively ignored when the predictor is run. It is suggested that you configure the predictor with one of the data elements in the data element group that the predictor will use. That way you can select a valid output category option combination for that data element.
At the time the predictor is created, the data element group must contain at least one data element of the type that you will use. (The data type of the data element is used during syntax checking of the predictor.)
You have data elements that represent various commodities, all belonging to a data element group with UID aIMu0nieph7.
You have category option combinations with the following UIDs:
| category option combo | means |
|---|---|
Gvoecom5muL | Stock balance at start of period |
CWa6eew5uco | Restock during period |
nthohhie8Ba | Used during period |
Faey8Iphooy | Lost, damaged, expired, or stolen during period |
The following predictor generator expression will compute the stock balance at the beginning of the next period as ( starting balance + restock - used - lost ):
forEach ?de in :DEG:aIMu0nieph7 -->
sum( #{?de.Gvoecom5muL} + #{?de.CWa6eew5uco} - #{?de.nthohhie8Ba} - #{?de.Faey8Iphooy} )
The predictor configuration includes:
| property | value |
|---|---|
| Output data element | one of the data elements in the group |
| Output category option combo | Stock balance at start of period (Gvoecom5muL) |
| Organisation units providing data | At selected level(s) only |
| Sequential sample count | 1 |
| Annual sample count | 0 |
The predictor will execute once for each data element in the data element group. Because the aggregation function sum() is used in the predictor generator expression, all the values in the expression will be fetched from the previous period (since the sequential sample count is 1). The predictor will write out the starting balance for each data element for the periods within the predictor run start and end date, for organisation units at the selected level(s).
Predictions are always made forward through time. The starting balance predicted for one period can be used as an input to compute the starting balance of the following period.
If you want to make predictions for the same period as the input data, just omit the aggregation function such as sum(). Adding to the previous example, say you have another category option combination that computes the net inventory change during the period:
| category option combo | means |
|---|---|
Hpiek8IefoS | Stock change during the period |
You can use the following expression to compute the inventory change as ( restock - used - lost ):
forEach ?de in :DEG:aIMu0nieph7 -->
#{?de.CWa6eew5uco} - #{?de.nthohhie8Ba} - #{?de.Faey8Iphooy}
The output category option combo is:
| property | value |
|---|---|
| Output category option combo | Stock change during the period (Hpiek8IefoS) |
Since there is no aggregation function such as sum() around the expression elements, the input data is taken from the same period as the predictor output.
Open the Maintenance app and click Other > Predictor group.
Click the add button.
Type a Name. This field needs to be unique.
(Optional) In the Code field, assign a code. This field needs to be unique.
(Optional) Type a Description.
Double-click the Predictors you want to assign to the group.
Click Save.
Cloning a data element or other objects can save time when you create many similar objects.
Open the Maintenance app and find the type of metadata object you want to clone.
In the object list, click the options menu and select Clone.
Modify the options you want.
Click Save.
Note
You can only delete a data element and other data element objects if no data is associated to the data element itself.
Warning
Any data set that you delete from the system is irrevocably lost. All data entry forms, and section forms which may have been developed will also be removed. Make sure that you have made a backup of your database before deleting any data set in case you need to restore it at some point in time.
Open the Maintenance app and find the type of metadata object you want to delete.
In the object list, click the options menu and select Delete.
Click Confirm.
Open the Maintenance app and find the type of metadata object you want to view.
In the object list, click the options menu and select Show details.
DHIS2 provides functionality for translations of database content, for example data elements, data element groups, indicators, indicator groups or organisation units. You can translate these elements to any number of locales. A locale represents a specific geographical, political, or cultural region.
Tip
To activate a translation, open the System Settings app, click > Appearance and select a language.
Open the Maintenance app and find the type of metadata object you want to translate.
In the object list, click the options menu and select Translate.
Tip
If you want to translate an organisation unit level, click directly on the Translate icon next to each list item.
Select a locale.
Type a Name, Short name and Description.
Click Save.
Push reports allows you to increase awareness and usage of data analysis by sending reports with charts, tables and maps directly to users e-mail addresses.
A push report gets its content from existing dashboards.
A push report lists the dashboard items in the same order as on the dashboard.
A push report can only contain dashboard items with charts, maps or tables.
You create the push report and its schedule in the Maintenance app.
The Title and Message parameters you set up in the Maintenance app, are included in each report. The Name you give the report is not included in the report. Instead, the name is used to identify the push analysis object in the system. This way a report can be named one thing, and the title of the report can be another.
When you run a push report job, the system compiles a list of recipients from the user groups you've selected. The system then generates a report for each member of the selected user groups. Each of the dashboard items are generated specifically for each user. This means that the data included in the report reflects the data the user has access to. All users could therefore get the same report (if all the data is "static") or custom reports (if all the data is "dynamic"), or a combination of the two.
Push reports are sent by e-mail to the recipients, not through the internal DHIS2 messaging system. If a user doesn't have a valid e-mail, or if the job fails, no e-mails are sent. In this case, the problem is logged on the server.
Note
The data generated in the push reports is public so verify that you don't include any sensitive data.

In the Maintenance app, you manage the following push reports objects:
| Object type | Available functions |
|---|---|
| Push analysis | Create, edit, clone, delete, show details, translate, preview and run |
Open the Maintenance app and click Other > Push analysis.
Click the add button.
In the Name field, type the name of the scheduled report.
This name is not included in the report e-mail. Instead, the name is used to identify the push analysis object in the system.
(Optional) In the Code field, assign a code.
Add a report Title.
This title is included in the report e-mail.
(Optional) Add a Message.
This message is included in the report e-mail.
Select a Dashboard to base the report on.
Select and assign the user groups you want to send the report to.
Select a Scheduling frequency: Daily, Weekly or Monthly.
Note
If you schedule a push report to "Monthly" and "31", the scheduled report job will not run if the month has less than 31 days.
(Optional) Select Enable to activate the push report job.
The job won't run until you activate it.
Click Save.
Open the Maintenance app and click Other > Push analysis.
In the push report list, locate the push report you want to preview.
Click the options menu and select Preview.
A preview of the push report opens in a new window.
Open the Maintenance app and click Other > Push analysis.
In the push report list, locate the push report you want to run.
Click the options menu and select Run now.
The push report job runs immediately.
Cloning a data element or other objects can save time when you create many similar objects.
Open the Maintenance app and find the type of metadata object you want to clone.
In the object list, click the options menu and select Clone.
Modify the options you want.
Click Save.
Note
You can only delete a data element and other data element objects if no data is associated to the data element itself.
Warning
Any data set that you delete from the system is irrevocably lost. All data entry forms, and section forms which may have been developed will also be removed. Make sure that you have made a backup of your database before deleting any data set in case you need to restore it at some point in time.
Open the Maintenance app and find the type of metadata object you want to delete.
In the object list, click the options menu and select Delete.
Click Confirm.
Open the Maintenance app and find the type of metadata object you want to view.
In the object list, click the options menu and select Show details.
DHIS2 provides functionality for translations of database content, for example data elements, data element groups, indicators, indicator groups or organisation units. You can translate these elements to any number of locales. A locale represents a specific geographical, political, or cultural region.
Tip
To activate a translation, open the System Settings app, click > Appearance and select a language.
Open the Maintenance app and find the type of metadata object you want to translate.
In the object list, click the options menu and select Translate.
Tip
If you want to translate an organisation unit level, click directly on the Translate icon next to each list item.
Select a locale.
Type a Name, Short name and Description.
Click Save.
You can customize GIS by including map layers from various sources and combine them with your own data in DHIS2. DHIS2 supports these common map service formats: Web Map Service (WMS), Tile Map Service (TMS), XYZ tiles and Vector tiles (Vector Style).
Note
DHIS2 only supports the Web Mercator projection (EPSG:3857) so make sure that the external service supports this projection.
| Object type | Available functions |
|---|---|
| External map layer | Create, edit, clone, delete, show details and translate |
Open the Maintenance app and click Other > External map layer.
Click the add button.
In the Name field, type a name that describes the content of the external map layer.
This is the name you'll see in the Maps app.
(Optional) In the Code field, assign a code.
Select a Map service format.
DHIS2 supports four common map service formats:
Web Map Service (WMS)
Image format: PNG format allows layers to be transparent, JPG format offers better compression and is often faster to load.
Layers: A WMS can contain several individual layers, and you can specify which you want to include (comma separated). Refer to the WMS GetCapabilities document to see the available layers.
Tile Map Service (TMS)
XYZ tiles (can also be used for WMTS)
Vector tiles (Vector Style)
When Vector Style is chosen, you can then add a value for "Before layer id". It indicates the layer id in the Vector tile (layer) stack at which the user's layers (such as Thematic, Events) will be inserted. If this value isn't set, then the user's layers will be placed on top of the layers in the Vector Style. The map service URL should be to a JSON document that follows the Mapbox GL Style Spec.
Enter the URL to the map service.
Note
XYZ and TMS URLs must contain placeholders {}, for example: http://{s}.tile.osm.org/{z}/{x}/{y}.png.
(Optional) Enter Source of the map layers. The field can contain HTML tags if you want to link to the source.
When you use an external map service it is important to highlight where the data comes from.
Select a Placement:
Bottom - basemap: For the Maps app, this makes the external map layer selectable as the basemap (i.e. as an alternative to the DHIS2 basemaps).
Top - overlay: For the Maps app, this allows the external map to be added from the Add Layer selection and placed anywhere above the basemap.
Note that Vector Style layers can only be added as a basemap.
(Optional) Add a legend.
You can add a legend in two ways:
Select a predefined Legend to describe the colors of the map layer.
Tip
Click Add new to create legends that you're missing. In the form that opens, create the legends you need. When you're done, click Refresh values.
Enter a link to an external image legend in Legend image URL.
These are often provided for WMS. See under LegendURL in the WMS GetCapabilites document.
Click Save.
Cloning a data element or other objects can save time when you create many similar objects.
Open the Maintenance app and find the type of metadata object you want to clone.
In the object list, click the options menu and select Clone.
Modify the options you want.
Click Save.
Note
You can only delete a data element and other data element objects if no data is associated to the data element itself.
Warning
Any data set that you delete from the system is irrevocably lost. All data entry forms, and section forms which may have been developed will also be removed. Make sure that you have made a backup of your database before deleting any data set in case you need to restore it at some point in time.
Open the Maintenance app and find the type of metadata object you want to delete.
In the object list, click the options menu and select Delete.
Click Confirm.
Open the Maintenance app and find the type of metadata object you want to view.
In the object list, click the options menu and select Show details.
DHIS2 provides functionality for translations of database content, for example data elements, data element groups, indicators, indicator groups or organisation units. You can translate these elements to any number of locales. A locale represents a specific geographical, political, or cultural region.
Tip
To activate a translation, open the System Settings app, click > Appearance and select a language.
Open the Maintenance app and find the type of metadata object you want to translate.
In the object list, click the options menu and select Translate.
Tip
If you want to translate an organisation unit level, click directly on the Translate icon next to each list item.
Select a locale.
Type a Name, Short name and Description.
Click Save.
The SQL View functionality of DHIS2 will store the SQL view definition internally, and then materialize the view when requested.
Database administrators must be careful about creating database views directly in the DHIS2 database. For instance, when the resource tables are generated, all of them will first be dropped and then re-created. If any SQL views depend on these tables, an integrity violation exception will be thrown and the process will be aborted.
The SQL views are dropped in reverse alphabetical order based on their names in DHIS2, and created in regular alphabetical order. This allows you to have dependencies between SQL views, given that views only depend on other views which come earlier in the alphabetical order. For instance, "ViewB" can safely depend on "ViewA". Otherwise, having views depending on other view result in an integrity violation error.
To create a new SQL view, click Apps > Maintenance > Other > SQL View and click the Add + button.
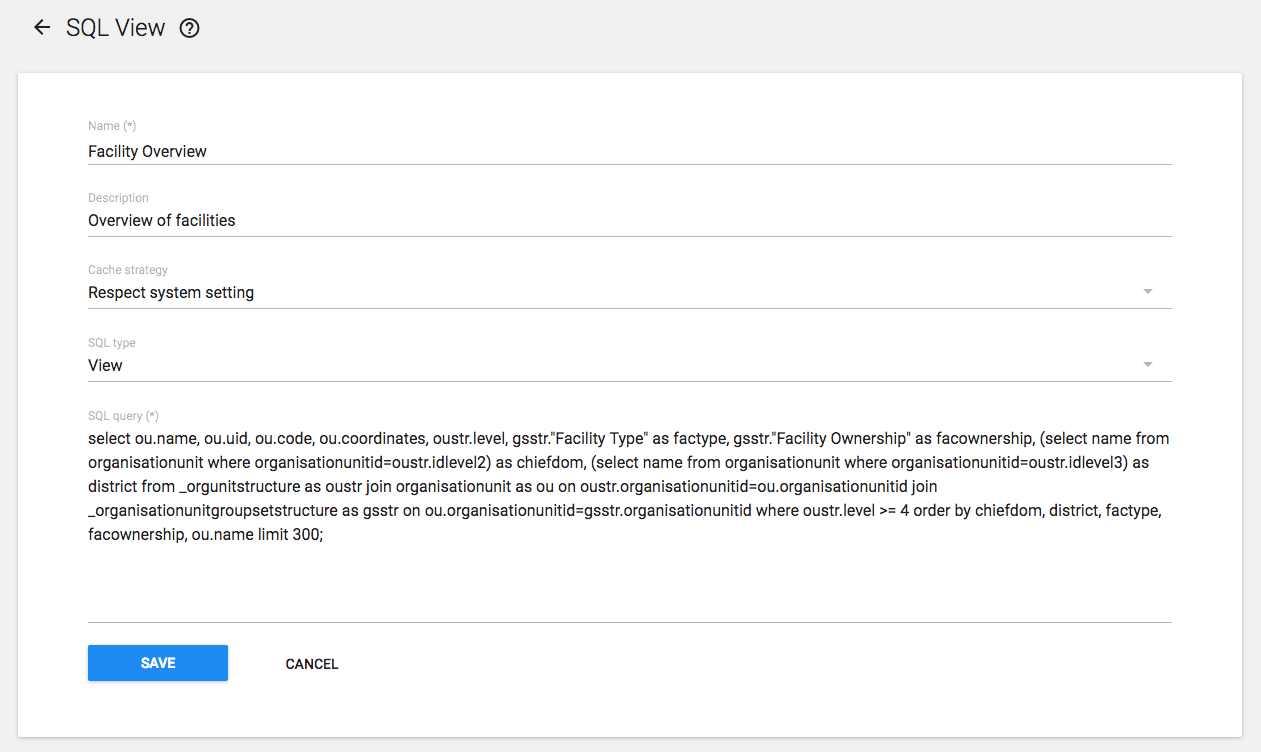
The "Name" attribute of the SQL view will be used to determine the name of the table that DHIS2 will create when the view is materialized by the user. The "Description" attribute allows one to provide some descriptive text about what the SQL view actually does.
The "SQL type" attribute allows the creation of three kinds of views: - A "View" is stored in the database and regenerated when queried - A "Materialized View" is stored in the database and its results are cached in the database - A "Query" is not stored in the database
Finally, the "SQL query" should contain the SQL view definition.
Only SQL "SELECT" statements are allowed and certain sensitive tables (i.e., user information) are not accessible.
Press "Save" to store the SQL view definition. If you created a "View" or a "Materialized View", you must also "Execute query" to finish the creation of the SQL view.
Keep in mind that the the columns returned by the used SELECT statement become table columns, that means they must be of a valid table column type. When functions are used it might be necessary to explicitly cast the result to a type by adding ::{TYPE} after the function.
For example, instead of jsonb_each (which would return a record type that cannot be a column type) use jsonb_each_text and cast the result to text, like in the below sample:
select jsonb_each_text(eventdatavalues)::text from ...
If you wish to make a SQL view that can be called be other SQL views, then its SQL type must be either "View" or a "Materialized View" (not "Query"). It also must have Execute query run on it before being called.
For instance, if you created a view named Data element count with SQL type "View" and this SQL:
select count(*) as count from dataelement;
...then you could run Execute query from the context menu and create a second SQL view named More than 100 data elements with this SQL:
select case when count > 100 then 1 else 0 end as result from _view_data_element_count;
In order to utilize the SQL views, simply click the view and from the context menu, choose "Execute query". Once the process is completed, you will be informed that a table has been created. The name of the table will be provided, and is composed from the "Description" attribute provided in the SQL view definition. Once the view has been generated, you can view it by clicking the view again, and selecting "Show SQL View".
Tip
If you have a view which depends on another view, you should be careful about how the views are named. When analytics is run on the DHIS2 server, all views must be dropped, and are recreated. When analytics starts, the views are dropped in alphabetical order, and then recreated in reverse alphabetical order. Thus, if view A depends on view B, it must appear before view B in alphabetical order. If it appears after view B in alphabetical order, analytics may fail, as the view with dependencies will not be dropped in the correct order.
The Analytics Table Hooks functionality of DHIS2 stores SQL code that is run during different phases of the analytics table generation process.
See also /api/analyticsTableHooks in the Developer documentation.
To create a new analytics table hook, click Apps > Maintenance > Other > Analytics table hooks and click the Add + button.
Press "Save" to store the analytics table hook.
It is possible to create custom locales in DHIS2. In addition to the locales available through the system, you might want to add a custom locale such as "English" and "Zambia" to the system. This would allow you to translate metadata objects to local languages, or to account for slight variants between countries which use a common metadata definition.
The locale is composed of a language along with a country. Select the desired values and press "Add". This custom locale will now be available as one of the translation locales in the system.
The Metadata group editor in the Maintenance app allows you to edit multiple object groups at the same time. You can edit the following objects types:
| Object type | Available functions |
|---|---|
| Category option | |
| Category option group | |
| Data element | Add one data element to multiple data element groups Remove one data element from multiple data element groups |
| Data element group | Add multiple data elements to one data element group Remove multiple data elements from one data element group |
| Indicator | Add one indicator to multiple indicator groups Remove one indicator from multiple indicator groups |
| Indicator group | Add multiple indicators to one indicator group Remove multiple indicators from one indicator group |
Open the Maintenance app and click Metadata group editor.
Click Manage items in group.
Select an object group type, for example Indicator groups.
Select an object group, for example HIV.
In the left-hand list, select the object(s) you want to add to the object group and click the right arrow.
In the right-hand list, select the object(s) you want to remove from the object group and click the left arrow.
Open the Maintenance app and click Metadata group editor.
Click Manage groups for item.
Select an object type, for example Indicators.
Select an object, for example ANC LLITN coverage.
In the left-hand list, select the objects group(s) you want to add the object to and click the right arrow.
In the right-hand list, select the object group(s) you want to remove the object from and click the left arrow.
Traditionally, public health information systems have been reporting aggregated data of service provision across their health programs. This does not allow you to trace the people provided with these services. In DHIS2, you can define your own programs with stages. These programs are an essential part of the "tracker" functionality which lets you track individual records. You can also track other ‘entities’ such as wells or insurances. You can create two types of programs:
| Program type | Description | Examples of use |
|---|---|---|
| Event program | Single event without registration program (anonymous program or SEWoR) Anonymous, individual events are tracked through the health system. No person or entity is attached to these individual transactions. Has only one program stage. | To record health cases without registering any information into the system. To record survey data or surveillance line-listing. |
| Single stage Tracker program | Single event with registration program (SEWR) An entity (person, commodity, etc.) is tracked through each individual transaction with the health system Has only one program stage. A tracked entity instance (TEI) can only enroll in the program once. | To record birth certificate and death certificate. |
| Multi-stage Tracker program | Multi events with registration program (MEWR) An entity (person, commodity, etc.) is tracked through each individual transaction with the health system Has multiple program stages. | Mother Health Program with stages as ANC Visit (2-4+), Delivery, PNC Visit. |
To create a program, you must first configure several types of metadata objects. You create these metadata objects in the Maintenance app.
| Object type | Description | Available functions |
|---|---|---|
| Event program | A program to record single event without registration | Create, edit, share, delete, show details and translate |
| Tracker program | A program to record single or multiple events with registration | Create, edit, share, delete, show details and translate |
| Program indicator | An expression based on data elements and attributes of tracked entities which you use to calculate values based on a formula. | Create, edit, clone, share, delete, show details and translate |
| Program rule | Allows you to create and control dynamic behaviour of the user interface in the Tracker Capture and Event Capture apps. | Create, edit, clone, delete, show details and translate |
| Program rule variable | Variables you use to create program rule expressions. | Create, edit, clone, delete, show details and translate |
| Relationship type | Defines the relationship between tracked entity A and tracked entity B, for example mother and child. | Create, edit, clone, share, delete, show details and translate |
| Tracked entity type | Types of entities which can be tracked through the system. Can be anything from persons to commodities, for example a medicine or a person. A program must have one tracked entity. To enrol a tracked entity instance into a program, the tracked entity of an entity and tracked entity of a program must be the same. Note A program must be specified with only one tracked entity. Only tracked entity as same as the tracked entity of program can enroll into that program. | Create, edit, clone, share, delete, show details and translate |
| Tracked entity attribute | Used to register extra information for a tracked entity. Can be shared between programs. | Create, edit, clone, share, delete, show details and translate |
| Program | A program consist of program stages. | Create, edit, share, delete, assign to organisation units, show details and translate |
| Program stage | A program stage defines which actions should be taken at each stage. | Create, edit, share, change sort order, delete, show details and translate |
| Program indicator group | A group of program indicators | Create, edit, clone, share, delete, show details and translate |
| Validation rule | A validation rule is based on an expression which defines a relationship between data element values. | Create, edit, clone, share, delete, show details and translate |
| Program notification | Automated message reminder Set reminders to be automatically sent to enrolled tracked entity instances before scheduled appointments and after missed visits. | Create, edit and delete |
| Program stage notification | Automated message reminder Set reminders to be automatically sent whenever a program stage is completed, or before or after the due date. | Create, edit and delete |
Single event without registration programs are called event programs. You configure them in the Maintenance app. Event programs can have three types of data entry forms:
| Form type | Description |
|---|---|
| Basic | Lists all data elements which belong to the program. You can change the order of the data elements. |
| Section | A section groups data elements. You can then arrange the order of the sections to create the desired layout of the data entry form. |
| Custom | Defines the data entry form as HTML page. |
Note
Custom forms take precedence over section forms if both are present.
If no custom or section form is defined, the basic form will be used.
The Android apps only support section forms.
You can create program notifications for event programs. The notifications are sent either via the internal DHIS2 messaging system, via e-mail or via text messages (SMS). You can use program notifications to, for example, send an automatic reminder to a tracked entity 10 days before a scheduled appointment. You use the program’s tracked entity attributes (for example first name) and program parameters (for example enrollment date) to create a notification template. In the Parameters field, you'll find a list of available tracked entity attributes and program parameters.
Enter the event program details.
Assign data elements.
Create data entry form(s): Basic, Section or Custom.
Assign the program to organisation unit(s).
Create program notification(s).
Open the Maintenance app and click Program > Program.
Click the add button and select Event Program in the popup menu.
Enter program details, then click next.
| Field | Description |
|---|---|
| Name | The name of the program. |
| Color | Color used for this program in the data capture apps. |
| Icon | Icon used for this program in the data capture apps. |
| Short name | A short name of the program. The short name is used as the default chart or table title in the analytics apps. |
| Description | A detailed description of the program. |
| Version | The version of the program. This is used for example when people collect data offline in an Android implementation. When they go online and synchronize their metadata, they should get the latest version of the program. |
| Category combination | The category combination you want to use. The default setting is None. |
| Open days after category option end date | If you selected a category combination other than None, you may enter zero or a positive number. This lets you enter data for this program for a category option up to the specified number of days after that category option's end date. |
| Completed events expiry date | Defines the number of days for which you can edit a completed event. This means that when an event is completed and the specified number of expiry days has passed, the event is locked. If you set "Completed events expiry days" to 10", an event is locked ten days after the completion date. After this date you can no longer edit the event. |
| Expiry period type Expiry days | The expiry days defines for how many days after the end of the previous period, an event can be edited. The period type is defined by the expiry period type. This means that when the specified number of expiry days has passed since the end date of the previous period, the events from that period are locked. If you set the expiry type to "Monthly" and the expiry days to "10" and the month is October, then you can't add or edit an event to October after the 10th of November. |
| User assignment of events | Select check box to enable user assignment of the event This means that in the form there will be a list of users to which the event can be assigned. |
| Block entry form after completed | Select checkbox to block the entry form after completion of the event of this program. This means that the data in the entry form can't be changed until you reset the status to incomplete. |
| Feature type | Sets whether the program is going to capture a geographical feature type or not. - None Nothing is captured. - Polygon An area is captured. For single event programs the area will be the area representing the event being captured. For tracker programs, the area will represent the area of the enrollment. - Point A point/coordinate is captured. For single event programs the point will be representing the event being captured. For tracker programs, the point will represent the enrollment. |
| Validation strategy | Sets the server and client side validation requirement. Data type validation is always performed regardless of the validation strategy. An integer field is never stored containing text, for example. - On complete This option will enforce required field and error messages to be fixed when completing the event, but the event can be saved to the server without passing these validation requirements. For legacy reasons, this is always the validation strategy for tracker programs, where each data value in the event is stored to the server while entering data. - On update and insert This option will enforce required field validation when saving the event to the server regardless of the completion status. When using this option no events can be stored without passing validations. |
| Pre-generate event UID | Select checkbox to pre-generate unique event id numbers. |
| Custom label for report date | Type a description of the report date. This description is displayed in the case entry form. |
Click next.
Click Assign data elements.
In the list of available items, double-click the data elements you want to assign to the event program.
(Optional) For each data element, add additional settings:
| Setting | Description |
|---|---|
| Compulsory | The value of this data element must be filled into data entry form before you can complete the event. |
| Allow provided elsewhere | Specify if the value of this data element comes from other facility, not in the facility where this data is entered. |
| Display in reports | Displays the value of this data element into the single event without registration data entry function. |
| Date in future | Will allow user to select a date in future for date data elements. |
| Mobile render type | Can be used to select different render types for mobile devices. Available options vary depending on the data element's value type. For example, for a numerical value you may select "Default", "Value", "Slider", "Linear scale", and "Spinner". |
| Desktop render type | WARNING: NOT IMPLEMENTED YET. Can be used to select different render types for desktop (i.e. the web interface). Available options vary depending on the data element's value type. For example, for a numerical value you may select "Default", "Value", "Slider", "Linear scale", and "Spinner". |
Click next.
The data entry forms decide how the data elements will be displayed to the user in the Event Capture app.
Click Create data entry form.
Click Basic, Section or Custom.
To create a Basic data entry form: Drag and drop the data elements in the order you want.
To create a Section data entry form:
Click the add button and enter a section's name, description and render type for desktop and mobile.
Click the section so it's highlighted by a black line.
Add data elements by clicking the plus sign next to the data elements' names.
Repeat the above steps until you have all the sections you need.
Change the section order: click the options menu, then drag the section to the place you want.
To create a Custom data entry form: Use the WYSIWYG editor to create a completely customized form. If you select Source, you can paste HTML code directly in the editing area. You can also insert images for example flags or logos.
Click next.
Access options decide who can capture data for the program or view/edit the program's metadata. A program can be shared to organisation units, and in addition, the main program and any program stages' access options can be configured through the Sharing dialog. Access options are available in the Access tab.
Assign organization units:
In the organisation tree, double-click the organisation units you want to add to the program.
You can locate an organisation unit in the tree by expanding the branches (click on the arrow symbol), or by searching for it by name. The selected organisation units display in orange.
Change roles and access:
Scroll down to the Roles and access section.
The first row shows the main program's access options, and each subsequent row shows the options of one program stage. Program stages with a warning icon (exclamation mark) contain access options that deviate from the main program, meaning they are accessed by a different combination of users.
Click on either of the rows and the Sharing dialog will show.
Modify the access options accordingly. See documentation on the sharing dialog for details.
Click the Apply button.
Repeat the process for each program/program stage. You can also copy all access options from the main program to your child programs:
Select the program stages you want to have similar access options as the main program by toggling the checkboxes on the right hand side of the program stages. You can also choose to Select all program stages, Deselect all program stages or Select similar stages, in terms of access options, to that of the main program. Similar stages are toggled by default.
Click Apply to selected stages
Create the message you want to send:
Click What to send?.
Enter a Name.
Create the Subject template: Double-click the parameters in the Template variables field to add them to your subject.
Note
The subject is not included in text messages.
Create the Message template: Double-click the parameter names in the Template variables list to add them to your message.
Dear A{w75KJ2mc4zz}, You're now enrolled in V{program_name}.
Define when you want to send the message:
Click When to send it?.
Select a Notification trigger.
| Notification trigger | Description |
|---|---|
| Program stage completion | The program stage notification is sent when the program stage is completed |
| Days scheduled (due date) | The program stage notification is sent XX number of days before or after the due date You need to enter the number of days before or after the scheduled date that the notification will be sent. |
Define who you want to send the message to:
Click Who to send it to?.
Select a Notification recipient.
| Notification recipient | Description |
|---|---|
| Tracked entity instance | Receives program notifications via e-mail or text message. To receive a program notification, the recipient must have an e-mail address or a phone number attribute. |
| Organisation unit contact | Receives program notifications via e-mail or text message. To receive a program notification, the receiving organisation unit must have a registered contact person with e-mail address and phone number. |
| Users at organisation unit | All users registered to the selected organisation unit receive program notifications via the internal DHIS2 messaging system. |
| User group | All members of the selected user group receive the program notifications via the internal DHIS2 messaging system |
| Program attribute | Receives program notifications via e-mail or text message. To receive a program notification, the recipient must have an e-mail address or a phone number attribute. |
| Data element | Receives program notifications via e-mail or text message. To receive a program notification, the recipient must have an e-mail address or a phone number data element. |
| Web hook | TBA |
Click Save.
Repeat above steps to create all the program notifications you need.
Click Save.
Note
You configure when the program notifications are sent in the Data Administration app > Scheduling > Program notifications scheduler.
Click Run now to send the program notifications immediately.
Select a time and click Start to schedule the program notifications to be sent at a specific time.
| Notification type | Variable name | Variable code |
|---|---|---|
| Program | Current date | V{current_date} |
| Days since enrollment date | V{days_since_enrollment_date} | |
| Enrollment date | V{enrollment_date} | |
| Incident date | V{incident_date} | |
| Organisation unit name | V{org_unit_name} | |
| Program name | V{program_name} | |
| Program stage | Current date | V{current_date} |
| Days since due date | V{days_since_due_date} | |
| Days until due date | V{days_until_due_date} | |
| Due date | V{due_date} | |
| Organisation unit name | V{org_unit_name} | |
| Program name | V{program_name} | |
| Program stage name | V{program_stage_name} | |
| Event status | V{event_status} |
Single or multiple event programs with registration are called Tracker programs. A program must be specified with only one tracked entity. Only tracked entities that are the same as the tracked entity of program can enroll into that program. A program needs several types of metadata that you create in the Maintenance apps.
Enter the tracker program details.
Enter enrollment details.
Assign attributes and create section or custom registration form.
Create program stages.
Configure access, and assign to organisation units.
Create program and program stage notification(s).
Open the Maintenance app and click Program > Program.
Click the add button and select Tracker Program in the popup menu.
| Field | Description |
|---|---|
| Name | The name of the program. |
| Color | Color used for this program in Tracker capture. |
| Icon | Icon used for this program in Tracker capture |
| Short name | A short name of the program. The short name is used as the default chart or table title in the analytics apps. |
| Description | A detailed description of the program. |
| Version | The version of the program. This is used for example when people collect data offline in an Android implementation. When they go online and synchronize their metadata, they should get the latest version of the program. |
| Tracked Entity Type | The tracked entity type you want to use. A program can only have one type of tracked entity. |
| Category combination | The category combination you want to use. The default setting is None. |
| Open days after category option end date | If you selected a category combination other than None, you may enter zero or a positive number. This lets you enter data for this program for a category option up to the specified number of days after that category option's end date. |
| Display front page list | Select checkbox to display a list of Tracked Entity Instances in Tracker Capture. If not selected, the Search will be displayed. |
| First stage appears on registration page | Select checkbox to display the first program stage together with the registration (enrollment). |
| Access level | Choose the access level of the program. |
| Completed events expiry days | Defines the number of days for which you can edit a completed event. This means that when an event is completed and the specified number of expiry days has passed, the event is locked. If you set "Completed events expiry days" to 10", an event is locked ten days after the completion date. After this date you can no longer edit the event. |
| Expiry period type Expiry days | The expiry days defines for how many days after the end of the previous period, an event can be edited. The period type is defined by the expiry period type. This means that when the specified number of expiry days has passed since the end date of the previous period, the events from that period are locked. If you set the expiry type to "Monthly" and the expiry days to "10" and the month is October, then you can't add or edit an event to October after the 10th of November. |
| Minimum number of attributes required to search | Specify the number of tracked entity attributes that needs to be filled in to search for Tracked Entities in the Program. |
| Maximum number of tracked entities to return in search | Specify the maximum number of tracked entities that is allowed to match a search outside capture scope. This setting can be used to force the user to search in a more targeted manner and narrow down the search results, rather than allowing a user to search and see a large number of results outside their capture scope. Enter 0 for no limit. More info here. |
| Field | Description |
|---|---|
| Allow future enrollment dates | Select checkbox if you want to allow tracked entity instances to be enrolled in the program on a future date. |
| Allow future incident dates | Select checkbox if you want to allow the incident date in the program to be on a future date. |
| Only enroll once (per tracked entity instance lifetime) | Select checkbox if you want a tracked entity to be able to enroll only once in a program. This setting is useful for example in child vaccination or post-mortem examination programs where it wouldn’t make sense to enroll a tracked entity more than once. |
| Show incident date | This setting allows you to show or hide the incident date field when a tracked entity enroll in the program. |
| Custom label for incident date | Defines the meaning of the incident date in this program. For example: In an immunization program for child under 1 year old, the incident date is the child's birthday. In a maternal program, the incident date is the date of last menstrual period. |
| Custom label for enrollment date | Defines the meaning of the enrollment date in this program, typically representing the date when the tracked entity is enrolled into the program. |
| Custom label for: - enrollment(s) - event(s) - program stage(s) - follow-up - registering unit - relationship - note - tracked entity attribute | Renames standard DHIS2 terms for this program. These labels only affect how the terms are displayed in the user interface and do not change their meaning. Note: Only Enrollment, Event, and Program Stage support plural forms; all other labels do not. Currently, these custom labels are used only by the DHIS2 Android app. |
| Ignore overdue events | When a tracked entity enrolls into the program, the events corresponding to the program stages are created. If you select this checkbox, the system will not generate overdue events. |
| Feature type | Sets whether the program is going to capture a geographical feature type or not. * None: Nothing is captured. * Polygon: An area is captured. For single event programs the area will be the area representing the event being captured. For tracker programs, the area will represent the area of the enrollment. * Point: A point/coordinate is captured. For single event programs the point will be representing the event being captured. For tracker programs, the point will represent the enrollment. |
| Related program | Choose a Tracker program which is related to the program you are creating, for example an ANC and a Child program. |
In the list of Available program tracked entity attributes, double-click the attributes you want to assign to the program.
(Optional) For each assigned attribute, add additional settings:
| Setting | Description |
|---|---|
| Display in list | Displays the value of this attribute in the list of tracked entity instances in Tracker capture. |
| Mandatory | The value of this attribute must be filled into data entry form before you can complete the event. |
| Date in future | Will allow user to select a date in future for date attributes. |
| Mobile render type | Can be used to select different render types for mobile devices. Available options vary depending on the attribute's value type. For example, for a numerical value you may select "Default", "Value", "Slider", "Linear scale", and "Spinner". |
| Desktop render type | WARNING: NOT IMPLEMENTED YET. Can be used to select different render types for desktop (i.e. the web interface). Available options vary depending on the attribute's value type. For example, for a numerical value you may select "Default", "Value", "Slider", "Linear scale", and "Spinner". |
Create registration form
The registration form defines how the attributes will be displayed to the user in consuming apps, such as Android and Tracker Capture.
Click Create registration form.
Click Section or Custom.
To create a Section form:
To create a Custom registration form: Use the WYSIWYG editor to create a completely customized form. If you select Source, you can paste HTML code directly in the editing area. You can also insert images for example flags or logos.
Click add stage.
A program consists of program stages. A program stage defines which actions should be taken at each stage.
Note
Changes to a program stage are not saved until you save the program.
| Option | Action |
|---|---|
| Auto-generate event | Clear check box to prevent creating an event of this program stage automatically when a entity is enrolled in the program. |
| Open data entry form after enrollment | Select check box to automatically open the event of this stage as soon as the entity has enrolled into the program. |
| Report date to use | If you have selected the Open data entry form after enrollment check box, also select a Report date to use: Date of incident or Date of enrollment. This is the date used as report date for an event that has been opened automatically. If the Report date to use is selected as one of those two ('incident date'/'enrollment date'), in Dashboard, the 'Report date' of the event will be set as one of those two. |
| User assignment of events | Select check box to enable user assignment of the program stage. This means that in Tracker capture there will be a list of users to which the event can be assigned. |
| Block entry form after completed | Select check box to block the entry form after completion of the event of this stage. This means that the data in the entry form can't be changed until you reset the status to incomplete. |
| Ask user to complete program when stage is completed | Select check box to trigger a pop-up which asks the user if he/she wants to create the event of next stage. |
| Ask user to create new event when stage is complete | Select check box to trigger a pop-up which asks the users if he/she wants to create a new event of this stage when an event of this stage is completed. This property is active only if you have selected Repeatable. |
| Generate events by enrollment date | Check on it for auto-generating due dates of events from program-stages of this program based on the enrollment date. If it is not checked, the due dates are generated based on incident date. |
| Hide due dates | Select checkbox to hide due dates for events. |
| Feature type | Sets whether the program is going to capture a geographical feature type or not. * None: Nothing is captured. * Polygon: An area is captured. For single event programs the area will be the area representing the event being captured. For tracker programs, the area will represent the area of the enrollment. * Point: A point/coordinate is captured. For single event programs the point will be representing the event being captured. For tracker programs, the point will represent the enrollment. |
| Pre-generate event UID | Select check box to pre-generate unique event id numbers. |
| Custom label for report date | Defines the meaning of the report date in this program stage. This description is displayed in the data entry form. |
| Custom label for due date | Defines the meaning of the due date in this program stage. |
| Custom label for: - event(s) - program stage | Renames standard DHIS2 terms for this program. These labels only affect how the terms are displayed in the user interface and do not change their meaning. Note: Only Event supports the plural form; Program Stage does not. Currently, these custom labels are used only by the DHIS2 Android app. |
Assign data elements to program stage:
In the list of Available data elements, double-click the data elements you want to assign to the program stage.
For each assigned data element, review the properties. You can select:
| Option | Action |
|---|---|
| Compulsory | The value of this data element must be filled into data entry form before completing the event. |
| Allow provided elsewhere | Specify if the value of this data element comes from other facility, not in the facility where this data is entered. |
| Display in reports | Display the value of this data element into the single event without registration data entry function. |
| Date in future | Allow to select a date in future for date data elements. |
| Skip synchronization | Allow data element to be skipped when running data synchronization jobs. |
| Mobile render type | Can be used to select different render types for mobile devices. Available options vary depending on the attribute's value type. For example, for a numerical value you may select "Default", "Value", "Slider", "Linear scale", and "Spinner". |
| Desktop render type | WARNING: NOT IMPLEMENTED YET. Can be used to select different render types for desktop (i.e. the web interface). Available options vary depending on the attribute's value type. For example, for a numerical value you may select "Default", "Value", "Slider", "Linear scale", and "Spinner". |
Create data entry forms for program stage
The data entry forms decide how the data elements will be displayed to the user in the Tracker Capture app.
Click Create data entry form.
Click Basic, Section or Custom.
To create a Basic data entry form: Drag and drop the data elements in the order you want.
To create a Section data entry form:
Click the add button and enter a section's name, description and render type for desktop and mobile.
Click the section so it's highlighted by a black border.
Add data elements by clicking the plus sign next to the data elements' names.
Repeat the above steps until you have all the sections you need.
Change the section order: click the options menu, then drag the section to the place you want.
To create a Custom data entry form: Use the WYSIWYG editor to create a completely customized form. If you select Source, you can paste HTML code directly in the editing area. You can also insert images for example flags or logos.
Click add stage.
Access options decide who can capture data for the program or view/edit the program's metadata. A program can be shared to organisation units, and in addition, the main program and any program stages' access options can be configured through the Sharing dialog. Access options are available in the Access tab.
Assign organization units:
In the organisation tree, double-click the organisation units you want to add to the program.
You can locate an organisation unit in the tree by expanding the branches (click on the arrow symbol), or by searching for it by name. The selected organisation units display in orange.
Change roles and access:
Scroll down to the Roles and access section.
The first row shows the main program's access options, and each subsequent row shows the options of one program stage. Program stages with a warning icon (exclamation mark) contain access options that deviate from the main program, meaning they are accessed by a different combination of users.
Click on either of the rows and the Sharing dialog will show.
Modify the access options accordingly. See documentation on the sharing dialog for details.
Click the Apply button.
Repeat the process for each program/program stage. You can also copy all access options from the main program to your child programs:
Select the program stages you want to have similar access options as the main program by toggling the checkboxes on the right hand side of the program stages. You can also choose to Select all program stages, Deselect all program stages or Select similar stages, in terms of access options, to that of the main program. Similar stages are toggled by default.
Click Apply to selected stages
You can create program notifications for programs with registration and their program stages. The notifications are sent either via the internal DHIS2 messaging system, via e-mail or via text messages (SMS). You can use program notifications to, for example, send an automatic reminder to a tracked entity 10 days before a scheduled appointment. You use the program’s tracked entity attributes (for example first name) and program parameters (for example enrollment date) to create a notification template.
Open the Maintenance app and click Program and then notifications.
A list of existing program notifications for the selected program opens. If the program doesn't have any program notifications, the list is empty.
Click on add button and select Program notification.
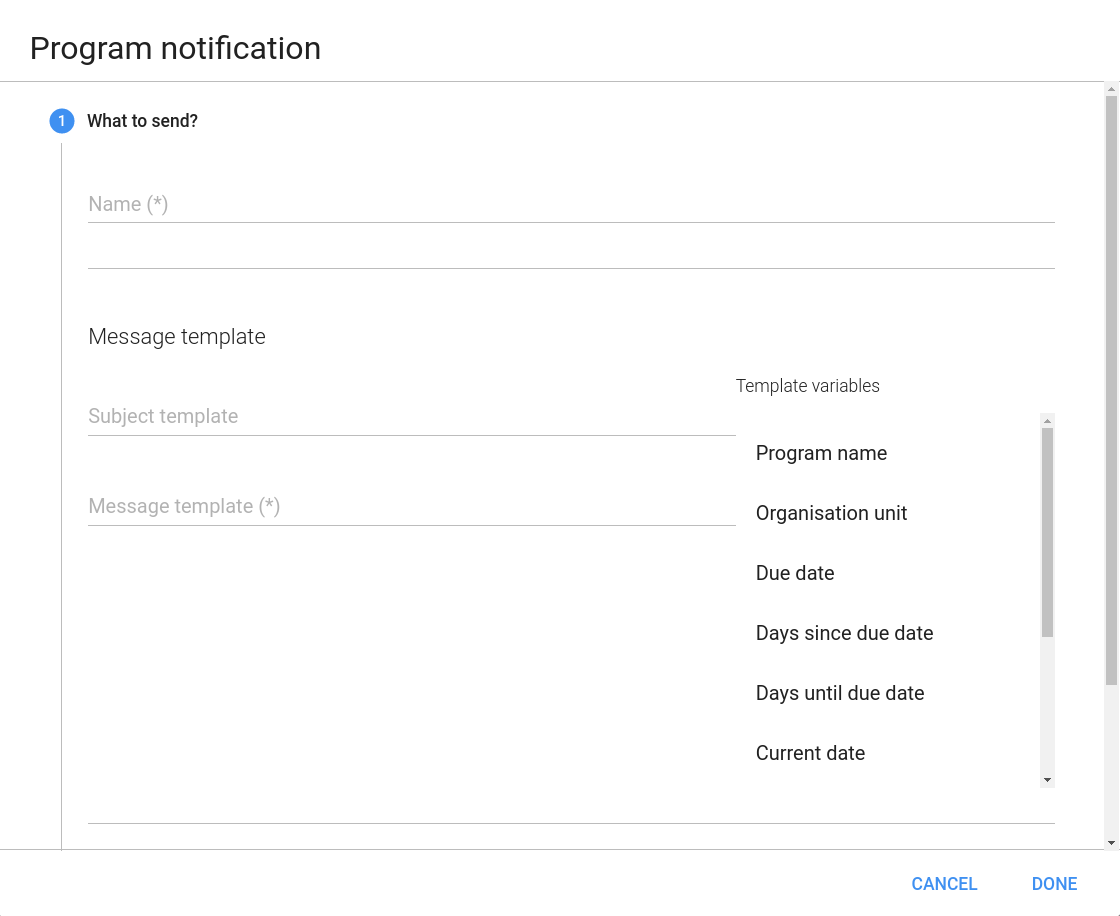
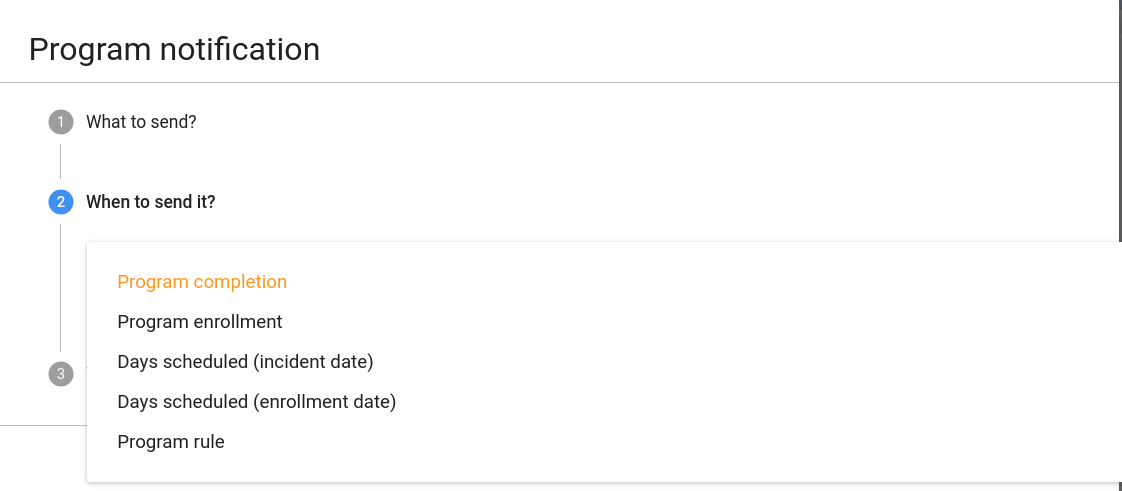
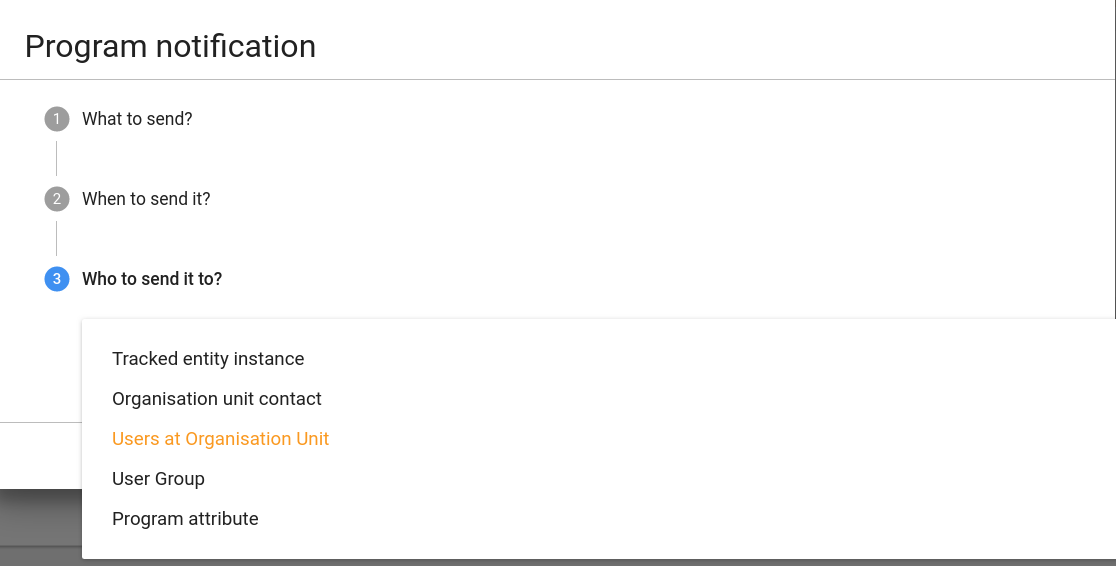
Enter a Name.
Create the Subject template.
Double-click the parameters in the Parameters field to add them to your subject.
Note
The subject is not included in text messages.
Create the Message template.
Double-click the parameter names in the Parameters field to add them to your message.
Dear A{w75KJ2mc4zz}, You're now enrolled in V{program_name}.
In the When-to-send it field, select what should trigger the notification.
| Trigger | Description | Note |
|---|---|---|
| Program enrollment | The program notification is sent when the TEI enrols in the program. | - |
| Program completion | The program notification is sent when the program of TEI is completed | - |
| Days scheduled (incident date) | The program notification is sent XX number of days before or after the incident date | You need to enter the number of days before or after the scheduled date that the notification will be sent. |
| Days scheduled (enrollment date) | The program notification is sent XX number of days before or after the enrollment date | You need to enter the number of days before or after the scheduled date that the notification will be sent. |
| Program Rule | Notification will be triggered as a result of program rule execution. | Program rule with ProgramRuleActionType.SENDMESSAGE need to be in place to make this trigger successful. |
In the Who-to-send-it field, select who should receive the program notification.
| Recipient type | Description | Note |
|---|---|---|
| Tracked entity instance | Receives program notifications via e-mail or text message. | To receive a program notification, the recipient must have an e-mail address or a phone number attribute. |
| Organisation unit contact | Receives program notifications via e-mail or text message. | To receive a program notification, the receiving organisation unit must have a registered contact person with e-mail address and phone number. |
| Users at organisation unit: | All users registered to the selected organisation unit receive program notifications via the internal DHIS2 messaging system. | - |
| User group | All members of the selected user group receive the program notifications via the internal DHIS2 messaging system | - |
| Limit To Hierarchy | Send notification only to those users who belong to any of the organisation unit in the hierarchy. | This option is only available when User Group is selected as recipient. |
| Parent OrgUnit Only | Send notification only to those users who belong to parent organisation unit. | This option is only available when User Group is selected as recipient. |
| Program Attribute | TrackedEntityAttribute can also be selected as recipient. | This parameter will only be effective if TrackedEntityAttribute value type is PHONE_NUMBER/EMAIL. |
Click Save.
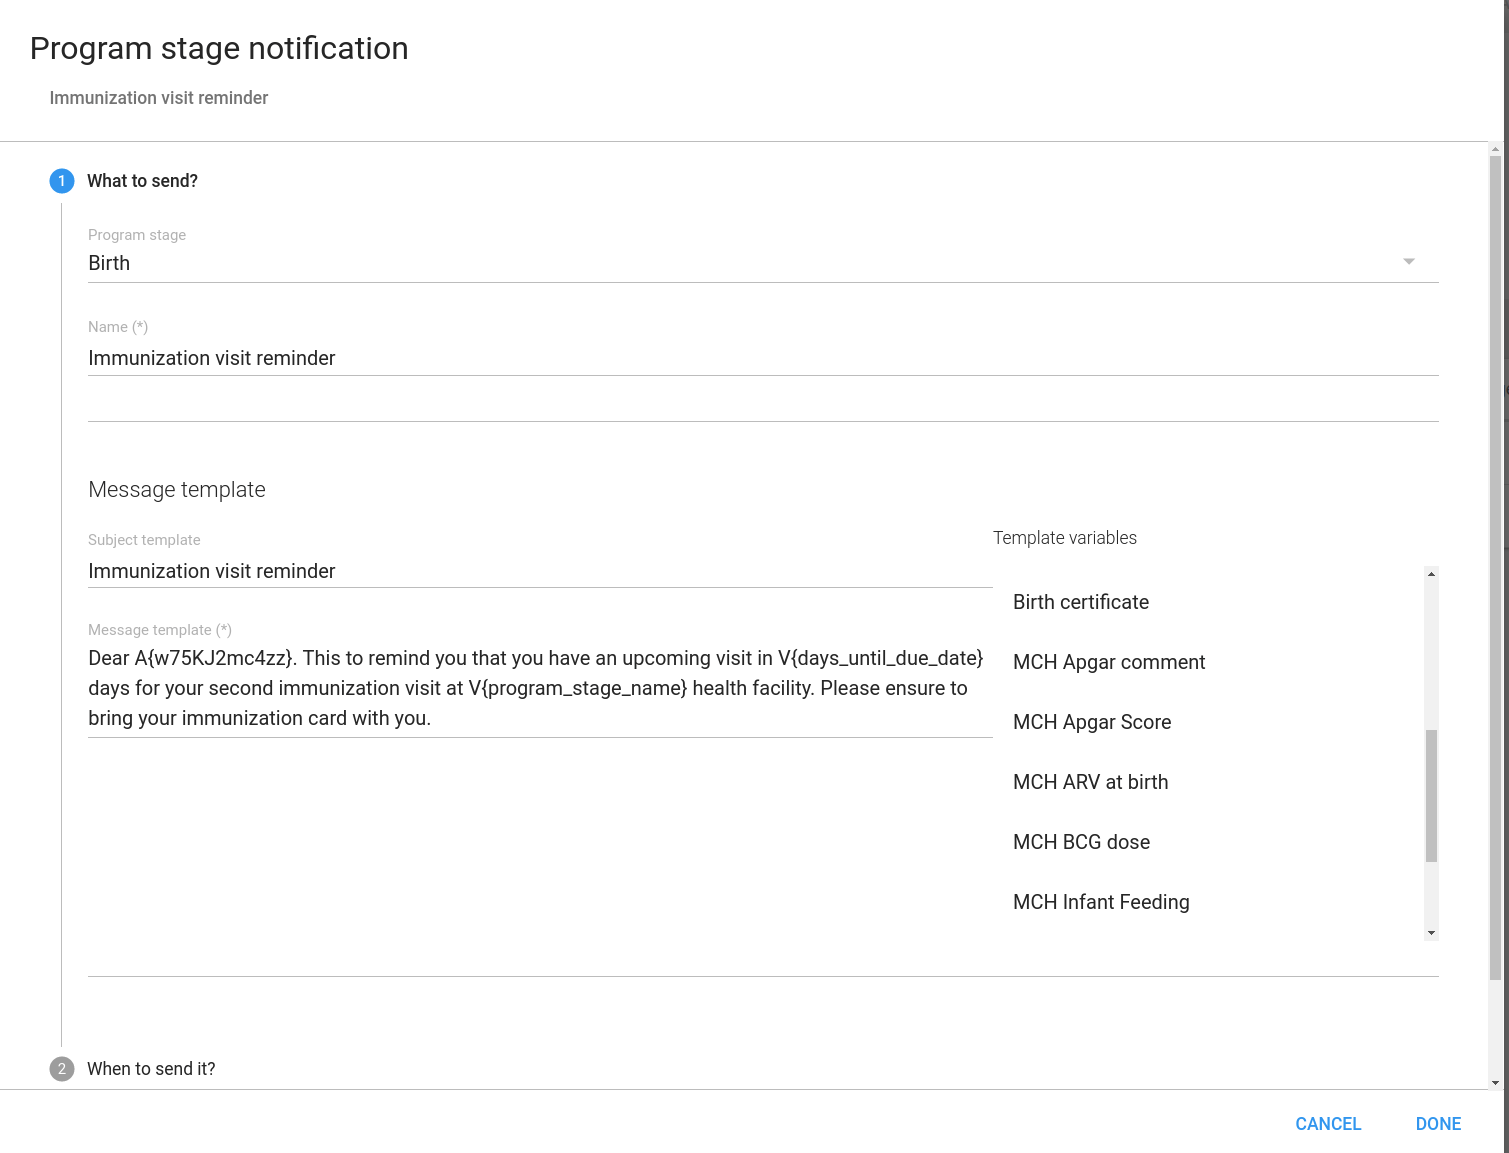
Open the Maintenance app and click Program and then notifications.
A list of existing program stage notifications for the selected program stage opens. If the program stage doesn't have any program stage notifications, the list is empty.
Click on add button and select Program stage notification.
Click Add new.
Enter a Name.
Create the Subject template.
Double-click the parameter names in the Parameters field to add them to your subject.
Note
The subject is not included in text messages.
Create the Message template.
Double-click the parameter names in the Parameters field to add them to your message.
Dear A{w75KJ2mc4zz}, please come to your appointment the V{due_date}.
In the When-to-send-it field, select what should trigger the notification.
| Trigger | Description | Note |
|---|---|---|
| Program stage completion | The program stage notification is sent when the program stage is completed | - |
| Days scheduled (due date) | The program stage notification is sent XX number of days before or after the due date | You need to enter the number of days before or after the scheduled date that the notification will be sent. |
| Program Rule | Notification will be triggered as a result of program rule execution. | Program rule with ProgramRuleActionType.SENDMESSAGE need to be in place to make this trigger successful. |
Allow notification to be sent multiple times
This flag can be used if notification is required to be sent multiple times. For example in case of repeatable program stage, same notification will be sent as many times as the stage is repeated.
In the Recipients field, select who should receive the program stage notification. You can select:
| Recipient type | Description | Note |
|---|---|---|
| Tracked entity instance | Receives program notifications via e-mail or text message. | To receive a program stage notification, the recipient must have an e-mail address or a phone number attribute. |
| Organisation unit contact | Receives program notifications via e-mail or text message. | To receive a program stage notification, the receiving organisation unit must have a registered contact person with e-mail address and phone number. The system selects the same organisation unit as where the event took place. |
| Users at organisation unit: | All users registered to the selected organisation unit receive program notifications via the internal DHIS2 messaging system. | - |
| User group | All members of the selected user group receive the program notifications via the internal DHIS2 messaging system | - |
| Limit To Hierarchy | Send notification only to those users who belong to any of the organisation unit in the hierarchy. | - |
| Parent OrgUnit Only | Send notification only to those users who belong to parent organisation unit. | - |
| Data Element | Data Element associated with ProgramStage can be selected as recipient. | Data Element will only be effective if DataElement has value type PHONE_NUMBER/EMAIL. |
| Tracked Entity Attribute | Tracked Entity Attribute associated with ProgramInstance/Enrollment can be selected as recipient. | Attribute will only be effective if it has value type PHONE_NUMBER/EMAIL. |
| Web Hook | Web hooks are automated HTTP messages sent to an external URL configured in web hook URL field. Notification template variables will be sent as key-value pairs in the HTTP request. | - |
Click Save.
| Notification type | Variable name | Variable code |
|---|---|---|
| Program | Current date | V{current_date} |
| Days since enrollment date | V{days_since_enrollment_date} | |
| Enrollment date | V{enrollment_date} | |
| Incident date | V{incident_date} | |
| Organisation unit name | V{org_unit_name} | |
| Program name | V{program_name} | |
| Program stage | Current date | V{current_date} |
| Days since due date | V{days_since_due_date} | |
| Days until due date | V{days_until_due_date} | |
| Due date | V{due_date} | |
| Organisation unit name | V{org_unit_name} | |
| Program name | V{program_name} | |
| Program stage name | V{program_stage_name} | |
| Event organisation unit | V{event_org_unit_id} | |
| Enrollment organisation unit | V{enrollment_org_unit_id} | |
| Program stage id | V{program_stage_id} | |
| Program id | V{program_id} | |
| Program instance id/Enrollment id | V{enrollment_id} | |
| Tracked entity id | V{tracked_entity_id} | |
| Event/Execution date | V{event_date} |
Program indicators are expressions based on data elements and attributes of tracked entities which can be used to calculate values based on a formula. Program indicators consist of an aggregation type, an analytics type, an expression and a filter.
Program indicators are evaluated based on the assigned aggregation type, expression and filter. The order of evaluation is:
The filter will filter the events which become part of the evaluation/aggregation routine.
The expression will be evaluated per event.
All evaluated expression values will be aggregated according to the aggregation type of the program indicator.
| Program rule component | Description |
|---|---|
| Aggregation type | The aggregation type determines how the program indicator will be aggregated. The following aggregation types are available: * Average * Average (number) * Average (number, disaggregation) * Average (sum in organisation unit hierarchy) * Average (sum of numbers) * Average (sum of numbers, disaggregation) * Average (Yes/No) * Count * Custom The "custom" aggregation type allows you to specify the aggregation type in-line in the expression. All other aggregation types are applied to the entire expression. Using the "custom" aggregation type might lead to an exception of the order of evaluation described above where individual parts of the expression can be evaluated and aggregated, as opposed to the entire expression being evaluated prior to aggregation. * Default * Max * Min * None * Standard deviation * Sum * Variance |
| Analytics type | The available analytics types are event and enrollment. The analytics type defines whether the program indicator is calculated based on events or program enrollments. This has an impact on what type of calculations can be made. * Events implies a data source where each event exists as an independent row. This is suitable for performing aggregations such as counts and sums. * Enrollments implies a data source where all events for a single enrollment is combined on the same row. This allows for calculations which can compare event data from various program stages within a program enrollment. |
| Organisation unit field | Determines which organisation unit is assigned to program indicator values. For Event programs (without registration) the options are: * Event organisation unit (default): where the event took place * any data elements of value type Organisation Unit (if any) assigned to the program For Tracker programs (with registration) and analytics type Enrollment the options are: * Registration organisation unit: where the tracked entity instance was created * Enrollment organisation unit (default): where the tracked entity instance was enrolled in this program * Owner at start organisation unit: where the tracked entity instance was owned at the start of the reporting period * Owner at end organisation unit: where the tracked entity instance was owned at the end of the reporting period For Tracker programs (with registration) and analytics type Event the options are: * Event organisation unit (default): where the event took place * any data elements of value type Organisation Unit (if any) assigned to the program * Registration organisation unit: where the tracked entity instance was created * Enrollment organisation unit: where the tracked entity instance was enrolled in this program * Owner at start organisation unit: where the tracked entity instance was owned at the start of the reporting period * Owner at end organisation unit: where the tracked entity instance was owned at the end of the reporting period |
| Analytics period boundaries | Defines the boundaries for the program indicator calculation. The boundaries determine which events or enrollments gets included in aggregations, always relative to the aggregate reporting period start and end. When creating the program indicator, the default boundaries will get preselected based on analytics type. * For analytics type event, the default boundaries will be configured to encapsulate any events with an event date after the reporting period starts and before the reporting period ends. * For analytics type enrollment, the default boundaries will encapsulate all enrollments with an enrollment date after the reporting date starts and before the reporting period ends. In addition, the default enrollment program indicator evaluates the newest event for all program stages regardless of date. It is possible to change the upper and lower boundaries to include a longer or shorter period relative to the reporting period, or delete one of the boundaries - in effect returning all data before or after a certain period. It is also possible to add more constraints, for example to make an enrollment program indicator only include event data up to a given point in time. * Boundary target: Can be incident date, event date, enrollment date or custom. Designates what is being constrained by the boundary. custom is used make boundary that target either a date data element, tracked entity attribute or the presence of an event in a program stage. This is done with a custom expression on the form: - Data element of type date: #{programStageUid.dataElementUid}. #{A03MvHHogjR.a3kGcGDCuk6} - Tracked entity attribute of type date: #{attributeUid}. A{GPkGfbmArby} - Presence of one event in a specific program stage: PS_EVENTDATE:programStageUid. PS_EVENTDATE:A03MvHHogjR Note This boundary target is only applicable to Analytics type Enrollment * Analytics period boundary type: Defines whether the boundary is an end boundary - starting with "before...", or a start boundary - "after...". Also defines whether the boundary relates to the end of the aggregate reporting period or the start of the aggregate reporting period. * Offset period by amount: In some cases, for example cohort analytics, the boundary should be offset relative to the aggregate reporting period when running pivots and reports. The offset period by amount is used to move the current boundary either back(negative) or forward(positive) in time. The amount and period type together will determine how big the offset will be. An example can be when making a simple enrollment cohort program indicator for a 1 year cohort, it might be enough to offset each boundary of the program indicator with "-1" and "Years" * Period type: See above. Can be any period, e.g. Weekly or Quarterly. |
| Expression | The expression defines how the indicator is being calculated. The expression can contain references to various entities which will be substituted with a related values when the indicator is calculated: * Data elements: Will be substituted with the value of the data element for the time period and organisation unit for which the calculation is done. Refers to both program stage and data element. * Attributes: Will be substituted with the value of the attribute for the person / tracked entity for which the calculation is done. * Variables: Will be substituted with special values linked to the program, including incident date and date of enrollment for the person, current date and count of values in the expression for the time period and organisation unit for which the calculation is done. * Constants: Will be substituted with the value of the constant. The expression is a mathematical expression and can also contain operators. For single event programs and tracker programs with analytics type event, the expression will be evaluated per event, then aggregated according to its aggregation type. For tracker programs with analytics type enrollment, the expression will be evaluated per enrollment, then aggregated according to its aggregation type. |
| Filter | The filter is applied to events and filters the data source used for the calculation of the indicator. I.e. the filter is applied to the set of events before the indicator expression is being evaluated. The filter must evaluate to either true or false. It filter is applied to each individual event. If the filter evaluates to true then the event is included later in the expression evaluation, if not it is ignored. The filter can, in a similar way as expressions, contain references to data elements, attributes and constants. The program indicator filter can in addition use logical operators. These operators can be used to form logical expressions which ultimately evaluate to either true or false. For example you can assert that multiple data elements must be a specific value, or that specific attributes must have numerical values less or greater than a constant. |
In the Maintenance app, you manage the following program indicator objects:
| Object type | Available functions |
|---|---|
| Program indicator | Create, edit, clone, share, delete, show details and translate |
| Program indicator group | Create, edit, clone, share, delete, show details and translate |
Note
A program indicator belongs to exactly one program.
Open the Maintenance app and click Indicator > Program indicator.
Click the add button.
Select a Program and enter:
Name
Short name
Code
Color
Icon
Description
Select an Aggregation type.
Select if you want to Display in form.
Assign one or multiple **Legend**s.
(Optional) Enter a Category option combination for aggregate data export.
(Optional) Enter an Attribute option combination for aggregate data export.
Create the expression.
Click Edit expression.
Create the expression based on mathematical operators and the attributes, variables and constants listed to the right.
Create the filter.
Click Edit filter.
Create the expression based on mathematical operators and the attributes, variables and constants listed to the right.
Click Save.
Open the Maintenance app and click Indicator > Program indicator group.
Click the add button.
Enter Name and Code.
In the list of available program indicators, double-click the program indicators you want to assign to your group.
Click Save.
The table below shows examples of how to write expressions and filters for different data element and attribute value types:
| Value types | Example syntax |
|---|---|
| Integer Negative integer Positive or zero integer Positive integer Number Percentage | Numeric fields, can be used for aggregation as an expression, or in filters:#{mCXR7u4kNBW.K0A4BauXJDl} >= 3 |
| Yes/No Yes only | Boolean fields. Yes is translated to numeric 1, No to numeric 0. Can be used for aggregation as an expression, or in filters:#{mCXR7u4kNBW.Popa3BauXJss} == 1 |
| Text Long text Phone number | Text fields. Can be checked for equality in filters:#{mCXR7u4kNBW.L8K4BauIKsl} == 'LiteralValue' |
| Date Age | Date fields. Most useful when combined with a d2:daysBetween function, which produces a number that can be aggregated as an expression or used in filters:d2:daysBetween(#{mCXR7u4kNBW.JKJKBausssl},V{enrollment_date}) > 100 Can also directly be checked for equality in filters: #{mCXR7u4kNBW.JKJKBausssl} == '2011-10-28' |
An expression that includes both attributes, data elements and constants looks like this:
(A{GPkGfbmArby} + #{mCXR7u4kNBW.NFkjsNiQ9PH}) * C{bCqvfPR02Im}
An expression which uses the custom aggregation type and hence can use inline aggregation types looks like this:
(sum(#{mCXR7u4kNBW.K0A4BauXJDl} * #{mCXR7u4kNBW.NFkjsNiQ9PH}) / sum(#{mCXR7u4kNBW.NFkjsNiQ9PH})) * 100
Note how the "sum" aggregation operator is used inside the expression itself.
Uniform syntax is supported for both singleline and multiline comments
d2:hasValue(#{mCXR7u4kNBW.NFkjsNiQ9PH}) /* this is comment */

d2:hasValue(#{mCXR7u4kNBW.NFkjsNiQ9PH}) && /* this is
comment */
d2:daysBetween(V{enrollment_date},PS_EVENTDATE:mCXR7u4kNBW)
The program indicator expression and filter support a range of functions. The functions can be applied to data elements and attributes:
| Function | Arguments | Description |
|---|---|---|
| d2:hasValue | (object) | Returns true if the data element/attribute has a value. Can be used in filters to distinguish between the number 0 and no value, and to distinguish between explicit "No" and no selection for a Yes/No field. |
| d2:minutesBetween | (datetime, datetime) | Produces the number of minutes between two data elements/attributes of type "date and time". When the first argument datetime comes before the second argument datetime, the number will be positive - in the opposite case, the number will be negative. The static datetime format is 'yyyy-MM-dd hh:mm'. Any of the arguments can be replaced with PS_EVENTDATE:(programStageUid) to compare the latest event date from a given program stage. |
| d2:daysBetween | (date, date) | Produces the number of days between two data elements/attributes of type date. When the first argument date comes before the second argument date, the number will be positive - in the opposite case, the number will be negative. The static date format is 'yyyy-MM-dd'. Any of the arguments can be replaced with PS_EVENTDATE:(programStageUid) to compare the latest event date from a given program stage. |
| d2:weeksBetween | (date, date) | Produces the number of full weeks between two data elements/attributes of type date. When the first argument date comes before the second argument date, the number will be positive - in the opposite case, the number will be negative. The static date format is 'yyyy-MM-dd'. Any of the arguments can be replaced with PS_EVENTDATE:(programStageUid) to compare the latest event date from a given program stage. |
| d2:monthsBetween | (date, date) | Produces the number of full months between two data elements/attributes of type date. When the first argument date comes before the second argument date, the number will be positive - in the opposite case, the number will be negative. The static date format is 'yyyy-MM-dd'. Any of the arguments can be replaced with PS_EVENTDATE:(programStageUid) to compare the latest event date from a given program stage. |
| d2:yearsBetween | (date, date) | Produces the number of full years between two data elements/attributes of type date. When the first argument date comes before the second argument date, the number will be positive - in the opposite case, the number will be negative. The static date format is 'yyyy-MM-dd'. Any of the arguments can be replaced with PS_EVENTDATE:(programStageUid) to compare the latest event date from a given program stage. |
| d2:condition | (boolean-expr, true-expr, false-expr) | Evaluates the boolean expression and if true returns the true expression value, if false returns the false expression value. The conditional expression must be quoted. The true-expr and false-expr arguments must follow the rules of any program indicator expression (including functions). |
| d2:zing | (expression) | Returns zero if the expression is negative, otherwise returns the expression value. The expression must follow the rules of any program indicator expression (including functions). |
| d2:oizp | (expression) | Returns one if the expression is zero or positive, otherwise returns zero. The expression must follow the rules of any program indicator expression (including functions). |
| d2:zpvc | (object, [,object ...]) | Returns the number of numeric zero and positive values among the given object arguments. Can be provided any number of arguments. |
| d2:relationshipCount | ([relationshipTypeUid]) | Produces the number of relationships of the given type that is connected to the enrollment or event. When no type is given, all types are counted. |
| d2:count | (dataElement) | Useful only for enrollment program indicators. Counts the number of data values that has been collected for the given program stage and data element in the course of the enrollment. The argument data element is supplied with the #{programStage.dataElement} syntax. |
| d2:countIfValue | (dataElement, value) | Useful only for enrollment program indicators. Counts the number of data values that matches the given literal value for the given program stage and data element in the course of the enrollment. The argument data element is supplied with the #{programStage.dataElement} syntax. The value can be a hard coded text or number, for example 'No_anemia' if only the values containing this text should be counted. |
| d2:countIfCondition | (dataElement, condition) | Useful only for enrollment program indicators. Counts the number of data values that matches the given condition criteria for the given program stage and data element in the course of the enrollment. The argument data element is supplied with the #{programStage.dataElement} syntax. The condition is supplied as a expression in single quotes, for example '<10' if only the values less than 10 should be counted. |
| if | (boolean-expr, true-expr, false-expr) | Evaluates the boolean expression and if true returns the true expression value, if false returns the false expression value. This is identical to the d2:condition function except that the boolean-expr is not quoted. |
| is | (expr1 in expression [, expression ...]) | Returns true if expr1 is equal to any of the following expressions, otherwise false. |
| isNull | (object) | Returns true if the object value is missing (null), otherwise false. |
| isNotNull | (object) | Returns true if the object value is not missing (not null), otherwise false. |
| firstNonNull | (object [, object ...]) | Returns the value of the first object that is not missing (not null). Can be provided any number of arguments. Any argument may also be a numeric or string literal, which will be returned if all the previous objects have missing values. |
| greatest | (expression [, expression ...]) | Returns the greatest (highest) value of the expressions given. Can be provided any number of arguments. Each expression must follow the rules of any program indicator expression (including functions). |
| least | (expression [, expression ...]) | Returns the least (lowest) value of the expressions given. Can be provided any number of arguments. Each expression must follow the rules of any program indicator expression (including functions). |
| log | (expression [, base ]) | Returns the natural logarithm (base e) of the numeric expression. If an integer is given as a second argument, returns the logarithm using that base. |
| log10 | (expression) | Returns the common logarithm (base 10) of the numeric expression. |
A filter that uses the "hasValue" function looks like this:
d2:hasValue(#{mCXR7u4kNBW.NFkjsNiQ9PH})
A filter that uses the "relationshipCount(relationshipTypeUid)" function looks like this:
d2:relationshipCount('KLkjshoQ90U')
A filter that uses the "is( x in y, z )" function looks like this:
is(#{oahc9ooVema} in 'New', 'Relapse')
An expression that uses the "zing" and "oizp" functions looks like this:
d2:zing(A{GPkGfbmArby}) + d2:oizp(#{mCXR7u4kNBW.NFkjsNiQ9PH}))
An expression that uses the "daysBetween" function looks like this:
d2:daysBetween(#{mCXR7u4kNBW.k8ja2Aif1Ae},'2015-06-01')
An expression that uses the "yearBetween" function to compare the latest event of the program stage 'mCXR7u4kNBW' to the enrollment date looks like this:
d2:daysBetween(V{enrollment_date},PS_EVENTDATE:mCXR7u4kNBW)
An expression that uses the "condition" function looks like this:
d2:condition('#{mCXR7u4kNBW.NFkjsNiQ9PH} > 100',150,50)
An expression that uses the "countIfValue" function to only count the number of times the value 10 has been collected looks like this:
d2:countIfValue(#{mCXR7u4kNBW.NFkjsNiQ9PH}),10)
An expression that uses the "zpvc" function looks like this:
d2:zpvc(A{GPkGfbmArby}),#{mCXR7u4kNBW.NFkjsNiQ9PH}),4,-1)
An expression that uses the "if" and "isnull" functions looks like this:
if(isNull(A{GPkGfbmArby}),10,20)
An expression that uses the "firstNonNull" function looks like this:
firstNonNull(A{GPkGfbmArby}),#{mCXR7u4kNBW.NFkjsNiQ9PH},44)
An expression that uses the "greatest" function looks like this:
greatest(#{mCXR7u4kNBW.k8ja2Aif1Ae},#{mCXR7u4kNBW.NFkjsNiQ9PH},1)
The program indicator expression and filter support a range of variables:
| Variable | Description |
|---|---|
| event_date | The date of when the event or the last event in the enrollment took place. |
| creation_date | The date of when an event or enrollment was created in the system. |
| due_date | The date of when an event is due. |
| sync_date | The date of when the event or enrollment was last synchronized with the Android app. |
| incident_date | The date of the incidence of the event. |
| enrollment_date | The date of when the tracked entity instance was enrolled in the program. |
| enrollment_status | Can be used to include or exclude enrollments in certain statuses. When calculating the haemoglobin improvement/deterioration throughout a pregnancy, it might make sense to only consider completed enrollments. If non-completed enrollments is not filtered out, these will represent half-finished ANC followups, where the final improvement/deterioration is not yet established. |
| current_date | The current date. |
| value_count | The number of non-null values in the expression part of the event. |
| zero_pos_value_count | The number of numeric positive values in the expression part of the event. |
| event_count | The count of events (useful in combination with filters). Aggregation type for the program indicator must be COUNT. |
| enrollment_count | The count of enrollments (useful in combination with filters). Aggregation type for the program indicator must be COUNT. |
| tei_count | The count of tracked entity instances (useful in combination with filters). Aggregation type for the program indicator must be COUNT. |
| org_unit_count | The count of organisation units (useful in combination with filters). Aggregation type for the program indicator must be COUNT. |
| program_stage_name | Can be used in filters for including only certain program stages in a filter for tracker programs. Uses the name of the program stage:V{program_stage_name} == 'ANC first visit' |
| program_stage_id | Can be used in filters for including only certain program stages in a filter for tracker programs. Uses the unique identifier of the program stage:V{program_stage_id} == 'YPSSfbmAtt1' |
| analytics_period_start | Can be used in filters or expressions for comparing any date to the first date in each reporting period.d2:daysBetween(#{WZbXY0S00lP.w4ky6EkVahL}, V{analytics_period_start}) |
| analytics_period_end | Can be used in filters or expressions for comparing any date to the last inclusive date in each reporting period. |
| event_status | Can be used in filters or expressions for comparing event status.V{event_status} == 'COMPLETED' |
| completed_date | Contains completion date of the event. If the event is not yet complete, then "completed_date" contains nothing. |
A filter that uses the "Analytics period end" variable to only include women who has an LMP that would be in the first trimester:
d2:daysBetween(#{WZbXY0S00lP.w4ky6EkVahL}, V{analytics_period_end}) <= 84
An expression that uses the "value count" variable looks like this:
(#{A03MvHHogjR.a3kGcGDCuk6} + #{A03MvHHogjR.wQLfBvPrXqq}) / V{value_count}
An expression that uses the "event_date" and "incident_date" variables looks like this:
d2:daysBetween(V{incident_date},V{event_date})
| Operator | Description |
|---|---|
| and | Logical AND |
| or | Logical OR |
| == | Equal to |
| != | Not equal to |
| < | Less than |
| <= | Less than or equal to |
| > | Greater than |
| >= | Greater than or equal to |
These operators can be used to form logical expressions which ultimately evaluate to either true or false. For example you can assert that multiple data elements must be a specific value, or that specific attributes must have numerical values less or greater than a constant.
A filter that uses both attributes and data elements looks like this:
A{cejWyOfXge6} == 'Female' and #{A03MvHHogjR.a3kGcGDCuk6} <= 2
Tip
DHIS2 is using the JEXL library for evaluating expressions which supports additional syntax beyond what is covered in this documentation. See the reference at the project home page to learn how you can create more sophisticated expressions
DHIS2 v42 introduces the ability to assign Disaggregation Category Combinations to a Program Indicator and create a mapping between the program data and each category option contained in the combination. This creates a relationship between the tracker and aggregate data models which allows for analysing individual data in the same way and alongside aggregated data.
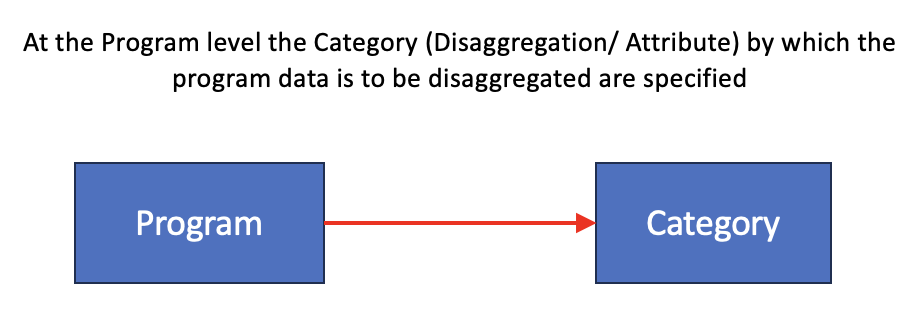

The Program Indicator Disaggregation mappings, defined at the Program level, provide a connection between the two data models within DHIS2. This ultimately allows a user to create disaggregated views of program data within the Data Visualizer using a single Program Indicator where previously one for each disaggregation was needed.
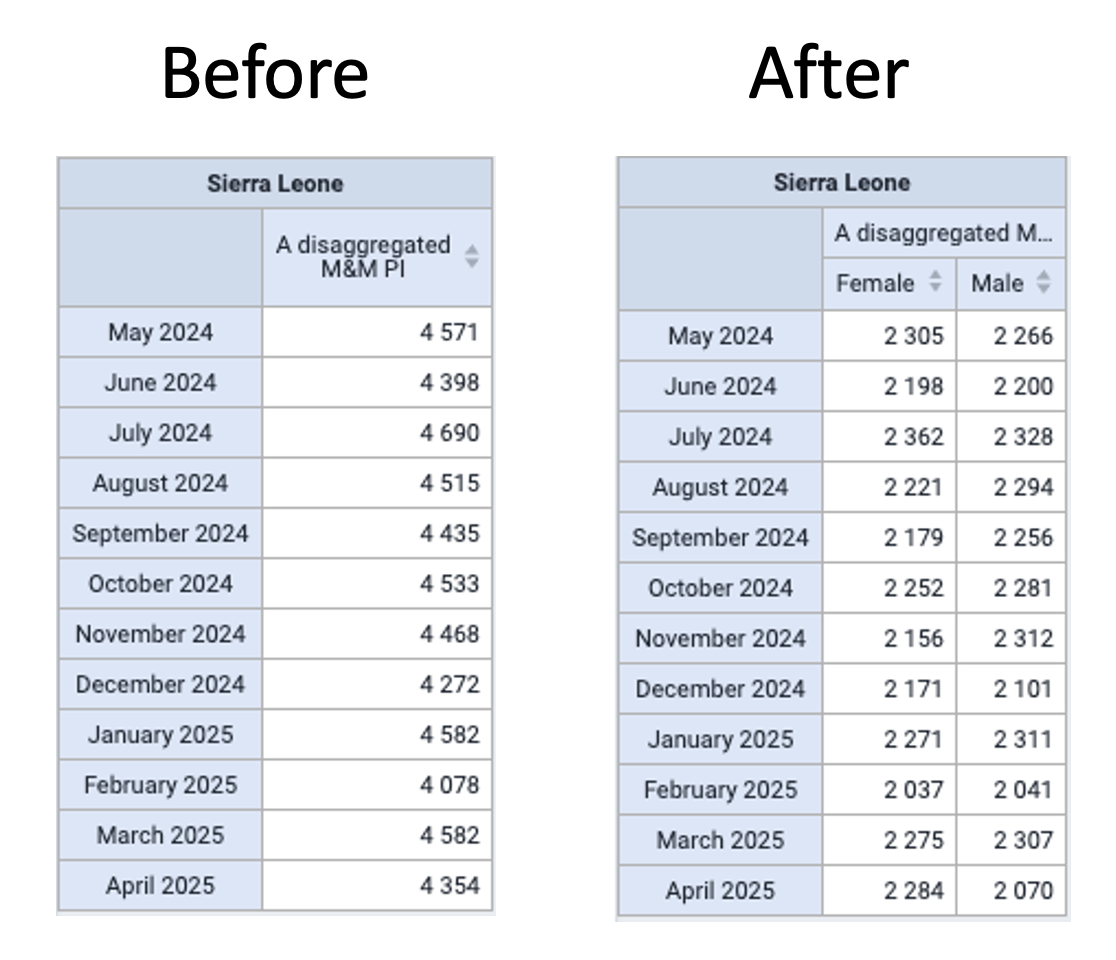
Install or update the new Maintenance app (Preview)
If your instance does not already have the new version of the maintenance app installed go to the App Management App and search for Maintenance in the App Hub and install the app. If you already have it installed, then you should update the app to the latest version. Updates to this app are continuously released so it is good to make sure that you are using the most recent release.

Load the Program Disaggregation section of the Maintenance (Preview) App by selecting Program Disaggregations under the Other section or browsing to yourinstanceurl/apps/maintenance-preview#/programDisaggregations/
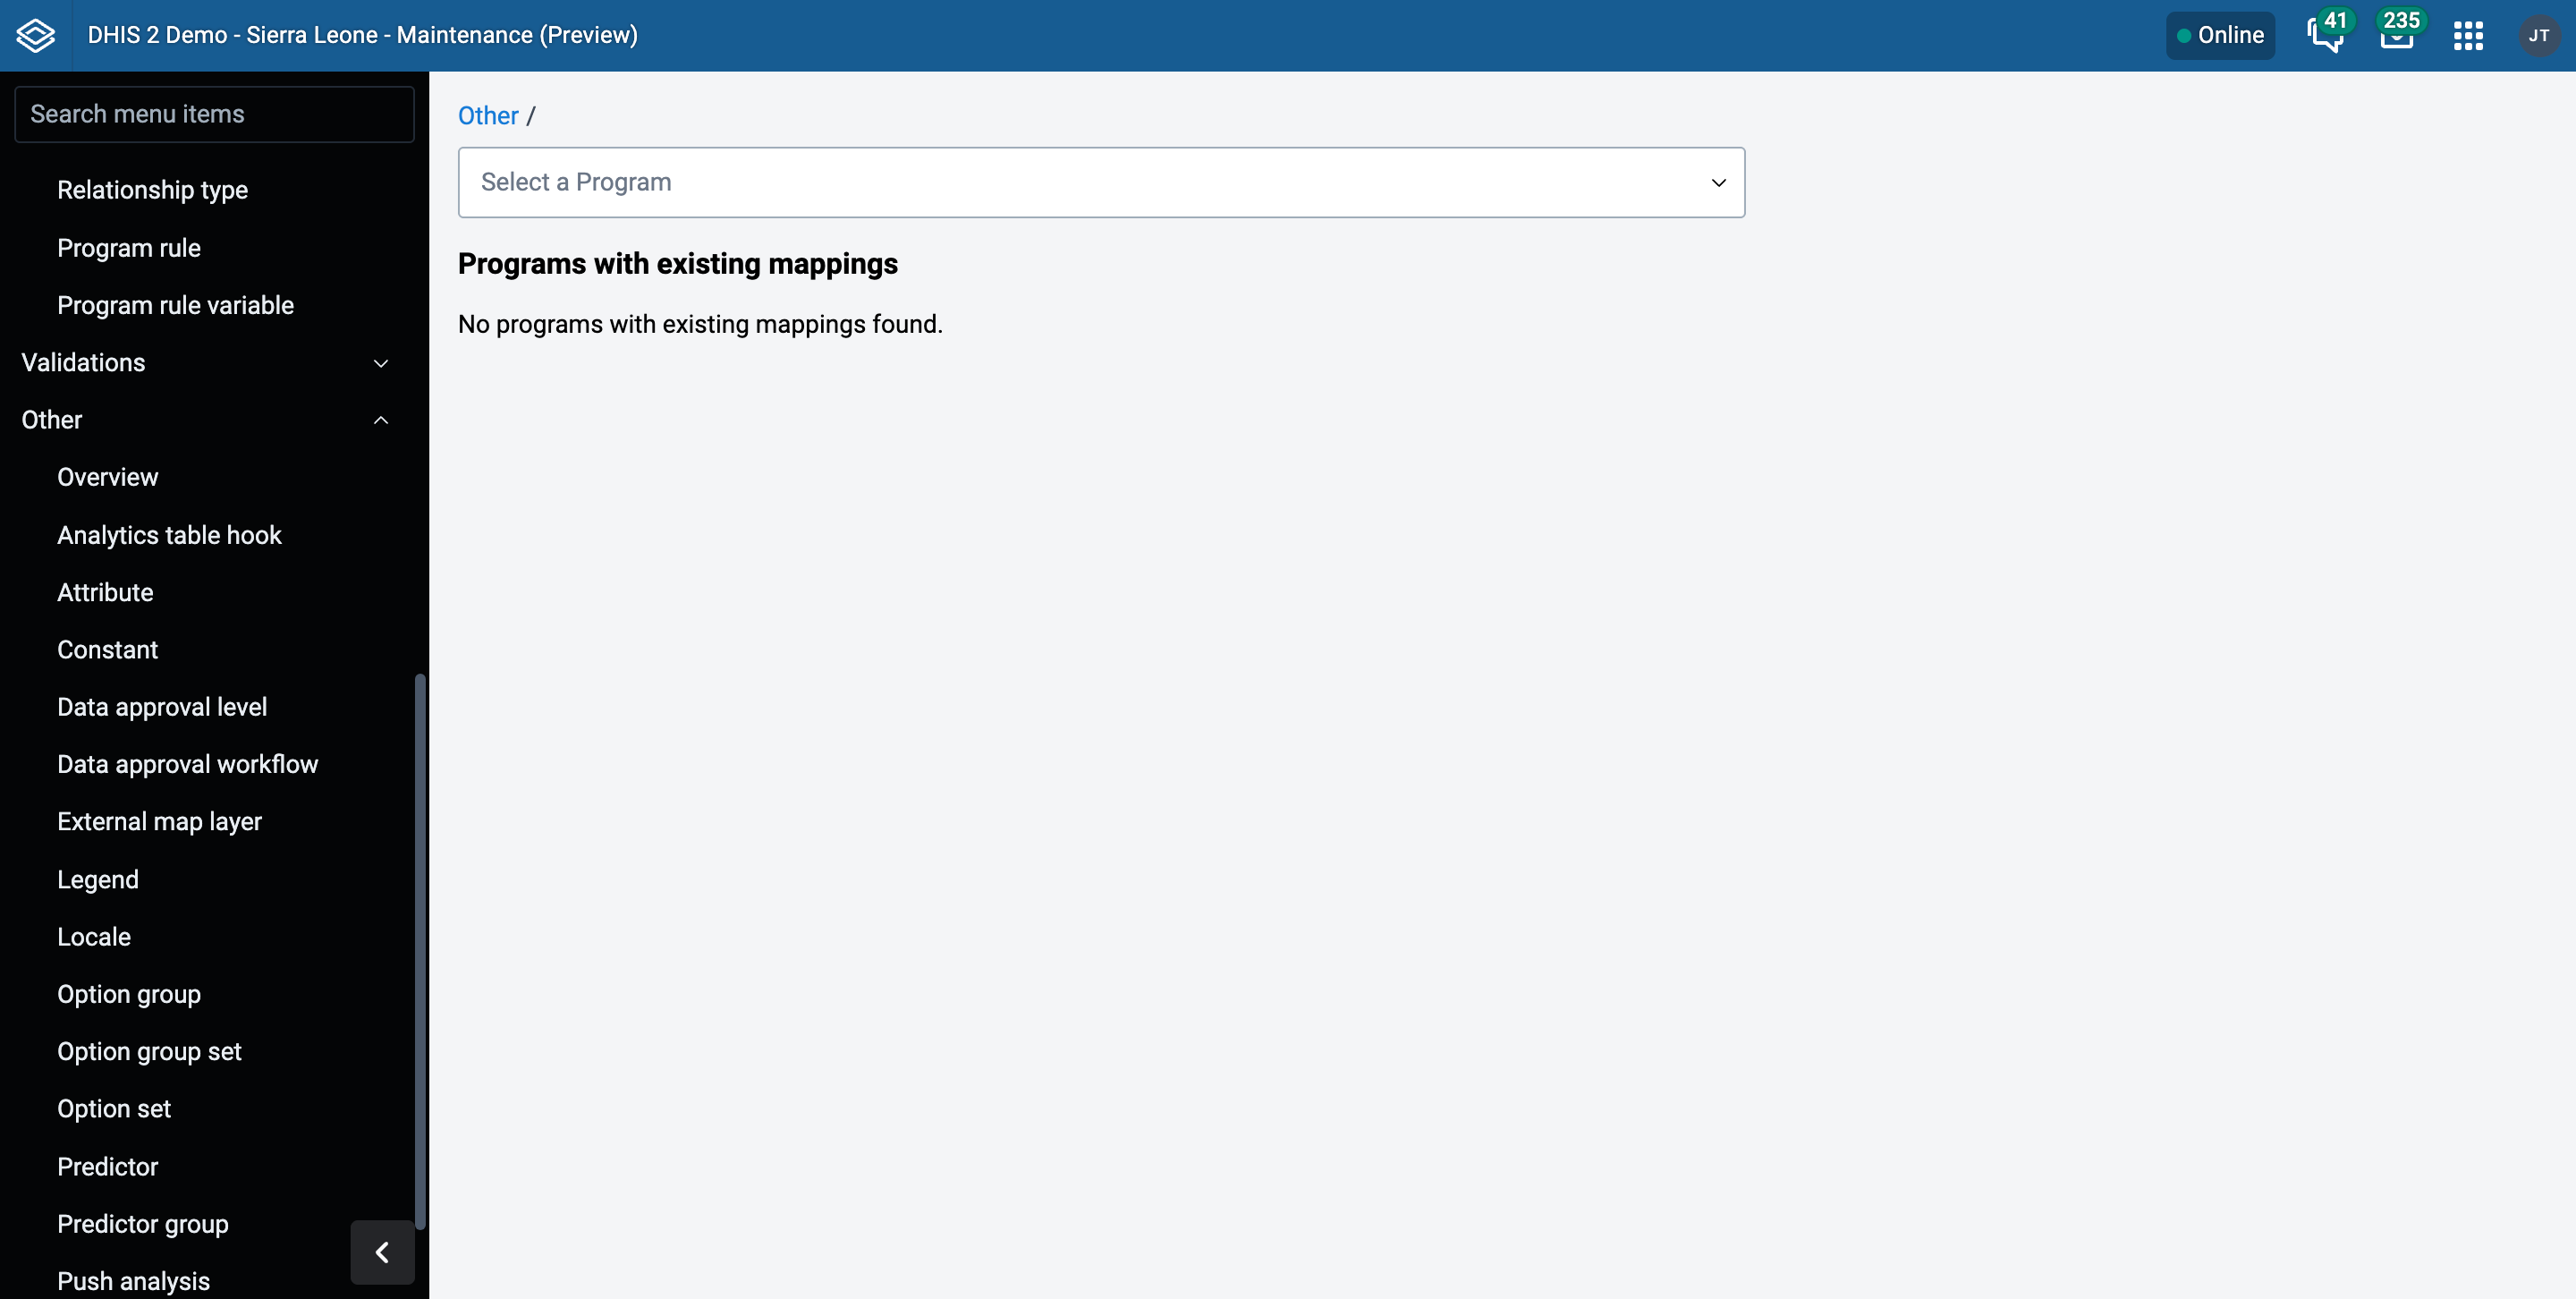
Select a Program from the drop down to enter the edit section and add Mappings to, for this example we will use the Inpatient morbidity and mortality program
This will load the Program Indicator Mapping and Categories definition screen
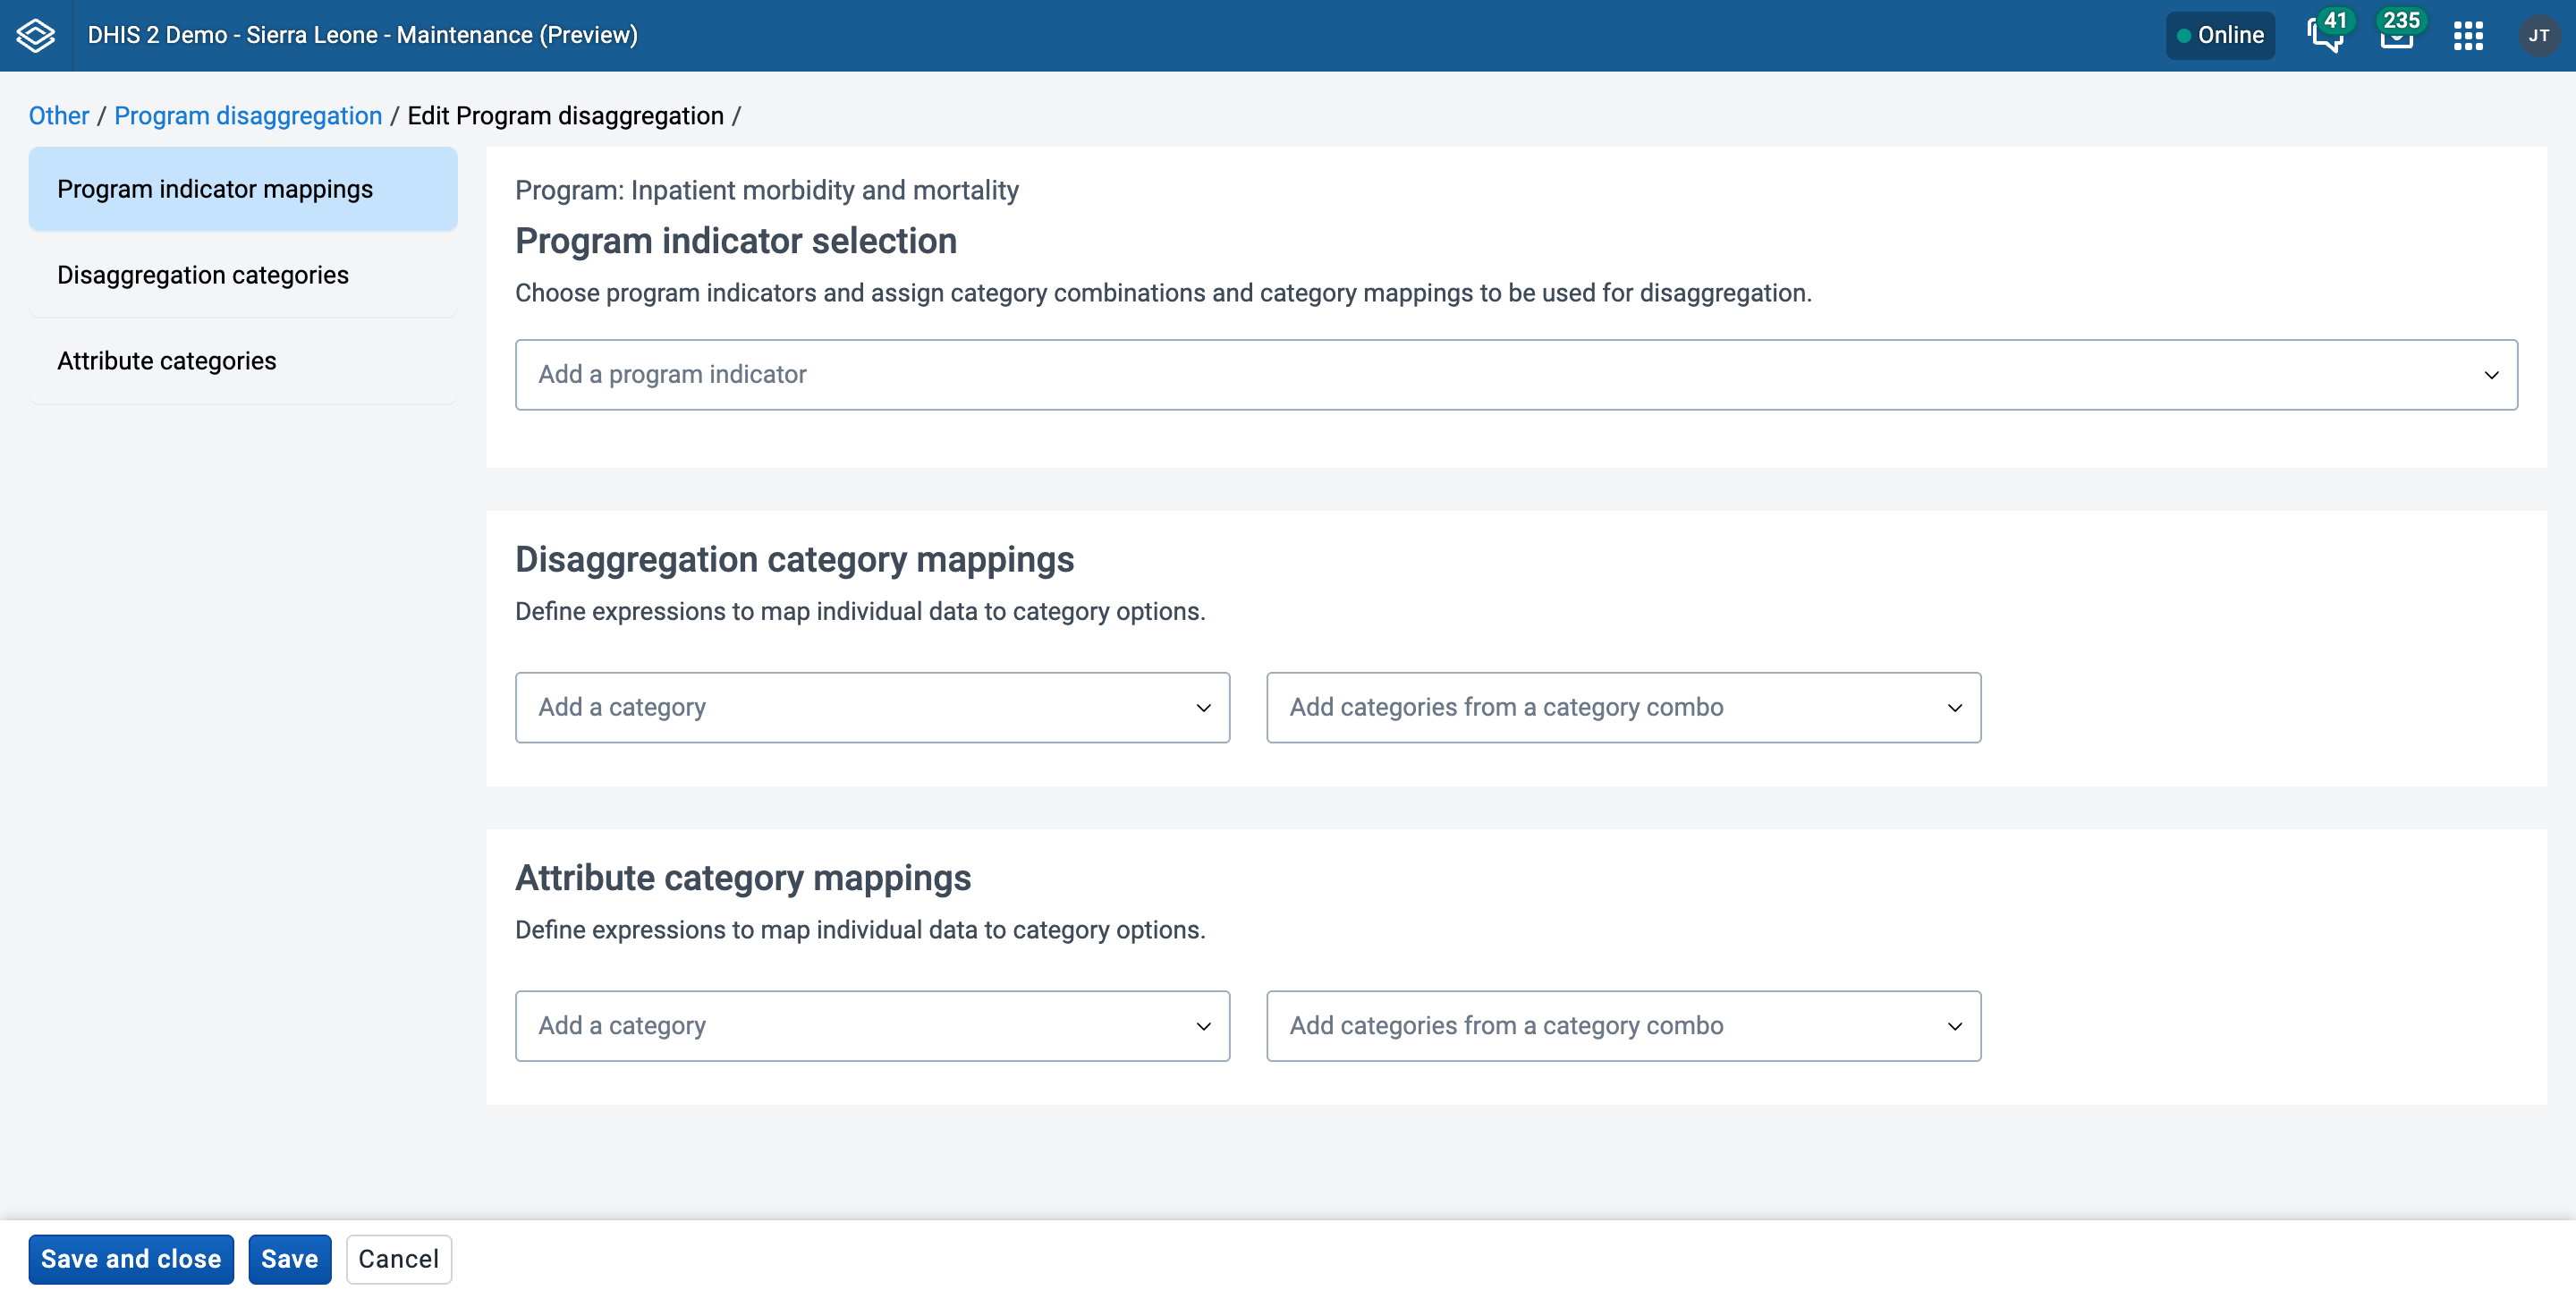
Select a Program Indicator from the drop down list, in this example we will use BMI
Under Disaggregation category combination Select Gender and U5y (you may need to create a new category combination containing the categories Gender and Under 5/5 and above of age if not present)

Loading this category combination will display the Mapping selection drop down for each of the categories defined, as this is the first time these categories have been selected there are no mappings currently available.
Under the Disaggregation categories section you should see both of the categories from the combination added as suggestion. Click Add category for both Gender and U5y
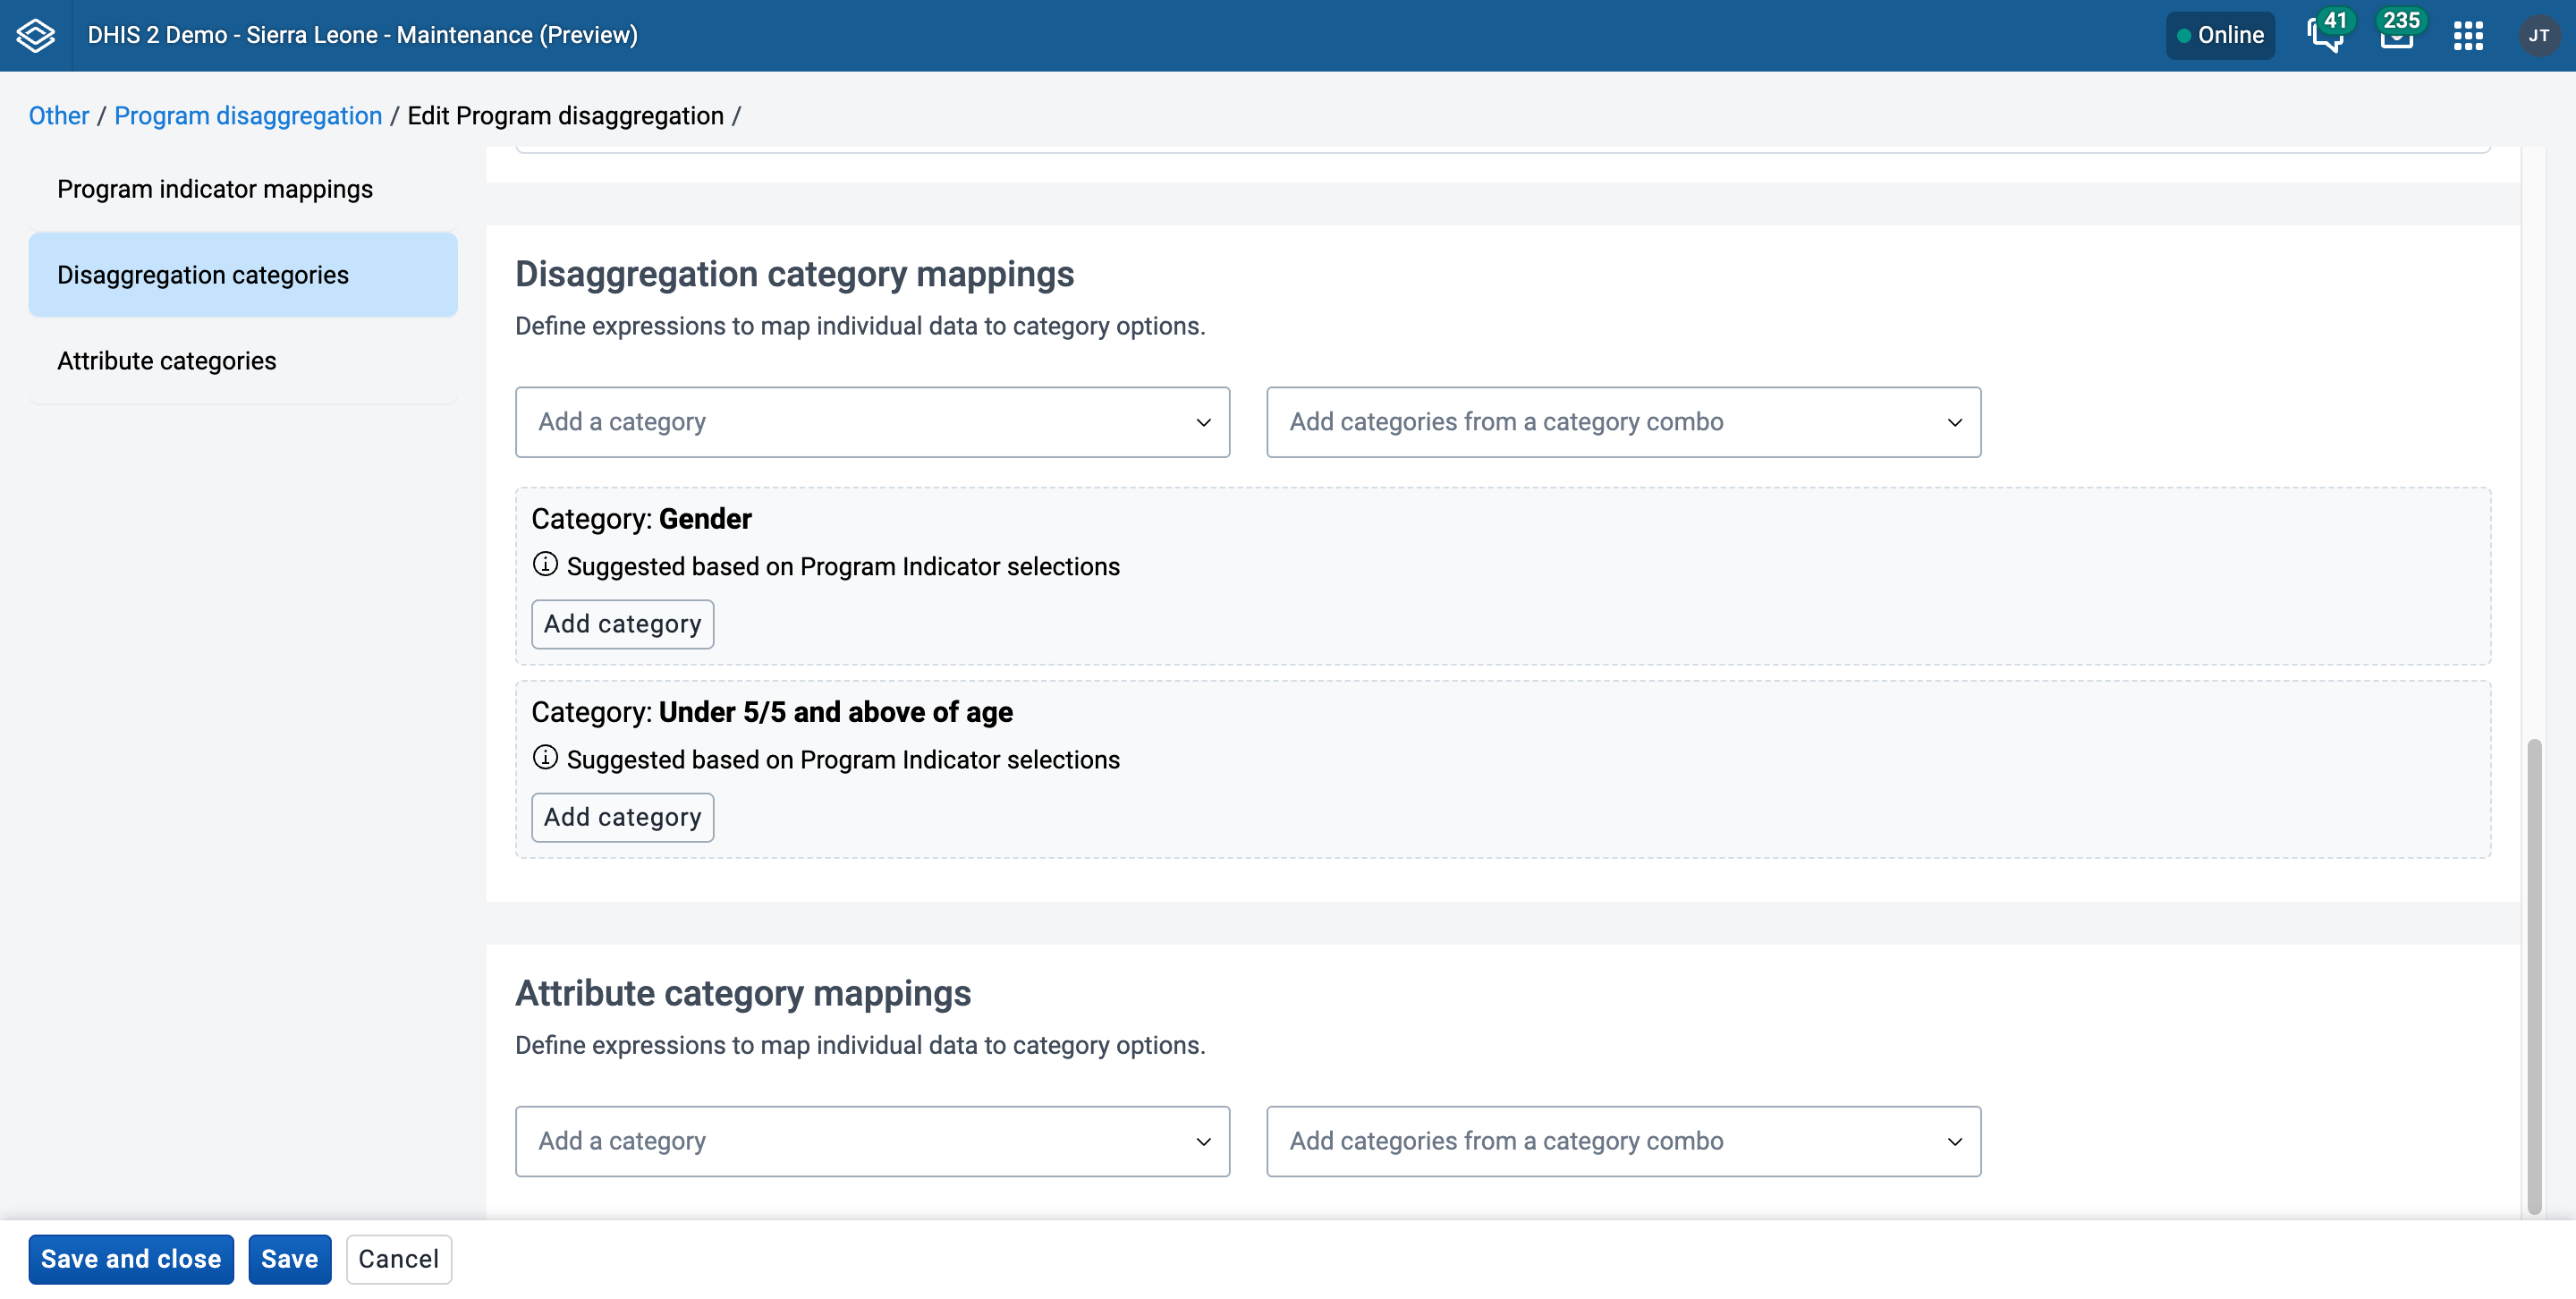
In the text field under each Category enter an expression using the Program Data Elements and Attributes that defines the category. The expression uses the same syntax as the Filter section of the Program Indicator creation screen. It is recommended to open a Program Indicator within the Program you are mapping, use the Filter screen to construct the expression and then copy it into this field. This allows you to use the inbuilt expression validation of the Program Indicator filter builder. Program Indicator functions and Variale operators
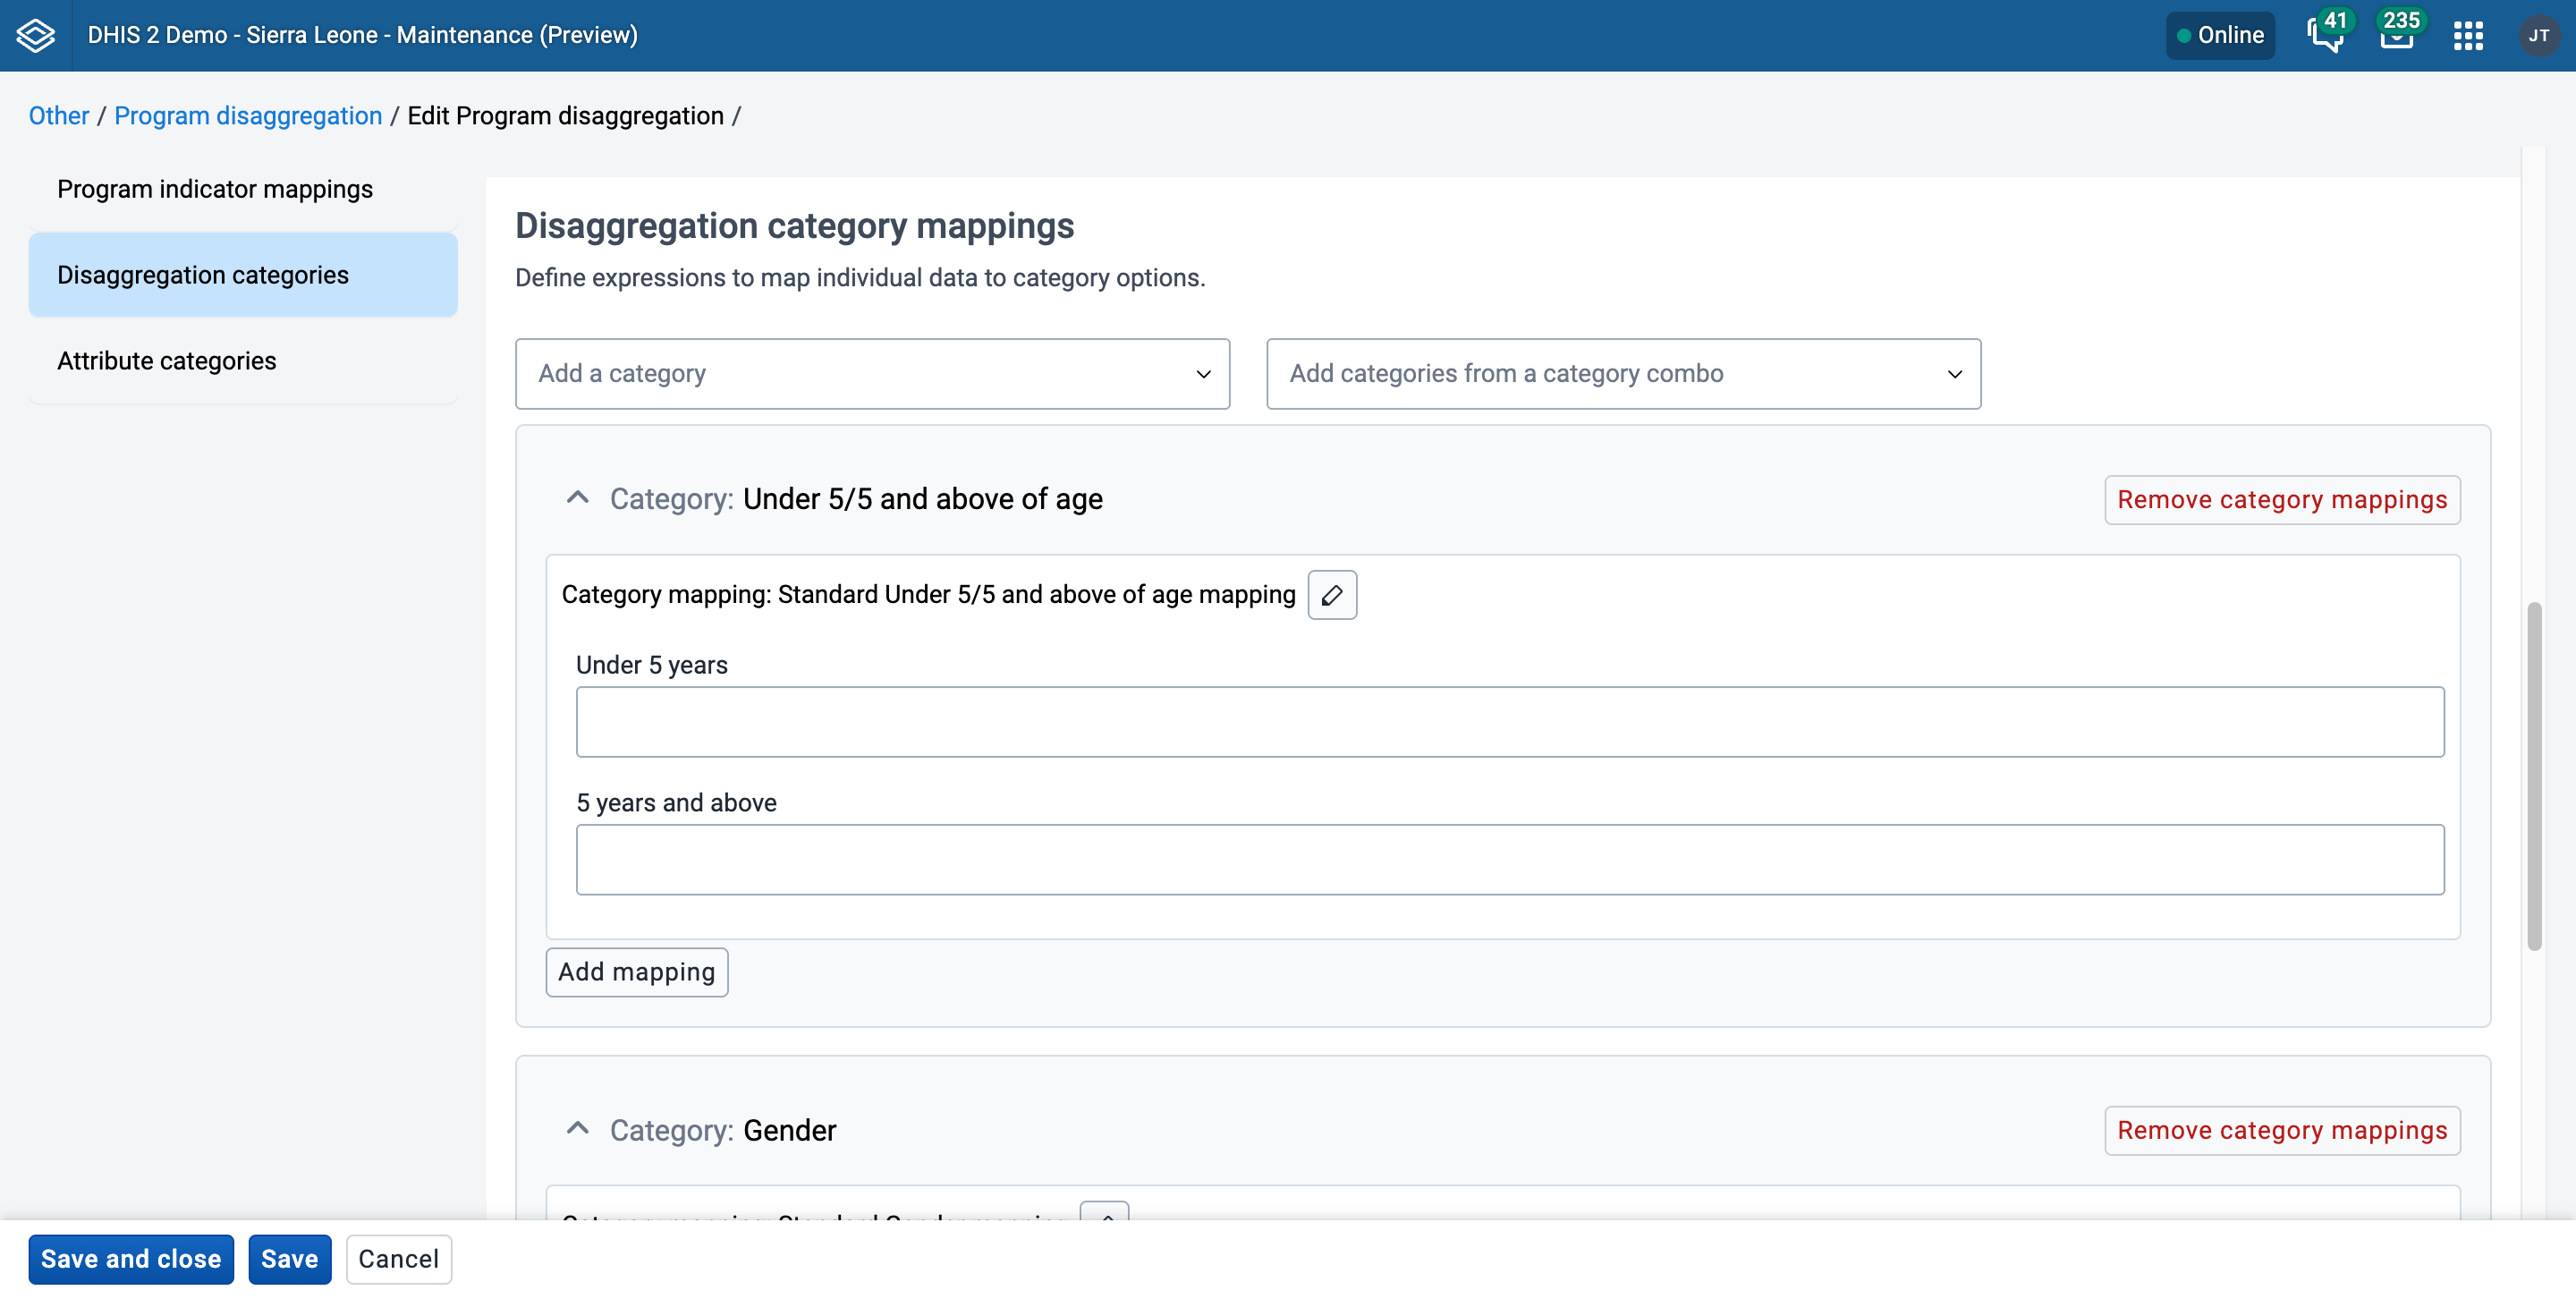
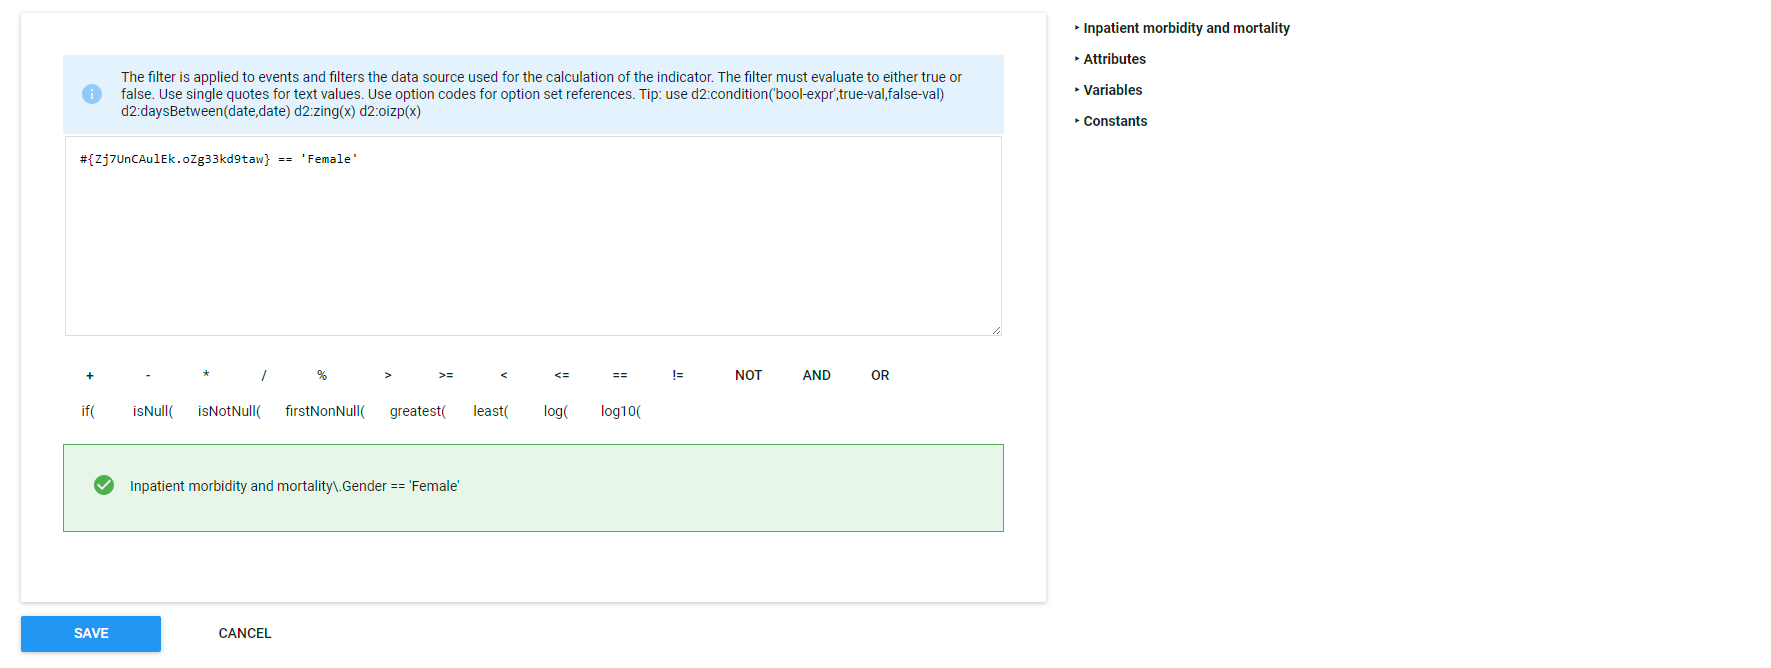
This example is linking the value selected in the Gender data element in the Program to the category option. Since the Option set in this case is a text field the expression is set to match the text ‘Female’. The next example for age shows a different way to define the relationship.

To add the mapping for the Under 5 years and 5 years and above, since it is a numerical field you can use the operators > >= < <= == != to define the relationship
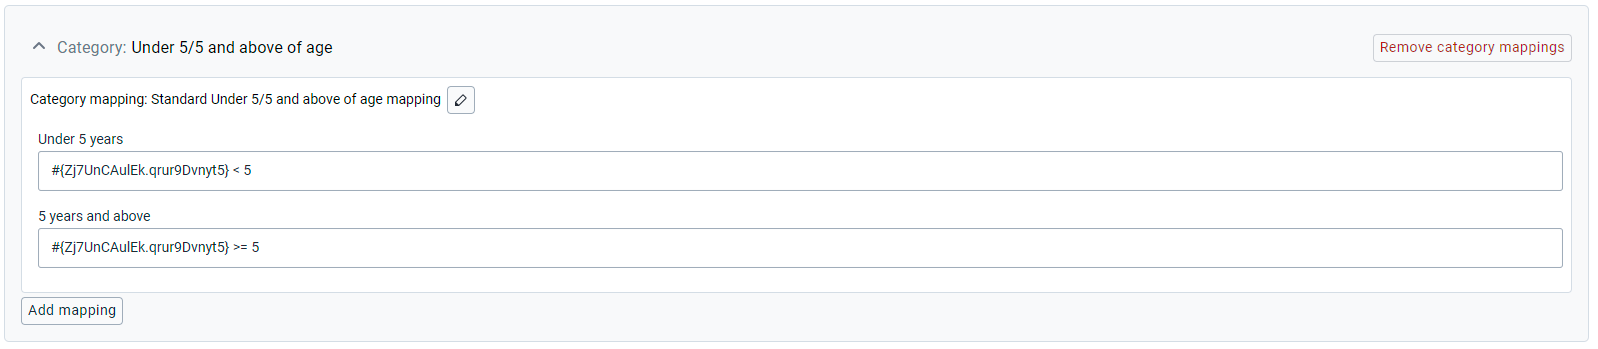
When mappings for all the category options are complete, click Save and exit
Open Data Visualizer, first let’s look at how these data were previously displayed. To do this create a visualisation to show the data of the 5 existing Program indicators with the built in disaggregations shown below.
Now remove the 4 Program Indicators with disaggregations specified and leave only the BMI Program Indicator.
You can now add Gender and Under 5/5 and above of age as disaggregation categories from the Your Dimensions column for the Program Indicator, click update and see the results.
You can now compare the data from the two separate program indicators and the single program indicator that has been disaggregated.
In addition to viewing a disaggregated Program Indicator in the Data Visualiser you can now transfer the Program Data, via the Disaggregated Program indicator, into a Data Element that shares the same Category Combination.
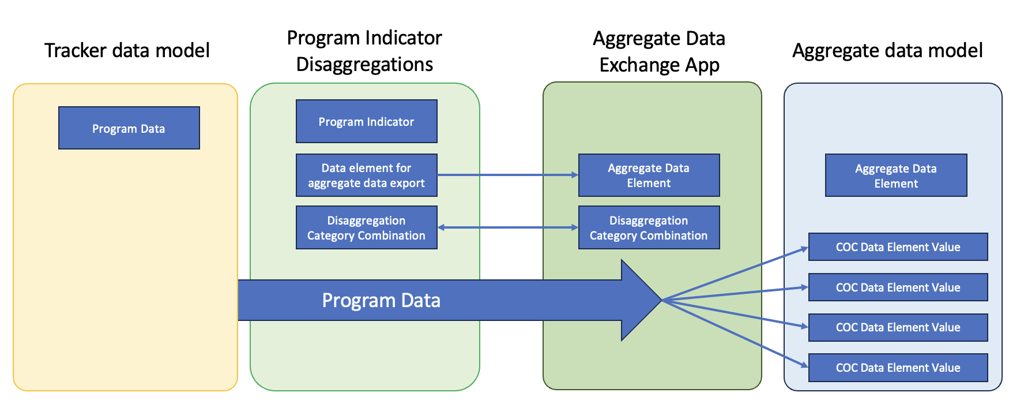
By adding the ID of a Data Element in the Data element for aggregate data export field and then setting up the aggregate data exchange app* to transfer data you can save Program data in the aggregate data model
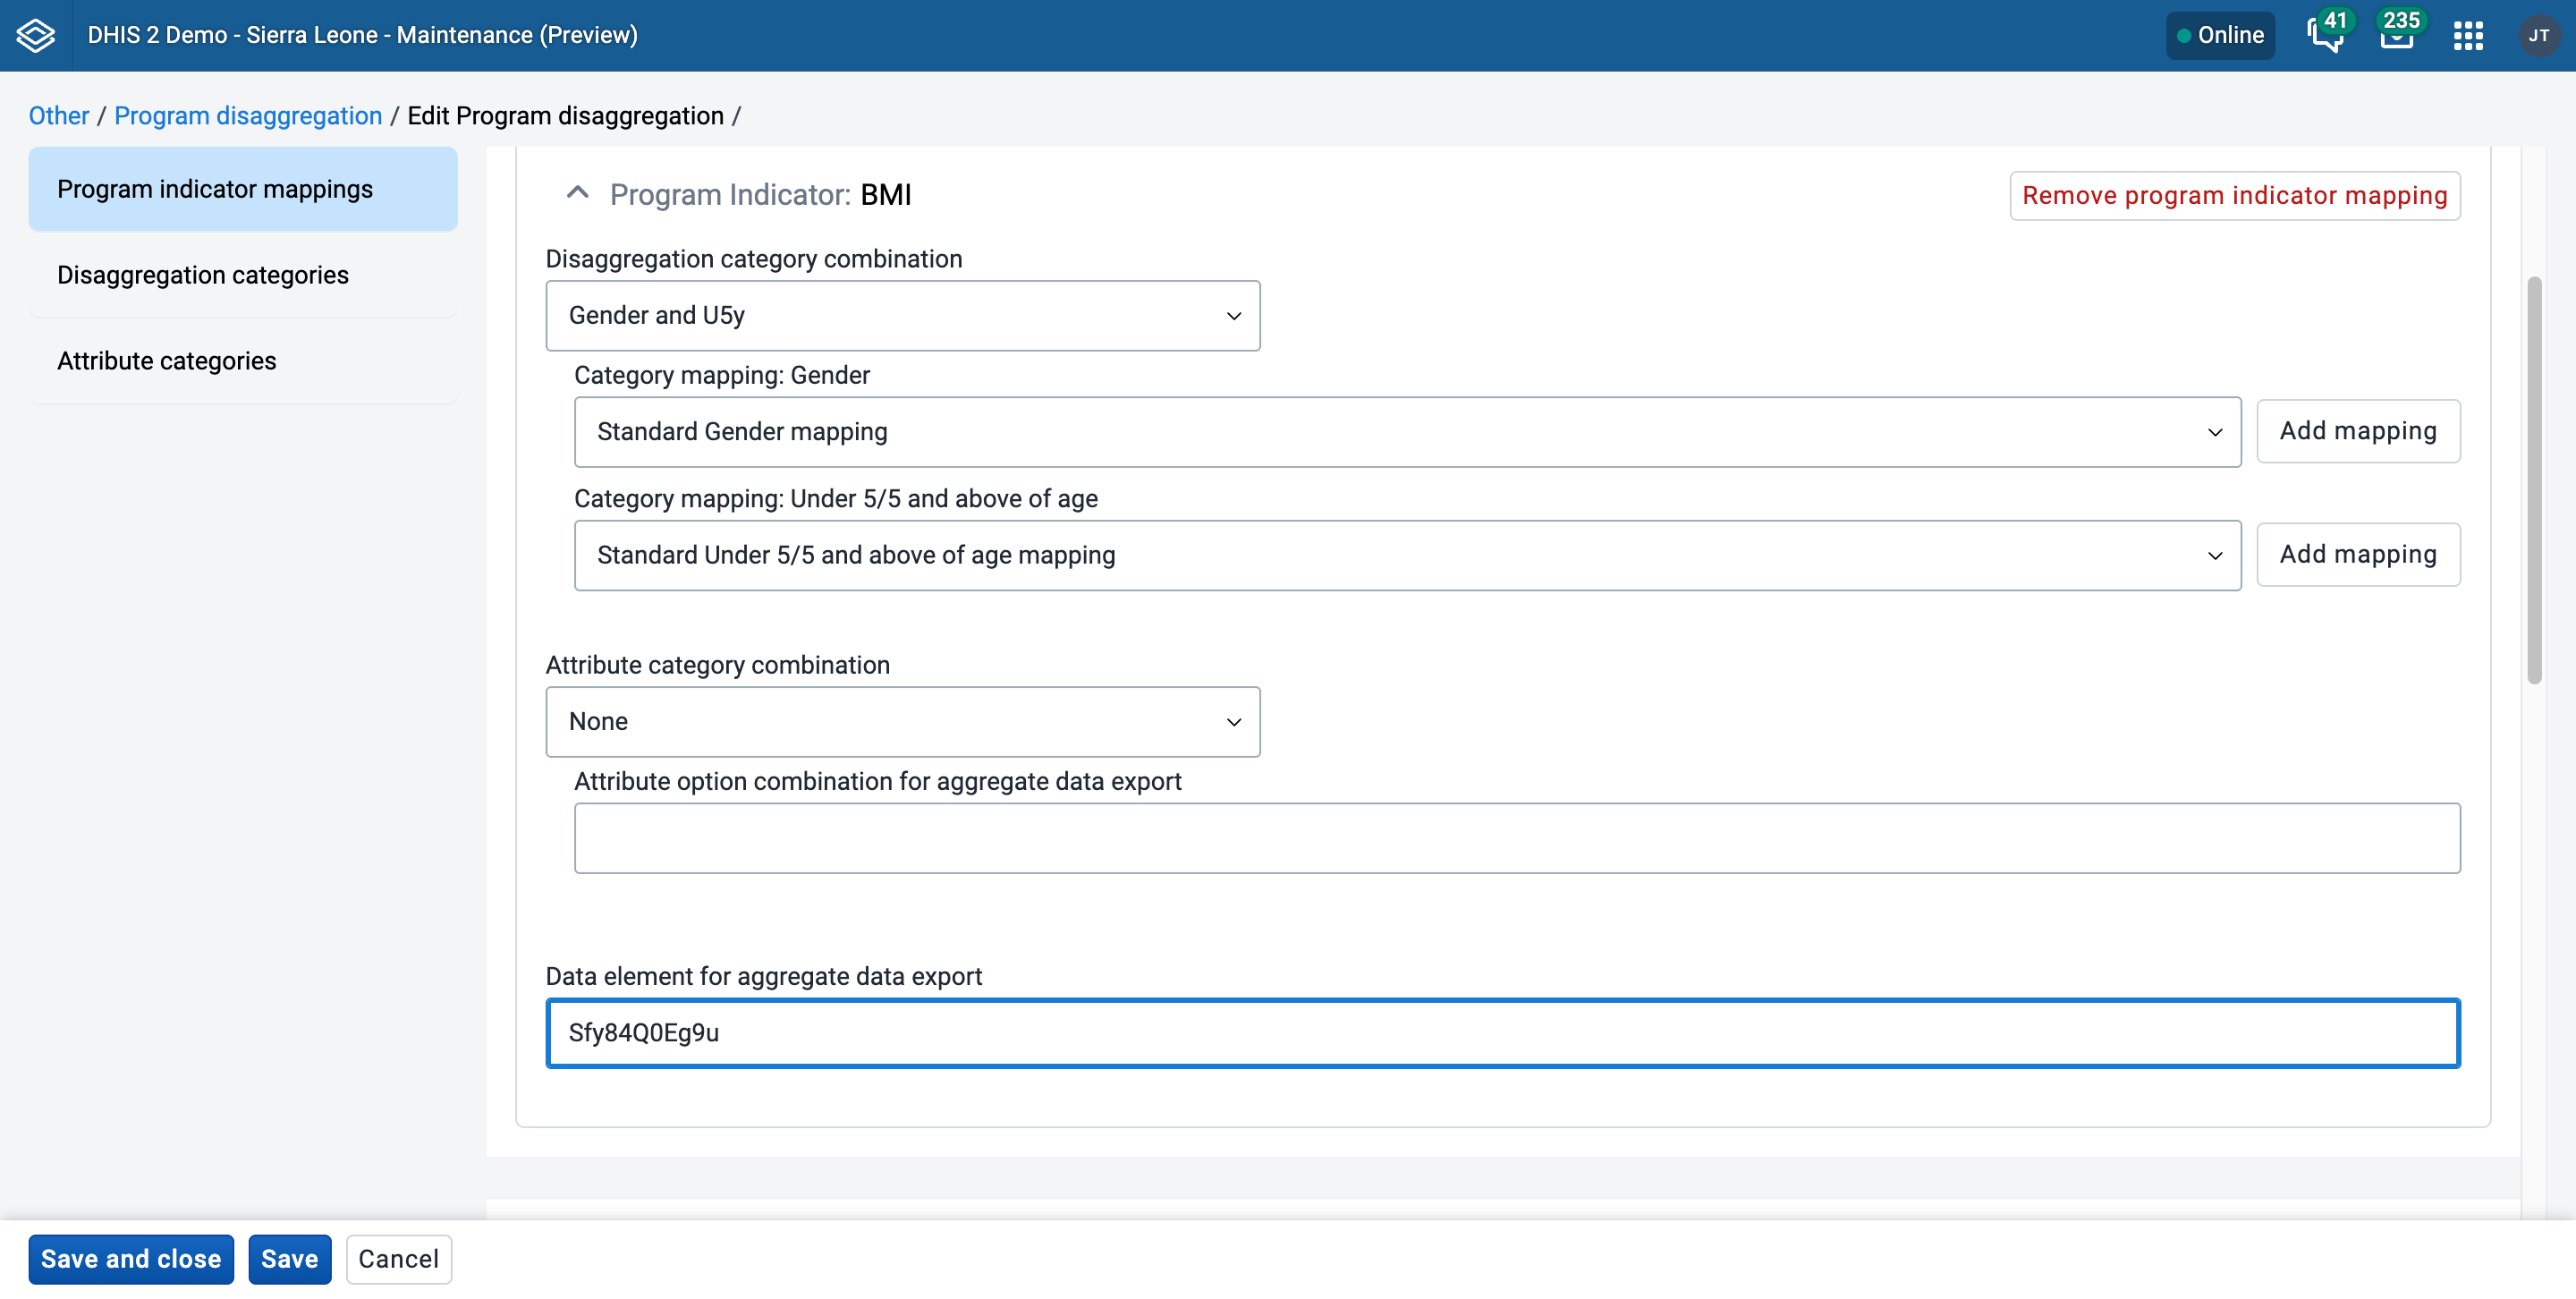
Program rules allow you to create and control dynamic behaviour of the user interface in the Tracker Capture and Event Capture apps. During data entry, the program rules expressions are evaluated each time the user interface is displayed, and each time a data element is changed. Most types of actions will take effect immediately when the user enters values in the Tracker Capture and Event Capture apps.
| Program rule component | Description |
|---|---|
| Program rule action | Each program rule contains one or multiple actions. These are the behaviours that are triggered in the user interface when the expression is true. Actions will be applied at once if the expression is true, and will be reverted if the expression is no longer true. There are several types of actions and you can have several actions in one program rule. |
| Program rule expression | Each program rule has a single expression that determines whether the program rule actions should be triggered, if the expression evaluates to true. If the expression is true the program rule is in effect and the actions will be executed. If the expression is false, the program rule is no longer in effect and the actions will no longer be applied. You create the expression with standard mathematical operators, custom functions, user-defined static values and program rule variables. The program rule variables represent attribute and data element values which will be evaluated as part of the expression. |
| Program rule variable | Program rule variables lets you include data values and attribute values in program rule expressions. Typically, you'll have to create one or several program rule variables before creating a program rule. This is because program rules expressions usually contain at least one data element or attribute value to be meaningful. The program rule variables are shared between all rules in your program. When you create multiple program rules for the same program, these rules will share the same library of program rule variables. |
In the Maintenance app, you manage the following program rule objects:
| Object type | Available functions |
|---|---|
| Program rule | Create, edit, clone, delete, show details and translate |
| Program rule variable | Create, edit, clone, share, delete, show details and translate |
In the Maintenance app, create program rule variable(s) if needed.
In the Maintenance app, create the program rule:
Enter the program rule details.
Create the program rule expression.
Define the program rule actions.
In the Tracker Capture or Event Capture apps, verify that the program rule behaves as expected.
Open the Maintenance app and click Program > Program rule variable.
Click the add button.
Select a Program and enter a Name
Please note that the name of the program may not contain any of the following excluded keywords: - and - or - not
Select if you want to Use code for option set.
This option is only effective when the data element or tracked entity attribute is connected to an option set. If you don't select this option, the program rule variable will be populated with the option set's name. If you select the option, the program rule variable will be populated with the option set's code instead.
Select a Source type and enter the required information.
Depending on the source type, you'll have to select, for example, a Program stage, Data element or Tracked entity attribute.
The source types determine how the program rule variable is populated with a value.
| Source type | Description |
|---|---|
| Data element from the newest event for a program stage | This source type works the same way as Data element from the newest event in the current program, except that it only evaluates values from one program stage. This source type can be useful in program rules where the same data element is used in several program stages, and a rule needs to evaluate the newest data value from within one specific stage. In order to know what event is the newest, the report date (event date) is used. If you have many events with the same report date, the system choose the one with the latest createdAt property of the event. |
| Data element from the newest event in the current program | This source type is used when a program rule variable needs to reflect the newest known value of a data element, regardless of what event the user currently has open. This source type is populated slightly differently in Tracker Capture and Event Capture apps: Tracker Capture: the program rule variable will be populated with the newest data value collected for the given data element within the enrollment. Event Capture: the program rule variable will be populated with the current events data. NB Future dates are "newer" than current or past dates. In order to know what event is the newest, the report date (event date) is used. If you have many events with the same report date, the system choose the one with the latest createdAt property of the event. |
| Data element in current event | Program rule variables with this source type will contain the data value from the same event that the user currently has open. This is the most commonly used source type, especially for skip logic (hide actions) and warning/error rules. |
| Data element from previous event | Program rule variables with this source type will contain the value from a specified data element from a previous event. Only older events is evaluated, not including the event that the user currently has open. This source type is commonly used when a data element only should be collected once during an enrollment, and should be hidden in subsequent events. Another use case is making rules for validating input where there is an expected progression from one event to the next - a rule can evaluate whether the previous value is higher/lower and give a warning if an unexpected value is entered. |
| Calculated value | Program rule variable with this source type is not connected directly to any form data - but will be populated as a result of some other program rules ASSIGN action. This variable will be used for making preliminary calculations, having a ASSIGN program rule action and assigning a value, this value can be used by other program rules - potentially making the expressions simpler and more maintainable. These variables will not be persisted and will stay in memory only during the execution of the set of program rules. Any program rule that assigns a data value to a preliminary calculated value would normally also have a priority assigned - to make sure that the preliminary calculation is done before the rule that consumes the calculated value. |
| Tracked entity attribute | Populates the program rule variable with a specified tracked entity attribute for the current enrollment. Use this is the source type to create program rules that evaluate data values entered during registration. This source type is also useful when you create program rules that compare data in events to data entered during registration. This source type is only used for tracker programs (programs with registration). |
Click Save.
Note
A program rule belongs to exactly one program.
Open the Maintenance app and click Program > Program rule.
Click the add button.
Enter the program rule details. These fields are not shown to the end user, they are only meant for the program administrator.
Program
Trigger rule only for program stage
If a program stage is selected, the program rule will only run for the selected program stage, as opposed to being run for every program stage in the program.
Name
Description
Priority
Let's say you have 16 program rules in your program. You configure the program rules with the following priority settings:
Priority 1 for program rule A
Priority 2 for program rules B - K
No priority for program rules L - P
Result: the system runs the program rules in the following order:
Program rule A
Program rules B - K (you can't find out or configure in which order the system runs these program rules)
Program rules L - P.
Click Enter program rule expression and create the program rule expression with the help of variables, functions and operators.
Click Define program rule actions and create the actions executed when the expression is true.
Click the add button, select an Action and enter the required information.
Depending on the action type, you'll have to perform different types of settings. For some action types, you must also enter free text or create expressions.
| Action type | Required settings | Description |
|---|---|---|
| Assign value | Data element to assign value to Tracked entity attribute to assign value to Program rule variable to assign value to Expression to evaluate and assign | Used to help the user calculate and fill out fields in the data entry form. The idea is that the user shouldn’t have to fill in values that the system can calculate, for example BMI. When a field is assigned a value, the user sees the value but the user can't edit it. NOTE: To assign a value to a tracked entity attribute, the user needs to open the tracked entity profile widget for the rule to trigger. Example from Immunization stock card i Zambia: The data element for vaccine stock outgoing balance is calculated based on the data element for incoming stock balance minus the data elements for consumption and wastage. Advanced use: configure an 'assign value' to do a part of a calculation and then assign the result of the calculation to a program rule variable. This is the purpose with the "Calculated value" program rule variable. |
| Display text | Display widget Static text Expression to evaluate and display after static text | Used to display information that is not an error or a warning, for example feedback to the user. You can also use this action to display important information, for example the patient's allergies, to the user. |
| Display key/value pair | Display widget Key label Expression to evaluate and display as value | Used to display information that is not an error or a warning. Example: calculate number of weeks and days in a pregnancy and display it in the format the clinician is used to see it in. The calculation is based on previous recorded data. |
| Error on complete | Data element to display error next to Tracked entity attribute to display error next to Static text Expression to evaluate and display after static text | Used whenever you've cross-consistencies in the form that must be strictly adhered to. This action prevents the user from continuing until the error is resolved. This action differs from the regular Show error since the error is not shown until the user tries to actually complete the form. If you don't select a data element or a tracked entity attribute to display the error next to, make sure you write a comprehensive error message that helps the user to fix the error. |
| Hide field | Data element to hide Tracked entity attribute to hide Custom message for blanked field | Used when you want to hide a field from the user. Custom message for blanked field allows you to define a custom message displayed to the user in case the program rule hides and blanks out the field after the user typed in or selected a value. If a hide field action hides a field that contains a value, the field will always removed. If no message is defined, a standard message will be displayed to alert the user. |
| Hide section | Program stage section to hide | Used when you want to hide a section in a program stage from the user. |
| Prevent adding new events to stage | Program stage where users will not be able to add new events | Used when you do not want users to add any more events to a program stage. Existing events will not be hidden. |
| Make field mandatory | Data element to make mandatory Tracked entity attribute to make mandatory | Used when you want to make a data element or tracked entity attribute mandatory so they have to be filled out before the form can be saved. |
| Show error | Data element to display error next to Tracked entity attribute to display error next to Static text Expression to evaluate and display after static text | Used whenever there are rules which must strictly be adhered to. The show error action prevents the user from continuing until the error is resolved. Such a strict validation should only be used when it's certain that the evaluated expression is never true unless the user has made a mistake in data entry. It's mandatory to define a message that is shown to the user when the expression is true and the action is triggered. You can select which data element or tracked entity attribute to link the error to. This will help the user to fix the error. In case several data elements or attributes are involved, select the one that is most likely that the user would need to change. |
| Show warning | Data element to display warning next to Tracked entity attribute to display warning next to Static text Expression to evaluate and display after static text | Used to give the user a warning about the entered data, but at the same time to allow the user to save and continue. You can use warnings to help the user avoid errors in the entered data, while at the same time allow the user to consciously disregard the warnings and save a value that is outside preset expectations. Static text defines the message shown to the user when the expression is true and the action is triggered. You can select which data element or tracked entity attribute to link the error to. This will help the user to fix the error. In case several data elements or attributes are involved, select the one that is most likely that the user would need to change. |
| Warning on complete | Data element to display warning next to Tracked entity attribute to display warning next to Static text Expression to evaluate and display after static text | Used to give the user a warning if he/she tries to complete inconsistent data, but at the same time to allow the user to continue. The warning is shown in a dialog when the user completes the form. Static text defines the message shown to the user when the expression is true and the action is triggered. This field is mandatory. You can select which data element or tracked entity attribute to link the error to. This will help the user to fix the error. If you don't select a data element or a tracked entity attribute to display the error next to, make sure you write a comprehensive error message that helps the user to fix the error. |
| Send Message | Message template to send | Send Message triggers a notification based on provided message template. This action will be taken immediately. The message template will be parsed and variables will be substituted with actual values. |
| Schedule Message | Message template to send Data field which contains expression to evaluate the date which notification should be sent at. If this expression results in any value other than Date, then resultant will be discarded and notification will not get scheduled. | Schedule Message will schedule notification at date provided by Expression in the data field. Sample expression is given below d2:addDays( '2018-04-20', '2' ) Message template will be parsed and variables will be substituted with actual values. |
| Schedule event | Program stage to schedule event for Expression to evaluate the scheduled date | Automatically schedules a new event for the specified program stage on the date returned by the expression. The expression must evaluate to a valid date; if it does not, no event will be scheduled. The event is only scheduled once — if the rule condition evaluates to true again, no duplicate event is created. Useful for programs where the timing of the next visit or follow-up can be derived from existing data, for example scheduling a second vaccination dose a fixed number of days after the first. Example expression that schedules an event 28 days after a recorded date: d2:addDays(#{dateOfFirstDose}, 28) |
| Hide option | Data element to hide option for Tracked entity attribute to hide option for Option that should be hidden | Used to selectively hide a single option for an option set in a given data element/tracked entity attribute. When combined with show option group the hide option takes precedence. |
| Hide option group | Data element to hide option group for Tracked entity attribute to hide option group for Option group that should be hidden | Used to hide all options in a given option group and data element/tracked entity attribute. When combined with show option group the hide option group takes precedence. |
| Show option group | Data element to show option group for Tracked entity attribute to show option group for Option group that should be shown | Used to show only options from a given option group in a given data element/tracked entity attribute. To show an option group implicitly hides all options that is not part of the group(s) that is shown. |
Click Save.
(Optional) Repeat above steps to add more actions.
Click Save.
Note
You can view all examples on the demo server: https://play.dhis2.org/dev/dhis-web-maintenance/#/list/programSection/programRule
This example shows how to configure a program rule which calculates number of weeks and days in a pregnancy and display the result in the format the clinician is used to see it in. The calculation is based on previous recorded data.


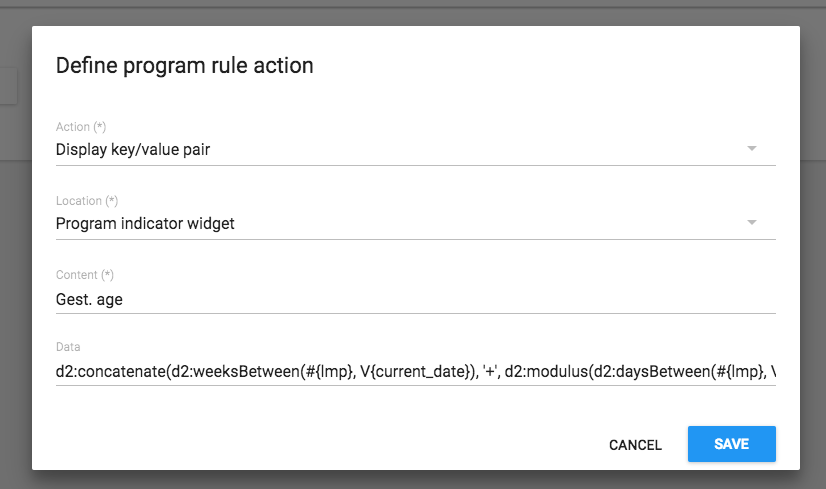
The full expression in the Data field:
d2:concatenate(d2:weeksBetween(#{lmp}, V{current_date}), '+',
d2:modulus(d2:daysBetween(#{lmp}, V{current_date}), 7))

This example shows how to configure a program rule to display text in the Feedback widget in the Tracker Capture app.
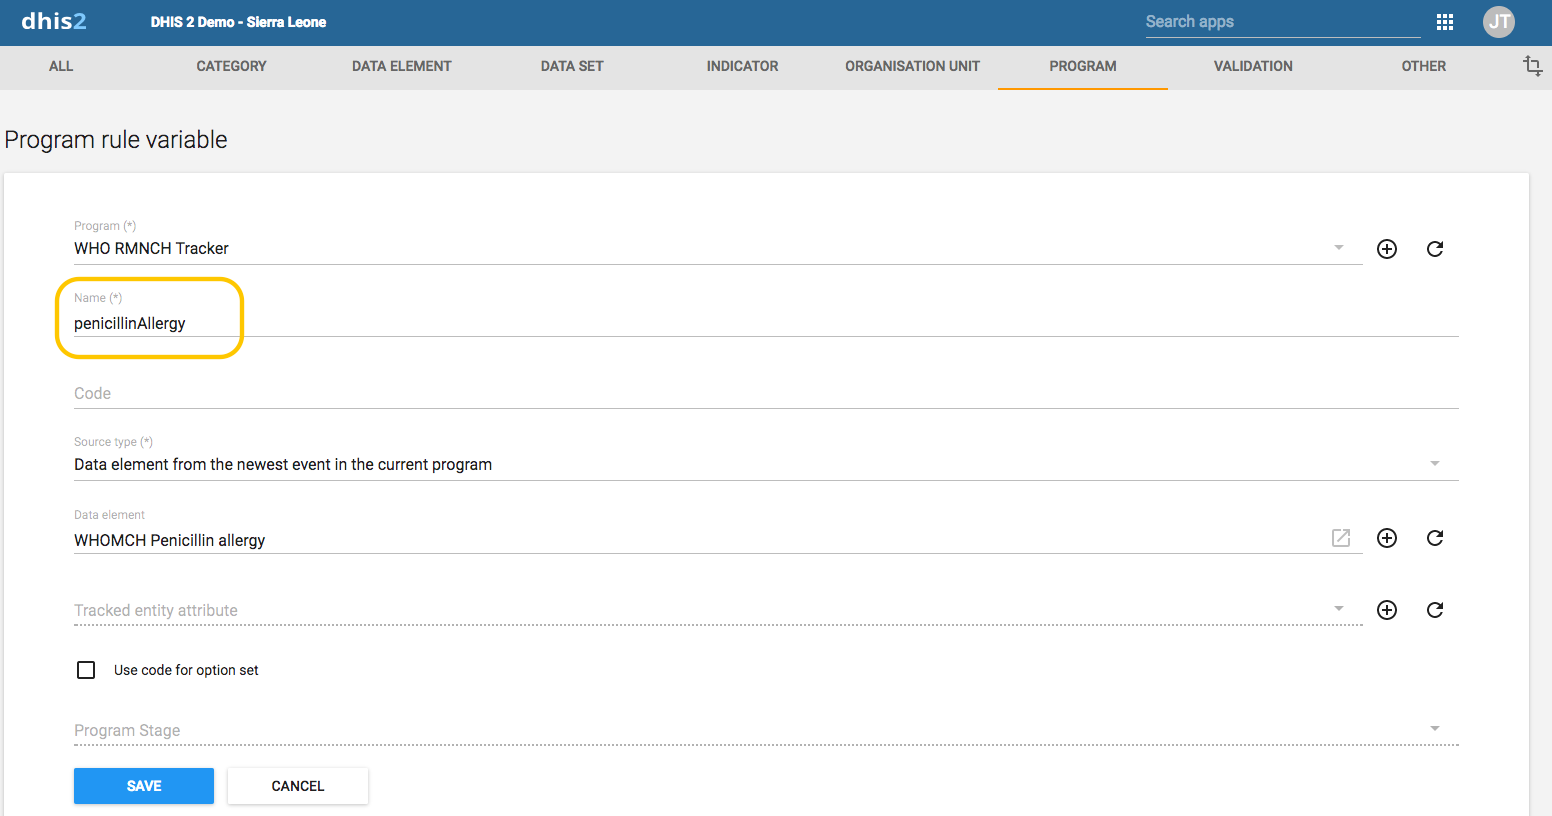
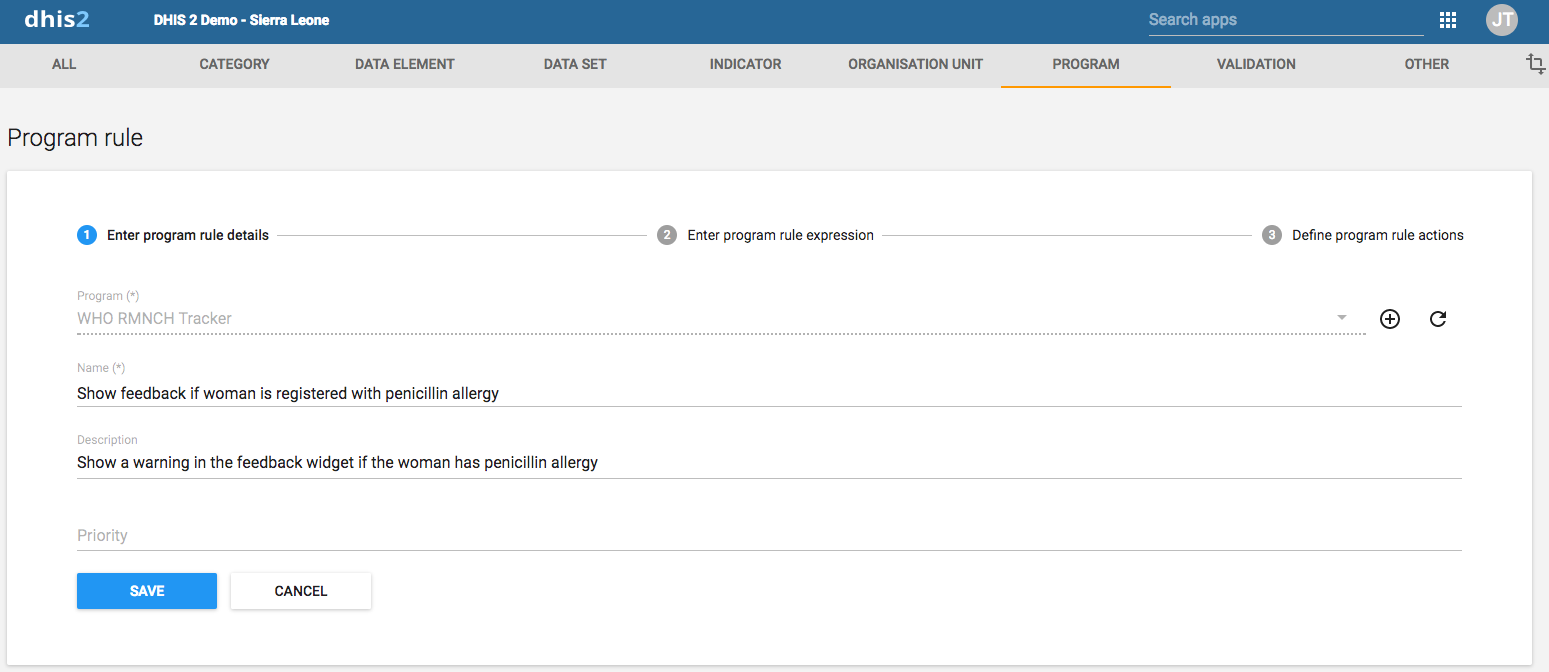

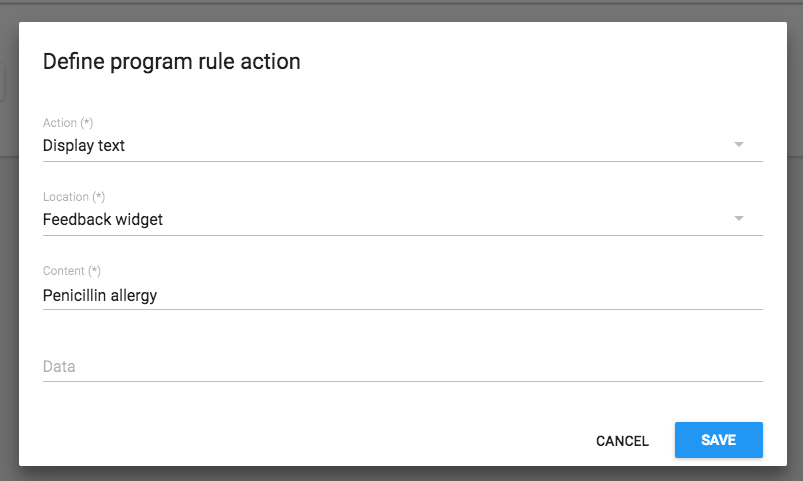

This example shows how to configure a program rule to always display certain data in the Feedback widget in the Tracker Capture app. This is useful when you want to make sure that vital data, for example medicine allergies, is always visible.
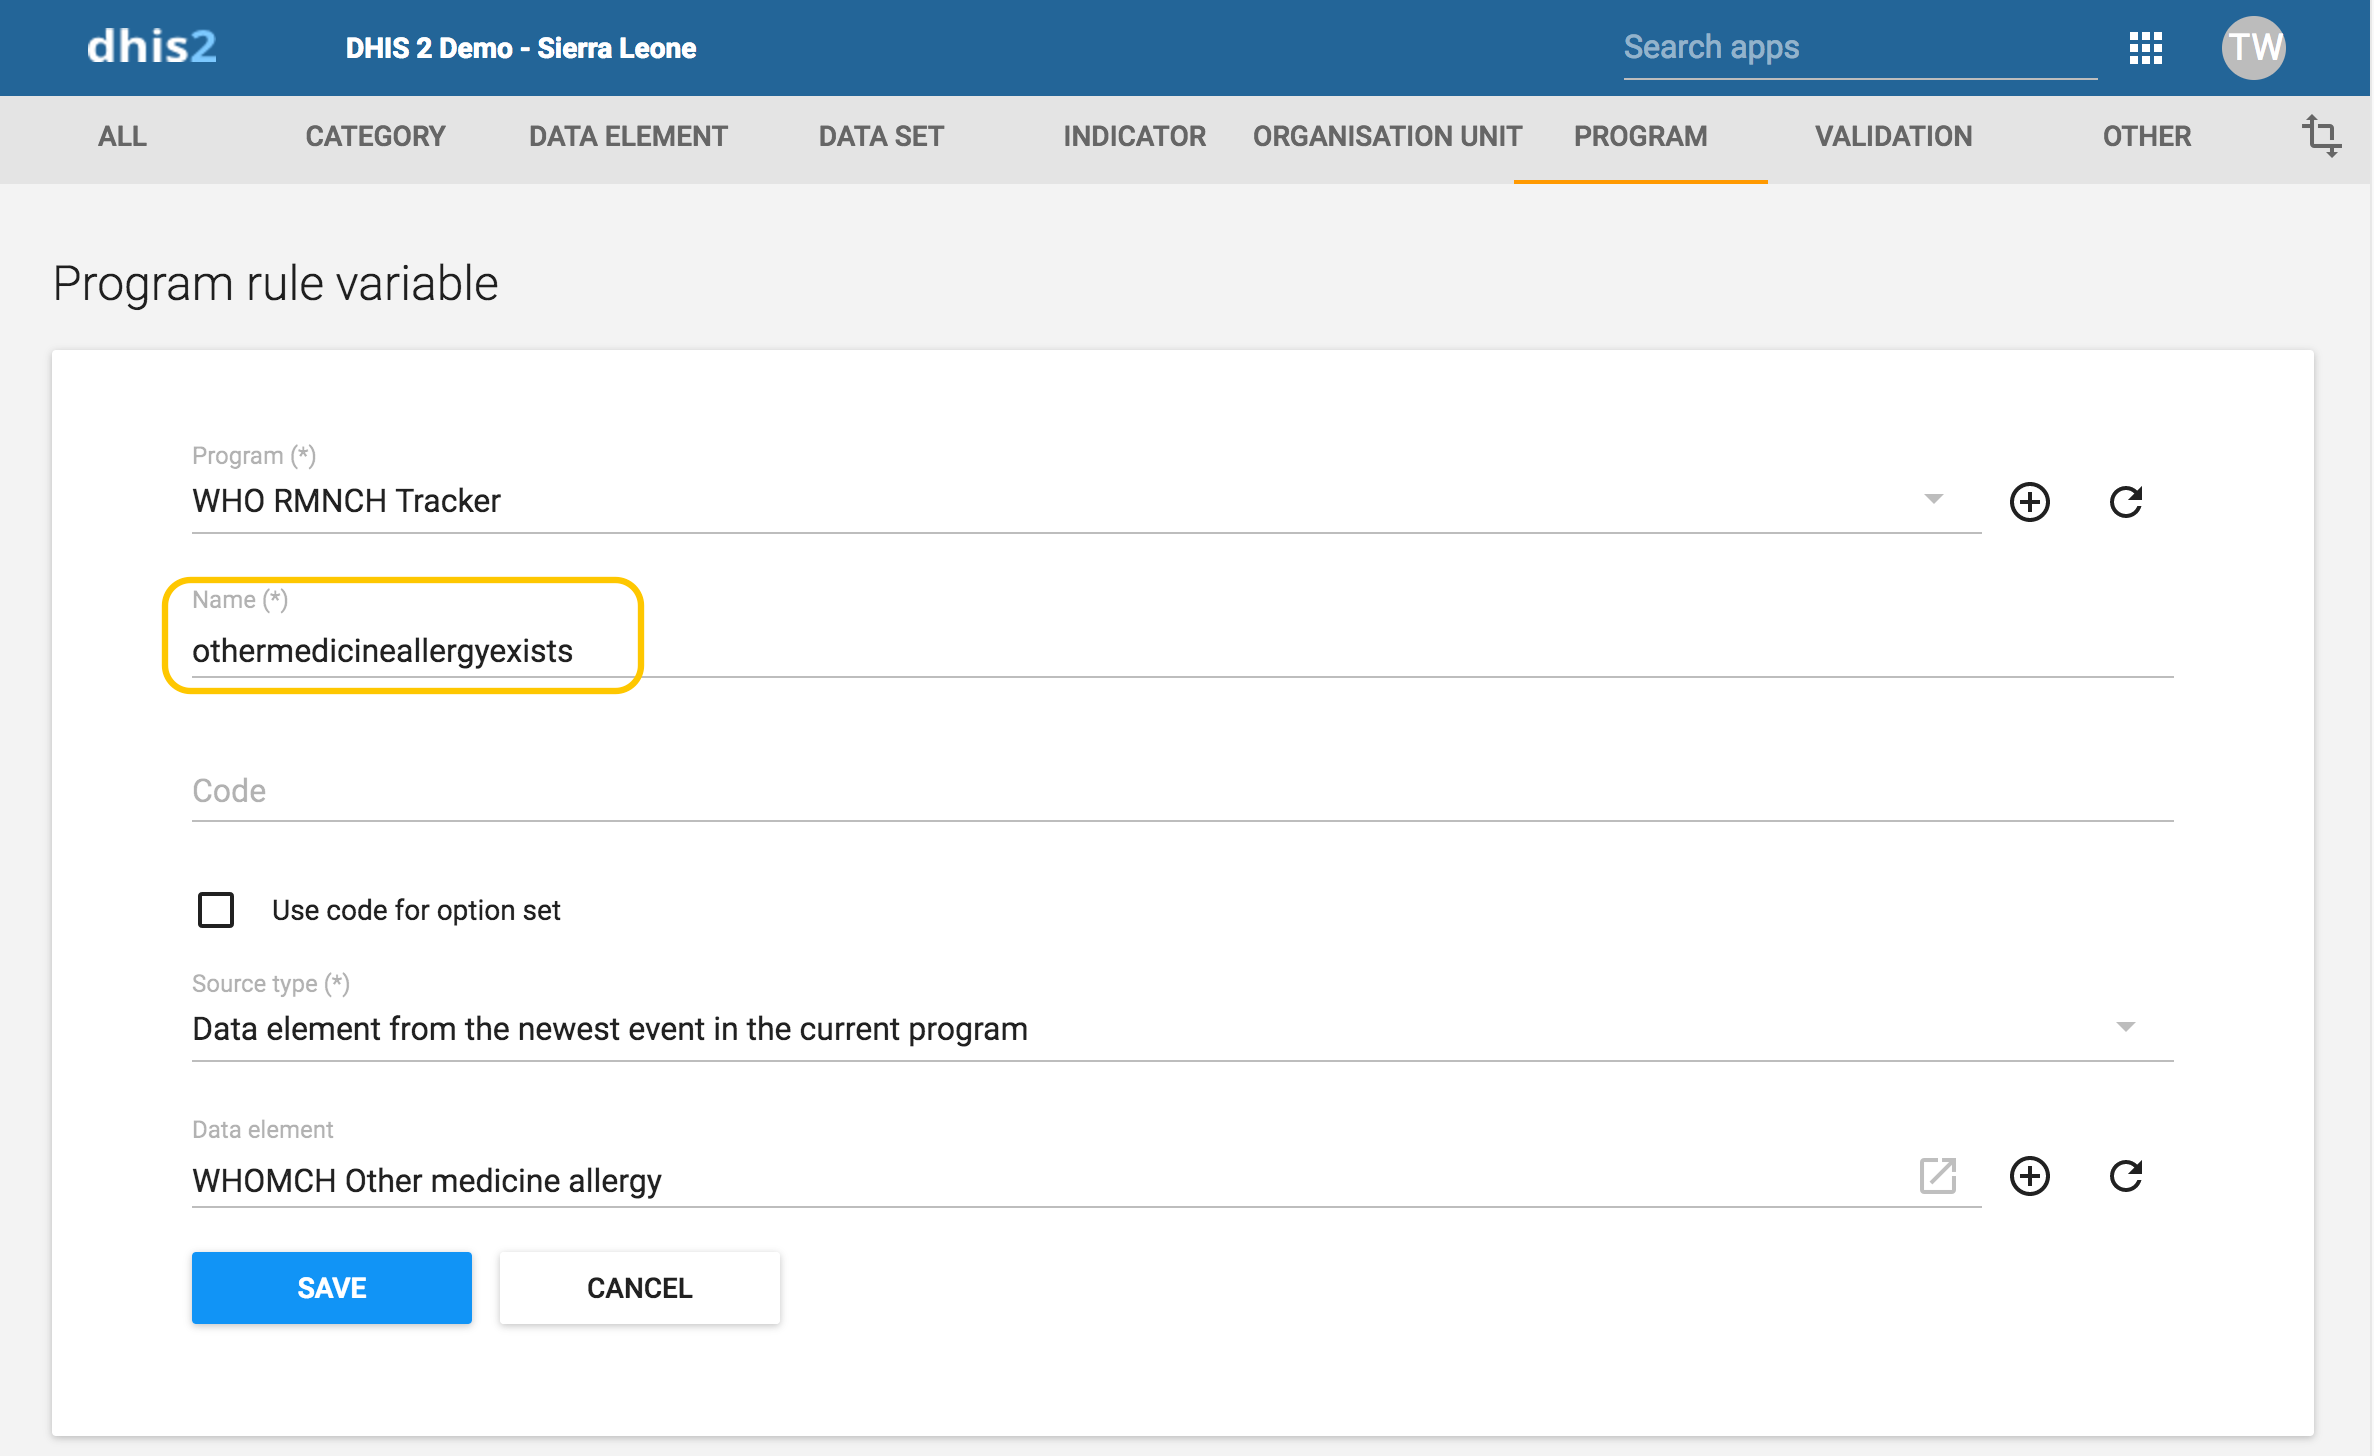
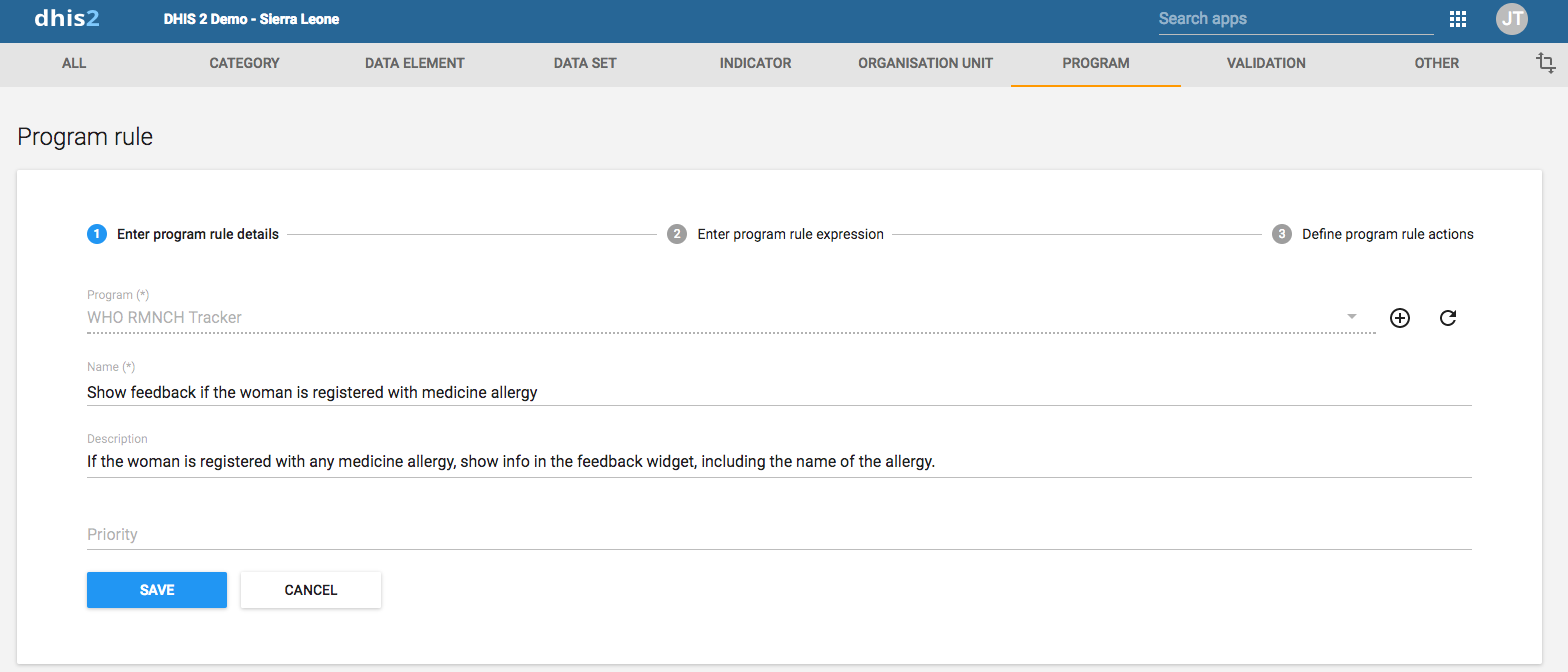

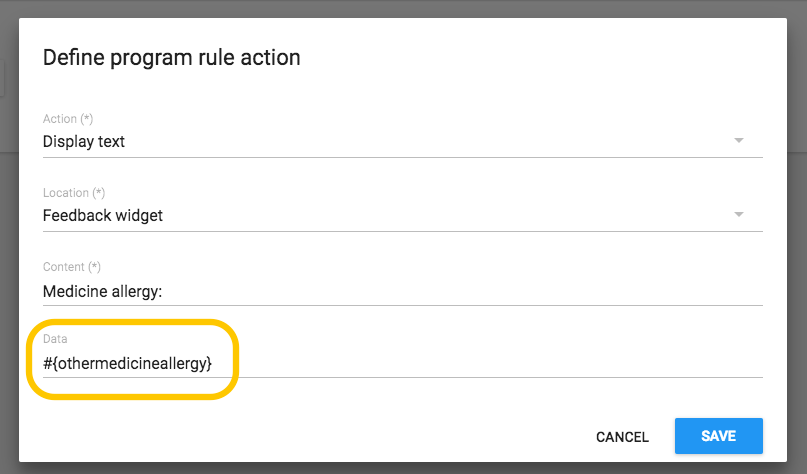
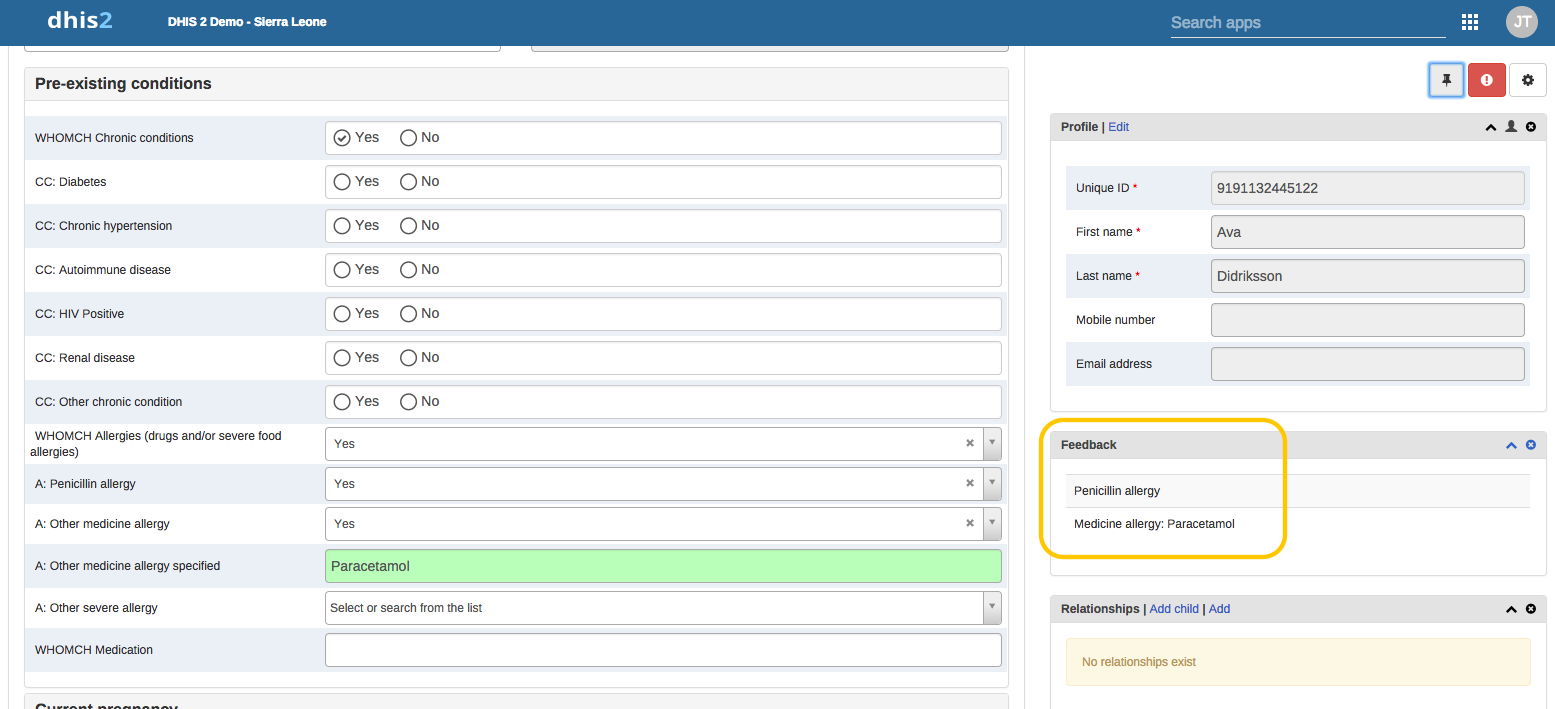

By using a program rule of type "Assign value" you can calculate the "Gestational age at visit" value and fill it in the data entry form. You configure the program rule to calculate "Gestational age at visit" based on either "LMP date" or "Ultrasound estimated due date".

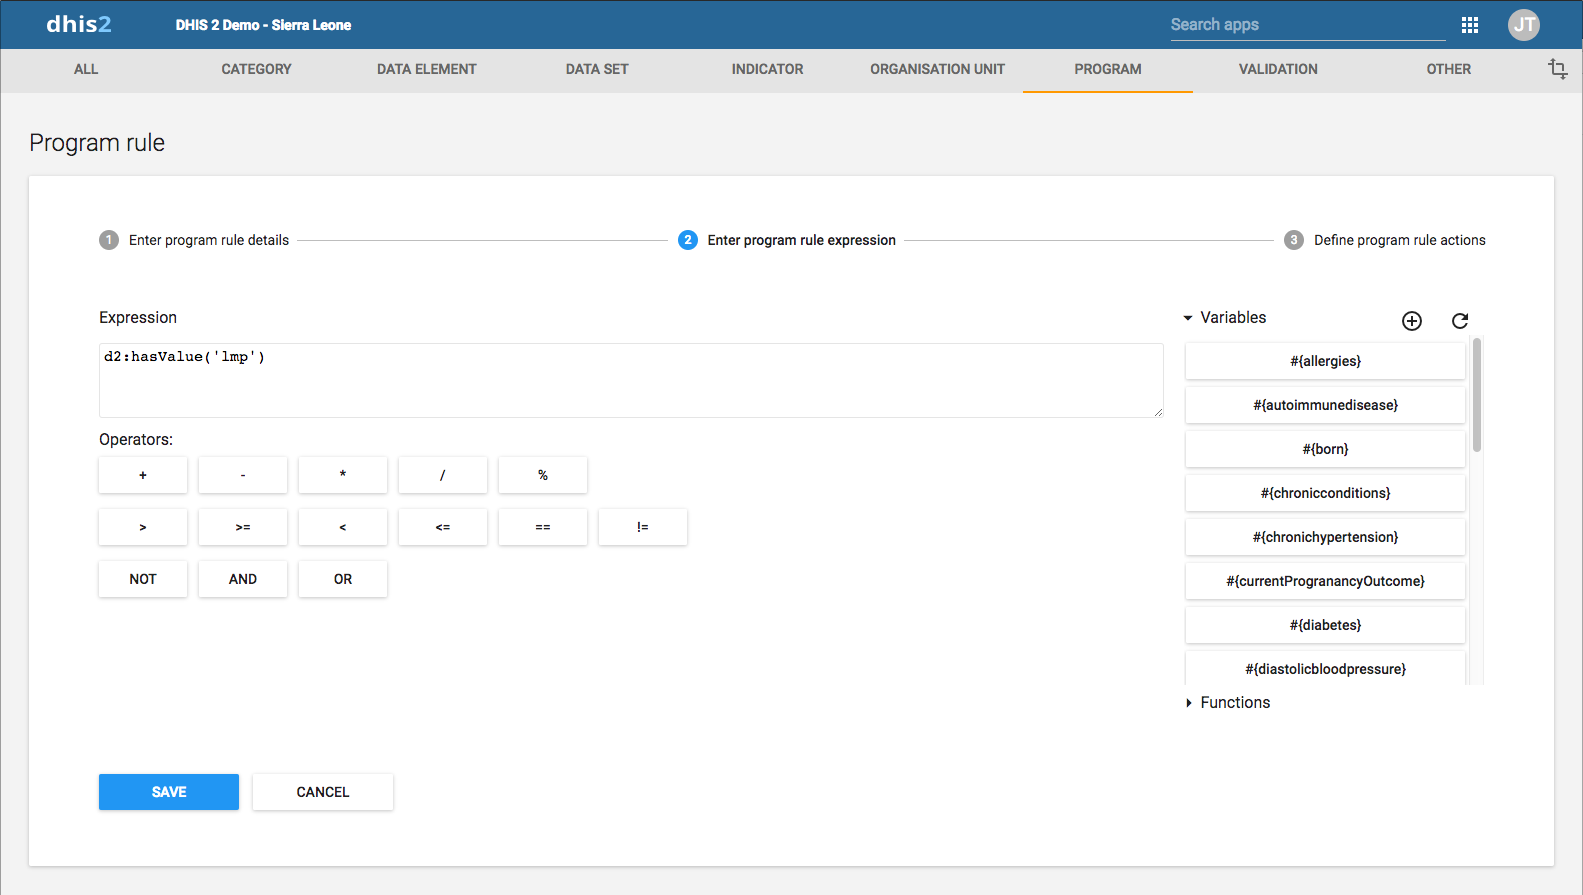
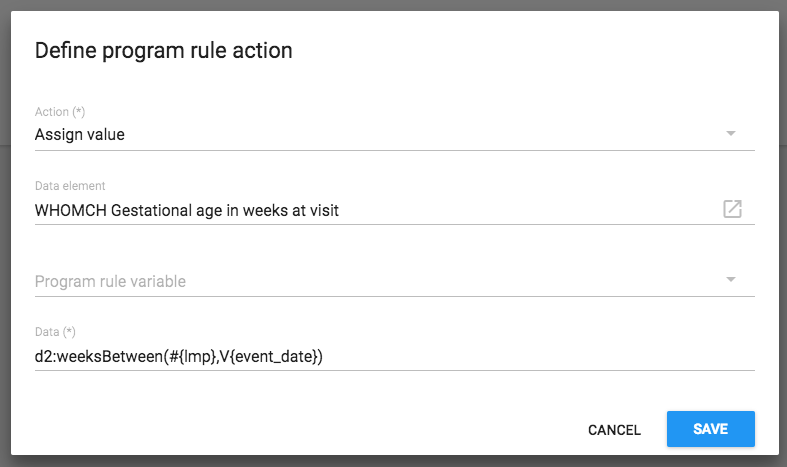
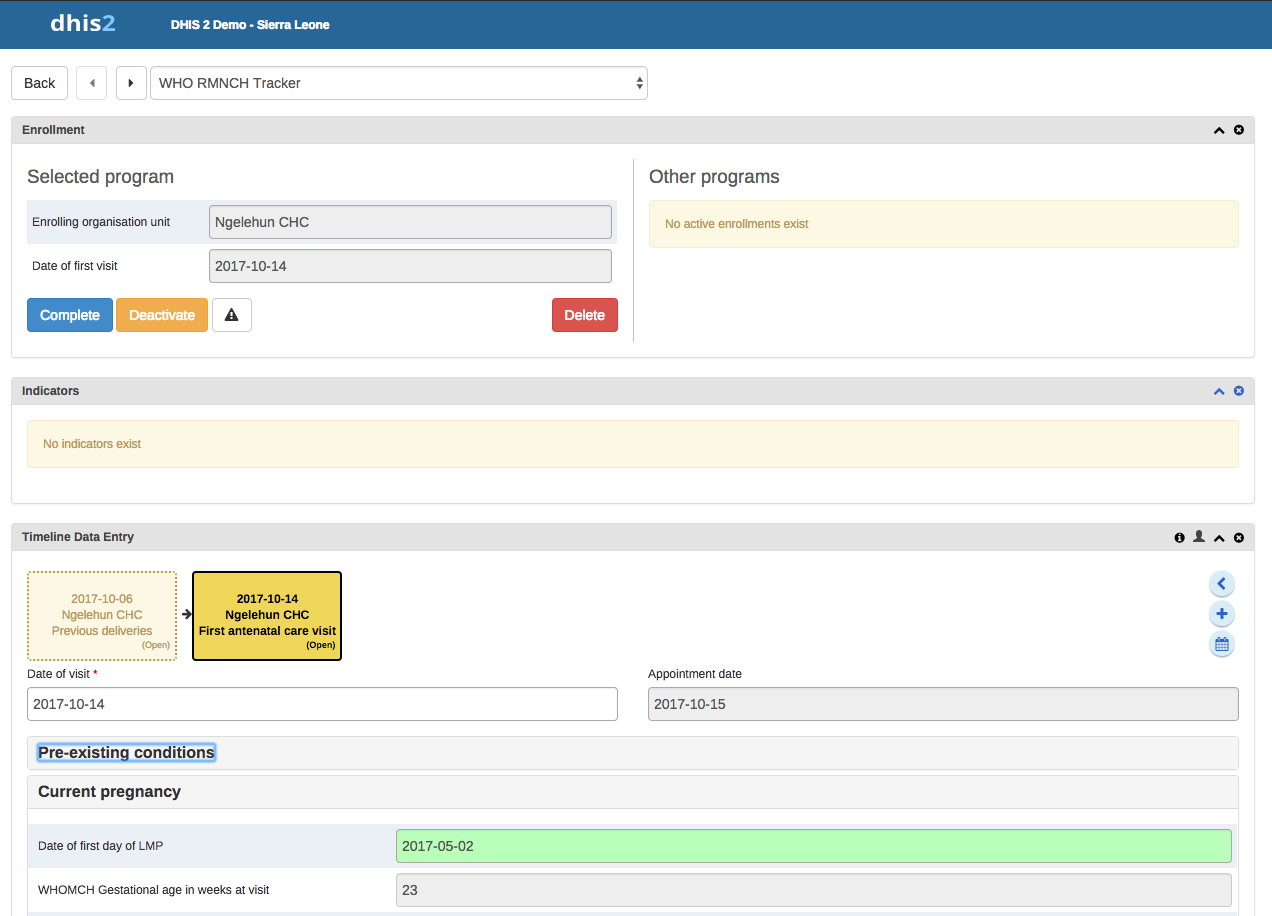
Note
When using absolute dates in program rule expressions, always use 'YYYY-MM-DD' date format irrespective of the System Date format setting.
Tip
You can nest functions within each other and with sub-expressions to form more complex conditions. An example that produces the gestational age in weeks, based on last menstrual date:
d2:floor( d2:daysBetween(#{lastMenstrualDate},V{event_date}) / 7 )
Tip
The source type will determine how the d2: function calls will evaluate a (sourcefield) parameter.
Example: where #{hemoglobinCurrent} is set to source type Data element in current event. The following function call with evaluate whether haemoglobin is entered in the current event.
d2:hasValue( 'hemoglobinCurrent' )
Example: where #{hemoglobin} is set to source type Data element from the newest event in the current program. The following function call with evaluate whether there exists a value for the haemoglobin in any event in the enrollment.
d2:hasValue( 'hemoglobin' )
Example: where #{hemoglobinPrevious} is set to source type Data element from previous event . The following function call with evaluate whether there exists a value for the haemoglobin among the events preceding the current event.
d2:hasValue( 'hemoglobinPrevious' )
| Operator | Description |
|---|---|
| + | Add numbers together |
| - | Subtract numbers from each other |
| * | Multiply two numbers |
| / | Divide two numbers |
| % | The modulus of two numbers |
| && | Logical AND. True only when the expression on the left and right side is true. The left and right side can be yes/no, yes only or a sub-expression in parenthesis. |
| || | Logical OR. True when either the expression on the left or the expression on the right side is true. The left and right side can be yes/no, yes only or a sub-expression in parenthesis. |
| > | Left number greater than right number |
| >= | Left number greater than or equal to right number |
| < | Left number less than right number |
| <= | Left number less than or equal to right number. |
| == | Left side equal to right side. Supports numbers, text, yes/no and yes only. |
| != | Left side not equal to right side. Supports numbers, text, yes/no and yes only. |
| ! | Negates the following value. Can be used for yes/no, yes only or a sub-expression in parenthesis. |
| () | Parenthesis is used to group sub-expressions. |
| Function | Arguments | Description |
|---|---|---|
| d2:addDays | (date, number) | Produces a date based on the first argument date, adding the second argument number of days. An example calculating the pregnancy due date based on the last menstrual period: d2:addDays(#{lastMenstrualDate},'283') |
| d2:ceil | (number) | Rounds the input argument up to the nearest whole number. Example: d2:ceil(#{hemoglobinValue}) |
| d2:concatenate | (object, [,object, object,...]) | Produces a string concatenated string from the input parameters. Supports any number of parameters. Will mainly be in use in future action types, for example to display gestational age with d2:concatenate('weeks','+','gestationalageDays'). |
| d2:contains | (text,text, ...) | Searches an expression for one or more substrings. Returns true if the expression contains all the substrings. For example, the following are all true: contains("abcd", "abcd"); contains("abcd", "b"); and contains("abcd", "ab", "bc"). Comparisons are case-sensitive. |
| d2:containsItems | (text,text, ...) | Searches an expression for one or more items. The expression is made up of comma-separated elements. containsItems returns true if every item exactly matches an element in the expression. For example, containsItems("abcd", "abcd") and containsItems("ab,cd", "ab", "cd") are true, but containsItems("abcd", "b") and containsItems("abcd", "ab", "bc") are false. Comparisons are case-sensitive. containsItems can be used for multi-valued data elements to see if an item is contained in the data element values. |
| d2:count | (sourcefield) | Counts the number of values that is entered for the source field in the argument. The source field parameter is the name of one of the defined source fields in the program - see example Example usage where #{previousPregnancyOutcome} is one of the source fields in a repeatable program stage "previous pregnancy":d2:count('previousPregnancyOutcome') |
| d2:countIfValue | (sourcefield,text) | Counts the number of matching values that is entered for the source field in the first argument. Only occurrences that matches the second argument is counted. The source field parameter is the name of one of the defined source fields in the program - see example. Example usage where #{previousPregnancyOutcome} is one of the source fields in a repeatable program stage "previous pregnancy". The following function will produce the number of previous pregnancies that ended with abortion:d2:countIfValue('previousPregnancyOutcome','Abortion') |
| d2:countIfZeroPos | (sourcefield) | Counts the number of values that is zero or positive entered for the source field in the argument. The source field parameter is the name of one of the defined source fields in the program - see example. Example usage where #{fundalHeightDiscrepancy} is one of the source fields in program, and it can be either positive or negative. The following function will produce the number of positive occurrences:d2:countIfZeroPos('fundalHeightDiscrepancy') |
| d2:daysBetween | (date, date) | Produces the number of days between the first and second argument. When the first argument date comes before the second argument date, the number will be positive - in the opposite case, the number will be negative. The static date format is 'yyyy-MM-dd'. Example, calculating the gestational age(in days) of a woman, based on the last menstrual period and the current event date: d2:daysBetween(#{lastMenstrualDate},V{event_date}) |
| d2:extractDataMatrixValue | Get GS1 value based on application identifier | Given a field value formatted with the gs1 data matrix standard and a string key from the GS1 application identifiers. The function looks and returns the value linked to the provided key. Example expression: d2:extractDataMatrixValue( 'gtin', A{GS1 Value} ) |
| d2:floor | (number) | Rounds the input argument down to the nearest whole number. An example producing the number of weeks the woman is pregnant. Notice that the sub-expression #{gestationalAgeDays}/7 is evaluated before the floor function is executed:d2:floor(#{gestationalAgeDays}/7) |
| d2:hasUserRole | (user role) | Returns true if current user has this role otherwise false Example expression: d2:hasUserRole('UYXOT4A3ASA') |
| d2:hasValue | (sourcefield) | Evaluates to true of the argument source field contains a value, false if no value is entered. Example usage, to find if the source field #{currentPregnancyOutcome} is yet filled in: d2:hasValue('currentPregnancyOutcome') |
| d2:inOrgUnitGroup | (text) | Evaluates whether the current organisation unit is in the argument group. The argument can be defined with either ID or organisation unit group code. The current organisation unit will be the event organisation unit when the rules is triggered in the context of an event, and the enrolling organisation unit when the rules is triggered in the event of a TEI registration form. Example expression: d2:inOrgUnitGroup('HIGH_RISK_FACILITY') |
| d2:inUserGroup | (text) | Returns true if current user is part of this user group otherwise false. The user group is defined by the ID. Example expression: d2:inUserGroup('HrXOT4trAFG') |
| d2:lastEventDate | Get the last event date for entered data | Gets the event date when the underlying data element was entered in the previous event in a program stage |
| d2:left | (text, num-chars) | Evaluates to the left part of a text, num-chars from the first character. The text can be quoted or evaluated from a variable: d2:left(#{variableWithText}, 3) |
| d2:length | (text) | Find the length of a string. Example: d2:length(#{variableWithText}) |
| d2:maxValue | Get maximum value for provided item | Function gets maximum value of provided data element across entire enrollment. Example expression: d2:maxValue( 'blood-pressure' ) |
| d2:minValue | Get minimum value for provided item | Function gets minimum value of provided data element across entire enrollment. Example expression: d2:minValue( 'blood-pressure' ) |
| d2:modulus | (number,number) | Produces the modulus when dividing the first with the second argument. An example producing the number of days the woman is into her current pregnancy week: d2:modulus(#{gestationalAgeDays},7) |
| d2:monthsBetween | (date, date) | Produces the number of full months between the first and second argument. When the first argument date comes before the second argument date, the number will be positive - in the opposite case, the number will be negative. The static date format is 'yyyy-MM-dd'. |
| d2:oizp | (number) | Evaluates the argument of type number to one if the value is zero or positive, otherwise to zero. |
| d2:right | (text, num-chars) | Evaluates to the right part of a text, num-chars from the last character. The text can be quoted or evaluated from a variable: d2:right(#{variableWithText}, 2) |
| d2:round | (number [, decimals]) | Rounds the input argument to the nearest integer. An optional second argument can be provided to specify a number of decimal places to which the number is to be rounded. Example: d2:round(1.25, 1) = 1.3 |
| d2:substring | (text, start-char-num, end-char-num) | Evaluates to the part of a string specified by the start and end character number. Example expression: d2:substring(#{variableWithText}, 1, 3) If the #{variableWithText} in the above example was 'ABCD', then the result of the evaluation would be 'BC' |
| d2:split | (text, delimiter, element-num) | Split the text by delimiter, and keep the nth element(0 is the first). The text can be quoted or evaluated from a variable, the delimiter must be quoted: d2:split(#{variableWithText}, '-', 1) Note: comma delimiter(,) is not supported. |
| d2:validatePattern | (text, regex-pattern) | Evaluates to true if the input text is an exact match with the supplied regular expression pattern. The regular expression needs to be escaped. Example expression, triggering actions if a number is not on the pattern 9999/99/9: !d2:validatePattern(A{nrc},'\\d{6}\/\\d{2}\/\\d') Example expression, triggering actions that if the address is not consisting of letters or white spaces, then a white space, then a number: !d2:validatePattern(A{registrationAddress},'[\\w ]+ \\d+') Example, triggering actions if a name contains any numbers: !d2:validatePattern(A{name},'[^\\d]*') Example expression, triggering actions if a mobile number contains the illegal number sequence 555: d2:validatePattern(A{mobile} ,'.*555.*') |
| d2:weeksBetween | (date, date) | Produces the number of full weeks between the first and second argument. When the first argument date comes before the second argument date, the number will be positive - in the opposite case, the number will be negative. The static date format is 'yyyy-MM-dd'. |
| d2:yearsBetween | (date, date) | Produces the number of years between the first and second argument. When the first argument date comes before the second argument date, the number will be positive - in the opposite case, the number will be negative. The static date format is 'yyyy-MM-dd'. |
| d2:zing | (number) | Evaluates the argument of type number to zero if the value is negative, otherwise to the value itself. |
| d2:zpvc | (object, [,object, object,...]) | Returns the number of numeric zero and positive values among the given object arguments. Can be provided with any number of arguments. |
| d2:zScoreWFA | Z-Score weight for age indicator | Calculates z-score based on data provided by WHO weight-for-age indicator. e varies between -3.5 to 3.5 depending upon the value of weight. Example expression: d2:zScoreWFA( ageInMonths, weight, gender ) Gender > Gender is considered female by default. Any of the following codes can > be used to denote male: 'Male', 'MALE', 'male', 'ma', 'm', 'M', 0, false |
| d2:zScoreHFA | Z-Score height for age indicator | Calculates z-score based on data provided by WHO height-for-age indicator. Its value varies between -3.5 to 3.5 depending upon the value of height. Example expression: d2:zScoreHFA( ageInMonths, height, gender ) |
| d2:zScoreWFH | Z-Score weight for height indicator | Calculates z-score based on data derived from the WHO weight-for-length and weight-for-height indicators. The data used for girls can be found here and for boys here. Its value varies between -3.5 to 3.5 depending upon the value of the weight. Example expression: d2:zScoreWFH( height, weight, gender ) |
| AI | Data Title | Description | Fixed Length |
|---|---|---|---|
| 00 | SSCC | SSCC (Serial Shipping Container Code) | 20 |
| 01 | GTIN | Global Trade Item Number | 16 |
| 02 | CONTENT | GTIN of Trade Items Contained in a logistic unit | 16 |
| 10 | LOT_NUMBER | Batch or lot number | Variable |
| 11 | PROD_DATE | Production date (YYMMDD) | 8 |
| 12 | DUE_DATE | Due date (YYMMDD) | 8 |
| 13 | PACK_DATE | Packaging date (YYMMDD) | 8 |
| 15 | BEST_BEFORE_DATE | Best before date (YYMMDD) | 8 |
| 16 | SELL_BY | Sell by date (YYMMDD) | 8 |
| 17 | EXP_DATE | Expiration date (YYMMDD) | 8 |
| 20 | VARIANT | Internal Product variant | 4 |
| 21 | SERIAL_NUMBER | Serial number | Variable |
| 22 | CPV | Consumer product variant | Variable |
| 235 | TPX | Third Party Controlled, Serialised Extension of Global Trade Item Number (GTIN) (TPX) | Variable |
| 240 | ADDITIONAL_ID | Additional product identification assigned by the manufacturer | Variable |
| 241 | CUSTOMER_PART_NUMBER | Customer part number | Variable |
| 242 | MTO_VARIANT_NUMBER | Made-to-Order Variation Number | Variable |
| 243 | PCN | Packaging component number | Variable |
| 250 | SECONDARY_SERIAL | Secondary serial number | Variable |
| 251 | REF_TO_SOURCE | Reference to source entity | Variable |
| 253 | GDTI | Global Document Type Identifier | Variable |
| 254 | GLN_EXTENSION_COMPONENT | GLN Extension component | Variable |
| 255 | GCN | Global Coupon Number (GCN) | Variable |
| 30 | VAR_COUNT | Variable count | Variable |
| 310* | NET_WEIGHT_KG | Net weight, kilograms (variable measure trade item | Variable |
| 311* | LENGTH_M | Length or first dimension, metres (variable measure trade item) | Variable |
| 312* | WIDTH_M | Width, diameter, or second dimension, metres (variable measure trade item) | Variable |
| 313* | HEIGHT_M | Depth, thickness, height, or third dimension, metres (variable measure trade item) | Variable |
| 314* | AREA_M2 | Area, square metres (variable measure trade item) | Variable |
| 315* | NET_VOLUME_L | Net volume, litres (variable measure trade item) | Variable |
| 316* | NET_VOLUME_M3 | Net volume, cubic metres (variable measure trade item) | Variable |
| 320* | NET_WEIGHT_LB | Net weight, pounds (variable measure trade item) | Variable |
| 321* | LENGTH_I | Length or first dimension, inches (variable measure trade item) | Variable |
| 322* | LENGTH_F | Length or first dimension, feet (variable measure trade item) | Variable |
| 323* | LENGTH_Y | Length or first dimension, yards (variable measure trade item) | Variable |
| 324* | WIDTH_I | Width, diameter, or second dimension, inches (variable measure trade item) | Variable |
| 325* | WIDTH_F | Width, diameter, or second dimension, feet (variable measure trade item) | Variable |
| 326* | WIDTH_Y | Width, diameter, or second dimension, yards(variable measure trade item) | Variable |
| 327* | HEIGHT_I | Depth, thickness, height, or third dimension, inches (variable measure trade item) | Variable |
| 328* | HEIGHT_F | Depth, thickness, height, or third dimension, feet (variable measure trade item) | Variable |
| 329* | HEIGHT_Y | Depth, thickness, height, or third dimension, yards (variable measure trade item) | Variable |
| 330* | GROSS_WEIGHT_GF | Logistic weight, kilograms | Variable |
| 331* | LENGTH_M_LOG | Length or first dimension, metres | Variable |
| 332* | WIDTH_M_LOG | Width, diameter, or second dimension, metres | Variable |
| 333* | HEIGHT_M_LOG | Depth, thickness, height, or third dimension, metres | Variable |
| 334* | AREA_M2_LOG | Area, square metres | Variable |
| 335* | VOLUME_L_LOG | Logistic volume, litres | Variable |
| 336* | VOLUME_M3_LOG | Logistic volume, cubic metres | Variable |
| 337* | KG_PER_M2 | Kilograms per square metre | Variable |
| 340* | GROSS_WHEIGHT_LB | Logistic weight, pounds | Variable |
| 341* | LENGTH_I_LOG | Length or first dimension, inches | Variable |
| 342* | LENGTH_F_LOG | Length or first dimension, feet | Variable |
| 343* | LENGTH_Y_LOG | Length or first dimension, yards | Variable |
| 344* | WIDTH_I_LOG | Width, diameter, or second dimension, inches | Variable |
| 345* | WIDTH_F_LOG | Width, diameter, or second dimension, feet | Variable |
| 346* | WIDTH_Y_LOG | Width, diameter, or second dimension, yards | Variable |
| 347* | HEIGHT_I_LOG | Depth, thickness, height, or third dimension, inches | Variable |
| 348* | HEIGHT_F_LOG | Depth, thickness, height, or third dimension, feet | Variable |
| 349* | HEIGHT_Y_LOG | Depth, thickness, height, or third dimension, yards | Variable |
| 350* | AREA_I2 | Area, square inches (variable measure trade item) | Variable |
| 351* | AREA_F2 | Area, square feet (variable measure trade item) | Variable |
| 352* | AREA_Y2 | Area, square yards (variable measure trade item) | Variable |
| 353* | AREA_I2_LOG | Area, square inches | Variable |
| 354* | AREA_F2_LOG | Area, square feet | Variable |
| 355* | AREA_Y2_LOG | Area, square yards | Variable |
| 356* | NET_WEIGHT_T | Net weight, troy ounces (variable measure trade item) | Variable |
| 357* | NET_VOLUME_OZ | Net weight (or volume), ounces (variable measure trade item) | Variable |
| 360* | NET_VOLUME_Q | Net volume, quarts (variable measure trade item) | Variable |
| 361* | NET_VOLUME_G | Net volume, gallons U.S. (variable measure trade item) | Variable |
| 362* | VOLUME_Q_LOG | Logistic volume, quarts | Variable |
| 363* | VOLUME_G_LOG | Logistic volume, gallons U.S. | Variable |
| 364* | VOLUME_I3 | Net volume, cubic inches (variable measure trade item) | Variable |
| 365* | VOLUME_F3 | Net volume, cubic feet (variable measure trade item) | Variable |
| 366* | VOLUME_Y3 | Net volume, cubic yards (variable measure trade item) | Variable |
| 367* | VOLUME_I3_LOG | Logistic volume, cubic inches | Variable |
| 368* | VOLUME_F3_LOG | Logistic volume, cubic feet | Variable |
| 369* | VOLUME_Y3_LOG | Logistic volume, cubic yards | Variable |
| 37 | COUNT | Count of trade items or trade item pieces contained in a logistic unit | Variable |
| 390* | AMOUNT | Applicable amount payable or Coupon value, local currency | Variable |
| 391* | AMOUNT_ISO | Applicable amount payable with ISO currency code | Variable |
| 392* | PRICE | Applicable amount payable, single monetary area (variable measure trade item) | Variable |
| 393* | PRICE_ISO | Applicable amount payable with ISO currency code (variable measure trade item) | Variable |
| 394* | PRCNT_OFF | Percentage discount of a coupon | Variable |
| 395* | PRICE_UOM | Amount Payable per unit of measure single monetary area (variable measure trade item) | N4+N6 |
| 400 | ORDER_NUMBER | Customers purchase order number | Variable |
| 401 | GINC | Global Identification Number for Consignment (GINC) | Variable |
| 403 | ROUTE | Routing code | Variable |
| 410 | SHIP_TO_GLOB_LOC | Ship to / Deliver to Global Location Number (GLN) | Variable |
| 411 | BILL_TO_LOC | Bill to / Invoice to Global Location Number (GLN) | Variable |
| 412 | PURCHASED_FROM | Purchased from Global Location Number (GLN) | Variable |
| 413 | SHIP_FOR_LOG | Ship for / Deliver for - Forward to Global Location Number (GLN) | Variable |
| 414 | LOC_NUMBER | Identification of a physical location - Global Location Number (GLN) | Variable |
| 415 | PAY_TO | Global Location Number (GLN) of the invoicing party | Variable |
| 416 | PROD_SERV_LOC | Global Location Number (GLN) of the production or service location | Variable |
| 417 | PARTY | Party Global Location Number (GLN) | Variable |
| 420 | SHIP_TO_POST | Ship to / Deliver to postal code within a single postal authority | Variable |
| 421 | SHIP_TO_POST_ISO | Ship to / Deliver to postal code with ISO country code | Variable |
| 422 | ORIGIN | Country of origin of a trade item | Variable |
| 423 | COUNTRY_INITIAL_PROCESS | Country of initial processing | Variable |
| 424 | COUNTRY_PROCESS | Country of processing | Variable |
| 425 | COUNTRY_DISASSEMBLY | Country of disassembly | Variable |
| 426 | COUNTRY_FULL_PROCESS | Country covering full process chain | Variable |
| 427 | ORIGIN_SUBDIVISION | Country subdivision Of origin | Variable |
| 4300 | SHIP_TO_COMP | Ship-to / Deliver-to company name | Variable |
| 4301 | SHIP_TO_NAME | Ship-to / Deliver-to contact | Variable |
| 4302 | SHIP_TO_ADD1 | Ship-to / Deliver-to address line 1 | Variable |
| 4303 | SHIP_TO_ADD2 | Ship-to / Deliver-to address line 2 | Variable |
| 4304 | SHIP_TO_SUB | Ship-to / Deliver-to suburb | Variable |
| 4305 | SHIP_TO_LOCALITY | Ship-to / Deliver-to locality | Variable |
| 4306 | SHIP_TO_REG | Ship-to / Deliver-to region | Variable |
| 4307 | SHIP_TO_COUNTRY | Ship-to / Deliver-to country code | Variable |
| 4308 | SHIP_TO_PHONE | Ship-to / Deliver-to telephone number | Variable |
| 4310 | RTN_TO_COMP | Return-to company name | Variable |
| 4311 | RTN_TO_NAME | Return-to contact | Variable |
| 4312 | RTN_TO_ADD1 | Return-to address line 1 | Variable |
| 4313 | RTN_TO_ADD2 | Return-to address line 2 | Variable |
| 4314 | RTN_TO_SUB | Return-to suburb | Variable |
| 4315 | RTN_TO_LOCALITY | Return-to locality | Variable |
| 4316 | RTN_TO_REG | Return-to region | Variable |
| 4317 | RTN_TO_COUNTRY | Return-to country code | Variable |
| 4318 | RTN_TO_POST | Return-to postal code | Variable |
| 4319 | RTN_TO_PHONE | Return-to telephone number | Variable |
| 4320 | SRV_DESCRIPTION | Service code description | Variable |
| 4321 | DANGEROUS_GOODS | Dangerous goods flag | Variable |
| 4322 | AUTH_LEAV | Authority to leave | Variable |
| 4323 | SIG_REQUIRED | Signature required flag | Variable |
| 4324 | NBEF_DEL_DT | Not before delivery date time | Variable |
| 4325 | NAFT_DEL_DT | Not after delivery date time | Variable |
| 4326 | REL_DATE | Release date | Variable |
| 7001 | NSN | NATO Stock Number (NSN) | Variable |
| 7002 | MEAT_CUT | UN/ECE meat carcasses and cuts classification | Variable |
| 7003 | EXP_TIME | Expiration date and time | Variable |
| 7004 | ACTIVE_POTENCY | Active potency | Variable |
| 7005 | CATCH_AREA | Catch area | Variable |
| 7006 | FIRST_FREEZE_DATE | First freeze date | Variable |
| 7007 | HARVEST_DATE | Harvest date | Variable |
| 7008 | AQUATIC_SPECIES | Species for fishery purposes | Variable |
| 7009 | FISHING_GEAR_TYPE | Fishing gear type | Variable |
| 7010 | PROD_METHID | Production method | Variable |
| 7020 | REFURB_LOT | Refurbishment lot ID | Variable |
| 7021 | FUNC_STAT | Functional status | Variable |
| 7022 | REV_STAT | Revision status | Variable |
| 7023 | GIAI_ASSEMBLY | Global Individual Asset Identifier (GIAI) of an assembly | Variable |
| 703* | PROCESSOR_NUMBER | Number of processor with ISO Country Code | Variable |
| 7040 | UIC_EXT | GS1 UIC with Extension 1 and Importer index | Variable |
| 710 | NHRN_PZN | National Healthcare Reimbursement Number (NHRN) - Germany PZN | Variable |
| 711 | NHRN_CIP | National Healthcare Reimbursement Number (NHRN) - France CIP | Variable |
| 712 | NHRN_CN | National Healthcare Reimbursement Number (NHRN) - Spain CN | Variable |
| 713 | NHRN_DRN | National Healthcare Reimbursement Number (NHRN) - Brasil DRN | Variable |
| 714 | NHRN_AIM | National Healthcare Reimbursement Number (NHRN) - Portugal AIM | Variable |
| 723* | CERT_NUMBER | Certification reference | Variable |
| 7240 | PROTOCOL | Protocol ID | Variable |
| 8001 | DIMENSIONS | Roll products (width, length, core diameter, direction, splices) | Variable |
| 8002 | CMT_NUMBER | Cellular mobile telephone identifier | Variable |
| 8003 | GRAI | Global Returnable Asset Identifier (GRAI) | Variable |
| 8004 | GIAI | Global Individual Asset Identifier (GIAI) | Variable |
| 8005 | PRICE_PER_UNIT | Price per unit of measure | Variable |
| 8006 | ITIP | Identification of an individual trade item piece (ITIP) | Variable |
| 8007 | IBAN | International Bank Account Number (IBAN) | Variable |
| 8008 | PROD_TIME | Date and time of production | Variable |
| 8009 | OPTSEN | Optically Readable Sensor Indicator | Variable |
| 8010 | CPID | Component/Part Identifier (CPID) | Variable |
| 8011 | CPID_SERIAL | Component/Part Identifier serial number (CPID SERIAL) | Variable |
| 8012 | VERSION | Software version | Variable |
| 8013 | GMN | Global Model Number (GMN) | Variable |
| 8017 | GSRN_PROVIDER | Global Service Relation Number (GSRN) to identify the relationship between an organisation offering services and the provider of services | Variable |
| 8018 | GSRN_RECIPIENT | Global Service Relation Number (GSRN) to identify the relationship between an organisation offering services and the recipient of services | Variable |
| 8019 | SRIN | Service Relation Instance Number (SRIN) | Variable |
| 8020 | REF_NUMBER | Payment slip reference number | Variable |
| 8026 | ITIP_CONTENT | Identification of pieces of a trade item (ITIP) contained in a logistic unit | Variable |
| 8110 | COUPON_USA | Coupon code identification for use in North America | Variable |
| 8111 | POINTS | Loyalty points of a coupon | Variable |
| 8121 | POSITIVE_OFFER_COUPON_USA | Paperless coupon code identification for use in North America | Variable |
| 8200 | PRODUCT_URL | Extended Packaging URL | Variable |
| 90 | AGREEMENT_INTERNAL | Information mutually agreed between trading partners | Variable |
| 91 | COMPANY_INTERNAL_1 | Company internal information | Variable |
| 92 | COMPANY_INTERNAL_2 | Company internal information | Variable |
| 93 | COMPANY_INTERNAL_3 | Company internal information | Variable |
| 94 | COMPANY_INTERNAL_4 | Company internal information | Variable |
| 95 | COMPANY_INTERNAL_5 | Company internal information | Variable |
| 96 | COMPANY_INTERNAL_6 | Company internal information | Variable |
| 97 | COMPANY_INTERNAL_7 | Company internal information | Variable |
| 98 | COMPANY_INTERNAL_8 | Company internal information | Variable |
| 99 | COMPANY_INTERNAL_9 | Company internal information | Variable |
| Variable | Type | Description |
|---|---|---|
| V{current_date} | (date) | Contains the current date whenever the rule is executed. Example expression: d2:daysBetween(#{symptomDate},V{current_date}) < 0 |
| V{event_date} | (date) | Contains the event date of the current event execution. Will not have a value at the moment the rule is executed as part of the registration form. |
| V{event_status} | (string) | Contains status of the current event or enrollment. Example expression to check status is: V{event_status} == 'COMPLETED' |
| V{due_date} | (date) | This variable will contain the current date when the rule is executed. Note: This means that the rule might produce different results at different times, even if nothing else has changed. |
| V{event_count} | (number) | Contains the total number of events in the enrollment. |
| V{enrollment_date} | (date) | Contains the enrollment date of the current enrollment. Will not have a value for single event programs. |
| V{incident_date} | (date) | Contains the incident date of the current enrollment. Will not have a value for single event programs. |
| V{enrollment_id} | (string) | Universal identifier string (UID) of the current enrollment. Will not have a value for single event programs. |
| V{enrollment_status} | (string) | Contains status of the current enrollment. It can be ACTIVE, COMPLETED or CANCELLED. Example expression to check status is: V{enrollment_status} == 'COMPLETED' |
| V{event_id} | (string) | Universal identifier string (UID) of the current event context. Will not have a value at the moment the rule is executed as part of the registration form. |
| V{orgunit_code} | (string) | Contains the code of the orgunit that is linked to the current enrollment. For single event programs the code from the current event orgunit will be used instead. Example expression to check whether orgunit code starts with WB_: d2:left(V{orgunit_code},3) == 'WB_' |
| V{environment} | (string) | Contains a code representing the current runtime environment for the rules. The possible values is "WebClient", "AndroidClient" and "Server". Can be used when a program rule is only supposed to run in one or more of the client types. |
| V{program_stage_id} | (string) | Contains the ID of the current program stage that triggered the rules. This can be used to run rules in specific program stages, or avoid execution in certain stages. When executing the rules in the context of a TEI registration form the variable will be empty. |
| V{program_stage_name} | (string) | Contains the name of the current program stage that triggered the rules. This can be used to run rules in specific program stages, or avoid execution in certain stages. When executing the rules in the context of a TEI registration form the variable will be empty. |
| V{completed_date} | (string) | This variable contains completion date of event which triggered this rule. If event is not yet complete then "completed_date" contains nothing. |
A relationship represents a link between two entities in the Tracker-model. A relationship is considered data in DHIS2 and is based on a Relationship Type, similar to how a Tracked Entity is based on a Tracked Entity Type.
Relationships always include two entities, and these entities can include Tracked Entities, Enrollments and Events, and any combination of these.
[!NOTE] Note that not all of these combinations are available in the current apps. Currently in the Capture app, you can create: * Tracked Entity to Tracked Entity Relationships * Event in Event Programs to Tracked Entity Relationships (Only from the Event side) * Event in one Program Stage to Event in another Program Stage in the same Program (Related stages - see more information here)
In addition, relationships can be defined as unidirectional or bidirectional. The only functional difference is currently that these requires different levels of access to create. Unidirectional relationships requires the user to have data write access to the “from” entity and data read access for the “to” entity, while bidirectional relationships require data write access for both sides.
For more information about configuration and the meaning of 'From constraint' and 'To constraint', see Relationship model.
Open the Maintenance app and click Program > Relationship type.
Click the add button.
Type a Name of the relationship type.
(Optional) Assign a Code.
(Optional) Provide a Description of the relationship.
(Optional) Select whether the relationship should be bidirectional
Provide Relationship name seen from initiating entity. This is the name of the relationship that will be shown in the Data Entry app at the 'left' side of the relationship. E.g. in a Mother-child relationship this could be 'Mother of'.
(Optional) Provide Relationship name seen from receiving entity. This is the name of the relationship that will be shown at the 'right' side of the relationship in the Data Entry app. E.g. in a Mother-child relationship this could be 'Mother'.
Select a 'From constraint'. This limits what kind of entities can be included in the relationship. Relationship model. After selecting a 'From constraint', you have the option to choose which attributes or data elements should be shown in the relationship widget in Tracker Capture and Capture for the "From constraint". The list will vary based on the constraint:
Select a 'To constraint'. This limits what kind of entities that can be included in the relationship. Relationship model. Repeat the selection of attributes or data elements that should be shown in the relationship widget for the "To constraint".
Click Save.
A tracked entity is a type of entity which can be tracked through the system. It can be anything from persons to commodities, for example a medicine or a person.
A program must have one tracked entity. To enroll a tracked entity instance into a program, the tracked entity type of the entity and the tracked entity type of the program must be the same.
Tracked entity attributes are used to register extra information for a tracked entity. Tracked entity attributes can be shared between programs.
Open the Maintenance app and click Program > Tracked entity attribute.
Click the add button.
In the Name field, type the tracked entity attribute name.
(Optional) Type a Short name.
(Optional) Type a Form name.
(Optional) In the Code field, assign a code.
(Optional) Type a Description.
(Optional) In the Field mask field, you may type a template that's used to provide hints for correct formatting of the attribute. NOTE: So far only implemented in the DHIS2 Android Capture app, not in the Capture and Tracker Capture web apps. The following are special characters that can be used in the mask. The special characters match exactly one character of the given type.
| Character | Match |
|---|---|
| \d | digit |
| \x | lower case letter |
| \X | capital letter |
| \w | any alphanumeric character |
For example, the pattern can be used to show hyphens as needed in the input field of the data element. E.g "\d\d\d-\d\d\d-\d\d\d, would show an hyphen for every third digit.
Select an Option set.
In the Value type field, select the type of data that the tracked entity attribute will record.
| Value type | Description |
|---|---|
| Age | Dates rendered as calendar widget OR by entering number of years, months and/or days which calculates the date value based on current date. The date will be saved in the backend. |
| Coordinate | A point coordinate specified as longitude and latitude in decimal degrees. All coordinate should be specified in the format "-19.23 , 56.42" with a comma separating the longitude and latitude. |
| Date | Dates render as calendar widget in data entry. |
| Date & time | Is a combination of the DATE and TIME data elements. |
| Valid email address. | |
| File | A file resource where you can store external files, for example documents and photos. |
| Image | A file resource where you can store photos. Unlike the FILE data element, the IMAGE data element can display the uploaded image directly in forms. |
| Integer | Any whole number (positive and negative), including zero. |
| Letter | A single letter. |
| Long text | Textual value. Renders as text area with no length constraint in forms. |
| Negative integer | Any whole number less than (but not including) zero. |
| Number | Any real numeric value with a single decimal point. Thousands separators and scientific notation is not supported. |
| Percentage | Whole numbers inclusive between 0 and 100. |
| Phone number | Phone number. |
| Positive integer | Any whole number greater than (but not including) zero. |
| Positive of zero integer | Any positive whole number, including zero. |
| Organisation unit | Organisation units rendered as a hierarchy tree widget. If the user has assigned "search organisation units", these will be displayed instead of the assigned organisation units. |
| Unit interval | Any real number greater than or equal to 0 and less than or equal to 1. |
| Text | Textual value. The maximum number of allowed characters per value is 50,000. |
| Time | Time is stored in HH:mm format. HH is a number between 0 and 23 mm is a number between 00 and 59 |
| Username | DHIS2 user. Rendered as a dialog with a list of users and a search field. The user will need the "View User" authority to be able to utilise this data type. |
| Yes/No | Boolean values, renders as drop-down lists in data entry. |
| Yes only | True values, renders as check-boxes in data entry. |
Select an Aggregation type.
Table: Aggregation operators
| Aggregation operator | Description |
|---|---|
| Average | Average the values in both the period and the organisation unit dimensions. |
| Average (sum in organisation unit hierarchy) | Average of data values in the period dimension, sum in the organisation unit dimensions. |
| Count | Count of data values. |
| Min | Minimum of data values. |
| Max | Maximum of data values. |
| None | No aggregation is performed in any dimension. |
| Sum | Sum of data values in the period and organisation unit dimension. |
| Standard deviation | Standard deviation (population-based) of data values. |
| Variance | Variance (population-based) of data values. |
| program | |
| 12. Select Unique to specify that the values of the tracked entity | |
| attribute is unique. |
There are two options for the unique setting:

  - **Entire system**: The values of the tracked entity attribute
    can duplicate with values which belong to other tracked entity
    attributes. But the values in this tracked entity attribute must
    not duplicate.

    Select **Automatically generated** to allow automatic generation
    of the tracked entity attribute value. When the generate setting
    is selected on, an optional field for specifying pattern also
    displays. This field should contain a pattern based on the
    TextPattern syntax. When the value is automatically generated,
    it will be unique for this attribute for the entire system. See
    the TextPattern section for more information on how it works.

  - **Organisation unit**: The values of the tracked entity
    attribute must not duplicate in the same organisation unit.
Select Inherit to registry a new entity for relationship with an available entity, all inherit entity attribute values of the entity will be pre-filled in the registration form.
(Optional) Select Display in list without program.
(Optional) Assign one or multiple Legends.
Click Save.
Open the Maintenance app and click Program > Tracked entity type.
Click the add button or an already existing tracked entity type.
Type a Name of the tracked entity.
(Optional) select a Color and an Icon that will be used by the data capture apps to identify this tracked entity type.
(Optional) Enter a Description of the tracked entity.
(Optional) Enter a Minimum number of attributes required to search. This specifies the amount of attributes that need to be filled out in order to be able to search for this tracked entity type in a global search. See Configure Search for more information.
(Optional) Enter a Maximum number of tracked entities to return in search. This specifies the number of tracked entities that will be returned in when searching outside capture scope. See Configure Search for more information.
(Optional) Add Tracked entity type attributes. This is used to configure search, see Configure Search for more information.
(Optional) Enter an Alternative name of the tracked entity.
Click Save.
Users can be given search organisation units, which makes it possible to search for tracked entity instances outside their data capture organisation units.
Searching can be done either in the context of a program, or in the context of a tracked entity type. To give users the option of searching in the context of a program, it is necessary to configure which of the programs tracked entity attributes is searchable. To give users the option of searching in the context of a tracked entity type, you will have to configure which of the tracked entity type attributes is searchable.
To be able to search with a program, you will have to make some of the program attributes searchable. Unique program attributes will always be searchable.
Open Maintenance app and click Program
Open or create a Tracker program
Go to Attributes
If you have no attributes, add one
Set the attribute searchable
Searchable program attributes will be assigned to a search group.
Unique group. One group per unique program attribute. Unique attributes cannot be combined with other program attributes in a search. The result from the search can only be 0 or 1 tracked entity instance.
Non-unique group. This group contains all non-unique program attributes and makes it possible to combine multiple attributes in a search.
There are two limits that can be set for a program search, as part of the Program details configuration.
Maximum number of tracked entities to return: This property defines how specific a search must be, by limiting the number of matching tracked entities a user is allowed to get for their search criteria. If the number of matching records is larger than this setting, they will not be returned. The user must then provide more specific search criteria, in order to reduce the number of matching records, before they are returned. More on limits here.
NOTE
This maximum limit setting is only applied to search results when searching outside the users capture org unit. Within the capture scope, the user can see any number of results.
Note
TET = Tracked entity type
To be able to search without a program, you will have to make some of the TET attributes searchable. Unique TET attributes will always be searchable.
Open Tracked entity type app
Open a Tracked entity type
If the TET has no attributes, add one
Set the attribute searchable
Searchable TET attributes will be assigned to a search group.
Unique group. One group per unique TET attribute. Unique attributes cannot be combined with other TET attributes in a search. The result from the search can only be 0 or 1 tracked entity instance.
Non-unique group. This group contains all non-unique TET attributes and makes it possible to combine multiple attributes in a search.
There are two limits that can be set for a TET search
Maximum number of tracked entity types to return: This property defines how specific a search must be, by limiting the number of matching tracked entity types a user is allowed to get for her search criteria. If the number of matching records is larger than this maximum, they will not be returned. The user must provide more specific search criteria, in order to reduce the number of matching records, before they are returned.
NOTE
This maximum is only applied to search results outside the users capture org unit. Within the capture scope, the user can see any number of results.
To be able to search in other organisation units than the users data capture organisation units, the user must be assigned with search organisation units. Giving a user a search organisation unit will also give them access to search in all children of that organisation unit.
Open Users app
Click on a user
Open Assign search organisation units
Select organisation units
Click Save
Cloning a data element or other objects can save time when you create many similar objects.
Open the Maintenance app and find the type of metadata object you want to clone.
In the object list, click the options menu and select Clone.
Modify the options you want.
Click Save.
Note
You can only delete a data element and other data element objects if no data is associated to the data element itself.
Warning
Any data set that you delete from the system is irrevocably lost. All data entry forms, and section forms which may have been developed will also be removed. Make sure that you have made a backup of your database before deleting any data set in case you need to restore it at some point in time.
Open the Maintenance app and find the type of metadata object you want to delete.
In the object list, click the options menu and select Delete.
Click Confirm.
You can assign different sharing settings to metadata objects, for example organisation units and tracked entity attributes. These sharing settings control which users and users groups that can view or edit a metadata object.
Some metadata objects also allow you to change the sharing setting of data entry for the object. These additional settings control who can view or enter data in form fields using the metadata.
Note
The default setting is that everyone (Public access) can find, view and edit metadata objects.
Open the Maintenance app and find the type of metadata object you want to modify.
In the object list, click the context menu and select Sharing settings.
(Optional) Add users or user groups: search for a user or a user group and select it. The user or user group is added to the list.
Change sharing settings for the access groups you want to modify.
Can edit and view: The access group can view and edit the object.
Can view only: The access group can view the object.
No access (only applicable to Public access): The public won't have access to the object.
Change data sharing settings for the access groups you want to modify.
Can capture data: The access group can view and capture data for the object.
Can view data: The access group can view data for the object.
No access: The access group won't have access to data for the object.
Click Close.
Open the Maintenance app and find the type of metadata object you want to view.
In the object list, click the options menu and select Show details.
DHIS2 provides functionality for translations of database content, for example data elements, data element groups, indicators, indicator groups or organisation units. You can translate these elements to any number of locales. A locale represents a specific geographical, political, or cultural region.
Tip
To activate a translation, open the System Settings app, click > Appearance and select a language.
Open the Maintenance app and find the type of metadata object you want to translate.
In the object list, click the options menu and select Translate.
Tip
If you want to translate an organisation unit level, click directly on the Translate icon next to each list item.
Select a locale.
Type a Name, Short name and Description.
Click Save.
Multiple users can access DHIS2 simultaneously and each user can have different authorities. You can fine-tune these authorities so that certain users can only enter data, while others can only generate reports.
You can create as many users, user roles and user groups as you need.
You can assign specific authorities to user groups or individual users via user roles.
You can create multiple user roles each with their own authorities.
You can assign user roles to users to grant the users the corresponding authorities.
You can assign each user to organisation units. Then the user can enter data for the assigned organisation units.
You can set an expiration date to individual users
| Term | Definition | Example |
|---|---|---|
| Authority | A permission to perform one or several specific tasks | Create a new data element Update an organisation unit View a report |
| User | A person's DHIS2 user account | admin traore guest |
| User role | A group of authorities | Data entry clerk System administrator Antenatal care program access |
| User group | A group of users | Kenya staff Feedback message recipients HIV program coordinators |
You manager users, user roles and user groups in the Users app.
| Object type | Available functions |
|---|---|
| User | Create, edit, invite, clone, disable, display by organisation unit, delete, show details and reset password |
| User role | Create, edit, share, delete and show details |
| User group | Create, edit, join, leave, share, delete and show details |
Each user in DHIS2 must have a user account which is identified by a user name. You should register a first and last name for each user as well as contact information, for example an email address and a phone number.
It is important that you register the correct contact information. DHIS2 uses this information to contact users directly, for example sending emails to notify users about important events. You can also use the contact information to share for example dashboards and pivot tables.
A user in DHIS2 is associated with an organisation unit. You should assign the organisation unit where the user works.
When you create a user account for a district record officer, you should assign the district where he/she works as the organisation unit.
The assigned organisation unit affects how the user can use DHIS2:
In the Data Entry app, a user can only enter data for the organisation unit she is associated with and the organisation units below that in the hierarchy. For instance, a district records officer will be able to register data for her district and the facilities below that district only.
In the Users app, a user can only create new users for the organisation unit she is associated with in addition to the organisation units below that in the hierarchy.
In the Reports app, a user can only view reports for her organisation unit and those below. (This is something we consider to open up to allow for comparison reports.)
An important part of user management is to control which users are allowed to create new users with which authorities. In DHIS2, you can control which users are allowed to perform this task. The key principle is that a user can only grant authorities and access to data sets that the user itself has access to. The number of users at national, province and district level are often relatively few and can be created and managed by the system administrators. If a large proportion of the facilities are entering data directly into the system, the number of users might become unwieldy. It is recommended to delegate and decentralize this task to the district officers, it will make the process more efficient and support the facility users better.
A user role in DHIS2 is a group of authorities. An authority means the permission to perform one or more specific tasks.
A user role can contain authorities to create a new data element, update an organisation unit or view a report.
A user can have multiple user roles. If so, the user's authorities will be the sum of all authorities and data sets in the user roles. This means that you can mix and match user roles for special purposes instead of only creating new ones.
A user role is associated with a collection of data sets. This affects the Data Entry app: a user can only enter data for the data sets registered for his/her user role. This can be useful when, for example, you want to allow officers from health programs to enter data only for their relevant data entry forms.
Recommendations:
Create one user role for each position within the organisation.
Create the user roles in parallel with defining which user is doing which tasks in the system.
Only give the user roles the exact authorities they need to perform their job, not more. Only those who are supposed to perform a task should have the authorities to perform it.
A user group is a group of users. You use user groups when you set up sharing of metadata objects or notifications for example for reports or programs.
See also:
Define the positions you need for your project and identify which tasks the different positions will perform.
Create roughly one user role for each position.
Create users.
Assign user roles to the users.
Assign the users to organisation units.
(Optional) Group users in user groups.
Share datasets with users or user-groups via the Sharing Dialog in Data set management section of the Maintenance app
Tip
For users to be able to enter data, you must add them to an organisational unit level and share a dataset with them.
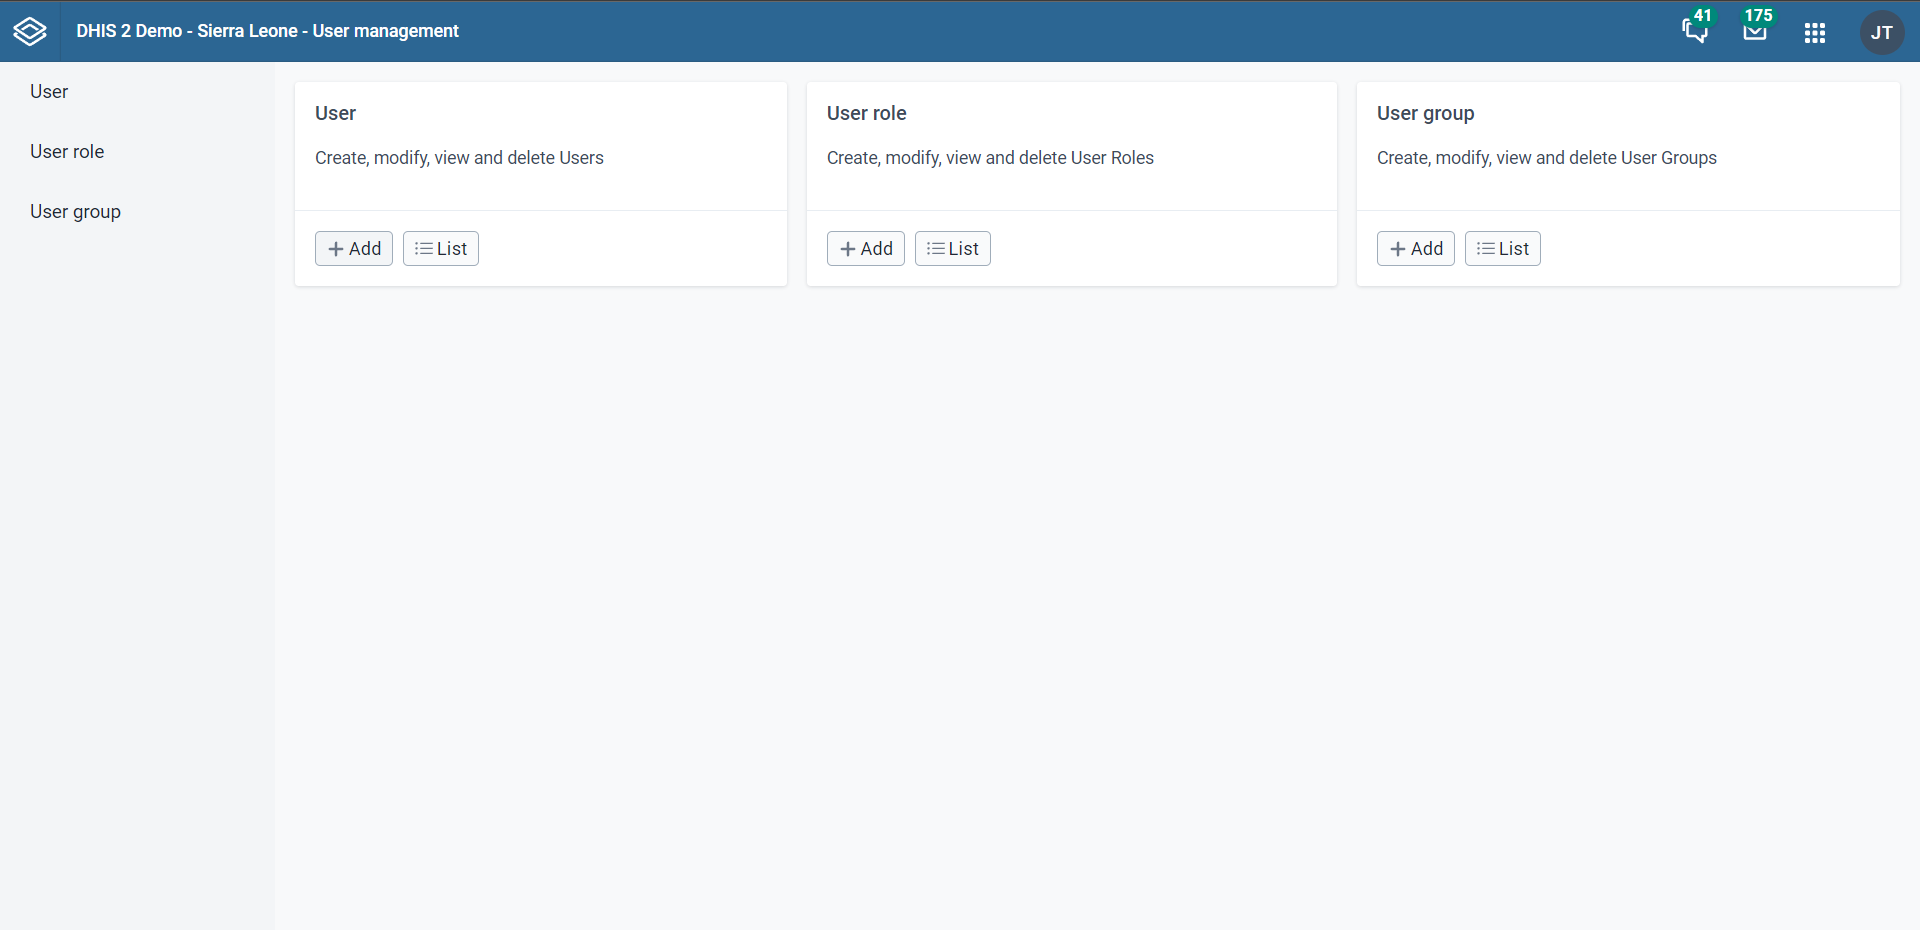
Open the Users app and click on the + in the Users card.
Select whether you want to fill in all the personal user information, or invite the user by email to complete the rest of the user information:
Create account with user details 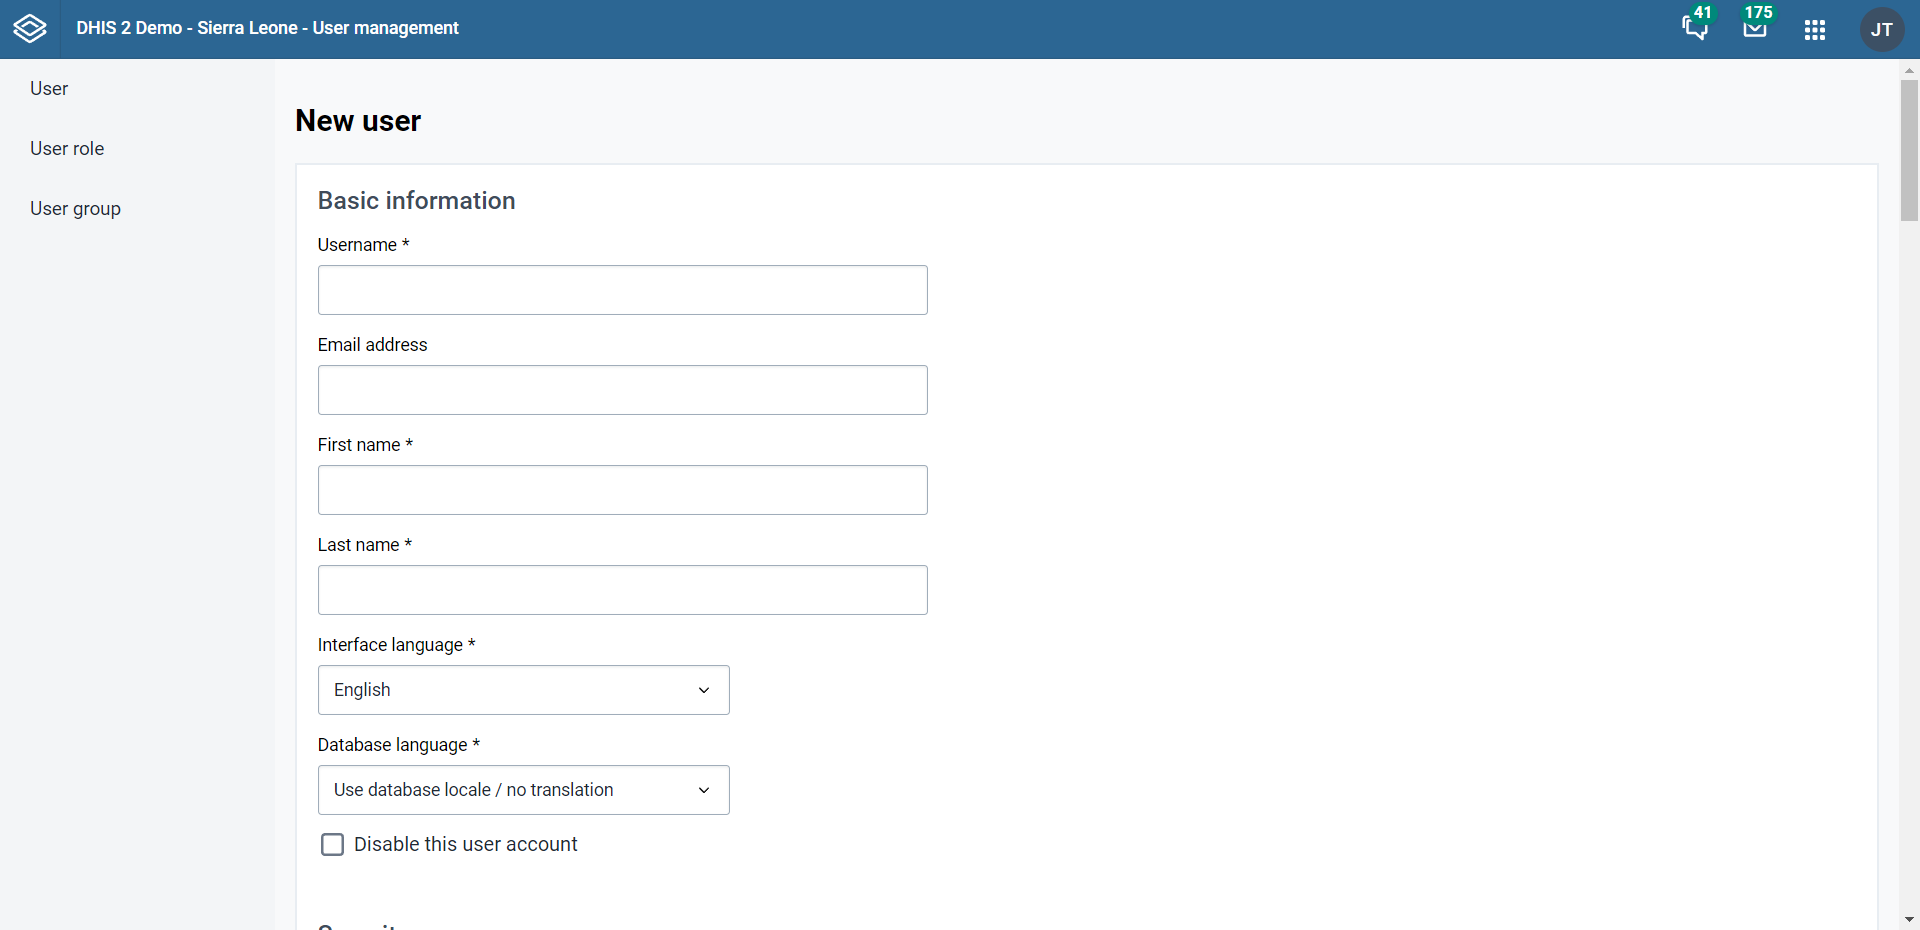 Choose this option if you would like to enter all the login details of the new user such as username, password, etc. Under these conditions, the fields username, password, surname, first name, and roles are mandatory.
After you've created the user, the account is ready for the user to use with the user name and password that you provide.
The following rules apply when you create a new username. The username must:
Contain at least 4 characters.
Not contain more than 255 characters.
Contain lowercase and UPPERCASE latin characters and numbers (a-z,A-Z,0-9).
These characters are also allowed . _ @ and #, but these may only be used as a separator, and not as a leading or trailing character, and should not be repeated (i.e. user@@name is not allowed).
Email invitation to create account 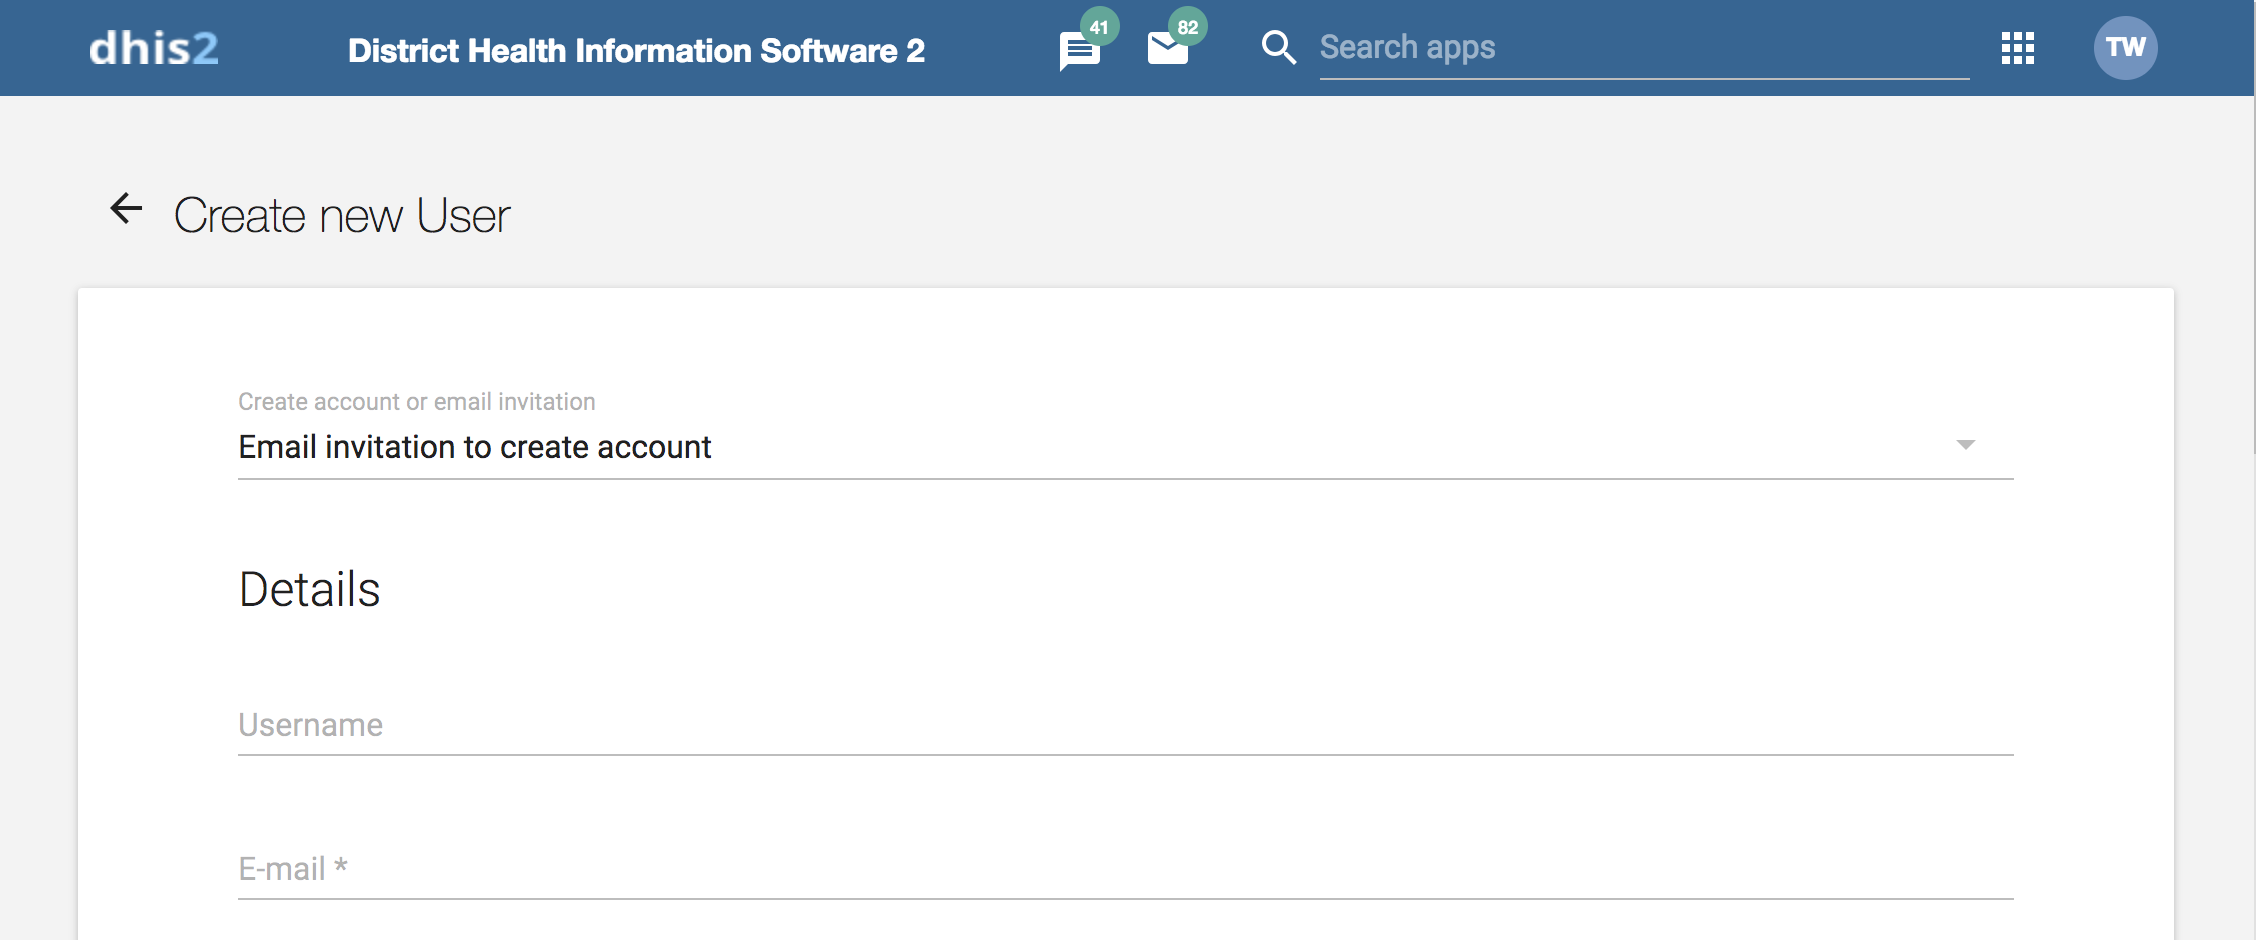 Choose this option if you want to send an invitation by email to the user. Then she/he must return to DHIS2 and finish setting up their user account. The account that the user finishes setting up will be limited according to how you configure the account.
Note
In order to use this feature the system should have a valid email configuration in SystemSettings -> Email
Enter the email address to which the invitation should be sent. If you want to, you may also enter the user name that the account will have. If you leave the user name empty, then the user may choose their own user name when they respond to the invitation (as long as it is not taken already for another user.)
After you've created the user, the system sends an email to the address you provided. It contains a unique web link by which the user can return to the system and activate their account by entering the rest of their user information. The user must finish setting up the account within 4 days, after that the invitation becomes invalid.
(Optional) Provide values for the fields OIDC mapping claim, LDAP identifier, Mobile phone number, WhatsApp, Facebook messenger, Skype, Telegram and Twitter.
Select an Interface language.
You can select a language into which fixed elements of the DHIS2 user interface have been translated.
Select a Database language.
You can select a language into which implementation-supplied items have been translated in the database, for example data element names or organisation unit level names.
In the Available roles section, double-click the user roles you want to assign to the user.
Select Data capture and maintenance organisation units.

The data capture and maintenance organisation units control for which organisation units the user can do data entry. You must assign at least one data capture and maintenance organisation unit to each user.
Users will have access to all sub-organisation units of the assigned organisation units. For example, if you've assigned a user to a district which has several facilities contained in the district, the user would have access to the district's data, as well as all of the facilities contained within the district.
(Optional) Select Data output and analysis organisation units.
The data output and analysis organisation units controls for which organisation units the user can view aggregated data in the analytics apps, for example the Pivot Table and GIS apps. You can assign any number of data output and analysis organisation units to a user.
Users will have access to all sub-organisation units of the assigned organisation units. You shouldn't select the descendants of an organisation unit which you have already selected. For example, if you've assigned the user to a district, you shouldn't select the facilities within that district.
Note
Assigning data output and analysis organisation units organisation units is optional. If you don't specify any organisation unit, the user will have access to the full organisation unit hierarchy for viewing aggregated data. As with the data capture organisation units, you should not select descendant organisation units of a unit which you have already selected.
In several places in the analytics apps, you can select "user organisation unit" for the organisation unit dimension. This mechanism will first attempt to use the data view organisation units linked to the current user. If not found, it will use the data capture and maintenance organisation units. If the user has been assigned to multiple organisation units, the use of "user organisation unit" may result in unpredictable behaviour.
Click Show more options and an additional three fields will show. (Optional)
In the Search organisation units select the organisation units you want the user to be able to search in. Searching is allowed by default for the data capture and maintenance organisation units (if no search organisation units are selected). If additional scope is provided using the search organisation units, the data capture and maintenance organisation units plus the search organisation units are the scope used during a search.
(Optional) In the Available user groups section, double-click the user groups you want to assign to the user.
(Optional) In the Available dimension restrictions for data analytics section, double-click the dimensions you want to assign to the user.
You can restrict the values the user sees in data analytics apps by selecting dimensions that will restrict the user's view.
Example
Let's say you have defined Implementing Partner as a category option group set, and you have shared with this user only one or more specific implementing partners (category option groups). If you want to make sure that the user does not see totals in analytics that include values from other groups, assign Implementing Partner to the user.
This insures that any data visible to the user through the analytics apps will be filtered to select only the Implementing Partner category option group(s) which are visible to the user.
Open the Users app and find the user you want to edit.
In the user list, directly click the relevant user, or click the menu icon and select Edit.
Modify the options you want.
Click Save.
In case a user account should expire on a specific date, you can set an account expiration date for a user
Open the Users app and click User.
Select the user whose account should have an expiration date
Use the "Account expiration date" input to define the date
Save the updates by submitting the form
You can disable a user. This means that the user's account is not deleted, but the user can't log in or use DHIS2.
Open the Users app and click User.
In the list, click the menu icon of relevant user record and select Disable.
Click OK to confirm.
Warning
If you are using the Android Capture App disabling a user (in DHIS2 versions previous to 2.30 and after 2.38) will cause the Android application to delete the local data stored on the phone next time the user attemps an on-line login. Please make sure that when you use the disable user function all the data has been synced with the server. Or that you are using this funcionality to ensure data deletion in case of a device being lost.
Open the Users app and click User.
In the list, click the menu icon of the relevant user and select Profile.
You can view all users that have been assigned to a particular organisation unit.
Open the Users app and click Users.
Above the user list, click on the Organisation Unit filter input.
A pop-up will appear in which you can select the organisation units you would like to filter by.
The list of users will be filtered to only include users which have been assigned to the selected organisation units.
You can filter users based on whether their email address is verified or not.
Open the Users app and click Users.
Above the user list, you will see a new dropdown filter labeled Email verification. This dropdown is located between Time inactive and Invitation filters.
Click on the Email verification dropdown to see the available options:
Email not verified: Displays only users with an unverified email address (emailVerified: false).
Select the desired option from the dropdown to filter the list of users accordingly.
Email verification column: If the system has email configured, a new column named Email verification will appear in the users list table, between Status and Last login. The two possible statuses are: - Verified: Indicates the user’s email is verified. - Not verified: Indicates the user’s email is not verified.
Open the Users app and click User.
In the user list, click the menu icon of the relevant user and select Replicate.
Enter a new user name and password for the cloned user account.
Click Replicate.
In the user list, click the user you just created and click Edit.
Modify the options you want.
Click Save.
To change a user's password:
Open the Users app and click User.
In the user list, click the menu icon of the relevant user and select Edit.
Enter a new password and retype it.
Click Save.
The following rules apply when you create a new password. The password must:
Contain at least 8 characters. Note that this number is configurable through the system setting "Minimum characters in password", which can be up to 14 characters.
Not contain more than 34 characters.
Contain at least one special character (non-alphanumeric character).
Contain at least one UPPERCASE character.
Contain at least one lowercase character.
Contain at least one digit (number).
To reset the password of a user by email:
The person owning the user account will receive an email with instructions for how to reset the password. The email is sent to the address specified for the user account.
Open the Users app and find the type of user you want to delete.
In the user list, click the menu icon of the relevant user and select Remove.
Click Confirm.
Open the Users app and find user you want to view.
In the user list, click the menu icon of the relevant user and select Show details.
If a user has enabled Two Factor Authentication and then loses access to his/her authentication device (e.g. smartphone gets lost or broken), this user will not be able to log into the system any more. To solve this issue, a user manager can disable Two Factor Authentication for the affected user, so that the user is able to access the system again using just a password.
Open the Users app and click Users.
In the user list, click the menu icon of the relevant user and select Disable Two Factor Authentication.
Click OK to confirm
Note
The option to disable Two Factor Authentication will only be available for users that have set up Two Factor Authentication via the user-profile-app.
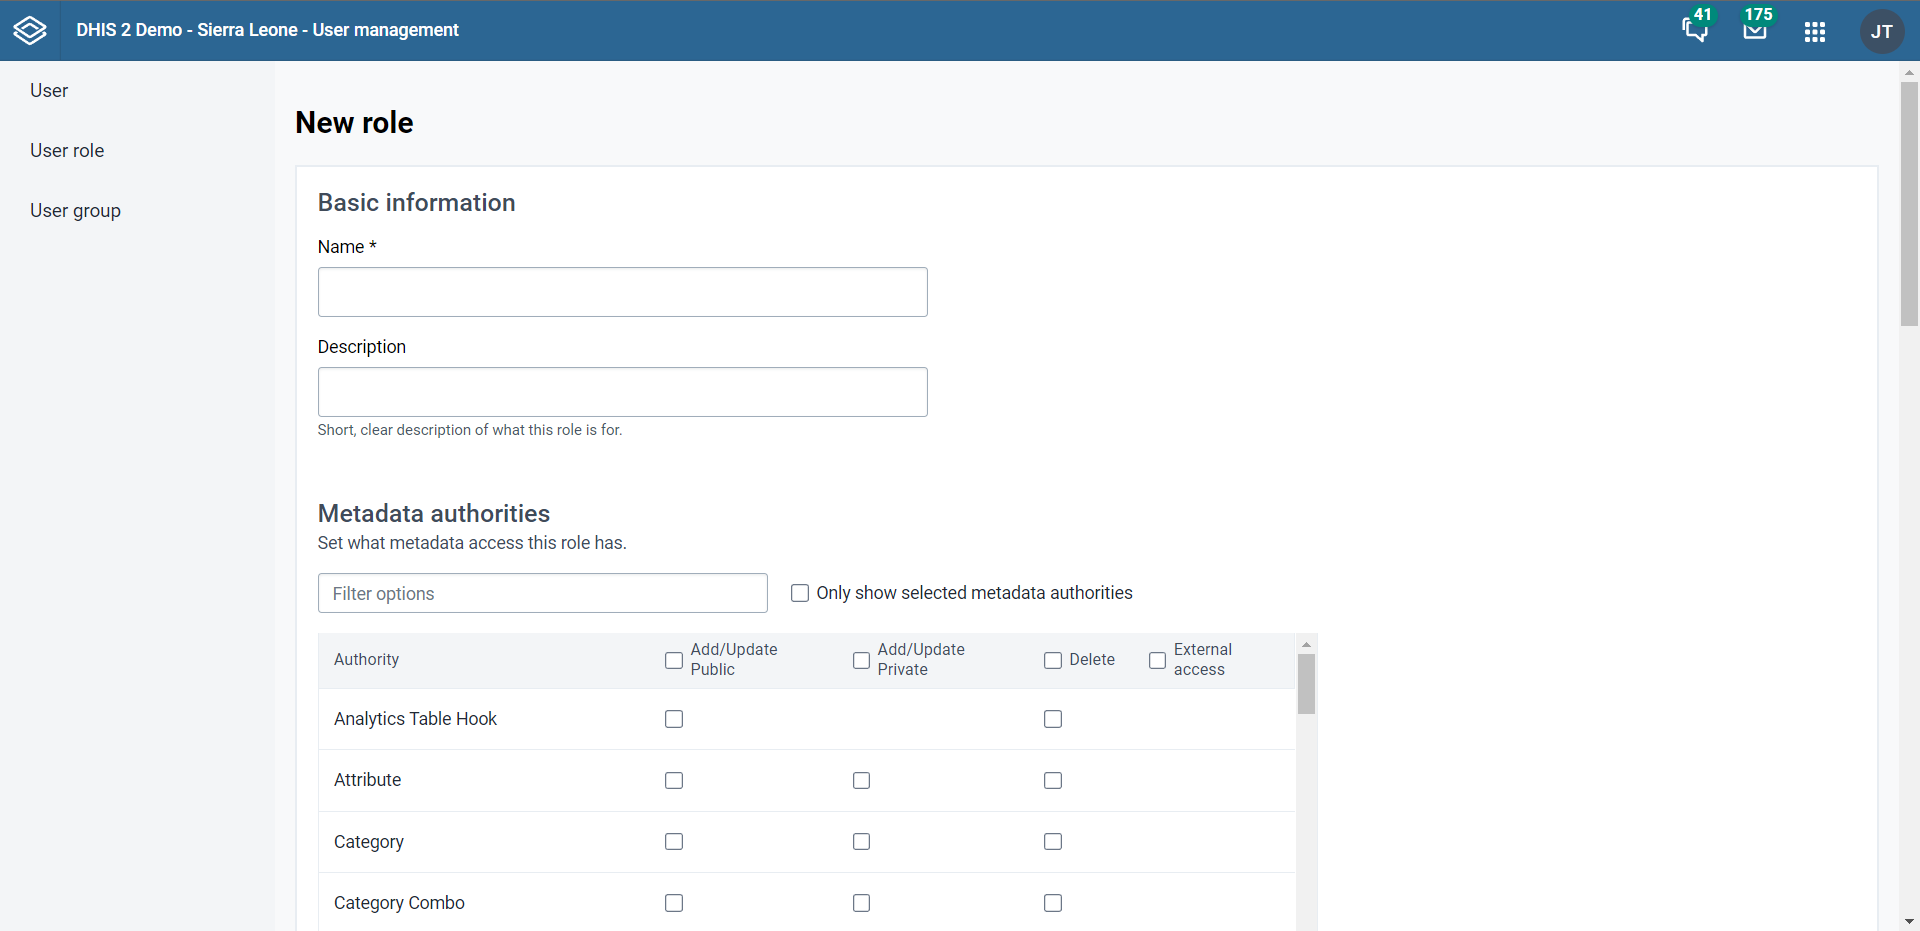
Open the Users app and click User role.
Click Add new.
Enter a Name, for example "Super user" or "Admin user".
Enter a Description.
In the Authorities section, select the authorities you want to give to the user role. You can also use the filter inputs above the authority section to search for a specific authority.
Click Add.
Open the Users app and find the type of user role you want to edit.
In the user list, directly click the relevant user role, or click the menu icon and select Edit.
Modify the options you want.
Click Save.
Open the Users app and find the user role you want to delete.
In the user role list, click the menu icon of the relevant user and select Remove.
Click Confirm.
Open the Users app and find the user role you want to view.
In the user list, click the menu icon of the relevant user role and select Show details.
Open the Users app and find the user role you want to modify.
In the user list, click the relevant user role and select Sharing settings.
(Optional) Search for a user group and select it, then click the plus icon. The user group is added to the list.
(Optional) Select External access (without login).
Note that this only gives access when no user is logged in. To give access also to logged in users, you must also allow Public access.
Change the settings for the user groups you want to modify.
Can edit and view: Everyone in the user group can view and edit the object
Click Save.
Open the Users app and click User group.
Click Add new.
In the Name field, type the name of the user group.
In the Available users section, double-click the users you want to add to the user group.
In the Available user groups section, double-click the user groups you want to add to the user group.
Click Add.
Open the Users app and click User group.
In the list, click the relevant user group and select Join group.
Open the Users app and click User group.
In the list, click the relevant user group and select Leave group.
Open the Users app and find the type of user group you want to edit.
In the user group list, directly click the relevant user group, or click the menu icon and select Edit.
Modify the options you want.
Click Save.
Open the Users app and find the type of user group you want to delete.
In the user group list, click the menu icon of the relevant user group and select Remove.
Click OK to confirm.
Open the Users app and find the user group you want to view.
In the object list, click the menu icon of the relevant user group and select Show details.
Open the Users app and find user you want to modify.
In the user group list, click the relevant user group and select Sharing settings.
(Optional) Search for a user group and select it, then click the plus icon. The user group is added to the list.
(Optional) Select External access (without login).
Note that this only gives access when no user is logged in. To give access also to logged in users, you must also allow Public access.
Change the settings for the user groups you want to modify.
Can edit and view: Everyone in the user group can view and edit the object
Click Save.
DHIS2 supports a concept for user management referred to as managed users which allows to explicitly define which users should be allowed to manage or modify which users. To "manage a user" implies that you can see and modify that user. The basic concept for user management is that you can see and modify users which you have been granted all of the authorities; in other words you can modify users which have a subset of your own authorities. The managed users concept gives you greater control over this.
The managed users concept allows you to define which users should be able to manage which users. This is configured through user groups and memberships within such groups. A user group can be configured to be allowed to manage other user groups from the standard add and update user interface. The effect is that a specific user can manage all users which are members of user groups which can be managed by a user group that the user is member of. In other words, users can be managed by all members of user groups which are managing user groups they are member of.
To enable this concept you should grant users the authority to "Add/update users within managed groups", and not grant access to the standard "Add/update users" authority. An implication of the managed users concept is that when creating a user with the "Add/update users within managed groups" only, the user must be made a member of at least one user group that the current user can manage. If not, the current user would lose access to the user being created immediately. This is validated by the system.
When granted the "Add/update users within managed groups" authority, the system lets a user add members to user groups for which she has read-only access to. The purpose of this is to allow for decentralized user management. You may define a range of user groups where other users may add or remove members, but not remove or change the name of the group.
In a health system, users are logically grouped with respect to the task they perform and the position they occupy.
Define which users should have the role as system administrators. They are often part of the national HIS division and should have full authority in the system.
Create roughly one user role for each position.
Examples of common positions are:
| Position | Typical tasks | Recommended authorities | Comment |
|---|---|---|---|
| System administrators | Set up the basic structure (metadata) of the system. | Add, update and delete the core elements of the system, for example data elements, indicators and data sets. | Only system administrators should modify metadata. If you allow users outside the system administrators team to modify the metadata, it might lead to problems with coordination. Updates to the system should only be performed by the administrators of the system. |
| National health managers Province health managers | Monitor and analyse data | Access to the reports module, the GIS, Data Quality apps and the dashboard. | Don't need access to enter data, modify data elements or data sets. |
| National health information system division officers (HISO) District health records and information officers (DHRIO) Facility health records and information officers (HRIO) | Enter data that comes from facilities which are not able to do so directly Monitor, evaluate and analyse data | Access to all the analysis and validation apps Access to the Data Entry app. | - |
| Data entry clerks | - | - | - |
| Accept data at lower levels | F_ACCEPT_DATA_LOWER_LEVELS |
| Access my data mart | F_MYDATAMART_VIEW |
| Add Facility | F_FRED_CREATE |
| Add Locale | F_LOCALE_ADD |
| Add Option Set | F_OPTIONSET_ADD |
| Add Organisation Unit Group Set | F_ORGUNITGROUPSET_ADD |
| Add Program Rule | F_PROGRAM_RULE_ADD |
| Add Public Map | F_MAP_PUBLIC_ADD |
| Add Relationship Type | F_RELATIONSHIPTYPE_ADD |
| Add/Remove Members In Read-Only User Groups | F_USER_GROUPS_READ_ONLY_ADD_MEMBERS |
| Add SQL View | F_SQLVIEW_ADD |
| Add Tracked Entity Attribute Value | F_TRACKED_ENTITY_ATTRIBUTEVALUE_ADD |
| Add Tracked Entity Form | F_TRACKED_ENTITY_FORM_ADD |
| Add Tracked Entity Instance Comment | F_TRACKED_ENTITY_COMMENT_ADD |
| Add Tracked Entity Relationship | F_RELATIONSHIP_ADD |
| Add/Update Attribute | F_ATTRIBUTE_ADD |
| Add/Update Chart | F_CHART_ADD |
| Add/Update Concept | F_CONCEPT_ADD |
| Add/Update Constant | F_CONSTANT_ADD |
| Add/Update Data Value | F_DATAVALUE_ADD |
| Add/Update Indicator Type | F_INDICATORTYPE_ADD |
| Add/Update Min/max rule | F_DATAELEMENT_MINMAX_ADD |
| Add/Update Organisation Unit | F_ORGANISATIONUNIT_ADD |
| Add/Update Private Category Option Group | F_CATEGORY_OPTION_GROUP_PRIVATE_ADD |
| Add/Update Private Category Option Group Set | F_CATEGORY_OPTION_GROUP_SET_PRIVATE_ADD |
| Add/Update Private Data Element | F_DATAELEMENT_PRIVATE_ADD |
| Add/Update Private Data Element Category | F_CATEGORY_PRIVATE_ADD |
| Add/Update Private Data Element Category Combo | F_CATEGORY_COMBO_PRIVATE_ADD |
| Add/Update Private Data Element Category Option | F_CATEGORY_OPTION_PRIVATE_ADD |
| Add/Update Private Data Element Category Option Combo | F_CATEGORY_OPTION_COMBO_PRIVATE_ADD |
| Add/Update Private Data Element Groups | F_DATAELEMENTGROUP_PRIVATE_ADD |
| Add/Update Private Data Element Group Sets | F_DATAELEMENTGROUPSET_PRIVATE_ADD |
| Add/Update Private Data Set | F_DATASET_PRIVATE_ADD |
| Add/Update Private Document | F_DOCUMENT_PRIVATE_ADD |
| Add/Update Private Indicator | F_INDICATOR_PRIVATE_ADD |
| Add/Update Private Indicator Group | F_INDICATORGROUP_PRIVATE_ADD |
| Add/Update Private Indicator Group Sets | F_INDICATORGROUPSET_PRIVATE_ADD |
| Add/Update Private Option Set | F_OPTIONSET_PRIVATE_ADD |
| Add/Update Private Organisation Unit Group | F_ORGUNITGROUP_PRIVATE_ADD |
| Add/Update Private Organisation Unit Group Set | F_ORGUNITGROUPSET_PRIVATE_ADD |
| Add/Update Private Program | F_PROGRAM_PRIVATE_ADD |
| Add/Update Private Report | F_REPORT_PRIVATE_ADD |
| Add/Update Private SQL View | F_SQLVIEW_PRIVATE_ADD |
| Add/Update Private Tracked Entity Attribute | F_TRACKED_ENTITY_ATTRIBUTE_PRIVATE_ADD |
| Add/Update Private User Group | F_USERGROUP_PRIVATE_ADD |
| Add/Update Private User Role | F_USERROLE_PRIVATE_ADD |
| Add/Update Private Validation Rule Group | F_VALIDATIONRULEGROUP_PRIVATE_ADD |
| Add/Update Program Attribute | F_PROGRAM_ATTRIBUTE_ADD |
| Add/Update Program Indicator | F_ADD_PROGRAM_INDICATOR |
| Add/Update Program Stage | F_PROGRAMSTAGE_ADD |
| Add/Update Program Stage Section | F_PROGRAMSTAGE_SECTION_ADD |
| Add/Update Public Category Option Group | F_CATEGORY_OPTION_GROUP_PUBLIC_ADD |
| Add/Update Public Category Option Group Set | F_CATEGORY_OPTION_GROUP_SET_PUBLIC_ADD |
| Add/Update Public Chart | F_CHART_PUBLIC_ADD |
| Add/Update Public Dashboard | F_DASHBOARD_PUBLIC_ADD |
| Add/Update Public Data Element | F_DATAELEMENT_PUBLIC_ADD |
| Add/Update Public Data Element Category | F_CATEGORY_PUBLIC_ADD |
| Add/Update Public Data Element Category Combo | F_CATEGORY_COMBO_PUBLIC_ADD |
| Add/Update Public Data Element Category Option | F_CATEGORY_OPTION_PUBLIC_ADD |
| Add/Update Public Data Element Category Option | F_CATEGORY_OPTION_DELETE |
| Add/Update Public Data Element Category Option Combo | F_CATEGORY_OPTION_COMBO_PUBLIC_ADD |
| Add/Update Public Data Element Groups | F_DATAELEMENTGROUP_PUBLIC_ADD |
| Add/Update Public Data Element Group Sets | F_DATAELEMENTGROUPSET_PUBLIC_ADD |
| Add/Update Public Data Set | F_DATASET_PUBLIC_ADD |
| Add/Update Public Document | F_DOCUMENT_PUBLIC_ADD |
| Add/Update Public Indicator | F_INDICATOR_PUBLIC_ADD |
| Add/Update Public Indicator Group | F_INDICATORGROUP_PUBLIC_ADD |
| Add/Update Public Indicator Group Sets | F_INDICATORGROUPSET_PUBLIC_ADD |
| Add/Update Public Option Set | F_OPTIONSET_PUBLIC_ADD |
| Add/Update Public Organisation Unit Group | F_ORGUNITGROUP_PUBLIC_ADD |
| Add/Update Public Organisation Unit Group Set | F_ORGUNITGROUPSET_PUBLIC_ADD |
| Add/Update Public Program | F_PROGRAM_PUBLIC_ADD |
| Add/Update Public Report | F_REPORT_PUBLIC_ADD |
| Add/Update Public Report Table | F_REPORTTABLE_PUBLIC_ADD |
| Add/Update Public SQL View | F_SQLVIEW_PUBLIC_ADD |
| Add/Update Public Tracked Entity Attribute | F_TRACKED_ENTITY_ATTRIBUTE_PUBLIC_ADD |
| Add/Update Public User Group | F_USERGROUP_PUBLIC_ADD |
| Add/Update Public User Role | F_USERROLE_PUBLIC_ADD |
| Add/Update Public Validation Rule Group | F_VALIDATIONRULEGROUP_PUBLIC_ADD |
| Add/Update Section | F_SECTION_ADD |
| Add/Update Tracked Entity Type | F_TRACKED_ENTITY_ADD |
| Add/Update Tracked Entity Attributes | F_ALLOW_EDIT_TRACKED_ENTITY_ATTRIBUTES |
| Add/Update User | F_USER_ADD |
| Add/Update User Group Managing Relationships | F_USERGROUP_MANAGING_RELATIONSHIPS_ADD |
| Add/Update User Within Managed Group | F_USER_ADD_WITHIN_MANAGED_GROUP |
| Add/Update Validation Criteria | F_VALIDATIONCRITERIA_ADD |
| Add/Update Validation Rule | F_VALIDATIONRULE_ADD |
| Add Validation Rule Groups | F_VALIDATIONRULEGROUP_ADD |
| Administrate data mart | F_DATAMART_ADMIN |
| Administrate data mart | F_DATA_MART_ADMIN |
| Administrate data visualizer | F_DV_ADMIN |
| Administrate GIS | F_GIS_ADMIN |
| Approve data | F_APPROVE_DATA |
| Approve data at lower levels | F_APPROVE_DATA_LOWER_LEVELS |
| Archive data | F_ARCHIVE_DATA |
| Change GIS Configuration | F_GIS_CONFIGURATION_UPDATE |
| Change Location of Tracked Entity Instance | F_TRACKED_ENTITY_INSTANCE_CHANGE_LOCATION |
| Change order in Data Set | F_DATASET_ORDER_CHANGE |
| Change system settings | F_SYSTEM_SETTING |
| Change Tracked Entity Instance Location | F_TRACKED_ENTITY_CHANGE_LOCATION |
| Chart External Access | F_CHART_EXTERNAL |
| Concept Management | F_CONCEPT_MANAGEMENT |
| Constant Management | F_CONSTANT_MANAGEMENT |
| Copy Excel Item | F_COPY_EXCEL_ITEM_ADMINISTRATION |
| Create and download backup | F_DASHBOARD_DOWNLOAD_BACKUP |
| Delete Attribute | F_ATTRIBUTE_DELETE |
| Delete Category Option Group | F_CATEGORY_OPTION_GROUP_DELETE |
| Delete Category Option Group Set | F_CATEGORY_OPTION_GROUP_SET_DELETE |
| Delete Chart | F_CHART_DELETE |
| Delete Concept | F_CONCEPT_DELETE |
| Delete Constant | F_CONSTANT_DELETE |
| Delete Data Element | F_DATAELEMENT_DELETE |
| Delete Data Element Category | F_CATEGORY_DELETE |
| Delete Data Element Category Combo | F_CATEGORY_COMBO_DELETE |
| Delete Data Element Groups | F_DATAELEMENTGROUP_DELETE |
| Delete Data Element Group Sets | F_DATAELEMENTGROUPSET_DELETE |
| Delete Data Set | F_DATASET_DELETE |
| Delete Data Value | F_DATAVALUE_DELETE |
| Delete Document | F_DOCUMENT_DELETE |
| Delete Excel Template | F_EXCEL_TEMPLATE_MANAGEMENT_DELETE |
| Delete Facility | F_FRED_DELETE |
| Delete Indicator | F_INDICATOR_DELETE |
| Delete Indicator Group | F_INDICATORGROUP_DELETE |
| Delete Indicator Group Sets | F_INDICATORGROUPSET_DELETE |
| Delete Indicator Type | F_INDICATORTYPE_DELETE |
| Delete Locale | F_LOCALE_DELETE |
| Delete Min/max rule | F_DATAELEMENT_MINMAX_DELETE |
| Delete Option Set | F_OPTIONSET_DELETE |
| Delete Organisation Unit | F_ORGANISATIONUNIT_DELETE |
| Delete Organisation Unit Group | F_ORGUNITGROUP_DELETE |
| Delete Organisation Unit Group Set | F_ORGUNITGROUPSET_DELETE |
| Delete Program | F_PROGRAM_DELETE |
| Delete Program Attribute | F_PROGRAM_ATTRIBUTE_DELETE |
| Delete Program Enrollment | F_PROGRAM_INSTANCE_DELETE |
| Delete Program Stage | F_PROGRAMSTAGE_DELETE |
| Delete Program Stage Section | F_PROGRAMSTAGE_SECTION_DELETE |
| Delete Relationship Type | F_RELATIONSHIPTYPE_DELETE |
| Delete Report | F_REPORT_DELETE |
| Delete Report Table | F_REPORTTABLE_DELETE |
| Delete Section | F_SECTION_DELETE |
| Delete SMS | F_MOBILE_DELETE_SMS |
| Delete SQL View | F_SQLVIEW_DELETE |
| Delete Tracked Entity Type | F_TRACKED_ENTITY_DELETE |
| Delete Tracked Entity Attribute | F_TRACKED_ENTITY_ATTRIBUTE_DELETE |
| Delete Tracked Entity Attribute Value | F_TRACKED_ENTITY_ATTRIBUTEVALUE_DELETE |
| Delete Tracked Entity Form | F_TRACKED_ENTITY_FORM_DELETE |
| Delete Tracked Entity Instance Comment | F_TRACKED_ENTITY_COMMENT_DELETE |
| Delete Tracked Entity Instance Visit | F_PROGRAM_STAGE_INSTANCE_DELETE |
| Delete Tracked Entity Relationship | F_RELATIONSHIP_DELETE |
| Delete User | F_USER_DELETE |
| Delete User Group | F_USERGROUP_DELETE |
| Delete User Role | F_USERROLE_DELETE |
| Delete User Within Managed Group | F_USER_DELETE_WITHIN_MANAGED_GROUP |
| Delete Validation Criteria | F_VALIDATIONCRITERIA_DELETE |
| Delete Validation Rule | F_VALIDATIONRULE_DELETE |
| Delete Validation Rule Group | F_VALIDATIONRULEGROUP_DELETE |
| Eliminate duplicate data elements | F_ELIMINATE_DUPLICATE_DATA_ELEMENTS |
| Excel Reporting Administration | F_EXCEL_REPORT_ADMINISTRATION |
| Export Activity Plan to XLS file | F_ACTIVITY_PLAN_EXPORT |
| Export data | F_EXPORT_DATA |
| Export events | F_EXPORT_EVENTS |
| Export meta-Data | F_METADATA_EXPORT |
| Generate Activity Plans | F_GENERATE_ACTIVITY_PLANS |
| Generate min-max values | F_GENERATE_MIN_MAX_VALUES |
| Generate Program Statistics Report | F_GENERATE_STATISTICAL_PROGRAM_REPORT |
| Generate Program Summary Report | F_GENERATE_PROGRAM_SUMMARY_REPORT |
| Generate Tracked Entity Tabular report | F_GENERATE_BENEFICIARY_TABULAR_REPORT |
| Import data | F_IMPORT_DATA |
| Import events | F_IMPORT_EVENTS |
| Import from other systems | F_IMPORT_OTHER_SYSTEMS |
| Import GML | F_IMPORT_GML |
| Import meta-Data | F_METADATA_IMPORT |
| Insert custom Java script and CSS | F_INSERT_CUSTOM_JS_CSS |
| List Excel Template | F_EXCEL_TEMPLATE_MANAGEMENT_LIST |
| List Tracked Entity Instance | F_TRACKED_ENTITY_INSTANCE_LIST |
| List User Groups | F_USERGROUP_LIST |
| List User Roles | F_USERROLE_LIST |
| Load event reminder messages | F_PROGRAM_STAGE_INSTANCE_REMINDER |
| Load Tracked Entity Instance History | F_TRACKED_ENTITY_INSTANCE_HISTORY |
| Manage integration routes | F_MANAGE_INTEGRATION_ROUTES |
| Manage Program Indicators | F_PROGRAM_INDICATOR_MANAGEMENT |
| Manage Program Rule | F_PROGRAM_RULE_MANAGEMENT |
| Manage Tracked Entities | F_TRACKED_ENTITY_MANAGEMENT |
| Manage Tracked Entity Instance Reminders | F_TRACKED_ENTITY_INSTANCE_REMINDER_MANAGEMENT |
| Map External Access | F_MAP_EXTERNAL |
| Merge organisation units | F_MERGE_ORGANISATION_UNITS |
| Merge indicator types | F_INDICATOR_TYPE_MERGE |
| Move Organisation Unit | F_ORGANISATIONUNIT_MOVE |
| Multiple Individual Data Entry | F_NAME_BASED_DATA_ENTRY |
| Option Set Management | F_OPTIONSET_MANAGEMENT |
| Organisation Unit Registration | F_ORGANISATION_REGISTRATION |
| Perform maintenance tasks | F_PERFORM_MAINTENANCE |
| Program Event Management | F_PROGRAM_INSTANCE_MANAGEMENT |
| Program Stage Section Management | F_PROGRAMSTAGE_SECTION_MANAGEMENT |
| Program Tracking Management | F_PROGRAM_TRACKING_MANAGEMENT |
| Prune organisation units | F_PRUNE_ORGANISATION_UNITS |
| Remove Empty Tracked Entity Events | F_TRACKED_ENTITY_REMOVE_EMPTY_EVENTS |
| Rename Excel Template file | F_EXCEL_TEMPLATE_MANAGEMENT_RENAME |
| Report Table External Access | F_REPORTTABLE_EXTERNAL |
| Run validation | F_RUN_VALIDATION |
| Scheduling Administration | F_SCHEDULING_ADMIN |
| Scheduling case aggregate query builder | F_SCHEDULING_CASE_AGGREGATE_QUERY_BUILDER |
| Scheduling send messages | F_SCHEDULING_SEND_MESSAGE |
| Search Activity Plan | F_ACTIVITY_PLAN |
| Search events without registration | F_PROGRAM_STAGE_INSTANCE_SEARCH |
| Search events with registration | F_PROGRAM_TRACKING_SEARCH |
| Search Tracked Entity Instance in All Org Units | F_TRACKED_ENTITY_INSTANCE_SEARCH_IN_ALL_ORGUNITS |
| See API Module | M_dhis-web-api |
| See Apps Maintenance module | M_dhis-web-maintenance-appmanager |
| See Browser Cache Cleaner module | M_dhis-web-cache-cleaner |
| See Dashboard integration module | M_dhis-web-dashboard-integration |
| See Dashboard module | M_dhis-web-dashboard |
| See Data Administration module | M_dhis-web-maintenance-dataadmin |
| See Data Elements and Indicators Maintenance module | M_dhis-web-maintenance-datadictionary |
| See Data Entry module | M_dhis-web-dataentry |
| See Data Mart module | M_dhis-web-datamart |
| See Data Set Maintenance module | M_dhis-web-maintenance-dataset |
| See Data Visualizer module | M_dhis-web-visualizer |
| See Event Capture module | M_dhis-web-event-capture |
| See Event Reports module | M_dhis-web-event-reports |
| See Event Visualizer module | M_dhis-web-event-visualizer |
| See Excel Report module | M_dhis-web-excel-reporting |
| See Export Data Mart Module | M_dhis-web-exportdatamart |
| See FRED API Module | M_dhis-web-api-fred |
| See GIS module | M_dhis-web-gis |
| See GIS module | M_dhis-web-mapping |
| See Import-Export module | M_dhis-web-importexport |
| See Individual Records | M_dhis-web-caseentry |
| See Light module | M_dhis-web-light |
| See Line-listing DataEntry module | M_dhis-web-dataentry-national |
| See Mobile Maintenance module | M_dhis-web-maintenance-mobile |
| See NRHM Reports module | M_dhis-web-reports |
| See Organisation Unit Maintenance module | M_dhis-web-maintenance-organisationunit |
| See Pivot Table module | M_dhis-web-pivot |
| See Report module | M_dhis-web-reporting |
| See Settings Maintenance module | M_dhis-web-maintenance-settings |
| See Smartphone module | M_dhis-web-mobile |
| See SMS module | M_dhis-web-sms |
| See Tracked Entity And Programs module | M_dhis-web-maintenance-program |
| See Tracker Capture module | M_dhis-web-tracker-capture |
| See User Maintenance module | M_dhis-web-maintenance-user |
| See Validation Analysis module | M_dhis-web-validationrule-local-in |
| See Validation Rule module | M_dhis-web-validationrule |
| Send message | F_SEND_MESSAGE |
| Send SMS | F_MOBILE_SENDSMS |
| Set mobile settings | F_MOBILE_SETTINGS |
| Single Event Without Registration Data Entry | F_ANONYMOUS_DATA_ENTRY |
| Single Event With Registration Data Entry | F_SINGLE_EVENT_DATA_ENTRY |
| Sql View External Access | F_SQLVIEW_EXTERNAL |
| Tracked Entity Aggregation | F_TRACKED_ENTITY_AGGREGATION |
| Tracked Entity Form Management | F_TRACKED_ENTITY_FORM_MANAGEMENT |
| Tracked Entity Instance Dashboard | F_TRACKED_ENTITY_INSTANCE_DASHBOARD |
| Tracked Entity Instance Management | F_TRACKED_ENTITY_INSTANCE_MANAGEMENT |
| Tracked Entity Relationship Management | F_RELATIONSHIP_MANAGEMENT |
| Update Facility | F_FRED_UPDATE |
| Update Organisation Unit Level | F_ORGANISATIONUNITLEVEL_UPDATE |
| Update Program Rule | F_PROGRAM_RULE_UPDATE |
| Update Relationship Type | F_RELATIONSHIPTYPE_UPDATE |
| Update Tracked Entity Type | F_TRACKED_ENTITY_UPDATE |
| Update Tracked Entity Attribute | F_TRACKED_ENTITY_ATTRIBUTE_EDIT |
| Upload Excel Template | F_EXCEL_TEMPLATE_MAMAGEMENT_UPLOAD |
| View and Search Tracked Entity Attributes and Identifiers | F_ACCESS_TRACKED_ENTITY_ATTRIBUTES |
| View data browser | F_VIEW_DATABROWSER |
| View Program Stage Completeness Report | F_PROGRAM_STAGE_COMPLETENESS |
| View program tracking | F_PROGRAM_TRACKING_LIST |
| View Report | F_REPORT_VIEW |
| View Tracked Entity Attribute | F_TRACKED_ENTITY_ATTRIBUTE_VIEW |
| View unapproved data | F_VIEW_UNAPPROVED_DATA |
| View User | F_USER_VIEW |
| View User Group Managing Relationships | F_USERGROUP_MANAGING_RELATIONSHIPS_VIEW |
| View User Within Managed Group | F_USER_VIEW_WITHIN_MANAGED_GROUP |
| Delete tracked entity instance and associated enrollments and events | F_TEI_CASCADE_DELETE |
| Delete enrollment and associated events | F_ENROLLMENT_CASCADE_DELETE |
| Edit expired data | F_EDIT_EXPIRED |
This chapter discusses the sharing of entities feature in DHIS2.
Many objects in DHIS2, like reports, charts, maps and indicators, can be shared. DHIS2 supports sharing of metadata or sharing of data. Sharing of metadata means making an object, like a report, available for reading or modification to a group of users or to everyone. Sharing of data means making the actual data captured available to others, and controlling who can capture that kind of data. For instance for reports, the sharing dialog can be opened by clicking on the "Sharing settings" button next to each report in the list. Implementers can use this feature to allow access to certain objects to only certain user groups. Users can use the feature to decide who they would like to share objects (such as pivot tables, charts, dashboards, etc) with.
If sharing is supported for a particular class of objects, a dialog will be available called "Sharing settings", usually available by clicking on the name of the object or in the analytics tools, through an icon (Share with other people). Once you have accessed the sharing settings for the object you wish to share, a dialog similar to the one below will be shown.
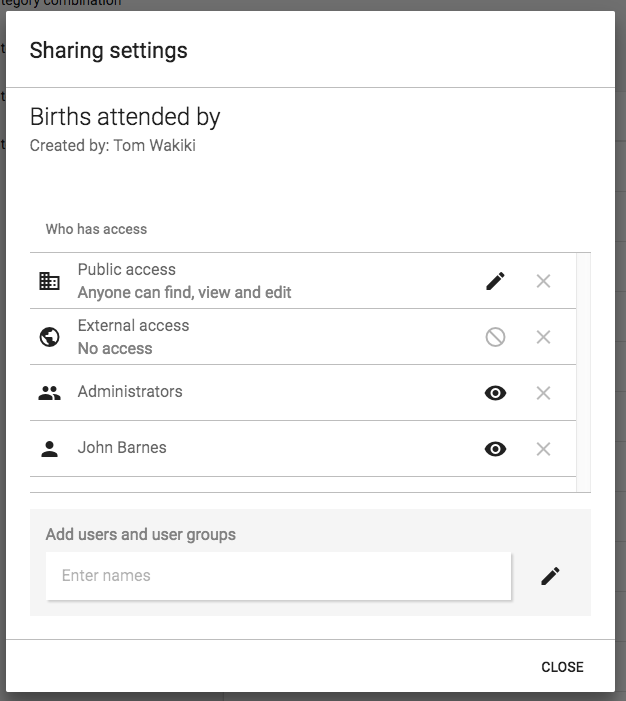
You can share your report with everyone or with a number of user groups. "External access" can be enabled to allow this resource to be shared with everyone, including users which cannot logon to DHIS2. This is useful for sharing public resources with external systems. Note, that if objects are shared externally, then they are visible to anyone who has access to the URL which provides the resource without any login credentials. Also note that "External access" does not give access to logged in users—to give them access, you must also allow "Public access".
Next to "Public access" you can choose your public access option under "METADATA": "No access", "Can view only" or "Can edit and view", and under "DATA": "No access", "Can view data", "Can capture data". Public access refers to users which are logged into the system. Edit also implies deleting the report.
To share with a group, simply start typing the name of the group and the "Search for user groups" input field and select your desired group. Click on the "+" icon next to the input field to share with that group. For each group you can set an access option, similar to public access.
Sharing with a user group implies that all users in that group will get access to the shared object. To create a user group you can go to the dashboard module and click on "Groups". This will lead you to the list of groups where you can click "Add new" in the top right corner. Creating user groups is open for everyone from the dashboard module.
The objects which support metadata sharing are indicator, indicator group, indicator group set, data dictionary, data set, program, standard report, resource, report table, chart, map and user group. Out of those objects, report table, chart, map and user group are open for everyone to create privately. Private means that the objects are available only to yourself or potentially to a number of user groups if you choose to share the object. These objects are referred to as "open" objects and can be created by all users. The remaining objects require that your user account has the authority to create them. These objects are referred to as "non-open" objects.
A user can be granted the authority to create publicly accessible objects or privately accessible objects. In order to create a publicly accessible object (available for viewing or editing by anyone) your user account must have the authority to do so. As an example, to create a publicly accessible chart, your user must have the "Create public chart" authority granted. The authority to create private objects applies only to non-open objects. For example, to allow a user to create indicators which will only be accessible to that user and not to everyone, the user can be issued with the "Create private indicator" authority.
Sharing a non-open object with another person and let her edit the object requires that the person's user account has the authority for updating that type of objects granted. For instance, if you want to let another person edit your indicator, that person's user account must have the "Update indicator" authority granted. This does not apply for open objects.
When you create a new object it will automatically become viewable for everyone if your user account has the authority to create public objects. As an example, if you create a standard report and you have the "Create public standard report" authority granted, the report will become viewable for everyone. If you do not have that authority granted the report will be viewable only to yourself. After you have created an object, you may navigate to the "Sharing settings" dialog and set your desired access control level.
If you need a user account which is able to view absolutely all objects you can create a user role with the "ALL" authority and assign a user to that role. If you need to switch between a "complete" view of objects and a "personal" view of objects it is recommended to create two user accounts, one assigned with the "ALL" authority and one without.
The metadata sharing functionality is useful in several scenarios. One use-case is setting up a DHIS2 instance for a global organisation with operations in multiple countries. Typically the organisation has a set of global data sets, indicators and reports which should apply to all countries, while all countries will have the need for country-specific data sets, indicators and reports. In this scenario the following approach could work:
Set up one user group for global personnel.
Set up a user group for personnel in each country.
Create global data sets and reports, make them viewable for everyone and editable for the global user group only.
Create country-specific data sets and reports, make them viewable and editable for the country user group and the global user group only.
This way, the global indicators and reports could be viewed and analysed by everyone, but maintained by the global user group only. The country-specific data sets, indicators and reports could be viewed and maintained by the country and global personnel, without being visible or impacting the system for other countries in the organisation.
A similar approach could work for a scenario with a donor, multiple funding agencies and implementing partners in a country, where user groups could be set up for each of those entities. That way each implementing partner could create and share their reports within their organisation without affecting or allowing access to others. Reports could also be shared with supervisors and funding agencies at the end of reporting periods.
Another use-case is a country department of health with multiple health programs. Typically there is a need for having general reports and charts for the department while allowing the health programs to develop specific reports and charts for internal use. This can be achieved by creating user groups for each health program. Later, when developing reports and charts, these can be made viewable and editable to the program user group only. This way the reports will not be visible to other programs and users. This is beneficial because the reports are kept internal to the program and because the visible list of reports of other users are kept shorter and more relevant.
The objects which support data sharing are data set, tracked entity type, program and program stage. The purpose of data sharing is to control which users can capture data, and which users can see the data captured.
Applies to the object types of tracked entity type, program and program stage. When working with single event programs in event capture, a user will have to possess the "DATA:Can view data" sharing level to see the program and its data. Without this sharing level, the program and its data will not be visible to the user. When working with tracker programs in tracker capture, the user will need to have "DATA:Can view data" to both the tracked entity type and program. In case of a tracker program, the user will also need "DATA:Can view data" on each program stage individually to be able to see the data within the program. To capture data the user needs the "DATA:Can capture data" sharing level.
Note
To see and capture data for a program, a data capture user also needs to report for an organisation unit to where the program has been assigned.
| Object type | Can view data | Can capture data | Comment |
|---|---|---|---|
| Tracked entity type | * Search for tracked entities with this tracked entity type. * See tracked entity type attribute values for this tracked entity type. | * Edit visible tracked entity attributes for tracked entity instances of this type. * Register/create new tracked entity instances of this type. * Delete tracked entity instances of this type. * Deactivate/reactivate tracked entity instances of this type. | |
| Program | * Search for tracked entities within this program. * See tracked entity attributes specific to this program. * See enrollment details for the program. * See notes for the enrollment. | * Enroll into the program. * Edit enrollment details for the program. * Complete/reopen enrollments into the program. * Add notes for the program. * Edit relationships for the program. * Send message to tracked entity instance. * Delete enrollments in the program. | Both "Can view data" and "Can capture data" also requires the user to have "Can view data" for the tracked entity type. |
| Program stage | * See the program stage and its events and data within an enrollment. * See the program stage notes. | * Add/schedule/refer a new event within the program stage. * Complete/reopen the events within the program stage. * Edit tracked entity data values within events in the program stage. * Add notes for events in the program stage. * Delete events in the program stage. | Both "Can view data" and "Can capture data" also requires the user to have "Can view data" for the program and the tracked entity type. |
| Object type | Can view data | Can capture data | Comment |
|---|---|---|---|
| Program | * See list of events within the program. * See tracked entity data values for events in the program. | * Add new events into the program. * Edit data for events in the program. * Delete events in the program. |
Applies to the object types of data set and category option . When working in Data Entry app, the user will need to have "DATA:Can capture data" to both see and capture data in the data set. To save data for an entry field in Data Set users need:
Authority: F_DATAVALUE_ADD ( Can add data value )
Data Set is shared with "Data: Can capture data"
Data Element is shared with "Metadata: Can View"
All Category Options used by selected Data Set are shared with "Data: Can capture data"
Note
To see and capture data for a data set, a data capture user also needs to report for an organisation unit to where the data set has been assigned.
| Object type | Can view data | Can capture data | Comment |
|---|---|---|---|
| Data set | * View Data Set's data in Analytics | * Can see DataSet in Data Entry app * Can save data for Data Set using API | For saving data value in Data Entry app, users also need "Can capture data" for Category Options within selected Data Set. |
| CategoryOption | * Can view data values belong to shared Category Option in analytics | * Can save data value for input fields in Data Entry app which belongs to shared Category Options. | For CategoryOptionCombo and AttributeOptionCombo to be writeable, all belongs CategoryOptions must be shared with "Can capture data". |
Setting up DHIS2 Maps simply means storing coordinates for the organisation units you want to show on the map in the database. Coordinates are often distributed in proprietary formats and will need to be converted to a format which DHIS2 understands. ESRI shapefile is a common geospatial vector data format for desktop applications. You might find shapefiles for your country here or in many other geospatial data repositories on the web. Some amount of work needs to be done in order to use these coordinates in DHIS2 Maps, namely transforming the data into a suitable format and ensuring the name which are contained in the geospatial data match exactly with the names of the organization units which they should be matched to.
Only organisation units with POINT geometry types can be edited through the Maintenance app at this time. To modify POLYGON geometries, please us the Org unit geometry import in the Import/Export app.
To edit the POINT coordinates of an organisation unit, open the Maintenance App and navigate to the Organisation Unit section. Click on the Organisation Unit you would like to view or edit, you can search or filter the list from on the left-hand side of the screen. Once an organisation unit is selected, you can edit the Latitude and Longitude values to update the POINT coordinates. If the Organisation Unit has a POLYGON geometry, the coordinates cannot be edited.
If you are going to add or update coordinates for a large number of units, or if you need to update polygon geometries, you should use the automatic Org unit geometry import explained in the following section.
Important
The only coordinate reference system (CRS) supported by DHIS2 is EPSG:4326, also known as geographic longitude/latitude. Coordinates must be stored with the longitude (east/west position) preceding the latitude (north/south position). If your vector data is in a different CRS than EPSG 4326, you will need to reproject the data first before importing into DHIS2.
Step 1 - Convert geospatial data to GeoJSON format
Skip this step if your data is already in GeoJSON format using geographic longitude/latitude.
The recommended tool for geographical format conversions is called "ogr2ogr". This should be available for most Linux distributions sudo apt-get install gdal-bin. For Windows, go to http://fwtools.maptools.org/and download "FWTools", install it and open up the FWTools command shell. During the format conversion we also want to ensure that the output has the correct coordinate projection (called EPSG:4326 with geographic longitude and latitude). For a more detailed reference of geographic coordinates, please refer to this site. If you have already reprojected the geographic data to the geographic latitude/longitude (EPSG:4326) system, there is no need to explicitly define the output coordinate system, assuming that ogr2ogr can determine the input spatial reference system. Note that most GeoJSON files use the EPSG:4326 system. You can determine the spatial reference system by executing the following command.
ogrinfo -al -so filename.shp
This command assumes your geospatial data is in ESRI Shapefile (.shp) format, but several other formats are supported.
Assuming that the projection is reported to be EPSG:27700 by ogrinfo, we can transform it to EPSG:4326 by executing the following command.
ogr2ogr -s_srs EPSG:27700 -t_srs EPSG:4326 -f GeoJSON filename.geojson filename.shp
If the geographic data is already in EPSG:4326, you can simply transform the shapefile to GeoJSON by executing the following command.
ogr2ogr -f GeoJSON filename.geojson filename.shp
You will find the created GeoJSON file in the same folder as the shapefile.
Step 2 - Simplify/generalize your geographical data
The boundaries in geographical data files are usually very accurate, too much so for the needs of a web-based GIS. This usually does not affect the performance when using GIS files on a local system, but it is usually necessary to optimize the geographical data for the web-based GIS system of DHIS2. All geographical data needs to be downloaded from the server and rendered in a browser, so if the data is overly complex, the performance of the DHIS2 Maps will be negatively impacted. This optimization process can be described as follows:
For polygons, we can make the boundary lines less detailed by removing some of the line points. This generalization will lead to degradation of the polygon. However, after a bit of experimentation, an optimal level of generalization can be found, where the accuracy of the polygon is visually acceptable, and the performance is optimal. Make a backup of your files before you start. One possible method is the use of MapShaper which is an online tool which can be used to generalize geographical data. To use MapShaper, simply upload your files to the site. Then, click on Simplify in the top menu and select a simplification method. A slider will show at the top of the screen that starts at 100%. It is usually acceptable to drag it up to about 30%. When you are happy with the result, click "Export" in the top right corner. Select the "GeoJSON" file format and click the Export button to download the file. Move on to the next step with your new simplified GeoJSON file.
Step 3 - Prepare the GeoJSON file
Unfortunately, the GeoJSON file is not ready for importation yet. Open it in a robust text editor like Geany (Linux) or Notepad++ (Windows). GeoJSON is a JSON based format. In the GeoJSON file an organisation unit is represented as a Feature. Every feature should have a geometry, properties (attributes) and they can have an id.
In order to import geospatial data from a GeoJSON file, DHIS2 must match each of them with an organisation unit in its database. Each GeoJSON feature must, in other words, contain a reference to its corresponding organisation unit. The reference itself must be one of three possible DHIS2 identifiers: uid, code or name.
By default we will try to match the organisation unit uid with the GeoJSON feature id. You can add or change the id field so it matches the uid for the organisasjon unit. You can also match by a property from the GeoJSON feature properties. The property can be matched with organisation uid, code or name.
Please note that the identifier used must uniquely identify an organisation unit (e.g. if there are two organisation units in the database of the same name or code, these cannot be matched properly on either). As uid is the only guaranteed-to-be-unique identifier it is the most robust choice. However, as matching on name is usually easier (given that the name is already part of your data).
Have a brief look at the identifiers and compare them to the corresponding values in the database. If they seem to match fairly good, it is about time to do a preview in the import-export module.
Go to the Import/Export app and click Org Unit geometry import. Select the GeoJSON file and how you want to match the GeoJSON features to the organisation units. Click Start dry run and look at the summary. Look for new/updated organisation units. Our intention is to add coordinates to already existing organisation units in the database, so we want as many updates as possible and 0 new. Those listed as new will be created as root units and mess up the organisation unit trees in DHIS2. If any listed as new, click the number and the organisation units in question will appear in the list below. If there are any slight misspellings compared to the organisation unit names in the database - fix them and start dry run again. Otherwise, click the "discard all" button below the list and then the Start import button.
If the import process completes successfully, you should now be able to utilize the geographical data in the DHIS2 Maps. If not, check the log for hints and look for common errors such as:
- Name duplicates in the GeoJSON file. The name column in the database is unique and does not accept two organisation units with the same name.
- The "shortname" column in the organisationunit table in your database has a too small varchar definition. Increase it to 100.
- Special name characters in the GeoJSON file.
- Wrongly formatted input GeoJSON, use GeoJSONLint to test the content.
Note
Only GML 2.0 is supported. GeoJSON is the recommended format.
Step 1 - Simplify/generalize your geographical data
The boundaries in geographical data files are usually very accurate, too much so for the needs of a web-based GIS. This usually does not affect the performance when using GIS files on a local system, but it is usually necessary to optimize the geographical data for the web-based GIS system of DHIS2. All geographical data needs to be downloaded from the server and rendered in a browser, so if the data is overly complex, the performance of the DHIS2 Maps will be negatively impacted. This optimization process can be described as follows:
For polygons, we can make the boundary lines less detailed by removing some of the line points. This generalization will lead to degradation of the polygon. However, after a bit of experimentation, an optimal level of generalization can be found, where the accuracy of the polygon is visually acceptable, and the performance is optimal. Make a backup of your shapefiles before you start. One possible method is the use of MapShaper which is an online tool which can be used to generalize geographical data. To use MapShaper, simply upload your files to the site. Then, click on Simplify in the top menu and select a simplification method. A slider will show at the top of the screen that starts at 100%. It is usually acceptable to drag it up to about 30%. When you are happy with the result, click "Export" in the top right corner. Select GeoJSON file format and click the Export button to download the file to your computer.
Step 2 - Convert to GML
The recommended tool for geographical format conversions is called "ogr2ogr". This should be available for most Linux distributions sudo apt-get install gdal-bin. For Windows, go to http://fwtools.maptools.org/ and download "FWTools", install it and open up the FWTools command shell. During the format conversion we also want to ensure that the output has the correct coordinate projection (called EPSG:4326 with geographic longitude and latitude). For a more detailed reference of geographic coordinates, please refer to this site. If you have already reprojected the geographic data to the geographic latitude/longitude (EPSG:4326) system, there is no need to explicitly define the output coordinate system, assuming that ogr2ogr can determine the input spatial reference system. Note that most shapefiles are using the EPSG:4326 system. You can determine the spatial reference system by executing the following command.
ogrinfo -al -so filename.json
Assuming that the projection is reported to be EPSG:27700 by ogrinfo, we can transform it to EPSG:4326 by executing the following command.
ogr2ogr -s_srs EPSG:27700 -t_srs EPSG:4326 -f GML filename.gml filename.json
If the geographic data is already in EPSG:4326, you can simply transform the shapefile to GML by executing the following command.
ogr2ogr -f GML filename.gml filename.json
You will find the created GML file in the same folder as the shapefile.
Step 3 - Prepare the GML file
Unfortunately, the GML file is not ready for importation yet. Open it in a robust text editor like Geany (Linux) or Notepad++ (Windows). GML is an XML based format which means that you will recognize the regular XML tag hierarchy. In the GML file an organisation unit is represented as a \<gml:featureMember>. Inside the feature members we usually find a lot of attributes, but we are just going to import their coordinates.
In order to import geospatial data from the feature members of the GML input, DHIS2 must match each of them with an organisation unit in its database. The feature member element must, in other words, contain a reference to its corresponding organisation unit. The reference itself must be one of three possible DHIS2 identifiers: uid, code or name. The identifier of choice must be provided as a property for each feature member element. The importer will look for a property with the local name of either Uid, Code or Name, e.g. "ogr:Name" or "anyPrefix:Code".
If your feature members already contain a property of the identifier you wish to use (such as the name of an area) you can use search and replace in a text editor to rename these elements to a name DHIS2 will recognize (see the below table). This is typically a workflow which is applicable when using the name as the identifier (the source shapefile or even GML will usually contain the name for each area it defines).
| Matching priority | Identifier | Valid spellings | Guaranteed unique |
|---|---|---|---|
| 1 | Uid | uid, Uid, UID | Yes |
| 2 | Code | code, Code, CODE | No |
| 3 | Name | name, Name, NAME | No |
In the case of renaming properties one would usually find a tag named something like "ogr:DISTRICT*NAME", "ogr:NAME_1" and rename it to "ogr:Name". If using the _code* or uid identifiers on the other hand, looking up the correct values in the DHIS2 database and going through the GML file, adding the properties for each corresponding feature member might be necessary. In any of the cases it is important to realize that the identifier used must uniquely identify an organisation unit (e.g. if there are two organisation units in the database of the same name or code, these cannot be matched properly on either). As uid is the only guaranteed-to-be-unique identifier it is the most robust choice. However, as matching on name is usually easier (given that the name is already part of your data), a viable approach to solving uniqueness conflicts can be to match any non-uniquely named organisation units on a different identifier (uid, preferably) and the rest on their names.
As can be seen in the above table there is a matching priority, meaning is any two or more identifiers are provided for the same feature member, matching will be performed on the highest priority identifier. Note also the valid properties which can be used in you GML. The namespace prefix is not important as only the local name is used.
A common pitfall of performing preparation of the GML files is syntax- or element naming errors. Therefore please make sure that all properties of the GML file are started and terminated with correctly corresponding tags. Also make sure the properties follow either of the given valid spellings of the property name. The identifying properties are supposed to look like e.g. \<ogr:Name>Moyamba District\</ogr:Name>, \<somePrefix:uid>x7uuia898nJ\</somePrefix:uid> or \<CODE>OU*12345\</CODE>. Another common error is not making sure the identifier matches exactly, especially when using the _name* property. All matches are performed on exact values, meaning that "Moyamba" in a source GML file would not be matched against "Moyamba District" in the database.
Have a brief look at the identifiers and compare them to the corresponding values in the database. If they seem to match fairly good, it is about time to do a preview in the import-export module.
Go to the Import/Export app, click Org Unit geometry import and select the GML format. Select the GML file and click Start dry run and look at the summary. Look for new/updated organisation units. Our intention is to add coordinates to already existing organisation units in the database, so we want as many updates as possible and 0 new. Those listed as new will be created as root units and mess up the organisation unit trees in DHIS2. If any listed as new, click the number and the organisation units in question will appear in the list below. If there are any slight misspellings compared to the organisation unit names in the database - fix them and do the preview again. Otherwise, click the "discard all" button below the list and then the "Import all" button above the list.
If the import process completes successfully, you should now be able to utilize the geographical data in the DHIS2 GIS. If not, check the log for hints and look for common errors such as:
- Name duplicates in the GML file. The name column in the database is unique and does not accept two organisation units with the same name.
- The "shortname" column in the organisationunit table in your database has a too small varchar definition. Increase it to 100.
- Special name characters in the GML file. Be sure to convert these to appropriate XML equivalents or escape sequences.
- Wrongly formatted input GML, non-matching tags
In the bigger picture of HIS terminology all data in DHIS2 are usually called aggregated as they are aggregates (e.g. monthly summaries) of medical records or some kind of service registers reported from the health facilities. Aggregation inside DHIS2 however, which is the topic here, is concerned with how the raw data captured in DHIS2 (through data entry or import)are further aggregated over time (e.g. from monthly to quarterly values) or up the organisational hierarchy (e.g. from facility to district values).
Raw data refers to data that is registered into the DHIS2 either through data entry or data import, and has not been manipulated by the DHIS2 aggregation process. All these data are stored in the table (or Java object if you prefer) called DataValue.
Aggregated data refers to data that has been aggregated by the DHIS2, meaning it is no longer raw data, but some kind of aggregate of the raw data.
Indicator values can also be understood as aggregated data, but these are special in the way that they are calculated based on user defined formulas (factor * numerator/denominator). Indicator values are therefore processed data and not raw data, and are located in the aggregatedindicatorvalue table/object. Indicators are calculated at any level of the organisational hierarchy and these calculations are then based on the aggregated data values available at each level. A level attribute in the aggregateddatavalue table refers to the organisational level of the orgunit the value has been calculated for.
Period and Period type are used to specify the time dimension of the raw or aggregated values, and data can be aggregated from one period type to another, e.g. from monthly to quarterly, or daily to monthly. Each data value has one period and that period has one period type. E.g. data values for the periods Jan, Feb, and Mar 2009, all of the monthly period type can be aggregated together to an aggregated data value with the period Q1 2009 and period type Quarterly.
Data (raw) can be registered at any organisational level, e.g. at national hospital at level 2, a health facility at level 5, or at a bigger PHC at level 4. This varies form country to country, but DHIS2 is flexible in allowing data entry or data import to take place at any level. This means that orgunits that themselves have children can register data, sometimes the same data elements as their children units. The basic rule of aggregation in DHIS2 is that all raw data is aggregated together, meaning data registered at a facility on level 5 is added to the data registered for a PHC at level 4.
It is up to the user/system administrator/designer to make sure that no duplication of data entry is taking place and that e.g. data entered at level 4 are not about the same services/visits that are reported by orgunit children at level 5.
NOTE
In some cases you want to have duplication of data in the system, but in a controlled manner. E.g. when you have two different sources of data for population estimates, both level 5 catchment population data and another population data source for level 4 based on census data (because sum of level 5 catchments is not always the same as level 4 census data). Then you can specify using advanced aggregation settings (see further down) that the system should e.g. not add level 5 population data to the level 4 population data, and that level 3,2,1 population data aggregates are only based on level 4 data and does not include level 5 data.
How data is aggregated depends on the dimension of aggregation (see further down).
Along the orgunit level dimension data is always summed up; i.e. simply added together. Note that raw data is never percentages, and therefore can be summed together. Indicator values that can be percentages are treated differently (re-calculated at each level, never summed up).
Along the time dimension there are several possibilities, the two most common ways to aggregate are sum and average. The user can specify for each data element which method to use by setting the aggregation operator (see further down). Monthly service data are normally summed together over time, e.g. the number of vaccines given in a year is the sum of the vaccines given for each month of that year. For population, equipment, staff and other kind of what is often called semi-permanent data the average method is often the one to use, as, e.g. 'number of nurses' working at a facility in a year would not be the sum of the two numbers reported in the six-monthly staffing report, but rather the average of the two numbers. More details further down under 'aggregation operators'.
Organisational units are used to represent the 'where' dimension associated with data values. In DHIS2, organisational units are arranged in a hierarchy, which typically corresponds to the hierarchical nature of the organisation or country. Organisational unit levels correspond to the distinct levels within the hierarchy. For instance, a country may be organized into provinces, then districts, then facilities, and then sub-centres. This organisational hierarchy would have five levels. Within each level, a number of organisational units would exist. During the aggregation process, data is aggregated from the lower organisational unit levels to higher levels. Depending on the aggregation operator, data may be 'summed' or 'averaged' within a given organisational unit level, to derive the aggregate total for all the organisational units that are contained within a higher level organisational unit level. For instance, if there are ten districts contained in a province and the aggregation operator for a given data element has been defined as 'SUM', the aggregate total for the province would be calculated as the sum of the values of the individual ten districts contained in that province.
Periods are used to represent the 'when' dimension associated with data values. Data can easily be aggregated from weeks to months, from months to quarters, and from quarters to years. DHIS2 uses known rules of how these different intervals are contained within other intervals (for instance Quarter 1 2010 is known to contain January 2010, February 2010 an March 2010) in order to aggregate data from smaller time intervals, e.g. weeks, into longer time intervals, e.g. months.
The data element dimension specifies 'what' is being recorded by a particular data value. Data element categories are actually degenerated dimensions of the data element dimension, and are used to disaggregate the data element dimension into finer categories. Data element categories, such as 'Age' and 'Gender', are used to record a particular data element, typically for different population groups. These categories can then be used to calculate the overall total for the category and the total of all categories.
The 'sum' operator simply calculates the sum of all data values that are contained within a particular aggregation matrix. For instance, if data is recorded on a monthly basis at the district level and is aggregated to provincial quarterly totals, all data contained in all districts for a given province and all weeks for the given quarter will be added together to obtain the aggregate total.
When the average aggregation operator is selected, the unweighted average of all data values within a given aggregation matrix are calculated.
It is important to understand how DHIS2 treats null values in the context of the average operator. It is fairly common for some organisational units not to submit data for certain data elements. In the context of the average operator, the average results from the number of data elements that are actually present (therefore NOT NULL) within a given aggregation matrix. If there are 12 districts within a given province, but only 10 of these have submitted data, the average aggregate will result from these ten values that are actually present in the database, and will not take into account the missing values.
The normal rule of the system is to aggregate all raw data together when moving up the organisational hierarchy, and the system assumes that data entry is not being duplicated by entering the same services provided to the same clients at both facility level and also entering an 'aggregated' (sum of all facilities) number at a higher level. This is to more easily facilitate aggregation when the same services are provided but to different clients/catchment populations at facilities on level 5 and a PHC (the parent of the same facilities) at level 4. In this way a facility at level 5 and a PHC at level 4 can share the same data elements and simply add together their numbers to provide the total of services provided in the geographical area.
Sometimes such an aggregation is not desired, simply because it would mean duplicating data about the same population. This is the case when you have two different sources of data for two different orgunit levels. E.g. catchment population for facilities can come from a different source than district populations and therefore the sum of the facility catchment populations do not match the district population provided by e.g. census data. If this is the case we would actually want duplicated data in the system so that each level can have as accurate numbers as possible, but then we do NOT want to aggregate these data sources together.
In the Data Element section you can edit data elements and for each of them specify how aggregation is done for each level. In the case described above we need to tell the system NOT to include facility data on population in any of the aggregations above that level, as the level above, in this case the districts have registered their population directly as raw data. The district population data should then be used at all levels above and including the district level, while facility level should use its own data.
This is controlled through something called aggregation levels and at the end of the edit data element screen there is a tick-box called Aggregation Levels. If you tick that one you will see a list of aggregation levels, available and selected. Default is to have no aggregation levels defined, then all raw data in the hierarchy will be added together. To specify the rule described above, and given a hierarchy of Country, Province, District, Facility: select Facility and District as your aggregation levels. Basically you select where you have data. Selecting Facility means that Facilities will use data from facilities (given since this is the lowest level). Selecting District means that the District level raw data will be used when aggregating data for District level (hence no aggregation will take place at that level), and the facility data will not be part of the aggregated District values. When aggregating data at Province level the District level raw data will be used since this is the highest available aggregation level selected. Also for Country level aggregates the District raw data will be used. Just to repeat, if we had not specified that District level was an aggregation level, then the facility data and district data would have been added together and caused duplicate (double) population data for districts and all levels above.
Resource tables provide additional information about the dimensions of the data in a format that is well suited for external tools to combine with the data value table. By joining the data value table with these resource tables one can easily aggregate along the data element category dimension or data element/indicator/organisation unit groups dimensions. E.g. by tagging all the data values with the category option male or female and provide this in a separate column 'gender' one can get subtotals of male and female based on data values that are collected for category option combinations like (male, \<5) and (male,>5). See the Pivot Tables section for more examples of how these can be used. orgunitstructure is another important table in the database that helps to provide the hierarchy of orgunits together with the data. By joining the orgunitstructure table with the data values table you can get rows of data values with the full hierarchy, e.g. on the form: OU1, OU2, OU3, OU4, DataElement, Period, Value (Sierra Leone, Bo, Badija, Ngelehun CHC, BCG \<1, Jan-10, 32) This format makes it much easier for e.g. pivot tables or other OLAP tools to aggregate data up the hierarchy.
Report tables are defined, cross-tabulated reports which can be used as the basis of further reports, such as Excel Pivot Tables or simply downloaded as an Excel sheet. Report tables are intended to provide a specific view of data which is required, such as "Monthly National ANC Indicators". This report table might provide all ANC indicators for a country, aggregated by month for the entire country. This data could of course be retrieved from the main datamart, but report tables generally perform faster and present well defined views of data to users.
To create a new report table, go to the Report tables section of the Reports module (Reports -> Report Table). Above the list of standard reports, use the "Add report table" or "Add Dataelement Dimension Table" buttons. A regular report table can be used to hold data on data elements, indicators or dataset completeness, while Dataelement dimension tables are used to include data element categories in report tables. Creating the tables are done in the same way, however, the only exception being when choosing data.
To create a report table, you start by making some general choices for the table, the most important of which is the crosstab dimension. Then, you choose which data elements, indicators, datasets or data element dimensions you want to include. Finally you select which organisation units and time periods to use in the report table. Each of these steps are described in detail below.
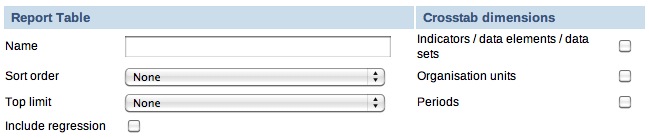
Cross tab dimensions
You can cross-tab one or more of the following dimensions: data element/indicator, orgunit, and period, which means that columns will be created based on the values of the dimensions chosen, e.g. if indicators is selected you will get column names in the table reflecting the names of the selected indicators.
For example, if you cross-tab on indicators and periods, the column headers will say "\<indicator title> \<period>". The organisation units will be listed as rows. See screenshot for clarification:

If you cross-tab on indicators and organisation units, the column headers of the table will say "\<indicator title> \<organisation unit>". Now the periods will be listed as rows. See screenshot for clarification:

Note that the options made here regarding crosstab dimensions may have consequences for what options are available when using the report table as a data source later, for example for standard reports.
Sort order
Affects the rightmost column in the table, allows you to choose to sort it low to high or high to low.
Top limit
Top limit allow you to set a maximum number of rows you want to include in the report table.
Include regression
This adds additional columns with regression values that can be included in the report design, e.g. in line charts.

Indicators/Data elements
Here you select the data elements/indicators that you want to include in the report. Use the group filter to more easily find what you are looking for and double click on the items you want to include, or use the buttons to add/remove elements. You can have both data elements and indicators in the same report.
Data sets
Here you select the data sets that you want to include in the report. Including a data set will give you data on the data completeness of the given set, not data on its data elements. Double click on the items you want to include, or use the buttons.
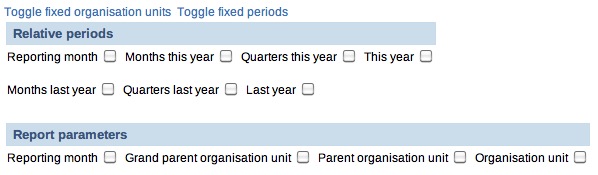
There are two ways to select both what organisation units to include in a report, and what time periods should be included: relative, or fixed. Fixed organisation units and/or periods means that you select the units/periods to include in the report table when you create the report table. Using relative periods, you can select the time and/or units as parameters when the report table is populated, for example when running a standard report or creating a chart. A combination is also possible, for example to add some organisation units in the report permanently while letting the users choose additional. Report parameters is discussed below. In general, using fixed organisation units and/or time periods are an unnecessary restriction.
Fixed Organisation Units
To add fixed organisation units, click "Toggle fixed organisation units". A panel will appear where you can choose orgunits to always include in the report. If you leave it blank, the users select orgunits when running the report through the use of report parameters. Use the drop down menu to filter organisation units by level, double click or use the buttons to add/remove.
Fixed Periods
To add fixed periods, click "Toggle fixed organisation units". A panel will appear where you can choose periods to always include in the report. If you leave it blank, the users select periods when running the report through the use of report parameters. Use the drop down menu to choose period type (week, month, etc), the Prev and Next button to choose year, and double click or use the buttons to add/remove.
Relative periods
Instead of using fixed/static periods like 'Jan-2010' or 'Q1-2010', more generic periods can be used to create reusable report tables, e.g. for monthly reports the period 'Reporting month' will simply pick the current reporting month selected by the user when running the report. Note that all relative periods are relative to a "reporting month". The reporting month is either selected by the users, otherwise the current month is used. Here is a description of the possible relative periods:
Reporting month:
Use this for monthly reports. The month selected in the reporting month parameter will be used in the report.
Months/Quarters this year:
This will provide one value per month or quarter in the year. This is well suited for standard monthly or quarterly reports where all month/quarters need to be listed. Periods that still have no data will be empty, but will always keep the same column name.
This year:
This is the cumulative so far in the year, aggregating the periods from the beginning of the year up to and including the selected reporting month.
Months/Quarters last year:
This will provide one value per month or quarter last year, relative to the reporting month. This is well suited for standard monthly or quarterly reports where all month/quarters need to be listed. Periods that still have no data will be empty, but will always keep the same column name.
Last year:
This is the cumulative last year, relative to the reporting month, aggregating all the periods from last year.
Example - relative periods
Let's say we have chosen three indicators: A, B and C, and we have also chosen to use the relative periods 'Reporting month' and 'This year' when we created the report table. If the reporting month (selected automatically or by the user) is for example May 2010, the report table will calculate the values for the three selected indicators for May 2010 (= the 'Reporting month') and the accumulated values for the three selected indicators so far in 2010 (= so far 'This year').
Thus, we will end up with six values for each of the organisation units: "Indicator A May 2010", "Indicator B May 2010" "Indicator C May 2010", "Indicator A so far in 2010", "Indicator B so far in 2010" and "Indicator C so far in 2010".
Report parameters
Report parameters make the reports more generic and reusable over time and for different organisation units. These parameters will pop up when generating the report table or running a report based on the report table. The users will select what they want to see in the report. There are four possible report parameters, and you can select none, all, or any combination.
Reporting month:
This decides which month will be used when the system is choosing the relative periods. If the box it not checked, the user will not be asked for the reporting month when the report is generated - the current month will then be used.
Grand parent organisation unit:
Select the grand parent of all the orgunit children and grand children you want listed in the report. E.g. a selected region will trigger the use of the region itself, all its district, and all their sub-districts.
Parent organisation unit:
Select the parent of all the orgunit children you want listed in the report. E.g. a selected district will trigger the use of the district itself and all its children/sub-districts.
Organisation unit:
This triggers the use of this orgunit in the report. No children are listed.
Example - report parameters
Continuing with the example on relative periods just above, let's say that in addition to 'Reporting month', we have chosen 'Parent organisation unit' as a report parameter when we created the report table. When we're running the report table, we will be asked to select an organisation unit. Now, let's say we choose "Region R" as the organisation unit. "Region R" has the children "District X" and "District Y".
When the report is run, the system will aggregate data for both "District X" and "District Y". The data will be aggregated from the lowest level where they have been collected. The values for the districts will be aggregated further to give an aggregated value for "Region R".
Thus, the report table will generate the six values presented in the previous example, for "District X", "District Y" and "Region R".
These tables enable the use of data element categories in report tables. There are two differences from regular report tables. The first is that it is not possible to select crosstab dimensions, as the columns will always be the disaggregations from the category combinations. The other is the actual choice of data. Only one category combination can be added per report, and only data elements from the same category combo can be selected.
Subtotals and the total will also be included in the table, e.g. a gender (male, female) + EPI age(\<1, >1) category combo would give the following columns: male+\<1, male+>1, Female+\<1, female+>1, male, female,\<1, >1, total.
Selecting data
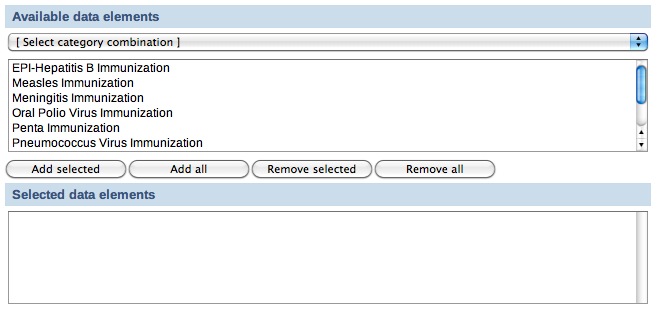
Use the drop down menu to choose category combinations. The data elements using this category combination will be listed. Double click to add to the report, or use the buttons.
To make the report tables reusable over time and across orgunits they can have parameters. Four types of parameters are allowed; orgunit, parent orgunit (for listing of orgunits in one area), grand parent orgunit and reporting month. As a side note it can be mentioned that we are looking into expanding this to include reporting quarter and year, or to make that period parameter more generic with regard to period type somehow. The ability to use period as a parameter makes the report table reusable over time and as such fits nicely with report needs such as monthly, quarterly or annual reports. When a report is run by the user in DHIS2, the user must specify the values for the report tables that are linked to the report. First the report table is re-generated (deleted and re-created with updated data), and then the report is run (in the background, in Jasper report engine).
Report tables can consist of values related to data elements, indicators or data completeness, which is related to completeness of reporting across orgunits for a given month. Completeness reports will be covered in a separate section.
There are three dimensions in a report table that identify the data; indicators or data elements, orgunits and periods. For each of these dimensions the user can select which metadata values to include in the report. The user must select one or more data elements or indicators to appear in the report. The orgunit selection can be substituted with a parameter, either one specific orgunit or an orgunit parent (making itself and all its children appear in the report). If one or more orgunits are selected and no orgunit parameter is used, then the report is static with regard to which orgunits to include, which in most cases is an unnecessary restriction to a report.
Using relative periods
The period selection is more advanced as it can in addition to specific periods like Jan-09, Q1-08, 2007 also contain what is called relative periods. As report usually is run routinely over time a specific period like Jan-09 is not very useful in a report. Instead, if you want to design a monthly report, you should use the relative period called Reporting Month. Then you must also include Reporting Month as one of your report parameters to let the system know what exactly is the Reporting Month on the time of report generation. There are many other relative periods available, and they all relate to the report parameter Reporting Month. E.g. the relative period called So far this year refers to the accumulative value for the year incl. the Reporting Month. If you want a trend report with multiple periods in stead of one aggregated period, you can select e.g. 'Months this year', which would give you values for each month so far in the year. You can do a similar report with quarters. The idea is to support as many generic report types as possible using relative periods, so if you have other report needs, please suggest new relative periods on the mailing list, and they might be added to the report table options.
Cross-tabbing dimensions
Cross tabbing is a very powerful functionality in report design, as the typical DHIS2 data table with references to period, data element/indicator and orgunit makes more advanced report design very difficult, as you cannot put e.g. specific indicators, periods or orgunits on specific columns. E.g. by cross-tabbing on the indicator dimension in an indicator report table you will get the indicator names on the column headers in your report, in addition to a column referencing orgunit, and another column referencing period. With such a table design you could drag and drop indicator names to specific columns or chart positions in the iReport software. Similarly you can cross tab on orgunits or periods to make their names specifically available to report design. E.g. by cross-tabbing on periods and selecting the two relative periods 'Reporting month' and 'This year', you can design reports with both the last month and the accumulative annual value for given month as they will be available as column headers in your report table. It is also possible to combine two dimensions in cross-tabbing, e.g. period and indicator, which makes it possible to e.g. look at three selected indicators for two specific relative periods. This would e.g. make it possible to make a table or chart based report with BCG, DPT3 and Measles coverage, both for the last month and the accumulative coverage so far in the year.
All in all, by combining the functionality of cross tabbing, relative periods and report table parameters you should have a tool to support most report scenarios. If not, we would be very happy to receive suggestions to further improvements to report tables. As already mentioned, we have started to look at more fine-grained parameters for the period dimension as the 'Reporting month' does not cover enough, or at least is not intuitive enough, when it comes to e.g. quarterly reports.
When the report table is run, the system will calculate values for specified indicators/data elements/data sets, orgunits and periods. The data will be presented in DHIS2 in a table layout. The column headers will correspond to the cross-tab dimension you have selected. An example report table showing ANC coverage for a district in The Gambia, is shown below. Here the indicator and the periods are cross-tabbed, as can be seen from the column headers.
Above the table there are six buttons; five download buttons and one Back button. Clicking the Back button will simply take you back to the previous screen. The function of the five download buttons, are presented below the screenshot:

The five download buttons
Download as Excel:
Downloads a generated Excel file you can open in Excel.
Download as CSV:
Downloads a generated .csv file. CSV stands for **C**omma **S**eparated **V**alues. It's a text file with the file ending .csv. Each line in the file corresponds to a row in the table, while the columns are separated with semi colons (;). The file can be opened in a text editor as well as in a spread sheet program (such as Excel).
Download as PDF:
Downloads a generated PDF file. The data will be presented in a similar layout as the generated table you are already viewing in DHIS2.
Download as Report:
Downloads a "styled" PDF file. In addition to present the data in a table layout, this file also presents a chart, showing the aggregated data from all the chosen periods and the parent organisation unit chosen for the report table. The report is generated using the Jasper report engine.
Download as JRXML:
Downloads the design file for the generated Report described in the previous bullet. The design file (with the file ending .jrxml) can be opened in the Jasper iReport Designer software. If you plan to design standard reports, this is the starting point.
A standard report is a manually designed report that presents data in a manually specified layout. Standard reports can be based either on report tables or SQL queries. Both approaches are described in the following sections. The main advantage of using report tables is that of simplicity - no special development skills are required. In cases where you have special requirements or need to utilize additional parts of the DHIS2 database you might want to use a SQL based standard report. In any case you will be able to utilize report parameters in order to create dynamic reports. The following guide will use the report table approach, while the SQL approach is covered towards the end.
Jasper iReport Designer is a tool for creating reports that can be used as Standard Reports in DHIS2. The tool allows for the creation of standard report templates that can easily be exported from DHIS2 with up to date data. The process of creating reports involves four major steps:
A report table must be created in DHIS2 with the indicators/data elements/datasets to be used in the report.
You have to run the report table and download the design file (Click the "Download as JRXML" button).
Open the downloaded .jrxml file using the free software Jasper iReport Designer to edit the layout of the report.
The edited report can then be uploaded to DHIS2 to be used as a standard report.
If you want to preview your report during the design in iReport, you actually have to upload your file to DHIS2 to see how it looks.
These four steps will be describe in detail in the coming sections. In general, when you are making standard reports you should have a clear idea of how it should look before you even make the report table, as how the report table is designed has implications for how the report can be formatted in iReport. For example, what crosstab dimensions are selected in the report table has consequences for what crosstabs are available for the standard report, and it has consequences for what types of charts you can make.
NOTE
If you have not created a report table yet, you have to do so. See section "How to create report tables" to do so.*
Locate your desired report table and run it by clicking the green circle with a white arrow inside. When the report is shown, click the "Download as JRXML" button to download the design file. Then open that file in the Jasper iReport Designer software.
You are now ready to edit the layout of the report. The main iReport window consists of a "Report Inspector" to the left, the report document in the middle, a "Palette" area on the upper right hand side and a "Properties" area on the lower right hand side. The "Report Inspector" are used for selecting and examining the various properties of the report, and when selecting an item in the inspector, the "Properties" panel changes to display properties relating to the selection. The "Palette" is used for adding various elements, e.g. text boxes, images and charts to the document.

NOTE
If you cannot see the Palette or Properties sidebar, you can enable them from the menu item called "Window" on the menu bar.
The iReport document is divided into seven main bands, divided by layout separators (the blue lines). These lines are used to decide how big each of the areas should be on the report.
The areas all have different purposes:
Title - area for the title of the report
Page header - area for the page header
Column header - area for column headers (for the table)
Detail 1 - area where the actual report data will be placed
Column footer - area to make footer of the table
Page footer - area for the page footer
Summary - elements in this area will be placed at the end of the report
By default you will see that only the Title, Column Header and the Detail 1 bands have data. For most reports this is OK. The Title band is suitable for a title and e.g. a chart. Data fields entered into the Detail 1 area will be iterated over to create a table. For example, if a field called "dataelementname" is placed in the Detail 1 band, all data elements in the report table will be listed here. We'll come back to data fields management just a little below.
The unused bands in the report are contracted to add more space for your report data. You can however increase/decrease the band height as you like. There are two ways to do that. The first way is simply to drag the blue band-line as shown below.

The other way to adjust the band height is to select a band in the "Report Inspector", and then adjust the "Band height" value in the "Detail 1 - properties" area in the lower right corner.
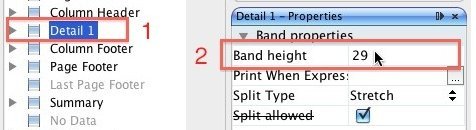
As the fields are already present on the report, you probably don't want to do anything than just fix the layout and drag fields around. You can also resize the fields by dragging the side, top or bottom lines. If you want to change the text in the column headers, you simply double click the field and change the text.
To add the a field to the table, we simply drag it to the Detail 1 band from the "Report Inspector". The column header will be added automatically.
By double clicking the box, the text can be edited. The format of the text, such as size, font and alignment, can be adjusted with the tools above the document.

NOTE
Fields starting with "$F" present values that are retrieved from the database every time the report is run. The values here will vary, so do not change these fields unless you want a static value here!
There are two types of text in iReport: «Text labels» and «Text fields» (data fields). They work in different ways, and should be used for different purposes. The main point is that text fields are just placeholders that will be filled with the correct text from the report table when the report is run, while text labels will stay the way they are when the report is run.
Static text are text plain text labels that can be edited normally. There are two ways to edit text labels:
By double clicking in the text box
By using the Static text properties in the Properties panel

Text fields are formulas that will be filled from the report table when the report is run. Unlike static text, these can not be edited in a normal way. However, they can be manipulated in various ways to ensure that the desired output will be produced. There are three ways to edit the text fields:
By right clicking on the text box and selecting Edit expression
By double clicking the text field (not recommended, as this will not bring up the expression editor)
By using the Text field properties in the Properties panel


Text fields can represent either numbers or text, so that they can be used both for showing for example names of district or for numeric values. It is therefore important the Expression class, seen in the Text field properties matches the Text field expression. For the default text fields in the .jrxml file downloaded from DHIS2 this is not a problem, but it is important when making new text fields. The two most important Expression classes are java.lang.Double for numbers and java.lang.String for text.
For example, let us say you have a quarterly report where you would like to add a new column with the yearly total. You therefore add a new Static text field to the column header band, and a Text field to the details band in. By default, new Text fields are set to java.lang.String (text). However, the yearly total column will be filled with numbers. We therefore have to change the Expression class for the new text field to java.lang.Double:


When we edit the text field expression, we see the Expression editor window with all the available columns from the report table. We can see here that each of these are marked with what type they are - text or number. What we need to make sure of is therefore that the expression class we choose for the text field matches the actual expression.

In the default table exported from DHIS2, there are some rows that it might be better to leave out of the table, and some that it would be preferable to have at the end. For example, when making a table based on a report table with the «parent organisation unit» parameter, the default table might have a row with the national level somewhere in between all the regions. In iReport, this can be changed so that the «parent organisation unit» appears at the bottom of the table. This involves two steps that will be explained below. Note that this will not work where there is only one organisation units, and it is therefore most useful when using the «parent organisation unit» or «grand parent organisation unit» parameters in the report table.
We exclude the "parameter organisation unit" from the table by using a property in the Details band called "Print when expression". To set a Print when expression, start by selecting the Detail band in the Report inspector, then edit the Print when expression in the properties panel.

The Expression editor window should now appear. What we must do is to create an expression that checks if the row being generated is the row with the organisation unit given as a parameter. The report table contains a column that we can use for this called organisation_unit_is_parent. To exclude the row with the parameter organisation unit, double click on organisation_unit_is_parent in the list to copy it to the expression area, then add .equals("No") at the end so that the code is:
$F{organisation_unit_is_parent}.equals("No")
This tells the report engine to only print table rows where the organisation unit is not the parent organisation unit.

Instead of removing the "param organisation unit" from the table entirely, it is also possible to put it at the bottom (or top) of the table. This is done by using the sort functionality explained in the next section, and choosing to sort first by "organisation_unit_is_parent". Other sorting options can be added in addition to this, for example to make a list where the param organisation unit is at the bottom of the table, with the other organisation units listed alphabetically above it.
Using the expression editor it is also possible to exclude other rows from the table, in addition to the parent organisation unit as was explained above. In Ghana, for example, all regions have a «fake district» which is the name of the region in square brackets. This can also be excluded from the table using the Print when expression that was introduced above. To to this, follow the instructions above to bring up the Expression editor window. Then, we use Java expressions to test whether or not the row should be hidden.
Example - removing rows with organisation units starting with [
($F{organisationunitname}.charAt( 0 ) != '[')
This makes the report skip any rows where the first character of the organisation unit name is [.
It is also possible to combine several of these expressions. To do this we put the expressions in a parenthesis with the two characters && in between. For example, to make a table that leaves both organisation units whose name starts with [ and the parent organisation unit, we can use the following expression:
($F{organisationunitname}.charAt( 0 ) != '[')&&$F{organisation_unit_is_parent}.equals("No")

Often you will be making reports where the first column is organisation unit names. However, it can be a problem that the list of organisation units are not sorted alphabetically. This can be fixed in iReport through a few simple steps.
In the report inspector, right click on the name of the report (by default this is dpt) and select Edit query.
A Report query window will appear. Click on the Sort options button.

A Sorting window as show below will appear. Here, we can add our sorting options. Click the Add field button. Another small window will show up, with a drop down menu where you can choose Sort by organisationunitname to have the table sorted alphabetically by name.


Click OK - Close - OK to close the three windows. The table should now be sorted.
By default, the reports from DHIS2 uses the short names for indicators and data elements in reports and charts. In some cases these are not always very meaningful for third parties, but with some work they can be given custom names through iReport. This is useful for example if you are making a report with indicators as rows and periods as column, or for charts with indicators.

To change the names of an indicator or data element, we have to edit its «expression» or formula, for example by right clicking the text box and choosing Edit expression to bring up the Expression editor.

Next, we have to insert some Java code. In the following example, we will be replacing the shortname of three indicators with their proper names. The code searches for the shortname, and then replaces it with a proper name.

($F{indicatorname}.equals("Bed Util All")) ? "Bed Utilisation - All Wards"
:
($F{indicatorname}.equals("Bed Util Mat")) ? "Bed Utilisation - Maternity"
:
($F{indicatorname}.equals("Bed Util Ped")) ? "Bed Utilisation - Paediatric"
:
$F{indicatorname}
From this, we can see a pattern that is reusable for more general cases.
For each indicator or data element we want to change the name for, we need one line
Each line is separated by a colon :
We finish the expression with a «regular» line
Each line has the same format, where the red text is the shortname, the blue text is what we want to insert instead.

The same expressions can be used for example when having indicator names along the category axis of a chart.
By using the expression editor, it is possible to add a column to the table with totals for each row. In the following example, we will make a table with three months as columns as well as a column with the totals for the three months.
We start by dragging a text label into the table header and changing its text to "Total", and dragging a text field into the details row.
As was discussed in the section on "Text field", we have to change the properties of the new text field so that it can display numbers. To do this, change the "Expressions Class" in the properties panel to "java.lang.Double".
Right click the text field and choose "Edit Expression". This will bring up the "Expressions editor". As the expression, we want to sum up all the columns. In this case we have three value expressions we want to sum up: "September", "October 2010", "November 2010". The name of these fields will vary depending on the crosstab dimension you have chosen in the report table. In our case, the expression we make is
$f{September}+$f{October 2010}+$f{November 2010}
There are cases when it can be useful to have several tables in one report. This can be done using Report groups. Using this functionality, one can for example create a report one table for each indicator, or one table of each organisation unit. In the following, we will go through the steps needed to make a report with three indicators, each represented in one table. It is important that the report table does not crosstab on indicators when we want to make groups of tables based on indicators.
In our example, the .jrxml file downloaded from DHIS2 will by default have one column for organisation unit and on for indicators (assuming we have chosen periods as the only crosstab dimension). We start by removing the indicator column, since this in not needed in our case, and realign the other fields to fit the report.
Next, we create out Report group. Go to the report inspector, right click on the report name (dpt is the default) and choose Add Report Group.
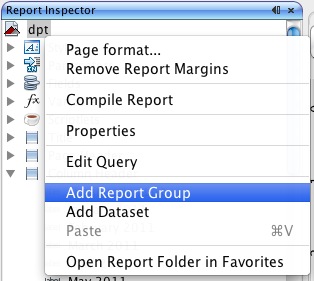
A window will appear, with a report group wizard. Select a name for the group, in this case we choose «Indicator». In the drop down menu, we can select what columns in the report table we want the groups to be based on. So, if we wanted one table for each organisation unit, we would choose organisation unit name as the report object to group according to. However, since we are grouping by indicators in this example, we choose indicatorname. Then click next.
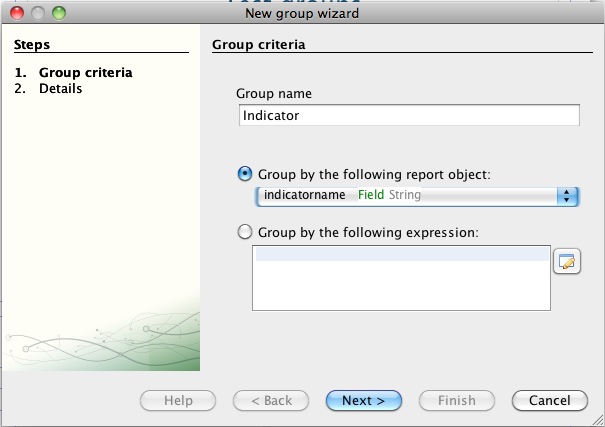
The next step is to select whether or not we want a separate Group header and Group footer band for each report group. In this case, we choose to include both. Click Finish, and the group bands should appear in the report.

If you upload and run the report, it will now create one table for each indicator. However, it will not look very good as there will be no header row over each table - only one header at the top of each page. Also, there is no indication as to which table is showing which indicator. In the following, we will fix this.
Instead of having the title row in the column header, we can instead move it to the Group header. This will make the heading show up above each individual table. Furthermore, we can add a heading to each table with the name of the indicator.
Move the column headers from the Column header band to the Indicator group header band.

Next, add a text field to the Indicator group heading band, and edit it’s expression to display the indicator name.


The report should now have three tables, one for each indicator. Each table will have a heading with the name of the indicator, and also a table header row.

When using grouping, some precautions must be taken with regards to sorting. Notably, when adding sorting parameters, whatever parameter is used as basis for the grouping must come first. Thus if you are grouping the report by indicator, and want sort the organisation units alphabetically, you have to choose to sort first by indicator, then by organisation unit name as shown below. For instructions on how to add sorting, see the sorting section above.

By default, a 3D bar chart is included in the .jrxml file that is downloaded from DHIS 2. This is set up so that only data from the «parameter organisation unit» (often the parent or grand parent) is used. Usually, this is a good solution. Since it is the default, we will start by looking at bar charts, before looking at line charts.
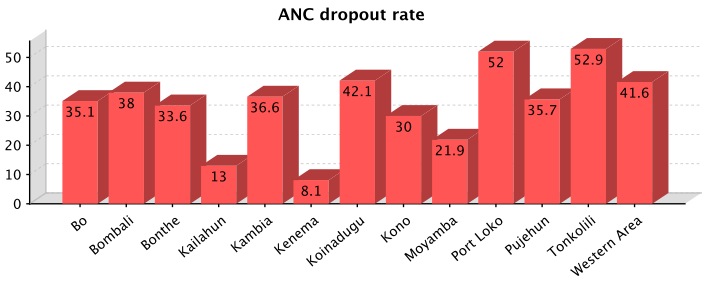
Bar charts are the default chart type in DHIS2. In this section, we will look at how to make a bar charts like the one above, comparing the value of one indicator in several districts. To edit the default chart in iReport, right click on it and choose Chart data.

A window will appear. By default, the Filter expression is filled in so that only data for the parent organisation unit will be displayed. If for some reason you do not want this, simply delete the text in the text box. In this case we do NOT want the filter, as we are making a chart showing a comparison across districts. To continue, click the details tab.

Under details, you see the list of series for the chart. By default, one series is created per crosstab column. In this case, we are looking at data for one indicator for the whole of 2010, for a number of districts. The indicator is along the crosstab dimension.

To make changes to a series, select it and click modify. Another window will appear where there are four areas that can be edit. The three first are required, but it is sufficient to add an empty quote («») in one of the first two.

The first box is a text field where the name of the series can be inserted or edited. This is the field that will be used to fill the text in the legend box (shown below).

However, if you want to have the name of each bar along the x-axis of the chart instead of using the legend, this can be done by adding whatever text you want to present in the Category expression field, or by inserting an expression to have it filled automatically when the report is run. In this case, we want to have one bar for each organisation unit. We therefore edit the category expression by clicking on the button to the right.

As the expression, we chose organisationunitname, as shown below.
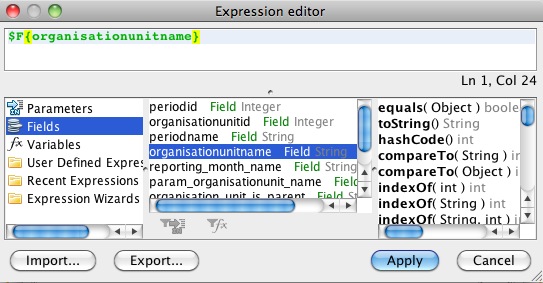
When we are finished, the series editor should look like below. Click OK, then Close to close the Chart Details window.
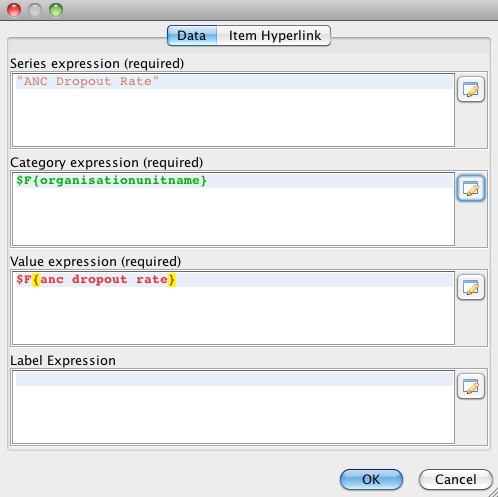
If you add a good description in the Category expression area, you can leave out the legend box. This is done in the Report properties panel of iReport, where you can also edit many other details of the chart.
We can also add a title to the chart, for example the name of the indicator. This is also done in the Chart properties panel, under Title expression.

The Expression editor window will appear, where you can enter the title. Note that the title must be in quotes, as shown below.

The chart is now ready.
Line charts can be useful in many circumstances. However, to make line charts the report data (report table) must be suited for it. Thus if you want to make a line chart, it is important that the report table does not have periods in the crosstab dimension. Examples where this is useful is if you are making a report for a single organisation unit with one or more indicators, or if you are making a report with one indicator and one or more organisation units.
Below, we will go though the steps needed to make a report with a line chart showing the development of three indicators over one year, for one organisation unit. We start by making a report table with the choices shown below:

When we open the resulting .jrxml-file in iReport, the default line chart is included. Since we want to make a line chart, we delete this chart and drag a new chart element into the report from the Palette panel.

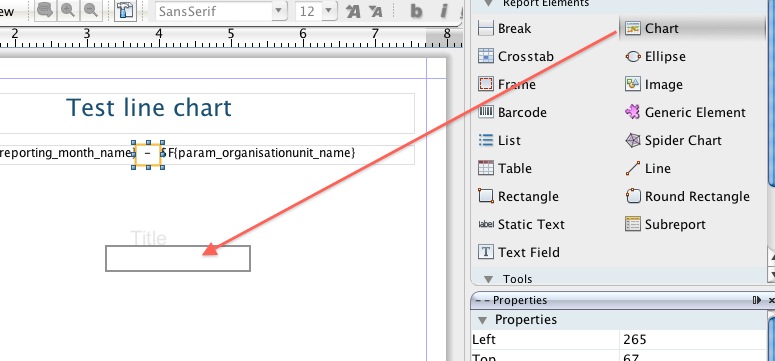
As soon as we drag the Chart element into the report, a window will appear. We choose the Line chart, as shown below.

A chart wizard will appear. Click next in the first step, then Finish in the next - we will add the data later.


Next, adjust the size and position of the chart in your report. Then, we will add one data series for each of our three indicators. Right-click on the chart and choose Chart data. If you are making a chart with one indicator and several organisation units, you probably want to make a filter expression so that only data from the parameter/parent organisation unit is used in the chart. To do this, add this line to the Filter expression area:
$F{organisation_unit_is_parent}.equals("Yes")
In our example, we only have on organisation unit, so this is not necessary. Next, click the details tab to see a list of the series in the chart. For now, this list is empty, but we will add one series for each of our three indicators. To add a series, click the Add button.
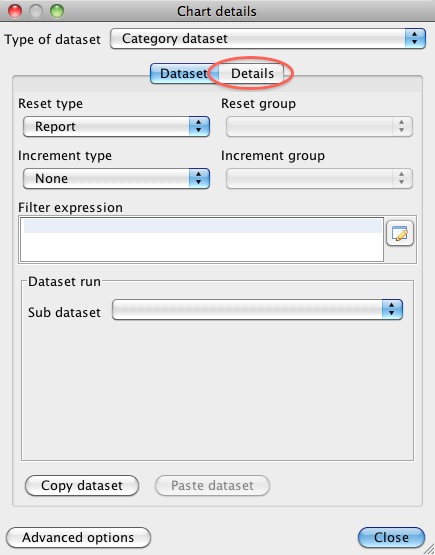

In the window that appears, enter the name of the first of the indicators in the Series expression window. Remember to put the name in quotes. In the category expression (along the x-axis) we want the months, so we use the button next to the field to open the Expression editor and add periodname.


In the value expression, we add the actual data values for our first indicator. Use the Expression editor again to do this. When we are finished, the window should look like the one below, only with different names according to the indicator.

You can then Click OK to close the window. Follow the same steps to add a series for the other indicators.

Close the window, and the data for the line chart should be ready. However, some additional adjustments might be needed - most of these can be found in the Line chart properties panel. For example, when making a month by month chart as we have in example, there is often not enough space for the month names along the category axis. This can be fixed by rotating the labels by for example -40 degrees, by using the property Category Axis Tick Label Rotation.

Many other options are available to give the chart the desired look.
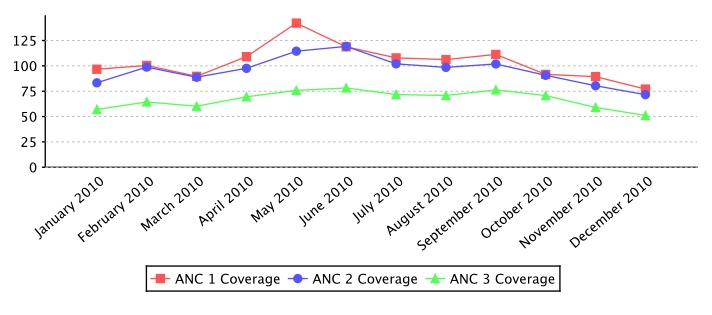
We can now switch to DHIS2 and import our report. Go to the Report Module in DHIS2, and select "Standard Report". In the "Standard Report" screen, click "Add new", or edit an existing one.
In the following screen, there are several actions we need to take. First, enter a name for the new "Standard Report". Second, for design, click "Choose File" and find the .jrxml-file you have edited in iReport. Then we select the report table that we used as a basis for the report in iReport. Click add, and it should move to the "Selected report tables" area. Finally, click save.
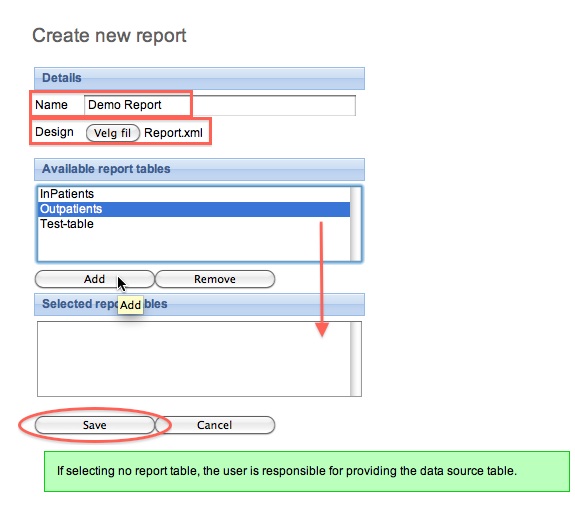
The report is now available as a "Standard Report" in DHIS2:

Use the same version of iReport and DHIS2's version of Jasper reports. See the About page in DHIS2 for the Jasper version in use.
Use report tables with cross tab dimensions as your data source for your report designs. This will make it a lot easier to design reports where you need to put specific indicators, periods, or orgunits on columns.
Learn from others, there are many DHIS2 report designs for Jasper on launchpad, see http://bazaar.launchpad.net/~DHIS2-devs-core/DHIS2/trunk/files/head:/resources/
A standard report might be based on SQL queries. This is useful when you need to access multiple tables in the DHIS2 database and do custom selects and joins.
- This step is optional, but handy when you need to debug your reports and when you have direct access to the database you want to use. Click on the "report datasources" button, "New", "Database JDBC connection" and click "next". In this window you can give you connection a name and select the JDBC driver. PostgreSQL and MySQL should come included in your iReport. Then enter the JDBC connection URL, username and password. The last three refers to your database and can be retrieved from your DHIS2 configuration file (hibernate.properties). Click "save". You have now connected iReport to your database.
- Go to standard reports and click "add new", then "get report template". Open this template in iReport. This template contains a series of report parameters which can be used to create dynamic SQL statements. These parameters will be substituted based on the report parameters which we will later select and include in the standard report. The parameters are:
periods - string of comma-separated identifiers of the relative periods
period_name - name of the reporting period
organisationunits - identifier of the selected organisation units
organisationunit_name - name of the reporting organisation unit
organisationunit_level - level of the reporting organisation unit
organisationunit_level_column - name of the corresponding column in the _orgunitstructure resource table
These parameters can be included in SQL statements using the $P\!{periods} syntax, where "periods" represents the parameter.
- To create a SQL query in iReport, click on the "report query" button. Write or paste your query into the textarea. An example SQL query using parameters which will create a report displaying raw data values at the fourth level in the org unit hierarchy is:
    select district.name as district, chiefdom.name as chiefdom, ou.name as facility,
    bcg.value as bcg, yellowfever.value as yellowfever, measles.value as  measles
    from organisationunit ou
    left outer join _orgunitstructure ous
      on (ou.organisationunitid=ous.organisationunitid)
    left outer join organisationunit district
      on (ous.idlevel2=district.organisationunitid)
    left outer join organisationunit chiefdom
      on (ous.idlevel3=chiefdom.organisationunitid)
    left outer join (
      select sourceid, sum(cast(value as double precision)) as value
      from datavalue
      where dataelementid=359706
      and periodid=$P!{periods}
      group by sourceid) as bcg on bcg.sourceid=ou.organisationunitid
    left outer join (
      select sourceid, sum(cast(value as double precision)) as value
      from datavalue
      where dataelementid=35
      and periodid=$P!{periods}
      group by sourceid) as yellowfever on yellowfever.sourceid=ou.organisationunitid
    where ous.level=4
    and ous.$P!{organisationunit_level_column}=$P!{organisationunits}
    order by district.name, chiefdom.name, ou.name;
- Finally, back in the add new report screen, we click on "Use JDBC data source". This enables you to select any relative period and report parameters for your report. Relative periods are relative to today's date. Report parameters will cause a prompt during report creation and makes it possible to dynamically select organisation units and periods to use for your report during runtime. For the example above, we must select "reporting month" under relative periods and both "reporting month" and "organisation unit" under report parameters. Click save. This will redirect you to the list of reports, where you can click the green "create" icon next to your report to render it.
A standard report can be designed using purely HTML and JavaScript. This requires a little bit of development experience in the mentioned subjects. The benefit of HTML based standard reports is that it allows for maximum flexibility. Using HTML you can design exactly the report you want, positioning tables, logos and values on the page according to your design needs. You can write and save your standard report design in a regular text file. To upload your HTML based standard report to DHIS2 do the following:
Navigate to standard reports and click "Add new".
Give the report a name.
Select "HTML report" as type.
If you want to you can download a report template by clicking on "Get HTML report template".
Select desired relative periods - these will be available in JavaScript in your report.
Select report parameters - these will be available in JavaScript in your report.
The report template, which you can download after selecting report type, is a useful starting point for developing HTML based standard reports. It gives you the basic structure and suggests how you can use JavaScript and CSS in the report. JavaScript and CSS can easily be included using standard script and style tags.
If you selected relative periods when creating the standard report you can access these in JavaScript like this:
var periods = dhis2.report.periods; // An array with period identifiers
var period = periods[0];
If you selected the organisation unit report parameter when creating the standard report you can access the selected organisation unit in JavaScript like this:
var orgUnit = dhis2.report.organisationUnit; // An object
var id = orgUnit.id;
var name = orgUnit.name;
var code = orgUnit.code;
When designing these reports you can utilize the analytics Web API resource in order to retrieve aggregated data in JavaScript. Have a look in the Web API chapter in this guide for a closer description. As a complete, minimal example you can retrieve analytics data after the report has been loaded and use that data to set the inner text of an HTML element like this:
<script type="text/javascript">
$( document ).ready( function() {
    $.get( "../api/analytics?dimension=dx:FnYCr2EAzWS;eTDtyyaSA7f&dimension=pe:THIS_YEAR&filter=ou:ImspTQPwCqd", function( json ) {
        $( "#bcg" ).html( json.rows[0][2] );
        $( "#fic" ).html( json.rows[1][2] );
    } );
} );
</script>

<div>BGG coverage: <span id="bcg"></span></div>
<div>FIC coverage: <span id="fic"></span></div>
A few other tips: To include graphics you can convert an image to SVG and embed that SVG content directly in the report - DHIS2 is based on HTML 5 where SVG tags are valid markup. To include charts and maps in your report you can use the charts and maps resources in the Web API. You can use the full capability of the Web API from JavaScript in your report - it may be useful to read through the Web API chapter to get an overview of all available resources.
| Setting | Description |
|---|---|
| Maximum number of analytics records | Increase this number to provide more records from the analytics. The default value is 50,000. Warning Use the setting Unlimited carefully, it might result in a very high load on your server. |
| Maximum number of SQL view records | Set the maximum number of records in a SQL view. The default value is Unlimited. |
| Maximum number of Tracked Entity records that can be fetched from database | Sets the limit on maximum tracked entity records that can be fetched from database. If user does not provide any value then default value which is 50,000 will be used. Setting this to 0 or any negative integer will disable this setting. Warning Disabling this setting may result in high load on the server. |
| Infrastructural indicators | Defines an indicator group where the member indicators should describe data about the organisation units' infrastructure. You can view the infrastructural data in the GIS app: right-click a facility and click Show information. |
| Infrastructural data elements | Defines a data element group where the member data elements should describe data about the organisation units' infrastructure. Infrastructural data elements can be population, doctors, beds, Internet connectivity and climate. You can view the infrastructural data in the GIS app: right-click a facility and click Show information. |
| Infrastructural period type | Sets the frequency for which the data elements in the infrastructural data elements group are captured. This will typically be yearly. When viewing the infrastructural data you will be able to select the time period of the data source. You can view the infrastructural data in the GIS app: right-click a facility and click Show information. |
| Default relative period for analysis | Setting this value will determine which relative period is selected as the default in the analytics apps. |
| Feedback recipients | Defines a user group where the members will receive all messages sent via the feedback function in the Dashboard app. This will typically be members of the super user team who are able to support and answer questions coming from end-users. |
| System update notification recipients | Defines a user group where the members will receive messages about new system updates available for download, the recipients will only receive the message once for each new patch version of the DHIS2 installation that is available for download. If no such user group is defined, the system defaults to sending it to all users that have the ALL authority. It is also possible to disable this feature altogether by setting the "system.update_notifications_enabled" configuration variable to "off", in the "dhis.conf" file. Under the hood, it works by calling (GET, with no parameters) on a REST API endpoint on a central server every day around 2:00 AM. This is the URL: https://releases.dhis2.org/v1/versions/stable.json Note: The DHIS2 core team do not log the details of any requests made to this versions API |
| Max offline organisation unit levels | Defines how many levels in the organisation unit hierarchy will be available offline in the organisation unit tree widget. Under normal circumstances you can leave this on the lowest level, which is default is the default setting. It can be useful to set it to a higher level to reduce initial load time in cases where you have a large number of organisation units, typically more than 30 000. |
| Data analysis std dev factor | Sets the number of standard deviations used in the outlier analysis performed on the captured data in the Data Entry app. The default value is 2. A high value will catch less outlier values than a low value. |
| Phone number area code | The area code for the area in which your deployment is located. Used for sending and receiving SMS. Typically, this is a country code. +260 (country code for Zambia) |
| Acceptance required before approval | When this setting is selected, acceptance of data will be required first before submission to the next approval level is possible. |
| Gather analytical object statistics in dashboard views | Gather usage analytics data when analytical objects (e.g., maps, charts, etc.) are viewed within a dashboard. Without this setting, analytics data on the objects is gathered only when the objects are viewed outside of a dashboard. |
| Include passive dashboard views in usage analytics statistics | Gather usage analytics data on the first dashboard shown when the Dashboard app is launched (otherwise only explicit dashboard selections are counted). |
| Setting | Description |
|---|---|
| Default relative period for analysis | Defines the relative period to use by default in analytics apps such as the Data Visualizer app and Maps app. The relative period will be automatically selected when you open these apps. Recommended setting: the most commonly used relative period among your users. |
| Property to display in analysis modules | Sets whether you want to display the metadata objects' names or short names in analytics apps such as the Data Visualizer app, Maps app and Line Listing app. The user can override this setting in the Settings app: User settings > Property to display in analysis modules. |
| Default digit group separator to display in analysis modules | Sets the default digit group separator in analytics apps such as the Data Visualizer app and Line Listing app. |
| Hide daily/weekly/biweekly/monthly/bimonthly periods | Hide daily/weekly/biweekly/monthly/bimonthly periods in the analysis tools. Note This setting was removed from DHIS2 version 2.43. Use Period types available in analytics apps instead. |
| Period types available in analytics apps | Controls which period types are available for data output in analytics apps. Use the checkboxes to enable or disable individual period types; disabled types will not appear in Analytics apps. Period types are grouped by frequency: daily, weekly, bi-weekly, monthly, bi-monthly, quarterly, six-monthly and yearly (including financial year variants). The yearly period type is always enabled and cannot be disabled. Note This setting is available from DHIS2 version 2.43. In earlier versions, use the individual Hide daily periods, Hide weekly periods, Hide biweekly periods, Hide monthly periods and Hide bimonthly periods settings. |
| Weekly relative period start day | Defines which day of the week the relative weekly period starts on in analytics apps. Available options are Monday (default), Wednesday, Thursday, Friday, Saturday and Sunday. Note This setting is available from DHIS2 version 2.43. |
| Financial year relative start month | Defines which month the relative financial year in the analytics apps should begin on. Available options are April, July and October. From DHIS2 version 2.43, February, August and September are also available. |
| Cache strategy | Decides for how long reports analytics responses should be cached. If you use the scheduled, nightly analytics update, you may want to select Cache until 6 AM tomorrow. This is because data in reports change at that time, and you can safely cache data up to the moment when the analytics tables are updated. If you are loading data continuously into the analytics tables, select No cache. For other cases select the amount of time you want the data to be cached. |
| Cacheability | Sets whether analytics data responses should be served with public or private visibility. Private: Any node or server between the DHIS2 server and the end user which has the ability to cache can NOT cache the web page. This is useful if the page served can or do contain sensitive information. This means that each time you want a web page, either you get a new page from the DHIS2 server, or the DHIS2 server caches the page. No other server than the DHIS2 server are allowed to cache the page. Public: Any node or server between the DHIS2 server and the end user which has the ability to cache can cache the web page. This relives the traffic to the DHIS2 server and potentially speeds up the subsequent page loading speed. |
| Analytics cache mode | Support two different modes: Progressive: this relates to the new progressive caching feature for analytics. When enabled, it OVERRIDES the global caching strategy for analytics requests. This mode will trigger HTTP and data layer caching for all analytics requests. When enabling this mode, the caching factor is MANDATORY. Fixed: the requests will be cached based on the period of time defined in cache strategy. |
| Caching factor | Select a value for the caching factor. This field is only available when the analytics cache mode has been set to progressive. It shows a list of integers where each integer represents an absolute caching factor. This integer will be used internally to calculate the final expiration time for each analytics request. Higher the caching factor, for longer the request will be cached. |
| Max number of years to hide unapproved data in analytics | Sets whether and for how long back in time analytics should respect the approval level of the data. Typically, data which is several years old would be considered to be approved by default. In order to speed up analytics requests, you can choose to ignore the actual approval level of historical data. Never check approval: no data will be hidden, irrespective of its data approval status. Check approval for all data: approval status will always be checked. Other options, for example Last 3 years: approval status will be checked for data which is newer than 3 years old; older data will not be checked. |
| Respect category option start and end date in analytics table export | This setting controls whether analytics should filter data which is associated with a category option with a start and end date, but which is not associated with a period within the category options interval of validity. |
| Include zero data values in analytics tables | This setting allows for including zero values in analytics tables. This only applies to data elements where the Store zero data values property is enabled. Note that setting Store zero data values on large numbers of data elements is strongly discouraged, as it can fill the analytics tables with zeros and cause unnecessary performance overhead. |
| Enable embedded dashboards | If enabled, users are presented with two modes of dashboard creation when creating a new dashboard: 1) Internal: the existing dashboard creation flow, based on data from the current instance. or 2) External: Embed a dashboard built from data external to the instance. |
| Allow users to switch dashboard items view type | Allows users to switch dashboard items' view between charts, pivot tables and maps, using the dashboard item menu. |
| Allow users to open dashboard items in relevant app | Allows users to open dashboard items in the app for that type of item, using the dashboard item menu. |
| Allow users to show dashboard items interpretations and details | Allows users to see dashboard items' interpretations and details, using the dashboard item menu. |
| Allow users to view dashboard items in fullscreen | Allows users to view dashboard items in fullscreen, using the dashboard item menu. |
| Use centroids for organisation unit polygons in event analytics | When enabled, analytics event tables are created using the centroid (centre point) of each organisation unit polygon, rather than the full polygon geometry. This applies to data elements and tracked entity attributes of type organisation unit or organisation unit geometry. |
| Org unit group set in facility map layers | Defines the default organisation unit group set which can be used to style facilities, with icons, when using the maps application. |
| Org unit level in facility map layers | Defines the default level for Facility layers when using the maps application. Organisation units for the default level will be displayed, unless a user selects a different level for a given layer. |
| Default basemap | Select which basemap will be selected by default in the Maps app. If no value is selected, then OSM Light will be used. |
| Setting | Description |
|---|---|
| Number of database server CPUs | Sets the number of CPU cores of your database server. This allows the system to perform optimally when the database is hosted on a different server than the application server, since analytics in DHIS2 scales linearly with the number of available cores. |
| System notifications email address | Defines the email address which will receive system notifications. Notifications about failures in processes such as analytics table generation will be sent here. This is useful for application monitoring. |
| Google Analytics (Universal Analytics) key | Sets the Google UA key to provide usage analytics for your DHIS2 instance through the Google Analytics platform. It should be noted that currently, not all apps in DHIS2 support Google Analytics, so certain activity of your users may not appear in this platform. You can read more about Google Analytics at google.com/analytics. |
| Google Maps API key | Defines the API key for the Google Maps API. Use this key to view Google map layers in DHIS2. Note that there is a different key setup for enabling Google Earth Engine layers in the DHIS2 Maps app. See documentation. |
| Bing Maps API key | Defines the API key for the Bing Maps API. Add this key to enable use of Bing basemaps in the DHIS2 Maps app. See Bing Maps API key documentation for information on setting up the key. |
| Setting | Description |
|---|---|
| Select language | Sets the language for which you can then enter translations of the following settings: * Application title * Application introduction * Application notification * Application left-side footer * Application right-side footer Note Before each of these settings can accept a translated value, they first need to have a default/fallback value. This value can be set by selecting System default (fallback) in this dropdown. |
| Application title | Sets the application title on the top menu. |
| Application introduction | Sets an introduction of the system which will be visible on the top-left part of the login page. |
| Application notification | Sets a notification which will be visible on the front page under the login area. |
| Application left-side footer | Sets a text in the left-side footer area of the login page. (When using a language written in a right-to-left script, such as Arabic, this will be in the right-footer area of the login page.) |
| Application right-side footer | Sets a text in the right-side footer area of the login page. ((When using a language written in a right-to-left script, such as Arabic, this will be in the left-footer area of the login page.) |
| Theme color | This color picker sets the color used in the DHIS2 header bar in all web apps and for the theme in the Android app. Upon setting a color, refresh the page to see the change. The Global Shell must be enabled to see the custom color in the header bar on web. If a color is set, click the Remove color button to return to the default color. |
| Start page | Sets the page or app which the user will be redirected to after log in. Recommended setting: the Dashboard app. |
| Enable light-weight start page | Instructs apps to render a light-weight and fast landing page. Recommended in low-bandwidth environments. |
| Help page link | Defines the URL which users will see when they click Profile >Help. |
| Flag | Sets the flag which is displayed in the left menu of the Dashboard app. |
| Interface language | Sets the language used in the user interface. The user can override this setting in the Settings app: User settings > Interface language. |
| Database language | Sets the language used in the database. The user can override this setting in the Settings app: User settings > Database language. |
| Require authority to add to view object lists | If you select this option, you'll hide menu and index page items and links to lists of objects if the current user doesn't have the authority to create the type of objects (privately or publicly). |
| Custom login page logo | Select this option and upload an image to add your logo to the login page. |
| Login page theme | This lets you select between the default layout, the sidebar layout, or a custom layout for the login app. If you select a custom layout, you need to provide a custom template in the "Login page template" section. |
| Login page template | Here you can paste the HTML to define the layout and style of the login page. More details for how to define the template are available in the developer documentation. |
| Enable Global Shell | When this property is enabled (set to true, the default), the Global Shell provides a common interface and navigation tools across all DHIS2 web applications. More technical details about the Global Shell can be found in the Developer Portal. |
| Enable custom translations | With this option enabled, apps can take advantage of custom translations that are set in the datastore. Read more in the Localization of DHIS2 page. |
| Setting | Description |
|---|---|
| Host name | Sets the host name of the SMTP server. When you use Google SMTP services, the host name should be smtp.gmail.com. |
| Port | Sets the port to connect to the SMTP server. |
| User name | The user name of the user account with the SMTP server. mail@dhis2.org |
| Password | The password of the user account with the SMTP server. |
| TLS | Select this option if the SMPT server requires TLS for connections. |
| Email sender | The email address to use as sender when sending out emails. |
| Send me a test email | Sends a test email to the current user logged into DHIS2. |
| Setting | Description |
|---|---|
| Self registration account user role | Defines which user role should be given to self-registered user accounts. To enable self-registration of users: select any user role from the list. A link to the self-registration form will be displayed on the login page. Note To enable self-registration, you must also select a Self registration account organisation unit. To disable self-registration of users: select Disable self registration. |
| Self registration account organisation unit | Defines which organisation unit should be associated with self-registered users. Note To enable self-registration, you must also select a Self registration account user role. |
| Do not require reCAPTCHA for self registration | Defines whether you want to use reCAPTCHA for user self-registration. This is enabled by default. |
| Enable user account recovery | Defines whether users can restore their own passwords. When this setting is enabled, a link to the account recovery form will be displayed on the front page. Note User account recovery requires that you have configured email settings (SMTP). |
| Enforce Verified Email | Controls whether users must verify their email addresses before accessing the system. This setting can only be enabled if the system is configured to send emails (SMTP). Note: If the keyEmailHostName or keyEmailUserName values are not set in the settings app, the Enforce Verified Email checkbox will be disabled and cannot be set to true. If these SMTP settings are missing, Enforce Verified Email can be set to false (if already set to true) but cannot be enabled until the required email settings are configured. |
| Lock user account temporarily after multiple failed login attempts | Defines whether the system should lock user accounts after five successive failed login attempts over a timespan of 15 minutes. The account will be locked for 15 minutes, then the user can attempt to log in again. |
| Allow users to grant own user roles | Defines whether users can grant user roles which they have themselves to others when creating new users. |
| Allow assigning object to related objects during add or update | Defines whether users should be allowed to assign an object to a related object when they create or edit metadata objects. You can allow users to assign an organisation unit to data sets and organisation unit group sets when creating or editing the organisation unit. |
| Require user account password change | Defines whether users should be forced to change their passwords every 3, 6 or 12 months. If you don't want to force users to change password, select Never. |
| Send reminders to users before their password expires | When set, users will receive a notification when their password is about to expire. |
| Number of days before password expiry to send reminder | This setting will be displayed if you choose to send reminders to users before their password expires. You can choose to send the email between 1 and 28 days before password expiry. |
| Minimum characters in password | Defines the minimum number of characters users must have in their passwords. You can select 8 (default), 10, 12 or 14. |
| CORS allowlist | allowlists a set of URLs which can access the DHIS2 API from another domain. Each URL should be entered on separate lines. Cross-origin resource sharing (CORS) is a mechanism that allows restricted resources (e.g. javascript files) on a web page to be requested from another domain outside the domain from which the first resource was served. |
| Setting | Description |
|---|---|
| notifierLogLevel | The level of messages to include in the log/list, default DEBUG (all) |
| notifierMaxMessagesPerJob | Each job can at most have this amount of messages in its list (soft enforced allowing momentary exceeding the limit by a few); default is 500 |
| notifierMaxAgeDays | Job data older than this number of days is discarded (soft enforced, cleanup after 1 minute of idle); default is 7 |
| notifierMaxJobsPerType | If per job type there are more than this number of jobs with data the oldest are discarded to get below this limit (soft enforced, cleanup after 1 minute idle); default is 500 |
| notifierCleanAfterIdleTime | The time in milliseconds the notifier has to be idle (not moving messages from queue to store) before an automatic store cleanup is run using the notifierMaxAgeDays and notifierMaxJobsPerType as caps; default is 60sec |
| notifierGistOverview | When true the overview pages will only show the first and last message of the list for each job; default true |
| Setting | Description |
|---|---|
| Calendar | Defines which calendar the system will use. The system supports the following calendars: Coptic, Ethiopian, Gregorian, Islamic (Lunar Hijri), ISO 8601, Julian, Nepali, Persian (Solar Hijri) and Thai. This is a system wide setting. It is not possible to have multiple calendars within a single DHIS2 instance. Refer here for more information about the difference between Gregorian and ISO 8601. |
| Date format | Defines which date format the system will use. |
The data import settings apply to extra controls which can be enabled to validate aggregate data which is imported through the web API. They provide optional constraints on what should be considered a conflict during import. The constraints are applied to each individual data value in the import.
| Setting | Description |
|---|---|
| Require periods to match period type of data set | Require period of data value to be of the same period type as the data sets for which the data element of data value is assigned to. |
| Require data elements to be part of data set | Require data element of a data value to be assigned to a data set. If a specific data set is specified on import, the system will check that data values are associated with the specified data set. |
| Require category option combos to match category combo of data element | Require category option combination of data value to be part of the category combination of the data element of the data value. |
| Require organisation units to match assignment of data set | Require organisation unit of data value to be assigned to one or more of the data sets which the data element of data value is assigned to. |
| Require attribute option combos to match category combo of data set | Require attribute option combination of data value to be part of the category combination of the data set which the data element of data value is assigned to. |
| Require category option combo to be specified | Require category option combination of data value to be specified. By default it will fall back to default category option combination if not specified. |
| Require attribute option combo to be specified | Require attribute option combination of data value to be specified. By default it will fall back to default attribute option combination if not specified. |
The following settings are used for both data and metadata synchronization.
Note
For more information about how you configure metadata synchronization, refer to Configure metadata synchronizing
| Setting | Description |
|---|---|
| Remote server URL | Defines the URL of the remote server running DHIS2 to upload data values to. It is recommended to use of SSL/HTTPS since user name and password are sent with the request (using basic authentication). The system will attempt to synchronize data once every minute. The system will use this setting for metadata synchronization too. Note To enable data and metadata synchronization, you must also enable jobs for Data synchronization and Metadata synchronization in the Scheduler app. |
| Remote server user name | The user name of the DHIS2 user account on the remote server to use for data synchronization. Note If you've enabled metadata versioning, you must make sure that the configured user has the authority "F_METADATA_MANAGE". |
| Remote server password | The password of the DHIS2 user account on the remote server. The password will be stored encrypted. |
| Enable versioning for metadata sync | Defines whether to create versions of metadata when you synchronize metadata between central and local instances. |
| Don't sync metadata if DHIS versions differ | The metadata schema changes between versions of DHIS2 which could make different metadata versions incompatible. When enabled, this option will not allow metadata synchronization to occur if the central and local instance(s) have different DHIS2 versions. This apply to metadata synchronization done both via the user interface and the API. The only time it might be valuable to disable this option is when synchronizing basic entities, for example data elements, that have not changed across DHIS2 versions. |
| Best effort | A type of metadata version which decides how the importer on local instance(s) will handle the metadata version. Best effort means that if the metadata import encounters missing references (for example missing data elements on a data element group import) it ignores the errors and continues the import. |
| Atomic | A type of metadata version which decides how the importer on local instance(s) will handle the metadata version. Atomic means all or nothing - the metadata import will fail if any of the references do not exist. |
You create, edit and delete OAuth2 clients in the System Settings app.
Open the System Settings apps and click OAuth2 clients.
Click the add button.
Enter Client ID and Client secret.
Select Grant types: Refresh token, or Authorization code.
Enter Redirect URIs. If you've multiple URIs, separate them with a line.
The data exchange app allows for exchanging data between the DHIS 2 instance where the app is installed and a target instance of DHIS 2, or other software that are capable of importing the DHIS 2 data value set format. Data can also be exchanged within a DHIS 2 instance, for instance for aggregation of tracker data and saving the result as aggregate data.
To exchange data, one or many aggregate data exchanges must be configured in the system. A data exchange defines the data elements, indicators, periods and organisation units to exchange data with the target instance. Please consult the Aggregate data exchange section in the Data exchange chapter in the Developer guide for a detailed explanation.
The Data Exchange app offers different sections:
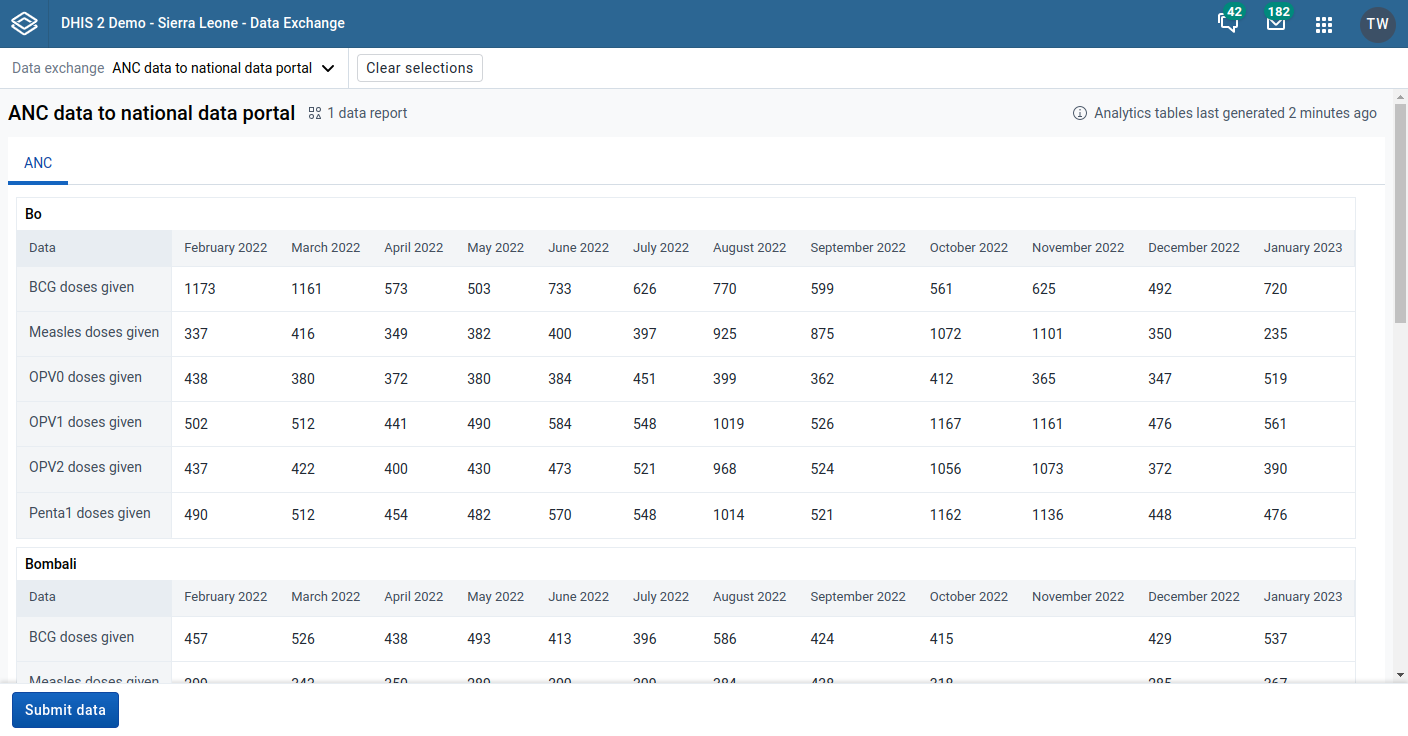
To get started with data exchange:
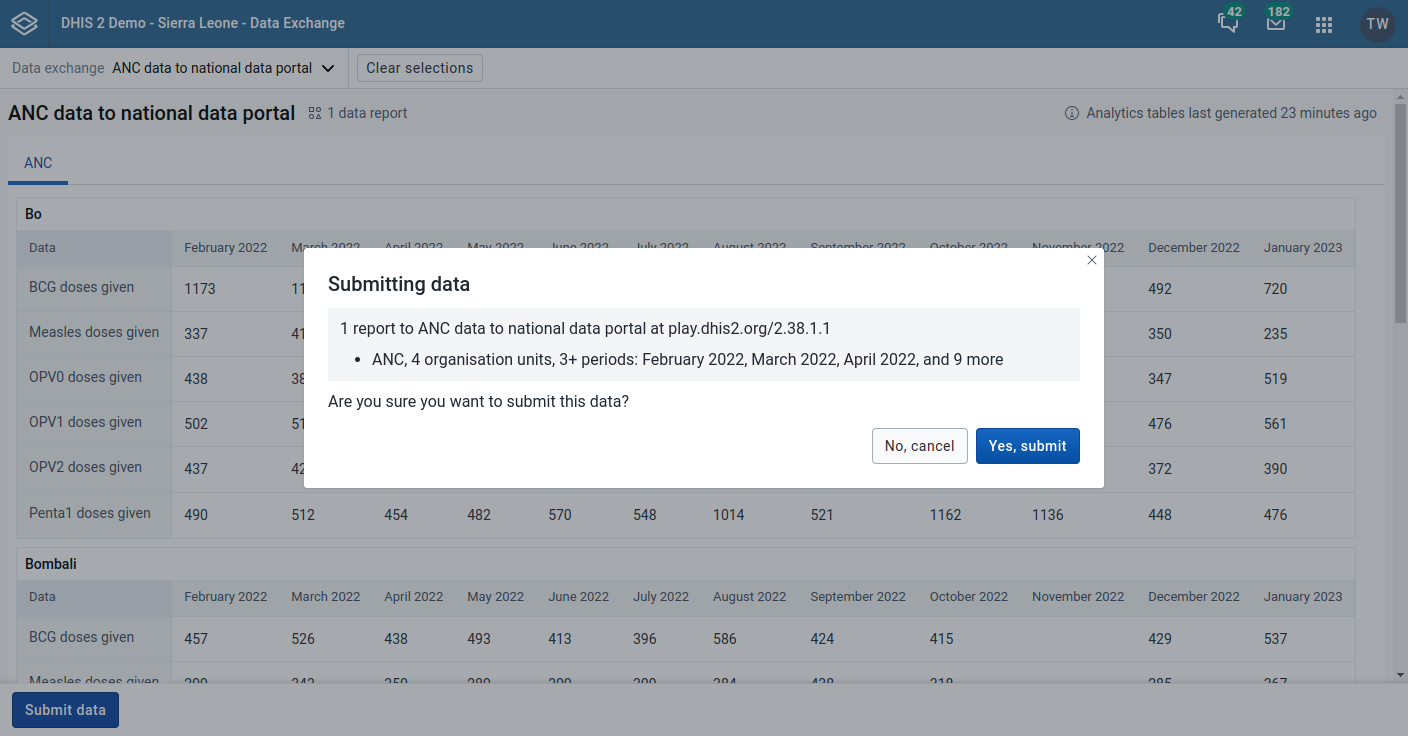
The submission summary indicates the outcome, meaning whether the operation was a success or failure, and how many data values were imported, updated and ignored as part of the data exchange.
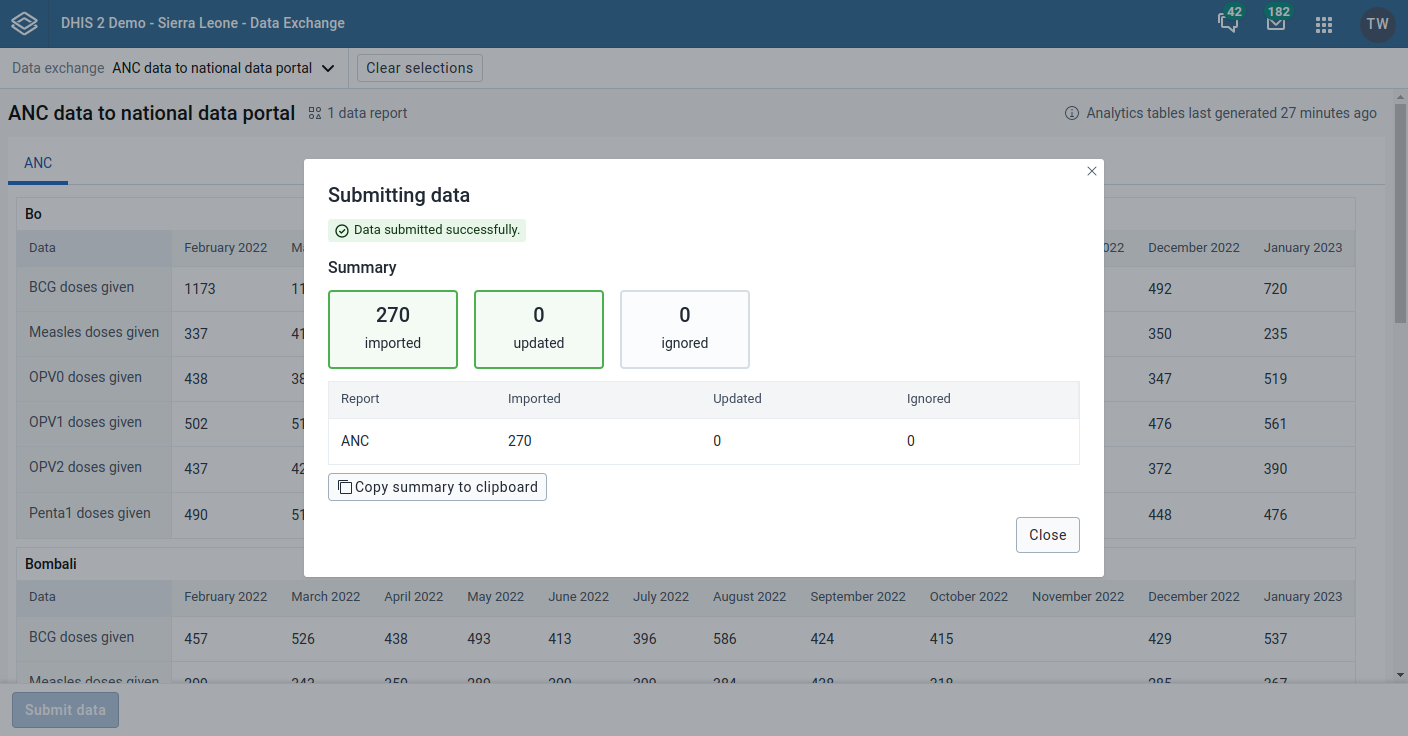
The data administration module provides a range of functions to ensure that the data stored in the DHIS2 database is integral and that the database performance is optimised. These functions should be executed on a regular basis by a data administrator to ensure that the quality of the data stored is optimal.
DHIS2 can perform a wide range of data integrity checks on the data contained in the database. Identifying and correcting data integrity issues is extremely important for ensuring that the data used for analysis purposes is valid. Each of the data integrity checks that are performed by the system will be described, along with general procedures that can be performed to resolve these issues.
Each data element must be assigned to a data set. Values for data elements will not be able to be entered into the system if a data element is not assigned to a data set. Choose Maintenance->Datasets->Edit from the main menu and then add the "orphaned" data element to the appropriate data set.
Some Data Elements have been allocated to several Data Element Groups. This is currently not allowed, because it will result in duplication of linked data records in the analytics record sets that provide aggregated data. Go to Maintenance -> Data Element Groups to review each Data Element identified and remove the incorrect Group allocations.
Some data elements have been allocated to several data element groups that are members of the same data element group set. All group sets in DHIS2 are defined as exclusive, which means that a data element can only be allocated to one data element group within that group set. Go to Maintenance -> Data elements and indicators -> Data element groups to review each data element identified in the integrity check. Either remove the data element from all groups except the one that it should be allocated to, or see if one of the groups should be placed in a different group set.
Data elements have been assigned to a data set, but have not been assigned to any sections of the data set forms. All data sets which use section forms, should generally have all data elements in the data set assigned to exactly one section of the dataset.
Data elements should not be assigned to two separate data sets whose period types differ. The recommended approach would be to create two separate data elements (for instance a monthly and yearly data element) and assign these to respective datasets.
All data sets should be assigned to at least one organisation unit.
Data sets which use section forms should only have a single category combination within each section. This violation could result from assigning a data element to a section, but then changing the category combination of this data element at a later point in time.
Although this rule will not affect data quality, it generally does not make sense to have two indicators with the exact same definition. Review the identified indicators and their formulas and delete or modify any indicator that appears to be the duplicate.
All data elements and indicators must be assigned to at least one group, so these Indicators need to be allocated to their correct Data Element and Indicator Group. From the main menu, go to Data elements/Indicators -> Indicator Groups, and allocate each of the `Orphaned` indicators to its correct group.
Violations of this rule may be caused by an incorrect reference to a deleted or modified data element. Review the indicator and make corrections to the numerator definition.
Violations of this rule may be caused by an incorrect reference to a deleted or modified data element. Review the indicator and make corrections to the denominator definition.
Some indicators have been allocated to several indicator groups that are members of the same indicator group set. All group sets in DHIS2 are defined as exclusive, which means that an indicator can only be allocated to one indicator group within that group set. Go to Maintenance -> Data elements and indicators -> Indicator groups to review each indicator identified in the integrity check. Either remove the indicator from all groups except the one that it should be allocated to, or see if one of the groups should be placed in a different group set.
If periods have been imported from external applications, it may be possible that some periods will be duplicated. If you have any periods which appear to be duplicated here, you will need to resolve these directly in the DHIS2 database. All data which has been assigned to the duplicated period, should be moved to the correct period, and the duplicate period should be removed.
Organisation units cannot be both parent and children of each other, directly nor indirectly. If this situation occurs, you will need to resolve the cyclic reference directly in the DHIS2 database in the "organisation unit" table, by reassigning the "parentid" field of the organisation units.
All organisation units must exist within the organisation unit hierarchy. Go to Organisation units -> Hierarchy Operations and move the offending organisation unit into the proper position in the hierarchy.
All organisation units must be allocated to at least one group. The problem might either be that you have not defined any compulsory OrgUnit Group Set at all, or that there are violations of the compulsory rule for some OrgUnits . NOTE: If you have defined no compulsory OrgUnit Group Sets, then you must first define them by going to Organisation units->Organisation unit group sets and define at least one compulsory Group Set (the group set 'Type' are nearly universally relevant). If you have the relevant group sets, go to Maintenance -> OrgUnit Groups to review each OrgUnit identified and add the relevant Group allocation.
These organisation units have not been assigned to the any organisation unit group within one of the compulsory organisation unit group sets. When a group set is defined as compulsory, it means that an organisation unit must be allocated to at least one organisation unit group within that group set. For instance, all organisation units must belong to one of the groups in the 'Type' group set. It might belong to the `Hospital` or the `Clinic` or any other 'type' group - but it must belong to exactly one of them. Go to Organisation units->Organisation unit groups to review each organisation unit identified in the integrity check. Allocate all organisation units to exactly one compulsory group.
Some organisation units have been allocated to several organisation unit groups that are members of the same organisation unit group set. All group sets in DHIS2 are defined as exclusive, which means that an organisation unit can only be allocated to one organisation unit group within that Group Set. For instance, one organisation unit cannot normally belong to the both the 'Hospital' and 'Clinic' groups , but rather to only to one of them. Go to Organisation unit->Organisation unit groups to review each organisation unit identified in the integrity check. Remove the organisation units from all groups except the one that it should be allocated to.
The organisation unit groups listed here have not been allocated to a group set. Go to Maintenance->Organisation unit->Organisation unit group sets and allocate the Organisation unit group to the appropriate group set.
All validation rules must be assigned to a group. Go to Maintenance app > Validation rule group and assign the offending validation rule to a group.
An error exists in the left-side validation rule definition. Go to Maintenance app -> Validation rule and click Edit on the offending rule. Click Left side and make the required corrections.
An error exists in the right-side validation rule definition. Go to Maintenance app -> Validation rule and click Edit on the offending rule. Click Right side and make the required corrections.
Report will highlight all the Program rules not configured with Condition. Evaluation for rules not having condition are always evaluated as false.
Report will highlight all the Program rules not configured with Priority. This is optional but its existence is very important when ProgramRuleActionType is ASSIGN. Rules with ASSIGN action type should have higher priority then the rest of the action types.
Report will highlight all the Program rules not configured with any ProgramRuleAction.
Report will highlight all the Program rule variables not configured with DataElement. Report will be based on source type configuration. DataElement should be provided when the source type of ProgramRuleVariable is DataElement.
Report will highlight all the Program rule variables not configured with TrackedEntityAttribute. Report will be based on source type configuration. TrackedEntityAttribute should be provided when the source type of ProgramRuleVariable is Attribute.
Report will highlight all the Program rule actions not configured with any Data object. Data object can be either DataElement of TrackedEntityAttribute. There are certain ProgramRuleActions which are responsible for assigning values to either dataElement or trackedEntityAttribute.
Report will highlight all the Program rule actions which have ProgramRuleActionType set to SENDMESSAGE/SCHEDULEMESSAGE where the configuration does not provide any link to notification.
Report will highlight all the Program rule actions which have ProgramRuleActionType set to HIDESECTION but configuration does not provide any section id.
Report will highlight all the Program rule actions which have ProgramRuleActionType set to HIDEPROGRAMSTAGE but configuration does not provide any program stage id.
Reports all the violations in program indicator expression caused by invalid DataElement or invalid TrackedEntityAttribute.
Reports all the violations in program indicator filter expression caused by invalid DataElement or invalid TrackedEntityAttribute.
Reports all tracked entity attributes with suboptimal configuration, which could potentially result in slower search performance when searching for tracked entities using those attributes.
Reports all tracked entity attributes that are not in sync with the trigram index in the database. This means that some indexes may need to be created, deleted, or both.
Reports all tracked entity attributes that have a partial trigram index in the trackedentityattributevalue table.
| Function | Description |
|---|---|
| Clear analytics tables | Completely empties the analytics tables. These tables are used to generate aggregate data for the pivot tables, GIS and reports. |
| Analyze analytics tables | Performs a PostgreSQL analyze operation on all analytics tables. |
| Remove zero data values | Removes zero data values from the database. Values registered for data elements with aggregation operator average is not removed, as such values will be significant when aggregating the data, contrary to values registered for data elements with aggregation operator sum. Reducing the number of data values will improve system performance. |
| Permanently remove soft deleted data values / events / enrollments / tracked entity instances | When a data value is deleted in DHIS2, the system will mark the corresponding database row as deleted, and not actually delete the row. Running this maintenance function will physically remove these data value rows from the database. |
| Prune periods | Removes all periods which have no registered data values. Reducing the number of periods will improve system performance. |
| Remove expired invitations | Will delete users which represent user account invitations that now have gone past their expiry date. |
| Drop SQL views | DHIS2 lets you set up and manage SQL views as system objects with corresponding database SQL views. Running this maintenance function will drop underlying SQL views for all system views. Use the Create SQL views function to recreate these SQL views. |
| Create SQL views | Recreates all SQL views in the database. |
| Update category option combinations | Rebuilds the category option combinations. This may be required after altering the category options which belong to a given category. |
| Update organisation unit paths | The organisation unit table in the DHIS2 database has a column "path" which contains a concatenated string of all ancestors in the hierarchy for each organisation unit. Running this maintenance function will update and ensure that these values are in sync with the current organisation unit hierarchy. This column is managed by DHIS2, but a manual update might be useful when doing data loading directly in the database. |
| Clear application cache | Clears the system cache. |
| Reload apps | Manually reloads and detects installed DHIS2 apps. The installed apps are also detected when the system starts and when installing or uninstall apps. |
Resource tables are supporting tables that are used during analysis of data. One would typically join the contents of these tables with the data value table when doing queries from third-party applications like Microsoft Excel. They are also used extensively by the analysis modules of DHIS2. Regeneration of the resource tables should only be done once all data integrity issues are resolved. The resource tables are also generated automatically, every time the analytics process is run by the system.
Organisation unit structure (analytics_rs_orgunitstructure)
This table should be regenerated any time there have been any changes made to the organisational unit hierarchy. This table provides information about the organisation unit hierarchy. It has one row for each organisation unit, one column for each organisation unit level and the organisation unit identifiers for all parents in the lineage as values.
Data element group set structure (analytics_rs_dataelementgroupsetstructure)
This table provides information about which data elements are members of which data element group sets. The table has one row for each data element, one column for each data element group set and the names of the data element group as values.
Indicator group set structure (analytics_rs_indicatorgroupsetstructure)
This table provides information about which indicators are members of which indicator group sets. The table has one row for each indicator, one column for each indicator group set and the names of the indicator group as values.
Organisation unit group set structure (analytics_rs_organisationunitgroupsetstructure)
This table provides information about which organisation units are members of which organisation unit group sets. The table has one row for each organisation unit, one column for each organisation unit group set and the names of the organisation unit groups as values.
Category structure (analytics_rs_categorystructure)
This table provides information about which data elements are members of which categories. The table has one row for each data element, one column for each category and the names of the category options as values.
Data element category option combo name (analytics_rs_categoryoptioncomboname)
This table should be regenerated any time there have been changes made to the category combination names. It contains readable names for the various combinations of categories.
Data element structure (analytics_rs_dataelementstructure)
This table provides information about all data elements and which period type (frequency) they capture data at. The period type is determined through the data set membership and hence relies on data elements to be member of data sets with similar period types to have a defined behaviour.
Date periods structure (analytics_rs_dateperiodstructure)
This table provides information about all periods and which period type they are associated with. For each period type with lower frequency than itself, it contains information about which period it will fall within.
Periods structure (analytics_rs_periodstructure)
Similar to analytics_rs_dateperiodstructure, containing a scoped set of periods more adapted for aggregated analytics. It's based on period and periodtype tables.
Data element category option combinations (analytics_rs_dataelementcategoryoptioncombo)
This table provides a mapping between data elements and all possible category option combinations.
Data set organisation unit category (analytics_rs_datasetorganisationunitcategory)
This table provides information related to data sets, organisation units and its category option combinations associated. If no association is found, it uses the default category option combo.
DHIS2 generates database tables which the system then uses as basis for various analytics functions. These tables are also valuable if you write advanced SQL reports. In the Data Administration app, you can execute the tables generation immediately. If you want to schedule them to be executed at regular intervals, this can be done in the Scheduler app. This means that you can refresh recent analytics on demand and see updated pivot tables without waiting for all of the past years data to re-process.
Note
You can also generate the tables through the web API. This task is typically performed by a system administrator.
Open the Data Administration app and click Analytics Tables.
Select the parts of the analytics process you want to skip:
Skip generation of resource tables
Skip generation of aggregate data and completeness data
Skip generation of event data
Skip generation of enrollment data
Skip generation of organisation unit ownership data
Select Number of last years of data to include. (If 0 is selected, then you will run latest or continuous analytics, as defined in Continuous analytics table.)
Click Start export.
The data statistics module provides an overview of the number of objects stored in the DHIS2 database.
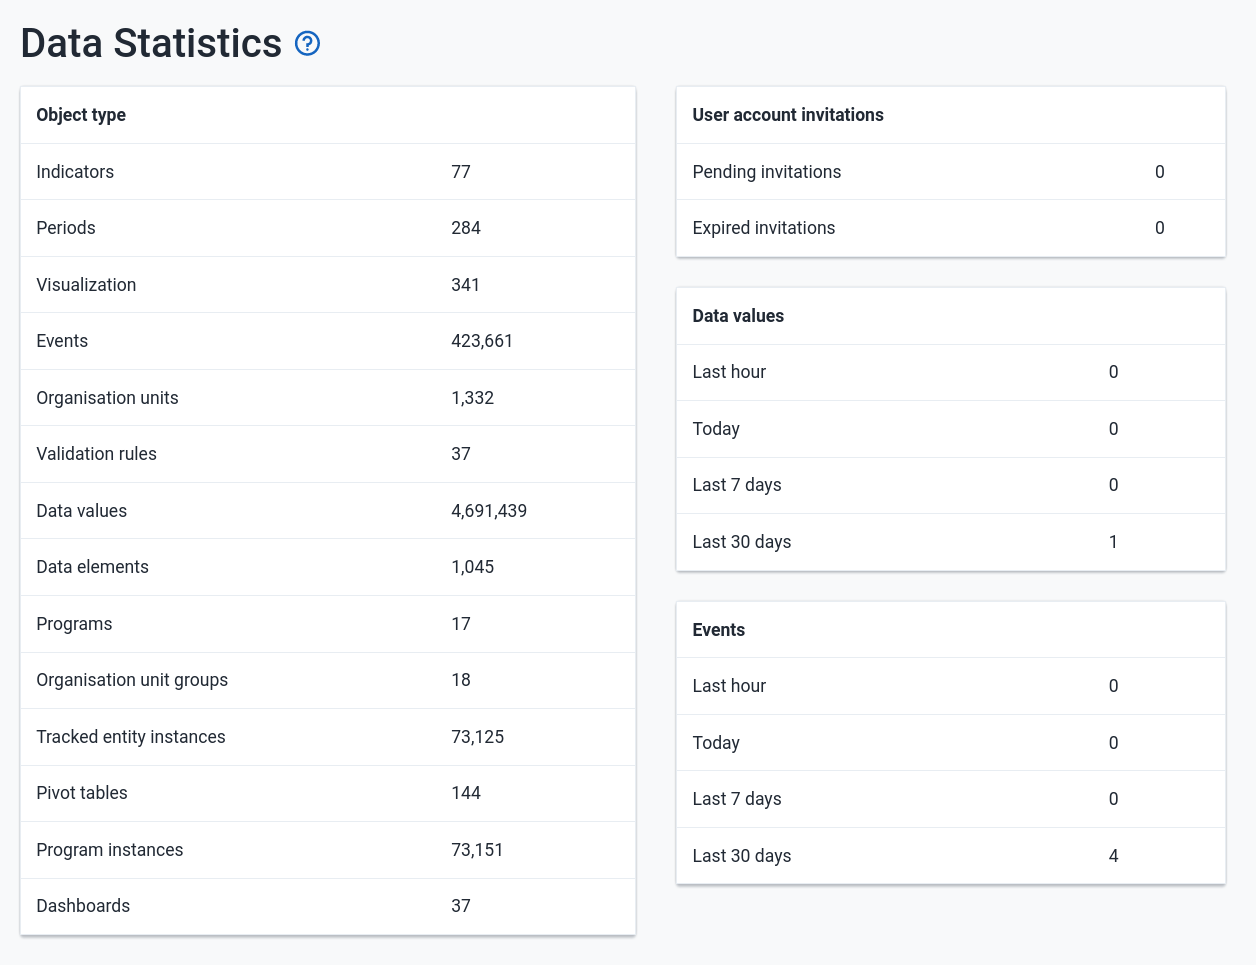
The total number of each type of object is presented in a series of tables with summary statistics of each object.
Lock exceptions provide fine-grained control over exemption from a locked data set. After the expiry of the data set, data entry will be denied by default, unless an exception has been granted through the Lock exception interface.
By granting a lock exception, data entry will be enabled even after the expiry period of the data set has passed.
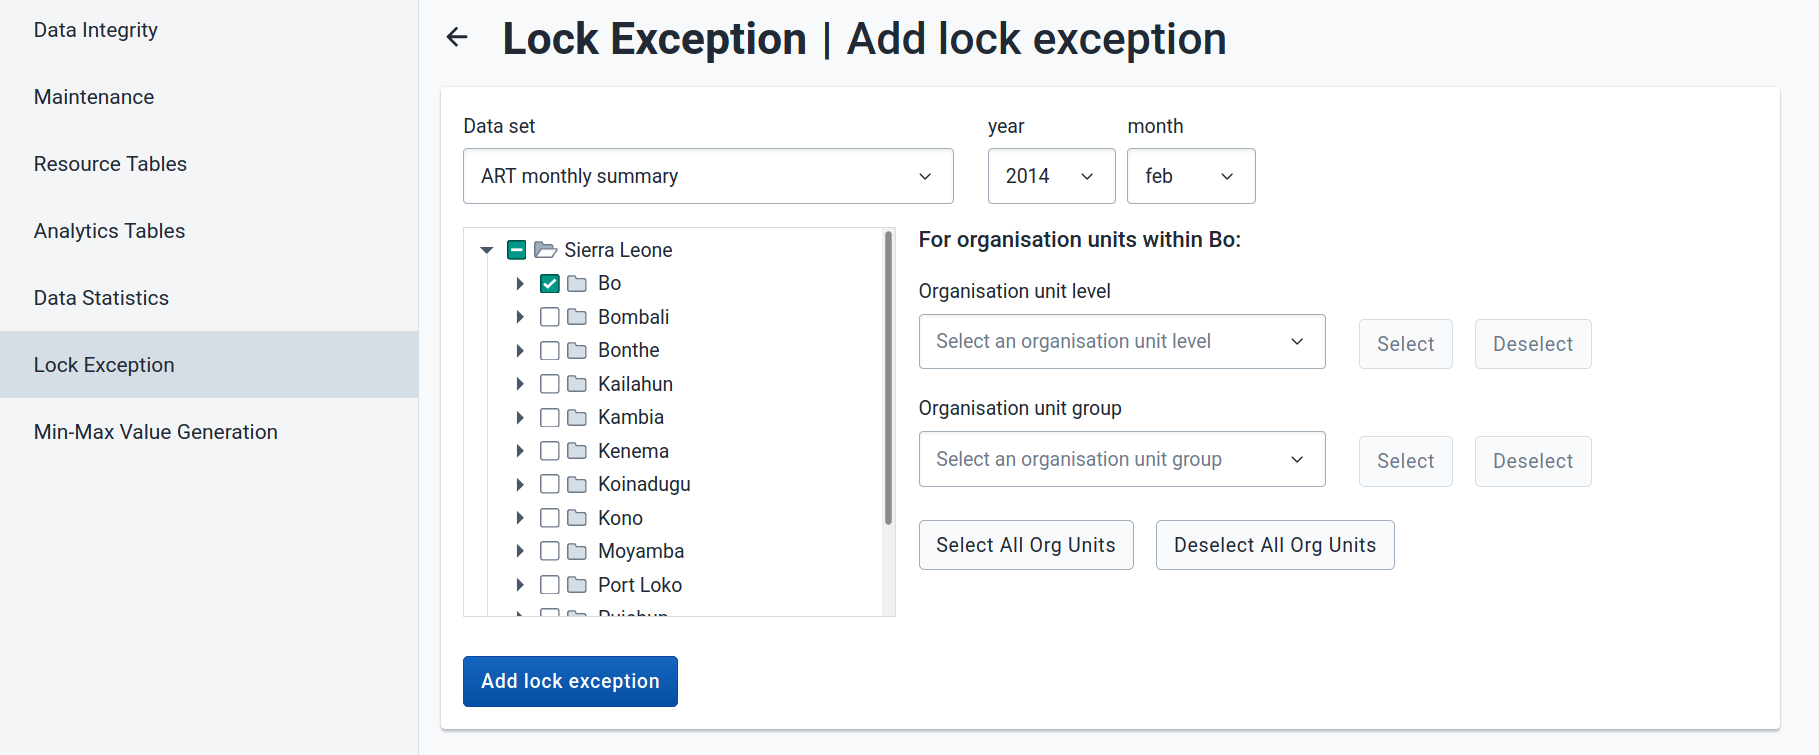
In the example above, a data lock exception would be created for "Bo" for the "ART monthly summary" dataset for "February 2014".
In order to run this function, no extra authority is needed.
This administrative function can be used to generate min-max values, which are used as part of the data quality and validation process for specific organization units and data sets. Simply select the dataset from the left hand frame, and then select the required organisation units to generate the min-max values for from the organisational units selector on the right. Press the "Generate" button to generate or regenerate all min-max values. Press "Remove" to remove all min-max values which are currently stored in the database. In order to run this function, the user MUST have the authority F_GENERATE_MIN_MAX_VALUES.

This option is for system administrators only to use. The cache statistics shows the status of the application level cache. The application level cache refers to the objects and query results that the application is caching in order to speed up performance. If the database has been modified directly the application cache needs to be cleared for it to take effect.
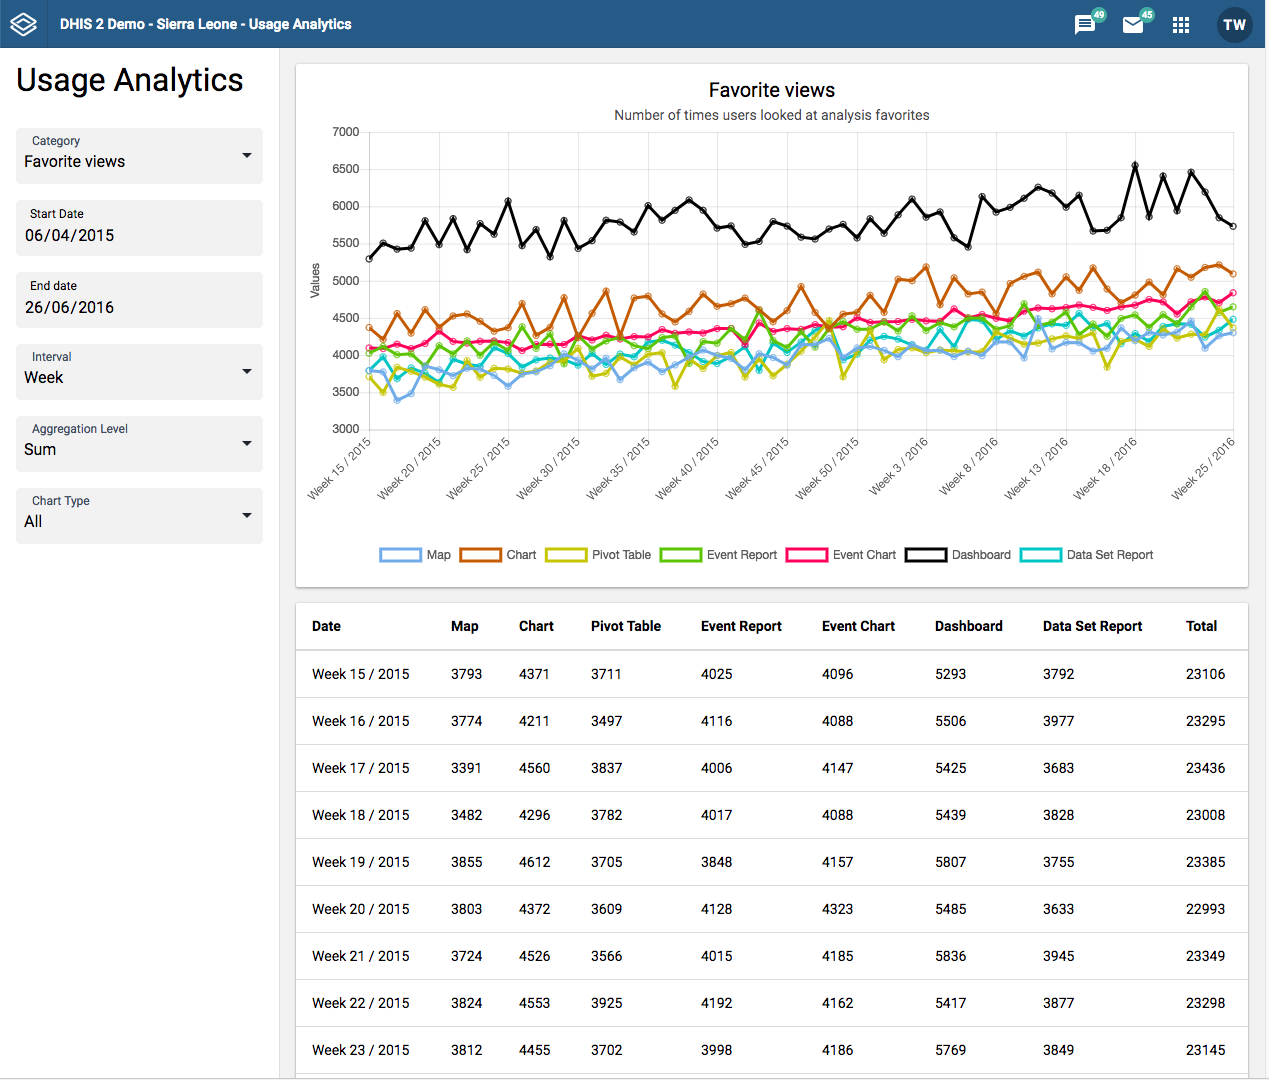
The Usage Analytics app lets you visualize statistics on how users are working with the Dashboard, GIS, Event Visualizer, Data Visualizer and Event Reports apps within DHIS2. With this statistics you can answers questions such as:
How many times people have loaded visualizations and dashboards?
How many favorites have users created?
How many users that are logging in versus total number of users?
What are the most viewed favorites?
Open the Usage Analytics app.
Select a Start date and End date.
Select an Interval: day, week month or year.
Select a Category.
There are five analytics categories:
Favorite views: Provides the number of times various types of favorites have been viewed, such as visualizations and dashboards, over time. This analysis lets you switch between all types of favorites, the total across all types and the average number of views.
Favorites: Provides the number of favorites which have been created and stored in the system over time.
Users: Provides the number of active as well as total number of users over time.
Top favorites: Shows the most viewed favorites in the system by type.
Data values: Provides the number of data values stored in the system over time.
Click Update.
The Datastore Management app is intended for advanced-level DHIS2 users. Read more about the Datastore here: DHIS2 datastore.
The Datastore Management app lets you manage the content of the web API global and user data stores. This is helpful when managing apps and external scripts.
On app load, the datastore loads all the namespaces contained in the global datastore. You can select the type of datastore you want to work with from the available tabs.

In either datastore, you can add a new namespace by clicking the New namespace button.

An Add New Namespace modal appears for the user to add a new namespace and key.

In the namespace list view, search for a particular namespace in the datastore using the search bar in the top left.

Click the delete icon in the actions column of a particular namespace.

A Delete Namespace modal asks you to confirm this action and its repercussions.
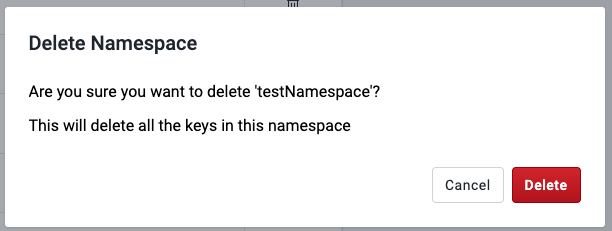
Click a namespace, and the app will redirect to a page displaying all its keys.
When viewing the keys in a namespace, click the New Key button.
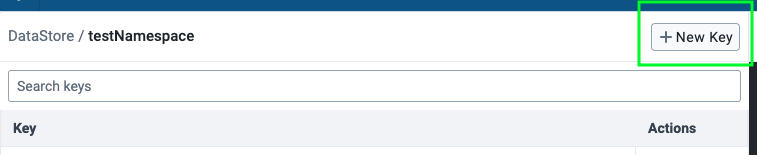
An Add New Key modal appears for you to add a new key to the active namespace.

Search for a particular key in the namespace using the search bar in the top left.

Click the delete icon in the actions column of a particular key.
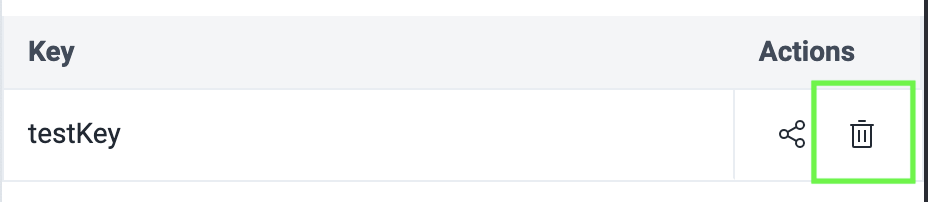
A Delete Key modal asks you to confirm this action and its repercussions.

This option is only available for keys in the global datastore and NOT the user datastore.
Click the share icon in the actions column for the key you want to share.
A Sharing and access dialog appears where you can restrict access settings for different users and groups.
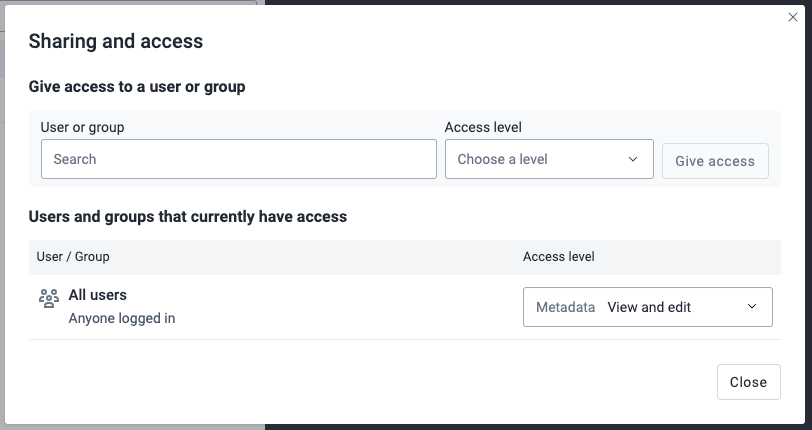
To edit the contents of a key, click on it. Its value will be rendered in the JSON editor on the right, and you can then modify the value within there.
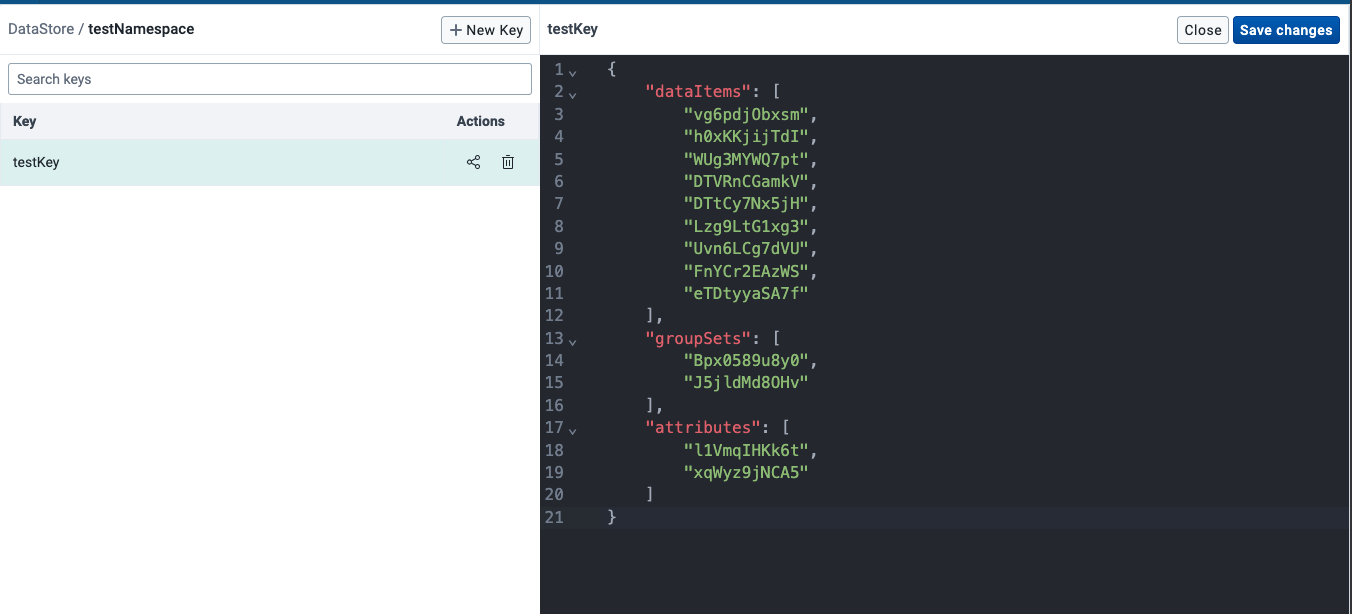
The JSON editor validates the user's input and will show an error if it is not valid JSON. For example:

To find a value within the editor, you can use keyboard commands to open up the search palette, which helps you find and/or replace values within your data. For Windows: Ctrl + F. For MacOS: Cmd + F.

Click the DataStore or UserDataStore link in the left panel header to return to the main page with all the namespaces in the selected datastore.

The Scheduler is an application for managing background jobs in DHIS2. Background jobs can do a number of tasks, such as running analytics, synchronizing data and meta data, or sending a push analysis report. The application provides the ability to create, modify and delete such jobs.
Jobs can be scheduled to run in a specific order with a job queue. A job queue consists of two or more jobs and can be scheduled according to a cron schedule. At the specified time the queue will start the first job and wait for it to finish before it starts the second job. It will continue running jobs in sequence until they have all been executed.
The Scheduler comes bundled with DHIS2 and is accessed through the App Menu.
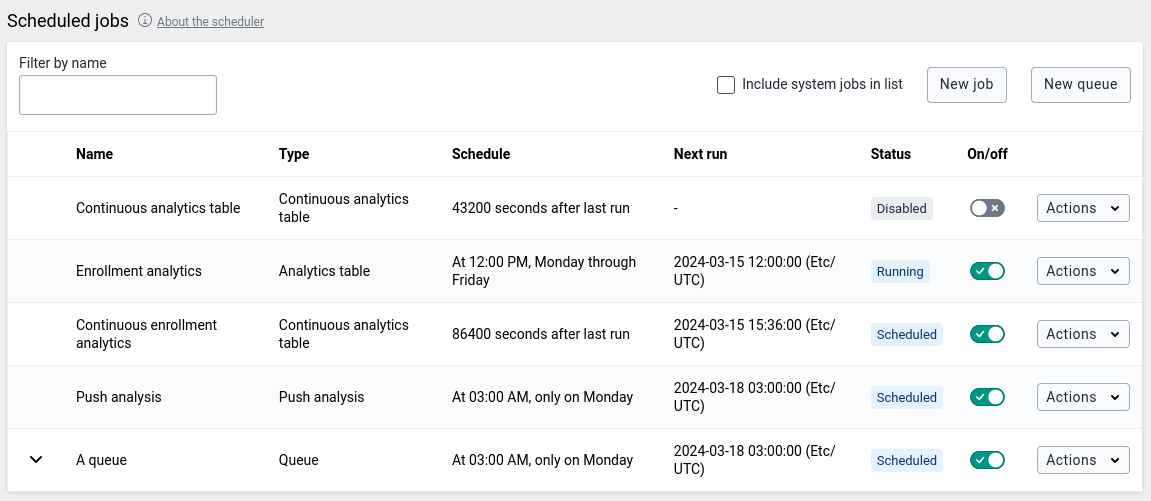
The start page of the Scheduler app shows an overview of existing jobs and queues. By default, pre-defined system jobs are hidden. To view these, click Include system jobs in list in the top right corner.
When you create or modify a job or queue, it will be scheduled according to the selected schedule. To run a job or queue on demand, go to the overview, click the "Actions" button of the job or queue you want to run and click "Run manually". This action is only available for enabled jobs and queues.
Open the Scheduler app and click the "New job" button in the top right corner.
Choose a suitable Name for the new job.
Select the Job type you want to schedule using the drop-down menu.
Select a schedule for the job. Each job type has its own scheduling type, either Cron scheduling or Delay scheduling.
For Cron scheduled job types you can set a schedule using the Spring scheduling syntax. You can also select a predefined Cron expression by clicking "Choose from preset times". This schedule will only start a new job run if the previous job run has finished, to prevent the system from spawning too many jobs.
For Delay scheduled jobs you can set a delay in seconds. Unlike the Cron scheduled jobs, these jobs aren't executed according to a set schedule, but with a specific delay in between job runs. The delay timer starts when a job ends, starting a new job run when the delay timer reaches zero. This will continue as long as the job is enabled.
If the job type is customizable, a Parameters section will appear below the scheduling settings. These additional options specify the details of the scheduled job, and will vary depending on the job type.
Press the Save button to confirm the job creation. On successful job creation you will be redirected to the job overview, where the newly created job will now be listed.
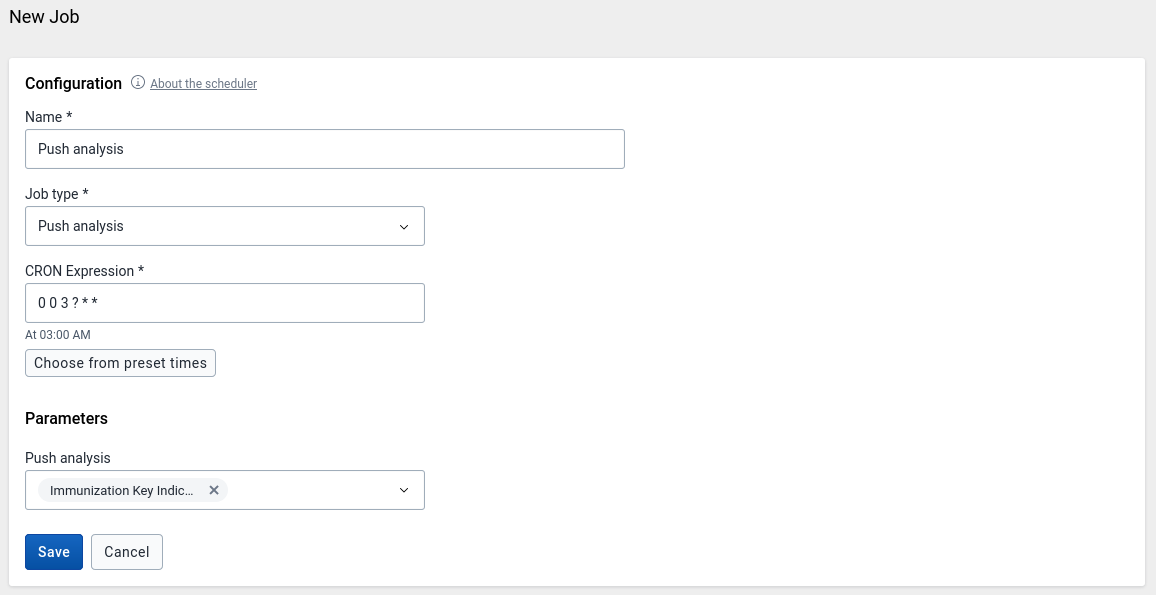
Newly created jobs are enabled by default.
With the proper permissions, you can modify the details of user-created jobs. To quickly enable or disable a user created job from running, use the switches in the On/off column on the landing page of the Scheduler app. Note that system jobs are always enabled and cannot be disabled.
Further editing of user jobs:
Click the "Actions" button of the job you want to edit and click "Edit" (only user jobs can be edited).
When done editing, press the Save button to persist the changes.
Click the "Actions" button of the job you want to delete and click "Delete" (only user jobs can be deleted).
Confirm by pressing Delete again in the pop-up window.
User jobs can also be deleted from the editing screen.
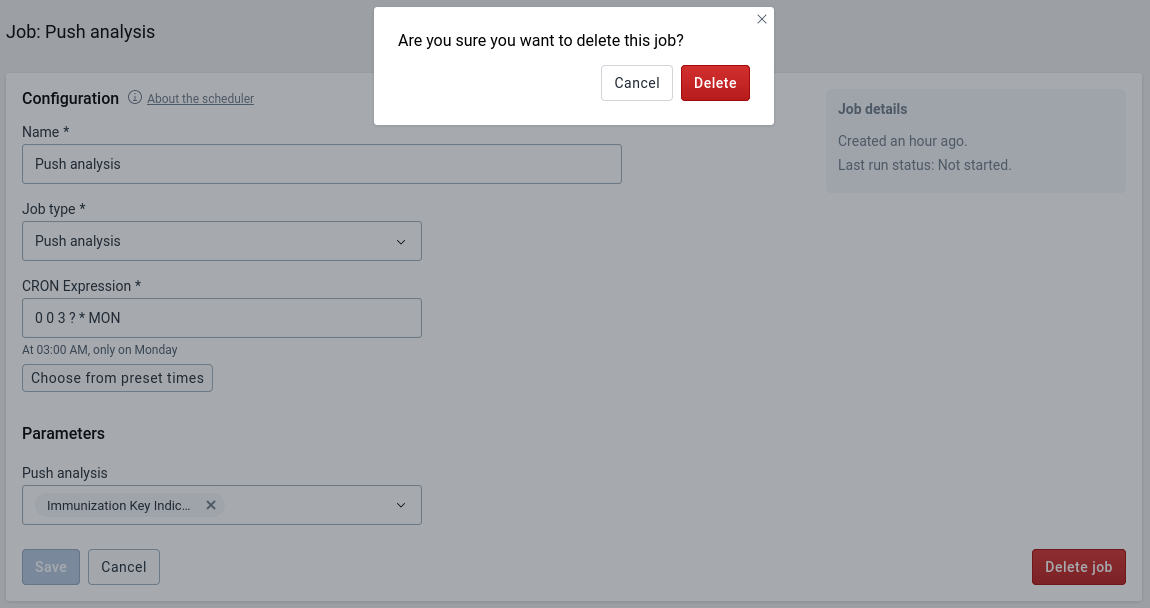
The following section describes the various job types.
Users that have not been active - not logged in - for a number of months can automatically be disabled. Select the number of inactive months as the job parameter. All users that have not logged in for that number of months or longer will be disabled by the job. Disabled users will no longer be able to log into the system.
The Reminder days before parameter can be set to send a reminder email to those users the specified number of days before their account is due to expire. If users do not log in further reminder emails are sent each halving the previous number of days. For example if the number of days is set to 7 the first email is sent 7 days in advance, the second 3 days and the third and last 1 day in advance. If the value is not set (blank) no reminder is sent.
The resource table job is responsible for generating and updating the resource database tables. These tables are used by various components in DHIS 2 and is meant to simplify queries against the database.
Note that when specifying any of the analytics table jobs, resource tables can be part of the process and it is not necessary to also specify a resource table job.
The analytics tables job is responsible for generating and updating the analytics tables. The analytics tables are used as basis for data analytics queries in DHIS2. Apps such as dashboard, visualizer and maps retrieve data from these tables through the DHIS2 analytics API, and they must be updated in order for analytics data to become available. You can schedule this process to run regularly through an analytics table job type.
The analytics table job will by default populate data for all years and data elements. The following parameters are available:
The analytics tables job is responsible for generating and updating the analytics tables. The analytics tables are used as basis for data analytics queries in DHIS2. Apps such as dashboard, visualizer and maps retrieve data from these tables through the DHIS2 analytics API, and they must be updated in order for analytics data to become available. You can schedule this process to run regularly through an analytics table job type.
The continuous analytics table job is based on two phases:
The continuous analytics table job will frequently update the latest data. The latest data process utilizes a special database partition which is used to hold the latest data only. This partition can be quickly refreshed due to the relatively small amount of data. The partition will grow in size until a full update is performed. Once per day, all data for all years will be updated. This will clear out the latest partition.
The analytics table job will by default populate data for all years and data elements. The following parameters are available:
The Tracker Trigram Index Maintenance Job is responsible for creating and updating partial trigram indexes for relevant tracked entity attributes on the trackedentityattributevalue table. These partial trigram indexes significantly improve the performance of searches on tracked entities.
A partial trigram index is created for a tracked entity attribute on the trackedentityattributevalue table if both of the following conditions are met: - The tracked entity attribute has the flag trigramindexable set to true. - The tracked entity attribute allows the use of at least one of the following operators: LIKE or EW.
The job also removes obsolete partial trigram indexes that were previously created but have since become unnecessary because one or both of the above conditions are no longer satisfied.
A trigram index only takes effect if the searched text is at least 3 characters long. For this reason, it is recommended to configure the tracked entity attribute intended for trigram indexing with a minimum search length of 3 characters. This can be set using the property minCharactersToSearch.
The job accepts one parameter: runAnalyze. This is a boolean flag. When set to true, the job will execute an ANALYZE command on the trackedentityattributevalue table. Running ANALYZE updates PostgreSQL column statistics, enabling the query planner to make accurate decisions about when to use the trigram index for optimal query performance.
DHIS2 provides synchronisation of data between remotely distributed instances and a central instance of DHIS2. This can be useful e.g. when you have deployed multiple stand-alone instances of DHIS2 which are required to submit data values to a central DHIS2 instance. Both tracker data and aggregate data synchronization is supported.
These are the steps to enable data synchronization:
Go to Synchronization Settings, enter the remote server URL, username and password. Press the TAB button to automatically save the new password. Refresh the page and check that the filled values are still present. Note that the password field will be empty after the refresh, since this value is encrypted, so you can consider it saved.
Using the Scheduler app, create a new job using the "Single events data synchronization" and/or "Tracked entities data synchronization" job type. Make sure it is enabled when you finish.
Note
These two job types replace the "Event Programs Data Sync" and "Tracker Programs Data Sync" jobs available in versions prior to 2.42. There is no automatic migration: when upgrading from 2.41 or earlier, any existing tracker or event program synchronization jobs are not carried over, and you must create a new job configuration for each of them using the new job types.
Some aspects of the data synchronization feature to be aware of:
The local DHIS2 instance will store the password of the user account on the remote instance encrypted in the local database. The remote account is used for authentication when transferring data. For security purposes make sure you set the encryption.password configuration parameter in hibernate.properties to a strong password.
Deploying the remote server on SSL/HTTPS is strongly recommended as the username and password are sent in clear text using basic authentication and could be intercepted by an attacker.
The data synchronization uses the UID property of data elements, category option combos and organisation units to match the meta-data. Hence the synchronization is dependent on these three meta-data objects being harmonized on the local and remote instance in order to work appropriately.
The first time DHIS2 runs the synchronization job, it will include any data available. The subsequent synchronization jobs will only include data added and changed since the last successful job. A synchronization job is considered successful only if all the data was saved successfully on the remote server (Any data successfully synced will remain on the receiving instance, regardless if the job eventually fails). Whether the job was successful or not can be decided from the import summary returned from the central server.
The initial synchronization job may take a significant amount of time, possibly slowing down your instance, depending on how much data is being synchronized. It could be a good idea to configure the job to run when there are few online users, then later change this to your own preference. If you do not want or need to synchronize all the data, there is a possibility to skip some of the data being synchronised.
When DHIS2 synchronizes tracker data, it determines the set of data to synchronize based on the last time it was synchronized. Each of the tracked entity instances and events have their own records of when they where last successfully synchronized.
The system will start a synchronization job based on the rules set in the configuration of the job. If the synchronization job starts while there is no connection to the remote server, it will retry up to three times before it aborts. The job will run again at a scheduled time.
The server handles each set of programs separately, which means one set of programs can be synchronized successfully, while the other fails. The failure or success of one doesn't influence the other, as the last successful synchronization time is tracked individually for each item as previously mentioned.
The attributes of TrackedEntityInstances (TrackedEntityAttribute) and the data elements of ProgramStages (ProgramStageDataElement) which have an option "Skip synchronization" turned on will not be synchronized. This feature allows you to decide to not synchronize some sensitive or not relevant data and to keep them only locally.
The authority Ignore validation of required fields in Tracker and Event Capture (F_IGNORE_TRACKER_REQUIRED_VALUE_VALIDATION) should be used when there is a requirement that some mandatory attribute / data element has at the same time a "Skip synchronization" property turned on. Such a setting will lead to validation failure on the central server as the given attribute / data element will not be present in the payload.
The validation won't fail for the user with this authority. The authority should be assigned to the user, on the central server, that will be used for synchronization job.
The syncSkipSyncForDataChangedBefore SettingKey can be used to skip the synchronisation of all the data (data values, Event and Tracker program data, complete data set registrations) that were last changed before the specified date. The SettingKey is used in the synchronization job all the time. Therefore, if you need to synchronize the old data, you should change the SettingKey.
If the default value does not fit your purpose, your own page size can be specified via the parameter in the particular sync job in the Scheduler app. The allowed page size ranges from a minimum of 5 to a maximum of 200.
DHIS2 provides a feature for synchronizing meta data from a remote instance to a local instance of DHIS2. This can be useful when you have deployed multiple stand-alone instances of DHIS2 and you need to create meta data in all the local instances similar to the central DHIS2 instance.
These are the steps to enable meta data synchronization:
Go to Settings > Synchronization, enter the remote server URL, username and password and click Save.
Using the Scheduler app, create a new job using the "Metadata synchronization" job type.
Some aspects of the meta data synchronization feature to be aware of:
The local DHIS2 instance will store the password of the user account of the remote instance in its database. The remote user account is used for authentication when transferring/downloading data. For security purposes make sure you set the encryption.password configuration parameter in hibernate.properties to a strong password.
Deploying the remote server on SSL/HTTPS is strongly recommended as the username and password are sent in clear text using basic authentication and could be intercepted by an attacker.
Also ensure that the remote user is not having ALL authority, instead simply create a user with F_METADATA_MANAGE authority so that even if these details are intercepted by a hacker, one cannot have full control of the remote system.
The meta data synchronization relies on the underlying import layer. Each meta data version is an export of meta data between two given timestamps. Each sync of meta data version is an attempt to import that meta data snapshot into the local instance. The sync of versions is incremental. The local instance will try to download the meta data versions from the central instance one after the other. Failure to sync a specific meta data version will not let the sync proceed to further versions. In case of failures, appropriate changes must be made to meta data at central to ensure that the error gets resolved. Metadata configuration is critical and the user should be careful while rolling out the updates to the production. It's always recommended to have staging environments in place to ensure the sanity of the meta data versions and their impact thereafter. The local instance will sync the meta data from first version so that harmony is maintained and local and central instance will work appropriately.
The system will attempt a synchronization at the scheduled time. If the local or remote server does not have a working Internet connection at the time, the synchronization will be aborted and re-attempted after as per the retry count as mentioned in the dhis.conf file.
You can see the time of last successful synchronization with remote server in the scheduling screen next to the "Last success" label.
This runs selected predictors and/or predictor groups.
The relative start and end parameters determine the periods in which data will be predicted, corresponding to the date on which the predictor job is run:
Relative start counts the days from the job date to the earliest date on which a predicted period may start. It can be positive or negative. For example, a value of 3 means predict into periods that start at least 3 days after the predictor run. A value of -3 means predict into periods that start at least 3 days before the predictor run.
Relative end counts the days from the job date to the latest date on which a predicted period may end. It can be positive or negative. For example, a value of 9 means predict into periods that end at least 9 days after the predictor run. A value of -9 means predict into periods that end at least 9 days before the predictor run.
Setting these values can give you very flexible control over when predictions will be made, especially if your predictor job is set to run daily or more frequently. Before you set these values, you should think carefully about when you want predictions for a period to start being made, and when you want them to stop being made. Then you need to compute the appropriate relative start and end dates.
Examples:
Requirement: A predictor uses data from the same week as the predicted value. (No past sampled data are used.) After the week ends on Sunday, you expect the data to be entered in the following two days (Monday and Tuesday). You don't want to start predicting data until Wednesday after the week ends because you don't want partial results to be shown. However, data may still be adjusted on Wednesday, so you want to update the predictions also on Thursday. After that, the data are frozen and you don't want to predict for that period anymore.
**Solution:** For a job running daily or more frequently, define the
relative start as -10 and the relative end as -2 (for periods
within 10 to 2 days before the job runs).

- Before Wednesday of the following week, the period end is
greater than 2 days before, so no predictions are made.

- On Wednesday of the following week, the period started 9 days
before and ended 2 days before. Predictions are made because -9 to -2
are within the range -10 to -2.

- On Thursday of the following week, the period started 10 days
before and ended 3 days before. Predictions are made because -10 to -3
are within the range -10 to -2.

- After Thursday, the previous week started more than
10 days before, so no predictions are made.

- Predictions are made only on Wednesday and Thursday. On Friday through
Tuesday, no predictions are made (and the job finishes very quickly).
Requirement: A predictor is used to forecast a limit (average plus twice the standard deviation) for expected non-seasonally varying disease cases based on data from the previous five weeks. Weeks are Monday through Sunday. Predictions should start being made from the previous Tuesday, using available data at that time, and continue being made through Tuesday of the week that the predictions are being made for (by which time it is assumed that the previous week's data are final).
**Solution:** For a job running daily or more frequently,
define the relative start as -1 and the relative end as 12.

- Before Tuesday, predictions will not be made for the following week because it
ends more than 12 days later.

- On Tuesday, predictions will be made for the following week which starts
in 6 days and ends in 12 days.

- On Wednesday through the following Tuesday, predictions will be made for
the week whose start-to-end dates are Wed: 5 to 11, Thu: 4 to 10,
Fri: 3 to 9, Sat: 2 to 8, Sun: 1 to 7, Mon: 0 to 6, and Tue: -1 to 5.

- Note that on Tuesday, predictions are made for the current week with
start-to-end dates -1 to 5, and also for the following week
with start-to-end dates 6 to 12. On all other days of the week
predictions are made for one week.
You can select which predictors and predictor groups will run during the job:
Predictors runs individual predictors. They run in the order added.
Predictor groups runs predictor groups. They run in the order added. The predictors within each group run in the order of their names (comparing Unicode character values).
If both individual predictors and predictor groups are selected in the same job, the individual predictors run first, followed by the predictor groups.
The Data Integrity job type is responsible for scheduling data integrity checks. DHIS2 can perform a wide range of data integrity checks on the data contained in the database. Identifying and correcting data integrity issues is extremely important for ensuring that the data used for analysis purposes is valid. Each of the data integrity checks that are performed by the system will be described, along with general procedures that can be performed to resolve these issues.
The result of the data integrity checks can be viewed in the Data Administration app. As of 2.41 the result of the data integrity checks are only available for up to one hour after the job has completed.
Some data integrity checks are marked as slow. Users should be cautious about running these checks on production systems as they could lead to decreased performance. It's generally not recommended to run more than one of these at the same time.
The following parameters are available:
See Data Administration for more information about the available data integrity checks.
Open the Scheduler app and click the "New queue" button in the top right corner.
Choose a suitable Name for the new queue.
Select a cron schedule for the queue. Queues can be scheduled using the Spring scheduling syntax, just like jobs. You can also select a predefined Cron expression by clicking "Choose from preset times".
Select the jobs that should be part of the queue. The available jobs can be added to the queue with the arrow buttons. The queue will run the jobs in the order specified here.
Press the Save button to confirm the queue creation. On successful queue creation you will be redirected to the jobs and queue overview, where the newly created queue will now be listed. The queue will have a dropdown arrow that can be clicked to show the jobs that are part of the queue.
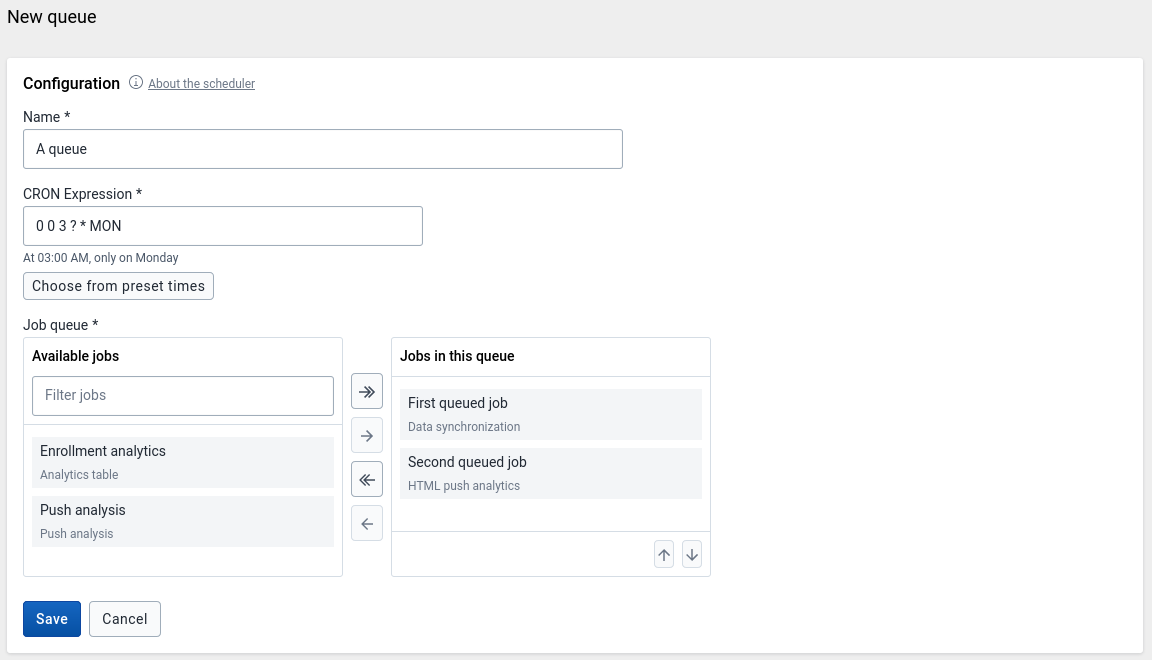
Newly created queues are enabled by default.
With the proper permissions, you can modify the details of queues. To quickly enable or disable a queue from running, use the switches in the On/off column on the landing page of the Scheduler app.
Further editing of queues:
Click the "Actions" button of the queue you want to edit and click "Edit".
When done editing, press the Save button to persist the changes.
If jobs were removed from the queue, they will be displayed again in the overview. But since they were part of a queue, they will be disabled and without a schedule.
Click the "Actions" button of the queue you want to delete and click "Delete".
Confirm by pressing Delete again in the pop-up window.
All jobs that were part of the queue will be displayed again in the overview. But since they were part of a queue, they will be disabled and without a schedule.
Queues can also be deleted from the editing screen.

In a primary health system, the HMIS typically involves a distributed application, where the same application is running in different geographical locations (PHCs,CHCs, hospitals, districts, and state). Many of these physical locations do not have Internet connectivity, and hence they work off-line. At some point (normally at the district level), the data needs to be synchronised in order to have a consolidated database for the a particular geographical region. For this, it is important to be able to export data from one location (which is working offline, say at the health facility level) and import into another one (say at the district level). This feature of exporting and importing is thus a crucial function of a HMIS. This feature also helps us overcome the dependency on the Internet to some degree, as data updates can be transferred via USB key where there is no connectivity, or through email where there is limited Internet connectivity. DHIS2 provides robust import-export functionality to fulfil these needs.
To access the Import/Export app, search in the top header bar for Import/Export. Import/Export app offers a number of services details for which can be found below.
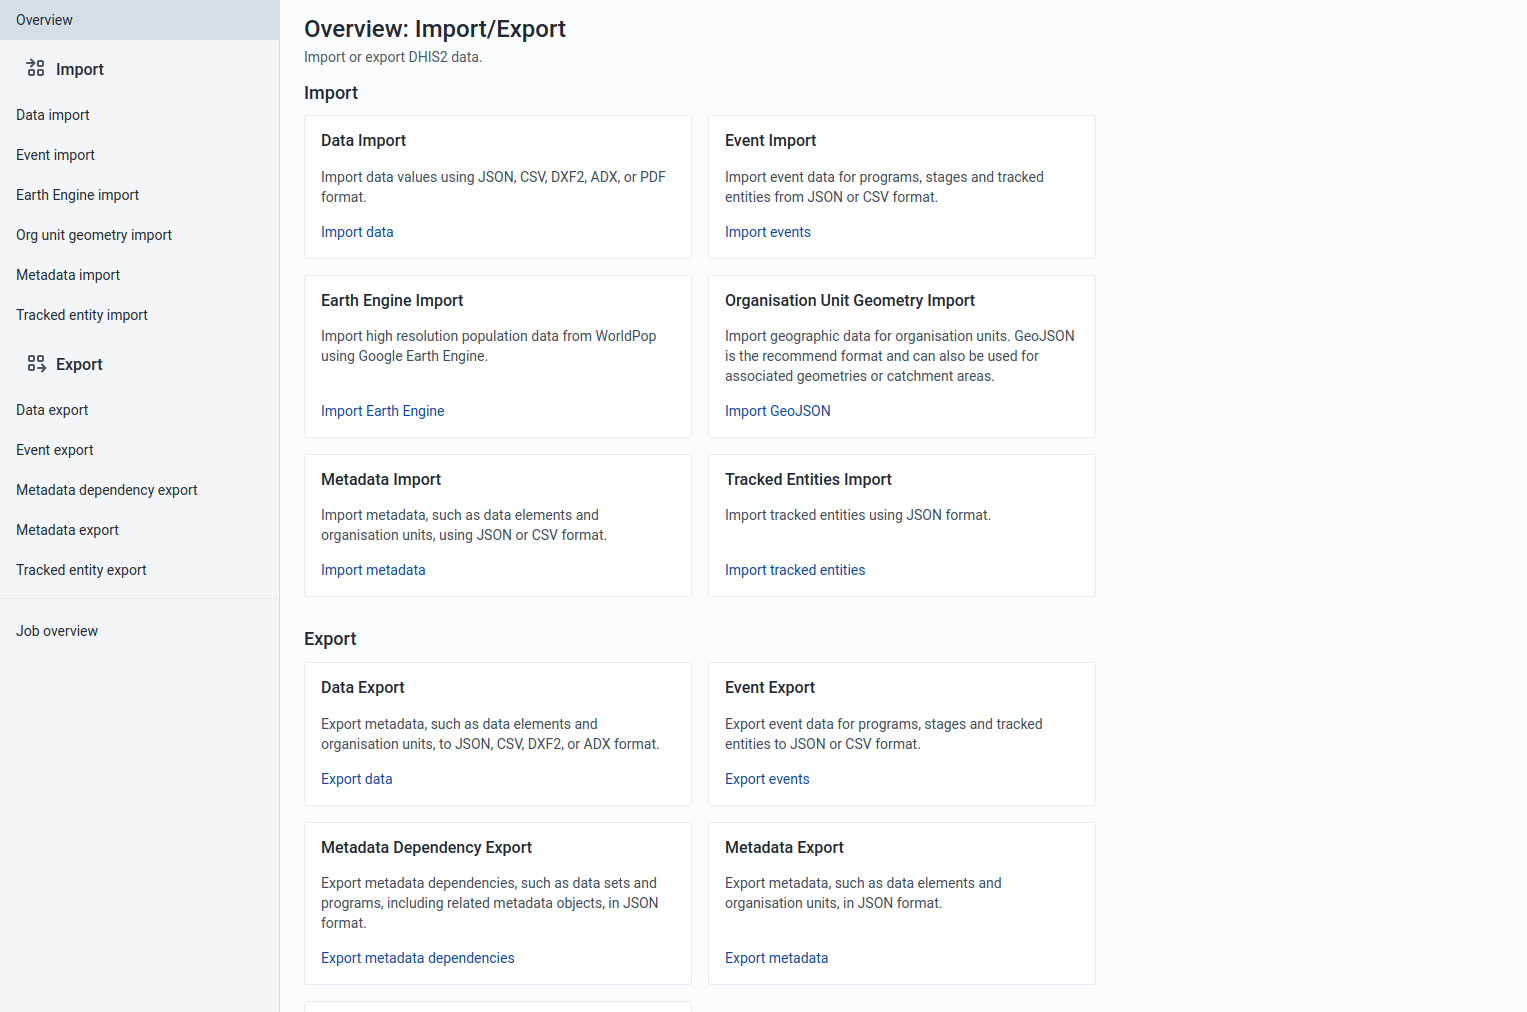
No matter what you import ("Data", "Events", "Org unit geometry", "Metadata" or "Tracked entity" data), you can always view the progress of the import by looking at the "Job Summary" at the top of the page.
On import request completion, we show import summaries above the import form. Any conflicts or errors are shown in the table under the main summary for the import.

Metadata Import can be accessed from the sidebar by clicking on Metadata Import.
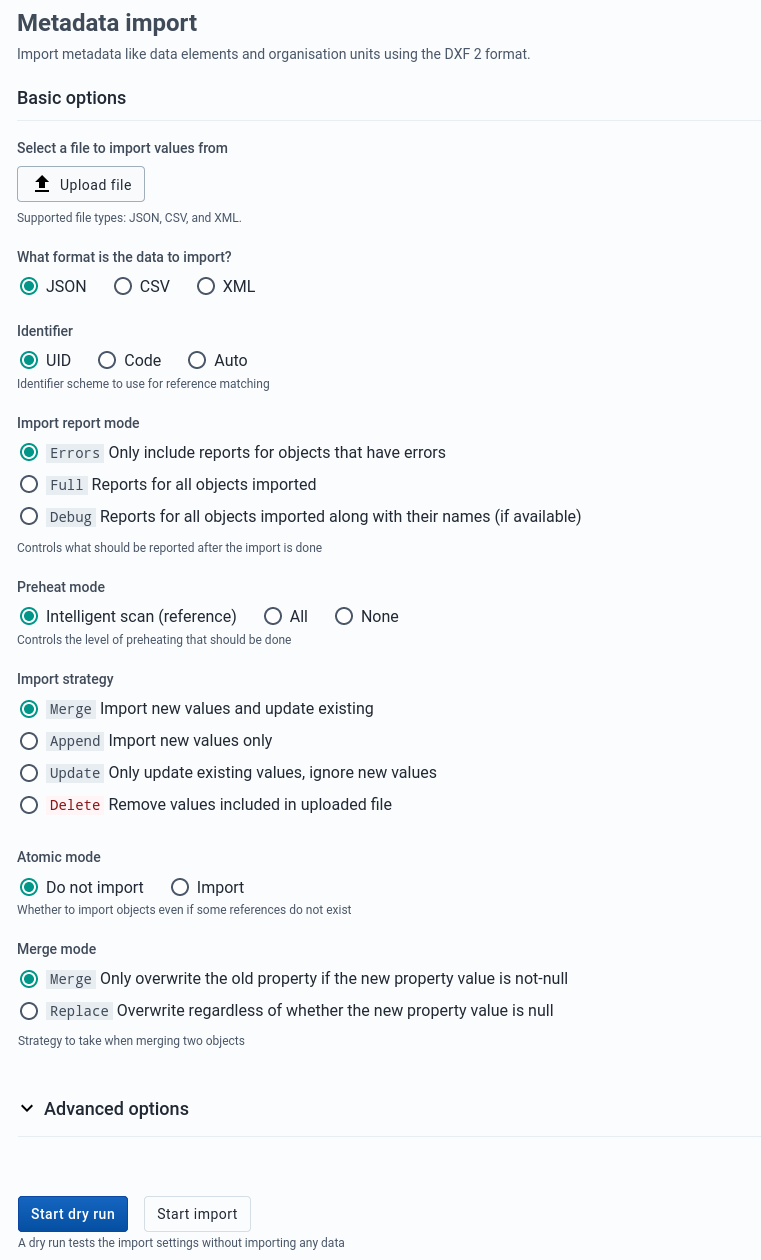
Choose a file to upload
Select a format: JSON , CSV, or XML
Select the appropriate settings for:
Click Advanced options if you want to adjust one or more of the following settings before importing:
Click on the Import button which will upload the file and start the importing process.
Tip
It is highly recommend to use the Dry run option to test before importing data; to make sure you keep control over any changes to your Metadata, and to check for problems with out-of-sync data elements or organisation unit names
Note
If an organisation unit e.g.
Nduvuibu MCHPhad a unknown reference to an object with IDaaaU6Kr7Gtpidn, it means that the object with IDaaaU6Kr7Gtpidnwas not present in your imported file, and it was not found in the existing database.You can control this using Identifier option, to indicate if you want to allow objects with such invalid references to be imported or not. If you choose to import invalid references you will have to correct the reference manually in DHIS2 later.
The DXF2 format currently support matching for two identifiers, the internal DHIS2 identifier (known as a UID), and also using an external identifier called called a "code". When the importer is trying to search for references (like the one above), it will first go to the UID field, and then to the code field. This allows you to import from legacy systems without having a UID for every meta-data object. I.e. if you are importing facility data from a legacy system, you can leave out the ID field completely (DHIS2 will fill this in for you) and put the legacy system's own identifiers in the code field, this identifier is required to be unique. This not only works for organisation units, but for all kinds of meta-data, allowing for easy import from other systems.
Data Import can be accessed from the sidebar by clicking on Data Import.
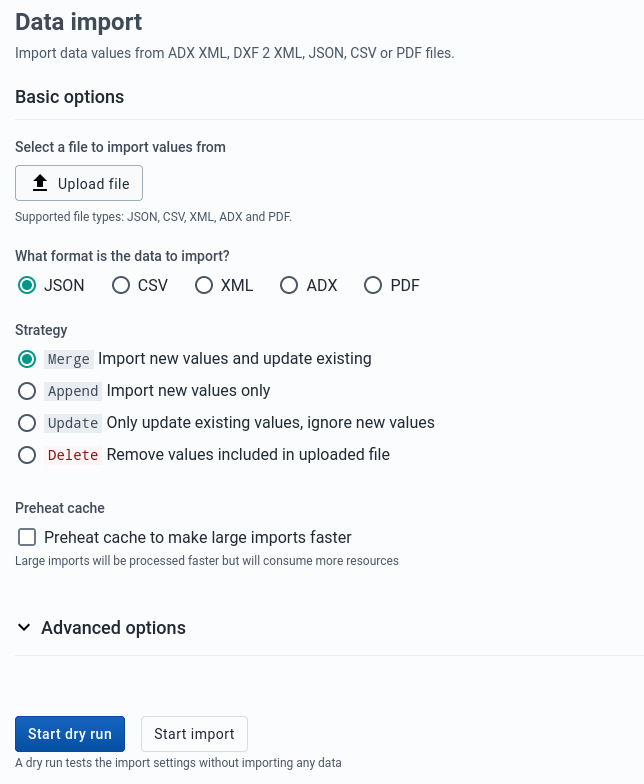
Choose a file to upload
Select a format: JSON, CSV, XML, ADX, or PDF
Select the appropriate settings for:
Click Advanced options if you want to adjust one or more of the following settings before importing:
Click on the Import button which will upload the file and start the importing process.
Tip
It is highly recommend to use the Dry run option to test before importing data; to make sure you keep control over any changes to your Metadata, and to check for problems with out-of-sync data elements or organisation unit names
DHIS2 supports import of data in the PDF format. This can be used to import data produced by off-line PDF data entry forms. Please refer to the section Data set management for details on how to produce a PDF form which can be used for off-line data entry.
To import a PDF data file, navigate to the PDF Data Import item in the side menu. Upload the completed PDF file and click Import.
Event Import can be accessed from the sidebar by clicking on Event Import.

Select a format: JSON or CSV.
Click Advanced options if you want to adjust one or more of the following settings before importing:
Click on the Import button which will upload the file and start the importing process.
Earth Engine Import can be accessed from the sidebar by clicking on Earth Engine Import.
Import high resolution population data from WorldPop using Google Earth Engine. A Google Earth Engine account is required to use this importer.
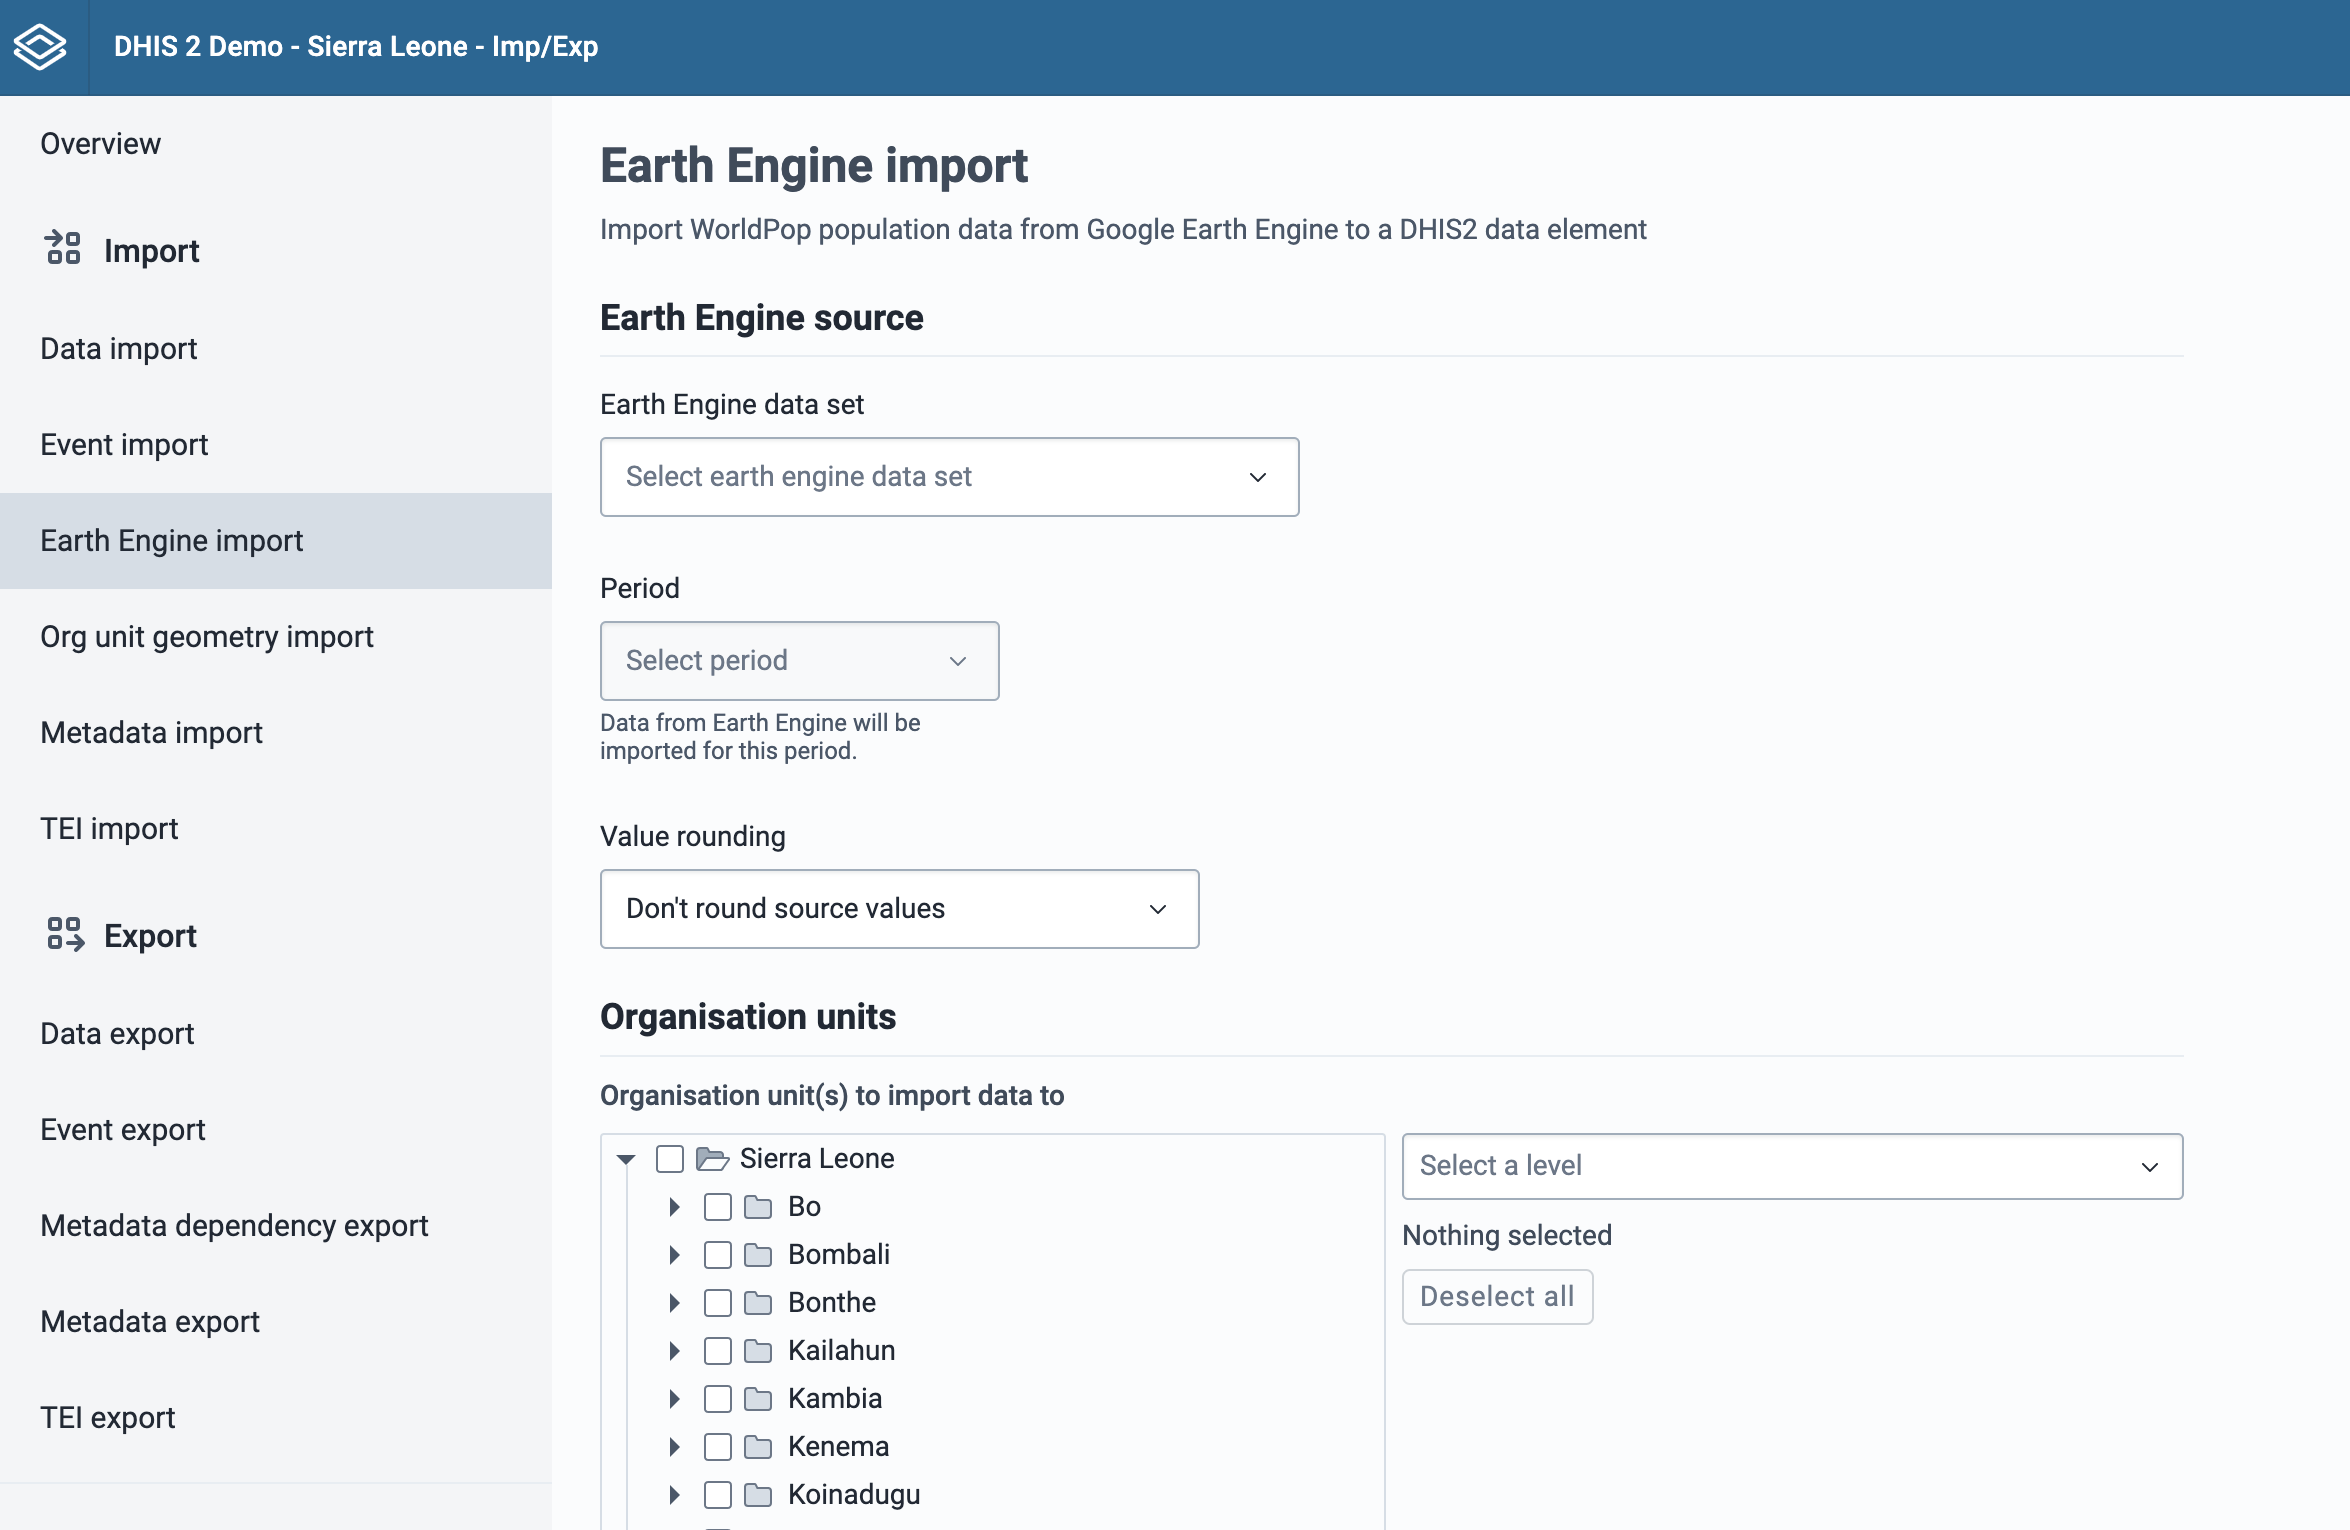
The first section of the form is used to configure the Earth Engine data to import.
Select which Earth Engine dataset should be imported. Currently the choices are Population and Population age groups.
After a dataset has been selected, a period must be selected. Only one period can be imported at a time.
Choose how the data should be rounded. By default data is not rounded.
Select which organisation units to import data to. If you select facility level organisation units, then you must choose an associated geometry for the facilities. Without an associated geometry for facilities, the Earth Engine cannot determine the population.

Once you have configured the Earth Engine dataset, you need to select which data element to import the data to. For datasets with disaggregation groups, such as "Population age groups", the DHIS2 data element must have disaggregations in the form of category option combos that match the Earth Engine dataset disaggregation groups.

Configuring data elements for Earth Engine import
When configuring the DHIS2 data elements that will contain Earth Engine data, if you plan to import data to multiple org unit levels, ensure that those levels are added as Aggregation Levels in the data element configuration.
Some Earth Engine datasets contain disaggregation groups, the DHIS2 data element must be configured with corresponding category option combos. For example the "Population age groups" dataset is disaggregated by gender (Male, Female) and 5-year age groups.
In DHIS2 this means that you must have a Male/Female category, and a 5-year age group category (<1yr, 1-4yr, 5-9yr, 10-14yr... 80+yr). These are combined into a category combination.
Pro-tip: To automatically match the category option combo to the Earth Engine disaggregation group, add a Code to each category option combo that matches the earth engine group name. For example, with "Population age groups", the groups are named: F_0, F_1, F_5..., M_0, M_1, M_5...
Once the data element and category option combos have been selected, the Preview button is enabled. After reviewing the data you want to import, you can do a dry run first, or proceed with the actual import.

Accessed from the sidebar by clicking on Org Unit geometry import. Two geometry formats are supported: GeoJSON and GML. GeoJSON is the recommended format and can also be used to import associated geometries (catchment areas).

Upload a file using the GeoJSON format.
By default the GeoJSON feature id should match the organisation unit id.
Check Match GeoJSON property to organisation unit scheme to match by a feature propery. Type the GeoJSON property name and select the Organisation unit ID scheme (Id, Code or Name).
Check Import as associated geometry to import the GeoJSON features as associated geometries the organisation units (e.g. catchment areas). Select at geometry attribute where the data should be imported. This requires an attribure of type GeoJSON applied to Organisatiot unit. This attribute can be defined in the Maintenance app.
Click on the Start import button which will upload the file and start the importing process.
Tip
It is highly recommend to use the Dry run option to test before importing data; to make sure you keep control over any changes to your organisation unit geometries.

Upload a file using the GML (Geographic Markup Language) format.
Click on the Import button which will upload the file and start the importing process.
Tracked entities import can be accessed from the sidebar by clicking on Tracked entity import.

Choose a JSON file to upload
Select the appropriate settings for:
Click Advanced options if you want to adjust one or more of the following settings before importing:
Click on the Import button which will upload the file and start the importing process.
Tip
It is highly recommend to use the Dry run option to test before importing data; to make sure you keep control over any changes to your tracked entities.
Metadata export can be accessed from the sidebar by clicking on Metadata export.
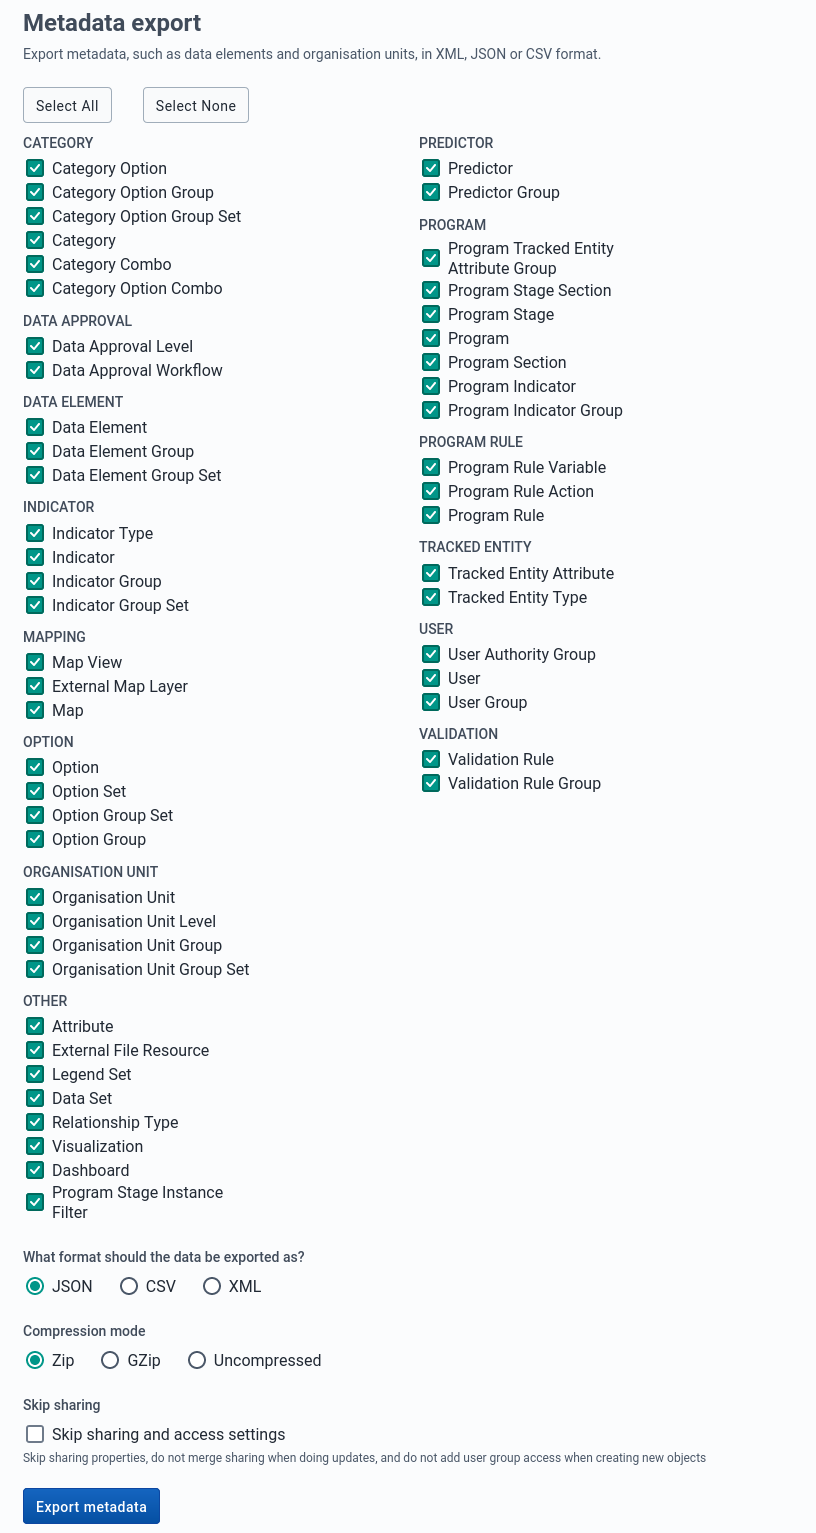
Choose the list of objects you would like to export.
Select a format: JSON
Select a compression type: zip, gzip or uncompressed
Decide whether to check Skip sharing and access settings
Click Export metadata which will open a new web-browser window that will give you a file to download to your local computer.
Metadata export with dependencies lets you create canned exports for metadata objects. This type of export will include the metadata objects and the metadata object's related objects; that is, the metadata which belong together with the main object.
| Object type | Dependencies included in export |
|---|---|
| Data sets | Data elements Sections Indicators Indicator types Attributes Data entry forms Legend sets Legends Category combinations Categories Category options Category option combinations Option sets |
| Programs | Data entry form Tracked entity Program stages Program attributes Program indicators Program rules Program rule actions Program rule variables Program attributes Data elements Category combinations Categories Category options Category option combinations Option sets |
| Category combination | Category combinations Categories Category options Category option combinations Attributes |
| Dashboard | Dashboard items Charts Event charts Pivot tables Event reports Maps Reports Resources |
| Data element groups | Data elements Category combinations Categories Category options Category option combinations Option sets Attributes Legend sets Legends |
| OptionSets | Option |
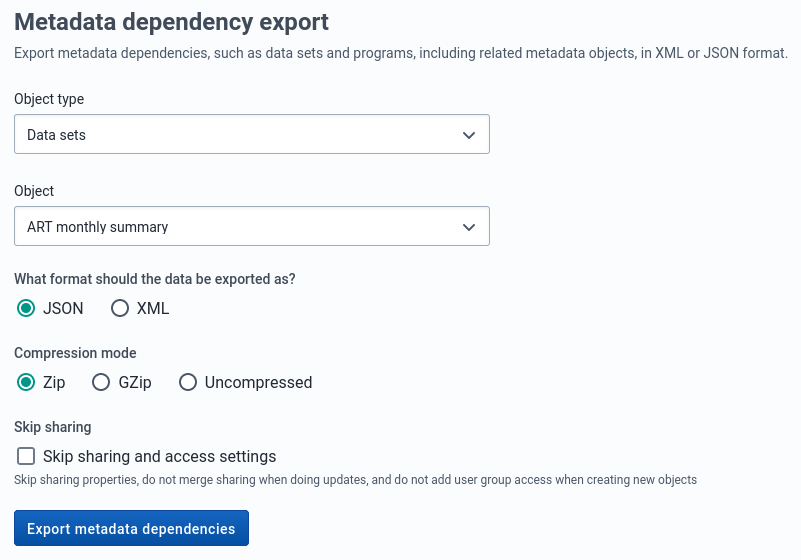
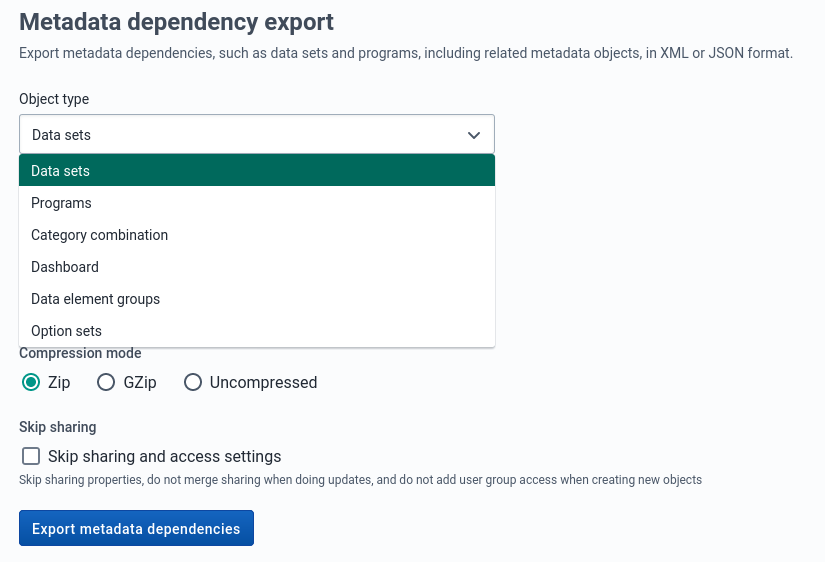
Select an object type: Data sets, Programs, Category combination, Dashboard, Data element groups or OptionSets.
Select an object.
Select a format: JSON
Select a compression type: Zip , GZip or Uncompressed
Click Export metadata dependencies which will open a new web-browser window that will give you a file to download to your local computer.
Data export can be accessed from the sidebar by clicking on Data export.
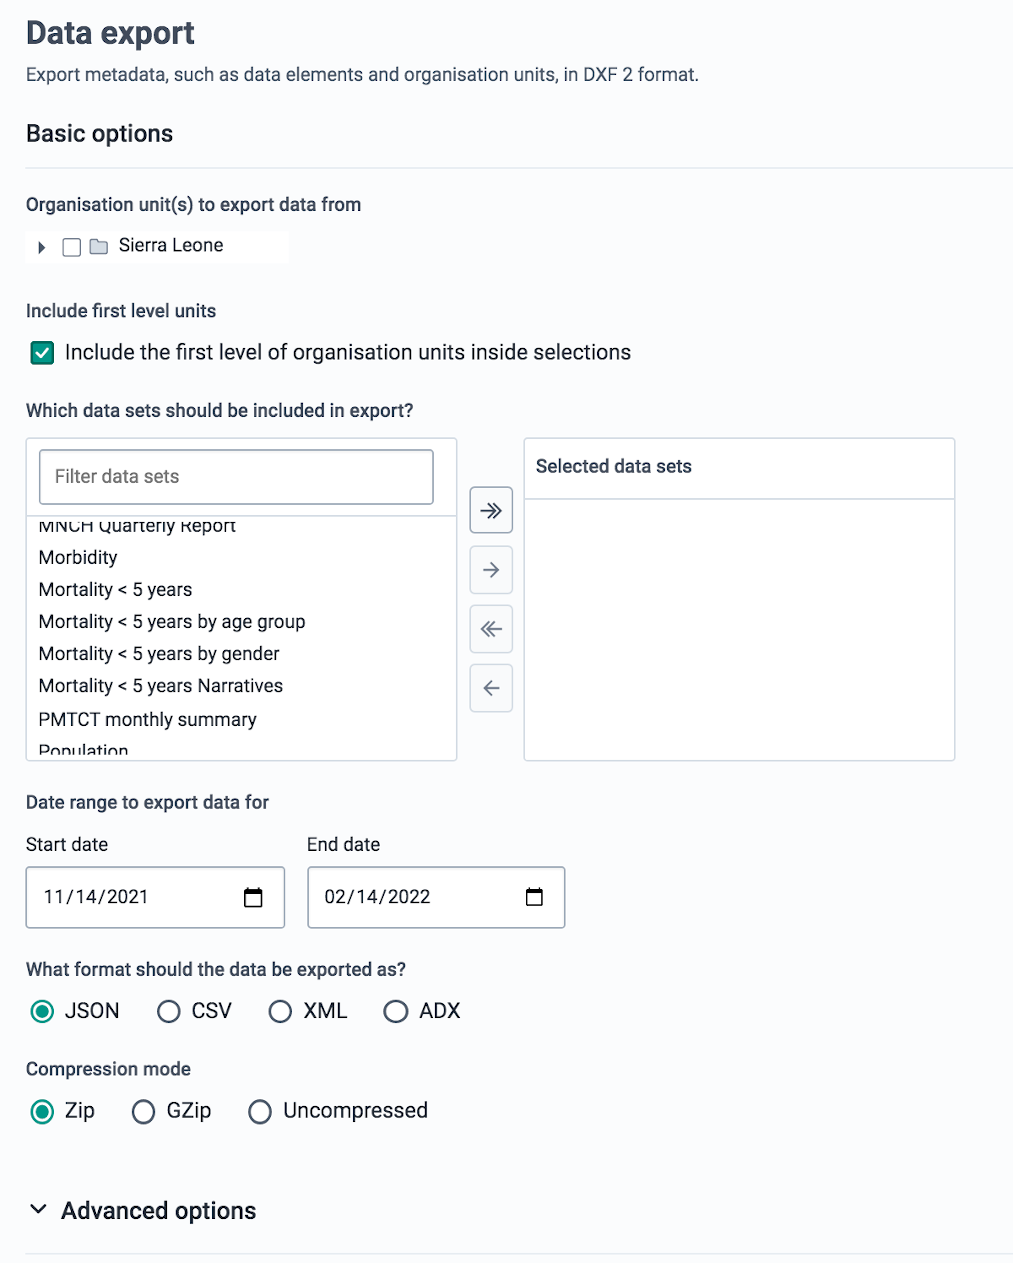
Select which organisation units to export from.
Select if you want export to include descendants of organisation units selected in Step 1 or only the manually selected organisation units.
Select which data sets to export.
Set the start and end date.
Select a format: JSON, CSV, XML, or ADX
Select a compression mode: Zip , GZip or Uncompressed
Click Advanced options if you want to adjust one or more of the following settings before exporting:
Click Export data which will open a new web-browser window that will give you a file to download to your local computer.
Event export can be accessed from the sidebar by clicking on Event export.

You can export event or tracker data in JSON or CSV.
Select an organisation unit.
Select the inclusion:
Selected: Export event data only for the selected organisation unit
Directly below: Export event data including the first level of the organisation units inside the selections as well as the selected organisation unit itself.
All below: Export event data for all organisation units inside the selections as well as the selected organisation unit itself.
Select a program and a program stage (if applicable).
Set the start date and end date.
Select a format: JSON or CSV.
Select a compression mode: Zip, GZip or Uncompressed.
Click Advanced options if you want to adjust one or more of the following settings before exporting:
Click Export events which will open a new web-browser window that will give you a file to download to your local computer.
Tracked entities export can be accessed from the sidebar by clicking on tracked entities export.
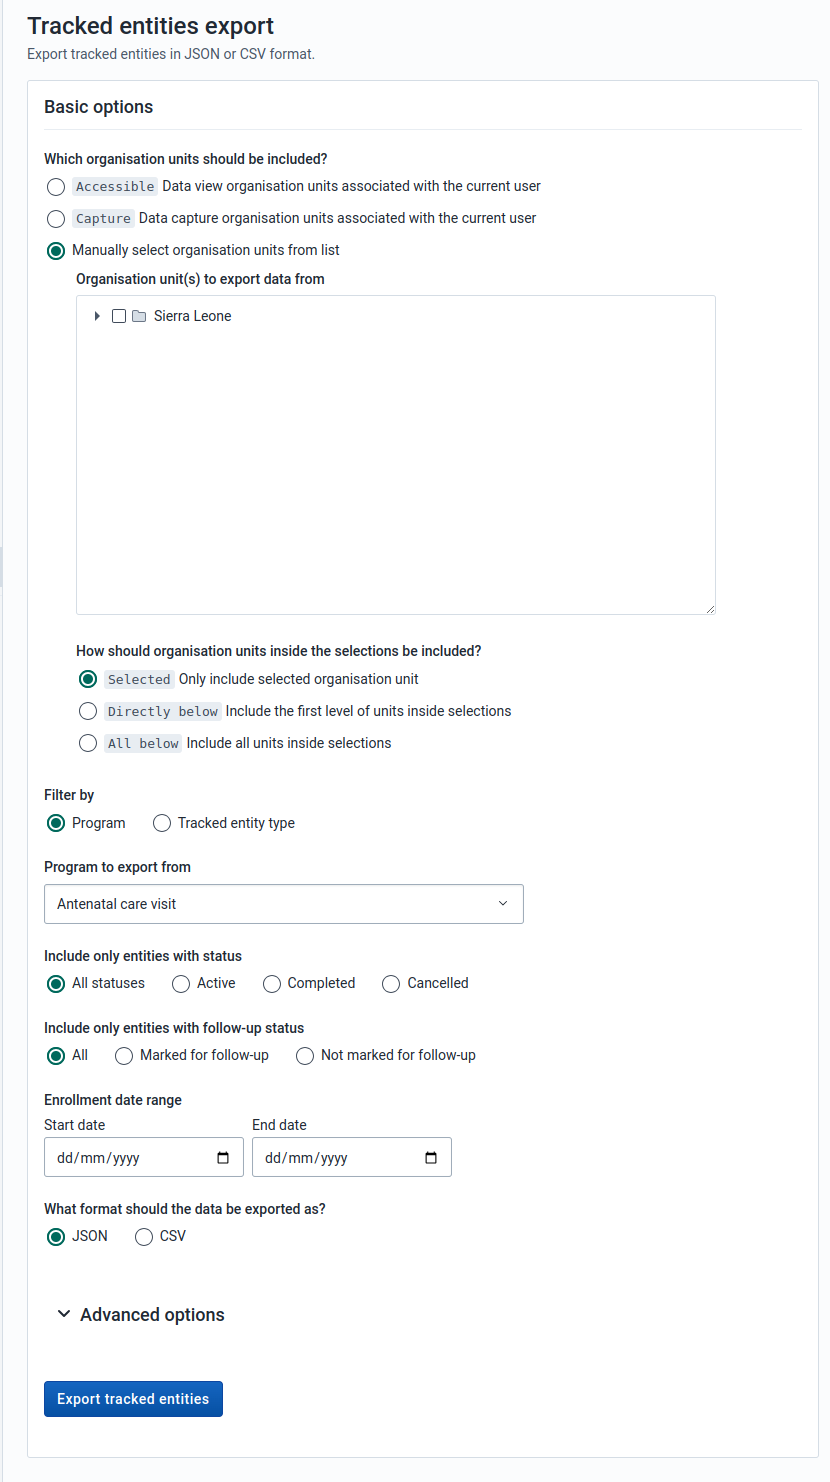
You can export tracked entities in JSON, or CSV format.
Select the organisation units that should be included. There are three modes for selecting organisation units:
Accessible: to select data view organisation units associated with the current user
Capture: to select data view organisation units associated with the current user.
Manually select organisation units: to manually select the organisation units.
If you choose to manually select organisation units then you will be presented with further options:
Selected: Export data only for the selected organisation unit
Directly below: Export data including the first level of the organisation units inside the selections as well as the selected organisation unit itself.
All below: Export event data for all organisation units inside the selections as well as the selected organisation unit itself.
Decide whether you want to filter by program or tracked entity type.
Decide what statuses to include in the export
Decide which follow-up statuses to include in the export
Select a format: JSON or CSV.
Click Advanced options if you want to adjust one or more of the following settings before exporting:
Click Export tracked entity which will open a new web-browser window that will give you a file to download to your local computer.
The import/export app was upgraded to use the new tracker API for importing and exporting tracked entities and events. The deprecated tracker API will be removed in v42 hence all applications are advised to upgrade as soon as possible.
This brings a lot of benefits in terms of the consistency and reliability of the import/export experience for tracked entities and events, such as better validation, error reporting and the use of a more reliable job scheduling workflow.
These benefits come with a couple of important caveats. First, the new format of the exported files is incompatible with previous versions of the app, so exports from v41 can not be imported in previous versions, and exports from previous versions can not be imported in v41. We also dropped support for XML format, and only support JSON and CSV. More context for these changes can be found in the Tracker API documentation.
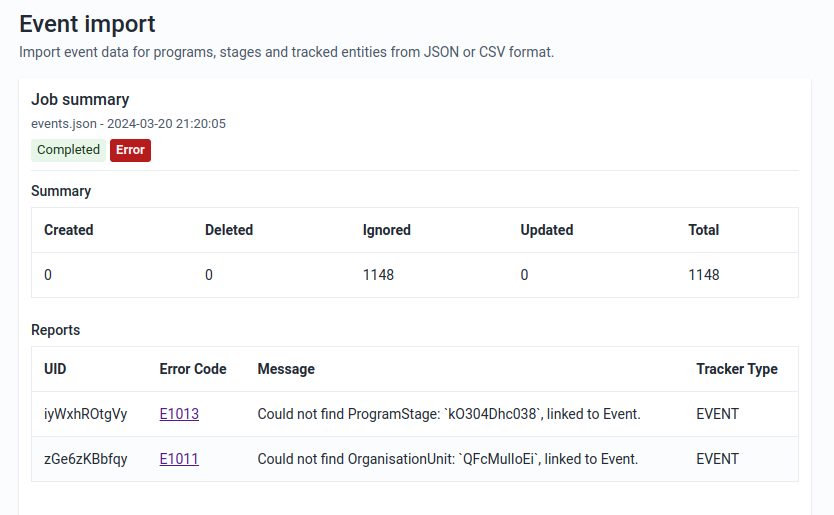
The job overview page can be accessed from the sidebar by clicking on Job Overview.
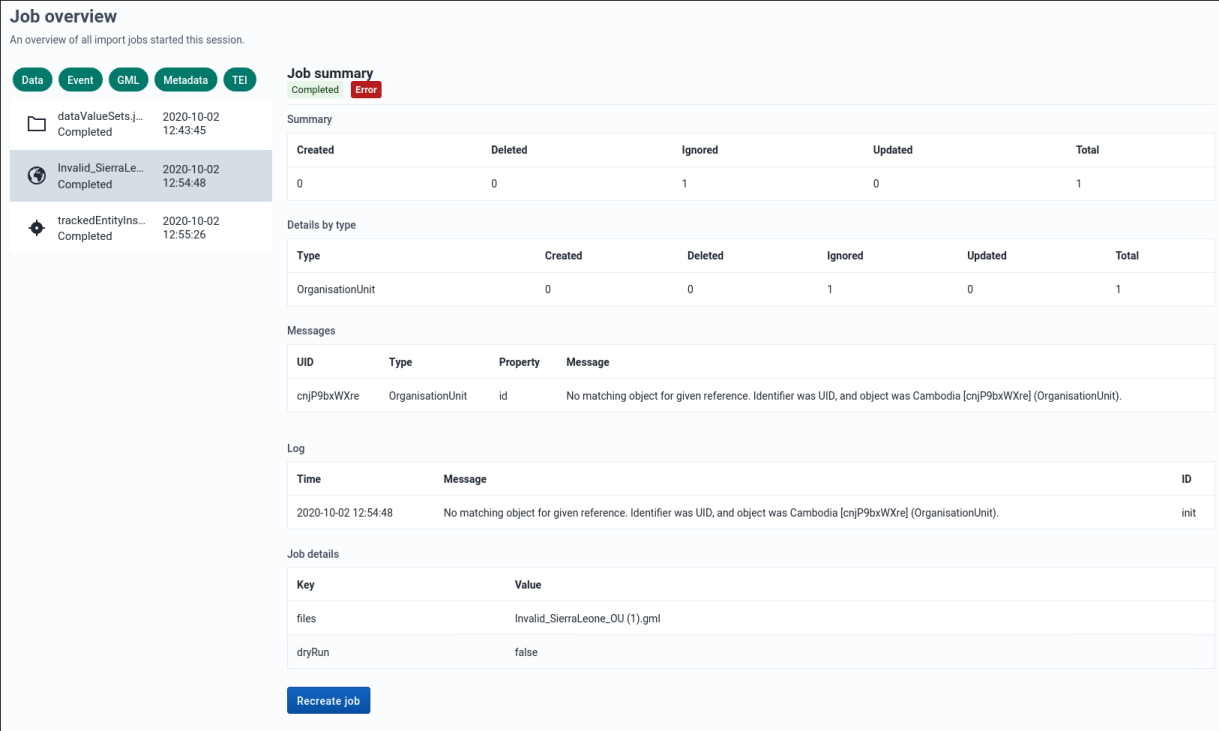
This page allows you to see the progress of all the imports you have started this session. You can see the list of all jobs on the left side and details about a specific selected job on the right.

By default jobs of all import types are shown in the job list, but you can filter categories you are interested in by clicking on the job type filters above the job list.
You can recreate previously run import jobs by clicking on the Recreate job button at the bottom of the page, assuming you have selected a job from the list. This will take you to the correct import page and fill in all the form details exactly as the job you chose to recreate.
The various schemes used in many of the import and export pages are also known as identifier schemes and are used to map metadata objects to other metadata during import, and to render metadata as part of exports.
| Scheme | Description |
|---|---|
| ID, UID | Match on DHIS2 stable Identifier, this is the default id scheme. |
| CODE | Match on DHIS2 Code, mainly used to exchange data with an external system. |
| NAME | Match on DHIS2 Name, please note that this uses what is available as object.name, and not the translated name. Also note that names are not always unique, and in that case, they can not be used. |
| ATTRIBUTE:ID | Match on metadata attribute, this attribute needs to be assigned to the type you are matching on, and also that the unique property is set to true. The main usage of this is also to exchange data with external systems, it has some advantages over CODE since multiple attributes can be added, so it can be used to synchronize with more than one system. |
The ID scheme applies to all types of objects, but can be overwritten by more specific object types.
You can synchronize data and metadata between different DHIS2 instances. Given two instances in a central-local deployment strategy, metadata created at the central system can be synchronized with the local system and the data created at local system can be synchronized with the central system. This can be useful when you've multiple stand-alone instances of DHIS2 and global metadata needs to be created at all the local instances.
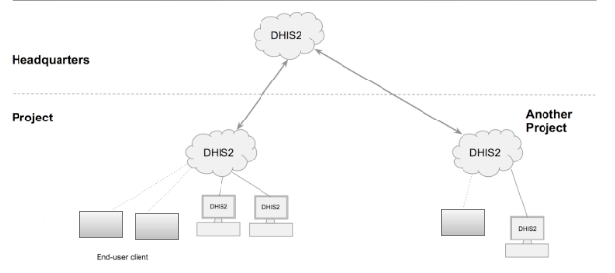
If metadata creation and update take place at the central system and if the metadata synchronisation task is enabled, the metadata gets synchronized down to all the local instances which are bound to the central instance. These local instances will in turn push data values and complete data registration sets to the central instance. Enabling or disabling versioning of metadata synchronization at local instance, will not hinder the metadata synchronization process. This is because the metadata synchronization interacts with versioning end points of the central instance and not with end points of the local instance.
Each snapshot of metadata export generated is referred to a metadata version. A new metadata version contains only the changes between the previous version and the current version, that is it's an export between two timestamps. All metadata versions are maintained in the DHIS2 database and are available to all local instances that connect to it. You can schedule each of the local instances to download new metadata versions. It is recommended to keep the metadata versions' sizes small and logical.
Warning
Each instance of DHIS2, whether central or local, can create metadata versions. The local instance is meant to synchronize metadata from a central system and not create metadata on its own.
If a new metadata version is created on the local instance, this instance can't receive new metadata versions from the central instance, since the content of the metadata versions will be out of synchronization.
If you've created metadata versions on a local instance, you must manually deleted these versions from the database before you can synchronize with the central instance.
Assume the central and local DHIS2 instances have identical metadata snapshots until version 10. Then the local instance creates a new snapshot called version 11. After that, the central instance creates a new snapshot called version 11. When the local instance attempts to synchronize metadata, version 11 is not downloaded. However, the content of version 11 on the local instance is not identical to the content of version 11 on the central instance.
Note
You can also use the Import-Export app to synchronize metadata manually.
On the central instance, configure metadata versioning. You should do this once the central instance contains metadata.
Connect local instance(s) to the central instance.
On local instance(s), configure automatic synchronization.
Note
To synchronize metadata, the user account of the central system must have the following authority:
F_METADATA_MANAGE
Only users with this authority will then be able to create and download metadata. This is to ensure security of the central system where the metadata is created. Instead of giving the credentials of user having ALL authority to the field instances, you need to create a user having this specific authority only.
On the central instance, open the System Settings app and click Synchronization.
Go to the Metadata versioning section and select Enable versioning for metadata sync.
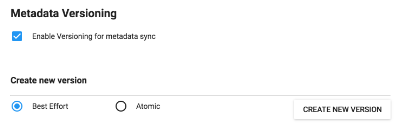
(Optional) Select Don't sync metadata if DHIS2 versions differ.
Select a type of metadata version: Best effort or Atomic.
Best effort means that if the metadata import encounters missing references (for example missing data elements on a data element group import) it ignores the errors and continues the import.
Atomic means all or nothing - the metadata import will fail if any of the references do not exist.
Note
Each metadata entity is associated with a "User" object. If this "User" reference is missing while importing metadata version of type ATOMIC, the import will fail at the validation phase itself. This means that the user who creates metadata also needs to synchronize down to local instances to successfully import the metadata version of type ATOMIC.
Click Create new version. The new version is added to the versioning table.
To enable metadata synchronization, you must configure the connection between the local instance and the central instance.
On the local instance, open the System Settings app and click Synchronization.
Add the central DHIS2 instance's details to the local instance:
Remote server URL
Remote server user name
Remote server password
Go to the Metadata versioning section and select Enable versioning for metadata sync.
(Optional) Select Don't sync metadata if DHIS2 versions differ.
The metadata schema changes between versions of DHIS2 which could make different metadata versions incompatible.
When enabled, this option will not allow metadata synchronization to occur if the central and local instance(s) have different DHIS2 versions. This apply to metadata synchronization done both via the user interface and the API.
The only time it might be valuable to disable this option is when synchronizing basic entities, for example data elements, that have not changed across DHIS2 versions.
(Optional) Configure email notifications to notify users about successful or unsuccessful metadata synchronization:
Open the System Settings app and click Email.
Enter Host name, Port, User name, Password and Email sender.
Click Server and enter a System notifications email address.
This email address will receive notifications about the metadata synchronization status.
Tip
When you receive email notification about a metadata synchronization failure, check which metadata version that causes the error and resolve it. Then you avoid future errors when the system downloads new metadata versions.
Once you have configured automatic metadata synchronization (scheduling) on local instance(s), the scheduler will run at that specific time and synchronize (download and import) the metadata from the central instance. No manual intervention is required from the users at the local instance(s).
After the scheduler has completed the metadata synchronization, the local instance will have the metadata exactly as created on the central system.
Note
Passwords of users are not synchronized. They are nullified for security reasons. After metadata synchronization, the Admin user must reset these passwords.
On the local instance, open the Data Administration app and click Scheduling.
In the Metadata Synchronization section, select Enabled.
Select a time period: Daily, Weekly, Monthly or Yearly.
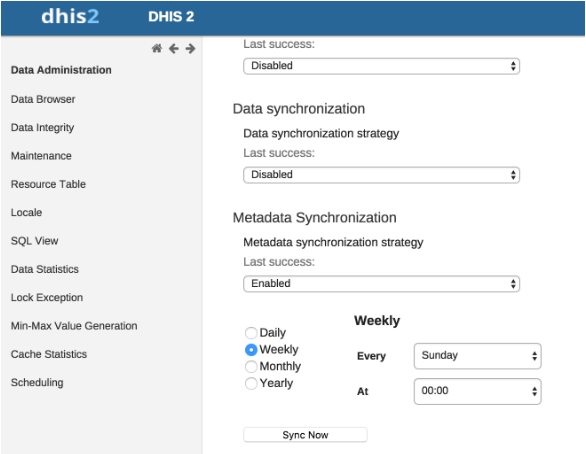
Click Start.
Open the System Settings app and click Synchronization.
Go to the Metadata versioning section and select Enable versioning for metadata sync.
(Optional) Select Don't sync metadata if DHIS2 versions differ.
Select Best effort or Atomic.
Click Create new version. The new version is added to the versioning table.
When the system is a central instance, you'll see three columns in the versioning table:
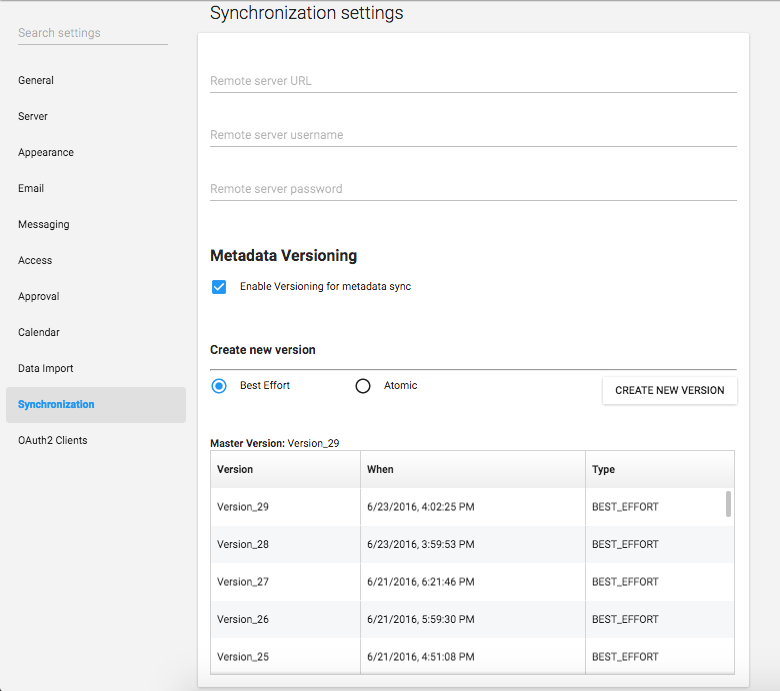
| Object | Description |
|---|---|
| Master version | The latest version in the system. |
| Version | Name of the version. The name is automatically generated by system. |
| When | The timestamp of the metadata version creation at the central instance. |
| Type | Type of metadata version. |
When system is a local instance, you'll see four columns in the versioning table:

| Object | Description |
|---|---|
| Master version | The latest version of the central instance. Note The master version information is the central instance's latest version. This is important to look at the difference between the versions of metadata that exist at central and at local. |
| Last sync attempt | If the last sync attempt is a failure, this will be displayed. |
| Version | Name of the version. The name is automatically generated by system. |
| When | The timestamp of the metadata version creation at the central instance. |
| Type | Type of metadata version. |
| Last sync | Timestamp of when the last sync happened for this version in this system. |
The process which performs metadata synchronization is called Metadata Sync Task. This task performs a series of steps before syncing of metadata:
Push data (aggregate data and anonymous events data) from local instance to central instance.
Gets the current metadata version of the local instance. Then uses this version information as a baseline to fetch the list of metadata versions created after the baseline.
If there are new versions created at central instance, it performs the synchronization of metadata versions one after the other. A mail will be sent to the configured user (if any) after each successful synchronization of metadata version at the local instance.
Once the Metadata Sync Task has run at the scheduled time, the task can retry (if any of the steps fail) based on the configuration of the following parameters defined in dhis.conf file:
| Parameter | Default value |
|---|---|
metadata.sync.retry | 3 |
metadata.sync.retry.time.frequency.millisec | 30000 |
Each retry will be made after the time (in millisecond) as specified. If the steps still fail even after all the retries, then the scheduler stops its execution and then a mail will be sent to the configured user (if any). If no values are specified then the default values will be used.
metadata.sync.retry = 5
metadata.sync.retry.time.frequency.millisec = 10000
This chapter covers various mobile technologies including Web, J2ME, SMS Service and SMS Command.
DHIS2 provides a range of options to allow data entry from mobile devices, including a dedicated GPRS/3G J2ME client and two versions of DHIS2 which have been optimized specifically for mobile browsers. Each of these solutions will be described in detail in the following sections. DHIS2 offers several Android clients, which are described in detail in other sections of this guide.
Collection of data in the field can be technically challenging and expensive. Mobile phone solutions have the potential to significantly reduce the complexity of deploying a distributed data collection system. Using a simple Java client installed on a mobile phone or a web browser which works on the mobile phone, field workers can report directly to the DHIS2 database through their mobile device.
While mobile phone solutions have a great potential, there are complexities with such deployments. Phones lack processing power and have a small display, they need to be charged, and often such deployments make the most sense in areas with poor or intermittent network coverage.
Each of the mobile solutions are introduced briefly below, and the discussed in separate sections in detail:
DHIS2 Light: A mobile browser optimized data entry module for all devices
This module allows for data entry directly with the browser of the mobile device. A wide range of devices and mobile browsers are supported including: Opera mini 3 & 4 (basic and advanced) - Opera mini 4, Nokia S40 mobiles ,Windows Phone 7, Window Mobile 6, Palm Pre, Blackberry (v5 and v6), Firefox mobile, iOS devices (iPhone) and Android devices. This client does not have offline-support, and an active GPRS/3G connection is required. It does not require a new application installation on the phone to support new features, but does require a stable data connection for use. This solution is described in Mobile browser based data entry
DHIS2 Smartphone client: A mobile browser optimized data entry module for Smartphone devices
This module allows for data entry directly with the browser of a Smartphone. Offline data entry is supported and it does not require any installation of a special client on the phone itself.
J2ME GPRS/3G client
DHIS-mobile includes two separate J2ME clients supporting GPRS/EDGE/3G as a transport mechanism. One clients supports facility aggregate reporting and the second client supports name-based program tracking. These clients are split into separate applications to make deployment easier. Some health workers may have both applications installed on their phone. Both of these clients support offline-storage of data and work on J2ME enabled devices (feature phones). .?>
An active GPRS/3G connection is required in order to send data to the DHIS2 database, but data can be entered offline and transmitted when a connection is present. This client is intended primarily for low-end devices which support J2ME applications, although the offline-supports adds some memory requirements which limits the handset selection. While the solution is primarily tested on Nokia phones, it also works on several other J2ME capable handsets.
The facility reporting J2ME client is described in the chapter "J2ME GPRS/3G Client"
This approach is for data-entry on a smart phone with a mobile browser by navigating to the URL of the DHIS2 instance, for example: the full URL link for demo on dhis2.org http://apps.dhis2.org/dev/mobile/index.action . And your mobile browser will automatically detect the DHIS2 application where the server URL is given (e.g.: http://apps.dhis2.org/dev). Here is the login form to access the application with user-name and password. Click on "Login" to continue or "Reset" to reset:

After logging in, there are the list of functions:

- Aggregate Reporting: Entries for aggregate data with defined/assigned dataset by organisation-units
- Tracking:
Find Person: find person based on Name, Phone Number or ID, and Organization unit.
Activity Plan: Entries data for the persons by organisation-units, persons and programs/program-stages
Person Registration: Registry a new person
Anonymous: Entries for anonymous person based on programs
- Messages: Manage the messages and discussions from the server. Message reply is available. User can send feedback message in Messages.
- Reports: The output reports from the server.
- Settings: User-information (e.g.: First-name, Surname, Phone number, E-mail) and the Interface language.
- Logout: to log out the application.
- Desktop version: navigate to the desktop version of DHIS2 for administration. This require a lot of resources from the client mobile, for example: the sufficient memory to load the pages. Not recommended for the normal GPRS/3G/... phones.
The list above will be explained in details:
Aggregate Reporting: Entries for aggregate data with defined/assigned dataset by organisation-units.

Click on the "Aggregate Reporting", then choose an Organisation Unit from the list and the list of the datasets will be appeared for entering aggregate data. See the below example:
Step 1: Select an Organisation Unit from the list
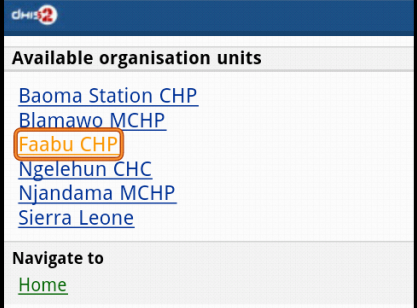
Step 2: Select a Dataset (entry form) from the list

Step 3: Select a period (based on the period type of the chosen dataset) from the list
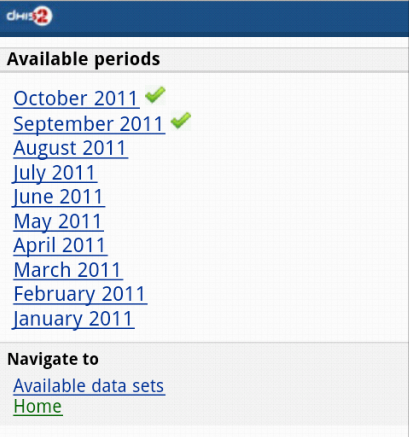
Step 4: Entering the data
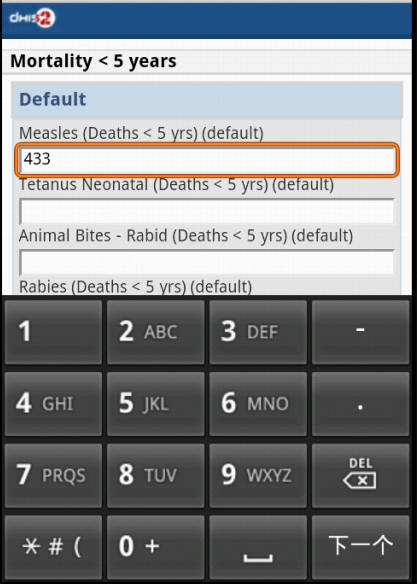
Step 5: Save the data entered after completing the data, choose the option for data completeness if having.
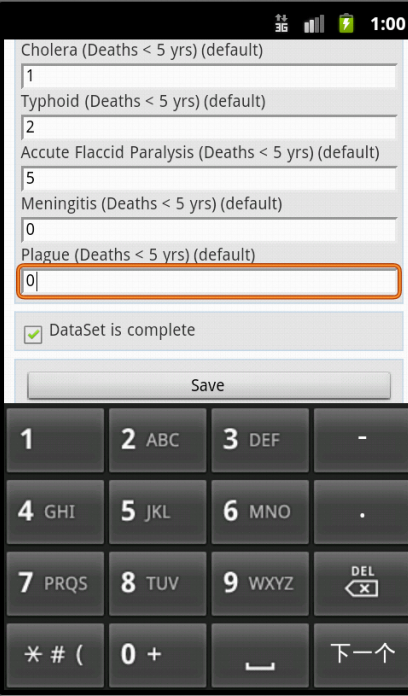
Tracking: Find/Add Person, Visit Schedule, Person Registration, Anonymous
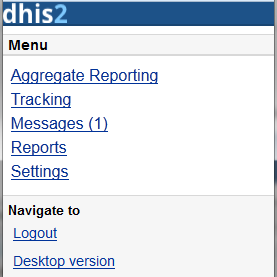
2.1 Find/Add Person: find person based on Name, Phone Number or ID, and Organization unit.
Step 1: insert Name, Phone Number or ID and select the Organization Unit, then click Search.

Step 2: select a person

Then all the information of that person will be displayed
Step 3: choose the next program stage for entering the data

To view all the program stages, click on the name of that program (Child Heath Program as the screen shot)
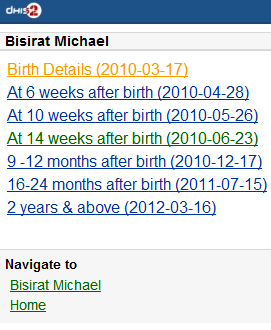
2.2: Visit Schedule: Choose An Organization Unit
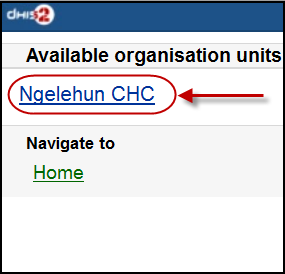

Current Activity Plan: the list of the beneficiaries registered, enrolled, not yet finish/complete a/many program and there is at least a program-stage open for data-entry.
+ Step 1: Choose a Person for entry

+ Step 2: Choose a current and active program-stage for entering the data

You can also see the person's information (ID, gender, Date of Birth, and Blood Group) by clicking on the Details (on top of the list appeared)

The details information of the chosen person:
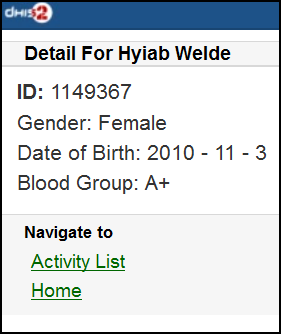
All Activity Plan: the list of all beneficiaries registered, enrolled, not yet finish/complete a/many program.
Single Event:
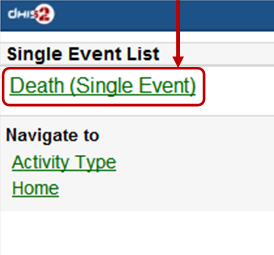
2.3: Person Registration: Registry a new Person
Step 1: Entry personal information
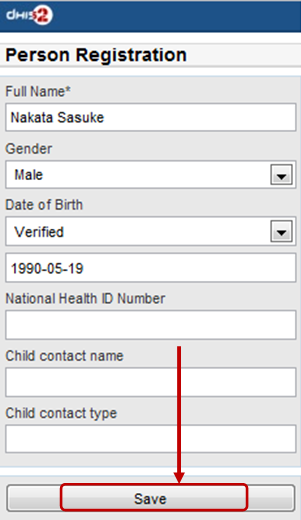
Step 2: Enrol program for the person just been registered, then click "Enroll".
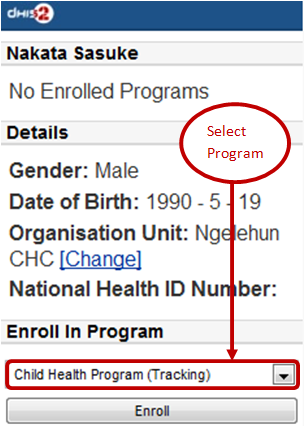
Step 3: Entry required information for the chosen program, then click "Enroll"
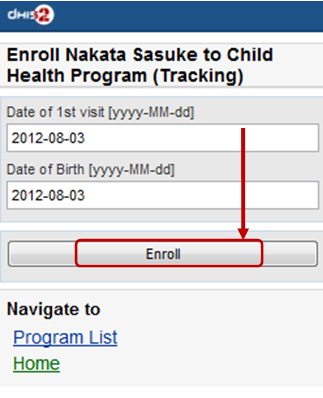
Here is the result:

2.4: Anonymous: Entries for anonymous person based on specific programs

Messages: Manage the messages and discussions from the server. Message reply is available.
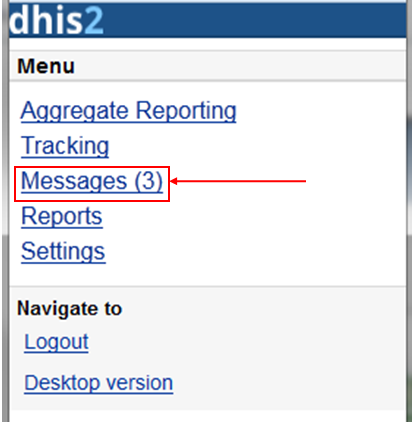
The number showed is the unread messages. Click on that to view the list of the messages (the unread messages are in bold and dark blue color):

Then you can pick up the message/topic for the discussions by leaving the reply message, see this example:

User can create and send a feedback to server in messages section. After sending out the new feedback, the message (feedback) will be listed under "Messages" for further following up.
Reports: The output reports from the server
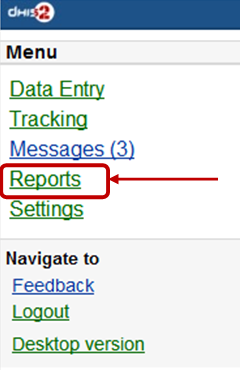
(will be updated)
Settings: User-information (e.g.: First-name, Surname, Phone number, E-mail) and the Interface language.
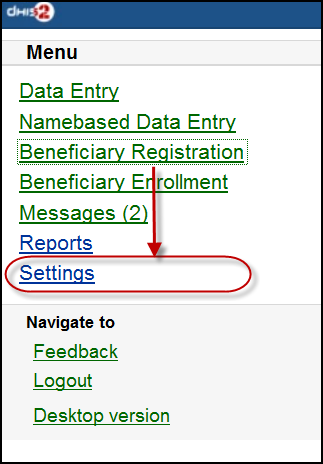
Here is the form for setting the user account/access and the interface language. Click on "SAVE" for completing the settings, see the example below:

Logout: to log out the application

Desktop version: navigate to the desktop version of DHIS2 for administration.

Here is the GUI of the desktop version (which require much memory for loading), not recommended for normal mobile. The example with DHIS2 Demo (from dhis2.org)
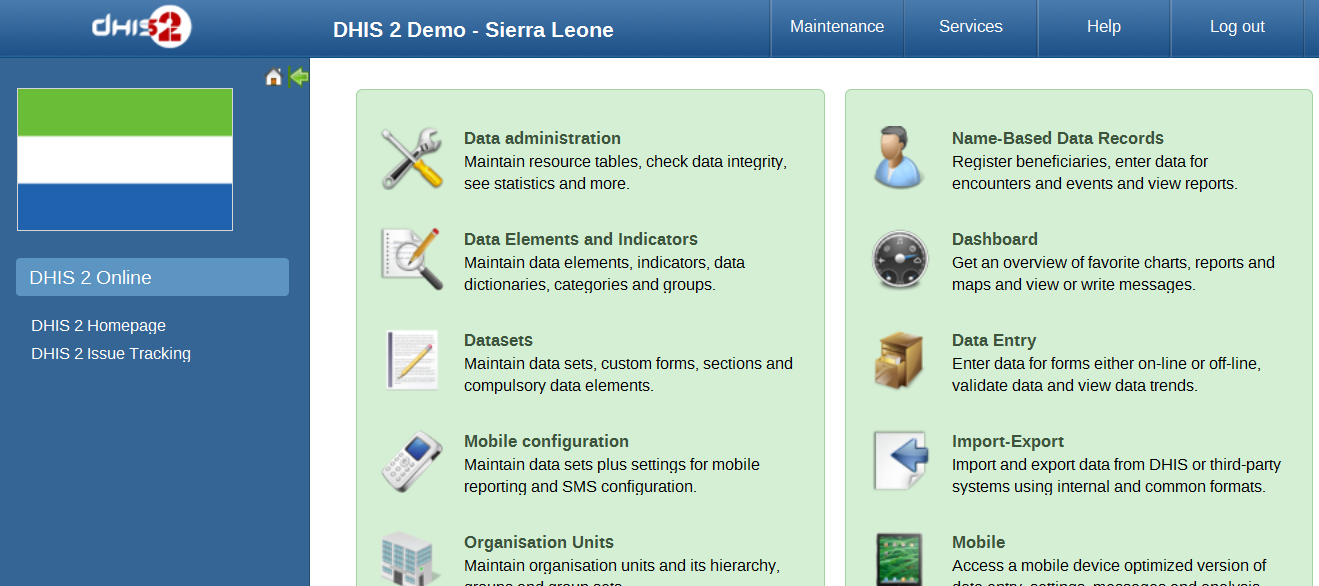
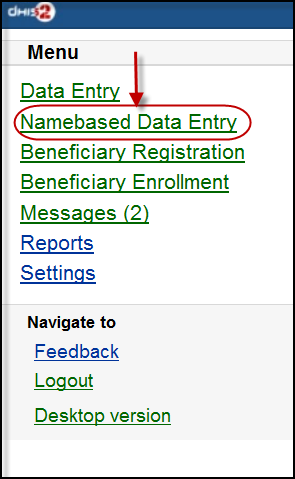
After clicking on the "Namebased Data Entry", the next will guiding to the selections in the following steps:
Step 1: Choose an Organisation Unit
Step 2: Choose the Activity Type
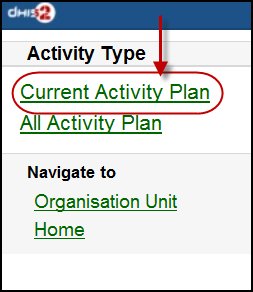
(the screen-shot with an example with "Current Activity Plan" option)
There will be normally these two type of Activity:
+ "Current Activity Plan": the list of the beneficiaries registered, enrolled, not yet finish/complete a/many program and there is at least a program-stage open for data-entry.
+ "All Activity Plan": the list of all beneficiaries registered, enrolled, not yet finish/complete a/many program.
Step 3: Choose a Beneficiary for entry
(the screen-shot with an example with "Hybia Welde" option)
Step 4: Choose a current and active program-stage for entering the data
(the screen-shot with an example with "16-24 months after birth" option)
You can also see the beneficiary's information (ID, gender, Date of Birth, and Blood Group) by clicking on the Details (on top of the list appeared)
The details information of the chosen beneficiary:
Beneficiary Registration: Registry a new beneficiary

Step 1: Choose an OrganisationUnit
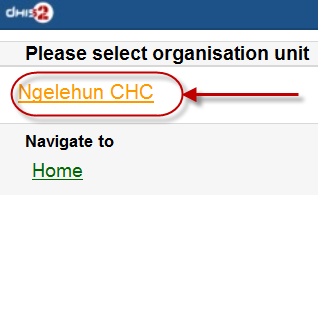
Step 2: Fill in the Beneficiary Registration form

There necessary information: Full Name, Gender, Date of Birth (and Blood Group).
Click on "SAVE" to register a new beneficiary.
A message "Successfully Saved" will appear when the beneficiary is created/registered successfully.
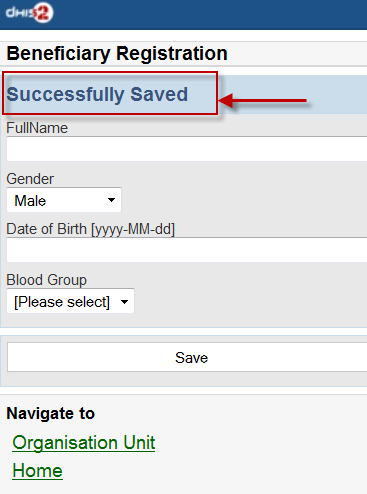
Beneficiary Enrollment: Enrol a beneficiary to one or many programs

Before enrolling a beneficiary to a program, the search function for a beneficiary is provided:
If the beneficiary is found, the result will be listed. The simply click on the beneficiary name for navigating to the programs in which the beneficiary enrolled:
The below screen-shot example describes the beneficiary named "Nguyen Van A":
- Has not enrolled any programs before
- There is one program: "Child Health Program" available for enrolment
The list of the available programs for enrolment will be listed. Just click on the program for enrolment by specifying the date of enrolment and the date of incident. See the example:
After clicking on the "ENROLL" button, if successful, the program enrolled will be listed under "Enrolled Programs for" + \<Name of the beneficiary>, see the example:
Messages: Manage the messages and discussions from the server. Message reply is available.
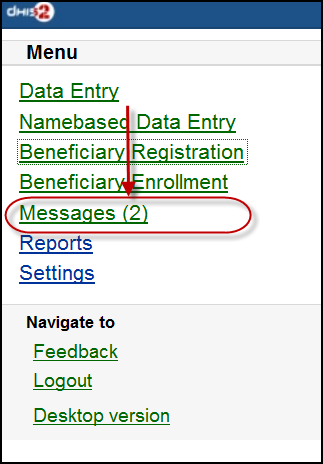
The number showed is the unread messages. Click on that to view the list of the messages (the unread messages are in bold and dark blue color):
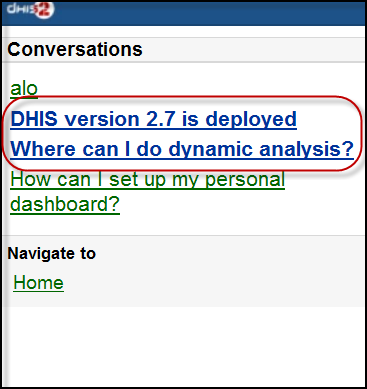
Then you can pick up the message/topic for the discussions by leaving the reply message, see this example:
Reports: The output reports from the server
(will be updated)
Settings: User-information (e.g.: First-name, Surname, Phone number, E-mail) and the Interface language.
Here is the form for setting the user account/access and the interface language. Click on "SAVE" for completing the settings, see the example below:
Feedback: the extra function for creating a new message to send to the server. The new created feedback from this will be listed under "Messages"
After clicking on the "Feedback", there will be a form for editing/sending out a new message/discussion. See the example below:

After sending out the new feedback, the message (feedback) will be listed under "Messages" for further following up.

Logout: to log out the application
Desktop version: navigate to the desktop version of DHIS2 for administration.
Here is the GUI of the desktop version (which require much memory for loading), not recommended for normal mobile. The example with DHIS2 Demo (from dhis2.org)
The DHIS2 GPRS/3G mobile module provides a mechanism for remote clients using mobile phones to enter data directly into the DHIS2 system. There are two functions of the client, namely:
The solution relies on the mobile phone having a data connection available (i.e. GPRS, Edge, 3G), over which it communicates with a DHIS2 instance which must be publicly available on the internet, as any other web server. The client application on the phone downloads the data entry forms to the phone from the server, and the forms can therefore be updated without installing a new application. This is also a crucial feature for community reporting, which relies on regularly downloading activity plans from the server.
Facility reporting, for data entry and reporting of regular DHIS2 aggregate data,
Activity reporting, for supporting individual activity reporting with the Community module.
Data connection availability can be a problem in many of the contexts where DHIS2 mobile reporting would otherwise be a good solution for getting data directly into DHIS2. If that is the case for you, you might want to consider trying the SMS based solution described in a separate document. Keep in mind that even though a data connection is currently required for communication between the server and the mobile phone, it is only required when initializing or updating the mobile application and when sending reports to the server. The phone stores all entered data locally, so it can work fine with only temporary access to a data connection on a regular basis.
The server side component of the web based solution is included in the general build of DHIS2.
In order to configure the DHIS2 web-based mobile reporting, you should follow the following steps.
Set the "Available for Mobile Reporting" flag for the data sets you want reported: Under Maintenance->DataSet->Edit mark the “Available for Mobile Reporting” check box and save.
Create a user role for the mobile user. Select Maintenance->Users->User Role->Add new. Add a user role name and description. Add the desired data sets for the role. The mobile user role will need to have at least privileges for DHIS2 Web API. Save the user role by clicking "Save".
Create a user which will be used by the client to login from Maintenance->Users->User ->Add new. Fill in all of the required details, keeping in mind that the password must be at least 8 digits long, contain one capital letter,and one digit. Assign the desired user role to the user which was created in the previous step.
Important
Assign the user to exactly one organisation unit. Each mobile reporting client will need their own user name and password.
Though the previous steps is all that should be needed for testing the solution more detail configuration of the datasets may be required and are described in the following sections.
By default, a data set is mapped to a single form on the phone. If the data set is divided into sections, each section is displayed as a separate page on the phone. If a data element has more than one category option combo it will be displayed as a heading with the category combination options following.
| Form design element | DHIS2 Metadata | Metadata element |
| Form title | Data set | Short Name if it exists, otherwise Name |
| Page tile | Section | Section name (or form name if no sections) |
| Question | Data element | Alternative name if it exists, otherwise Name |
| Question name if combos | Category option combo | name |
By default, data elements will be sorted according to the global sorting assigned in DHIS2. If sections are used, their section specific sorting order will be used. In some cases, when sections are not used, a data element might be used in multiple data sets, and conflict in the way it should be sorted in individual data sets. A work around for this situation is to wrap the whole dataset in one section (note that this will only work if the data elements have the same category option combo)
To make it possible to compare and update the data sets on the mobile phone with the version on the server, data sets are automatically versioned when you edit the data set structure. Some changes which occur on the DHIS2 server, will cause the mobile client to update its forms with a new version.
Create DataSet
Edit DataSet
Create/edit/delete Section in DataSet
Sort Section Order
Update DataElement (affect many related DataSets)
Delete DataElement (affect many related DataSets)
Edit DataElement Category
Edit DataElement Category Combo
Multi-language support is available.
DataSet and DataElement are translated through web-based function. Default language on server is used on mobile in cases requested language from mobile is not available.
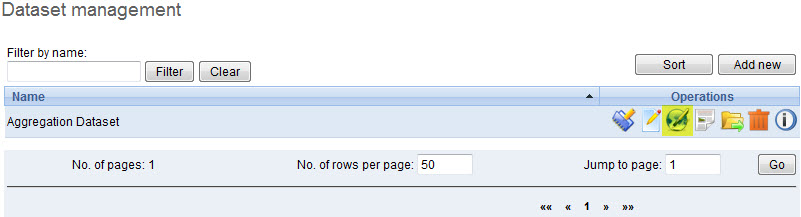
Download the jar packages from the DHIS2 homepage: https://www.dhis2.org/downloads
Initialization should be performed before the phones are delivered end-users. Given the large variation in possible phone configurations, it is impossible to describe the exact steps which are required in order to enable the client on the phone. However, for most phones, simply copying the DHIS2 Web Mobile client "JAR" file to the phone with a USB cable or via Bluetooth is sufficient. Of course, GPRS/3G connectivity must be enabled. Contact your mobile service provider for exact details on the configuration of the phones and networks.
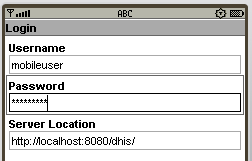
Once the client has been installed on the phone, an initialization process must occur by providing a user name, password and server URL.
Logging into the server for the first time.
The first time the client logins to the server, or if the client is reinitialized, the username, password and server URL must be entered.
If the client is unable to login, there could be several possible error messages which you see.
Connection Not Found: The specified server URL is not correct. Check the server address, ensure that the server is actually reachable, and try again.
Invalid User Name Or Password: the username or password is incorrect
Application not authorized to access restricted APIs : The server can be contacted, but the user does not have the necessary permissions to access the mobile reporting module
Setting the PIN number: After the initial login process, a PIN number can be entered by the user. This will make the login process much easier, as the user only has to remember the four digit pin number, as opposed to typing in the user name and password each time. The PIN number can be preset if the phone is initialized prior to delivery, or it can be set by the users themselves if they have been provided with usernames and passwords.

After entering the PIN, press (Menu)->Next.
Download all forms: After the PIN has been specified, all forms will be downloaded from the server and stored locally on the phone..
If the user has been configured to report on aggregate datasets, a list of appropriate datasets will be displayed. If the user is responsible for community based reporting, the list of assigned activities is displayed.
Notes: If the Health Worker is responsible for both Facility Reporting and Community Reporting, DHIS2 server will send all forms of both Facility Reporting and Community Reporting to mobile and on mobile, there will be a screen to choose whether displaying Facility Reporting or Community Reporting.
Errors:
After starting the application, the PIN form is displayed.
PIN: Enter the four digit number PIN.
Reinitialize Command: this function will clear all data on mobile and we start from the login screen with username and password.
Errors: Invalid PIN: If the user has entered an invalid PIN, they will need to enter the correct PIN, or reinitialize the application with the correct username and password.
After selecting an aggregate dataset from the "Select report form" window, the user will need to select an appropriate time period. A list of available time periods is automatically generated.
After the user has entered their PIN, they can select from a list of available datasets. Select the appropriate dataset and press "Next".
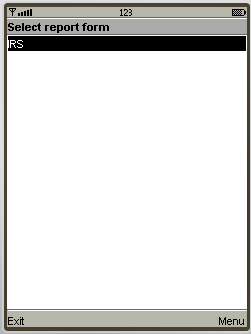
Choosing periods: A list of available periods will be automatically displayed to the user. They can select the appropriate period from the list.

Fill in values: After choosing the period, the form can be displayed in two modes, depending on the
Form with sections
Each form section is displayed in a single screen with the name of the section in the title window.
To navigate from screen to screen, push "Next".
Forms without section (Datasets without sections)
All fields are displayed on one screen with the title that is the name of DataSet
The user simply fills in each data element with the appropriate value.

Save and Complete:
After finishing data entry, the user can choose to save the data locally on the phone or to upload the data directly to the DHIS2 server.
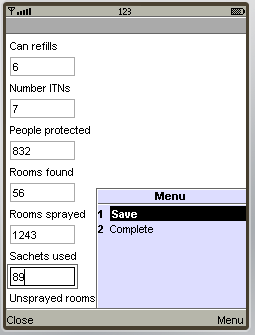
If the user saves the data form, they can edit the form at a later point in time if they need to. When selecting a period once again, the period will be marked as "Saved' as seen in the next screen shot.

If the user selects "Complete", and the data entry form is not complete, the user will be asked if they are certain they wish to submit the form as incomplete. Once the form has been submitted, a message should be displayed informing the user that the transmission was successful.

Period list:
Periods marked with an asterisk (*) is the period that is completed or saved, depending on the status of the data entry.

All periods that are not in period list are considered old and will be deleted automatically.
Storing values duration
The number of saved forms on mobile are limited only by the effective amount of storage of the mobile device.
Forms are saved for limited period only, depending on the frequency of collection of the particular dataset.
Daily Forms: 2 months (current and previous month)
Weekly Forms: 4 weeks (current and 3 previous week)
Monthly Forms: 2 months (current and previous month)
Quarterly Forms: 2 quarters (current and previous quarter)
Yearly Forms: 2 years (current and previous year)
Completed forms - Uneditable forms
If the form has been completed, the user can view the form on their phone, but they cannot make any subsequent edits to the form. Each field is greyed out and inactive for editing.
Re-Edit completed forms
If the user wishes to edit data which has already been submitted to the server, they can do so by pressing the "Edit" button. They are allowed to do this assuming that the dataset has not been locked for the period in question. If they attempt to upload the data, the user will be informed that the dataset has been locked, and it is not possible to upload the data.
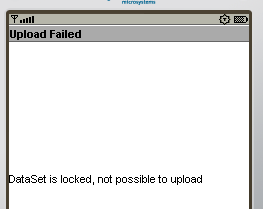
Update Forms:
This function is used to synchronize the forms on mobile and on server. The process is automatically triggered after entering PIN number.
Note: Checking and downloading updated forms process run in background. After finished, prompt is displayed to ask user whether refresh form list or stay where they are.
Multi-Language Support:
This function help user to choose language of mobile's GUI (graphical user interface) and content's language (Forms).
The forms must be translated on server, otherwise, default language is used.
Default language of first login is English. Change language in Setting menu will affect both interface and content.
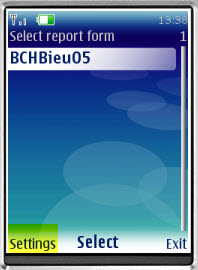
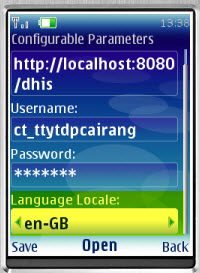

Multi-Language Interface: In Setting menu, there are list of supported language (downloaded from server). Language of GUI is only changed after restart application.
Multi-Language Content (forms): Form's language is change after click "Save". In case there are many forms, it take several minutes to save setting.
Data has been entered on the phone but does not appear on the server
This usually occurs when users enter data on the phone, but cannot send it to the server. This may be because of the configuration of the phone, lack of credit on the phone, or lack of coverage. Usually an error message is displayed as shown below.
Users should be informed that if they see this error, then it means that their data has not been transmitted.
SMS command feature helps DHIS2 system receiving SMS from users, patients, or even anonymous. A SMS command is an object containing the configurations for each SMS form: reporting data from phones or j2me apps, alerting users, registering patient or user, etc.
This is where you can create a new SMS command
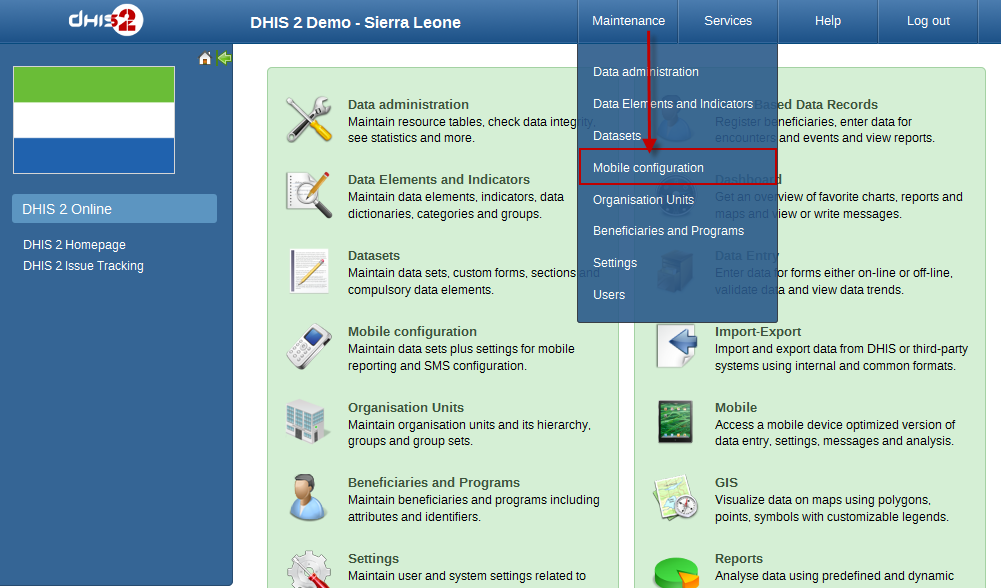
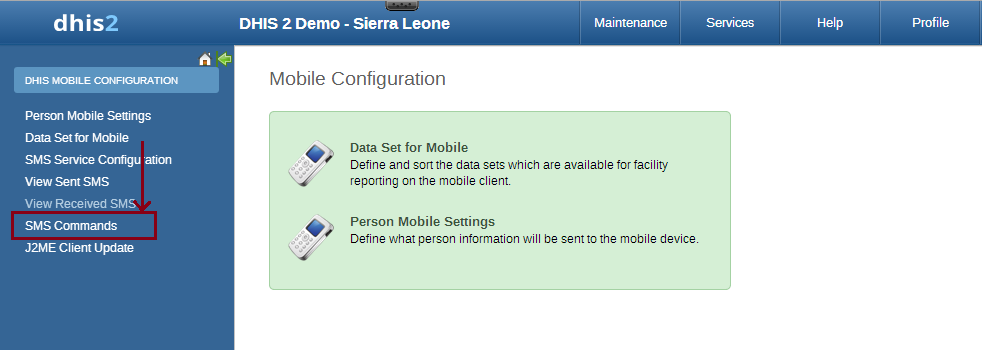
Usually each SMS command has it own property, then the setting up process may be different from each other. Currently, we have 4 types of SMS command:

With KEY_VALUE_PARSER and J2ME_PARSER, the SMS command will have dataset because those are used for reporting data. If data is reported for a Period which is already approved then SMS response will be sent back containing information about approval status of the period.
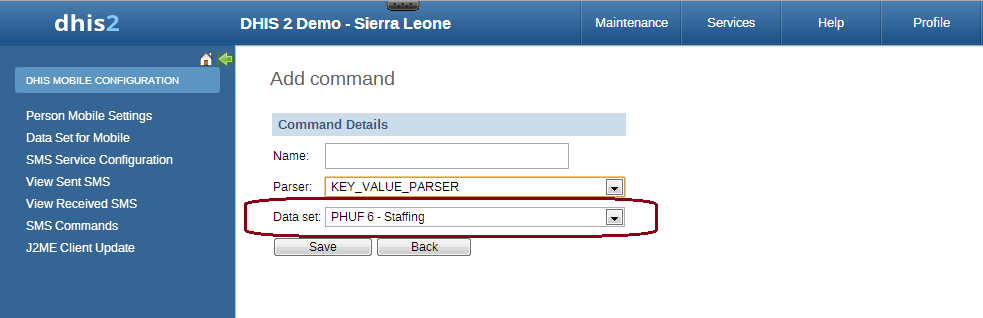
With ALERT_PARSER and UNREGISTERED_PARSER, the SMS command will have user group because those are used for sending message such as SMS, DHIS2 conversation, email.
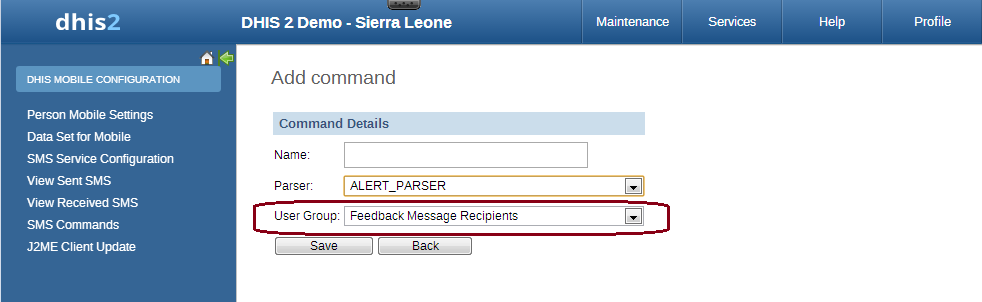
There are certain parameters which are common to all SMS Command types. These parameters have default values configured in the system, if user does provide any value to these parameters then those default ones will be used. Here is the list of those parameters
| Parameter | Type | Description |
|---|---|---|
| Code Value Separator | String | To provide custom code value separator. Default is "=" |
| Field Separator | String | To provide custom field separator. Default is "|" |
| Reply message if no codes are sent (only the command) | String | To provide message if no code is found in SMS text input. Default is "Parameter missing" |
| Wrong format message | String | To provide message if command is not formatted correctly. Command should be formatted as per code value separator. This message will also be sent back if any mandatory parameter is missing. |
| No user message | String | To provide message if sending phone number is not registered in DHIS2. |
| User belong to more than one OrgUnit message | String | Certain SMS command types require user ( retrieved from sending phone number ) to be associated with only one organization unit. This message can be configured to be sent back in case that requirement is not fullfilled. |
| Success Message | String | To provide message that will be sent upon successful completion of the process. |
The SMS command is basically defined by its parser type. In other word, each SMS command has one unique parser to parse the plain text SMS, then the result will be used for the purpose of that SMS command.
In order to report data for example data set (aggregation), we use SMS commands which have KEY_VALUE_PARSER (for phone's plain text), or J2ME_PARSER (for j2me apps)
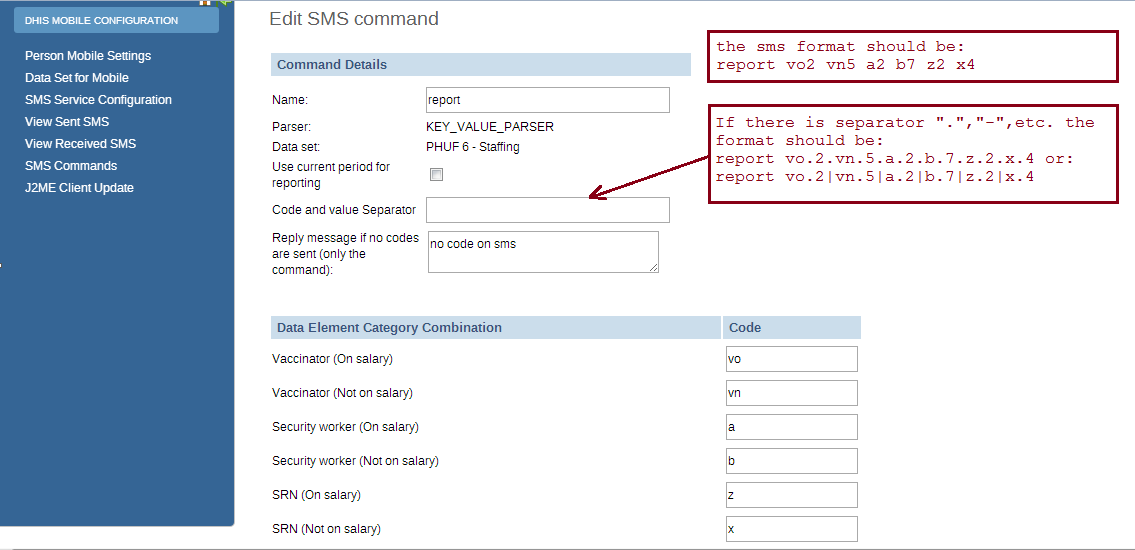
If the command has name "report", and a list of data element with code like above. The format should be: [command's name] [code][value] [code][value] [code][value]....,the [value] of course might be changed depends on real data, so you have to prepare an SMS text like this example: report vo2 vn5 a2 b6 z3 x1
In case the command has a separator for instance ".", the SMS text should be:
report vo.2.vn.5.a.2.b.6.z.3.x.1
or report vo.2|vn.5|a.2|b.6|z.3|x.1
Moreover in SMS text input, orgUnit can be specified like this org orgUnitCode If no orgUnit is specified in SMS then user is retrieved first from the sending phoneNumber and then orgUnit from that user. As far as PeriodType is concerned it should be specified in this format "ddMM" for example 3108, but in case its not specified then PeriodType will be retrieved from DataSet attached to SMSCommand
With the J2ME_PARSER, you don't need to prepare those SMS text, because the J2ME will do this job

User can set the custom response message for "Wrong format message", "No User Message", "User belong to more than one OrgUnit message" and "Success message". If no custom message is being set, system will use the default message.
TRACKED_ENTITY_REGISTRATION_PARSER can be used to enrol tracked entity into the system.
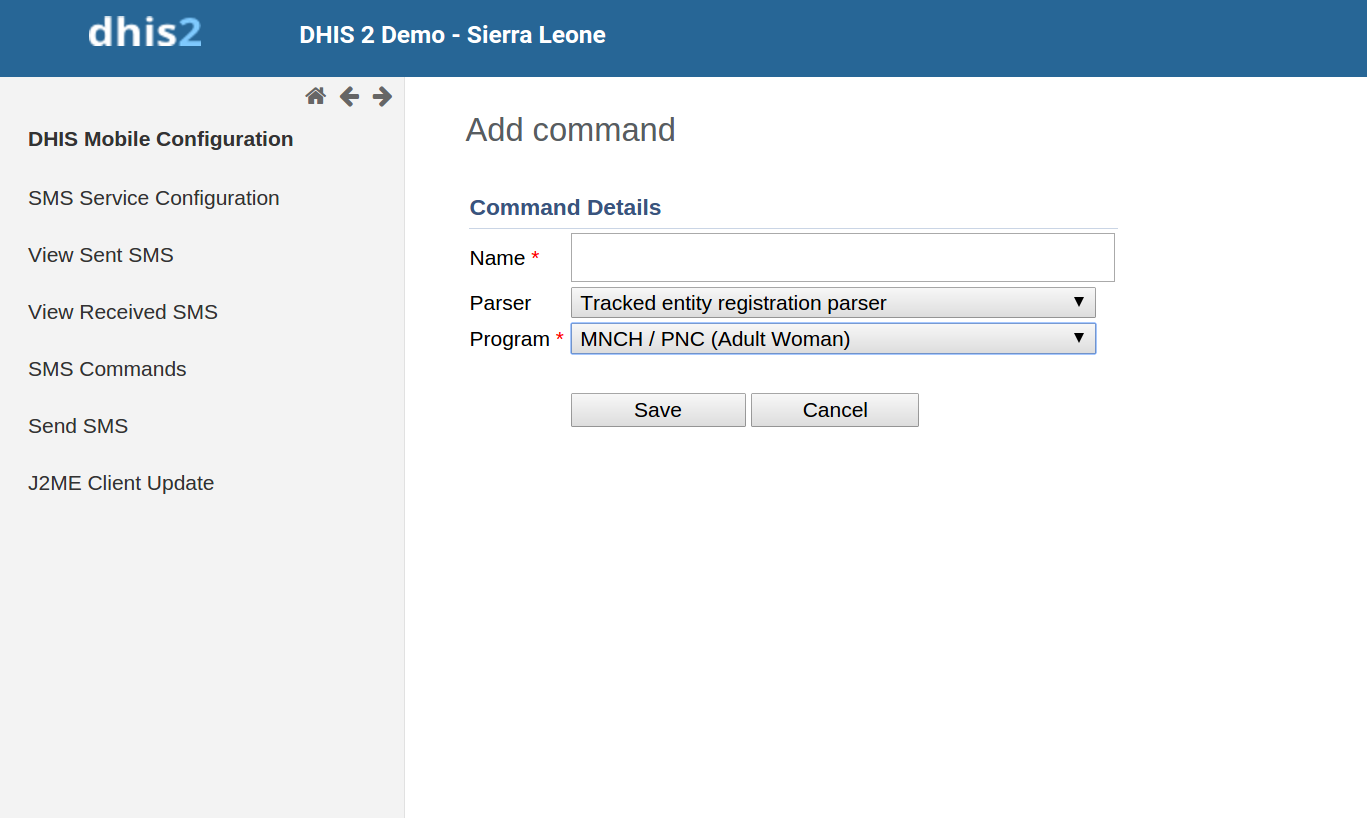
Command name will be followed by tracked entity attributes pertaining to specific program which this command is associated with. Program selection will be done while creating this command.
Default text pattern ( if field separator and codevalue separator is not provided ) for this parser would look like this. childProgram fn=xmen|ln=xmen2|age=4
In case field separator is for example "," then text would look like this.childProgram fn=xmen,ln=xmen2,age=4
Rest of the behavior is same as for other commands. If user does not provide those parameters then default ones will be used.
PROGRAM_STAGE_DATAENTRY_PARSER can be used to enter program stage related data for a specific tracked entity instance.

Command name will be followed by data elements pertaining to specific program stage which this command is associated with. Program and program stage selection will be done while creating this command.
Default text pattern ( if field separator and codevalue separator is not provided ) for this parser would look like this. programstage bcgd=1|opvd=2|wght=34
In case field separator is for example "," then text would look like this.programstage bcgd=1,opvd=2,wght=34
Rest of the behavior is same as for other commands. If user does not provide those parameters then default ones will be used.
In order to alert users, we use SMS commands which have ALERT_PARSER (for phone's plain text), or UNREGISTERED_PARSER (for j2me apps). UNREGISTERED_PARSER can also be used for registering IDSR rumour.

The format of those command will be: [command's name] [text], for example:
alert one emergency case in A town
Commands which has ALERT_PARSER will be received from users only
Event Registration can be used to register anonymous event into the system based on the data collected through SMS. This command type is associated with Programs of type WITHOUT_REGISTRATION. For example Birth events can be tracked using this parser.
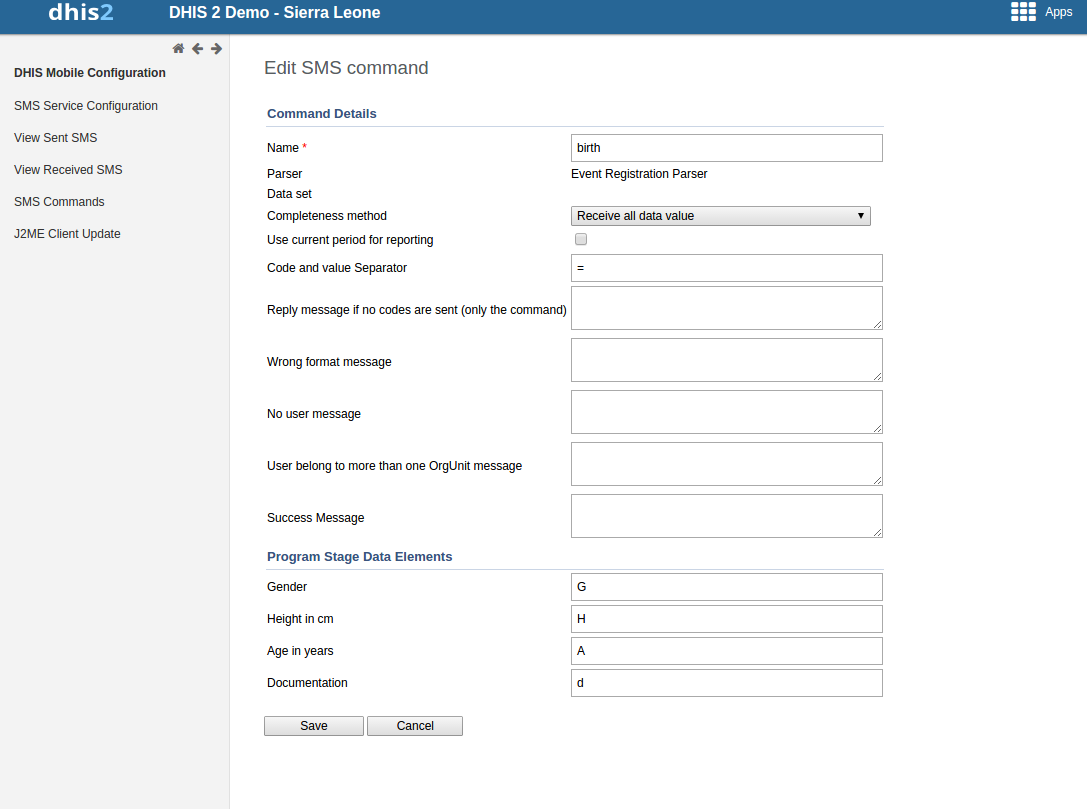
The format of those command will be: [command's name] [code][separator][value], for example:
birth A=1,B=2,G=Male
Code/Value separator is configurable. Pipe "|" is by default taken as field separator. Commands which has EVENT_REGISTRATION_PARSER will be received from DHIS2 users only. Once command is successfully received then data received in SMS will be parsed and event will be registered in DHIS2.
SMS Service is a generic service used for sending/receiving SMS. Any other DHIS2 module can include this service and utilize it to send and receive SMS from users or workers in the field.
There are few pre-requisites in order to make this service functional. There are two ways to complete these steps. One way is to configure gateway from the GUI in Mobile Configuration Module. The other way is to use SMS Web Api.
There are five different types of Gateways supported by SMS Service. SMS can be sent if any one of the gateway is configured. If more than one gateways are present, then they will be used in round-robin fashion for load balancing. There are different parameters for different type of gateway. The Gateway can be configured in GUI in Mobile Configuration Module as shown in the figure. More information about parameters needed to configure gateway can be found in [Gateway Configurations] section of new SMS app.(#gateway.configuration)
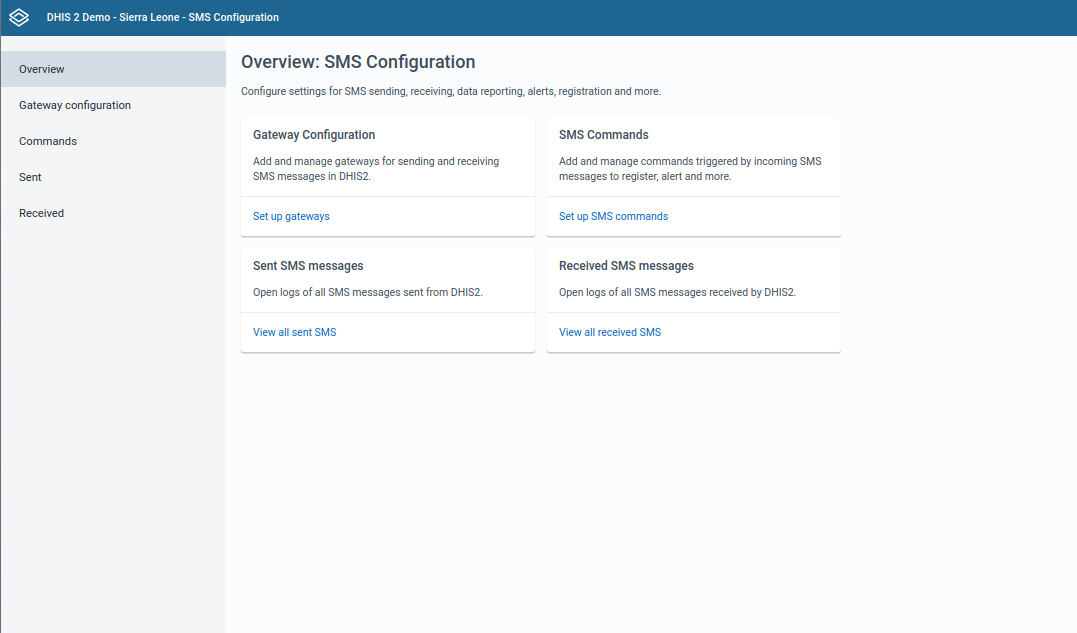
Many DHIS2 instances are using GenericHttpGateway to connect to their local gateways. These local gateways provides HTTP APIs for sending SMS. In new GenericHttpGateway it is now possible to configure generic configuration template for gateway configuration. This template is converted into request payload by replacing place holders with actual values taken from gateway key value parameters.
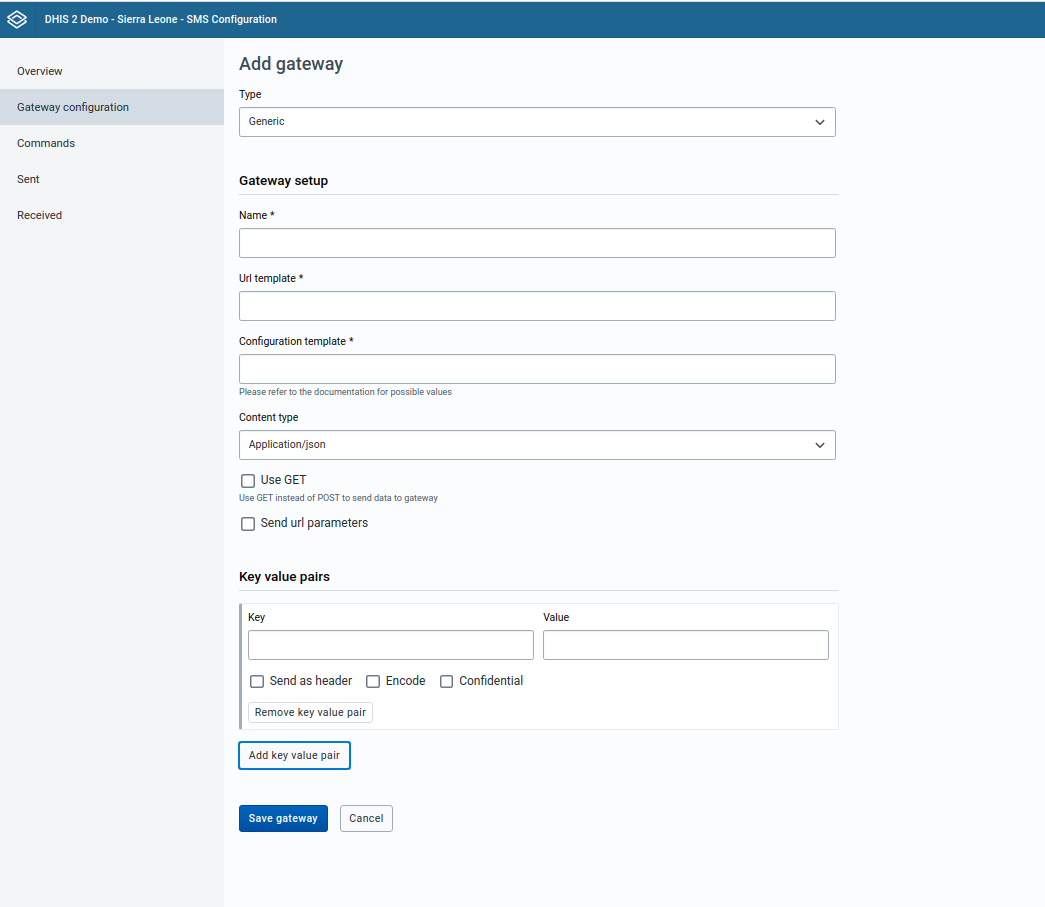
Below table shows the parameters required for configuring gateway.
| Parameter | BulkSMS Gateway | Clickatell Gateway | Generic HTTP Gateway | SMPP Gateway | Description |
|---|---|---|---|---|---|
| Gateway Name | Optional | Optional | Optional | Optional | Used as gateway identity. Default name will be stored in case this parameter is not configured. Its use is recommended |
| User Name | Required | Optional (if token is used) | Required | Required | Used for API authentication |
| Password | Required | Optional (if token is used) | Required | Required | Used for API authentication |
| Auth-Token | N/A | Optional (if password is used) | N/A | N/A | Used for API authentication |
| URL Template | N/A | N/A | Required | Required | Url Tempalte is only required in case of GenericHttpGateway . For example "http://smsgatewa1.com" |
| Headers | N/A | N/A | Optional | N/A | Header option can be checked to send selected parameter as http header. For example username/password/token can be sent in http header. |
| useGet | N/A | N/A | Optional | N/A | HTTP POST method is used by default for posting data toward gateway. But in certain cases if HTTP GET method is required for doing so then useGet parameter can be set to true. Default value for useGet is false. |
| systemType | N/A | N/A | N/A | Required | SystemType parameter is required for SMPP gateway. Default value is 'cp' |
| typeOfNumber | N/A | N/A | N/A | Required | TypeOfNumber parameter is required for SMPP gateway. Default value is 'UNKNOWN'. Other possible values are UNKNOWN, INTERNATIONAL, NATIONAL, NETWORK_SPECIFIC, SUBSCRIBER_NUMBER, ALPHANUMERIC and ABBREVIATED |
| numberPlanIndicator | N/A | N/A | N/A | Required | NumberPlanIndicator parameter is required for SMPP gateway. Default value is UNKNOWN. Other possible values are UNKNOWN, ISDN, DATA, TELEX, LAND_MOBILE, NATIONAL, PRIVATE, ERMES, INTERNET and WAP |
| bindType | N/A | N/A | N/A | Required | BindType parameter is required for SMPP gateway. Default value is TX. Other possible values are BIND_TX, BIND_RX and BIND_TRX |
| compressed | N/A | N/A | N/A | Optional | Compressed parameter is optional for SMPP gateway. Default value is false |
| sendUrlParameters | N/A | N/A | Optional | N/A | Gateway parameters will be appended with url for example https://samplegateway.com/messages?apiKey={apiKey}&to={recipients},content={text},deliveryreport={dp} |
| contentType | N/A | N/A | Optional | N/A | The type in which data will be sent to sms gateway. Default is application/x-www-form-urlencoded. Other supported types are application/json, application/xml and text/plain |
| configurationTemplate | N/A | N/A | Optional | N/A | Generic configuration template can be used to provide the data in the form acceptable to external gateway. For example username=${username}&password=${password}&to=${recipients}&countrycode=880&message=${text$}&messageid=0. Json/xml template can also be provided. |
This document covers the functionality of the SMS Configuration App. For additional information about SMS service integration, please refer to the Mobile document.
SMS commands process SMS messages received by a DHIS2 instance, taking certain actions depending on the command and message content. Multiple SMS commands can be set up to process and handle data in multiple ways. A SMS command is an object containing the configurations for each SMS form: reporting data from phones or j2me apps, alerting users, registering patients or users, etc.
To see all available commands, navigate to the "Commands" page. All commands will be listed in a table. On this page the following actions are available:
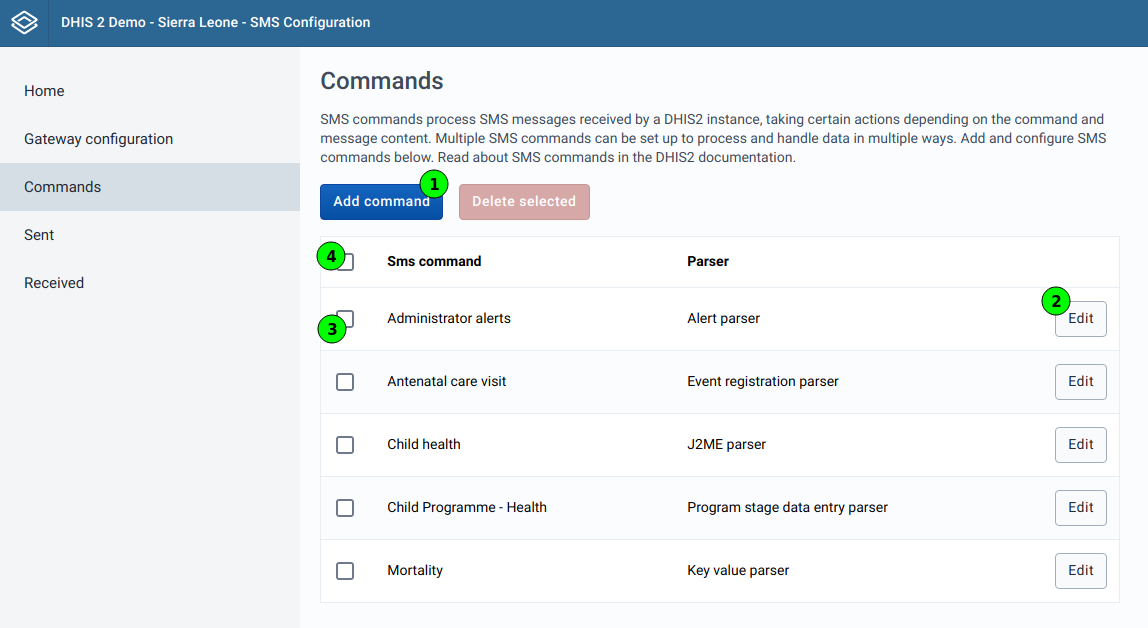
Deleting commands can be done by individually checking the checkboxes of each command (1) that should be deleted or by selecting all displayed commands by checking the checkbox in the table head (2). After selecting the commands to delete, the "Delete selected" button needs to be clicked (3).
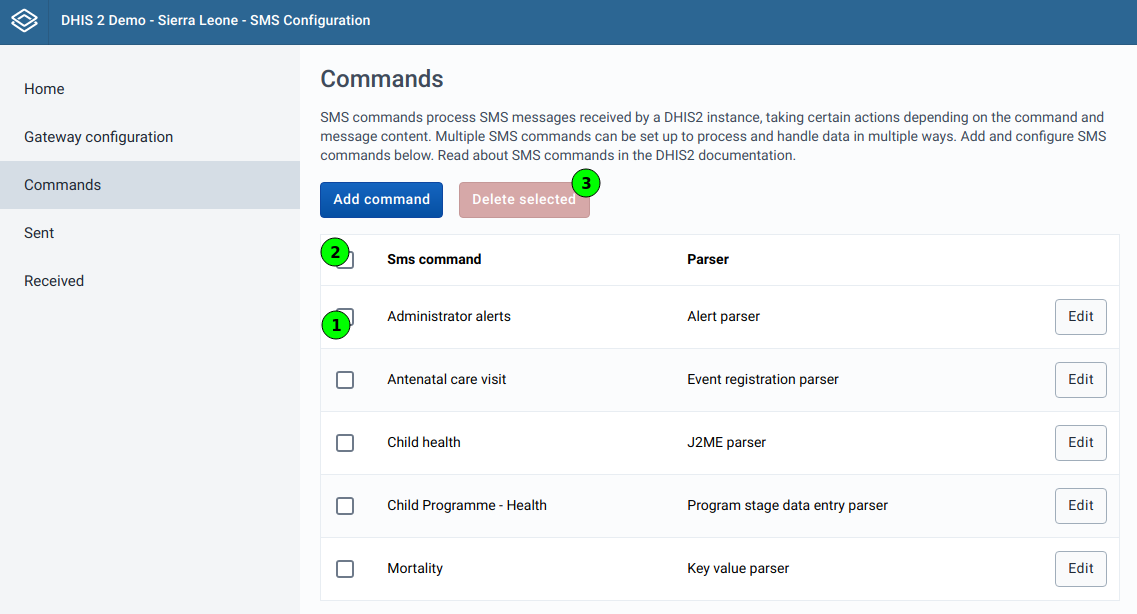
To prevent accidental deletions, a confirmation dialog will show up.
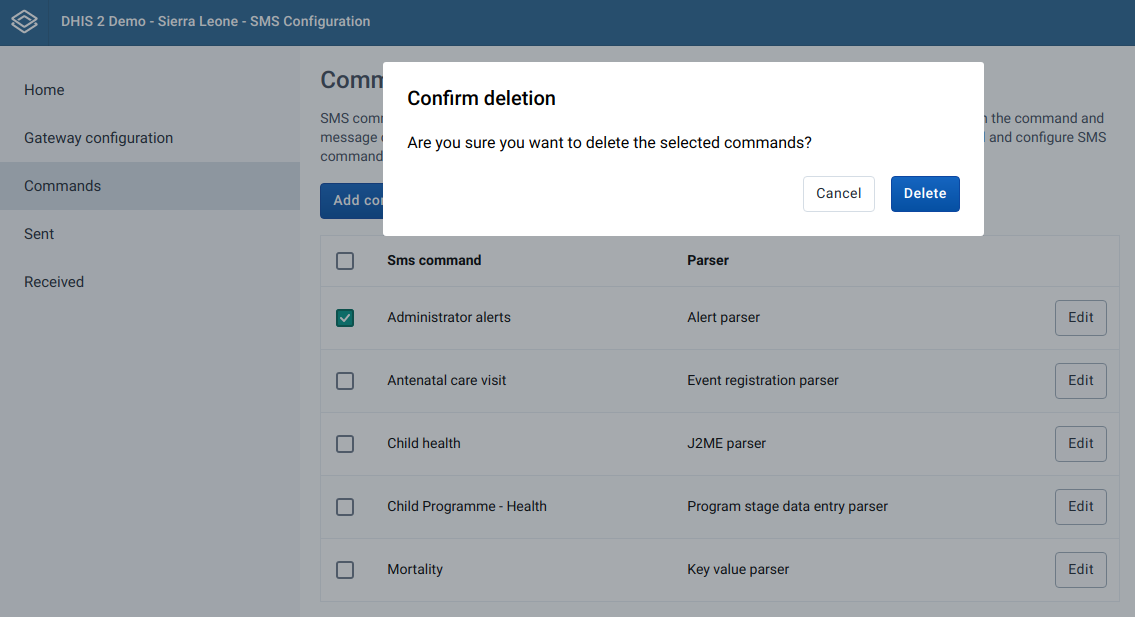
Caution
Commands are not active immediately after they are added! They must then be edited in order to configure the necessary fields!
After clicking on the "Add command" button in the command overview page, a dynamic form will appear. Depending on the parser type, different inputs will be displayed:
| Parser type | User group | Program | Program Stage | Data set |
|---|---|---|---|---|
| Alert parter | ✓ | ✕ | ✕ | ✕ |
| Event registration parser | ✕ | ✓ | ✓ | ✕ |
| J2ME parser | ✕ | ✕ | ✕ | ✓ |
| Key value parser | ✕ | ✕ | ✕ | ✓ |
| Program stage data entry parser | ✕ | ✓ | ✓ | ✕ |
| Tracked entity registration parser | ✕ | ✓ | ✕ | ✕ |
| Unregistered parser | ✓ | ✕ | ✕ | ✕ |
These commands can have short codes for their associated program stage. Only programs of type "Event program" can be chosen for this command. Therefore only one program stage exists, which will be selected automatically.
These commands can have short codes for their associated program stage. Only programs of type "Tracker program" can be chosen for this command. Unlike "Event registration" parsers, a program stage has to be chosen for this parser type.
When editing commands, changing the parser type as well as the additional data supplied when adding the command is not possible. The only way this is currently possible is by creating a new command and deleting the old one.
There are certain parameters which are common to all SMS Command types. These parameters have default values configured in the system, if user does provide any value to these parameters then those default ones will be used. Here is the list of those parameters
These common fields are:
| Parameter | Type | Description |
|---|---|---|
| Field Separator | String | To provide custom field separator. Default is "|" |
| Reply message if no codes are sent (only the command) | String | To provide message if no code is found in SMS text input. Default is "Parameter missing" |
| Wrong format message | String | To provide message if command is not formatted correctly. Command should be formatted as per code value separator. This message will also be sent back if any mandatory parameter is missing. |
| No user message | String | To provide message if sending phone number is not registered in DHIS2. |
| User belong to more than one OrgUnit message | String | Certain SMS command types require user ( retrieved from sending phone number ) to be associated with only one organization unit. This message can be configured to be sent back in case that requirement is not fullfilled. |
| Success Message | String | To provide message that will be sent upon successful completion of the process. |
Some commands have the option to add short codes, which are explained in the individual sections for each parser type down below.
When editing an alert parser command, only two fields are editable, the fields that are shared between most parser types are not present:
Both are text fields.
Commands of this parser type have all the shared fields. Additionally short codes can be defined. A short code can be added for every data element connected to the program stage that was selected when adding the command:
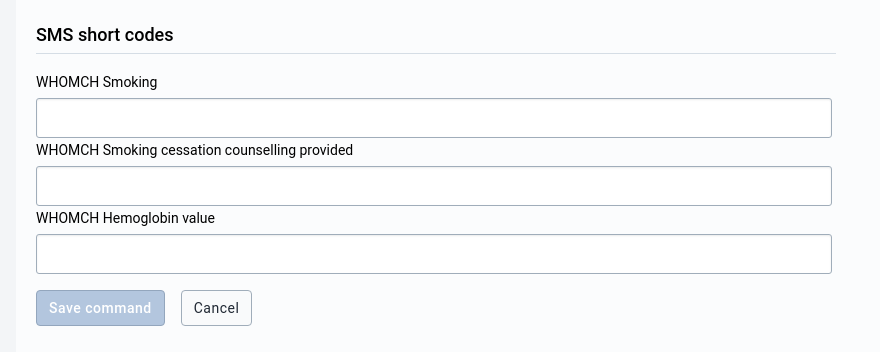
Commands of this parser type have all the shared fields. The SMS command will have a dataset because those are used for reporting data. If data is reported for a Period which is already approved then SMS response will be sent back containing information about approval status of the period. Additionally short codes can be defined. Each command is connected to a dataset. The dataset has data elements, which have category combos, which have at least one category option combo. For every existing "data element - category option combo" combination, a short code can be provided.
Required values notice Make sure at least one SMS short code is provided when completeness method "Receive at least one data value" is chosen, otherwise received messages will not be processed.
Each short code can have an optional formula. By providing a formula, the value of a different data element can be either added or subtracted.
This can be done by clicking the "Add formula" / "Edit formula" button below the short code's input field:
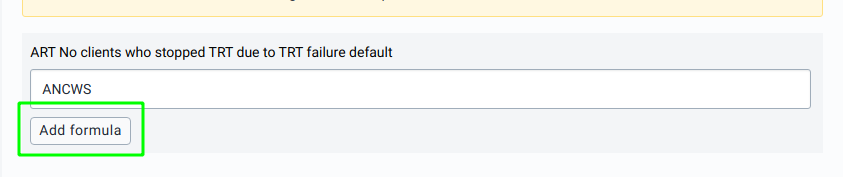
When clicking the button, a modal will appear which offers a dropdown to select a data element, and the formula operator, which can be either "+" or "-":
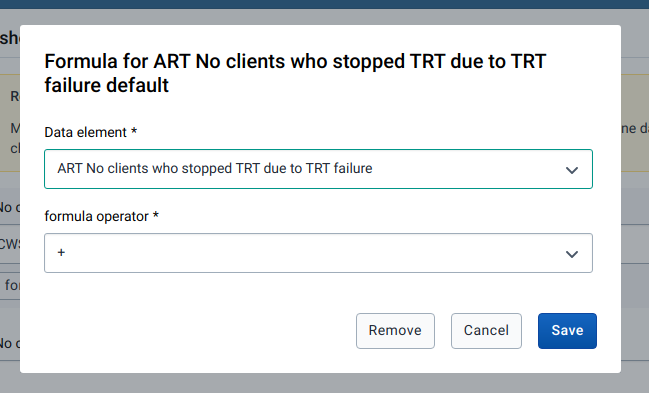
By clicking "Save", the formula will be added to the main edit form, it does not get saved to the command automatically! In order to save a changed formula, you need to submit the whole form.
If a short code has a formula, it can be removed by clicking the "Edit formula" button. The modal that will appear, has a button "Remove". By clicking that button, the formula will be removed from the short code in the main form and the modal will close. It does not get saved to the command automatically! In order to save the removal of the formula, you need to submit the whole form.
This command type works identically to J2ME parser commands work. Please check the documentation above.
Commands of this parser type have all the shared fields. Additionally short codes can be defined. A short code can be added for every data element connected to the program stage that was selected when adding the command:
Commands of this parser type have all the shared fields. Additionally short codes can be defined. A short code can be added for every tracked entity attribute connected to the program that was selected when adding the command:
This command type works identically to alert parser commands work. Please check the documentation above.
An SMS gateway lets a DHIS2 instance send and receive SMS messages. Different gateway types can be added and configured below. At least one gateway is needed to send and receive SMS messages. Load balancing will use all gateways if there are multiple available.
There are four types of Gateways supported by the SMS Service: * Generic gateways * BulkSMS gateways * Clickatell gateways * SMPP gateways
To see all available gateways, navigate to the "Gateway configurations" page. All gateways will be listed in a table. On this page the following actions are available:
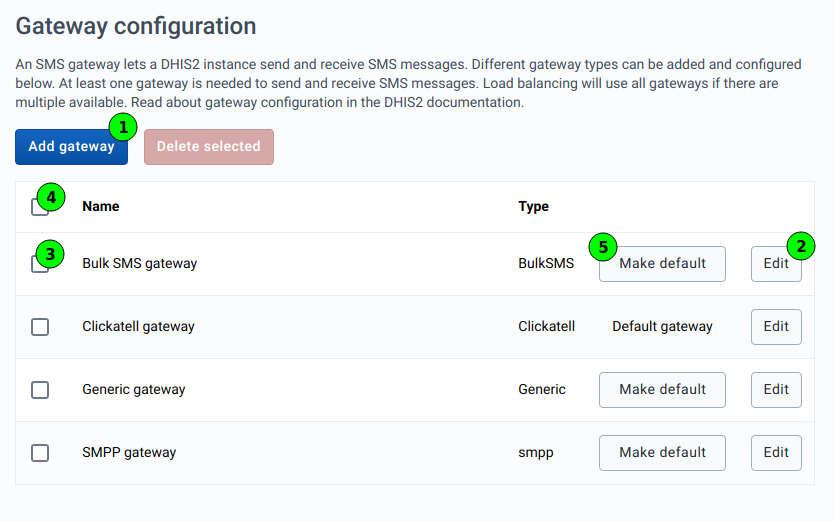
After clicking on the "Add gateway" button in the gateway configurations overview page, a dynamic form will appear. It's devided into two sections:
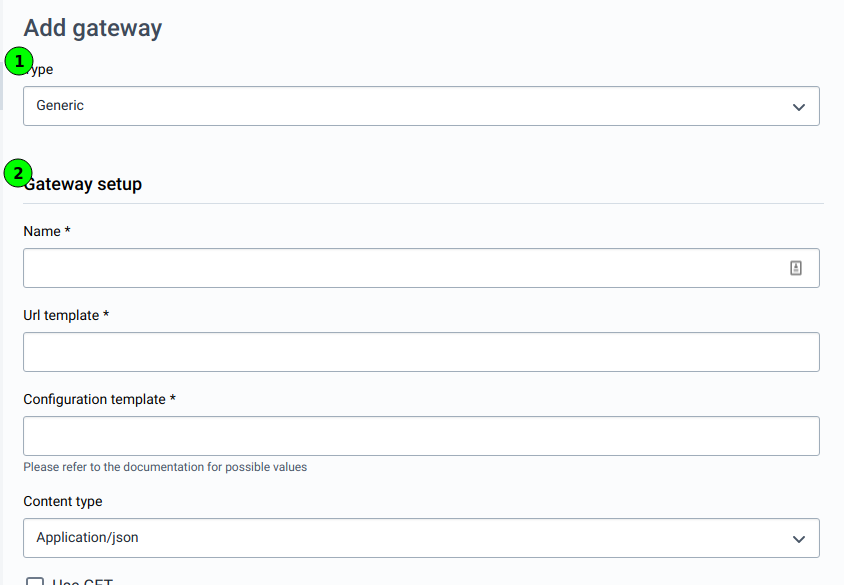
For more details about configuring gateways, please refer to the Gateway Configurations section of the "Mobile" maintenance documentation.
Editing is similar to adding gateways with the exception that the gateway type cannot be altered. If a gateway has the wrong type, it needs to be deleted and added again. For more information how to edit gateways, please refer to the "Adding gateways" section above.
To see all inbound sms, navigate to the "Received" page. All received sms will be listed in a paginated table. On this page the following actions are available:
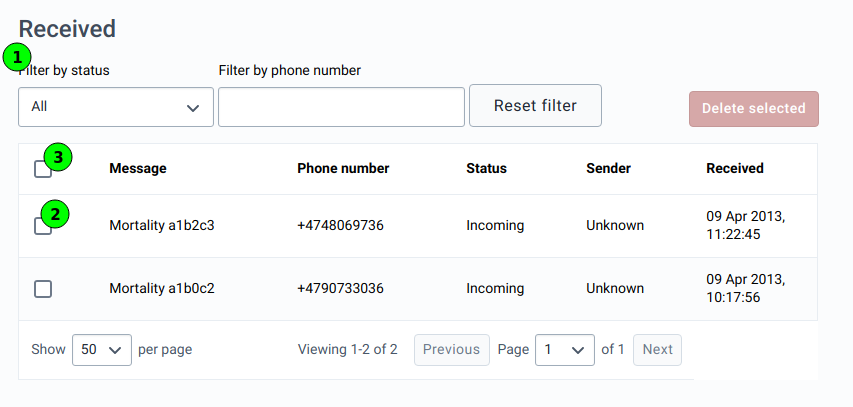
All set filters can be reset by clicking on the "Reset filter" button.
The list of inbound SMSes can be filtered by the following statuses:
By entering a phone number in the input field above the table with the SMSes, the table can be filtered by that phone number.

This section is identical to the "Inbound"/"Received" SMSes section, with only one difference: The list cannot be filtered by a phone number. Please refer to the "View inbound SMS" section.
Applications are one of the main ways that DHIS2 can be extended. A DHIS2 installation comes bundled with around 30 core apps.
These apps can be accessed from the search menu on the header bar (top image below) or the more powerful command palette since DHIS2 v42 (bottom image).
One of the core apps is the App Management app which is used to install, update, delete and maintain installed apps on an DHIS2 instance.
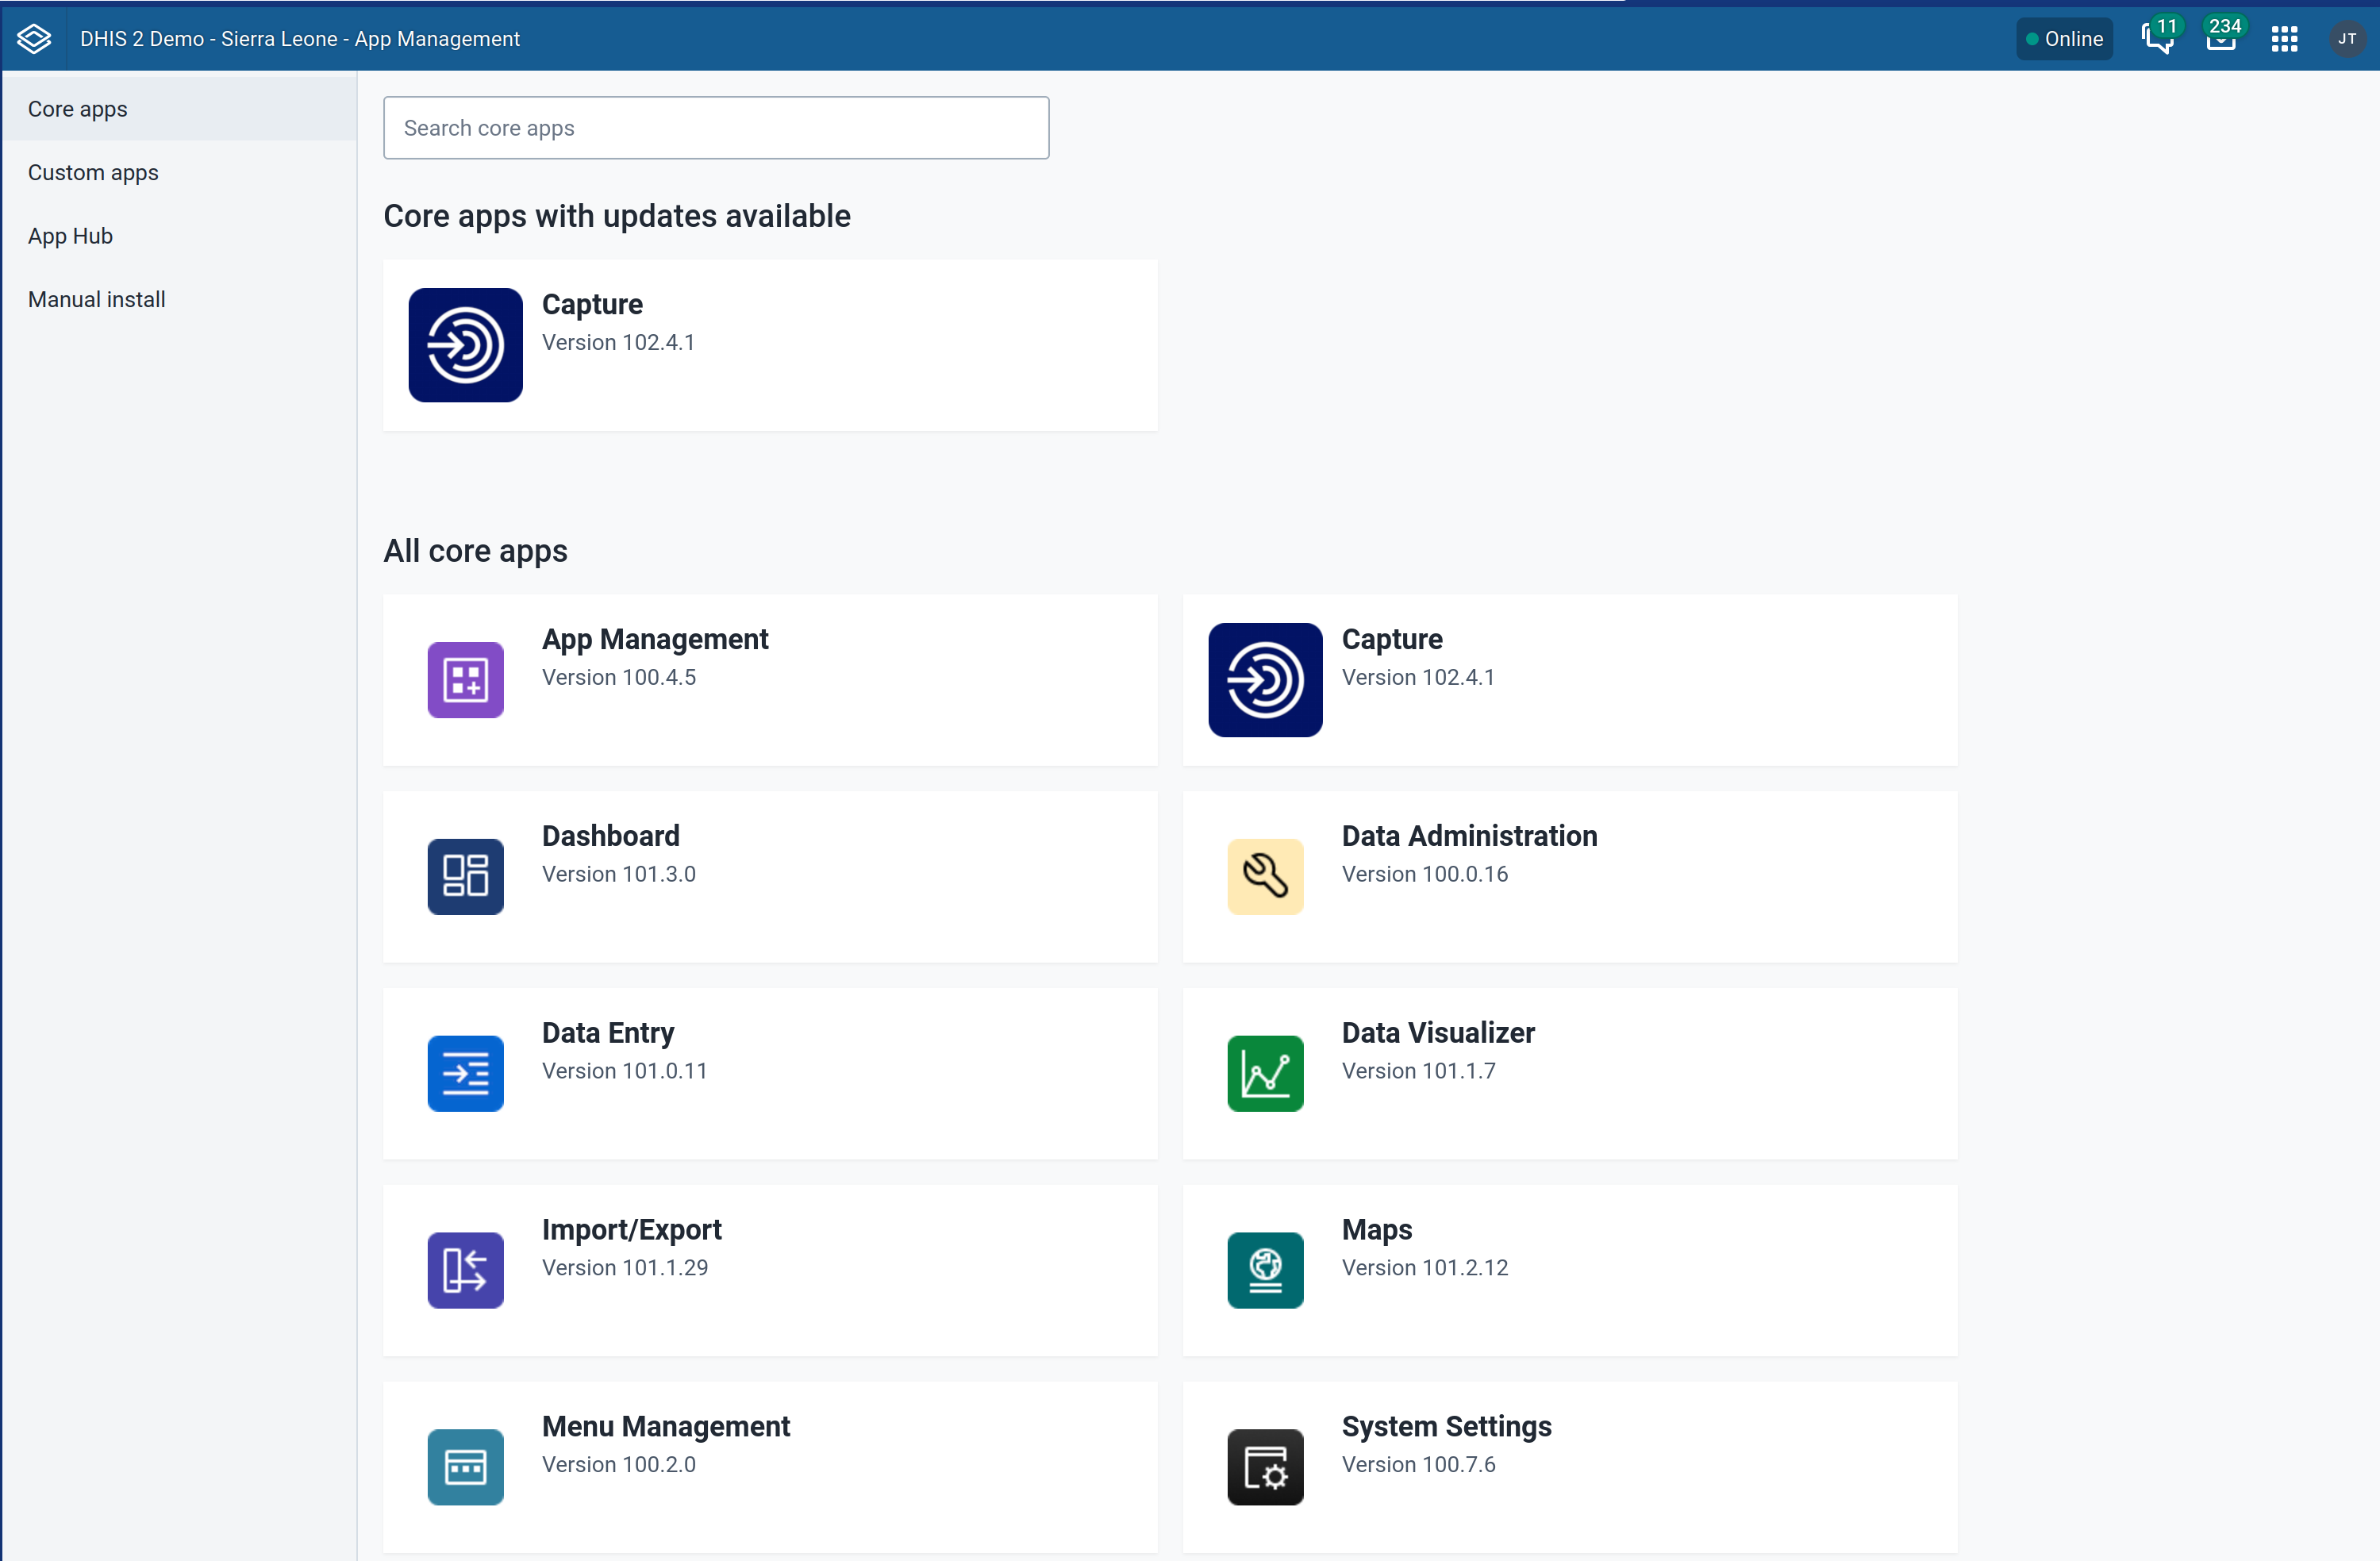
The App Management app has four sections:
These are the apps typically bundled with a DHIS2 installations. They provide core functionality for DHIS2 — for example, data entry (aggregate and tracker), maintenance, analytics, and visualisation — among many other use cases.
In the App Management core apps page, you can see the currently installed apps and their versions. Apps with updates available are highlighted at the top.
This section displays apps that are installed manually from the Manual Install section. Since these are manually installed, they might lack some information (such as their version, and whether there is an update).
Other than the DHIS2 applications provided by the core team, there is a thriving community of developers that builds and maintains apps for the platform. These can be accessed and viewed on the App Hub: https://apps.dhis2.org.
The App Hub section in the App Management app integrates with App Hub to seamlessly allow users to install and manage apps available in the App Hub.
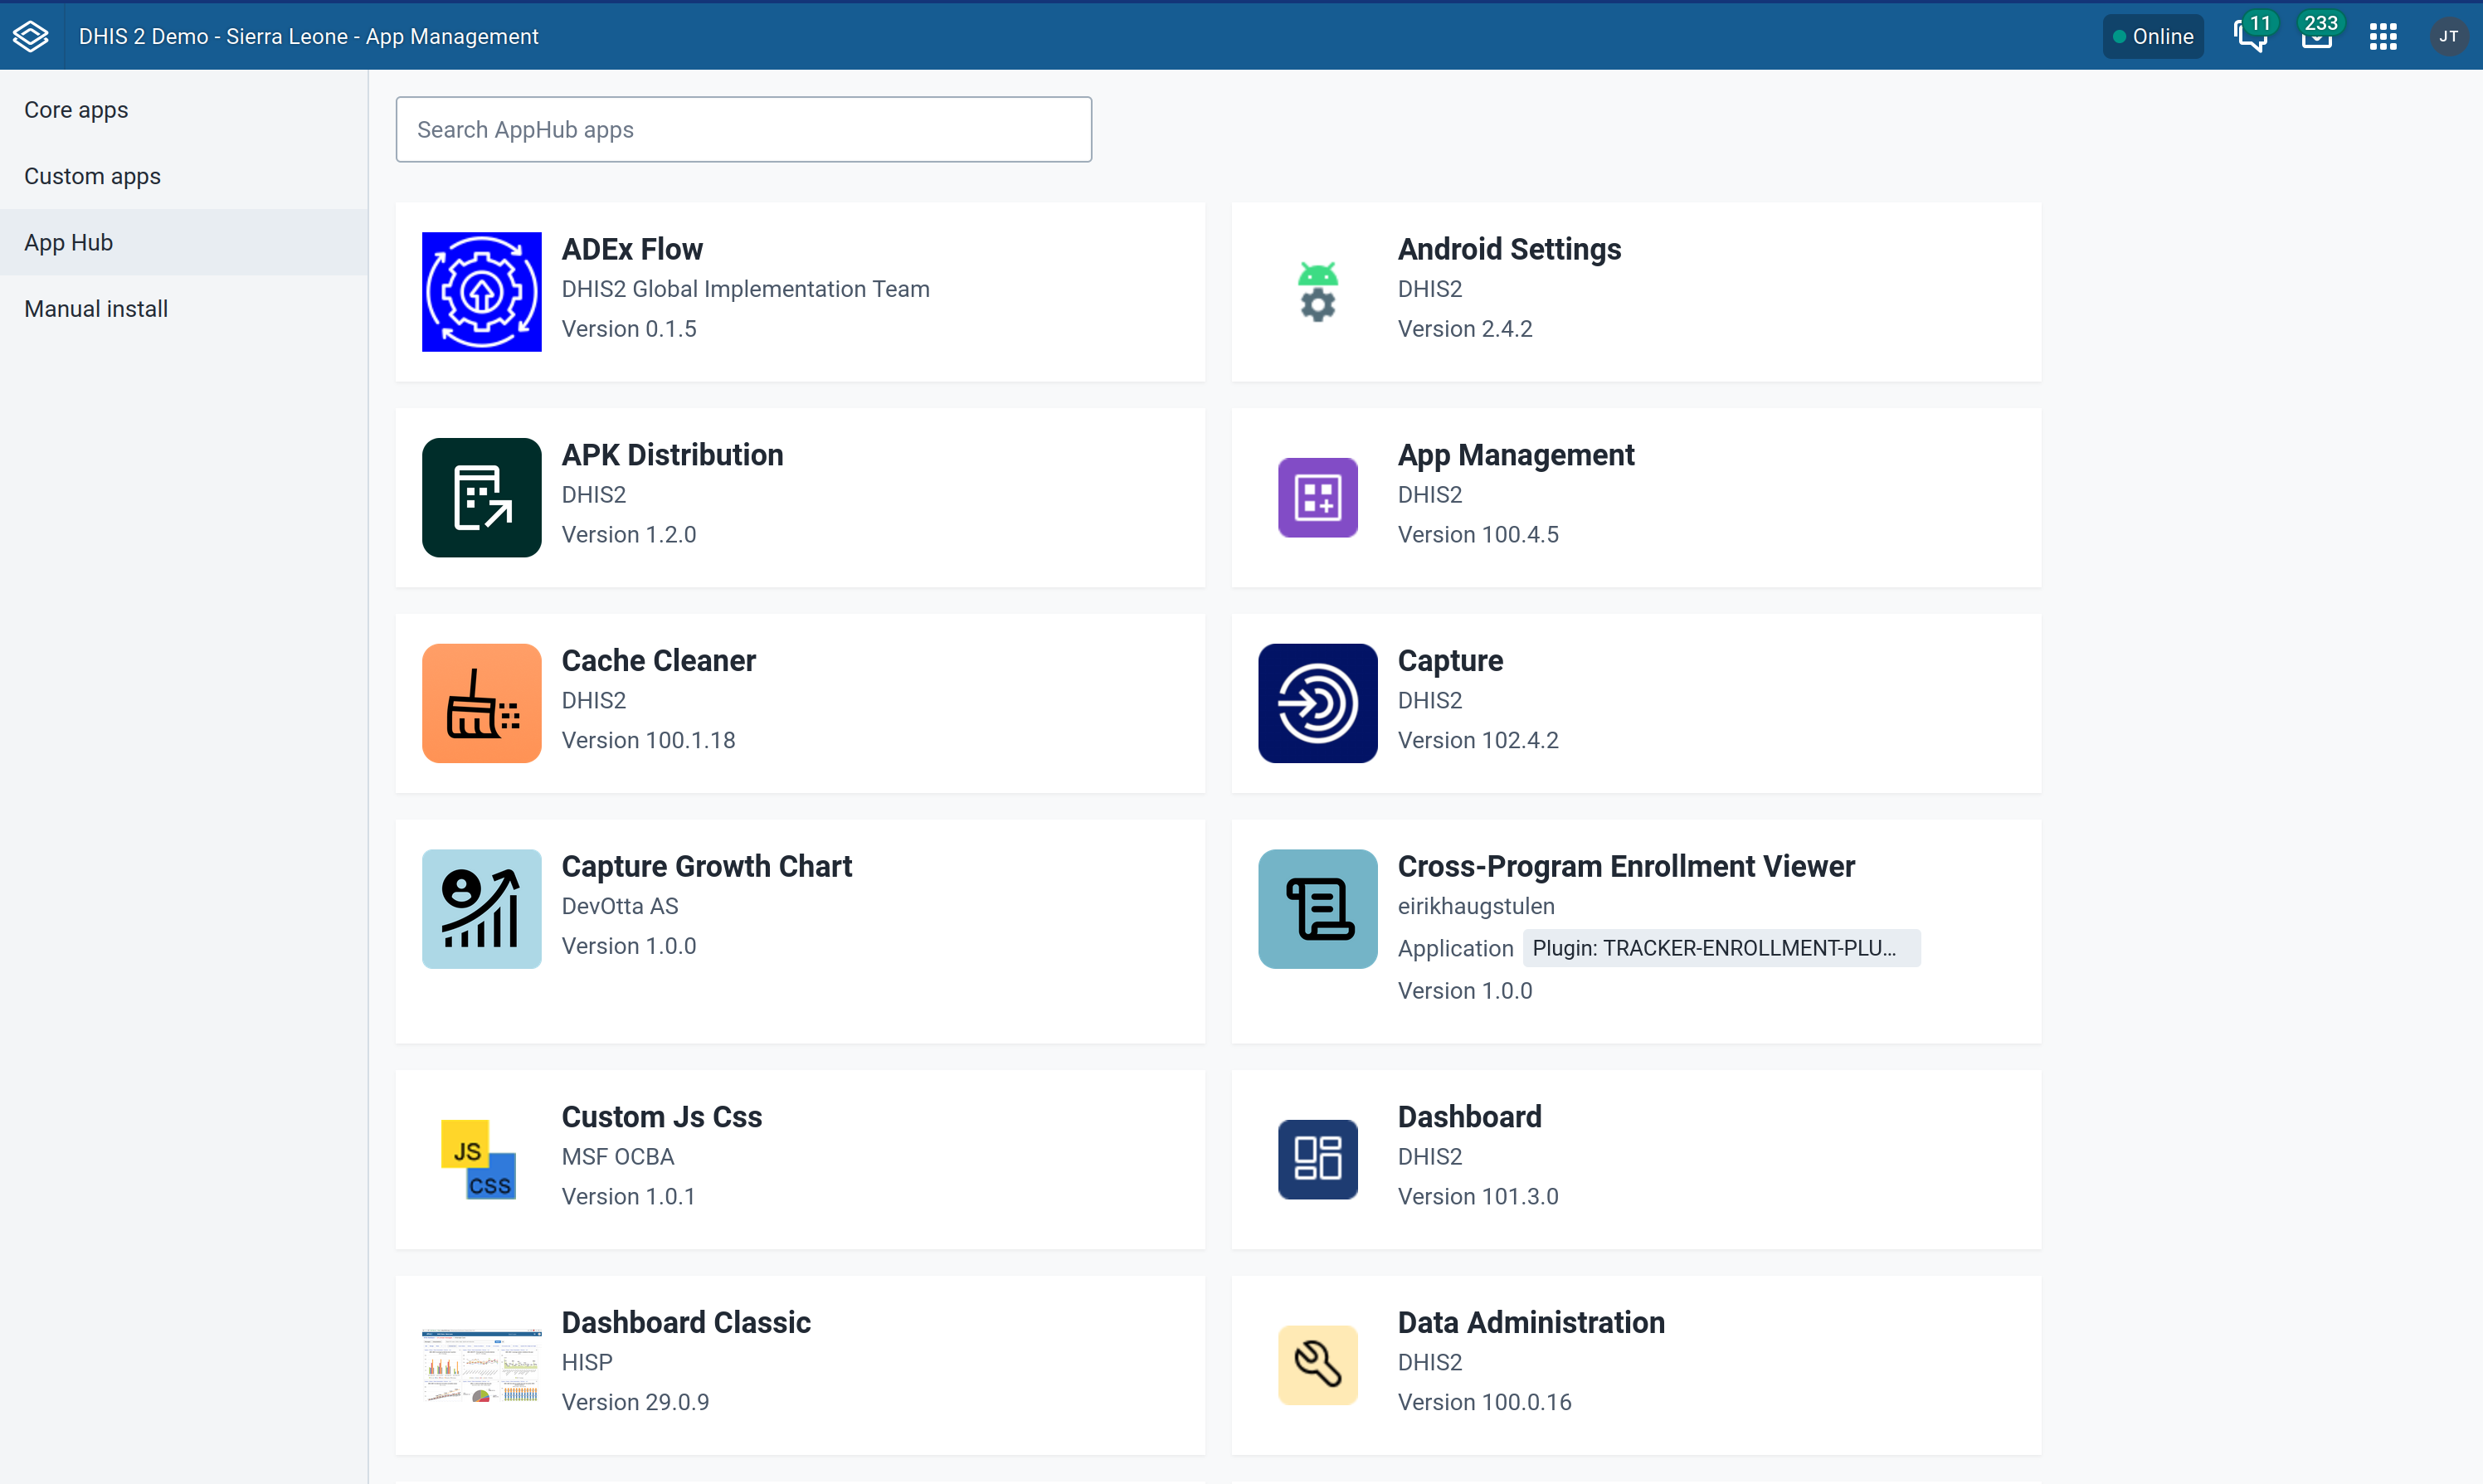
In this section, users can install apps manually by uploading a zip file containing a DHIS2-compliant app. The zip files can be obtained from a variety of sources (GitHub release pages, App Hub, directly from developers, etc.)
For information on developing such DHIS2 apps, you can refer to the developer documentation: https://developers.dhis2.org/docs.
When you click on one of the apps in any section (core, custom or App Hub), you will be taken to the application details view.
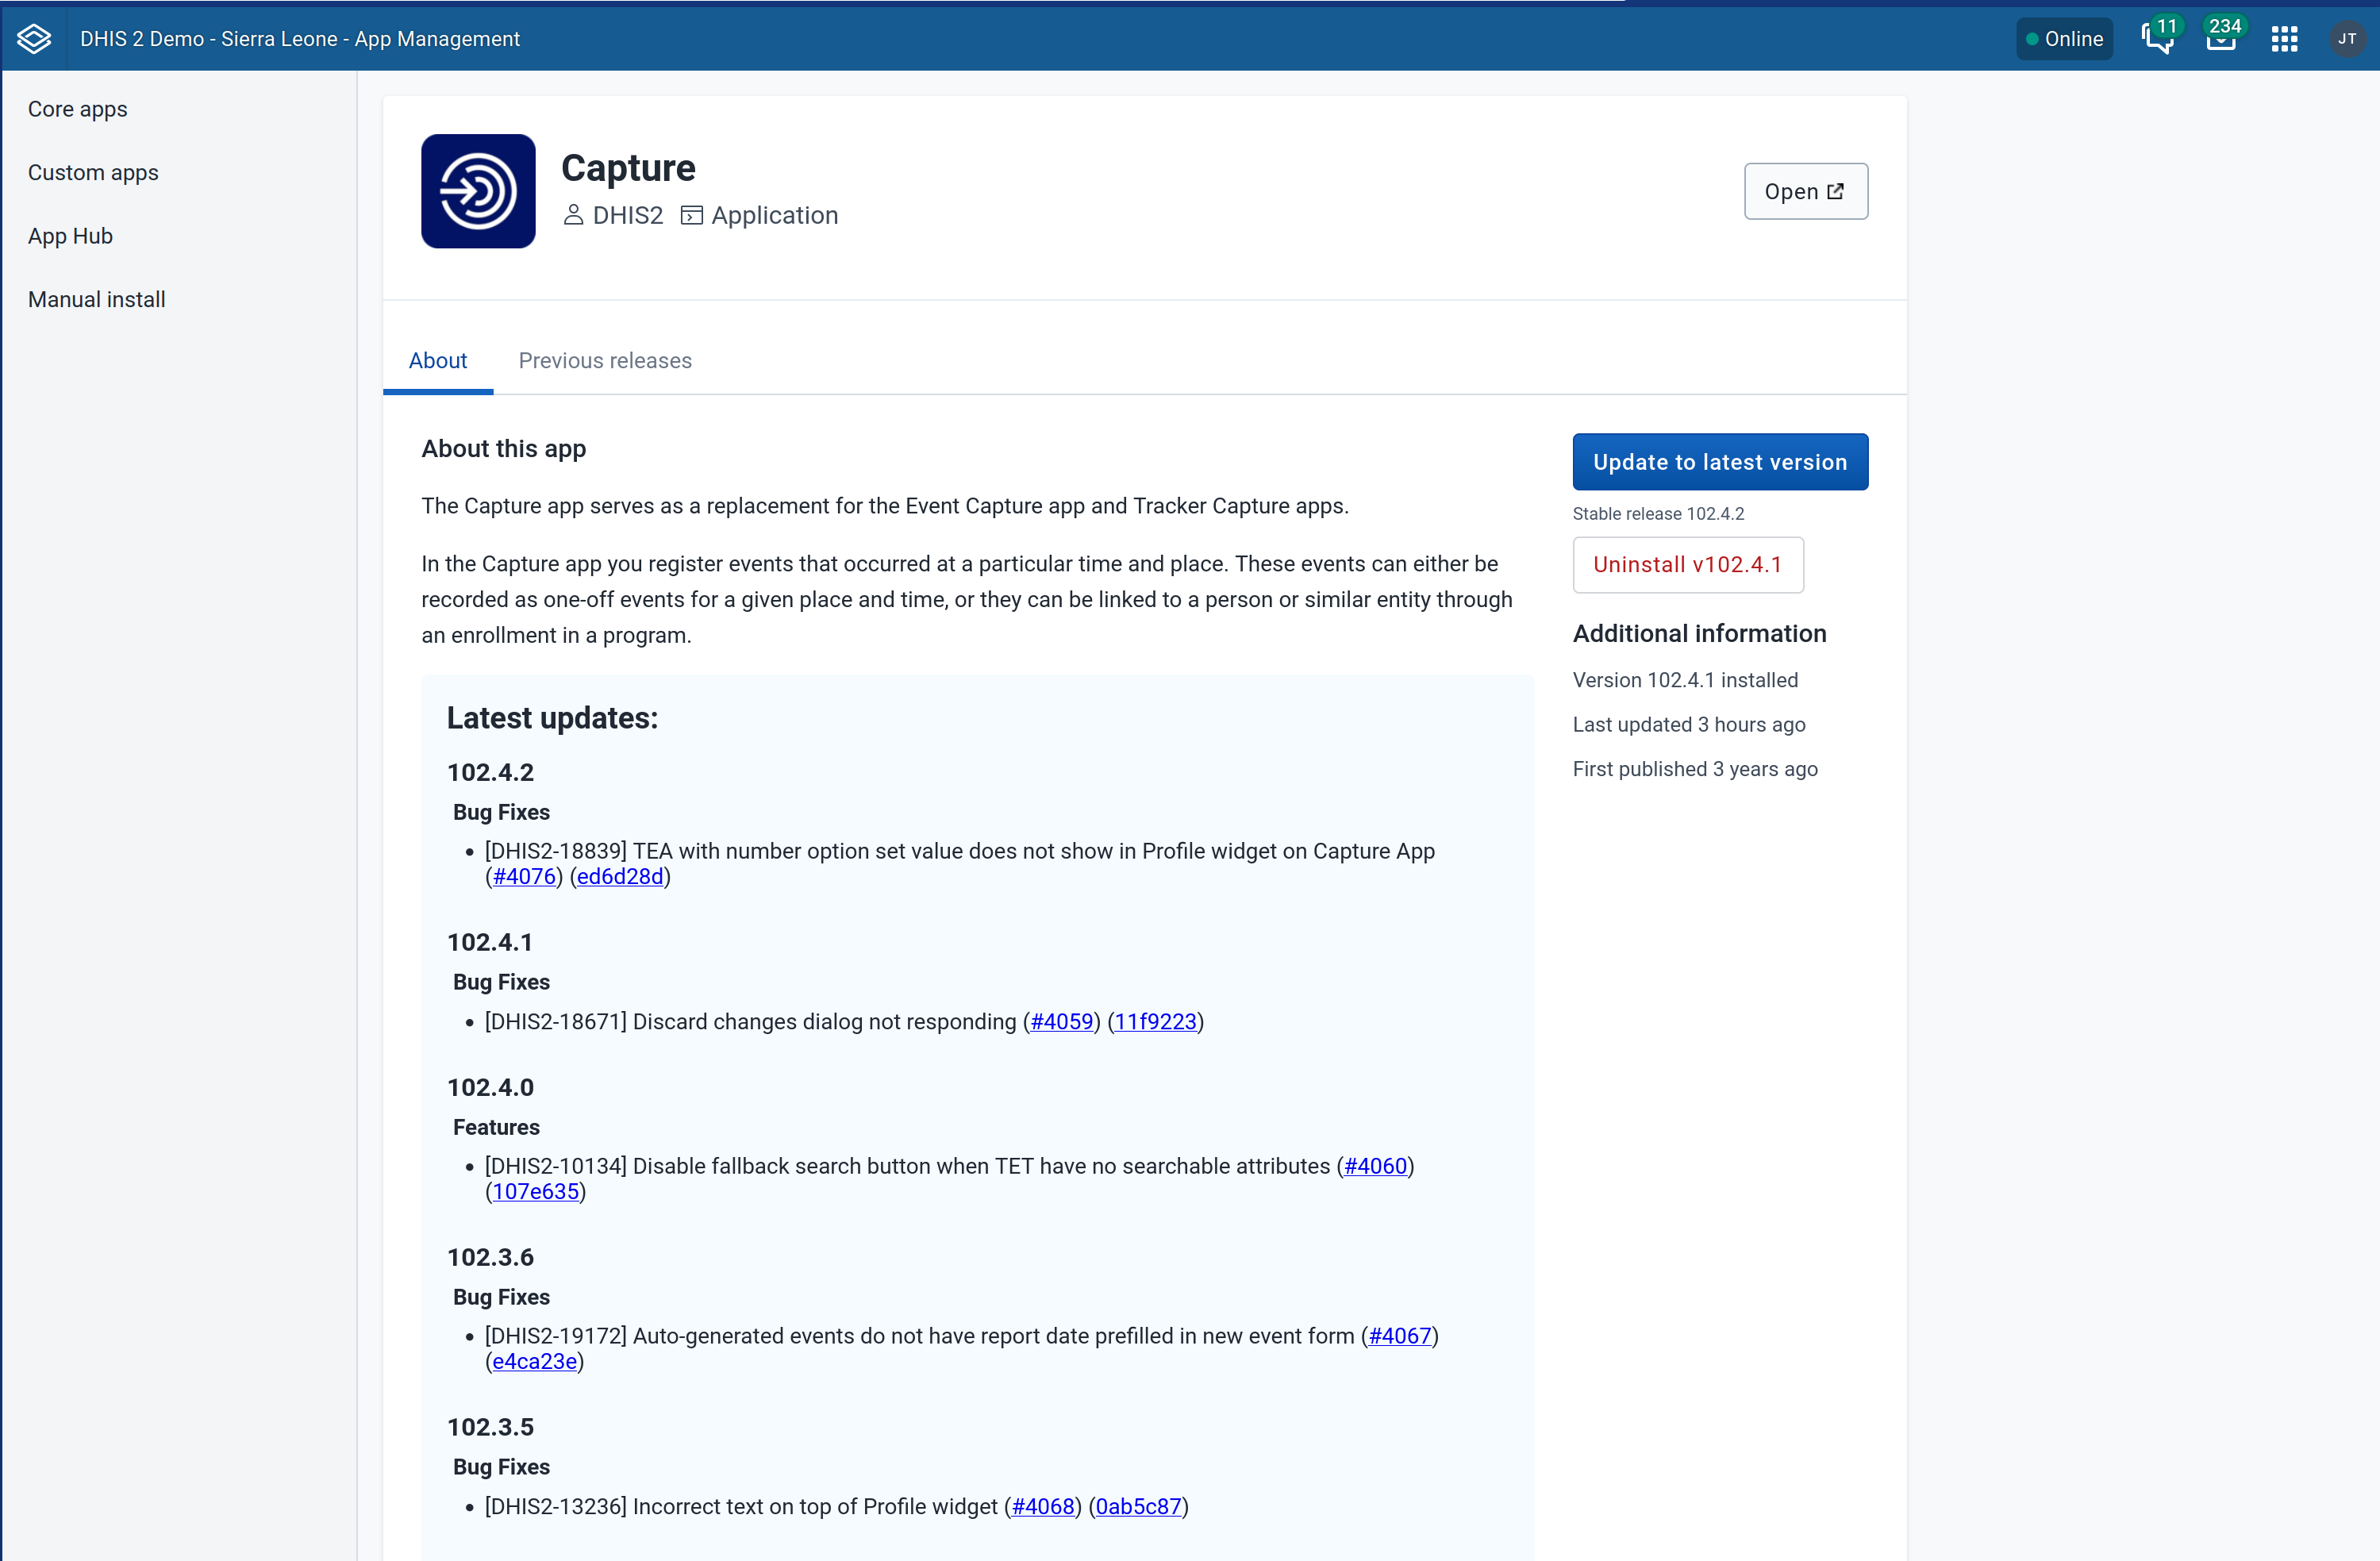
The top part of the application view provides the basic information about the app:
The About tab provides the app description provided by the developer, as well as a list of the latest updates to the app if they are provided by the developer.
The Latest Updates section provides information about what features or bug fixes were added in each version of the app. This allows administrators to make an informed decision on whether to upgrade an app to a specific version or not.
This section depends on the developers providing the information, either automatically through change logs, or manually by updating the App Hub page for the app. Both of these approaches are described in details in the developers documentation for developers and organisations who want to integrate change logs in their apps development process.
On the right of the app page (in the About tab), there are also buttons that allow you to Update to latest version if you are not on the latest version, as well as completely uninstalling the app if you wish to.
You can open an installed app using the Open button at the top of the app details page or by searching for it either in the app menu or Command Palette (available in DHIS2 version 42+).
The Previous Releases tab provides an extended view of the Latest Updates section. It lists all the versions of the app that are compatible with the instance's DHIS2 version.
Each version entry allows the user to install the specific version of the app, or download the zip file of the app - the downloaded file could then manually installed if you wish to, but it is better to use the install option so that the App Management app can keep track of the apps' history and alert you for future releases.
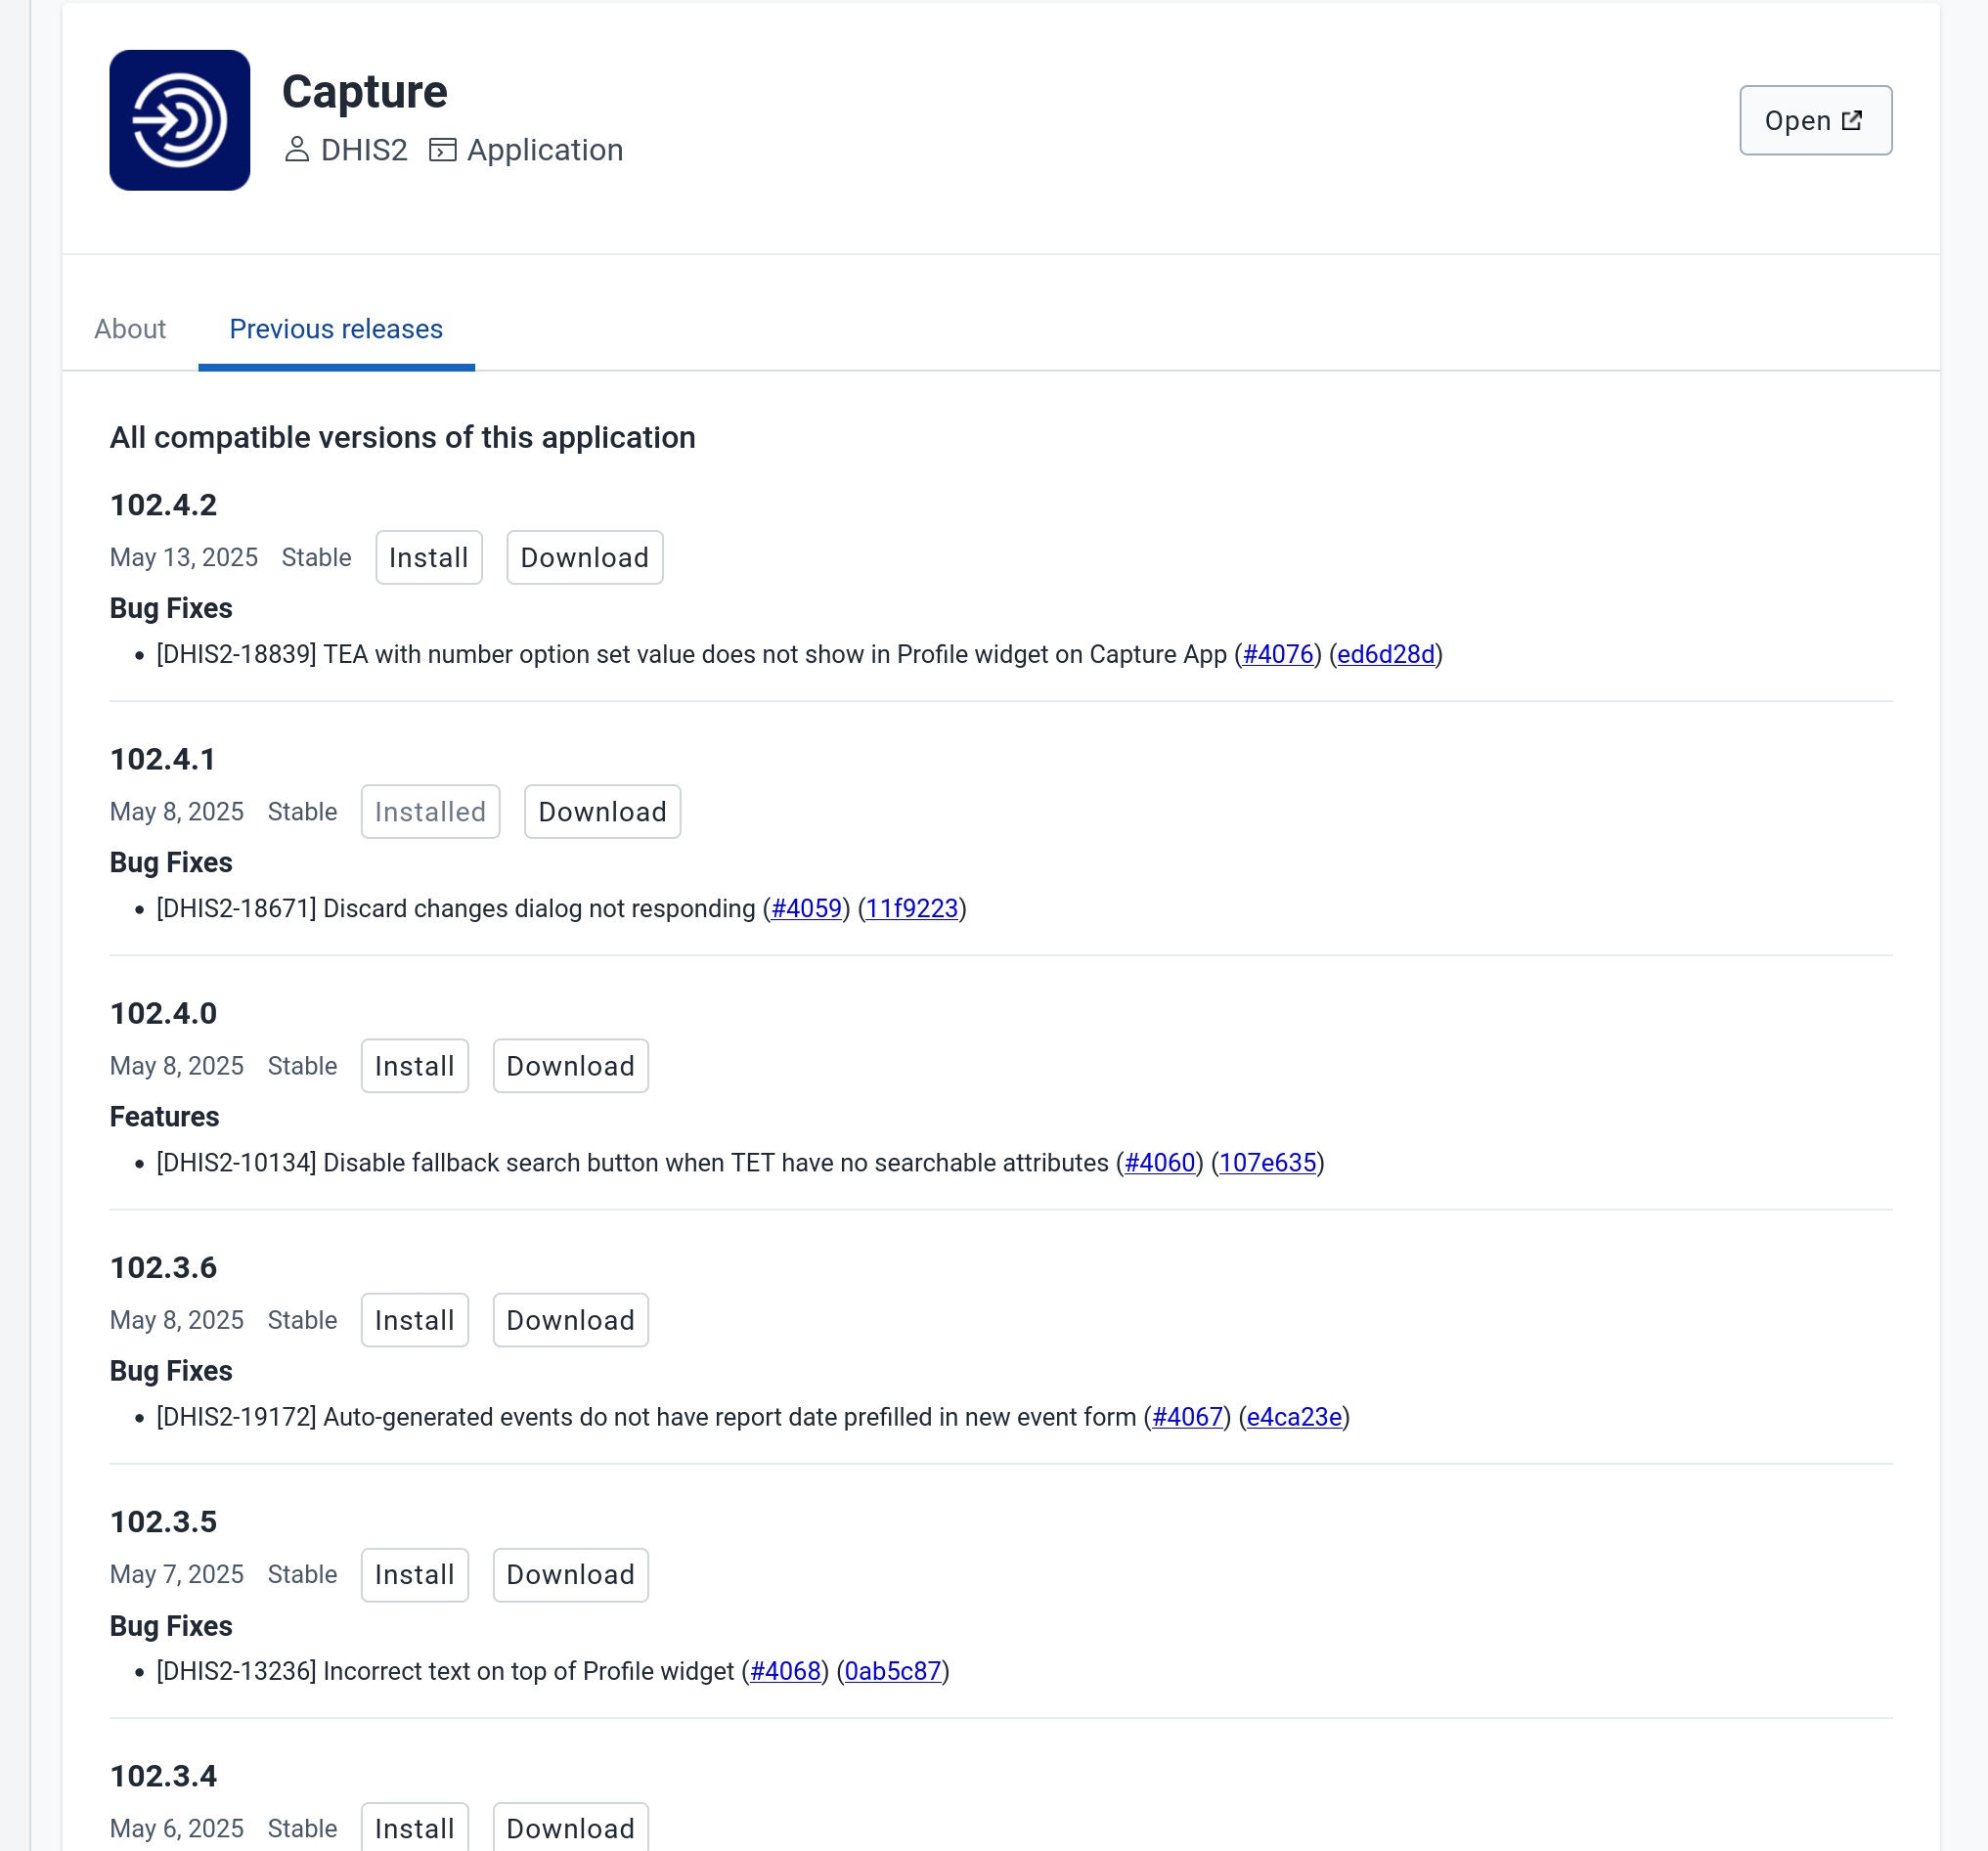
A data value in DHIS2 is described by at least three dimensions: 1) data element, 2) organisation unit, and 3) period. These dimensions form the core building blocks of the data model.

As an example, if you want to know how many children that were immunised for measles in Gerehun CHC in December 2014, the three dimensions which describe that value are the data element "Measles doses given", the organisation unit "Gerehun CHC", and the period "December 2014". All data values have at least these three dimensions describing what, where, and when.
In addition to the data element, organisation unit, and period dimensions, data values may also be associated with additional data dimensions. A common use of this feature is to describe data values which are reported by multiple partners in the same location for the same data element and time period. In principle, it can be used as a "free-form" dimension, to describe multiple observations of the same phenomena at the same place and time. For more information about this, see Chapter 34: Additional data dimensions.
| Organisation Unit | Data Element | Period | Value |
|---|---|---|---|
| Gerehun CHC | Measles doses given | Dec-09 | 22 |
| Tugbebu CHP | Measles doses given | Dec-09 | 18 |
The data element mentioned above ,"Measles doses given", can be further disaggregated into by combinations of data element categories. Each system administrator of DHIS2 is free to define any data element category dimensions for data elements. There are however, certain best practices which should generally be followed.
Given the example of Measles vaccination, if you want to know whether these vaccines were given at the facility (fixed) or out in the community as part of the outreach services then you could add a dimension called—e.g., "Place of service", with the two possible options "Fixed" and "Outreach". Then all data collected on measles immunisation would have to be disaggregated along these to options. In addition to this you might be interested in knowing how many of these children who were under 1 year or above 1 year of age. If so you can add an Age dimension to the data element with the two possible options "\<1 y" and ">1 y". This implies further detail on the data collection process. You can also apply both categories "Place of service" and "Age" and combine these into a data element category combination e.g. called "EPI disaggregation". You would then be able to look at four different more detailed values in stead of only one as in the example above for the data element "Measles doses given": 1) "Fixed and \<1 y, 2) Fixed and >1 y, 3) Outreach and \<1 y, and 4) Outreach and >1 y. This adds complexity to how data is collected by the health facilities, but at the same time opens up for new possibilities of detailed data analysis of Measles immunisation.
| Organisation Unit | Data Element | Place of service | Age | Period | Value |
|---|---|---|---|---|---|
| Gerehun CHC | Measles doses given | Fixed | \<1 y | Dec-09 | 12 |
| Gerehun CHC | Measles doses given | Outreach | \<1 y | Dec-09 | 4 |
| Gerehun CHC | Measles doses given | Fixed | >1 y | Dec-09 | 4 |
| Gerehun CHC | Measles doses given | Outreach | >1 y | Dec-09 | 2 |
| Tugbebu CHP | Measles doses given | Fixed | \<1 y | Dec-09 | 10 |
| Tugbebu CHP | Measles doses given | Outreach | \<1 y | Dec-09 | 4 |
| Tugbebu CHP | Measles doses given | Fixed | >1 y | Dec-09 | 3 |
| Tugbebu CHP | Measles doses given | Outreach | >1 y | Dec-09 | 1 |
While the data element categories and their options described above provide the level of detail (disaggregation) at the point of data collection and how data values get stored in the database, the data element group sets and groups can be used to add more information to data elements after data collection. As an example, if you are analysing many data elements at the same time in a report, you would want to group these based on some criteria. Instead of looking at all the data captured in a form for immunisation and nutrition, you might want to separate or group data elements along a programme dimension (known as a data element group set in DHIS2) where "Immunisation" (or EPI) and "Nutrition" would be the two groups.
Expanding the report to include data from other programs or larger themes of health data would mean more groups to such a group set dimension, like "Malaria", "Reproductive Health", "Stocks". For this example, you would create a data element group set called "Programme" (or whatever name you find appropriate), and to represent the different programmes in this dimension you would define data elements groups called "EPI", "Nutrition", "Malaria", "Reproductive health" and so on, and add all these groups to the "Programme" group set. To link or tag the data element "Measles doses given" to such a dimension you must (in our example) add it to the "EPI" group. Which groups you add "Measles doses given" to does not affect how health facilities collect the data, but adds more possibilities to your data analysis. So for the group set dimensions there are three levels; the group set (e.g. "Programme"), the group (e.g. "EPI"), and the data element (e.g. "Measles doses given").
Indicators can be grouped into indicator groups and further into indicator group sets (dimensions) in exactly the same way as data elements.
| Organisation Unit | Data Element | Programme | Period | Value |
|---|---|---|---|---|
| Gerehun CHC | Measles doses given | EPI | Dec-09 | 22 |
| Gerehun CHC | Vitamin A given | Nutrition | Dec-09 | 16 |
| Tugbebu CHP | Measles doses given | EPI | Dec-09 | 18 |
| Tugbebu CHP | Vitamin A given | Nutrition | Dec-09 | 12 |
| Gerehun CHC | Malaria new cases | Malaria | Dec-09 | 32 |
| Tugbebu CHP | Malaria new cases | Malaria | Dec-09 | 23 |
Organisation units in DHIS2 should typically represent a location, such as a Community Health Centre or referral hospitals, or an administrative unit like "MoHS Sierra Leone", "Bo District" or "Baoma Chiefdom". In non-health sector applications, they could be "schools" or "water points". Orgunits are represented in a default hierarchy, usually the default administrative hierarchy of a country or region, and are therefore assigned an organisational level. As an example, Sierra Leone has four organisation unit levels; National, District, Chiefdom, and Facility, and all orgunits are linked to one of these levels. An orgunit hierarchy in DHIS2 can have any number of levels. Normally data is collected at the lowest level, at the health facility, but can be collected at any level within the hierarchy, such as both the districts as well as the facility level.
When designing reports at higher levels with data aggregated at the district or province level, DHIS2 will use the hierarchy structure to aggregate all the health facilities' data for any given unit at any level. The organisation unit level capturing the data always represents the lowest level of detail that is possible to use in data analysis, and the organisational levels define the available levels of aggregation along a geographical dimension.
While facility level is typically the lowest geographical level for disaggregation in DHIS2, there are ways to flexibly group organisation units into any number of dimensions by using the organisation unit groups and group set functionality. As an example, if all facilities are given an official type like "Community health center" or "District Hospital, it is possible to create an organisation unit group set called "Type" and add groups with the names of the types mentioned above. In order for the group sets to function properly in analysis, each organisation unit should be a member of a single group (compulsory and exclusive) within a group set. Stated somewhat differently, a facility should not be both a "Community health center" as well as a "District hospital".
You can improve the completeness of your aggregated data by inheriting the settings of a "parent" organisation unit in your organisation unit hierarchy. This is particularly helpful if you are aggregating the data of more than 100 organisation units. See the Maintenance app documentation for more details.
A more advanced use of organisation unit group sets is to create alternative hierarchies e.g. use administrative borders from other ministries. In Sierra Leone that could mean an alternative hierarchy of 1:MoHS, 2:Districts, and 3: Local councils, instead of the four-level hierarchy with chiefdoms and facilities. For instance, if all facilities are linked to a specific local council, it would be possible to look at data aggregated by local council instead of chiefdom. Then you would first need to create a group set called "Local council" and then create one organisation unit group for every local council, and finally link all facilities to their corresponding local council group.
| District | OrgUnit Type | Data Element | Period | Value |
|---|---|---|---|---|
| Bo | CHC | Measles doses given | Dec-09 | 121 |
| Bo | CHP | Measles doses given | Dec-09 | 98 |
| Bo | MCHP | Measles doses given | Dec-09 | 87 |
| Bombali | CHC | Measles doses given | Dec-09 | 110 |
| Bombali | CHP | Measles doses given | Dec-09 | 67 |
| Bombali | MCHP | Measles doses given | Dec-09 | 59 |
As mentioned above, all organisation units should be a member of a single group within a group set. If an organisation unit is not present in any group or is present in multiple group members in a group set, this can lead to unexpected results in the analysis modules. DHIS2 has integrity checks to identify organisation units which are not present in any organisation unit group set member, or which is present in multiple groups.
The period dimension becomes an important factor when analysing data over time e.g. when looking at cumulative data, when creating quarterly or annual aggregated reports, or when doing analysis that combines data with different characteristics like monthly routine data, annual census/population data or six-monthly staff data.
In DHIS2, periods are organised according to a set of fixed period types described below. The following list is for the default ISO 8601 calendar type.
Daily
Weekly: The system supports various weekly period types, with Monday, Wednesday, Thursday, Saturday and Sunday as the first day of the week. You collect data through data sets configured to use the desired weekly period type. The analytics engine will attribute weekly data to the month which contains four days or more of the week.
Bi-weekly: Two week periods beginning with the first week of the year.
Monthly: Refers to standard calendar months.
BiMonthly: Two-month periods beginning in January.
Quarterly: Standard ISO quarters, beginning in January.
SixMonthly: Six-month periods beginning in January
Yearly: This refers to a calendar year.
Financial April: Financial year period beginning on April 1st and ending on March 31st of the calendar next year
Financial July: Financial year period beginning on July 1st and ending on June 31st of the calendar next year
Financial Oct: Financial year period beginning on October 1st and ending on September 31st of the calendar next year
Six-monthly April: Six-month periods beginning on April 1st with a duration of six calendar months.
As a general rule, all organisation units should collect the same data using the same frequency or periodicity. A data entry form therefore is associated with a single period type to make sure data is always collected according to the correct and same periodicity across the country.
It is possible however to collect the same data elements using different period types by assigning the same data elements to multiple data sets with different period types, however then it becomes crucial to make sure no organisation unit is collecting data using both data sets/period types as that would create overlap and duplication of data values. If configured correctly the aggregation service in DHIS2 will aggregate the data together, e.g. the monthly data from one part of the country with quarterly data from another part of the country into a national quarterly report. For simplicity and to avoid data duplication it is advised to use the same period type for all organisation units for the same data elements when possible.
In addition to the fixed period types described in the previous section, DHIS2 also support relative periods for use in the analysis modules.
When creating analytical resources within DHIS2 it is possible to make use of the relative periods functionality. The simplest scenario is when you want to design a monthly report that can be reused every month without having to make changes to the report template to accommodate for the changes in period. The relative period called "Last month" allows for this, and the user can at the time of report generation through a report parameter select the month to use in the report.
A slightly more advanced use case is when you want to make a monthly summary report for immunisation and want to look at the data from the current (reporting) month together with a cumulative value for the year so far. The relative period called "This year" provides such a cumulative value relative to the reporting month selecting when running the report. Other relative periods are the last 3,6, or 12 months periods which are cumulative values calculated back from the selected reporting month. If you want to create a report with data aggregated by quarters (the ones that have passed so far in the year) you can select "Last four quarters". Other relative periods are described under the reporting table section of the manual.
| Organisation Unit | Data Element | Reporting month | So far this year | Reporting month name |
|---|---|---|---|---|
| Gerehun CHC | Measles doses given | 15 | 167 | Oct-09 |
| Tugbebu CHP | Measles doses given | 17 | 155 | Oct-09 |
While data needs to be collected on a given frequency to standardise data collection and management, this does not put limitations on the period types that can be used in data analysis and reports. Just like data gets aggregated up the organisational hierarchy, data is also aggregated according to a period hierarchy, so you can create quarterly and annual reports based on data that is being collected on a Monthly basis. The defined period type for a data entry form (data set) defines the lowest level of period detail possible in a report.
When aggregating data on the period dimension there are two options for how the calculation is done, namely sum or average. This option is specified on a per data element in DHIS2 through the use of the 'aggregation operator' attribute in the Add/Edit Data Elements dialog.
Most of the data collected on a routinely basis should be aggregated by summing up the months or weeks, for instance to create a quarterly report on Measles immunisation one would sum up the three monthly values for "Measles doses given".
Other types of data that are more permanently valid over time like "Number of staff in the facility" or an annual population estimate of "Population under 1 year" need to be aggregated differently. These values are static for all months as long as there are valid data. For example, the "Estimated population under 1", calculated from the census data ,is the same for all months of a given year, or the number of nurses working in a given facility is the same for every month in the 6 months period the number is reported for.
This difference becomes important when calculating an annual value for the indicator morbidity service burden for a facility. The monthly head-counts are summed up for the 12 months to get the annual headcount, while the number of staff for the facility is calculated as the average of the two 6-monthly values reported through the 6-monthly staff report. So in this example the data element "OPD headcount" would have the aggregation operator "SUM" and the data element "Number of staff" would have it set to "AVERAGE".
Another important feature of average data elements is the validity period concept. Average data values are standing values for any period type within the borders of the period they are registered for. For example, an annual population estimate following the calendar year, will have the same value for any period that falls within that year no matter what the period type. If the population under 1 for a given facility is 250 for the year of 2015 that means that the value will be 250 for Jan-15, for Q3-15, for Week 12 of 2015 and for any period within 2015. This has implications for how coverage indicators are calculated, as the full annual population will be used as denominator value even when doing monthly reports. If you want to look at an estimated annual coverage value for a given month, then you will have the option of setting the indicator to "Annualised" which means that a monthly coverage value will be multiplied by a factor of 12, a quarterly value by 4, in order to generate an effective yearly total. The annualised indicator feature can therefore be used to mimic the use of monthly population estimates.
Datasets determine what raw data that is available in the system, as they describe how data is collected in terms of periodicity as well as spatial extent. Data sets define the building blocks of the data to be captured and stored in DHIS2. For each data dimension we decide what level of detail the data should be collected at namely 1) the data element (e.g. diagnosis, vaccine, or any event taking place) and its categories (e.g. age and gender), 2) the period/frequency dimension, and 3) the organisation unit dimension. For any report or data analysis you can never retrieve more detailed data than what is defined in the data sets, so the design of the datasets and their corresponding data entry forms (the data collection tools) dictate what kind of data analysis will be possible.
It is important to understand that the data entry forms or datasets themselves are not intrinsically linked to the underlying data value and that the meaning of data is only described by the data element (and its categories). This makes it perfectly safe to modify datasets and forms without altering the data (as long as the data elements stay the same). This loose coupling between forms and data makes DHIS2 flexible when it comes to designing and changing new forms and in providing exactly the form the users want.
Another benefit of only linking data to data elements and not to forms, is the flexibility of creating indicators and validation rules based on data elements, and also in providing any kind of output report (in pivot tables, charts, maps etc.) that can combine data individually or across forms, e.g. to correlate data from different health programs. Due to this flexibility of enabling integration of data from various programs (forms) and sources (routine and semi permanent (population, staff, equipment)) a DHIS2 database is used as an integrated data repository for many or all parts of the aggregated data in a larger HIS. The figure below illustrates this flexibility.

In this example, we see that data elements from multiple forms can be combined to create a given indicator. As a more concrete example, one might collect "Population under one year of age" in an annual data set by district, and then collect a data element like "Fully immunized children" by month at the facility level. By annualizing the population, we can generate an approximation of the effective monthly population, and combining this with the aggregate total of the number of fully immunized children by month, it would be possible to generate an indicator "Fully immunized coverage", consisting of the aggregated total of children who are fully immunized, divided by the effective monthly population.
The table below combines data element the two group sets Diagnosis (all the diseases) and Morbidity/Mortality (New cases, Follow-ups, Referrals, Deaths) with the data element category PHU/Community. Deaths are captured in a separate form with other dimensions (e.g. the PHU/Community) than morbidity.
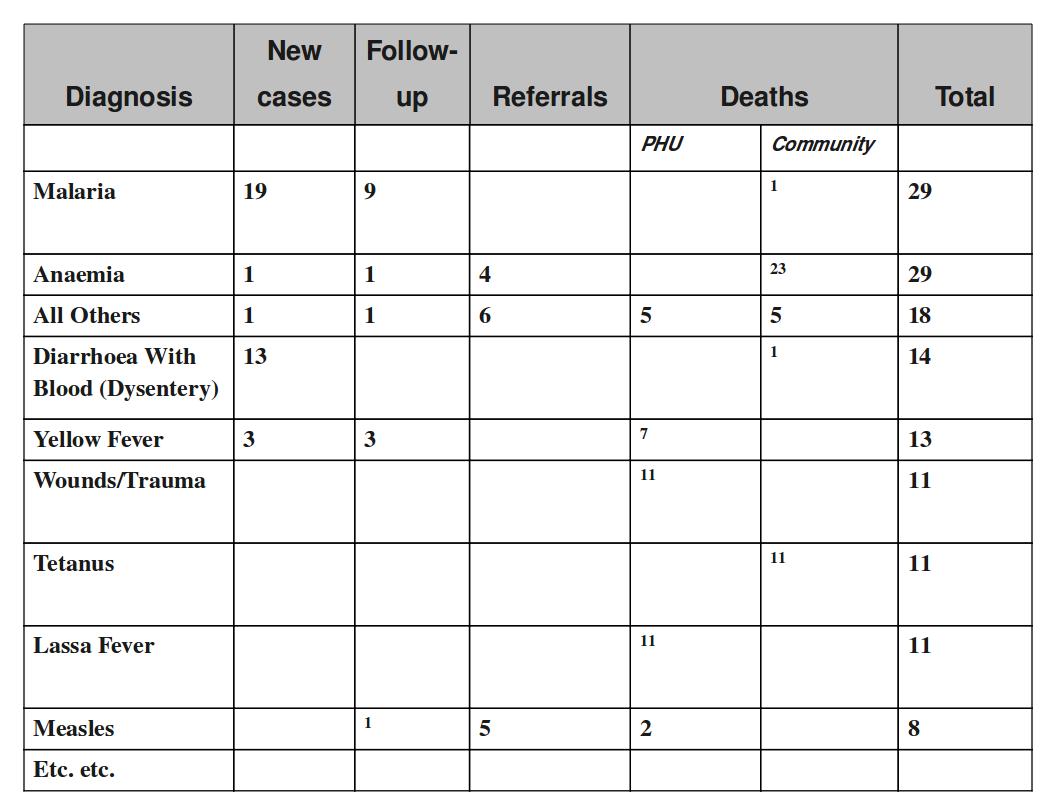
This output table combines the two data element categories HIV_Age and Gender with the data element group set ART Group. The group enables subtotals for staging and entry points summing up the data elements in that group. Subtotals for either age groups and gender would be other possible columns to easily include here.
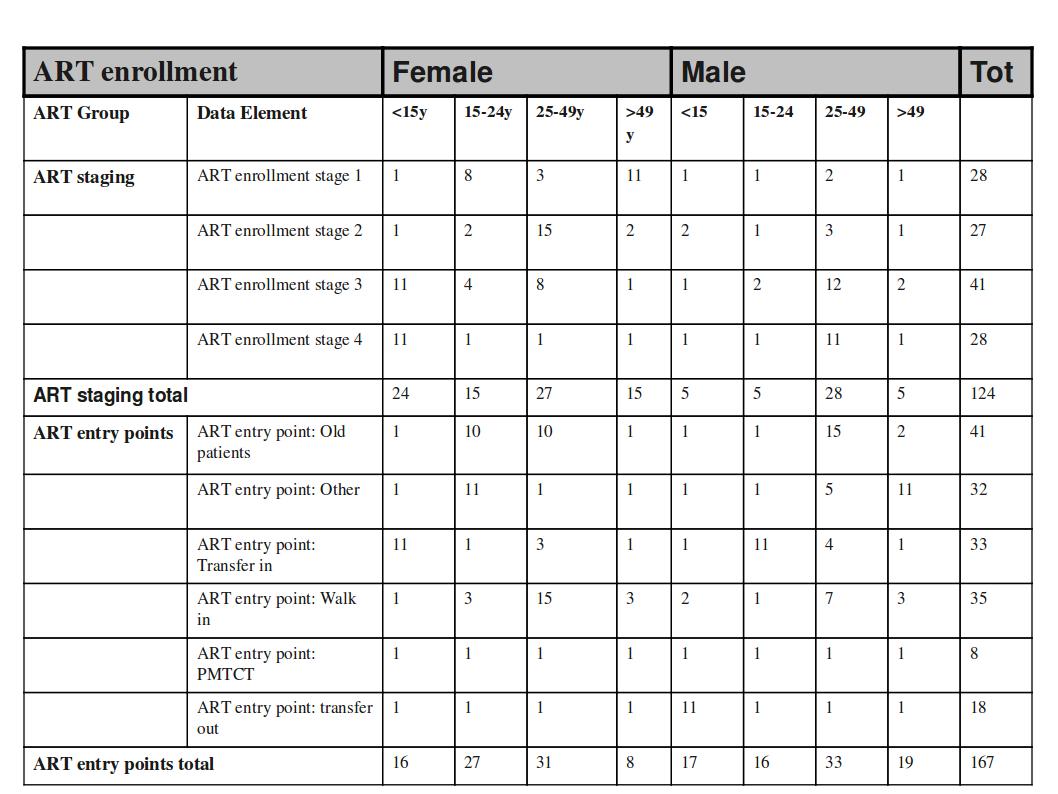
When doing data analysis in Excel pivot tables or any other OLAP based tool the dimensions become extremely powerful in providing many different views into the data. Each data element category or group set become a pivot field, and the options or groups become values within each of these fields. In fact categories and groupsets are treated exactly the same way in pivot tables, and so are orgunits, periods, and data elements. All these become dimensions to the data value that can be used to rearrange, pivot, filter, and to drill down into the data. Here we will show some examples of how the data dimensions are used in pivot tables.
Using the example of morbidity and mortality data, a pivot table can show how the dimensions can be used to view data for different aggregation levels.
The completely aggregated number is viewed when none of the pivot fields are arranged in the table area, as column or row fields, but are listed above the table itself as page field (filter).
Here we have selected to look at the Morbidity total. The various data elements on morbidity have been ordered into the main_de_groups Morbidity (we will get back to Mortality later). The fields above the table itself are all set to "All", meaning that the totals in the table will contain data from all Countries, Districts, Chiefdom, ou_type, year, months, the various categories as listed in the red fields, and all data elements in the Morbidity group.
As we have seen, this is not a very useful representation, as Morbidity is organized into new cases, follow-ups, referrals, and then again in age groups. Also, we do not see the various diagnoses. The first step is to include the diagnoses field (which is a group set), which is done by dragging the "diagnosis" field down to be a row field, as shown in the figure below, and to add the group set called "morbiditymortality" in the column field to display new cases, follow-up, and referrals.
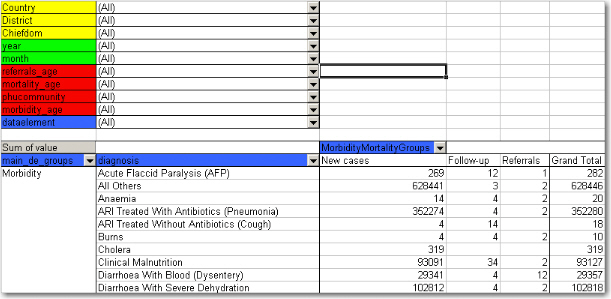
Contrast this figure above to the one below.
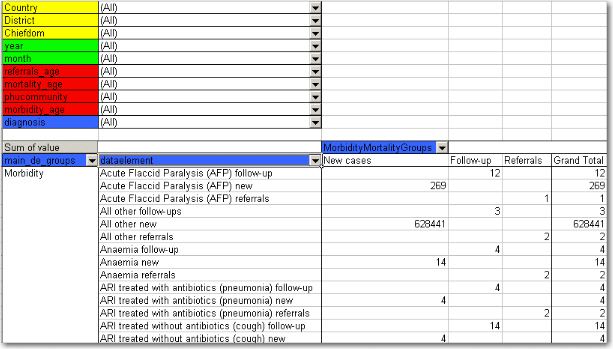
They both show the same data (some of the rows have been cut in the screenshot due to image size), albeit in a different way.
The "dataelement" field, used in the bottom figure, displays each diagnosis as three elements; one follow-up, one new, and one referrals. This is the way the data elements have been defined in DHIS2, as this makes sense for aggregation. You would not like to aggregate follow-ups and new, thus these have not been made as categories, the whole point of is to ease aggregation and disaggregation.
The "diagnosis" group set has instead been made to lump these three (follow-up, new, referrals) together, which can then be split with another group set, namely the one called "morbiditymortality". This allows us to organize the data as in the first of the two figures, where we have the single diagnosis per row, and the groups new, follow-up, referrals as rows.
The idea of using group sets is that you can combine, in any set, different data elements. Thus, if we add the mortality data (by checking it from the drop-down menu of the main_de_groups field, and moving this field out of the table) we can see also the deaths, since the mortality data elements have been included as a "death" group in the "morbiditymortality" group set. The result is shown below.

The result is a much more user-friendly pivot table. Now, another figure shows the relationship between the group sets and elements (these are fake data values).
This small detail of the pivot table show how the actual data elements link to the group sets:
The four data elements, as defined in DHIS2, are Measles death, Measles follow-up, Measles new, and Measles referrals
They all belong to the group set "diagnosis", where they have been lumped together in the group Measles
The group set "morbiditymortality" contains the groups New cases, Follow-up, Referrals, and Deaths.
Only the data element Measles deaths has data related to the group Deaths, thus this is where the data value (20) is shown, at the upper right corner. The same for Measles new; the value (224) is shown at the intersection of the data element Measles new and the group New cases (in the group set morbiditymortality)
All the intersections where the data element does not link with the groups in morbiditymortality are left blank. Thus in this case we would get a nice table if we excluded the data element from the table, and just had diagnosis and the group set morbiditymortality, as in the figure shown earlier
Now lets see how the data element categories can be used. In the data entry form for Morbidity the new cases and follow-ups use one age category, the referral data another,, and the mortality data a third age breakup, so these are available as three individual age group fields in the pivot tables called morbidity_age, referrals_age and mortality_age. It doesn't make sense to use these while looking at these data together (as in the examples above), but e.g. if we only want to look at the only the new cases we can put the MobidityMortalityGroups field back up as a page field and there select the New cases group as a filter. Then we can drag the Morbidity_age field down to the column area and we get the following view:
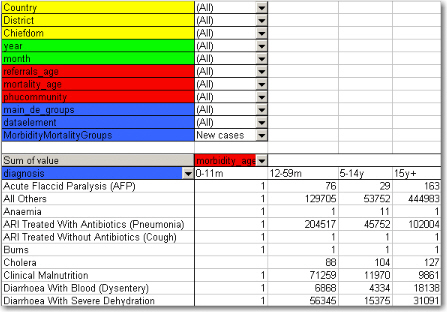
The following table illustrates the benefits of reusing data element categories across datasets and category combinations. The VCCT, ART and PMTCT data are collected in three different datasets, the first two with both gender and age breakdown, and the PMTCT only age (gender is given). All three share the same age groups and therefore it is possible to view data elements from all these three datasets in the same table and use the age dimension. In the previous example with morbidity and mortality data this was not possible since new cases, referrals and deaths all have different age groups.
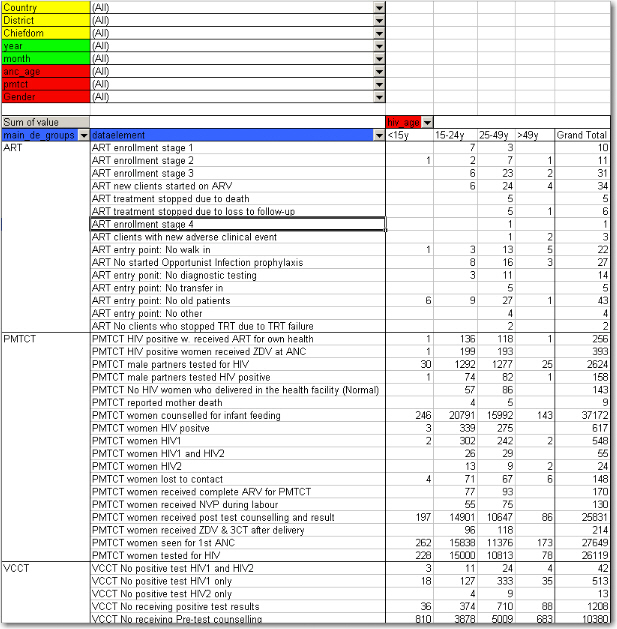
In the table below PMTCT data has been removed from the table and the gender category added to the column area so that you can analyse the data for VCCT and ART by age and gender. An optional subtotal for gender has also been added, as well as a grand total for all age and gender.

Typically the design of a DHIS2 dataset is based on some requirements from a paper form that is already in use. The logic of paper forms are not the same as the data element and data set model of DHIS2, e.g. often a field in a tabular paper form is described both by column headings and text on each row, and sometimes also with some introductory table heading that provides more context. In the database this is captured in one atomic data element with no reference to a position in a visual table format, so it is important to make sure the data element with the optional data element categories capture the full meaning of each individual field in the paper form.
Another important thing to have in mind while designing datasets is that the dataset and the corresponding data entry form (which is a dataset with layout) is a data collection tool and not a report or analysis tool. There are other far more sophisticated tools for data output and reporting in DHIS2 than the data entry forms. Paper forms are often designed with both data collection and reporting in mind and therefore you might see things such as cumulative values (in addition to the monthly values), repetition of annual data (the same population data reported every month) or even indicator values such as coverage rates in the same form as the monthly raw data. When you store the raw data in DHIS2 every month and have all the processing power you need within the computerised tool there is no need (in fact it would be stupid and most likely cause inconsistency) to register manually calculated values such as the ones mentioned above. You only want to capture the raw data in your datasets/forms and leave the calculations to the computer, and presentation of such values to the reporting tools in DHIS2.
As we have seen in the examples above, data element categories and category options are helpful in representing tabular data, when adding dimensions to a field in a paper form. We have also seen how the data element is one of the required dimensions which describe data in DHIS2. As we will see in the example below there are often more than one way to represent a paper form in DHIS2 , and it can be difficult to know which dimension to represent with a data element name and which to represent as categories, or even as groups as we have seen above. Here are some general lessons learned from working with data element and category combinations:
Design your dimensions with data use in mind, not data collection. This means that disaggregation of data values at collection time should be easily aggregated up along the various dimensions, as in adding up to a meaningful total.
Reuse dimensions as much as possible as this increases the ability to compare disaggregated data (e.g. age groups, fixed/outreach, gender).
Disaggregation dimensions should add up to a total. In certain cases, data elements may be collected a subsets of each other. In this case, use of categories to disaggregate the data element should not be used. As an example, we might collect "Number of confirmed malaria cases" and disaggregate this by "Under 5" and "Over 5". A third data element "Number of confirmed malaria cases under 1" might also exist on the form. It would seem reasonable then to create three age groups : Under 1, Under 5 and Over 5, to describe the disaggregation. However, the Under 1 is actually a subset of the Under 5 group, and when totalled, would result in duplication. Thus, categories should be generally be composed of mutually exclusive category options, such that the sum of individual category options results in a coherent total.
Different levels of dimensions; 1) disaggregation and 2) grouping. Disaggregation dimensions dictate how you collect and how detailed you store your data, so plan these carefully. The group dimension is more flexible and can be changed and added to even after data collection (think of it as tagging).
It is best to think of how the data would be used in an integrated data repository and not how it will actually be collected on forms or by programs when designing the meta-data model. Ideally, the same type of disaggregation should be used across forms and datasets for data elements which will be analysed together, or used to build indicators. Reuse definitions so that the database can integrate even though the forms themselves might be duplicated (which in practice, is often the case).
In order to better explain the approach and the possibilities we present an example paper form and will walk through it step by step and design data elements, categories, category options and category combinations.
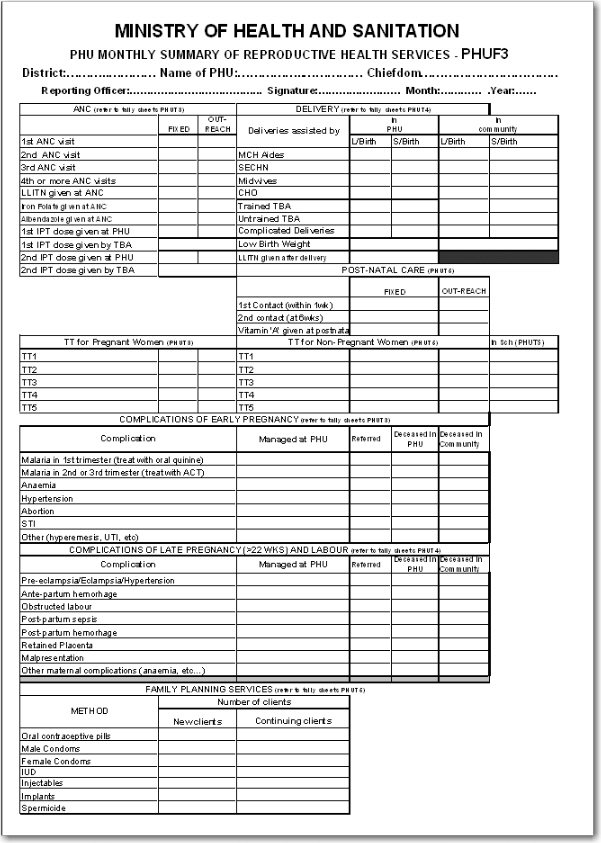
This form has many tables and each of them potentially represent a data element category combination (from now on referred to as a catcombo). As such there is no restriction on a dataset to only have one set of dimensions or catcombo, it can have many and as we see above this is necessary as the dimensions are very different from table to table. In the following paragraphs, we will analyse how to break down this form into its component pieces and suggest an implementation pathway in DHIS2.
ANC table. This table in the top left corner is one the simpler ones in this form. It has two dimensions, the first column with the ANC activity or service (1st visit, IPT 2nd dose etc) and the second and third column which represent the place where the service was given with the two options "Fixed" and "Outreach". Since the ANC service is the key phenomena to analyse here, and often there is a need for looking at the total of "ANC 1st visits" no matter where they actually took placed, it makes a lot of sense to use this dimension as the data element dimension.
Thus, all items on the first column from "1st ANC" visit to "2nd IPT dose given by TBA" are represented as individual data elements. The where dimension is represented as a data element category (from now on referred to as category) with the name "fixed/outreach" with the two data element category options (from now on catoptions) "fixed" and "outreach". There is no other dimension here so we add a new catcombo with the name "Fixed/Outreach" with one category "Fixed/Outreach". Strictly speaking there is another dimension in this table, and that is the at PHU or by TBA dimension which is repeated for the two doses of IPT, but since none of the other ANC services listed have this dimension it does not seem like a good idea to separate out two data elements from this table and give them another catcombo with both fixed/outreach and at PHU/by TBA. reusing the same catcombo for all the ANC services makes more sense since it will be easier to look at these together in reports etc. and also the fact that there is not much to lose by repeating the at PHU or by TBA information as part of the data element name when it is only for four data elements in a table of eleven data elements.
DELIVERY table. This table is more tricky as it has a lot of information and you can see that not all the rows have the same columns (some columns are merged and a one field is greyed out/disabled.). If we start by looking at the first column "Deliveries assisted by" that seems to be one dimension, but only down to the "Untrained TBA" row, as the remaining three rows are not related to who assisted the delivery at all. Another dimension is the place of delivery, either In PHU or in Community as stated on the top column headings. These deliveries are further split into the outcome of the delivery, whether it is a live or still birth, which seems to be another dimension. So if we disregard the three bottom rows for a moment there seems to be 3 dimensions here, 1) assisted by, 2) place of delivery, and 3) delivery outcome. The key decision to make is what to use as the data element, the main dimension, the total that you will most often use and want easily available in reports and data analysis.
In this case, the outcome dimension as "Total live births" is a very commonly used value in many indicators (maternal mortality ratio, births attended by skilled health personnel etc.). In this case the "Assisted By" dimension could also have been used without any problem, but the added value of easily getting the total live births information was the decisive point for us. This means that from this table (or sub-table of row 1 to 6) there are only two data elements; "Live births" and "Still births".
Next, there are two more dimensions, the "PHU/Community" with its two options and a "Births attended by" with options ("MCH Aides", "SECHN", "Midwives", "CHO", "Trained TBA", "Untrained TBA"). These two categories make up the catcombo "Births" which is assigned to the two data elements "Live births" and "Still births". Considering the final three rows of the delivery table we can see that "Complicated Deliveries" does not have the assisted by dimension, but has the place and the outcome. "Low birth weight" also does not have the assisted by dimension and not the outcome either. The LLITN given after delivery does not have any additional dimension at all. Since not any of the three rows can share catcombo with any other row we decided to represent these fields as so called flat data elements, meaning data elements with no categories at all, and simply adding the additional information from the column headings to the data element name, and therefore ended up with the following data elements with the default (same as none) catcombo; "Complicated deliveries in PHU live birth", "Complicated deliveries in PHU still births", "Complicated deliveries in community live birth", "Complicated deliveries in community still births", "Low birth weight in PHU", "Low birth weight in community", and "LLITN given after delivery".
POST-NATAL CARE table This table is simple and we used the same approach as for the ANC table. 3 data elements listed in the first column and then link these to the catcombo called "fixed/outreach". Reusing the same category fixed/outreach for these data elements enables analysis on fixed/outreach together with ANC data and other data using the same category.
TT table This table is somewhat more complex than the previous examples.We decided to use "TT1", "TT2" ... "TT5" as data elements which makes it easy to get the total of each one of these. There is fixed/outreach dimension here, but there is also the "In school place" that is only applied to the Non-Pregnant, or more correctly to any of the two as the school immunisation is done whether the girls are pregnant or not. We consulted the program people behind the form and found out that it would be OK to register all school TT immunisations as non-pregnant, which simplifies the model a bit since we can reuse the "TT1" to "TT5" data elements. So we ended up with a new category called "TT place" with the three options (Fixed, Outreach, In School), and another category called "Pregnant/Non-pregnant" with two options. The new catcombo "TT" is then a combination of these two and applied to the 5 TT data elements. Since we agreed to put all In Schools immunisations under Non-pregnant in means that the combination of options (Pregnant+In School) will never be used in any data entry form, and hence become a possible optioncombo, which is OK. As long as the form is custom designed then you can choose which combinations of options to use or not, and therefore it is not a problem to have such passive or unused catoptions. Having school as one option in the TT place category simplifies the model and therefore we thought it was worth it. The alternative would be to create 5 more data elements for "TT1 in school" ... "TT5 in school", but then it would be a bit confusing to add these together with the "TT1" ..."TT5" plus TT catcombo. Having school as a place in the TT place category makes it a lot easier to get the total of TT1.. TT5 vaccines given, which are the most important numbers and most often used values for data analysis.
Complications of early and late pregnancy and labour tables We treat these two tables as one, and will explain why. These two tables are a bit confusing and not the best design. The most important data coming out of these tables are the pregnancy complications and the maternal deaths. These data elements contain further detail on the cause of the complication or death (the first column in both tables), as well as a place of death (in PHU or community), and an outcome of the complication (when its not a death) that can be either "Managed at PHU" or " Referred". We decided to create two data elements for these two tables; "Pregnancy complications", and "Maternal Deaths", and two category combinations, one for each of the data elements. For the Pregnancy Complications data element there are two additional dimensions, the cause of the complication (the combined list of the first column in the two tables) and the outcome (managed at PHU or Referred), so these are the categories and options that make up that category combination. For the "Maternal deaths" data element the same category with the different causes are used and then another category for the place of death (in PHU or In community). This way the two data elements can share one category and it will be easy to derive the total number of pregnancy complications and maternal deaths. While the list of complications on the paper form is divided into two (early and late/labour) you can see that e.g. the malaria in 2nd and 3rd trimester are listed under early, but in fact are for a later phase of the pregnancy. There is no clear divide between early and late complications in the form, and therefore we gave up trying to make this distinction in the database.
Family Planning Services table This table has 2 dimensions, the family planning method (contraceptive) and whether the client is new or continuing. We ended up with one data element only "Family planning clients" and then added two categories "FP method" with all the contraceptives as options, and another category "FP client type" with new or continuing as options. This way it will be easy to get the total number of family planning clients which is the major value to look at in data analysis, and from there you can easily get the details on method or how many new clients there are.
Identify the different tables (or sub datasets) in the paper form that share the same dimensions
For each table identify the dimensions that describe the data fields
Identify the key dimension, the one that makes most sense to look at in isolation (when the others are collapsed, summed up). This is your data element dimension, the starting point and core of your multidimensional model (sub dataset). The data element dimension can be a merger of two or more dimensions if that makes more sense for data analysis. The key is to identify which total that makes most sense to look at alone when the other dimensions are collapsed.
For all other/additional dimensions identify their options, and come up with explanatory names for dimensions and their options.
Each of these additional dimensions will be a data element category and their options will be category options.
Combine all categories for each sub dataset into one category combination and assign this to all the data elements in your table (or sub dataset if you like).
When you are done with all the tables (sub datasets), create a new dataset and add all the data elements you have identified (in the whole paper form) to that dataset.
Your dataset will then consist of a set of data elements that are linked to one or more category combinations.
DHIS2 has the ability to add dimensions to data in addition to what was described in the previous chapter. We will call these dimensions “attribute categories” (ACs). The categories described in the previous chapter we will call “disaggregation categories” (DCs) to differentiate them from ACs.
ACs and DCs are quite similar—they work in much the same way, are accessed through the same part of the maintenance interface, and exist in the same part of the database. The main difference between them is what they are connected to. A DC is attached to a data element; however, an AC is attached to a data set. This means values for all DC options can be entered on the same data entry screen, whereas you must choose the AC option before you begin to enter data.
In setting up a system, you could just use DCs and ignore ACs altogether. However, ACs are a way to simplify data entry screens or reduce the size of the cross-product of category option combos.
Tip
When you’re deciding which categories should be DCs and which should be ACs, here’s a good rubric:
Use DCs when you want to use different combinations of categories on different data elements within a data set
Use DCs when you want to enter all the category option combinations on one data entry screen
Use ACs when you want to use the same combination of categories for all the data in a data set
Use ACs when you want to enter only one category option combination on one data entry screen
While we referred to DCs as part of the what dimension for simplicity in the former chapter, it’s actually more complex. Either DCs or ACs can answer any question about a data element, including what (of course), who, why, how, or even a where or a when beyond the organisation unit and period dimensions.
The process of creating an attribute category as well as its options and combinations, is discussed in the section Manage categories. As noted there, disaggregation categories are configured by editing a data element and attribute categories are configured by editing a data set.
When entering aggregate data, one must first choose the attribute categories, and then one can enter the data across disaggregation categories on a single page.
For instance, in the graphic below, the attribute categories are Implementing Partner (AIDSRelief Consortium) and Project (Improve access to medicines). The disaggregation categories are gender (male/female/etc.), age (<15, 15-24, 25-49, >49).
In order to do analysis with disaggregation and attribute categories, check the “Data dimension” box in the category editing screen of the Maintenance app, as discussed in Create or edit a category.
To include attribute categories in approvals, create a category option group that contains the same category options as the attribute category. Then create a category option group set and add that the category option group set as a data approval level.
This is covered in more detail in the section Approving by category option group set and Approving by multiple category option group sets.
For some, the way attribute categories work with disaggregation categories is clearer when we look at how the data values are stored in DHIS2’s database. If diving into the database internals doesn’t help you understand how the different types of categories work together, please feel free to ignore it.
Each data value is associated with a data element, a period, and an organisation unit, which are represented in this way:
dataelementid | periodid | sourceid |
|
|
|
(Note these are numeric database ids, not DHIS2 uids.)
And of course, each data value has a value, adding the value column to the database:
dataelementid | periodid | sourceid | value |
|
|
Each data value also references the disaggregation category options and the attribute category options assigned to it. For instance, in the example above, the data value entered in the box “Male <15” will have the option “Male” for the disaggregation category gender, and the option “<15” for the disaggregation category age. The combination of these two options is represented in the database by a single category option combination meaning “Male, <15”. The data value references this disaggregation category option combination in the categoryoptioncomboid:
dataelementid | periodid | sourceid | value | categoryoptioncomboid |
|
Likewise, the same data value will have the option “AIDSRelief Consortium” for the category Implementing Partner, and the option “Improve access to medicines” for the category Project. There will also be a database category option combination meaning “Implementing Partner, Improve access to medicines”. The data value references this attribute category option combination in the attributeoptioncomboid:
dataelementid | periodid | sourceid | value | categoryoptioncomboid | attributeoptioncomboid |
Note
The above column list does not include all of the columns in the datavalue table.
If you have not defined a disaggregation category combination for a data element, the categoryoptioncomboid will reference a “default” category option combination, which is defined internally in DHIS2 as the category default with the option default (the only option in the default category). Likewise, if you have not defined an attribute category combination for the dataset in which you enter the data, the attributeoptioncomboid references the same “default” category option combination.
We hope this investigation of how data values are stored in DHIS2’s database makes it clearer how data values can be associated with various groups of category options, both from disaggregation categories and attribute categories.
A relationship represents a link between two entities in the Tracker-model. A relationship is considered data in DHIS2 and is based on a Relationship Type, similar to how a Tracked Entity is based on a Tracked Entity Type.
Relationships always connect two entities, and these entities can include Tracked Entities, Enrollments and Events, and any combination of these. Note that all of these combinations are not currently available through the User Interface.
Relationships between entities can be classified as either unidirectional or bidirectional, with each type requiring different levels of access for creation.
When retrieving relationships from a tracker exporter endpoint, only those originating from the requested entity are shown. This means that the entity is either part of a bidirectional relationship or the "from" entity in a unidirectional relationship.
A Relationship Type is the definition of the properties a relationship have. Relationships always consists of two sides, referred to as "from" and "to", and what entities can be contained for each side is determined by the Relationship Type. The properties that determine what each can contain are called constraints, fromConstraint and toConstraint respectively. These constraints are significant when working with the data later, to understand what a relationship can and cannot contain.
Each of the constraints defined in the Relationship Type consists of several properties. The primary property is the relationship entity, which decides what kind of entities the relationship can contain. The entities can be one of the following for each constraint:
Depending on the kind of relationship entity you select, you can choose additional limitations for each constraint. The following table explains the different combinations you can configure:
| Tracked Entity Instance | Enrollment | Event | |
|---|---|---|---|
| Tracked Entity Type | Required | Optional | - |
| Program | - | Required | - |
| Program Stage | - | Required | Optional |
These additional limitations, will require the entity to match the limitation set before it can be created. For example, if your relationship is between a mother and a child, both constraints would have their required Tracked Entity Type set to Person and could optionally set the Enrollment to Maternal Health Program and Child Program respectively. This way, only Tracked Entities who are of type Person and who is enrolled in the required program is allowed to be included in these relationships.
In addition to the constraints defined by a Relationship Type, each relationship can be configured as bidirectional, true or false.
One important thing to note about bidirectional relationships, are that the "from" and "to" sides are still significant in the database, meaning each entity must match the constraint for that side. However, from a user perspective, which side each entity is stored as is insignificant.
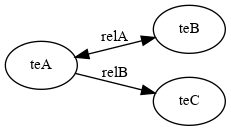
Analytics refers to the process which processes and prepares data which has been entered into DHIS2 into a format which is more suitable for retrieving indicators and aggregated data. When data is entered into DHIS2, it is stored in a format which is optimized for writing the data. However, when data needs to be processed into indicators or aggregated (e.g from months to quarters), it is more efficient to transform and store this data in a different format which is optimized for read-only operations. The analytics system of DHIS2 is used extensively by the analytics apps (GIS, Pivot Table, Event reports, etc.).
It is important to keep in mind that because the data which has been entered into DHIS2 must be processed into the analytics format, the data which appears in the analytics apps only represents the data which was present in the system the last time analytics was run. If data has been entered after that, analytics will need to be run again for this data to appear in the analytics apps.
Approvals can be used to control the visibility and editibility of data. When data is submitted from the lowest reporting level, it can be approved by the next higher level. This approval has two effects:
Data is no longer able to be edited in the data entry screens at the lower level.
Depending on the system settings which have been enabled, the data will become visible at the approval level.
As an example, data is entered at the facility level, and the submitted for approval. Once the data has been approved at the district level, the data will become locked in the data entry screens for the facility level. It will also become visible in the analytics apps to district users.
Category combination options are dynamically composed of all of the different combinations of category options which compose a category combination. As an example, two categories "Gender" and "Age", might have options such as "Male" or "Female" and "<5 years" or ">5 years". The category combination options would then consist of:
DXF
The divisor of an indicator. Can be composed of multiple data elements with the use of an indicator formula.
This is obviously a very generalized example. The numerator and indicator themselves can be composed of various data elements, factors, and the four basic operands (addition, multiplication, division and subtraction).
The DHIS2 team maintains a demonstration server at https://play.dhis2.org/demo. This is by far the easiest way to try out DHIS2. Simply open the link in your web browser and login with username = admin and password = district.
Note
All changes on this server are deleted each night, so do not save any important work on this server. It is strictly for demonstration purposes on only!
Using Docker containers to run a d2 cluster is an easy way to get started with DHIS2 on your local computer. This approach is appropriate for a stand-alone installation and demos. Simply follow the guide here.
You must be sure that you have installed Yarn and Nodejs. A current version of Docker must be installed on your machine as well. Please refer to the guide for detailed information.
The latest stable server version can be downloaded from this website. For detailed information on how to install it please refer to the installation chapter in the implementation manual.
Regardless of whether you have installed the server version or ran a DHIS2 instance locally, you will use a web-browser to log on to the application. DHIS2 should be compatible with most modern web-browsers, although you will need to ensure that Java Script is enabled.
To log on to the application just enter http://localhost:8080/dhis if you are using the DHIS2 live package, or replace localhost with the name or IP address of the server where the server version is installed.
Once you have started DHIS2, either on-line or off-line, the displayed screen will prompt you to enter your registered user-name and password. After entering the required information click on log-in button to log into the application. The default user name and password are 'admin' and 'district'. They should be changed immediately upon logging on the first time.
You can select the language which you wish to display DHIS2 in from the "Change language" dialog box at the bottom of the screen. Not all languages may be available.
Should you have forgotten your password, you can click on the "Forgot password?" link. You must have informed DHIS2 of your email address and the server must be properly configured to send emails.
If you want to create your own account (and the server administrator allows this), simply click "Create an account" and follow the directions provided.
Once you have logged into DHIS2, refer to the specific sections in this manual for the different functionality which is available.
Just click on the Profile and the click "Log out" the top-right corner of the DHIS2 menu.
DHIS2 provides a powerful set of tools for data collection, validation, reporting and analysis, but the contents of the database, e.g., what to collect, who should collect it and on what format will depend on the context of use. However, in order to do anything with DHIS2, you must first create meta-data. Meta-data, or data about the data, describes what should be collected (data elements and categories), where it should be collected (organisation units) and how frequently it should be collected (periods). This meta-data needs to be created in the DHIS2 database before it can be used. This can be done through the user interface and requires no programming or in-depth technical skills of the software, but does require a good understanding of the processes which you are trying to collect data form.
This section will provide a very quick and brief introduction to DHIS2 database design and mainly explain the various steps needed to prepare a new DHIS2 system for use. How to do each step is explained in other chapters, and best practices on design choices will be explained in the implementers manual. Here are the steps to follow:
1. Set up an organisational hierarchy
2. Define data elements
3. Define data sets and data entry forms
4. Define validation rules
5. Define indicators
6. Define report tables and design reports
7. Set up the GIS module
8. Design charts and customise the dashboard
The organisational hierarchy defines the organisation using the DHIS2, the health facilities, administrative areas and other geographical areas used in data collection and data analysis. This where dimension to the data is defined as a hierarchy with one root unit (e.g., Ministry of Health) and any number of levels and nodes below. Each node in this hierarchy is called an organisational unit in DHIS2.
The design of this hierarchy will determine the geographical units of analysis available to the users as data is collected and aggregated in this structure. There can only be one organisational hierarchy at the same time so its structure needs careful consideration. Additional hierarchies (e.g. parallel administrative groupings such as "Facility ownership") can be modelled using organisational groups and group sets, however the organisational hierarchy is the main vehicle for data aggregation on the geographical dimension. Typically national organisational hierarchies in public health have 4-6 levels, but any number of levels is supported. The hierarchy is built up of parent-child relations, e.g. a Country or MoH unit (the root) might have e.g. 8 parent units (provinces), and each province again ( at level 2) might have 10-15 districts as their children. Normally the health facilities will be located at the lowest level, but they can also be located at higher levels, e.g. national or provincial hospitals, so skewed organisational trees are supported (e.g. a leaf node can be positioned at level 2 while most other leaf nodes are at level 5).
Typically there is a geographical hierarchy defined by the health system. e.g. where the administrative offices are located (e.g. MoH, province, district), but often there are other administrative boundaries in the country that might or might not be added, depending on how its boundaries will improve data analysis. When designing the hierarchy the number of children for any organisational unit may indicate the usefulness of the structure, e.g. having one or more 1-1 relationships between two levels is not very useful as the values will be the same for the child and the parent level. On the other extreme a very high number of children in the middle of the hierarchy (e.g. 50 districts in a province) might call for an extra level to be added in between to increase the usefulness of data analysis. The lowest level, the health facilities will often have a large number of children (10-60), but for other levels higher up in the hierarchy approx. 5-20 children is recommended. Too few or too many children might indicate that a level should be removed or added.
Note that it is quite easy to make changes to the upper levels of the hierarchy at a later stage, the only problem is changing organisational units that collect data (the leaf nodes), e.g. splitting or merging health facilities. Aggregation up the hierarchy is done based on the current hierarchy at any time and will always reflect the most recent changes to the organisational structure. Refer to the chapter on Organisation Units to learn how to create organisational units and to build up the hierarchy.
The Data Element is perhaps the most important building block of a DHIS2 database. It represents the what dimension, it explains what is being collected or analysed. In some contexts this is referred to an indicator, but in DHIS2 we call this unit of collection and analysis a data element. The data element often represents a count of something, and its name describes what is being counted, e.g. "BCG doses given" or “Malaria cases”. When data is collected, validated, analysed, reported or presented, the data elements or expressions built upon data elements describes what the data is. As such the data elements become important for all aspects of the system and they decide not only how data is collected, but more importantly how the data values are represented in the database, which again decides how data can be analysed and presented.
It is possible to add more details to this what dimension through the disaggregation dimension called data element categories. Some common categories are age and gender, but any category can be added by the user and linked to specific data elements. The combination of a data element's name and its assigned category defines the smallest unit of collection and analysis available in the system, and hence describes the raw data in the database. Aggregations can be done when zooming out of this dimension, but no further drill-down is possible, so designing data elements and categories define the detail of the analysis available to the system (on the what dimension). Changes to data elements and categories at a later stage in the process might be complicated as these will change the meaning of the data values already captured in the database (if any). So this step is one of the more decisive and careful steps in the database design process.
One best practice when designing data elements is to think of data elements as a unit of data analysis and not just as a field in the data collection form. Each data element lives on its own in the database, completely detached from the collection form, and reports and other outputs are based on data elements and expressions/formulas composed of data elements and not the data collection forms. So the data analysis needs should drive the process, and not the look an feel of the data collection forms. A simple rule of thumb is that the name of the data element must be able to stand on its own and describe the data value also outside the context of its collection form. E.g. a data element name like "Total referrals" makes sense when looking at it in either the "RCH" form or the "OPD" form, but on its own it does not uniquely describe the phenomena (who are being referred?), and should in stead be called "Total referrals from Maternity" or "Total referrals from OPD". Two different data elements with different meanings, although the field on the paper form might only say "Total referrals" since the user of the form will always know where these referrals come from. In a database or a repository of data elements this context is no longer valid and therefore the names of the data elements become so important in describing the data.
Common properties of data elements can be modelled through what is called data element groups. The groups are completely flexible in the sense that they are defined by the user, both their names and their memberships. Groups are useful both for browsing and presenting related data, but can also be used to aggregate data elements together. Groups are loosely coupled to data elements and not tied directly to the data values which means they can be modified and added at any point in time without interfering with the raw data.
All data entry in DHIS2 is organised through the use of Datasets. A Dataset is a collection of data elements grouped together for data collection, and in the case of distributed installs they also define chunks of data for export and import between instances of DHIS2 (e.g. from a district office local installation to a national server). Datasets are not linked directly to the data values, only through their data elements and frequencies, and as such a dataset can be modified, deleted or added at any point in time without affecting the raw data already captured in the system, but such changes will of course affect how new data will be collected.
A dataset has a period type which controls the data collection frequency, which can be daily, weekly, monthly, quarterly, six-monthly, or yearly. Both which data elements to include in the dataset and the period type is defined by the user, together with a name, short name, and code.
In order to use a dataset to collect data for a specific orgunit you must assign the orgunit to the dataset, and this mechanism controls which orgunits that can use which datasets, and at the same time defines the target values for data completeness (e.g. how many health facilities in a district expected to submit RCH data every month).
A data element can belong to multiple datasets, but this requires careful thinking as it may lead to overlapping and inconstant data being collected if e.g. the datasets are given different frequencies and are used by the same orgunits.
Once you have assigned a dataset to an orgunit that dataset will be made available in Data Entry (under Services) for the orgunits you have assigned it to and for the valid periods according to the dataset's period type. A default data entry form will then be shown, which is simply a list of the data elements belonging to the dataset together with a column for inputting the values. If your dataset contains data elements with categories such as age groups or gender, then additional columns will be automatically generated in the default form based on the categories. In addition to the default list-based data entry form there are two more alternatives, the section-based form and the custom form.
Section forms allow for a bit more flexibility when it comes to using tabular forms and are quick and simple to design. Often your data entry form will need multiple tables with subheadings, and sometimes you need to disable (grey out) a few fields in the table (e.g. some categories do not apply to all data elements), both of these functions are supported in section forms. After defining a dataset you can define it's sections with subsets of data elements, a heading and possible grey fields i the section's table. The order of sections in a dataset can also be defined. In Data Entry you can now start using the Section form (should appear automatically when sections are available for the selected dataset). You can switch between default and section forms in the top right corner of the data entry screen. Most tabular data entry forms should be possible to do with sections forms, and the more you can utilise the section forms (or default forms) the easier it is for you. If these two types of forms are not meeting your requirements then the third option is the completely flexible, although more time-consuming, custom data entry forms.
When the form you want to design is too complicated for the default or section forms then your last option is to use a custom form. This takes more time, but gives you full flexibility in term of the design. In DHIS2 there is a built in HTML editor (FcK Editor) for the form designer and you can either design the form in the UI or paste in your HTML directly using the Source window in the editor. In the custom form you can insert static text or data fields (linked to data elements + category) in any position on the form and you have complete freedom to design the layout of the form. Once a custom form has been added to a dataset it will be available in data entry and used automatically. You can switch back to default and section (if exists) forms in the top right corner of the data entry screen.
Once you have set up the data entry part of the system and started to collect data then there is time to define data quality checks that help to improve the quality of the data being collected. You can add as many validation rules as you like and these are composed of left and right side expressions that again are composed of data elements, with an operator between the two sides. Typical rules are comparing subtotals to totals of something. E.g. if you have two data elements "HIV tests taken" and "HIV test result positive" then you know that in the same form (for the same period and organisational unit) the total number of tests must always be equal or higher than the number of positive tests. These rules should be absolute rules meaning that they are mathematically correct and not just assumptions or "most of the time correct". The rules can be run in data entry, after filling each form, or as a more batch like process on multiple forms at the same time, e.g. for all facilities for the previous reporting month. The results of the tests will list all violations and the detailed values for each side of the expression where the violation occurred to make it easy to go back to data entry and correct the values.
Indicators represent perhaps the most powerful data analysis feature of the DHIS2. While data elements represent the raw data (counts) being collected the indicators represent formulas providing coverage rates, incidence rates, ratios and other formula-based units of analysis. An indicator is made up of a factor (e.g. 1, 100, 100, 100 000), a numerator and a denominator, the two latter are both expressions based on one or more data elements. E.g. the indicator "BCG coverage \<1 year" is defined a formula with a factor 100, a numerator ("BCG doses given to children under 1 year") and a denominator ("Target population under 1 year"). The indicator "DPT1 to DPT3 drop out rate" is a formula of 100 % x ("DPT1 doses given"- "DPT3 doses given") / ("DPT1 doses given").
Most report modules in DHIS2 support both data elements and indicators and you can also combine these in custom reports, but the important difference and strength of indicators versus raw data (data element's data values) is the ability to compare data across different geographical areas (e.g. highly populated vs rural areas) as the target population can be used in the denominator.
Indicators can be added, modified and deleted at any point in time without interfering with the data values in the database.
Standard reports in DHIS2 are a very flexible way of presenting the data that has been collected. Data can be aggregated by any organisational unit or orgunit level, by data element, by indicators, as well as over time (e.g. monthly, quarterly, yearly). The report tables are custom data sources for the standard reports and can be flexibly defined in the user interface and later accessed in external report designers such as iReport or through custom HTML reports. These report designs can then be set up as easily accessible one-click reports with parameters so that the users can run the same reports e.g. every month when new data is entered, and also be relevant to users at all levels as the organisational unit can be selected at the time of running the report.
In the integrated GIS module you can easily display your data on maps, both on polygons (areas) and as points (health facilities), and either as data elements or indicators. By providing the coordinates of your organisational units to the system you can quickly get up to speed with this module. See the GIS section for details on how to get started.
On of the easiest way to display your indicator data is through charts. An easy to use chart dialogue will guide you through the creation of various types of charts with data on indicators, organisational units and periods of your choice. These charts can easily be added to one of the four chart sections on your dashboard and there be made easily available right after log in. Make sure to set the dashboard module as the start module in user settings.
Scorecards definition: In public health settings such as Ministries of Health, scorecards offer a useful and standardized method for combining related indicators into one table. A scorecard gives an overall view of the performance of a health program such as a vaccination program, highlighting successes, weaknesses, and areas for improvement Here's what a typical scorecard looks like:
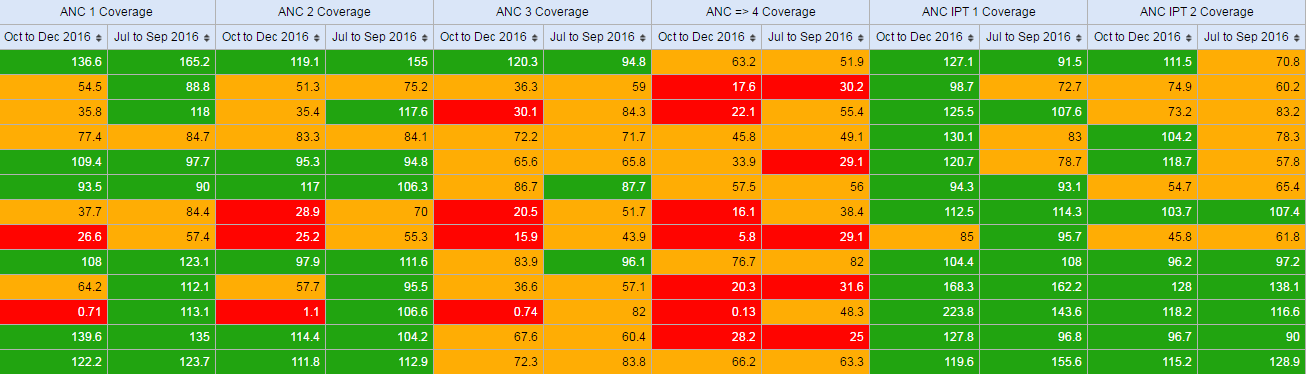
This tutorial explains how to create a scorecard in the DHIS2 Pivot Table app. There are several advantages to using the Pivot Table to create a scorecard, such as:
You can save the scorecard on the dashboard and use it offline.
You can share the scorecard with other DHIS2 users.
Let's get started!
First, we’ll create a 3-color “traffic light” legend for the scorecard. With three basic colors, the scorecard is easy to scan and easy to understand.
Open the Maintenance app. Click the menu in the top right corner and select Maintenance from the list of apps. You can also type the first letters of the word maintenance in the search field to find the app.
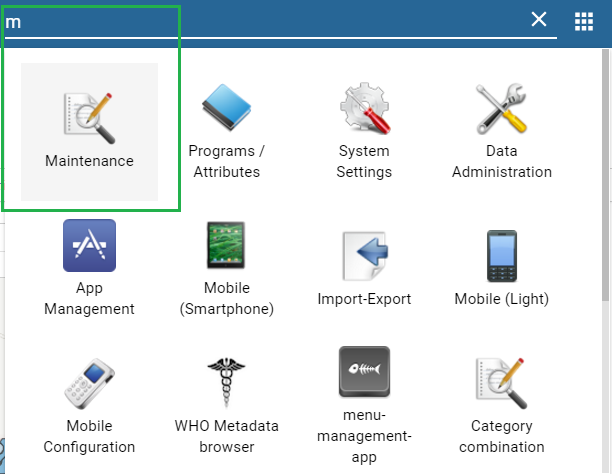
In the Maintenance app, scroll to the bottom of the page right down to the Other section.
Go to Legend and click the +.

In the Legend Management page, scroll to the bottom of the page and create a new legend by clicking the blue + button.

Enter a name for the legend such as “Traffic light”, a start value and an end value in the fields. The values you enter here depend on the performance ratings you wish to set for the scorecard.
Change Number of legend items to 3 to display three colors in the scorecard. To change the legend item colors, click the blue + button and then edit the colors.

Open the Pivot Table app from the top right menu of the dashboard. You can also enter the first letters of Pivot Table in the search field.
Go to Data in the pane on the left side and select Indicators in the list.
Select an Indicator group such as “ANC” in the second list.
Using the arrows, select the type of indicators you want to see in your scorecard.

Click Update. This button is in the menu at the top of the workspace
Go to Periods and select a period for which you want to display data. In this “traffic light” example, we’ll use the relative period section. In Quarters, select This quarter**and **Last quarter. Clear any other checkboxes and click Update.
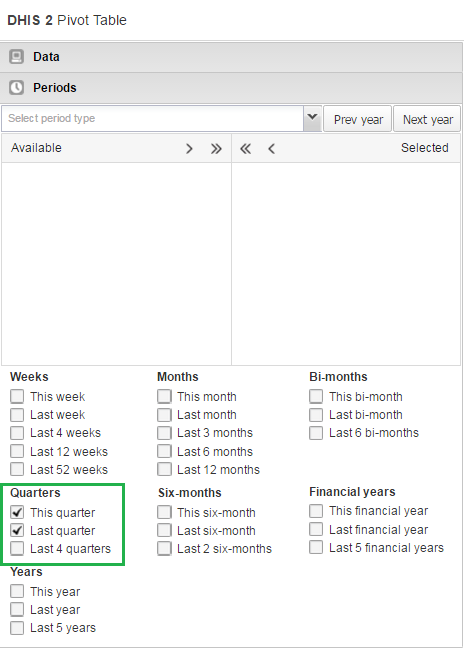
Go to Organisation Units in the same left side pane, and click the arrow next to the gear button.
Select Select levels.
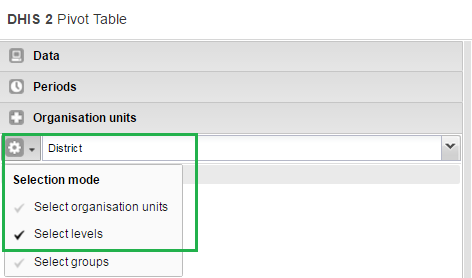
Select District from the list (next to the gear button). Click Update.
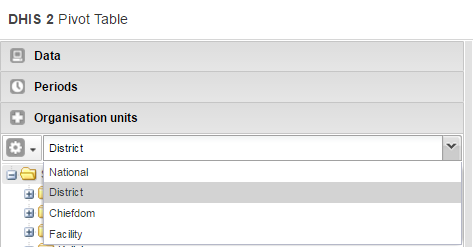
As you can see, the scorecard is starting to take shape in the workspace. Now it’s time to fine-tune the look and feel.
In the workspace, click Layout.
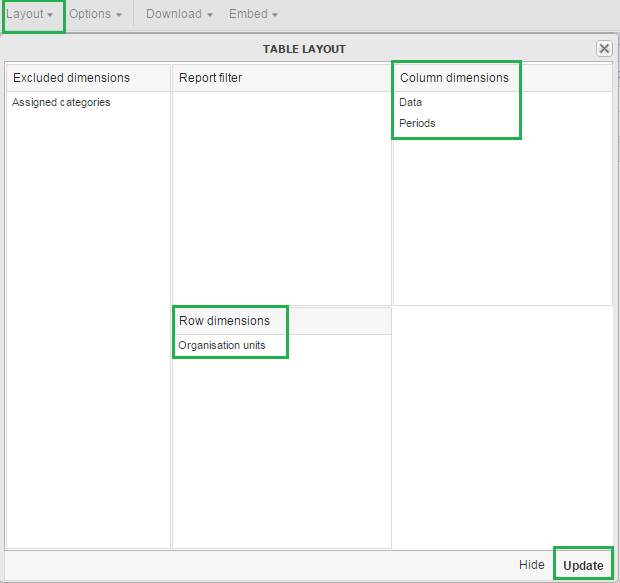
In Table layout, drag Organisation units down to the Row dimensions section.
Drag Data to the Column dimensions section.
In the Column dimensions pane, drag Periods below Data, and click Update.
In the workspace, click Options.
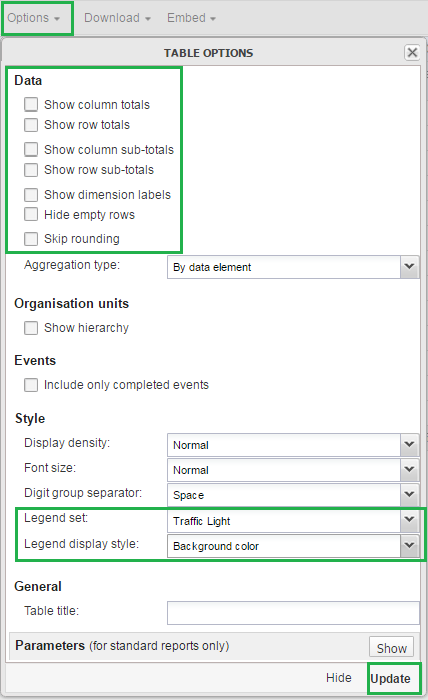
Go to Data and clear all the checkboxes.
Go to Style > Legend set and from the list, select the legend you created in the Maintenance app. In this example, we called it Traffic light.
Go to Style > Legend display style and select Background color.
Click Update.
The Scorecard is ready!
In the workspace, go to the Favorites menu.
Click Save as. Enter a name for your Scorecard.
To share your Scorecard, select Favorites.
Enter the name of a user group name, and click Save. Your scorecard can be viewed by people that you share a dashboard with.
TextPattern was introduced in DHIS2 version 2.29, as a way of defining a pattern that includes variables, generated values and raw text, which then could be generated into a text value. The current use-case for TextPattern is automatically generated attributes for tracked entities, where you want to generate for example unique ids based on a specific pattern.
This guide will cover both basic and advanced topics for working with TextPattern, but is mainly focused on how you can define TextPatterns and which limitations and caveats exists.
A TextPattern is a sequence of segments, joined together by the "+" character. A segment has a specific notation and in most cases a parameter format, which allows for further manipulation of the value.
| Segment notation | Description | Paramenter (format) | Example (segment → input value → result) |
|---|---|---|---|
| "Plain text" | The plain text segment will remain unchanged in all generated values. This special segment is defined by wrapping text between two double quotes. If your pattern should include separation symbols like a dash, you should use this "-". The plain text segment also allows for placeholder text. That means you can specify that parts of the plain text segment should be any of a set of characters. Currently there are 4 supported special characters you can use: * \d (0-9) * \x (a-z) * \X (A-Z) * \w (a-zA-Z0-9) | None | "Hello world" → None → Hello world "Hello \x\x\x" → "Hello you" → Hello you "\d\d\d" → "123" → 123 |
| CURRENT_DATE(format) | Current date segment will be generated by the server at the time of generation. This is useful if you want your patterns to have a time-constraint that is disconnected from the context. You should not use this if you need to control which date is injected into the pattern. | Date format | CURRENT_DATE(yyyy) → 01-01-2018 → 2018 |
| ORG_UNIT_CODE(format) | This segment represents the organisation unit code associated with the generation. | Text format | ORG_UNIT_CODE(...) → OSLO → OSL |
| RANDOM(format) | Random segments will be replaced by a value randomly generated by the server based on the format. Generated segments, like Random, bases its uniqueness on the rest of the pattern. That means a random value can appear twice, as long as the rest of the pattern is different, which means the generated text as a whole will be unique. | Generation format | RANDOM(X####) → None → A1234 |
| SEQUENTIAL(format) | Sequential segments will be replaced by a number, based on a counting value on the server. Sequential segments will start at the value 1, and for each generated value count up until no more values are available, based on the format. Like Random segments, uniqueness is based on the rest of the pattern, so each possible version of the pattern will have it's own sequential counter starting from 1. | Generation format | "A"+SEQUENTIAL(###) → None → A001 "A"-SEQUENTIAL(###) → None → A002 "B"-SEQUENTIAL(###) → None → B001 "B"-SEQUENTIAL(###) → None → B002 |
Most segments has a parameter format, except for the plain text segment. The following table lists the available formats, how they are used and example notations using them.
| Format | Description | Example |
|---|---|---|
| Date format | This format is based directly on the java SimpleDateFormat, which means any pattern valid for SimpleDateFormat, will be valid as a date format in TextPattern | CURRENT_DATE(dd-MM-yyyy) → 31-12-2018 CURRENT_DATE(MM-yyyy) → 12-2018 |
| Text format | The text format allows for some basic text manipulation. Leaving the format empty will return the value unmodified, but using "^", "." and "$", you can modify the value before it is returned. Each "." represents a character, while "^" represents the start of the text and "$" represents the end. When using formats, the input value must be at least the same length as the format. | ORG_UNIT_CODE(....) → OSLO ORG_UNIT_CODE(..) → OS ORG_UNIT_CODE(..$) → LO ORG_UNIT_CODE(^...$) → OSLO ^....$ will require the input value to be exactly 4 characters. |
| Generation format | The generation format accepts a combination of one or more of he following characters: "#", "X", "x" and "*". They respectively represent a number(0-9), an uppercase letter (A-Z), a lowercase letter(a-z) or any of the above(0-9,a-z,A-Z). The SEQUENTIAL segment only accepts "#", since it will only generate numbers. The number of characters in the format decides the size of the value generated. Using just one "#" will in other words only allow for 10 values (0-9), while "###" will allow for 1000 values (000-999). SEQUENTIAL generated values have leading zeroes, so the length of the generated value will always match the format length. | RANDOM(X###) → A123 RANDOM(****) → 1AbC SEQUENTIAL(###) → 001 SEQUENTIAL(######) → 000001 |
A few important things to note regarding the formats:
Date format is very versatile, but be aware of which date or time components you are using. Using components smaller than a day (For example hours or seconds) is not recommended, even though available.
Text format allows for marking both the start and end of the input value, but "^..." and "..." will in reality give exactly the same results. The only time you would want to use "^" is when you want to enforce the length of the input value. For example, "^....$" will accept OSLO, since its 4 characters between the start and end, but PARIS will be rejected, since it has 5 characters.
When text format is used for unique values, like organisation unit code, make sure that the format does not break the uniqueness. (Example: ORG_UNIT_CODE(..) for "PARIS" and "PANAMA CITY" would both return PA, which means these two organisation units would in reality share generated values)
Generation format is the primary way to understanding the capacity of your pattern. Make sure the format is long enough to cover more values than you need.
To finish off the syntax section of the tutorial, here is a couple of example TextPattern:
ORG_UNIT_CODE(...) + "-" + CURRENT_DATE(yyyyww) + "-" + SEQUENTIAL(#####)
This pattern will have 99999 possible values (based on SEQUENTIAL. 00000 is never used since we start at 1). In addition, the remaining pattern will change for each different organisation unit generating values (ORG_UNIT_CODE) and for each week (CURRENT_DATE(yyyyww) represents year and week). That effectively means every new week, each organisation unit will have 99999 new values they can use.
"ABC_" + RANDOM(****)
The plain text segment of this pattern, will make no difference in the total capacity of the pattern, however the generated segment (RANDOM) will allow for 14776336 possible values. The reason for this is that * can be any one character of the 62 characters available (0-9, a-z, A-Z). You can read more about understanding pattern capacity further down in the tutorial.
One use-case for TextPattern is to generate unique ids. In this section we will present guidelines and common issues related to designing TextPatterns used for ids.
An id should never contain sensitive information, or information that in combination can identify an individual. TextPattern does not currently support segments that uses these kind of values, but might do so in the future.
The following list highlights some of the TextPattern specific restrictions you need to consider when designing a TextPattern for ids:
Make sure the capacity (number of possible values) of the TextPattern covers your use-case. It's better to have more values than needed than less. Tracked entity attributes using TextPattern will require that a single generated segment is present in the TextPattern.
A TextPattern is unique in the entire system, but only for the object using it. In other words, if you have a single tracked entity attribute with TextPattern, used by multiple Tracked entities (Not to be mistaken for tracked entity instances), all values generated will be shared between all traced entities using the attribute. This also means that if you have two tracked entity attributes with the same TextPattern syntax, each attribute will be able to generate the same value as the other, since uniqueness is based on the attribute.
SEQUENTIAL segments are in the implementation numbers starting from 1, increasing by 1 for each value, sequentially until no more values are available. However, in reality you will most likely end up with gaps when users generate and reserve values that is never used, or if a user sends in a value where the SEQUENTIAL segment has a higher value than recorded on the server.
The current implementation relies on the user-client to send in the values contained in the TextPattern when storing a new value. That means generating a correct id is depending on the user, and user-client, to provide the correct data.
The most important thing to keep in mind when designing a TextPattern, is the capacity - that means the total number of potential values a TextPattern can yield.
With the current implementation of TextPattern, there are three main factors that decides the capacity:
Capacity of the generated segment in the TextPattern
The presence of a CURRENT_DATE segment
The presence of a ORG_UNIT_CODE segment
The presence of a date segment (like CURRENT_DATE) will effectively reset the capacity each time the segment changes. Depending on the date format, it can change anywhere to yearly to daily. Important: If your date format don't contain a year, the pattern will resolve to the same value every year. That means values will already be used. For example, if your TextPattern looks like this:
CURRENT_DATE(ww) + "-" + RANDOM(#)
This pattern will give you up to 10 unique values for each week, but after 1 year, CURRENT_DATE(ww) will be the same as last year, and you will have no new values available. If you use "yyyy-ww" instead, it will be unique for every year, every week.
Organisation unit codes will make your values unique for each different organisation unit, which means if you have a text pattern like this:
ORG_UNIT_CODE() + "-" + RANDOM(#)
This pattern will give you 10 unique values for each different organisation unit.
Understanding how to calculate the capacity of a TextPattern is critical when designing TextPatterns. The generated segments will be the main component of any TextPattern in terms of capacity, then increased based on the presence of ORG_UNIT_CODE or CURRENT_DATE.
Let's start with SEQUENTIAL segments. Each "#" in the format represents a number between 0 and 9. To calculate the total capacity, you multiply the number of possible values for each "#". Since it's always 10 (0-9) the maths is quite straight forward:
SEQUENTIAL(#) = 10 = 10
SEQUENTIAL(###) = 10 * 10 * 10 = 1000
SEQUENTIAL(#####) = 10 * 10 * 10 * 10 * 10 = 100000
Since SEQUENTIAL counters on the server start at 1 and not 0, the actual capacity is 999, but that's insignificant in most cases.
As soon as we involve RANDOM, the calculation becomes a bit more complicated. Similar to SEQUENTIAL, a "#" has 10 possible values, in addition we have "X" and "x" with 26 possible values each, as well as "*" which can be any of the previous, which means 62 (10+26+26) possible values.
To calculate the capacity, you need to take each character in your format and replace with the number of possible values, then multiply them all together like we did for SEQUENTIAL:
RANDOM(#) = 10 = 10
RANDOM(X) = 26 = 26
RANDOM(*) = 62 = 62

RANDOM(X##) = 26 * 10 * 10 = 2600
RANDOM(XXxx) = 26 * 26 * 26 * 26 = 456976

RANDOM(***) = 62 * 62 * 62 = 238328
As you can see, the maths gets a bit more complicated when, but by following this recipe you can see the number of potential values.
There is a hidden cost of using the random segment in TextPattern in the long run, but that does not mean you should never use it. This section will highlight the problems of using the random segment and suggest when it might be more appropriate to use it.
This section is motivated by an issue with the previous generation strategy, where you only had random generation. After while, instances using this feature would actually be unable to generate and reserve new values, since it was taking to long to find available values. This section looks at some of the problems with random generation that created this situation.
Before using the RANDOM segment in your TextPattern, you should consider the following problems connected to the use of RANDOM:
As previously mentioned, the only metadata currently supporting TextPattern is the tracked entity attributes. In this section, we will describe the different ways data entry for TextPattern works, especially for tracked entity attributes.
By default, all values sent to the server for metadata using TextPattern, will be validated. Validation can be skipped if needed, but you should always validate input under normal circumstances. The validation will be based on the TextPattern you have defined and will be as strict as possible:
Date segments must match the same format as specified in the segment parameter
Plain text segments must match exactly
Text segments values must be at least as long as the format string. If both "^" and "$" is present, the value must match the exact length.
Generated segment values must match the format exactly, character by character.
When using the server to first generate and reserve values, the server will modify the values used in the TextPattern before injecting them, meaning you will always get a valid value when generating it on the server.
A final exception to TextPattern validation is made for a special case: If you change a TextPattern after reserving values for the original pattern, values sent to the server that are invalid according to the new TextPattern, will still be accepted if it was already reserved.
There is currently 2 ways a client can store values for TextPattern metadata:
Generating and reserving values (Apps should do this for you)
Storing a custom value
The preferred way, is to generate and reserve the needed values (The number of values generated and reserved is handled by the app). That means each time you are seeing and storing a value, it has been generated and reserved by the server, and will be valid.
The other way might be useful in specific cases. The user will supply the value themselves and as long as the value supplied is valid for the TextPattern, they can put anything they want. The caveat of doing it this way, is that you might use values that was reserved by someone else and if you have a SEQUENTIAL segment, the counter will not be updated.
Q: I have entered data into a data entry form, but I cannot see the data in any reports (pivot tables, charts, maps). Why does data which is entered not show up immediately in my graphs in DHIS2?
A: Data which is entered into DHIS2 must first be processed with the "analytics". This means that data is not immediately available in the analytics resources (such as reports, pivot tables, data visualizer, GIS, etc.) after it has been entered. If scheduling is active, the analytics process will run automatically at midnight each day. After that, new data which was entered since the last time the analytics process ran, will become visible.
You can trigger the analytics process manually by selecting Reports->Analytics from the main menu and pressing the "Start export" button. Note, the process may take a significant amount of time depending on the amount of data in your database.
Other factors which can affect the visibility of data are:
Data approval: If data has not been approved to a level which corresponds to your users level, the data may not be visible to you.
Sharing of meta-data objects: If certain meta-data objects have not been shared with a user group which you are a member of, the data may not be visible to you.
Caching of analytics: In many cases, server administrators cache analytical objects (such as pivot tables, maps, graphs) on the server. If you have entered data, re-run analytics, and you are still not seeing any (updated) data, be sure that your data is not being cached by the server.
Q: I have downloaded DHIS2 from https://www.dhis2.org/downloads but when i try to enter the system it needs a username and password. Which should I use?
A: By default, the username will be "admin" and the password "district". Usernames and passwords are case sensitive.
Q: I added a new dimension to the system, but I get errors when using it in analytics through the Data Visualizer or Line Listing app. The API returns HTTP 409 Conflict.
A: When new dimensions are added to the system, a FULL analytics export is required (for all years preferable). Otherwise, the new dimensions won't be available to the analytics APIs.
For up-to-date information about the latest DHIS 2 releases, please refer to the DHIS 2 downloads page on our website.