DHIS 2 manual for the Interactive Scorecard App

DHIS2 Documentation Team

Copyright © 2008-2021 DHIS2 Team
Last update: 2021-10-04
Warranty: THIS DOCUMENT IS PROVIDED BY THE AUTHORS ‘’AS IS’’ AND ANY EXPRESS OR IMPLIED WARRANTIES, INCLUDING, BUT NOT LIMITED TO, THE IMPLIED WARRANTIES OF MERCHANTABILITY AND FITNESS FOR A PARTICULAR PURPOSE ARE DISCLAIMED. IN NO EVENT SHALL THE AUTHORS OR CONTRIBUTORS BE LIABLE FOR ANY DIRECT, INDIRECT, INCIDENTAL, SPECIAL, EXEMPLARY, OR CONSEQUENTIAL DAMAGES (INCLUDING, BUT NOT LIMITED TO, PROCUREMENT OF SUBSTITUTE GOODS OR SERVICES; LOSS OF USE, DATA, OR PROFITS; OR BUSINESS INTERRUPTION) HOWEVER CAUSED AND ON ANY THEORY OF LIABILITY, WHETHER IN CONTRACT, STRICT LIABILITY, OR TORT (INCLUDING NEGLIGENCE OR OTHERWISE) ARISING IN ANY WAY OUT OF THE USE OF THIS MANUAL AND PRODUCTS MENTIONED HEREIN, EVEN IF ADVISED OF THE POSSIBILITY OF SUCH DAMAGE.
License: Permission is granted to copy, distribute and/or modify this document under the terms of the GNU Free Documentation License, Version 1.3 or any later version published by the Free Software Foundation; with no Invariant Sections, no Front-Cover Texts, and no Back-Cover Texts. A copy of the license is included in the source of this documentation, and is available here online: http://www.gnu.org/licenses/fdl.html
This guide is intended for program implementers, who are aimed to configure the program (such as RMNCH) scorecard at national or organizational level for the rest of the users to use to measure the performance of agreed indicators at their levels. In most implementations, a program used to have one national scorecard with a list of agreed indicators, and configured at national level while other users at national and subnational levels are shared with read only access to limit them to make any changes.
In this guide, we are going to refer to Implementers and normal users in respect to the national Apart from setting up the scorecard, users with administrative privilege should share the scorecard with users or user groups. Users with privilege access can use the scorecard as normal users, with the privilege to access scorecards configured, access and download outputs, and share with others. To access as normal users, visit https://docs.google.com/document/d/1CI4A6MPr9Gr-KyuEnOFosfrdAG8Qdm1B/edit. for end user manual.
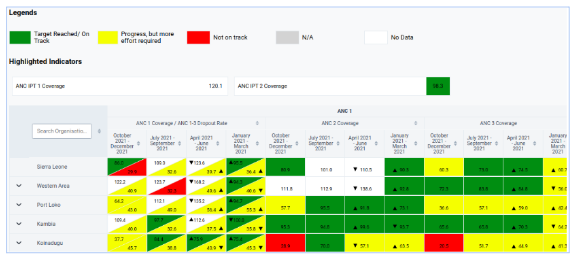
In public health settings such as the Ministries of Health, a scorecard offers a useful and standardized method for analysis with traffic lights color codes, combining related indicators into one table. A scorecard can give an overall view of the performance of a health program such as a vaccination program, highlighting successes, weaknesses, and areas for improvement.
In DHIS2 system, the scorecard can be created in two different ways as explained in dhis 2 website http://www.dhis2.org
This guide focuses mainly on the scorecard application. The advantage of the scorecard app is that it is tuned for advanced scorecard analysis and is developed and maintained by HISP Community, that uses vast and different use cases from different implementations to come up with solution, in contrast to the Pivot Table App that is used for basic scorecard analysis and is developed and maintained by the Dhis2 core team. While both scorecard app and pivot table app gives the user option to download and use the scorecard offline and share it on the DHIS2 dashboard, the Scorecard app gives more advanced control and power to easily create and analyse multiple elements and dimensions of the data.
Additionally, the scorecard app gives an opportunity to cascade the analysis by including bottleneck indicators in the scorecard dashboard as well as analyses the data with a broad spectrum of visualization tools, such as pivot table, charts and maps. This version of the scorecard is aimed to address limitations encountered in the scorecard version 2.4.1 by including functionalities such as ability of accommodating national and district targets for the same indicator, ability to sort the indicator while maintaining the parent organization unit, ability to change the layout of the scorecards listing, ability to filter the scorecard per specific facility type, ownership and periods, ranking the good or poor performers etc. The revised scorecard app has considered users’ feedback and new use cases over five years of the scorecard Implementation.
The Scorecard app can be used by any one with access to the DHIS2 system. Scorecard creation can be done by anyone with access to DHIS2. If someone creates a scorecard, it will only be accessed by the creator/owner unless sharing access to other users within the DHIS2 system. Most organizations and countries prefer to have one scorecard for each of the particular programs, where a list of indicators with their cut-off points are selected and approved for the particular program’s scorecard such as RMNCH. Then users from the program at organizational or national levels are tasked to create a scorecard and limit its access to read only to other users so that they can only visualize for evaluation of the program performance.
In this perspective, the one who creates and maintains a program scorecard are referred to as implementers, while any other users with read only access to the program scorecard are referred to as normal users.
 Important: In this guide, an Implementer is referred to as the user who creates and maintains a particular scorecard, and gives a view only access to the rest of the users; while any other users who can only view the particular program scorecard without ability of editing it are referred to as normal users.
To access the scorecard, a user must login to the DHIS2 system using the login credentials. You can access the application using an internet browser when you have a working internet connection. The internet browsers; Google Chrome, Mozilla Firefox, Safari can be used to access the application. However, the recommended web browser is Google Chrome.
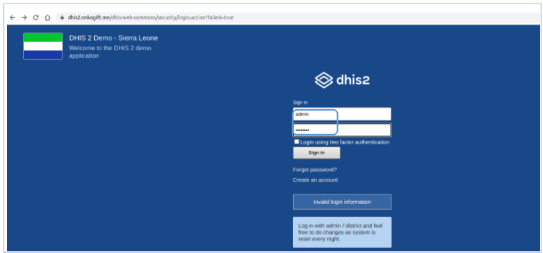
Once successfully logged in, a user will be landed on the DHIS2 dashboard or list of applications depending on the setup of the system. Then, a user will be required to access the scorecard menu from DHIS2 global menu.
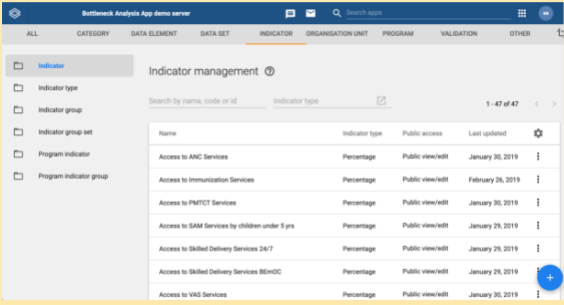
The Scorecard app borrows its meta-data from the general DHIS2 data source and uses this to create a data store for ease of analysis and visualization. The Scorecard app metadata such as indicators and indicator groups are managed using the DHIS2 Indicator maintenance App.
A user has to click on the scorecard application to get the list of created scorecards, or have access to create the new one. To create a new scorecard, a user has to click on the Add New Scorecard button at the top right corner of the screen.
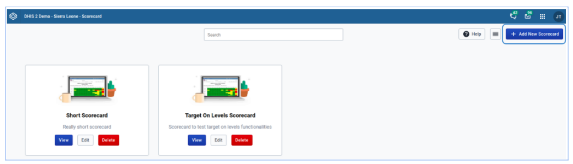
A user should click on the scorecard application to open it and have access to configure. Then fill in the information in the respective fields as per field label against each field under General tab.
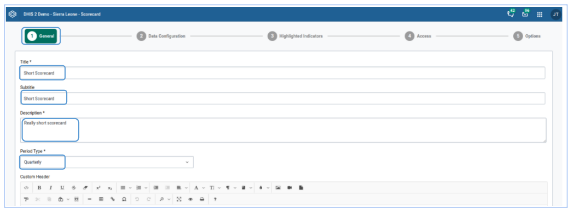
To set up legend definitions, a user has to scroll up the page and change the color codes and associate the legend definitions by clicking on the color selectors available. To add more legend definitions, a user needs to click on the ‘Add item’ button below the legend definitions. For deleting the legend, a user needs to use the Delete button next to each legend.
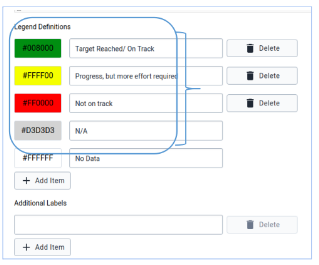
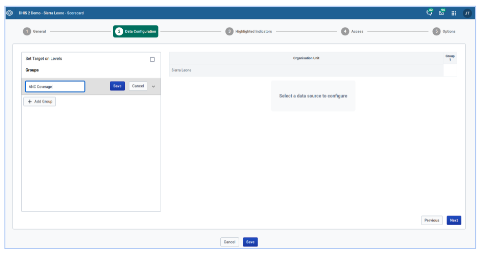
To select indicator groups, indicators, and cut-off points for poor, average and good performance a user has to navigate to the ‘Data configuration’ tab. The user is supposed to click on the Add group to be able to add items for scorecard configuration. At the right hand side, there is information that guides on items to be done to get the scorecard generated.
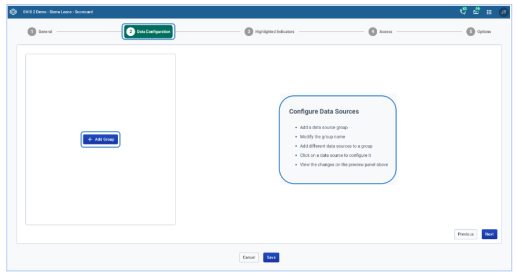
To edit the default group created after clicking the Add group button, the user has to click on the edit icon against the default group name (Group 1), and write the appropriate name of the group and save.
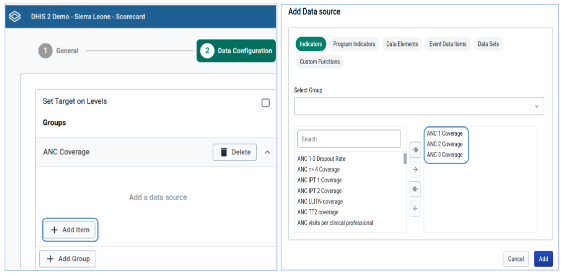
Note: The process of adding indicator groups and indicators in a group can be repeated as in the Figure 8 until all groups and their indicators are exhausted.
After saving the selected indicators, the layout of indicators and cut-off points for each selected indicator, the number for effective gap, and options to display arrows for effective gap, and show colors are made accessible for administrative users to apply.
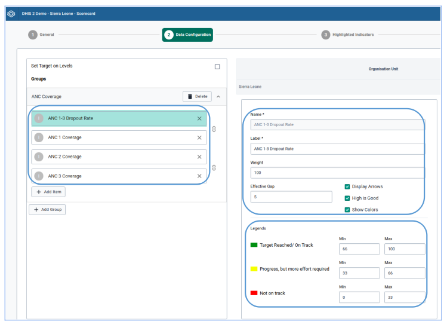
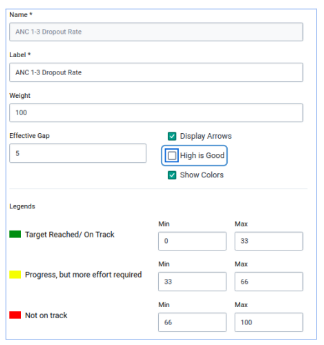
For indicators whose good performance is when the percentage is decreasing in number, the indicator can be simply configured by unchecking the ‘High is Good’ option that appears just on top indicator cut-off points.
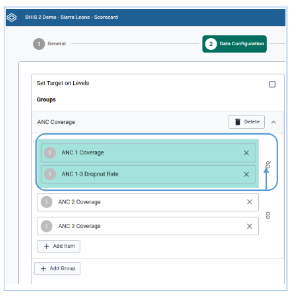
For the case of pairing of related indicators, it can be easily done by clicking the hyperlink next to the right of the indicators. This is helpful to save the horizontal space of the scorecard layout and place related indicators in one column for comparison purposes.
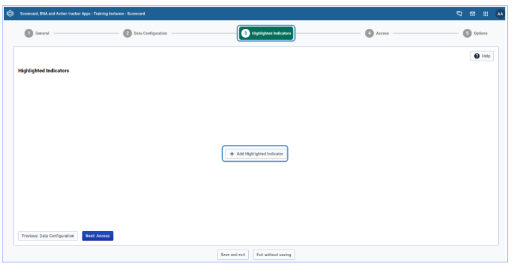
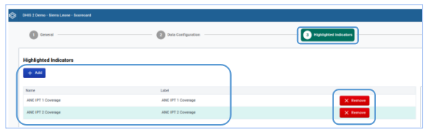
To select indicators for indicators that should be highlighted while displaying the scorecard, a user has to navigate to the ‘Highlighted Indicators’ button and add. With highlighted indicators, a user can quickly have a look at the performance of such indicators just on top of the generated scorecard.
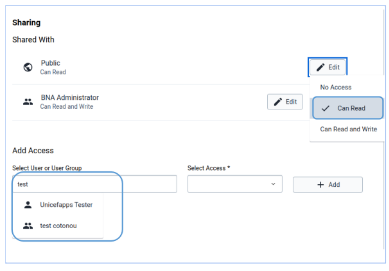
The scorecard should be shared to individual users or user groups for them to get access to. This is a very important concept in DHIS2 that every object cannot be accessed by anyone apart from the one created unless it is either given a public access sharing, or shared with users or a group of users. Scorecard sharing can be extended to decide to share the access to which level. For example, a program can have a district scorecard configured and only shared to the level of the district, as well as user groups. For the scorecard under configuration, a read access for the test user has been assigned to allow a user with a test account to only browse the scorecard without changing anything.
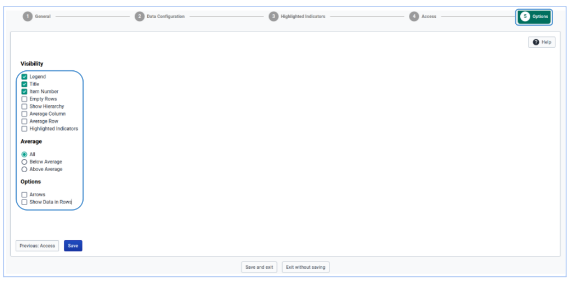
To select a list of options to be displayed by default when any user loads the scorecard before making his/her own selection of options, the user can configure the scorecard by selecting the options button at the right corner of the displayed window. The selected options persist even when the normal user makes his/her own selections and later decide to reload the scorecard.
The user needs to save the configurations made and load the scorecard to visualize it as other normal users will do (Figure 15). This finalizes the scorecard configuration and saves it to the system for access with users with shared access.
Chapter 3 and others after it are intended for users of the scorecard app who do not have the access rights to edit a particular dashboard that they are viewing. These are users with the privilege to access scorecards configured, access and download outputs, and share with others. To create a new scorecard please refer to chapters 1 and 2 that focus on users who want to create a dashboard or have the privilege to edit the dashboard they are accessing.
The use of health management information platforms like DHIS2 has helped health managers to collect, monitor, and use data for planning and decision making. Not all health managers have the analytical skills to perform data analysis and generate trends over time. Using tools like scorecards equip such managers with a tool that generates analysis automatically and displays them in a manner that would allow them to make decisions.
In relation to similar DHIS2 based apps like Bottleneck Analysis (BNA) and action tracker apps; the scorecard provides a way for health managers to track the performance of an unlimited number of indicators grouped as configured by the user. While BNA allows indicators configuration based on human resources, commodities, geographic coverage, initial utilization, continuous utilization, and effective utilization; the scorecard app provides users with the ability to track and group indicators based on their own preferences.
The scorecard app provides you with a quick visual output of performances for different indicators making it easy to observe performances and trends. Using the default traditional colour codes red (for bad performance), yellow (for normal), and green (for good), users are easily pointed to indicators and locations with issues that need special attention.
 Note: Although red, yellow, and green are used as default colours, users can use different colour codes for indicator outputs.
The Scorecard app borrows its meta-data from the general DHIS2 data source and uses this to create a data store for ease of analysis and visualization. The Scorecard app metadata such as indicators and indicator groups are managed using the DHIS2 Indicator maintenance App.
The Scorecard Application is built on an architecture that eases the user interactions by having a design concept that promotes the user to follow their intuition complemented with high performance that considers the lowest internet connection scenarios with descriptive notification messages if the user misses a step along the way.
When using the Scorecard App the Global DHIS2 Menu is accessible in its usual position. The user can use the global menu to access other apps and to log out of the system. Most of the app notifications will pop on the top position where the DHIS2 global menu exists.
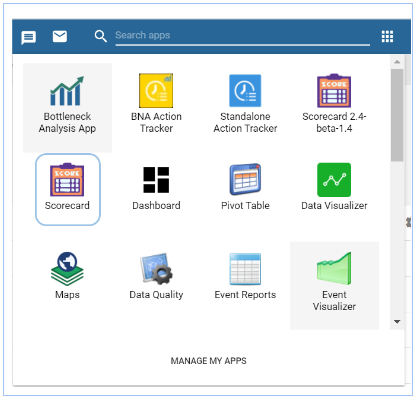
Upon selecting the Scorecard app from the global DHIS2 menu, you will have the option to select the scorecard to track and visualize.
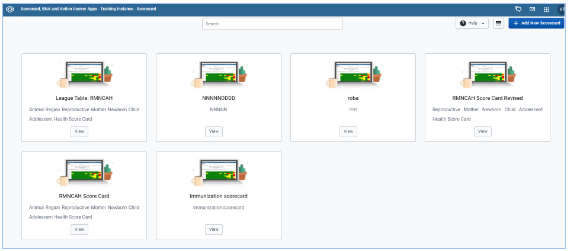
You click on the option for managing display layout to change the display of scorecards from a horizontal to vertical listing and vice versa
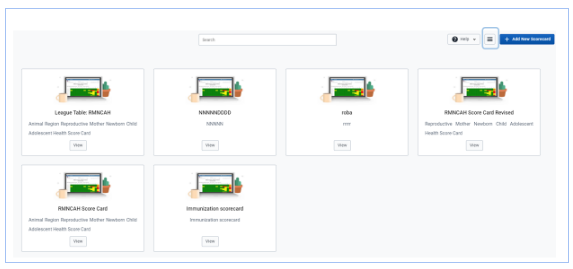
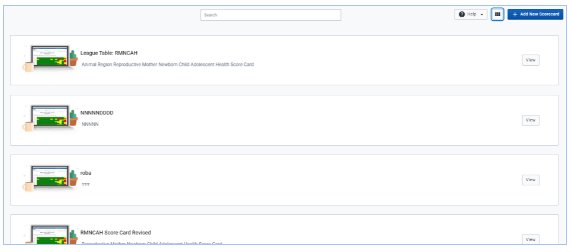
You may select the scorecard you want to access if it is seen on the list of search the scorecard name by typing the name in the search bar option.
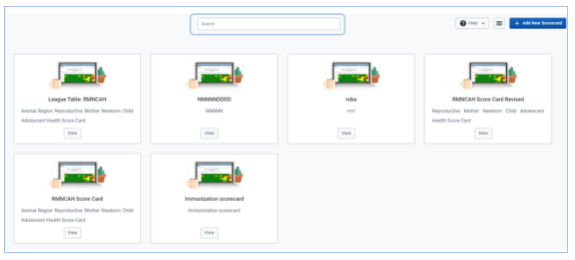
Instead of using the search option, you may also use the navigation bar at the bottom of the list to move from one page of the scorecards list to another.
The Scorecard App can be found in the Apps menu. if the application has not yet been installed in your DHIS2 instance or installation has issues, refer to the installation instructions of the implementation guide for further guidance, or contact the DHIS2 administrator for assistance.
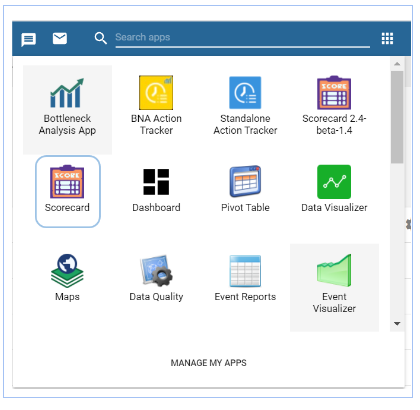
To select the scorecard you want to visualize click on the View option as shown in Figure 10 below. If you do not see the scorecard you want to visualize, please refer to section 2.4.2 on how to search for a scorecard.
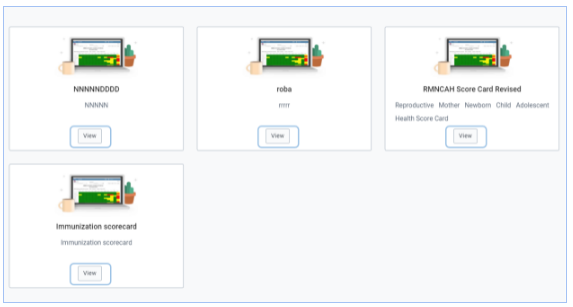
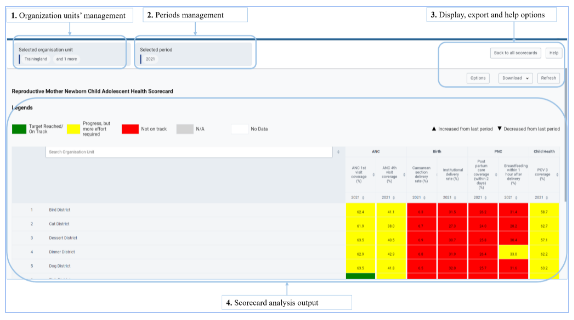
Upon clicking the View option, you will be taken to the main page of the scorecard you have selected. The scorecard’s main page will include the following options:
Organization units’ management: This section will provide you options for selection location (organization units) for which you want to visualize the scorecard for
Periods management: This section will provide you options for periods for which you want the scorecard analysis to be done for Display, export and help options: This section will provide options for managing how the scorecard analysis outputs should be displayed as well as options for exporting and/or printing the scorecard outputs. The help option provides a built-in navigation guide on how to use different menu options of the scorecard app.
Scorecard analysis output8: This section will output the analysis results for all the selected organization units and indicators or indicators groups for the scorecard. The output section is preceded by the colour-coded key that explains how each scorecard should be interpreted.
This section will allow you to select the organization unit on which you want the scorecard analysis to be done. You will be able to choose three options for selecting organization units for scorecard display; first selection by organization unit (selecting a specific location to view scorecard for), second selection by level (selecting organization unit level e.g., region or district to view scorecard for) and third selection by Organization unit group (selecting groups of organization units e.g., hospitals to view the scorecard for)
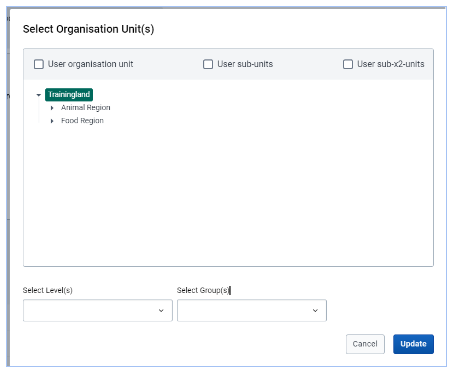
After selecting the category of organization unit to view, you will be able to select the specific sub-option to select. For the first option selection by organization unit, you will be able to select a sub-unit to view, for the second option of selection by level, you will be able to select the specific level to view, and for the third option of selection group, you will be able to select specific organization unit to view
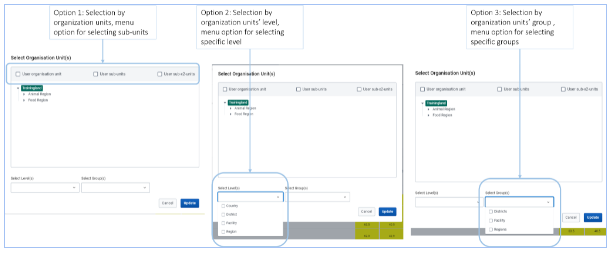
To select a specific organization unit after selection options outlined in figure 12 and 13 above, you may click on a specific organization unit’s name to select the organization unit for visualizing the scorecard for.
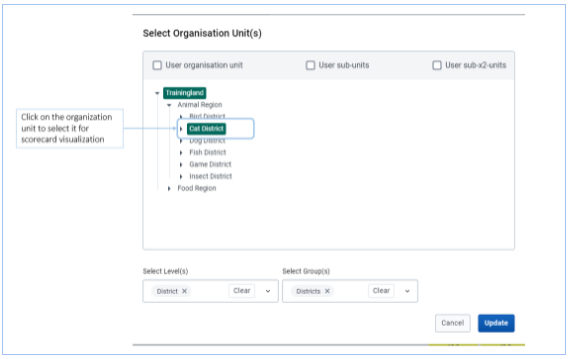
After selecting Organization units’ option to view, click Update to confirm the selection and alter the scorecard display to match the selected organization unit you have chosen.
The period management section allows you to select specific periods or periods for which you want to visualize the dashboard for. To get options for selecting periods, click on the period selection tab (Figure 15)
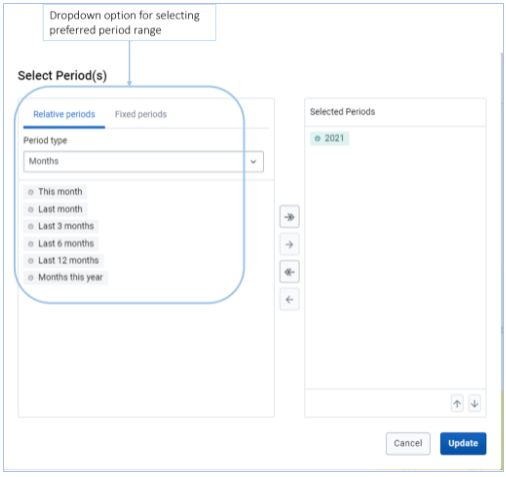
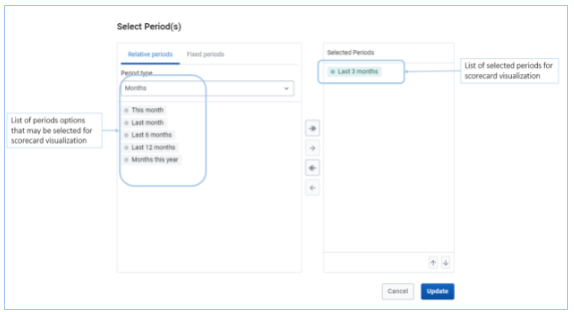
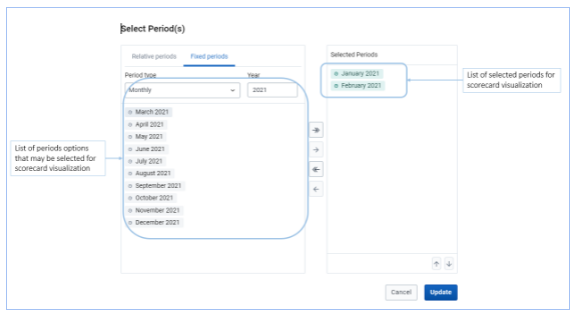
You can select a period using the Relative Periods or Fixed Periods options. Period option will be listed on the left hand side. To select the period of choice, double click the period. Once selected (double clicked) the period will be shifted to the right hand (Figures below). To deselect the period (from the right hand side) double click it.
This display management section allows you to select display options determining how the scorecard output should be displayed.
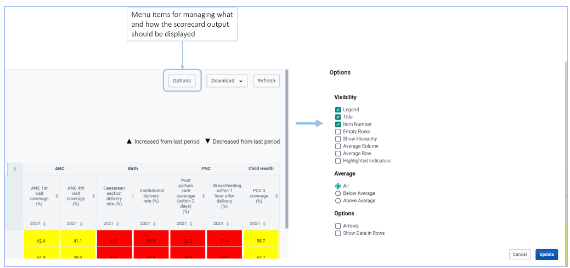
The scorecard display options allow you to management the following:
Legend:**choosing if legends should be shown or not **Title: choosing if the scorecard title should be displayed or not Item number:**choosing if listing of organization units should include item numbers **Empty rows:**choosing if scorecard outputs with zero values should be displayed or not **Show hierarchy:**Option for displaying organization units hierarchy when displaying scorecard outputs **Average column:**choosing if the average column should be displayed or not **Average row:**choosing if the average row should be displayed or not **Highlighted indicators: Option for displaying indicators that were added as indicators of interest to tracked. **Average:**allowing you to choose to display all organization units or those that have performed below or above average only. **Options:**choosing if you want to display arrows showing changes (increase or decrease in performance) and actual performance data (number) related to colour coded outputs of indicators to be displayed
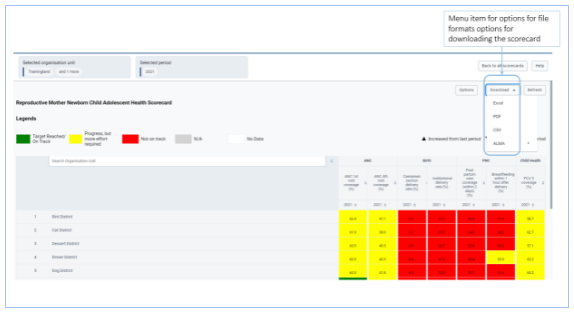
The display and export section also include an option for downloading the scorecard. Click on the Download icon to get options of allowable file formats for download. Click on the preferred file format then save the file to be downloaded to your preferred location (as per your browser settings). The scorecard can be downloaded as Excel, PDF, CSV or ALMA options (JSON or CSV Metadata)
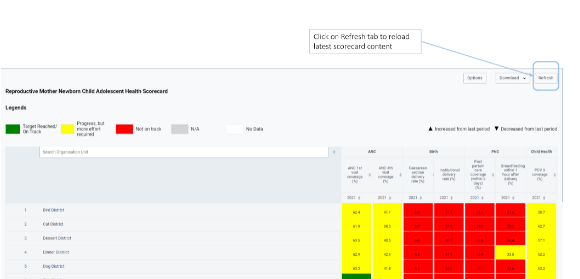
For each display this section also allows you to refresh the scorecard and get the latest analytical outputs. This could be relevant in case there are ongoing changes as you are viewing the scorecard or there is a need to clear the cached display.
This section is used for displaying the scorecard outputs based on options selected as guided in sections 3.1.1, 3.1.2 and 3.1.3.
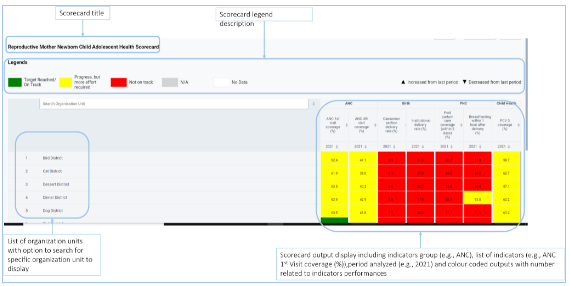
The scorecard analysis output section has the following main sections
*Title:*displaying title of the scorecard *Legend description:*describing colour codes used and marks for increase or decrease in performance *Organization units list:*Displaying list of organization units analyzed with option to search for specific organization unit to display *Scorecard output:*with information about indicators group (if added), indicators names, period analyzed and colour coded outputs of the analysis with corresponding performance.
In addition to this User-Guide, the scorecard app has a built-in Help navigation option that will provide you with descriptions. To access the Help guide click on the Help button then follow the steps highlighting different scorecard options and their functionalities.
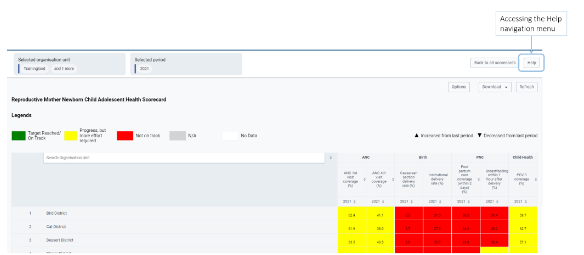
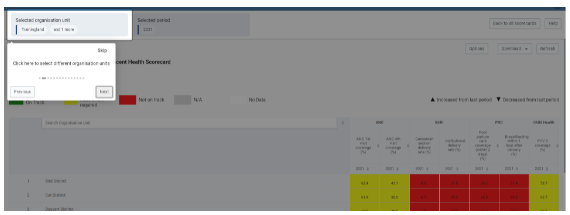
Use the Previous or Next buttons to navigate from one option of the Help navigation to another. To end the Help navigation, you may click the Skip option
If the scorecard action tracker application is taking too long to load, and you’re not on a slow network, make sure you have cleared your browser cache.
The Scorecard app makes good use of cached files for a better offline experience, as a result, when installing a higher version, the Scorecard app may use older versions of cached files and thus break down while loading.
Approaches to clear application cache and browser interface, vary from browser to browser; for example for Mozilla Firefox the keyboard shortcut is “CTRL+SHIFT+DELETE” while for Google chrome the keyboard shortcut is “CTRL+SHIFT+J”.
Accessing the interface for clearing browser cache can be done via the following approaches:
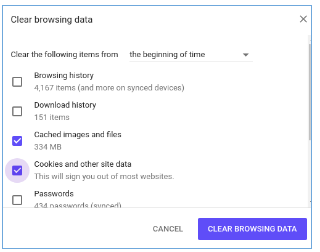
• Google Chrome: Go to the menu icon on the top right corner, and click it to open, go to more tools menu, and choose “Clear browsing data”. Once the interface is open, Make sure, “Clear the following items from” is set to “The beginning of time”.
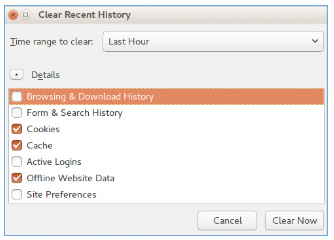
• Mozilla Firefox: Go to the menu icon on the top right corner, and click it to open, go to ->Library, and go to History, and choose “Clear recent history”. Once the interface is open, Make sure “Time range to clear” is set to “Everything”, and the “Details” option is expanded to show all details options. Once on the clear browsing data or recent history, tick “Cache”, “Cookies”, “Hosted app data” or “Offline Website Data”. To clear all cached files, cookies, and locally stored data.
Note:These will also clear all cache information and cookies from other websites you visited in your browser.
The Scorecard app has error messages for the expected errors that could occur.
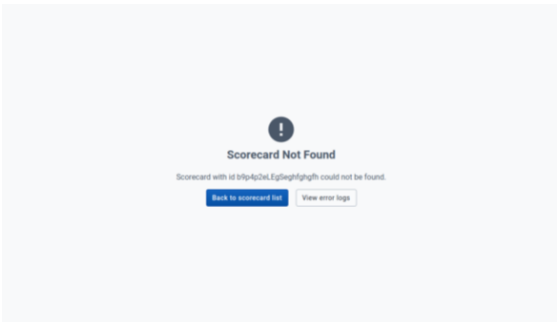
Scorecard not found error: This error (shown in Figure below) appears when the provided scorecard id (on the address bar) does not match any of the scorecard configurations present in the system. This error will most likely occur when a user accesses a scorecard by pasting a link on the address bar. To solve this error, ensure that the provided link is for a valid scorecard configuration.
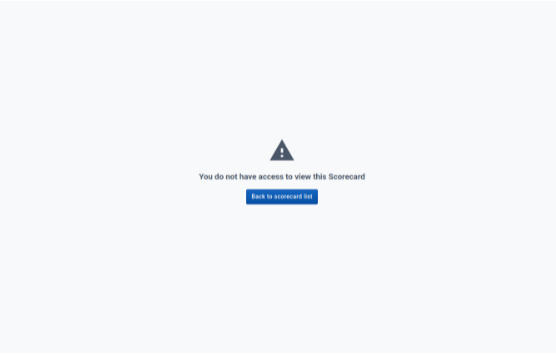
Access denied error: This error (shown in Figure below) appears when a user tries to access a scorecard which he does not have access to. This will most likely occur when a user accesses a scorecard by pasting a link on the address bar. To solve this issue, ensure that the current user has proper access to the scorecard.
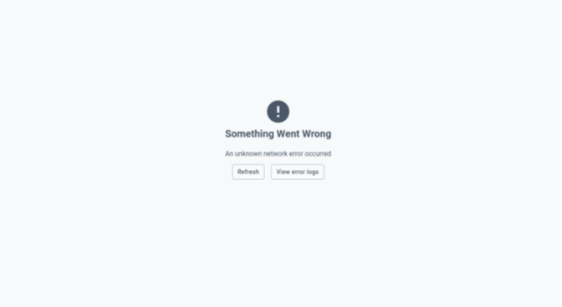
General errors: Other errors can occur during the app usage due to various reasons (network issues, for example). The errors will appear as shown in Figure below. A simple message of the error will be shown. If the error is technical, a descriptive message can be viewed when the user clicks on View logs button.Most of these errors can be solved by refreshing the application (through the Refresh button or the browser’s refresh button or CTRL + R)