DHIS2 Documentation Team
Copyright © 2008-2023 DHIS2 Team
source.revision.date: 2026-05-13
Warranty: THIS DOCUMENT IS PROVIDED BY THE AUTHORS ‘’AS IS’’ AND ANY EXPRESS OR IMPLIED WARRANTIES, INCLUDING, BUT NOT LIMITED TO, THE IMPLIED WARRANTIES OF MERCHANTABILITY AND FITNESS FOR A PARTICULAR PURPOSE ARE DISCLAIMED. IN NO EVENT SHALL THE AUTHORS OR CONTRIBUTORS BE LIABLE FOR ANY DIRECT, INDIRECT, INCIDENTAL, SPECIAL, EXEMPLARY, OR CONSEQUENTIAL DAMAGES (INCLUDING, BUT NOT LIMITED TO, PROCUREMENT OF SUBSTITUTE GOODS OR SERVICES; LOSS OF USE, DATA, OR PROFITS; OR BUSINESS INTERRUPTION) HOWEVER CAUSED AND ON ANY THEORY OF LIABILITY, WHETHER IN CONTRACT, STRICT LIABILITY, OR TORT (INCLUDING NEGLIGENCE OR OTHERWISE) ARISING IN ANY WAY OUT OF THE USE OF THIS MANUAL AND PRODUCTS MENTIONED HEREIN, EVEN IF ADVISED OF THE POSSIBILITY OF SUCH DAMAGE.
License: Permission is granted to copy, distribute and/or modify this document under the terms of the GNU Free Documentation License, Version 1.3 or any later version published by the Free Software Foundation; with no Invariant Sections, no Front-Cover Texts, and no Back-Cover Texts. A copy of the license is included in the source of this documentation, and is available here online: http://www.gnu.org/licenses/fdl.html
Any implementation of District Health Information Software (DHIS2) should aim at establishing sustainable systems that are flexible to changing needs in the health sector. It is important to acknowledge that this will take many years, with continuous structures for capacity building, best practice sharing, and innovation. This quick guide will provide a very crude overview of the different facets of DHIS2 implementation.
A DHIS core team (DCT) of 4-5 people will be needed to administer a national HMIS. Their responsibilities and required skills should be clearly defined. The DCT will participate in DHIS2 Academies, organize training and end-user support for various user groups in the country.
A Technical Steering Committee, or equivalent, will be needed to steer the coordination between health programs, other information systems and development partners and Universities. They will lead integration efforts and make decisions regarding the overall architecture of information systems.
An assessment needs to establish the needs for hardware. Desktops, laptops, tablets, mobile phones all have different qualities, and typically a mix of these different technologies will need to be supported.
Server and hosting alternatives needs to be critically examined with regards to capacity, infrastructural constraints, legal framework, security and confidentiality issues.
Internet connection for all users will be needed. Mobile internet will be adequate for majority of users doing data collection and regular analysis.
Options for mobile phone users, bulk sms deals etc, should be examined if appropriate.
The DCT will play a key role here and each member should have clear responsibilities for the roll-out covering: user support, user training, liaison with health programs, etc.
Broader support structures need to be established to provide support, supervision, and communication with global/regional network of expert users and developers.
Information use must be a focus area from the start and be a component both in the initial system design and the first round of user training. Data collection and data quality will only increase with real value of the information. District review meetings and equivalent should be supported with appropriate information products and training.
Training will typically be the largest investment over time, and necessitates structures for continuous opportunities. Plan for a long term training approach catering for a continuous process of enabling new users and new system functionalities.
Supervision and data quality assessment should be held frequently.
Based on the decisions the system should support (system scope); customization and adaptation of the platform will be needed for DHIS2 aggregate, tracker, and/or events. Each action will need special competence, and should be led by the DCT.
Assessment of the intended users and beneficiaries is needed, such as related to their information needs, and hardware and network needs.
An understanding of the larger architecture of the HIS (the "HIS ecosystem") is important; what other systems are there, and how should they interact with DHIS2? Consider what needs there will be for interoperability between electronic systems.
If there are needs that are not currently supported by DHIS2, an assessment of additional software development is necessary. These can be addressed locally by developing a custom web app or feed into the overall core platform development roadmap process organized by UiO.
Reporting units: implementing the different reporting units (service outlets) and hierarchies including grouping.
Data collection needs: Which indicators are needed, what data variables will go into their calculation, and how should this data be collected? Design data elements, disaggregation categories, data sets, and collection forms.
Information for action (indicators, dashboards, other outputs): what are the information products the various users will need? Tables, charts, maps, dashboards. Routines for dissemination and sharing.
User management: Create user roles and groups, routines for managing users, define access to features, and appropriate sharing of content.
DHIS2 governance document (roles by profile, how to change metadata and under what conditions).
DCT will need all skills necessary for a sustainable, evolving system. This includes technical skills (DHIS2 adaptation, server maintenance), system knowledge (architectures and design principles), organizational (integration strategies), and project management (organizing structured support and training).
DCT members should attend the regional/global DHIS2 Academy frequently (e.g. twice a year) to ensure high quality training, continuous communication with the broader expert community, and to make sure the local team is up to date with new functionalities and enhancements in recent releases of the DHIS 2 platform. DCT will be responsible for adapting and cascading this regional training curriculum to a broader group of users within country.
DCT should offer training in relation to the implementation, and continuously thereafter to meet growing demands, system updates and staff turnover.
Adapting and developing training material and reference guides to reflect local information needs and local system content is important.
Proper planning and budgeting is an important activity in order to sustain a good system design over time, making sure the DHIS2 system develops in a healthy way, is updated frequently, responds to user needs and operates according to rules and regulations. This includes making sure the system responds to basic user needs in terms of data collection, data quality checks, data analysis and presentations, and remains relevant to all key health programs and at all levels of the health system (from facility/community to national level).
A strong DHIS2 implementation that is sustainable over time and adaptable to changing programmatic needs requires a number of cross cutting functions to be in place and well-functioning. We refer to these as foundational domains, which includes areas such as leadership and governance, security and infrastructure. These are important building blocks in order to support both aggregated and individual level data systems. The figure below illustrates the foundations for DHIS2 - these will all require financial support internally and often externally in the form of organisational strengthening and capacity building, technical assistance and local operational costs.

The purpose of this section is to provide guidance on planning and budgeting DHIS2 strengthening activities, with a particular emphasis on the foundational domains. It is not straightforward to provide clear costing guidance in each domain in this model, since the particular activities will vary greatly depending on the current state or maturity of the domain, the capacity of the local core DHIS2 team, and local cost levels. Because it is not possible to provide generic costing estimates in real value (dollars), we instead describe the cost categories and factors to consider when making a budget.
A tool is available ("DHIS2 Maturity Profile") to map the maturity of a DHIS2 implementation in a country in order to help identify areas in need of strengthening. The assessment tool is structured as a set of questions per each domain shown in the figure above, and will give a snapshot of the current maturity of DHIS2 in a country. This assessment is intended to be performed regularly in collaboration between DHIS2 experts/HISP groups and Ministries of Health and results in a summary report with recommendations.
The DHIS2 maturity profile supports countries to;
The DHIS2 Maturity Profile is an important tool for building and costing coordinated and sustainable DHIS2 plans in a country.
Costs can roughly be divided in;
The largest investments in DHIS2 strengthening are associated with building and maintaining local capacity in the country, but for new implementations there are costs to help get started, support the initial configuration and training etc.
Costs are generally highest when getting started and first scaling up DHIS2. Certain costs are one-off, meaning they will only occur once, such as gathering requirements and configuring the initial system, but most costs are recurring each year. For example, an initial investment in purchasing computers or mobile devices must be backed up with a long term plan to replace a certain number of these devices every year, perpetually. Similarly, there needs to be a plan and budget for training of new staff, refresher training, server hosting, regular security audits, and ongoing system maintenance and improvements etc. It is very important to ensure that there is sustainable funding over time to support the system.
Depending on the state of the core team or maturity of the country, the nature of assistance will change. In an early stage of an implementation, there may be need for external support even for relatively routine or basic activities. As a local capacity and a strong core team is developed, most activities can be handled internally. Outside expertise will then primarily be in the form of providing advice and capacity building in new areas or for new functionality.
General budgeting guidance are located here. Note that the guidance mostly covers one-off costs, but we recommend that countries plan longer term and factor in costs that are recurring.
Next is a description of the foundations of DHIS2, what you need to think about when it comes to budgeting and planning and some relevant resources. Further down you will find guidance to plan, budget and build/maintain both aggregate and tracker programs
Solid governance and coordination mechanisms are crucial to support an HMIS that is coherent across programs, up to date and well maintained. An aim is to have a cross-ministry steering committee bringing together key health information stakeholders across the ministry responsible for high-level strategic decisions relating to content and scope for DHIS2. The group should have representatives from across all major health programs, with both technical and public health leadership, and should be given a clear mandate. Additionally, a technical working group can meet more frequently and have the mandate to make decisions of practical nature.
While this is not a quick fix in any country, guidance and technical assistance from HISP groups on how to establish and run such coordinating mechanisms can be useful. They can also help prepare or participate in such meetings.
Strategy and coordinated investments means having digital strategies which address areas where DHIS2 is used, such as HMIS (aggregated data), surveillance, case based surveillance and community based data. Countries should conduct regular HMIS needs assessments and develop costed work plans. The sustainability of HMIS funding and investments over time also points to a mature DHIS2 implementation. This includes planning for DHIS2 strengthening, but also planning for the personnel needs in the whole "data-chain", such as health personnel with time and capacity to work with data, district health information officers, statisticians etc.
There might be costs associated with assistance to support this strategy development work, conducting needs assessment and writing costed plans.
DHIS2 implementations need to align with local legislation and be protected from breaches and data loss. This requires personnel with the right skills, well-defined policies, auditing procedures and key security tools and documents that are used routinely. There should be a person responsible for implementing security policy covering DHIS2, at a senior level within the Ministry of Health. If this responsibility is not defined, or the person is not sufficiently senior, overseeing and implementing other key elements of a security framework is difficult. Related to this, both data and technical ownership should be clearly established and defined for the DHIS2 system. The data owner is the person or unit responsible for data backup and retention policy, and access control approvals. The technical owner is responsible for the infrastructure, change management and system maintenance.
There should be a document describing the security policy for the DHIS2 system, which outlines processes and procedures for implementing and managing security at server, instance and data level. A regular (e.g. yearly) internal and/or external audit of the DHIS2 system should be conducted that verifies adherence of the implementation against this defined policy. The audit should also specifically test the server and the DHIS2 instances for security issues.
Finally, key security tools and documents should be available and used as needed. Examples of such tools and documents include risk registers, threat model, privacy impact assessment, non-disclosure agreements, and incident response plans.
Security and compliance is to a large extent about policies and delegation of responsibility, and costing of this domain should take into account resources to allow relevant staff to take on the necessary responsibility. When policies and key tools and documents are not in place, budgeting for technical assistance to develop and implement these may be needed. Similarly, there should be a plan and budget for regular audits.
The vital part to any DHIS2 implementation is to identify a DHIS2 core team that will be central to the DHIS2 rollout and responsible for the day-to-day maintenance and further development of the national DHIS2 system. This team will be a critical component in the long term sustainability of the system and to ensure local ownership. This team needs to be established at the beginning of the DHIS2 implementation and lead the local customization process.
A team can either be funded through secondments of staff to MoH from external organisations or as annual salaries if existing staff exist in the MoH (across programs and departments). One can incentivise participation and long term involvement through regular core team meetings e.g. configuration workshops, coordination meetings, training events (in country and regional DHIS2 academies) for the core team.
Key to building capacity of the core DHIS2 team is that all technical assistance activities are planned in a way that allows the local team to be involved and learn from outside expertise as far as practically possible. Building the core team is therefore a cross-cutting concern that should be considered when outside expertise is involved to strengthen any of the foundational areas.
Costs will include salaries or secondments, workshops with travel and per diems, technical assistance to provide capacity building support, as well as DHIS2 academy sponsorships.
Metadata quality refers to the quality of the DHIS2 configuration, such as how data elements, indicators, reporting forms (data sets) and analytical outputs (dashboards) are configured. For example, whether there are misconfigurations that can potentially lead to system errors, or if the metadata is organised in a way that facilitates use of information by end users.
The quality of the organisational unit hierarchy (e.g. districts, health facilities refers to whether they are completely represented in DHIS2, including both public, private and non-governmental sectors, and whether they are kept up to date with associated information.
While maintenance of metadata and orgunits is in general an integral part of the ongoing work of the core DHIS2 team, it will often be necessary to plan for metadata assessments and cleaning exercises from time to time. Outside technical assistance may be required to support this, as addressing certain types of issues can be very technically challenging.
Training of end users of DHIS2 at all levels of the health system is a critical component of a successful DHIS2 implementation. Countries should have a plan for systematically training new staff, providing refresher training on a regular basis, and addressing training gaps on data entry, validation and use. A common problem and an area with large potential is local level data use. Thorough investigations and documentation of local data use practices in selected districts is needed to support this. Based on these investigations, next steps can be adaptation of analysis tools to local practices and data policies (incl. denominator data at each level), design and configuration of local level data analysis products and distributing these tools to other districts.
HISP groups typically conduct Training of Trainers (TOT) to help countries run their own end-user training. Costs associated with training are both TA and travel for HISP groups, and local costs to host and contact cascaded training, such as venue, trainers, training materials, per diems, travel etc.
In order to ensure overviews of the target population and the available services and personnel it is important with complete and up to date population and facility data. When CRVS data (e.g. births and deaths) is available and complete, this could be linked to DHIS2 and used to calculate denominators. Population data (denominators) from census data is more typically used in DHIS2, and should be available for use at subnational level. Census estimates may not be available or appropriate at all relevant levels used in DHIS2, and there should therefore be SOPs and routines making projections available for local use.
A facility list or register should be available in DHIS2 that covers all relevant facilities, including community units where those are reporting. This list should be kept up to date, which in most cases means that there is a process for involving the sub-national level (e.g. district) in the facility list maintenance. Human Resource data (workforce) should also be linked to facilities, with details on the type and number of staff kept up to date on a regular basis.
In addition to the ongoing staff requirements to keep this information updated and relevant in DHIS2, the main cost items is technical assistance to integrate the relevant types of data into DHIS2, either as a one-time operation or by establishing some form of interoperability with CRVS, master facility list or human resource systems.
Sufficient infrastructure means that the system is being hosted in a secure and stable environment (either on-premise or cloud based), that there are enough working devices for end users, and that ICT support is available and needed. Different projects and programs will have different infrastructure needs; some countries enter the data at facility level on paper and digitise it at district level, while others run full scale digital implementations with personal devices for health workers. In addition to the actual infrastructure there are associated costs such as mobile device management and device inventory.
There are many different options for hosting an online system, both in terms of where to put the server (e.g. in-house vs. cloud) and who to manage the server (e.g. in-house vs. outsourced). Server and hosting alternatives need to be critically examined with regards to capacity, infrastructural constraints, legal frameworks, security and confidentiality issues. These decisions may need to be revisited at least annually as server complexity, data types (e.g. aggregate vs. patient) and local capacity may change over time. It is important to budget for device replacement as devices eventually will break down or get lost.
The maturity of an aggregate DHIS2 implementation can be measured by looking at metrics such as reporting completeness, timeliness and consistency, whether there are available data use guidelines or forums, and job descriptions for staff working with the data. Reviews of data collection tools, indicators and data use products are also needed at regular intervals, and the data collection tools should generally be aligned with current international (e.g. WHO) standards within the health area. Improving some of these can require training of the core team or end users or technical assistance with DHIS2 configuration.
Expanding the scope of the DHIS2 implementation into new health areas or domains with aggregate data collection requires careful consideration of status and maturity of the foundational domains. Adding new domains, e.g. inclusion of additional health programmes, disease surveillance or community-level reporting (CHIS), puts additional demand on the foundation areas. If the foundational areas are already weak, the likelihood that the expansion will not be successful increases.
In general, the foundational domains should all be at minimum acceptable level before additional aggregate domains are implemented, i.e. scoring at least "Early progress" when using the Maturity Profile tool. When planning and budgeting implementation of new aggregate domains, it is critically important that the plans also provide for strengthening the foundational areas that are in need of improvement. It is important to keep in mind that even foundational areas that have previously been performing well may be negatively affected by additions of new aggregate reporting, and that this needs to be compensated for in the implementation plan. For example, a server/hosting arrangement that was previously sufficient may no longer be appropriate if hundreds of new users are introduced, and the model for end user training that works well for facility level users may no longer be appropriate if reporting from the community level is introduced.
There are different approaches to incorporating a new health domain into DHIS2. When DHIS2 is being introduced as a data collection tool, this can be done on the basis of an existing information flow and using existing primary data collection tools (e.g. paper registers and forms), or as part of a revision to the overall reporting system. Potentially, global metadata configuration packages may be used for parts of this process. Furthermore, another system may be used for data collection, and integrated in DHIS2 through an interoperability solution. These different scenarios have implications for the planning and budgeting. In general, a project to introduce new health areas into DHIS2 will require orientation meetings, a requirements gathering process, DHIS2 configuration, testing and training. In addition there are local costs associated with devices, salaries, training etc for the staff as described above.
Developing and implementing individual level/tracker systems can be more complicated than working with aggregated data. The system design may require more work and testing as it touches on concrete work processes and typically involves larger data sets and business logic. Additionally, there are more users, meaning a bigger need for training, devices and support.
The same cost categories as for aggregate systems apply for building and improving tracker systems. However, developing and implementing a tracker program requires the DHIS2 core team to work closely with the clinical staff to understand and fit their work processes. It is more time consuming to design and build a good tracker program both for the implementers and for the key personnel that are providing the requirements. Whether building a tracker programme from scratch or adapting a metadata configuration package, close collaboration with end users is needed. The tracker should be field tested in a realistic setting and adjusted based on the results from the testing. Remote guidance and onsite technical assistance can help in this process.
A tracker program typically affects a lot of users, and training of trainers, end user training and devices and connectivity are large budget posts. It is therefore generally more costly to add a new tracker programme than a new data set for aggregate reporting. In most cases, a tracker program needs to be costed per program.
More resources on considerations for tracker can be found in the tracker implementation guide.
In general, the foundational domains should all be at minimum acceptable level before additional tracker programs are implemented, i.e. scoring at least "Early progress", and preferably "Adequate" when using the Maturity Profile tool. No foundational areas in the maturity profile tool should have the score "Not yet achieved" before starting a tracker program, and DHIS2 security and compliance should always be at least "Adequate". As with aggregate systems, when planning and budgeting implementation of new individual data domains, it is critically important that the plans also provide for strengthening the foundational areas that are in need of improvement. The project plan should clearly identify actions to improve foundational pieces of DHIS2 while planning for new tracker programs. It is also key that the attention to aggregate reporting is not lost as a country embarks on advanced tracker programs - often it is the same personnel working on both.
This chapter provides a introduction to some of the key conceptual design principles behind the DHIS2 software. Understanding and being aware of these principles will help the implementer to make better use of the software when customising a local database. While this chapter introduces the principles, the following chapters will detail out how these are reflected in the database design process.
The following conceptual design principles will be presented in this chapter:
All meta data can be added and modified through the user interface
A flexible data model supports different data sources to be integrated in one single data repository
Data Input != Data Output
Indicator-driven data analysis and reporting
Maintain disaggregated facility-data in the database
Support data analysis at any level in the health system
In the following section each principle is described in more detail.
The DHIS2 application comes with a set of generic tools for data collection, validation, reporting and analysis, but the contents of the database, e.g. what data to collect, where the data comes from, and on what format, will depend on the context of use. These meta data need to be populated into the application before it can be used, and this can be done through the user interface and requires no programming. This allows for more direct involvement of the domain experts that understand the details of the HIS that the software will support.
The software separates the key meta data that describes the raw data being stored in the database, which is the critical meta data that should not change much over time (to avoid corrupting the data), and the higher level meta like indicator formulas, validation rules, and groups for aggregation as well as the various layouts for collection forms and reports, which are not that critical and can be changed over time without interfering with the raw data. As this higher level meta data can be added and modified over time without interfering with the raw data, a continuous customisation process is supported. Typically new features are added over time as the local implementation team learn to master more functionality, and the users are gradually pushing for more advanced data analysis and reporting outputs.
The DHIS2 design follows an integrated approach to HIS, and supports integration of many different data sources into one single database, sometime referred to as an integrated data repository or a data warehouse.
The fact that DHIS2 is a skeleton like tool without predefined forms or reports means that it can support a lot of different aggregate data sources. There is nothing really that limits the use to the health domain either, although use in other sectors are still very limited. As long as the data is collected by an orgunit (organisational unit), described as a data element (possibly with some disaggregation categories), and can be represented by a predefined period frequency, it can be collected and processed in DHIS2. This flexibility makes DHIS2 a powerful tool to set up integrated systems that bring together collection tools, indicators, and reports from multiple health programs, departments or initiatives. Once the data is defined and then collected or imported into a DHIS2 database, it can be analysed in correlation to any other data in the same database, no matter how and by whom it was collected. In addition to supporting integrated data analysis and reporting, this integrated approach also helps to rationalise data collection and reduce duplication.
In DHIS2 there are three dimensions that describe the aggregated data being collected and stored in the database; the where - organisation unit, the what - data element, and the when - period. The organisation unit, data element and period make up the three core dimensions that are needed to describe any data value in the DHIS2, whether it is in a data collection form, a chart, on a map, or in an aggregated summary report. When data is collected in an electronic data entry form, sometimes through a mirror image of the paper forms used at facility level, each entry field in the form can be described using these three dimensions. The form itself is just a tool to organise the data collection and is not describing the individual data values being collected and stored in the database. Being able to describe each data value independently through a Data Element definition (e.g. ‘Measles doses given \<1 year’) provides important flexibility when processing, validating, and analysing the data, and allows for comparison of data across collection forms and health programs.
This design or data model approach separates DHIS2 from many of the traditional HIS software applications which treat the data collection forms as the key unit of analysis. This is typical for systems tailored to vertical programs’ needs and the traditional conceptualisation of the collection form as also being the report or the analysis output. The figure below illustrates how the more fine-grained DHIS2 design built around the concept of Data Elements is different and how the input (data collection) is separated from the output (data analysis), supporting more flexible and varied data analysis and dissemination. The data element ‘Measles doses given \<1 y’ is collected as part of a Child Immunisation collection form, but can be used individually to build up an Indicator (a formula) called ‘Measles coverage \<1y’ where it is combined with the data element called ‘Population \<1y’, being collected through another collection form. This calculated Indicator value can then be used in data analysis in various reporting tools in DHIS2, e.g. custom designed reports with charts, pivot tables, or on a map in the GIS module.

What is referred to as a Data Element above, the key dimension that describes what is being collected, is sometimes referred to as an indicator in other settings. In DHIS2 we distinguish between Data Elements which describe the raw data, e.g. the counts being collected, and Indicators, which are formula-based and describe calculated values, e.g. coverage or incidence rates that are used for data analysis. Indicator values are not collected like the data (element) values, but instead calculated by the application based on formulas defined by the users. These formulas are made up of a factor (e.g. 1, 100, 100, 100 000), a numerator and a denominator, the two latter are both expressions based on one or more data elements. E.g. the indicator "Measles coverage \<1 year" is defined a formula with a factor 100, a numerator ("Measles doses given to children under 1 year") and a denominator ("Target population under 1 year"). The indicator "DPT1 to DPT3 drop out rate" is a formula of 100 % x ("DPT1 doses given"- "DPT3doses given") / ("DPT1 doses given"). These formulas can be added and edited through the user interface by a user with limited training, as they are quite easy to set up and do not interfere with the data values stored in the database (so adding or modifying an indicator is not a critical operation).
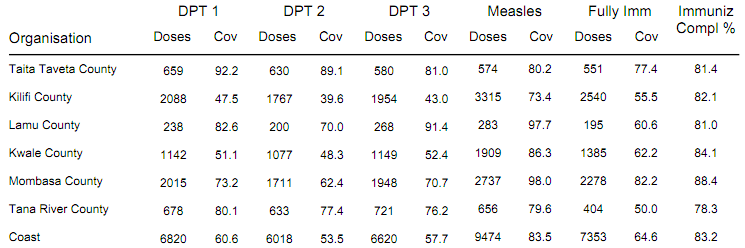
Indicators represent perhaps the most powerful data analysis feature of the DHIS2, and all reporting tools support the use of indicators, e.g. as displayed in the custom report in the figure above. Being able to use population data in the denominator enables comparisons of health performance across geographical areas with different target populations, which is more useful than only looking at the raw numbers. The table below uses both the raw data values (Doses) and indicator values (Cov) for the different vaccines. Comparing e.g. the two first orgunits in the list, Taita Taveta County and Kilifi County, on DPT-1 immunisation, we can see that while the raw numbers (659 vs 2088) indicate many more doses are given in Kilifi, the coverage rates (92.2 % vs 47.5 %) show that Taita Taveta are doing a better job immunising their target population under 1 year. Looking at the final column (Immuniz. Compl. %) which indicates the completeness of reporting of the immunisation form for the same period, we can see that the numbers are more or less the same in the two counties we compared, which tells us that the coverage rates can be reasonably compared across the two counties.
When data is collected and stored in DHIS2 it will remain disaggregated in the database with the same level of detail as it was collected. This is a major advantage of having a database system for HIS as supposed to a paper-based or even spreadsheet based system. The system is designed to store large amounts of data and always allow drill-downs to the finest level of detail possible, which is only limited by how the data was collected or imported into the DHIS2 database. In a perspective of a national HIS it is desired to keep the data disaggregated by health facility level, which is often the lowest level in the orgunit hierarchy. This can be done even without computerising this level, through a hybrid system of paper and computer. The data can be submitted from health facilities to e.g. district offices by paper (e.g. on monthly summary forms for one specific facility), and then at the district office they enter all the facility data into the DHIS2 through the electronic data collection forms, one facility at a time. This will enable the districts health management teams to perform facility-wise data analysis and to e.g. provide print-outs of feedback reports generated by the DHIS2, incl. facility comparisons, to the facility in-charges in their district.
While the name DHIS2 indicates a focus on the District, the application provides the same tools and functionality to all levels in the health system. In all the reporting tools the users can select which orgunit or orgunit level to analyse and the data displayed will be automatically aggregated up to the selected level. The DHIS2 uses the orgunit hierarchy in aggregating data upwards and provides data by any orgunit in this hierarchy. Most of the reports are run in such a way that the users will be prompted to select an orgunit and thereby enable reuse of the same report layouts for all levels. Or if desired, the report layouts can be tailored to any specific level in the health system if the needs differ between the levels.
In the GIS module the users can analyse data on e.g. the sub-national level and then by clicking on the map (on e.g. a region or province) drill down to the next level, and continue like this all the way down to the source of the data at facility level. Similar drill-down functionality is provided in the Excel Pivot Tables that are linked to the DHIS2 database.
To speed up performance and reduce the response-time when providing aggregated data outputs, which may include many calculations (e.g. adding together 8000 facilities), DHIS2 pre-calculates all the possible aggregate values and stores these in what is called a data mart. This data mart can be scheduled to run (re-built) at a given time interval, e.g. every night.
The DHIS2 application comes with a set of tools for data collection, validation, reporting and analysis, but the contents of the database, e.g. what data to collect, where the data comes from, and on what format will depend on the context of use. These meta data need to be populated into the application before it can be used, and this can be done through the user interface and requires no programming. What is required is in-depth knowledge about the local HIS context as well as an understanding of the DHIS2 design principles (see the chapter “Key conceptual design principles in DHIS2”). We call this initial process database design or customisation. This chapter provides an overview of the customisation process and briefly explains the steps involved, in order to give the implementer a feeling of what this process requires. Other chapters in this manual provide a lot more detail into some of the specific steps.
The following section describes a list of tips for getting off to a good start when developing a new database.
Quickly populate a demo database, incl. examples of reports, charts, dashboard, GIS, data entry forms. Use real data, ideally nation-wide, but not necessarily facility-level data.
Put the demo database online. Server hosting with an external provider server can be a solution to speed up the process, even if temporary. This makes a great collaborative platform and dissemination tool to get buy-in from stakeholders.
The next phase is a more elaborate database design process. Parts of the demo can be reused if viable.
Make sure to have a local team with different skills and background: public health, data administrator, IT and project management.
Use the customisation and database design phase as a learning and training process to build local capacity through learning-by-doing.
The country national team should drive the database design process but be supported and guided by experienced implementers.
As the DHIS2 customisation process often is and should be a collaborative process, it is also important to have in mind which parts of the database are more critical than others, e.g. to avoid an untrained user to corrupt the data. Typically it is a lot more critical to customise a database which already has data values, than working with meta data on an “empty” database. Although it might seem strange, much customisation takes place after the first data collection or import has started, e.g. when adding new validation rules, indicators or report layouts. The most critical mistake that can be made is to modify the meta data that directly describes the data values, and these as we have seen above, are the data elements and the organisation units. When modifying these definitions it is important to think about how the change will affect the meaning of the data values already in the system (collected using the old definitions). It is recommended to limit who can edit these core meta data through the user role management, to restrict the access to a core customisation team.
Other parts of the system that are not directly coupled to the data values are a lot less critical to play around with, and here, at least in the early phases, one should encourage the users to try out new things in order to create learning. This goes for groups, validation rules, indicator formulas, charts, and reports. All these can easily be deleted or modified later without affecting the underlying data values, and therefore are not critical elements in the customisation process.
Of course, later in the customisation process when going into a production phase, one should be even more careful in allowing access to edit the various meta data, as any change, also to the less critical meta data, might affect how data is aggregated together or presented in a report (although the underlying raw data is still safe and correct).
The following section describes concrete steps for developing a database from scratch.
The organisational hierarchy defines the organisation using the DHIS2, the health facilities, administrative areas and other geographical areas used in data collection and data analysis. This dimension to the data is defined as a hierarchy with one root unit (e.g. Ministry of Health) and any number of levels and nodes below. Each node in this hierarchy is called an organisational unit in DHIS2. The design of this hierarchy will determine the geographical units of analysis available to the users as data is collected and aggregated in this structure. There can only be one organisational hierarchy at the same time so its structure needs careful consideration.
Additional hierarchies (e.g. parallel administrative boundaries to the health care sector) can be modelled using organisational groups and group sets, but the organisational hierarchy is the main vehicle for data aggregation on the geographical dimension. Typically national organisational hierarchies in public health have 4-6 levels, but any number of levels is supported. The hierarchy is built up of parent-child relations, e.g. a Country or MoH unit (the root) might have e.g. 8 child units (provinces), and each province again ( at level 2) might have 10-15 districts as their children. Normally the health facilities will be located at the lowest level, but they can also be located at higher levels, e.g. national or provincial hospitals, so skewed organisational trees are supported (e.g. a leaf node can be positioned at level 2 while most other leaf nodes are at level 5).
The Data Element is perhaps the most important building block of a DHIS2 database. It represents the what dimension, it explains what is being collected or analysed. In some contexts, this is referred to an indicator, but in DHIS2 we call this unit of collection and analysis a data element. The data element often represents a count of something, and its name describes what is being counted, e.g. "BCG doses given" or "Malaria cases". When data is collected, validated, analysed, reported or presented it is the data elements or expressions built upon data elements that describe the WHAT of the data. As such the data elements become important for all aspects of the system and they decide not only how data is collected, but more importantly how the data values are represented in the database, which again decides how data can be analysed and presented.
A best practice when designing data elements is to think of data elements as a unit of data analysis and not just as a field in the data collection form. Each data element lives on its own in the database, completely detached from the collection form, and reports and other outputs are based on data elements and expressions/formulas composed of data elements and not the data collection forms. So the data analysis needs should drive the process, and not the look and feel of the data collection forms.
All data entry in DHIS2 is organised through the use of data sets. A data set is a collection of data elements grouped together for data collection, and in the case of distributed installs they also define chunks of data for export and import between instances of DHIS2 (e.g. from a district office local installation to a national server). Data sets are not linked directly to the data values, only through their data elements and frequencies, and as such a data set can be modified, deleted or added at any point in time without affecting the raw data already captured in the system, but such changes will of course affect how new data will be collected.
Once you have assigned a data set to an organisation unit that data set will be made available in Data Entry (under Services) for the organisation units you have assigned it to and for the valid periods according to the data set's period type. A default data entry form will then be shown, which is simply a list of the data elements belonging to the data set together with a column for inputting the values. If your data set contains data elements with categories such as age groups or gender, then additional columns will be automatically generated in the default form based on the categories. In addition to the default list-based data entry form, there are two more alternatives, the section-based form and the custom form. Section forms allow for a bit more flexibility when it comes to using tabular forms and are quick and simple to design. Often your data entry form will need multiple tables with subheadings, and sometimes you need to disable (grey out) a few fields in the table (e.g. some categories do not apply to all data elements), both of these functions are supported in section forms. When the form you want to design is too complicated for the default or section forms then your last option is to use a custom form. This takes more time but gives you full flexibility in term of the design. In DHIS2 there is a built in HTML editor (FcK Editor) for the form designer and you can either design the form in the UI or paste in your html directly (using the Source window in the editor.
Once you have set up the data entry part of the system and started to collect data then there is time to define data quality checks that help to improve the quality of the data being collected. You can add as many validation rules as you like and these are composed of left and right side expressions that again are composed of data elements, with an operator between the two sides. Typical rules are comparing subtotals to totals of something. E.g. if you have two data elements "HIV tests taken" and "HIV test result positive" then you know that in the same form (for the same period and organisational unit) the total number of tests must always be equal or higher than the number of positive tests. These rules should be absolute rules meaning that they are mathematically correct and not just assumptions or "most of the time correct". The rules can be run in data entry, after filling each form, or as a more batch like process on multiple forms at the same time, e.g. for all facilities for the previous reporting month. The results of the tests will list all violations and the detailed values for each side of the expression where the violation occurred to make it easy to go back to data entry and correct the values.
Indicators represent perhaps the most powerful data analysis feature of the DHIS2. While data elements represent the raw data (counts) being collected the indicators represent formulas providing coverage rates, incidence rates, ratios and other formula-based units of analysis. An indicator is made up of a factor (e.g. 1, 100, 100, 100 000), a numerator and a denominator, the two latter are both expressions based on one or more data elements. E.g. the indicator "BCG coverage \<1 year" is defined a formula with a factor 100, a numerator ("BCG doses given to children under 1 year") and a denominator ("Target population under 1 year"). The indicator "DPT1 to DPT3 drop out rate" is a formula of 100 % x ("DPT1 doses given"- "DPT3 doses given") / ("DPT1 doses given").
Most report modules in DHIS2 support both data elements and indicators and you can also combine these in custom reports, but the important difference and strength of indicators versus raw data (data element's data values) is the ability to compare data across different geographical areas (e.g. highly populated vs rural areas) as the target population can be used in the denominator.
Indicators can be added, modified and deleted at any point in time without interfering with the data values in the database.
Standard reports in DHIS2 is a very flexible way of presenting the data that has been collected. Data can be aggregated by any organisational unit or orgunit level, by data element, by indicators, as well as over time (e.g. monthly, quarterly, yearly). The report tables are custom data sources for the standard reports and can be flexibly defined in the user interface and later accessed in external report designers such as iReport or BIRT. These report designs can then be set up as easily accessible one-click reports with parameters so that the users can run the same reports e.g. every month when new data is entered, and also be relevant to users at all levels as the organisational unit can be selected at the time of running the report.
In the integrated GIS module you can easily display your data on maps, both on polygons (areas) and as points (health facilities), and either as data elements or indicators. By providing the coordinates of your organisational units to the system you can quickly get up to speed with this module. See the GIS section for details on how to get started.
One of the easiest way to display your indicator data is through charts. An easy to use chart dialogue will guide you through the creation of various types of charts with data on indicators, organisational units and periods of your choice. These charts can easily be added to one of the four chart sections on your dashboard and there be made easily available right after log in. Make sure to set the dashboard module as the start module in user settings.
The purpose of these guidelines is to assist DHIS2 implementers and system owners to take reasonable and appropriate measures to identify and manage the risks associated with running the DHIS2 system. The hope is that it will be particularly useful for system owners who might otherwise struggle to define and impose technical constraints on implementers.
DHIS2 is implemented by many different types of organisations at different scales and for different purposes. The primary system owner in mind here is a government health department or ministry, but many of the guiding principles should also be applicable to NGOs and private sector organisations.
The DHIS2, as a web-based system, reaches its maximum potential when it is accessible over the open internet by health workers using whatever devices might be available to them and through whatever internet connectivity providers are available (eg. 4G mobile phone systems). We have seen how when using such an open model it is possible to roll-out national systems across countries and programs over a matter of months rather than years.
Unfortunately, over the same period we have also seen a rising threat to internet based systems from both criminal and state actors. Attacks have become more frequent and more sophisticated. The need to be more rigorous and street smart is much more apparent now than when the first web-based versions of DHIS2 were being rolled out 10 years ago.
Comprehensive security practice is concerned with CONFIDENTIALITY, INTEGRITY and AVAILABILITY of data.
The DHIS2 has been remarkably successful in being adapted and sustained in many countries as the national health information system, typically as the aggregate routine reporting system. Whereas the confidentiality of routine data is arguably a not very important concern, the integrity and availability of the data becomes more important as the system becomes more institutionalised over time. The impact of data loss in particular becomes more serious.
The nature of the data collected in DHIS2 has also become more sensitive. Increasingly a DHIS2 database will contain a significant amount of personal identifiable information (PII) or personal data. This can be patient demographic data, but also health worker personal data (email, telephone, address, messages) captured as User information. Adequate measures need to be in place to protect the confidentiality of such data and the privacy of the persons involved.
There are no universal set of laws, practices and principles which apply everywhere. The dominant recent legislation regarding privacy in countries of the European Union, for example, is the GDPR (General Data Protection Regulation, in force from May 2018). This legislation introduces a set of guiding principles and accompanying terminology which differs in scope, justificatory narrative and intent from the U.S. HIPAA (Health Insurance Portability and Accountability Act), which is the primary legislation governing health data in that country.
These are both relatively new and complex pieces of legislation. Countries where DHIS2 is being used are generally not subject to either HIPAA or GDPR compliance, but many have developed or are developing national legislation in the area - for example the Protection Of Personal Information Act 2013 in South Africa, and the Personal Data Protection Bill, 2019 (draft) in India. Implementers and system owners should make the effort to familiarize themselves fully with the legislation in their jurisdiction of use. The UNCTAD maintains a page with up-to-date privacy legislation for each country across the world.
For public sector systems (perhaps the majority of cases of DHIS2 usage) there might be additional policies and standard operating procedures related to the security of systems and data which also carry the weight of law.
In most cases, pleading ignorance of the law is not a defense.
Operating outside the context of any relevant legislation and policy is difficult, but in contexts where the existing regulatory environment is outdated or not adequate, appropriate controls need to be established by consensus within the scope of the DHIS2 system itself.
It is a characteristic of "advanced" capitalist economies that there is a highly developed division of labor. We see this clearly in the IT sector in Europe and the US where there are very clear distinctions between system administrators, programmers, network engineers, information end users as well as highly developed IT management structures, roles and practices, particularly in large organisations.
It is foolish to expect to find the same sort of structures and roles in all countries, particularly where the DHIS2 might be the first, or at least the most important, national system in a national health ministry. Implementing a complex web-based system like DHIS2 without a relatively modern base of management and skilled labor brings with it unique risks and challenges. Developing the appropriate organisational forms to manage the risk and allow the system to flourish and sustain is at least as important as any technical considerations.
The challenge is exacerbated where there is a complex mix of government departments, partner organisations and donors, all of whom might not share the same perspectives and priorities regarding security and privacy.
In the face of the organisational challenges that system owners might face, it becomes more important, rather than less so, for the system owners to develop an appropriate plan to manage the security of the system. What follows is a small collection of practical advice.
Having a security management plan is the first step to asserting any sort of ownership over the system. Where the ministry of health is a passive user of the system developed and managed by partner organisations they are not asserting ownership.
Security is a management issue. You cannot delegate it to the lowliest, most technical person in the organisation (common!) nor can you outsource it to a technical partner (also common). You will almost certainly lean on these resources but the motivation should be driven from management.
In an ideal world there might be a chief security officer (CSO) with professional background in some of the many security and governance frameworks (TOGAF, ITIL, ISO27000x etc). It is much more likely that this will not be the case and people need to make a more agile plan with what resources they have. Improvisation can be key. Having a bad, or at least poorly developed, plan for managing security is much better than having no plan at all. A weak plan can be improved and further developed.
We recommend that organisations adopt some of the methodology of the likes of ISO27002 (Information Security Management) without necessarily embarking on a route towards ISO27000 compliance. At a very minimum this would imply that:
1. You have a high level statement summarising your organisation\'s security posture. A one pager which should highlight principles and intentions and signal the commitment of senior management to the process.
2. You have clearly identified someone (reasonably senior) in the team who will take on the role of developing, maintaining and implementing the security plan. We can call it the security manager.
3. The security manager is committed to a process of identifying, documenting and mitigating risks. This is an ongoing process which generally revolves around the maintenance of a risk register which is subject to regular review.
4. There is a process in place (including time and budget) for regular internal and/or external audit of the DHIS2 deployment, configuration and metadata, including the organization\'s security plan.
5. There is a Data Sharing Agreement among the parties that define what data is handled, for what purpose and how, setting clear limits and boundaries to avoid the breach of patient data, as well as protecting the integrity and confidentiality of data.
6. Data and technical ownership is established for the DHIS2 system.
Many of the other artifacts and processes envisaged in a framework like ISO 27000 could emerge naturally from this cycle. For example, if there is no disaster recovery plan or backup strategy that would be highlighted as a major risk in the register. Assembling and maintaining a register like this allows the team to identify and prioritize tasks which need to be done and assess progress towards achieving a better posture.
As a minimum, the following documents should be created as first step of any security program: - Asset inventory - Risk assessment/Risk register document - Backup policy - Disaster Recovery policy - Incident Response plan - Identity and Access Management plan
To help implementers to kick-start their security programs, we have developed a set of templates anyone can use and adapt to their own needs, called Security Starter Kit.
There are also a number of measures which can be taken to improve security at the level of DHIS2 configuration, for example related to ensuring appropriate system and data access. A proposed high priority (top 10) list of system configuration measures are included here:
System administration
1. There is a limited number (less than 5) of people with superuser (full) access to the system. Can easily be assessed through the API:
/api/users.json?filter=userCredentials.userRoles.authorities:!in:[_ALL_]&filter=userCredentials.userRoles.authorities:in:\[ALL]2. System administrators are only given authority to perform functions that are relevant for their system administration roles. For example, an administrator responsible for managing charts and dashboards does not need rights to edit organisation units.
3. The default DHIS2 user account (username "admin") is deleted or disabled. The admin account should only be used when DHIS2 is started for the first time, to set up a personal superuser. It should then be disabled and/or deleted. The status of the admin account can be verified using the API:
/api/users.json?filter=userCredentials.username:eq:admin&fields=name,userCredentials\[name,disabled\]
User management
4. There are procedures in place to disable or remove user accounts of people who leave the service. There should be clear procedures in place to disable/delete user accounts of people who leave the (health) service. Some indication of this can be derived from the API, by looking at user accounts that are not disabled and have not logged in to the system e.g. in the current year:
/api/users.json?filter=userCredentials.disabled:eq:false&filter=userCredentials.lastLogin:lt:20215. All user accounts in the system are personal, i.e. not shared by several individuals. User accounts should not be shared by several individuals, as this makes auditing impossible. This is especially critical if Tracker is used for individual-level data.
6. There are clearly defined user roles and user groups, with guidance on what roles and groups should be used according to the positions within the (health) service of the user.
7. If self-registration of users is enabled, the user role given to these users should be very limited, e.g. to only viewing public dashboards.
8. Disabling accounts might be a good way to limit the access to some users that have been forgotten in the system. DHIS2 provides a scheduled task to automate this. However, be aware that this might have consequences (leading to data loss) while using Android devices as explained in the official documentation.
Tracker
9. Access to Tracker data is limited to users with a legitimate need for the edit/view the data through appropriate use of sharing and user groups. No tracker programmes intended for use to record information on individual persons are configured with public access. Tracker data is typically linked to individuals, and should therefore be restricted to users with a legitimate use of this data. While it might be a good idea that aggregate data is accessible to all users, this is not the case with Tracker data.
10. Tracker programmes are configured so that users can only search for and access data for people they have a legitimate reason for viewing. For example, a user working within one health facility should not be assigned to a district. The "tracked entity search organisation unit" should not be set broader than what is practically necessary, if used.
Android
Using mobile devices (Android) in DHIS2 is becoming more common due to their offline and last-mile capabilities. However it comes with additional requirements to look at from the security perspective as the exposure increases passing from one server containing information to multiple devices that might contain sensitive information.
If sensitive information is being stored in the devices, concern should be raised via training and/or documentation. And system administrators might want to enable different measures that could help reduce the risks for which the Android Settings Web App (ASWA) is available.
The ASWA allows system administrators (among other things) to:
- Force the DHIS2 local database encryption on the devices to prevent the leak of data by malicious actors in case of having access to a device.
- Allowing/disallowing the screenshot capabilities reduces (but not limits) the risk of leaking confidential information.
A section of the official documentation (DHIS2 Android App) describes all these in detail.
On top of this the Android application might be individually configured to ask for a PIN code as another layer of security to the username/password pair.
In implementations where risk of devices being lost/stolen exists, system administrators might want to add another layer of security brought by tools like Mobile Device Management which could allow remote wiping, location, etc. A specific guide is available in the official documentation: managing mobile devices.
There are many ways that a DHIS2 system can be provisioned, including on different physical environments (on-premises, co-location, private cloud, public cloud) using different operating systems, using containers, load-sharing, replication etc. There are different detailed sets of security controls which can and should be applied depending on these design choices which are made in provisioning.
In the most general sense we can that there should be:
Organisations such as the Centre for Internet Security (https://cisecurity.org) maintain detailed benchmarks for software products which can be used to compile a set of controls for your implementation. In most cases you won\'t apply all of them but will select the ones which are most relevant. From the list available at https://www.cisecurity.org/cis-benchmarks/ you should download and study the benchmarks for Apache Tomcat, Postgresql, nginx (or Apache2). In addition, depending on your technology choices you might find benchmarks for Ubuntu linux, lxd, Docker or Microsoft Windows relevant to your implementation.
A proposed high priority (top 10) list of technical measures that should be in place:
1. Operating system is a LTS (long term service edition).
2. There is an automatic process for applying OS security patches.
3. Host and/or network based firewall configured exposing only the necessary services to the network.
4. Administrative access to DHIS2 server is via SSH according to agreed good practices - keys authentication only, no root access, explicit users allowlist, low number of max authentication attempts.
5. DHIS2 version is not more than 3 versions behind the latest release. Process exists to apply patch releases regularly.
6. Automated backup system is in place and regularly tested, including offsite.
7. Postgres and system users follow the least privilege principle: allow only minimal permissions and access.
8. DHIS2 is exposed via a web-proxy server configured with TLS/SSL (must score a minimum of A in ssllabs).
9. Database data is in a separate location (data partition, hard disk, cloud storage, etc) allowing encryption at rest.
10. Monitoring and alerting systems are in place for system metrics (CPU, memory, disk, network, database, web proxy at minimum) with adequate authentication mechanisms (e.g. 2FA, SSO, strong password requirements) and role based access.
This chapter outlines the challenges of setting up a DHIS2 system in production. It describes various approaches that we commonly see in practice and looks critically at the advantages and disadvantages of each. It aims to provide practical and pragmatic advice to organisations planning a DHIS2 implementation. The document refers to a national Ministry of Health (MOH) as the typical system owner, but most of the considerations apply to other types of organisations as well.
DHIS2 is a database backed java web application which can be setup to run very simply, using just a java servlet engine such as tomcat or jetty and a postgresql database server. A person with reasonable technical ability can read the DHIS2 reference guide and setup the two packages and the database connection between them relatively simply on a laptop machine. This type of setup is quite common for developers or people who just want to try DHIS2 out locally and see what it looks like. The DHIS2 web application file (the WAR file) is downloaded from the https://dhis2.org/downloads page, the database connection is configured in dhis.conf and the DHIS2 application is accessed via a web browser connecting to the running tomcat server.

Setting up and running DHIS2 in production involves a lot more than just the connected software components. Hardware resources need to be provisioned and managed. Software needs to be installed with security, performance and maintainability in mind. In most cases there will be more than one DHIS2 system and potentially other systems within the architecture. Account needs to be taken of the surrounding infrastructure (monitoring systems, messaging systems, interoperability components etc). Most importantly, a considerable mix of technical skills and experience (warmware) are required to design, install and manage the system.
Planning for a DHIS2 server that is running in a production environment is a much more detailed and extensive exercise due to the fact that: - the application will typically need to be continuously available 24x7 with very little scheduled or unscheduled downtime - the data it will hold is valuable and potentially sensitive - large sites may have tens of thousands of users and millions of records - the system will need to be actively maintained and updated over many years
All of the above give rise to quite complex requirements regarding physical infrastructure, security and performance constraints and a broad range of technical skill, none of which are immediately visible when viewing the simple architecture above. It is essential that the server implementation is properly planned for when an implementation is in its planning stage in order to be able to mobilize the physical and human resources to meet these requirements.
Its always useful to have security in mind at the outset. Practically this might mean that you have budgeted for: 1. a security officer as part of the core team. A major part of the role of the security officer will be to make a security management plan, eg. following the guidelines of ISO27001. 2. internal or preferably external audit of the system annually. There is more detail on security in this guide in its own section.
The detailed considerations here should derive from the security plan and be setup according to the installation process. We draw special attention here because, in our experience over the years, the most common "disasters" we see relate to inadequate backups, often leading to irrevocable data loss.
Important aspects of the backup plan to consider are 1. What are the point in time recovery targets (how much data can you afford to lose) 2. Automation. A backup plan which is dependent on human intervention to take the backups is not a reliable plan 3. Offsite archiving. Storing backups on the same machine has some value but consideration needs to made for the possibility of catastrophic failure of the machine (or nearby machines). This includes cloud Virtual Machines. Also the cost of high speed disk capacity. For those who can, offsite archiving using object storage (S3 compatible) is now available from a range of cloud providers and is generally the cheapest and simplest way to deal with archiving. 4. Testing. Backups need to be periodically tested (preferably automated) to ensure that those files you believe to be backups are actually good backups.
There are other aspects to the backup plan, but the important point to make is that it should be a serious consideration at the start of a project rather than an afterthought. There always budgetary trade-offs to be made, so any backup plan should be properly costed taking into account retention requirements vs budget.
One of the more important parts of your plan will involve making decisions on the physical environment your servers will be running in. The first broad choice is between owning your own equipment and hosting facility or making use of a cloud service provider and paying for the use of resources and potentially other services such as application management. There is no right or wrong answer and how you choose will be determined by factors such as cost, available skills, existing infrastructure, regulatory compliance etc. DHIS2 has been successfully implemented using a variety of deployment models, though each one comes with its own set of risks and challenges. In this section we offer a few thoughts on each and end with a brief summary table of factors to consider.
This slightly tongue-in-cheek description refers to organisations which purchase server equipment and set it up in a server room in the building. Having everything close-at-hand maximizes the sense of control over the resources, but with control comes greater responsibility.
This approach is by far the hardest to get right. Typical challenges include:
The architectural considerations alone make it quite an expensive proposition. Placing server class equipment and racks into an unregulated environment will shorten workable life and void warranties.
Because of the costs and risk involved, in most cases we would not advise going this route. There is also a larger mix of technical skills required, including data centre engineering, network and security engineering which can be avoided using one of the approaches below.
Acknowledging the difficulties above, many countries have a strategy of concentrating the hosting requirements either into government-wide or ministry-wide purpose built data centres.
Some countries have successfully made use of local data centre providers to either host physical servers (co-location) or to rent virtual resources. This approach has the advantage of meeting requirements around geo-location of data (eg. all data must be stored in the country). Also government tends to have greater leverage over such companies than with large global commercial providers - they are less likely to be cut off when payment of the bill is late!
Potential risks with this approach are: - due to economies of scale, local hosting tends to be more expensive than global cloud companies - where government has mandated that a particular company be used as the "preferred provider" there are often problems with performance and customer service
| Approach | Description | Cost | Skills | Security |
|---|---|---|---|---|
| In the basement | Server is installed in the ministry, typically in a re-purposed room | Setup costs can be high, getting the room up to standard regarding power, aircon etc | High level of skill required ranging from system admin, network admin and data centre knowledge | Physical and network security are additional challenges |
| National government data centre | MOH applications are hosted in a purpose builty data centre managed as a cross-government service | Cost to the MOH varies according to the cost recovery mechanisms of the data centre. Ranges from zero to considerably higher than commercial cloud | Skills required by to run the system limited to system administration. Dependency that other skills related to networks and virtual machine management and provisioning are available at the data centre | Security concerns are shared across implementers and data centre provider |
| Commercial cloud 1 (Infrastructure as a service) | MOH has an account with a commercial cloud company and pays for the use of server resources | Generally the lowest cost option. Considerable variation of pricing plans across the market | Mostly just sysadmin skills required to setup and run the system. Management processes need to be in place to manage the budget and ensure bills are paid. | Security concerns are shared across implementers and cloud provider |
| Commercial cloud 2 (Software as service) | MOH has an account with a commercial cloud company which offers DHIS2-as-a-service | More expensive than infrastructure as a service, but no need to pay for expensive system administrator salaries | Management processes need to be in place to manage the budget and ensure bills are paid | Most security concerns are managed by the service provider |
DHIS2 is a relatively complex system to administer. The system administration team will need expertise and experience in: - ubuntu linux - Apache2 or nginx web proxy - Apache tomcat - Postgresql database If this experience is not available in-house, the ministry would be well advised to outsource some of the management to a local entity with such a skills portfolio, even if this is seen as a transitory arrangement.
Beyond installation, the ongoing activities typically consists of : 1. provisioning of staging/test/training instances as required 2. monitoring performance and tuning the software to suit 3. managing and testing backups 4. patching (typical frequency 4-6 weeks) of minor version upgrades 5. plan and execute major DHIS2 instance upgrade (annually) 6. major operating system/database server upgrades (every 2-3 years)
UIO can provide training on the overall architecture and all things DHIS2-specific and also link the maintainers into the global community of practice in DHIS2 system administration. Note that there are pre-requisite requirements in terms of the skills listed above. It is not practical or sensible to depend on system administrators who do not have the requisite experience.
There are a number of resources made available by the UIO team to aid in installation:
This chapter will discuss the role and place of the DHIS2 application in a system architecture context. It will show that DHIS2 can serve the purpose of both a data warehouse and an operational system.
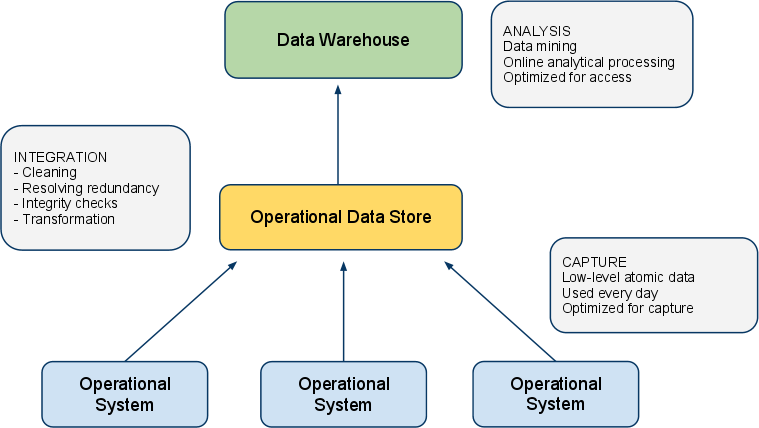
A data warehouse is commonly understood as a database used for analysis. Typically data is uploaded from various operational / transactional systems. Before data is loaded into the data warehouse it usually goes through various stages where it is cleaned for anomalies and redundancy and transformed to conform with the overall structure of the integrated database. Data is then made available for use by analysis, also known under terms such as*data mining*and online analytical processing. The data warehouse design is optimized for speed of data retrieval and analysis. To improve performance the data storage is often redundant in the sense that the data is stored both in its most granular form and in an aggregated (summarized) form.
A transactional system (or operational system from a data warehouse perspective) is a system that collects, stores and modifies low level data. This system is typically used on a day-to-day basis for data entry and validation. The design is optimized for fast insert and update performance.
There are several benefits of maintaining a data warehouse, some of them being:
Consistency: It provides a common data model for all relevant data and acts as an abstraction over a potentially high number of data sources and feeding systems which makes it a lot easier to perform analysis.
Reliability: It is detached from the sources where the data originated from and is hence not affected if data in the operational systems are purged or lost.
Analysis performance: It is designed for maximum performance for data retrieval and analysis in contrast to operational systems which are often optimized for data capture.
There are however also significant challenges with a data warehouse approach:
High cost: There is a high cost associated with moving data from various sources into a common data warehouse, especially when the operational systems are not similar in nature. Often long-term existing systems (referred to as legacy systems) put heavy constraints on the data transformation process.
Data validity: The process of moving data into the data warehouse is often complex and hence often not performed at regular and timely intervals. This will then leave the data users with out-dated and irrelevant data not suitable for planning and informed decision making.
Due to the mentioned challenges, it has lately become increasingly popular to merge the functions of the data warehouse and operational system, either into a single system which performs both tasks or with tightly integrated systems hosted together. With this approach, the system provides functionality for data capture and validation as well as data analysis and manages the process of converting low-level atomic data into aggregate data suitable for analysis. This sets high standards for the system and its design as it must provide appropriate performance for both of those functions; however, advances in hardware and parallel processing is increasingly making such an approach feasible.
In this regard, the DHIS2 application is designed to serve as a tool for both data capture, validation, analysis and presentation of data. It provides modules for all of the mentioned aspects, including data entry functionality and a wide array of analysis tools such as reports, charts, maps, pivot tables and dashboard.
In addition, DHIS2 is a part of a suite of interoperable health information systems which covers a wide range of needs and are all open-source software. DHIS2 implements the standard for data and meta-data exchange in the health domain called SDMX-HD. There are many examples of operational systems which also implements this standard and potentially can feed data into DHIS2:
iHRIS: System for management of human resource data. Examples of data which is relevant for a national data warehouse captured by this system is "number of doctors", "number of nurses" and "total number of staff". This data is interesting to compare for instance to district performance.
OpenMRS: Medical record system being used at hospital. This system can potentially aggregate and export data on inpatient diseases to a national data warehouse.
OpenELIS: Laboratory enterprise information system. This system can generate and export data on number and outcome of laboratory tests.

The analysis tools in DHIS2 read aggregated data from data mart tables. A data mart is a data store optimized for meeting the most common user requests for data analysis. The DHIS2 data mart contains data aggregated in the*space dimension* (the organisation unit hierarchy), time dimension (over multiple periods) and for indicator formulas (mathematical expressions including data elements). Retrieving data directly from data marts provides good performance even in high-concurrency environments since most requests for analysis can be served with a single, simple database query against the data mart. The aggregation engine in DHIS2 is capable of processing low-level data in the multi-millions and managing most national-level databases, and it can be said to provide near real-time access to aggregate data.
DHIS2 allows for setting up scheduled aggregation tasks which typically will refresh and populate the data mart with aggregated data every night. You can choose between aggregating data for the last 12 months every night, or aggregate data for the last 6 months every night and the last 6 to 12 months every Saturday. The scheduled tasks can be configured under "Scheduling" in "Data administration" module. It is also possible to execute arbitrary data mart tasks under "Data mart" in "Reports" module.
There are two leading approaches for storing data in a data warehouse, namely the normalized and dimensional approach. DHIS2 lends a bit from the former but mostly from the latter. In the dimensional approach, the data is partitioned into dimensions and facts. Facts generally refer to transactional numeric data while dimensions are the reference data that gives context and meaning to the data. The strict rules of this approach make it easy for users to understand the data warehouse structure and provides for good performance since few tables must be combined to produce meaningful analysis, while it, on the other hand, might make the system less flexible and harder to change.
In DHIS2 the facts correspond to the data value object in the data model. The data value captures data as numbers, yes/no or text. The compulsory dimensions which give meaning to the facts are the data element, organisation unit hierarchy and period dimensions. These dimensions are referred to as compulsory since they must be provided for all stored data records. DHIS2 also has a custom dimensional model which makes it possible to represent any kind of dimensionality. This model must be defined prior to data capture. DHIS2 also has a flexible model of groups and group sets which makes it possible to add custom dimensionality to the compulsory dimensions after data capture has taken place. You can read more about dimensionality in DHIS2 in the chapter by the same name.

DHIS2 can be perceived as a platform on several levels. First, the application database is designed ground-up with flexibility in mind. Data structures such as data elements, organisation units, forms and user roles can be defined completely freely through the application user interface. This makes it possible for the system to be adapted to a multitude of local contexts and use-cases. We have seen that DHIS2 supports most major requirements for routine data capture and analysis emerging in country implementations. It also makes it possible for DHIS2 to serve as a management system for domains such as logistics, labs and finance.
Second, due to the modular design of DHIS2 it can be extended with additional software modules. These software modules can live side by side with the core modules of DHIS2 and can be integrated into the DHIS2 portal and menu system. This is a powerful feature as it makes it possible to extend the system with extra functionality when needed, typically for country specific requirements as earlier pointed out.
The downside of the software module extensibility is that it puts several constraints on the development process. The developers creating the extra functionality are limited to the DHIS2 technology in terms of programming language and software frameworks, in addition to the constraints put on the design of modules by the DHIS2 portal solution. Also, these modules must be included in the DHIS2 software when the software is built and deployed on the web server, not dynamically during run-time.
In order to overcome these limitations and achieve a looser coupling between the DHIS2 service layer and additional software artifacts, the DHIS2 development team decided to create a Web API. This Web API complies with the rules of the REST architectural style. This implies that:
The Web API provides a navigable and machine-readable interface to the complete DHIS2 data model. For instance, one can access the full list of data elements, then navigate using the provided hyperlink to a particular data element of interest, then navigate using the provided hyperlink to the list of forms which this data element is part of. E.g. clients will only do state transitions using the hyperlinks which are dynamically embedded in the responses.
Data is accessed through a uniform interface (URLs) using a well-known protocol. There are no fancy transport formats or protocols involved - just the well-tested, well-understood HTTP protocol which is the main building block of the Web today. This implies that third-party developers can develop software using the DHIS2 data model and data without knowing the DHIS2 specific technology or complying with the DHIS2 design constraints.
All data including meta-data, reports, maps and charts, known as resources in REST terminology, can be retrieved in most of the popular representation formats of the Web of today, such as HTML, XML, JSON, PDF and PNG. These formats are widely supported in applications and programming languages and give third-party developers a wide range of implementation options.

There are several scenarios where additional software artifacts may connect to the DHIS2 Web API.
First, Web portals may be built on top of the Web API. A Web portal in this regard is a web site which functions as a point of access to information from a potential large number of data sources which typically share a common theme. The role of the Web portal is to make such data sources easily accessible in a structured fashion under a common look-and-feel and provide a comprehensive data view for end users.
Aggregate data repository: A Web portal targeted at the health domain may use the DHIS2 as the main source for aggregate data. The portal can connect to the Web API and communicate with relevant resources such as maps, charts, reports, tables and static documents. These data views can dynamically visualize aggregate data based on queries on the organisation unit, indicator or period dimension. The portal can add value to the information accessibility in several ways. It can be structured in a user-friendly way and make data accessible to inexperienced users. It can provide various approaches to the data, including:
Thematic - grouping indicators by topic. Examples of such topics are immunization, mother care, notifiable diseases and environmental health.
Geographical - grouping data by provinces. This will enable easy comparison of performance and workload.
Mash-up: The Web portal is not limited to consuming data from a single Web API - it can be connected to any number of APIs and be used to mash up data from auxiliary systems within the health domain. If available the portal might pull in specialized data from logistics systems tracking and managing ARV medicines, from finance systems managing payments to health facilities and from lab systems tracking lab tests for communicable diseases. Data from all of these sources might be presented in a coherent and meaningful way to provide better insight in the situation of the health domain.
Document repository: The Web portal can act as a document repository in itself (also referred to as content management system). Relevant documents such as published reports, survey data, annual operational plans and FAQs might be uploaded and managed in terms of ownership, version control and classification. This makes the portal a central point for document sharing and collaboration. The emergence of high-quality, open source repository/CMS solutions such as Alfresco and Drupal makes this approach more feasible and compelling.
Knowledge management: KM refers to practices for identifying, materializing and distributing insight and experience. In our context it relates to all aspects of information system implementation and use, such as:
Database design
Information system usage and how-to
End-user training guidelines
Data use, analysis and interpretation
Knowledge and learning within these areas can be materialized in the form of manuals, papers, books, slide sets, videos, system embedded help text, online learning sites, forums, FAQs and more. All of these artifacts might be published and made accessible from the Web portal.
Forum: The portal can provide a forum for hosting discussions between professional users. The subject can range from help for performing basic operations in the health information system to discussions over data analysis and interpretation topics. Such a forum can act as an interactive source for information and evolve naturally into a valuable archive.
Second, third-party software clients running on devices such as mobile phones, smart phones and tablets may connect to the DHIS2 Web API and read and write to relevant resources. For instance, third-party developers may create a client running on the Android operating system on mobile devices targeted at community health workers who needs to keep track of the people to visit, register vital data for each encounter and receive reminders of due dates for patient care while travelling freely in the community. Such a client application might interact with the patient and activity plan resources exposed by the DHIS2 Web API. The developer will not be dependent on deep insight into the DHIS2 internal implementation, rather just basic skills within HTTP/Web programming and a bit of knowledge of the DHIS2 data model. Understanding the DHIS2 data model is made easier by the navigable nature of the Web API.
Third, information system developers aiming at creating new ways of visualizing and presenting aggregate data can utilize the DHIS2 Web API as the service layer of their system. The effort needed for developing new information systems and maintaining them over time is often largely under-estimated. Instead of starting from scratch, a new application can be built on top of the Web API. Developer attention can be directed towards making new, innovative and creative data representations and visualizations, in the form of e.g. dashboards, GIS and charting components.
DHIS2 is an open platform and its implementers are active contributors to interoperability initiatives, such as openHIE. The DHIS2 application database is designed with flexibility in mind. Data structures such as data elements, organisation units, forms and user roles can be defined completely freely through the application user interface. This makes it possible for the system to be adapted to a multitude of local contexts and use-cases. DHIS2 supports many requirements for routine data capture and analysis emerging in country implementations, both for HMIS scenarios and as a basic data collection and management system in domains such as logistics, laboratory management and finance.
Based on its platform approach, DHIS2 is able to receive and host data from different data sources and share it to other systems and reporting mechanisms. An important distinction of integration concepts is the difference between data integration and systems interoperability:
When talking about integration, we think about the process of making different information systems appear as one, making electronic data available to all relevant users as well as the harmonization of definitions and dimensions so that it is possible to combine the data in useful ways.
A related concept is interoperability, which is one strategy to achieve integration. We consider DHIS2 interoperable with other software applications because of its capability to exchange data. For example, DHIS2 and OpenMRS are interoperable, because they allow to share data definitions and data with each other. Interoperability depends on standards for data formats, interfaces, codes and terminologies. These would ideally be internationally agreed-upon standards, but in practice may also consist of de facto standards (which has wide acceptance and usage but is not necessarily formally balloted in a standards development organisation) and other more local agreements within a particular context.
DHIS2 is often used as an integrated data warehouse, since it contains (aggregate) data from various sources, such as Mother and Child health, Malaria program, census data, and data on stocks and human resources. These data sources share the same platform, DHIS2, and are available all from the same place. These subsystems are thus considered integrated into one system.
Interoperability in addition will integrate data sources from other software applications. For example, if census data is stored in a specialized civil registry or in a vital events system, interoperability between this database and DHIS2 would mean that census data would also be accessible in DHIS2.
Finally, the most basic integration activity (that is not always taken into account in the interoperability discussion) is the possibility to integratedata from existing paper systems or parallel vertical systems into DHIS2. Data will be entered directly into DHIS2 without passing through a different software application. This process is based on creating consistent indicator definitions and can already greatly reduce fragmentation and enhance data analysis through an integrated data repository.
In most countries we find many different, isolated health information systems, causing many information management challenges. Public Health Information System have seen an explosive and often uncoordinated growth over the last years. Modern information technology makes it less costly to implement ICT4D solutions, which can lead to a high diversity of solutions. A staggering example was the mHealth moratorium declaration of Uganda´s MoH in 2012, as a reaction to an avalanche of around 50 mHealth solutions that were implemented within the course of a few years. Most of these solutions were standalone approaches that did not share their data with the national systems and rarely were developed beyond pilot status.
This may lead to the conclusion, that all systems should be connected or that interoperability is an objective in itself. However DHIS2 is often employed in contexts, where infrastructure is weak, and where resources to run even basic systems reliably are scarce. Fragmentation is a serious problem in this context, however interoperability approaches can only resolve some of the fragmentation problems - and often interoperability approaches result in an additional layer of complexity.
Example
Complexity of Logistics solutions in Ghana
In the area of Logistics or Supply Chain Management, often a multitude of parallel, overlapping or competing software solutions can be found in a single country. As identified in a JSI study in 2012, eighteen (18!) different software tools were documented as being used within the public health supply chain in Ghana alone.
Systems interoperability therefore seems as one possibility to remove fragmentation and redundancies and give public health officers a concise and balanced picture from available data sources. However the effort of connecting many redundant software solutions would be very high and therefore seems questionable. In a first step, focus should be on **reducing the number of parallel systems**and identifying the most relevant systems, afterwards these relevant systems can be integrated.
On this background, we want to define the major objectives of DHIS2 integration approaches:
Calculation of indicators: Many indicators are based on numerators and denominators from different data sources. Examples include mortality rates, including some mortality data as numerator and population data as denominator, staff coverage and staff workload rates (human resource data, and population and headcount data), immunization rates, and the like. For the calculation, you need both the numerator and denominator data, and they should thus be integrated into a single data warehouse. The more data sources that are integrated, the more indicators can be generated from the central repository.
Reduce manual processing and entering of data: With different data at the same place, there is no need to manually extract and process indicators, or re-enter data into the data warehouse. Especially interoperability between systems of different data types (such as patient registers and aggregate data warehouse) allows software for subsystems to both calculate and share data electronically. This reduces the amount of manual steps involved in data processing, which increases data quality.
Reduce redundancies: Often overlapping and redundant data is being captured by the various parallel systems. For instance will HIV/AIDS related data elements be captured both by both multiple general counselling and testing programs and the specialized HIV/AIDS program. Harmonizing the data collection tools of such programs will reduce the total workload of the end users. This implies that such data sources can be integrated into DHIS2 and harmonized with the existing data elements, which involves both data entry and data analysis requirements.
Improve organizational aspects: If all data can be handled by one unit in the ministry of health, instead of various subsystems maintained by the several health programs, this one unit can be professionalized. With staff which sole responsibility is data management, processing, and analysis, more specialized skills can be developed and the information handling be rationalized.
Integration of vertical programs: The typical government health domain has a lot of existing players and systems. An integrated database containing data from various sources becomes more valuable and useful than fragmented and isolated ones. For instance when analysis of epidemiological data is combined with specialized HIV/AIDS, TB, financial and human resource data, or when immunization is combined with logistics/stock data, it will give a more complete picture of the situation.
DHIS2 can help streamlining and simplifying system architecture, following questions such as:What is the objective of the integration effort? Can DHIS2 help reduce the number of systems? Can an DHIS2 integration help provide relevant management information at a lower cost, at at higher speed and with a better data quality than the existing systems? Is DHIS2 the best tool to replace other systems, or is another fit-for-purpose solution that can interoperate with DHIS2 more appropriate? More practical information on defining these objectives can be found in STEP 1 of the 6-Step implementation guideline.
Since there are different use-cases for health information, there are different types of software applications functioning within the health sector. We use the term architecture for health information to describe a plan or overview of the various software applications, their specific uses and data connections. The architecture functions as a plan to coordinate the development and interoperability of various subsystems within the larger health information system. It is advisable to develop a plan that covers all components, including the areas that are currently not running any software, to be able to adequately see the requirements in terms of data sharing. These requirements should then be part of specifications for the software once it is developed or procured.
The openhealth information exchange (openHIE) is an interoperable interpretation of this architecture, with an HMIS or DHIS2 often assuming a significant role in it.The openHIE framework has been developed with a clear focus on countries in low resource settings, through the participation of several institutions and development partners, including the Oslo HISP program.
The schematic overview below shows the main elements of the openHIE framework, containing a component layer, an interoperability services layer and external systems. The openHIE component layer covers meta or reference data (Terminology, Clients, Facilities), Personal data (Staff, Patient History) and national health statistics. The purpose is to ensure the availability of the same meta data in all systems that participate in the corresponding data exchange (e.g. indicator definitions, facility naming, coding and classification). In some cases, like the case of the Master Facility Registry, the data may also be used to provide information to the general public through a web portal. While the interoperability layer ensures data brokerage between the different systems, the external systems layer contains several sub-systems, many at point of service level, with often overlapping functional range.
There are different approaches to define an eHealth architecture. In the context of this DHIS2 guideline, we distinguish between approaches based on a 1:1 connection versus approaches based on an n:n connection (many-to-many).
In many countries a national HMIS is often the first system to be rolled out to a large number of facilities and to manage a large number of data on a monthly or quarterly basis. When countries start to develop their health system architecture further, DHIS2 often will be connected to some other systems. This connection is often done directly through a simple script, which automates a data transfer.
We talk of a 1:1 connection because it is limited to two systems. In the case of an LMIS/HMIS integration, one LMIS will transfer data to DHIS2 as defined in the script. This hands-on approach often represents a first step and is one of the most common use cases on the way to an interoperable openHIE architecture. However, this simplicity also brings along disadvantages: In case a second logistics system would want to transfer data to DHIS2 (e.g. commodity data for a specific disease program), a second script would have to be written, to perform this task. These two scripts would then run independently from another, resulting in two separate 1:1 connections.
A different approach is based on placing a purpose-built software to serve as an interoperability layer or BUS approach, managing the data transfer between possibly several systems on either side (n:n). This could be the case if for example you wanted to collect stock level data through different LMIS applications, and then share it to a central warehouse LMIS, the HMIS and some vertical disease programs system. The openHIE reference software to assume this role is the "OpenHIM", but systems like "MOTECH" have also been used for this purpose as will be discussed below.
While this approach may result in a higher initial effort, it promises to make further integration project easier, because the interoperability layer is being alimented with definitions and mappings that can be re-used for connecting the next systems.
In practice, there are certain challenges to this approach. It takes a considerable effort of qualified resources to activate APIs and with each new release of any involved system, data flows require re-testing and if necessary adaptations. Also, to be successful these implementation projects typically have to go through a series ofcomplex steps, such as the agreement on an interoperability approach embedded in the national eHealth strategy, the definition of data standards and sustainable maintenance structure, and attaining a stakeholder consensus on data ownership and sharing policies. There can be some long term consequences when data and systems are knitted together - it creates new roles, jobs and tasks which didn't exist before and may not have been planned for (metadata governance, complex system administration, boundary negotiators, etc.).
Example
Grameen DHIS2/CommCare middle layer in Senegal
In Integration concepts, MOTECH serves as technical middle layer between an LMIS for mobile data collection at the health facility level (CommCare) and DHIS2, allowing to define data mapping, transformation rules and data quality checks. The interface is set-up to transfers data from CommCare Supply to DHIS2 whenever data is saved into a CommCare form at facilities. For each commodity, data on consumption, available stock, losses and stock-out data is transferred from CommCare to DHIS2.
The higher initial investment of the Senegal approach hints towards a more ambitious long-term system architecture, foreseeing that the MOTECH platform may in future serve to accommodate further interoperability task. However we do not see any of the country activities tightly embedded in a text-book eHealth architecture, which would clearly define areas of priority, leading systems for each priority and the relations and resulting APIs between these different components. One may argue that interoperability projects are built on a weak foundation if there is no previous consensus on an architectural master plan. On the other hand it is also valuable to allow system initiatives to organically develop, as long as they are rooted in well-founded country needs.
An important element of an eHealth architecture is the inclusion of international eHealth standards. Standards are especially relevant for n:n connections, less so for direct (1:1) connections.
Some standards are on the technical level (e.g. transmission methods), other on the contents side (e.g. WHO 100 core indicators). Gradually aligning national system initiatives to these standards can give countries access to proven solutions, benefitting from medical and technological innovation.
Example
Ghana EPI
The Ghana case illustrates how the WHO EPI reporting requirements serves to define standard data in DHIS2. This standardization at the dataset and terminological level is the basis for the system integration. In the area of DHIS2, work is ongoing with WHO to develop standardized datasets, which could in the future open up new opportunities for interoperability and efficiency gains by offering some consistency of metadata across systems, and also encouraging countries to reuse existing solutions.
At the language level, there is a need to be consistent about definitions. If you have two data sources for the same data, they need to be comparable. For example, if you collect malaria data from both standard clinics and from hospitals, this data needs to describe the same thing if they need to be combined for totals and indicators. If a hospital is reporting malaria cases by sex but not age group, and other clinics are reporting by age group but not sex, this data cannot be analysed according to either of these dimensions (even though a total amount of cases can be calculated). There is thus a need to agree on uniform definitions.
In addition to uniform definitions across the various sub-systems, data exchange standards must be adopted if data is to be shared electronically. The various software applications would need this to be able to understand each other. DHIS2 is supporting several data formats for import and export, including the most relevant standard ADX. Other software applications are also supporting this, and it allows the sharing of data definitions and aggregate data between them. For DHIS2, this means it supports import of aggregate data that are supplied by other applications, such as OpenMRS (for patient management) and iHRIS (for human resources management).
A crucial element of the architecture is how organize data mapping. Typically the metadata of different systems does not match exactly. Unless an MoH has been enforcing a consequent data standard policy, different systems will have different codes and labels for a facility. one System may call it District Hospital - 123, the other system may refer to it as Malaria Treatment Centre - 15. To be able to transfer data, somewhere the information that these two facilities correspond needs to be stored.
In the case of a 1:1 connection, this mapping has to be done and maintained for every connection, in case of an n:n interoperability approach, one side of the definitions can be re-used.
In order to assure that the data can flow smoothly, you need to have clear responsibilities on both sides of the system regarding data maintenance and troubleshooting. For example, there need to be previously defined standard procedures for such activities as adding, renaming, temporarily deactivating or removing a facility on either of the two systems. Changes of database fields that are included in a transferred data record need also to be coordinated in a systematic way.
DHIS2 has been expanding its reach into many health systems. Starting from its familiar grounds of aggregate data sets for routine data it has included patient related data and then data in the areas of HR, finance, logistics and laboratory management, moving towards operational or transactional data.
We can differentiate between transactional and aggregate data. A transactional system (or operational system from a data warehouse perspective) is a system that collects, stores and modifies detailed level data. This system is typically used on a day-to-day basis for data entry and validation. The design is optimized for fast insert and update performance. DHIS2 can incorporate aggregate data from external data sources, typically aggregated in the space dimension (the organisation unit hierarchy), time dimension (over multiple periods) and for indicator formulas (mathematical expressions including data elements).
When we look at a transactional system, such as a logistics software for the entire supply chain or parts of it, there is one fundamental decision to take: Do you need to track all detailed transactions at all levels, including such operations as returns, transfer between facilities, barcode reading, batch and expiry management? Or can you get most of your needed decision insight results using aggregate data?
Supply chains may often be well monitored and to some degree, managed, as long as data are reliably available where and when they are needed for operational decisions and for monitoring purposes.. The main indicators *intake, consumption and stock level at the end of period*can be managed without electronic transactions and often suffice to give the big picture of system performance, and may reduce the needs for system investment.
Being realistic about what data need to be collected, how often, and who will be using them is important so you don’t create systems that fail due to lack of use or unrealistic expectations about how the data will be used. Digital logistics management systems can work well when they are fully integrated into routine workflows and designed to make the users’ jobs easier or more efficient.
Note
The expectation, that more detailed data leads to better logistics management is not always fulfilled. Sometimes the ambitious attempt to regularly collect logistics transaction data results in less data quality, for example because the data recording, which may have to happen on a daily basis instead of a monthly or quarterly basis, is not carried out reliably. On the other hand, if the transactional system is well maintained and monitored, more detailed data can help identify inaccuracies and data quality challenges, reduce wastage (due to expiry or CCE failure), support a recall, manage performance and lead to improvements in supply chain decision making. Analysing detailed data may help to discover root causes of some problems and improve the data quality in the long run.
DHIS2 can assume different roles in interoperability scenarios. A common interoperability scenario is for DHIS2 to receive aggregate data from an operational system, in which case the operational system adds up the transactions before passing it on to DHIS2. However, DHIS2 may to a certain extent also be configured to store detailed transactional data, receiving it from external systems or through direct data entry in DHIS2.
On this basis we try making a comparative overview, comparing aggregate DHIS2 data management with data management of external specialized system. This can serve as a rough orientation, but is not static since both the capabilities of DHIS2 and its interpretation by implementers are broadening with almost each release.
| Area | Aggregate DHIS2 | External specialized systems |
|---|---|---|
| Logistics | Aggregate data, e.g. end-of-month facility stock levels can be send through DHIS2. DHIS2 can produce simple stock level and consumption reports. | Supply chain management support logistics system operations and can track detailed stock movements (Issuing, resupplying, allocating, wastage) and record details such as production batch numbers. SCM systems create forecasting, replenishment and elaborate control reports, allowing for real time monitoring of stock levels, notifications (low stock, workflow management, CCE failure, etc.), supported estimations, and emergency orders. |
| Finance | Aggregate data, e.g. on total expenditure or cash level can be send through DHIS2. DHIS2 can produce simple finance overview reports, e.g. on remaining budgets. | Finance management systems allow fully traceable recording of financial transactions according to legal requirements, including budgeting, transfers, cancellations, reimbursements etc. Multi-dimensional tagging of transactions allows for analytical reports. |
| Patient tracking | Disease or program related data are collected by DHIS2, DHIS2 Tracker also allows a simplified longitudinal view on medical records, including patient history and multi-stage clinical pathways. | Specialized hospital management systems can cover and optimize complex workflows between different departments (e.g. reception, payment counter, wards, OPD, IPD, laboratory, imaging, storeroom, finance and HR administration, medical device maintenance, etc.). |
| Human Resources | DHIS2 collects human resource related indicators, for example planned positions and vacancies per facility. | A specialized HR management system can track detailed status information and changes for a Health Worker (accreditation, promotion, sabbatical, change of position, change of location, additional training, etc.). It comes with pre-designed reports for both operational oversight and planning. |
The different objectives described above lead to different integration scenarios. DHIS2 can assume multiple roles in a system architecture:
Data input: data entry (offline, mobile), data import (transactional data, aggregate data)
Data storage, visualisation and analysis with in-built tools (DWH, reports, GIS)
Data sharing to external tools (e.g. DVDMT), via web APIs, web apps
In the following paragraphs we discuss the data input and data sharing approaches, then we present the example of the vertical integration where DHIS2 often assumes all these roles.
The role of DHIS2 to store, visualise and analyse data is discussed seperpately in the data warehouse section.
There are several aspects on how DHIS2 deals with data input. On the most basic level, DHIS2 serves to replace or at least mirror paper-based data collection forms, integrating the data electronically. This will result in manual data entry activities at facility or at health administration level. The next input option is to import data. DHIS2 allows to import data through a user interface, which is a method requiring little technical knowledge, but needs to be executed manually every time data needs to be made available. A detailed description of the import functions can be found in the DHIS2 user guides.
Tip
The manual data entry and import approach require relatively little technical effort. They may also be used temporarily to pilot a data integration approach. This allows user to test indicators and reports, without having to employ dedicated technical resources for the development of automated interoperability functions, either through a 1:1 or an n:n connection.
There are three sharing scenarios, (1) a simple data export, (2) DHIS2 apps and (3) external apps or websites connecting to the DHIS Web API. Similar to the import functions described in the data input section, the most accessible way of data sharing is to use the data export functions that are available from the user menu, requiring little technical knowledge.
Due to its modular design DHIS2 can be extended with additional software modules, which can be downloaded from the DHIS2App store. These software modules can live side by side with the core modules of DHIS2 and can be integrated into the DHIS2 portal and menu system. This is a powerful feature as it makes it possible to extend the system with extra functionality when needed, typically for country specific requirements as earlier pointed out.
The downside of the software module extensibility is that it puts several constraints on the development process. The developers creating the extra functionality are limited to the DHIS2 technology in terms of programming language and software frameworks, in addition to the constraints put on the design of modules by the DHIS2 portal solution. Also, these modules must be included in the DHIS2 software when the software is built and deployed on the web server, not dynamically during run-time.
In order to overcome these limitations and achieve a looser coupling between the DHIS2 service layer and additional software artefacts, the DHIS2 development team decided to create a Web API. This Web API complies with the rules of the REST architectural style. This implies that:
The Web API provides a navigable and machine-readable interface to the complete DHIS2 data model. For instance, one can access the full list of data elements, then navigate using the provided hyperlink to a particular data element of interest, then navigate using the provided hyperlink to the list of forms which this data element is part of. E.g. clients will only do state transitions using the hyperlinks which are dynamically embedded in the responses.
Data is accessed through a uniform interface (URLs) using a well-known protocol. There are no fancy transport formats or protocols involved - just the well-tested, well-understood HTTP protocol which is the main building block of the Web today. This implies that third-party developers can develop software using the DHIS2 data model and data without knowing the DHIS2 specific technology or complying with the DHIS2 design constraints.
All data including meta-data, reports, maps and charts, known as resources in REST terminology, can be retrieved in most of the popular representation formats of the Web of today, such as HTML, XML, JSON, PDF and PNG. These formats are widely supported in applications and programming languages and gives third-party developers a wide range of implementation options.
This Web API can be accessed by different external information system. The effort needed for developing new information systems and maintaining them over time is often largely underestimated. Instead of starting from scratch, a new application can be built on top of the Web API.
Extenal systems can offer different options for visualizing and presenting DHIS2 data, e.g. in the form of dashboards, GIS and charting components. Web portals targeted at the health domain can use DHIS2 as the main source for aggregate data. The portal can connect to the Web API and communicate with relevant resources such as maps, charts, reports, tables and static documents. These data views can dynamically visualize aggregate data based on queries on the organisation unit, indicator or period dimension. The portal can add value to the information accessibility in several ways. It can be structured in a user-friendly way and make data accessible to inexperienced users. An example for this is the Tanzania HMIS Web Portal.
Taking into account all the above elements on system architecture and data types, DHIS2 implementers have several options on how to approach implementations:
Focus on transactional or aggregate data
Focus on data integration or systems interoperability
Given the efforts required to implement systems interoperability, many Ministries of Health are going for the pragmatic shortcut of integrating data such as basic stock level data directly into their existing national DHIS2. As a rapidly evolving platform, DHIS2 has been adding a lot of functionality over the last years, especially in DHIS2 Tracker. Taking the example of logistics data, the following main functions are currently available:
Data entry form mirroring the widely used Report and Requisition (R\&R) paper form. Data entry by facilities is possible through the desktop browser or a mobile app, including in offline mode. These electronic forms can be filled by staff based on the paper stock cards, that are normally placed next to the commodity in the store room.
DHIS2 can then produce reports for central level performance monitoring, giving commodity and program managers an understanding of how the logistics system is functioning.. Depending on how the logistics system operates, these data may also be able to support operational decision-making although a more complete analysis of logistics business processes and users should be conducted first.
Stock data can be transformed into logistics indicators, that can be put into context with other program indicators, for example cross-referencing number of patients treated with a specific pathology and corresponding drug consumption.
Although each country that we look at in the use cases has their own development path towards system integration, some common learnings can be drawn from their experiences. The maturity model below describes an evolutionary approach to cope with integration and interoperability challenges, allowing the different stakeholders in a national Health System to grow professional analytics and data usage habits.
The maturity model suggests moving from aggregate data to transactional data and from stand-alone to interoperable systems (using the example of logistics data).
DHIS2 is often one of the first systems to cover the health administration and several facility levels of a country. At first core disease indicators are covered (for example corresponding to the 100 WHO Core Health Indicators).
In a second phase, different stakeholders seek to complement the disease and service delivery data they are reporting with basic LMIS data. This can be done on an aggregate basis in DHIS2, e.g. by including stock levels and consumption in periodic reports. This will provide high level information on logistics system performance but may or may not provide sufficient insights to support improved logistics system operations.
At a more mature stage, there may be a legitimate need for specialized logistics systems, especially when a very detailed transactional view is wanted to have a more granular control, (e.g. returns, transfers between facilities, batch numbers and expiries, etc.). DHIS2 Tracker can offer some event or patient related data management functions, but cannot always achieve the degree of workflow support provided by other, more specialized solutions.
In a mature technological and managerial environment, the logistics transactions can be shared to DHIS2 in an aggregate form, moving from a stand-alone to an integrated scenario.
The purpose of this step-by-step DHIS2 Implementation Guide is to provide a methodology for implementers to create and support a DHIS2 integration scenario. The guide is based on the best practices and lessons learned. The guide advocates for a country driven, iterative, and agile approach that begins with collecting user stories and functional requirements. The guide is intended as a framework that can be adapted to the specific context of each country. The content describes specific examples for each step detailing user stories, data specifications, job aids and checklists to guide the use of the reference implementation software. The basic structure, including the 6 steps, are basedon the OpenHIE implementation methodology:
Step 1: Identify Stakeholders and Motivations for Improved Facility Data
Step 2: Document Facility Registry Specifications and User Stories
Step 3: Set Up Initial Instance
Step 4: Identify Gaps & Iterative Development via User Testing
Step 5: Scaling the Registry Implementation
Step 6: Provide Ongoing Support
In addition to these steps related to interoperability, it is also interesting to reference back to some of the general DHIS2 implementation experiences and best practises given in the sections on Recommendations for National HIS Implementations and Setting Up a New Database. A typical DHIS2 implementation approach which is also vital for interoperability projects is a participatory approach. This approach stresses to include right from project start a local team with different skills and background to assume responsibility as soon as possible.
In a first step, the objectives of the integration project will be defined. As with every technology project, there should be a clear consensus on strategic and functional objectives. Technological innovation and feasibility should not be the sole driving force but rather a clearly defined organisational goal. Therefore this step is also intended to answer the question: “Why do we want to connect systems or integrate data from different sources with DHIS2?”
On a practical level, this leads to questions on the data integration approach, such as:
Do you want to eliminate paper forms or even eliminate data sets that are redundant or not needed anymore?
Can you integrate the (aggregate) data into DHIS2?
Can you integrate the detailed (e.g. patient level or transactional) data into DHIS2, using DHIS2 tracker functions?
If you want to create a data exchange connection between DHIS2 and another system, how do you define ownership and responsibilities?
Activities to answer this question are described below and will lay the groundwork for an DHIS2 interoperability project.
It is in the nature of interoperability projects to have more than one stakeholder. Stakeholders from different areas need to agree on a common system approach, for example the team responsible for the national HMIS (e.g. the M\&E department or Planning Department) and the Logistics Department in case of an LMIS implementation. These two main areas often have sub-divisions, e.g. in the logistics area the procurement unit, the warehousing unit, the transport unit. In addition, stakeholders from disease specific programs will have their own regimens and commodity managers. In addition to these local actors, international partners (agencies, donors, iNGOs, consultancies) are often also involved in the decision making process.
Therefore it´s interesting to look at the main motivations of the stakeholders and how to mitigate risks resulting from potential diverging interests.
Central MoH Departments such as **M\&E&**Planning often are the main stakeholders for a standardisation of indicators and IT Systems
Central IT departments have a general interest over (often locally controlled) technology choices and ownership, hardware and software purchases. They are often dealing with network and hardware issues but lack experience dealing with complex web-based architectures and data exchanges.
Specialized disease programs are often under pressure to deliver very program specific indicators, both for their own management but also responding to donor driven approaches. They may also feel more comfortable controlling their proper IT system to be sure their needs are prioritized.
Specialized functional areas (such as Human Resources, Logistics, Hospital Management) are often in a sandwich position, having to cater to the information needs of several different stakeholders, while trying to achieve operational efficiency with limited resources.
By identifying who is interested to provide or utilize the data, the lead implementers can start to form a project team to inform the design and implementation. One method for characterizing stakeholders involves grouping interested parties by their functional roles. The existing infrastructure and procedures are also important to understanding governance and curation options. Understanding the stakeholders and their corresponding systems is a critical first step.
It is important to get a clear view on the overall IT systems landscape. This can help make sure that interoperability investment is done to strengthen the main systems and that the investments contribute to a simplification of the system architecture. For example, if the system inventory shows that there are a lot of redundant functional systems, e.g. more than 10 different logistics systems or modules in a country, the interoperability project should try to contribute to a mid or long-term rationalization of this situation. This could mean to participate in a national consensus finding process to identify the most future-proof solutions, identify national “champions” for each speciality and develop a roadmap for aligning these systems or data and removing underutilized or redundant systems.
Also in this context it is interesting to analyse whether simple indicators can be collected and managed in DHIS2 itself and how this can complement logistics system improvement efforts (as this is later explained in an LMIS example). Once the stable and sustainable systems have been identified, planning for a data exchange with DHIS2 can start.
The motivations driving an implementation can be detailed by the perceived opportunities or challenges that stakeholders face. This might include the desire to share data across systems related to health facilities for supply chain management, monitoring and evaluation, health service delivery and many other systems. User stories and use cases will be documented in depth during Step 2, but a high level vision of motivations to engage with partners is also needed.
Clear national policies on data integration, data ownership, routines for data collection, processing, and sharing, should be in place at the start of the project. Often some period of disturbance to the normal data flow will take place during integration, so for many the long-term prospects of a more efficient system will have to be judged against the short-term disturbance. Integration is thus often a stepwise process, where measures need to be taken for this to happen as smoothly as possible.
Example
Ghana CHIM
- Stakeholder cooperation: The Ghana Centre for Health Information Management(CHIM) has a clear position towards vertical programs and other partners with proper software initiatives. CHIM establishes DHIS2 as an attractive data collection option, supporting other GHS stakeholders to connect to DHIS2 and to work on a common interoperability strategy, evolving DHIS2 according to stakeholder needs. This also includes data sharing agreements.
- Strong sense of system ownership: CHIM has a strong determination to build up the necessary know-how inside the CHIM team to configure and maintain the system. The CHIM team consists of Health Information Officers, that combine Public Health and Data Management skills.
Also, having clearly defined system maintenance and update procedures can certainly help to manage interoperability.
Example
Ghana CHIM
As an example, in the case of Ghana DHIS2, a clear yearly system update cycle is in place: Towards the end of each year, new indicators are created and the corresponding paper forms are issued. Staff will receive training and is prepared for data entry. The new form for EPI data was included in this update cycle and EPI staff was prepared for data entry as part of the process. This systematic procedure allows GHS to quickly respond to the needs of stakeholders such as the EPI Programme and accommodate their data and reporting needs with a limited and predictable investment. It puts CHIM in a position to contribute to the rationalization and simplification of the national Health System Architecture, gradually integrating the data management for more vertical programs, both on the side of data entry and analytics.
A key principle for HISP is to engage the local team in building the system from the very beginning, with guidance from external experts if needed, and not to delay knowledge transfer towards the end of the implementation. Ownership comes first of all from building the system and owning every step of this process.
Collect existing metadata
Document data specifications
Document user stories
Implement the specifications
Identify and piroritize incomplete user stories
Agile and iterative development
User testing
Collect, reconcile and upload data
Confirm user roles and responsibilities
User training
Critical integrations
While during the implementation phase a temporary support structure should be available, afterwards a permanent support structure needs to be set-up. The main challenge is to have clear responsibilities. In an ideal situation, we are dealing with two stable systems that each have already their own clearly defined support structure.
However in reality some recurring challenges may have to be dealt with: Many Public Health System are undergoing dynamic developments, leading to changes in data collection needs or calculation of indicators.
Interoperability tends to be a tedious technical and organisational charge. All of the three described initiatives have consumed a considerable effort of qualified resources to activate APIs. In addition, with each new release of any involved system, data flows require re-testing and if necessary adaptations. To be successful these implementation projects typically have to go through a series of complex steps, such as the agreement on an interoperability approach embedded in the national eHealth strategy, the definition of data standards and sustainable maintenance structure, and attaining a stakeholder consensus on data ownership and sharing policies. There can be some long term consequences when data and systems are knitted together - it creates new roles, tasks and categories of labour which need to be planned for (metadata governance, complex system administration, boundary negotiators, etc.). A solution could be to discuss the new responsibilities beforehand, assigning them to job descriptions, teams and specific positions.
Another important area is that of metadata governance, particularly in the scenarios of secondary use of data. In a stand-alone set-up, metadata, such as facility or commodity codes can be managed without much consideration of other stakeholder´s needs. But in an interoperability environment, metadata changes will have effects outside of the individual system. Metadata governance can be highly formalised through registries or more manual through human processes.
In order to determine the appropriate approach, is it useful to estimate the expected metadata maintenance effort and the consequences of unsynchronized metadata across different systems. In the case of the LMIS/DHIS2 integrations, there are potentially thousands of facility identifiers that could go out of synch. However normally, facility identifiers do not change often since the physical infrastructure of most public health system is relatively constant. As to the commodities, although regimes and priority drugs may change over time, the number of datasets is relatively small: The commodity list of a program often contains less than 20 products. Therefore often it can be practical to update a commodity manually, and not invest into an interoperability solutions such as an automated metadata synchronization.
DHIS2 has been expanding its reach into many health systems. Starting from its familiar grounds of aggregate data sets for routine data it has included patient related data and then data in the areas of HR, finance, logistics and laboratory management. This is in line with the development of DHIS2 in many country settings, where implementers are pushing the use beyond its originally intended scope.
This is also reflected in the overall system architecture. Since the expanding functionality of DHIS2 reduces the urgency to introduce or maintain other specialized systems, the number of potential data interfaces decreases. This reduced complexity in system architecture is certainly a benefit for a Health System with limited resources.
For several years now, DHIS2 has grown its data management activities organically, allowing the actual usage to lead to sometimes unforeseen solutions. However, there are also limits to where leveraging DHIS2 seems useful. In the following sections, special systems will be described.
a) Introduction
Logistics Management Systems (LMIS) or Supply Chain Management Systems (SCM) serve to replace paper systems to increase standardization, transparency, timeliness of procurement, efficiency, safety, cost-effectiveness, and to reduce waste. National SCMS/LMIS can cover such functions as commodity planning, budgeting, procurement, storage, distribution and replenishment of essential drugs and consumables.
b) Implementing LMIS in DHIS2
Supply chains can often be well controlled with aggregate data only, as long as data is provided reliably from all relevant levels and followed up upon. The main indicators intake, consumption and stock level at the end of period can be managed without electronic transactions and often suffice to give the big picture, reducing the needs for system investment. As a rapidly evolving platform, DHIS2 has been adding a lot of functionality over the last years, especially in DHIS2 Tracker. The following main functions are currently available:
Data entry form mirroring the widely used Report and Requisition (R\&R) paper form. Data entry by facilities is possible through the desktop browser or a mobile app, including in offline mode. In online mode the form can calculate requisition proposals, offering the facility manager to modify the request and comment on it. These electronic forms can be filled by staff based on the paper stock cards, that are normally placed next to the commodity in the store room.
DHIS2 can then produce reports for central decision making, giving commodity and program managers the possibility to accept or modify delivery suggestions.
Stock data can be transformed into logistics indicators, that can be put into context with other program indicators, for example cross-referencing number of patients treated with a specific pathology and corresponding drug consumption.
c) Interoperability Options
LMIS is an area where a multitude of parallel, overlapping or competing software solutions can be found in a single country. As identified in a JSI study in 2012(Ghana Ministry of Health, July 2013: Landscape Analysis of Supply Chain Management Tools in Use), eighteen (18!) different software tools were documented as being in use within the public health supply chain in Ghana alone.
Although a basic LMIS configuration based on aggregate data can take you very far, in some cases a transactional LMIS is necessary if you need to track such detailed operations as returns, transfer between facilities, barcode reading, batch and expiry management. Also some specialized HQ functions such as creating forecasting, replenishment and elaborate control reports are often done in specialized tools.
DHIS2 has integrated aggregate data from external systems such as openLMIS and CommCare through automated data interfaces. As a result, stock data is available in shared dashboards, displaying health service and stock data next to each other.
The DHIS2 approach for data quality follows what is outlined within the WHO Data Quality Assurance (DQA) guidelines. For the best results in implementing DHIS2 data quality features, it is recommended that you review these guidelines as reference to this toolkit. In the DQA guidelines, several frequencies for the review of data are identified:
Routine Review
These should be regular (e.g. weekly/monthly etc. depending on the frequency of data collection) reviews of data quality built into a system of checks of the HMIS or other program reporting systems as part of a feedback cycle that identifies errors in near real-time so they can be corrected as they occur. This routine examination of data can be more holistic and either cross-cutting or programme-specific, and can be conducted by different users of data (e.g. HMIS managers, program managers, etc.).
Discrete Assessments
These are needed to look at the quality of health facility data being used both to measure the performance of the health sector and also for policy and planning purposes. These assessments should be carried out before a planning cycle, such as in advance of an annual health sector review (periodicity is country-specific, but likely most comparable to an annual cycle).
Periodic Review
These should focus on a single disease or program area and should be timed to meet the planning needs of the specific program (e.g. prior to program reviews).
DHIS2 is able to support these different frequencies of data quality review. This toolkit will focus on measures involved in the routine review of data quality as general observations indicate this can be challenging to implement in practice. These routine practices can be built on and used for the purposes of discrete and periodic review as needed.
During a typical review of data quality, there are 4 measures of data quality that are typically assessed:
Completeness is measured either by reviewing reporting rates for an entire reporting form/data set or by reviewing the completeness of specific data elements within reporting forms when additional accuracy is required.
Data set completeness - reporting rates
In DHIS2, reporting rate completeness = Received reports/expected reports x 100%
Received reports: the number of data sets for a given period and organisation unit which have been marked as complete by the data entry clerk, using the “complete” button in the data entry app
Expected reports: the number of organisation units a data set is assigned to based on the reporting period the data set should be reported on. For a monthly dataset assigned to 100 facilities we expect 100 reports in a month.
Data set timeliness
Reporting timeliness: Received reports on time/expected reports x 100%
“On time” is dependent on the configuration within a country or organization, and is often based on procedures that have been locally defined. For example, in a monthly reporting form on time could be defined as 15 days after the end of the previous reporting month. In that case, submitting data by June 15 for May data would be considered timely.
Data element completeness
The goal of a data element reporting rate is to assess the reporting consistency of a single variable. This is applicable to aggregate data elements only.
Data element completeness = Number of received values / Number of expected values x 100%
This section in this toolkit describes completeness and timeliness measures in DHIS2 in more detail.
Internal consistency is meant to compare internal data sources to determine if there are significant variations based on either statistical rules or logical comparisons. In DHIS2, we can support the review of internal consistency through several measures including:
External consistency is meant to compare your data with data from other sources. For example, you could compare data in a routine health information system with data collected from a survey. If this external data is imported into DHIS2, several comparative measures can be used to review external consistency via data visualizer, the WHO data quality app and through the use of validation rules.
This measure reviews the denominators that are used to calculate coverage. This can involve aspects of both internal and external consistency. For example, comparing related census population estimates such as estimated pregnant women, estimated live births and estimates of <1 year would be an internal comparison; while comparing these census measures with UN population estimates would be an example of external consistency.
As much as possible, data quality issues should be detected and addressed as early as possible. By the time data is entered into DHIS2, it will often have been recorded first on patient cards or registers, then manually tallied into tally sheets, before the data is aggregated into weekly, monthly or quarterly values and recorded in aggregate facility reporting forms. Finally, data from these aggregate forms is entered into DHIS2. The design and quality of all these different tools, and the training provided and time allocated to staff to correctly perform these data collection activities are critical for the quality of the data.
Design of the data collection forms is an often overlooked element of good data quality. Design of paper-based data collection tools and forms is beyond the scope of this document, but well-designed paper based forms which are easy for data collection staff to fill out are an important factor in improving data quality. Forms which are extremely complex may be difficult to fill out on paper, leading to possible transcription errors on the original paper form. These errors may then be propagated into digital form (i.e. DHIS2) when electronic data entry takes place.
Data entry forms in DHIS2 can either be auto-generated (default or section forms) or have custom design (custom forms). Using HTML and JavaScript, complex custom forms can be created by DHIS2 implementers which can mimic very closely the layout and design of a paper form. So-called section forms are auto-generated by DHIS2, and consist of sections of data which share a common type of disaggregation. Section forms are generally easier to maintain and work well on mobile devices such as Android. Section forms should be the preferred option when possible. Section forms however may not align with the design of paper forms, which may complicate the process of data entry, thereby leading to a higher likelihood of mistakes being made during the transcription process.
Custom forms are sometimes necessary to be able to make a data entry form that makes it easy to transfer from paper to digital; however, custom forms are sensitive to changes in the underlying metadata (e.g. data elements and category dimensions). This may lead to data being entered into the incorrect data element/category option combination without the user noticing it. Complicated custom forms may also require extra work to make “tabbing” between cells work correctly, which is important for efficient data entry without errors.
More generally, data entry forms that are overwhelmingly big (such as tables with 100+ rows x 10+ columns, not uncommon for recording morbidity data) come with the risk of the data entry user losing track of what row/column (e.g. disease and age/sex disaggregation) data is being entered into.
While we will not cover all the aspects of creating data entry forms here, consider some of these items in your design prior to configuring any data set in DHIS2 as this may aid in reducing some potential data quality issues before they arise.
It is also critical that data elements are configured with the appropriate value types, to allow only the right type of data values to be saved. For example, making sure data elements used for capturing service delivery usage, cases/deaths, number of tests etc should be configured as zero or positive integers, to prevent negative numbers or decimals.
Validation rules are a critical component of ensuring that individual data values which are related follow defined patterns. As a simple example, it is not possible to have more people who test positive for malaria than the number of people who were tested for malaria. Similarly, if there are any people who have tested positive for malaria, there should be at least as many people who were tested.
In DHIS2, validation rules consist of two values (a left side and a right side) which are compared using a mathematical operator (less than, greater than, etc) to produce a logical true or false result. Validation rules compare values which are within DHIS2, at the level of capture and periodicity as defined by the validation rule. Using our examples above, a validation rule can look like the following in DHIS2:

If this data is collected monthly at the facility level, then it can be compared at least every month at the facility level, and additionally can be run at higher levels and lower frequencies if needed (for example, at district level for a year).
Note that validation rules are not triggered when working offline in the web-based Data entry app; however they do work offline when using the DHIS2 android application on a mobile device.
Let us create the validation rule example we have mentioned previously in DHIS2. As malaria testing can be performed using different methods, we will create this rule specifically for RDT tests.



Review the fields that will be used to describe the rule. You will need to enter a name, select the importance and period type and define your left side, right side and operator at minimum.
Add a name. The name must be unique among the validation rules in the system. Try to make it descriptive so you understand what it is representing. In this example, we could use the name “MAL - Positive (RDT) <= Tested (RDT).”
Add an instruction. This field is not required, but this is what the user will see in both validation analysis as well as when reviewing validation rules in data entry. For this reason, it is recommended that an instruction is always in place to make it clear to the user how to review the validation rule.
(Optional) Assign the rule a short name, code, description.

Select an Importance: High, Medium or Low. This is a description of the validation rule that will be displayed to the user and does not affect priority or whether it is run or not.
Select a Period type. Note that you can not select a period type that is less than the frequency of data entry. If your data is collected monthly, you can not set the period as weekly for example.
Create the left side of the expression:
| Option | Description |
|---|---|
| Never skip | The validation rule will never be skipped in case of missing data, and all missing operands will be treated effectively as a zero. This is the default option. Always select this option if you use the Exclusive pair or Compulsory pair operator. |
| Skip if all values are missing | The validation rule will be skipped only if all of the operands which compose it are missing |
| Skip if any value is missing | The validation rule will be skipped if any of the values which compose the expression are missing. |
| 4. Type a Description. | |
| 5. Build an expression based on the available data elements, program objects, organisation units, counts and constants. To do this, In the right pane, double-click the data objects you want to include in the expression. Combine them with the mathematical operators located below the left pane. |
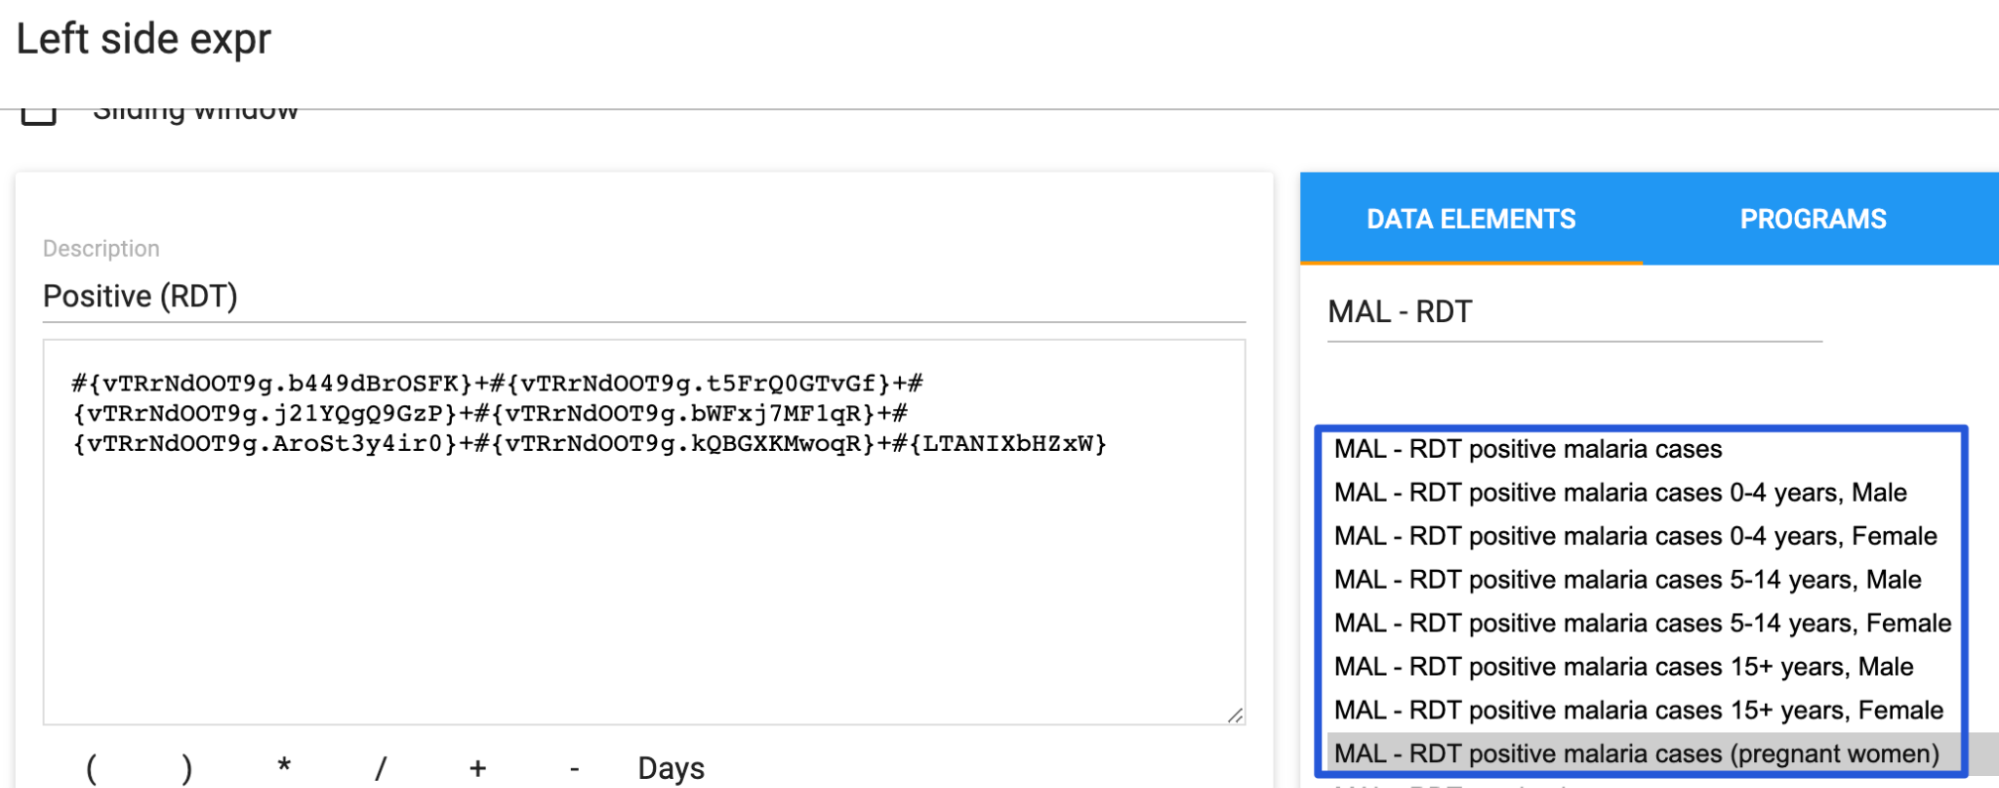
Note:

It is recommended to use the disaggregated data elements instead of the total data element as shown in the figure above i.e. all of the positive malaria cases by age and sex as we see here. This is because during validation rule analysis, when looking at the details, if the total data element was selected the details will be empty and you will not be able to drill down to identify where the problem originates from.

Select an Operator: Compulsory pair, Equal to, Exclusive pair, Greater than, Greater than or equal to or Not equal to.
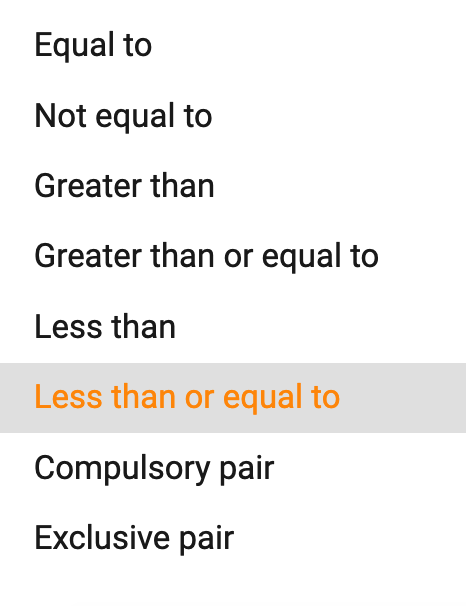

(Optional) Choose which Organisation unit levels this rule should be evaluated for. Leaving this empty will cause the validation rule to be evaluated at all levels and is the most frequently used option.
(Optional) Click Skip this rule during form validation to avoid triggering this rule while doing data entry. Normally this is not selected so the user can also review this validation rule during data entry
Click Save to save the validation rule
After we have created our validation rules, we should group them together. Grouping similar validation rules together helps in particular when reviewing the validation rules together in bulk analysis.
Go to Maintenance> Validation> Validation Group

Select the add button and fill in the details of the validation group (the name, code and description).

Add in all of the related validation rules that you have made to group by selecting them from the left pane and moving them to the right pane. When you have added all of your related rules to the group, select “Save.” How to best define groups depends on how data elements and data sets are structured in a particular implementation. However, examples can be:
As each system will have a different configuration, validation rules will need to be made as outlined in the “Configuring validation rules” section in this document prior to reviewing any violations. Once you have made all of the validation rules you require, you will want to use them to check your data on a routine basis. We can review validation rules in both data entry as well as through validation analysis[SECTION LINK]. When reviewing validation rules, we will only be alerted to those rules that are violated; not those that pass the checks we have created.
Let us take a look at our example again
We can start by reviewing our validation rules in the data entry app. We have set the period for the validation rule we have defined as “monthly” as the data for malaria is collected monthly. In our example, the data comes from the following table

In order to check if there is any issue with our data based on the validation rules we have defined, we can scroll either to the top or bottom of the data set within the data entry app and select “Run validation” [Note: validation rules will also run if you select “Complete” at the bottom of the data entry screen].

This will run any of the validation rules that are using data elements within the data set you have selected.
We can see the results within a pop-up window showing us the validation rules that have been violated when checked within data entry.
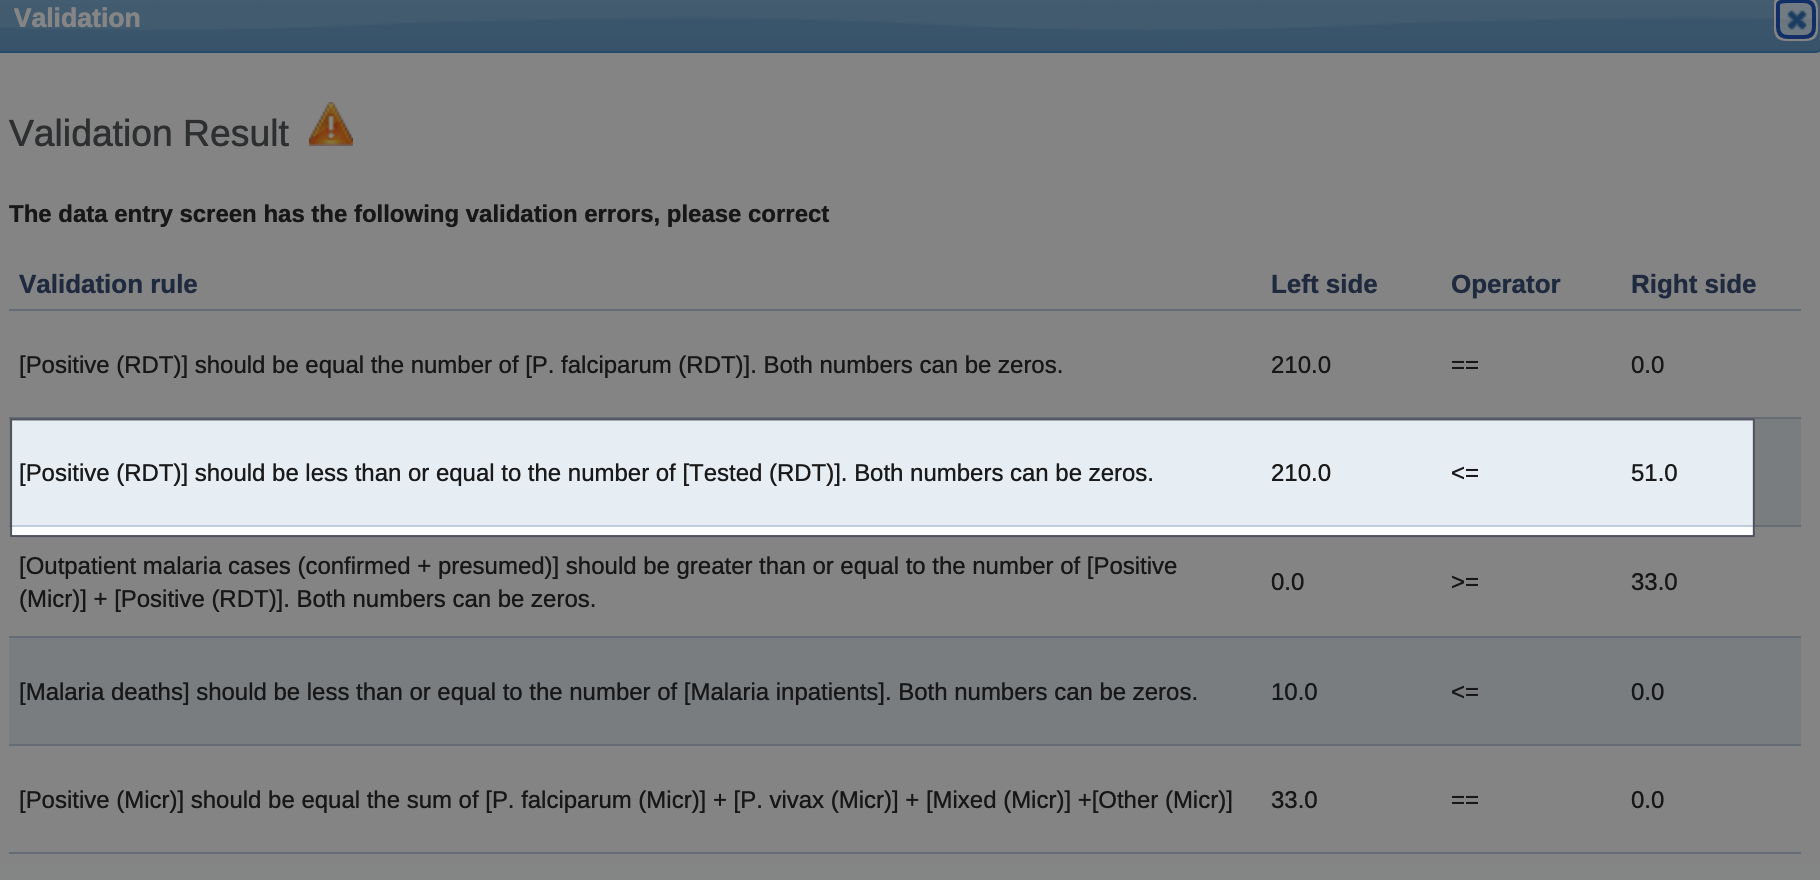
We can see there are multiple violations, including the rule that was created previously. At this time, it would be a good idea to review each of these rules to ensure that the data values in this dataset have been entered correctly before finalizing the data entry process. If possible, incorrect values should be changed in order to minimize errors at the source of collection.
Reviewing our example we can see an obvious error and would want to correct this to the correct value


If we go through and correct all the errors that were identified as part of running validation within this dataset, period and organisation unit combination and run validation again, we should get a message indicating that validation has passed successfully.

Ideally, we should strive to have validation rules created prior to performing training on data entry for a particular program, as it would allow you to perform training on validation violations and correction during training. During training, you should then make sure all data sets successfully pass validation where possible prior to submission.
Validation rules can also be run in the new data entry app (available from version 2.39). Do this by selecting either “Run validation” at any time or “Mark complete” if the data set is supposed to be completed.

Results will show on the right side of the data entry app, indicating the number of High, Medium and Low priority violations as well as listing the violations highlighted in the appropriate colour depending on the priority they have been assigned. We will see the new app displays the violations slightly differently then the previous data entry app, showing the instruction, then the left side along with its value, the operator, and the right side along with its value.

We would want to go through a similar process as described for the data entry app and review each of the values associated with these rules to determine if a correction can be made prior to proceeding with other operations in DHIS2.
Validation rule notifications provide a way to create messages that can be sent in response to a validation rule being violated. These notifications consist of the validation rule(s) which trigger the notification, recipient(s), and the message that is tied to the violation. The notifications can be sent out as messages to intended recipients using 3 mechanisms within DHIS2: e-mail, SMS and through the DHIS2 internal messaging service. Refer to the documentation for more information on configuring e-mail and SMS. Here is an example of a validation rule notification sent out via e-mail.

Regarding the creation and use validation rule notifications, we need to be careful to ensure that the results within a message are not ignored. Usually, we would be conservative in the number of notifications we are creating so that users do not receive too many messages. Experience dictates that when this is the case, users tend to ignore these messages and areas that are actually problematic are not fixed. In general, create notifications for priority areas of correction and ensure that these notifications are being sent only to the users who need to see them. Other violations can be identified via routine data quality review procedures.
In order to create a validation rule notification, user groups are used to define the recipients. Please refer to the documentation on user groups to review how to create a user group in DHIS2.
Go to Maintenance> Validation> Validation Notification

Select the add button to review the details of a new validation notification. There are a number of fields that we can break down.



We can review an example of an output message to review how template variables and plain text appear within a notification when it is sent out.

We can see we can use a number of different variables to create our message and provide correct outputs to the person reviewing the notification.
To create the template, populate the message with a mix of free text and by selecting appropriate variables from the right side of the screen.
Once you are done filling in these fields, select "Save" to save the notification.
Validation rules are a powerful tool to prevent data entry errors, but if they are not configured in an appropriate way they can also be a source of error by nudging users to “fix” mistakes.
In some cases, there may be validation rules that you would like to create which are most often real data quality problems, but which may be falsely flagged by DHIS2. An example of this is the comparison between women making their first (ANC1) and fourth antenatal care visit (ANC4). Seen as an overall population, we can say that the number of ANC1 visits should be greater than or equal to the number of ANC4 visits. Every woman making a fourth visit has also made the first visit, but inevitably some women will not show up for their fourth appointment. Thus, ANC4 should always be less than or equal to ANC1; however, this is not appropriate as a validation rule, because ANC visits are spread over several months, and women may make different visits in different health facilities. For example, a health facility may have 100 ANC 1 visits and 74 ANC 4 visits in a year (ANC 1 ≥ ANC 4), but in one individual month there could be 9 women making their 4th visit and only 8 making their first visit (ANC 1 < ANC 4). This is not a data quality problem, but would be recorded as such with a validation rule comparing ANC1 and ANC4.
We recommend not creating validation rules in these instances, as this may be confusing to the data entry user seeing the validation rule warning, and they may in the worst case edit the data to meet the validation rule criteria. If you do create this type of validation rule, the message to users should clearly state that the validation rule warning should be examined, but may not be an actual data quality problem in all cases.
The health data toolkits - specifically the various aggregate metadata packages - includes validation rules for different health programmes
The “Min-Max” functionality of DHIS2 is a set of features that allows you to check for outliers in the data during data entry. The min-max value is based on setting minimum and maximum accepted values for a combination of data element, category option combination and organization unit. During data entry, values outside these minimum and maximum thresholds are highlighted in the data entry screen. Similar to validation rules, if a data value is outside the boundaries defined by the min/max values, DHIS2 will still allow the data value in question to be saved. However, the value will be highlighted in the data entry screen and a dialog box will be displayed which the user will need to acknowledge.
There are two main advantages with the min-max functionality:
It allows data quality issues to be detected and flagged at the point of data entry, so that the user entering data can immediately verify the data, correct typos etc.
Unlike validation rules, that can only be defined when there are multiple data elements with a logical relationship between them, min-max values can be set for any numeric data element for which a minimum of historical data is available.
Note: for data sets disaggregated with an attribute category combination, the min-max values applies to all attribute option combinations.
Min-max values can either be set manually in the data entry app, or using methods that calculate minimum and maximum values based on statistical methods from historical data. Note that for reasons outlined in further detail below, we do not recommend using the tool built in to DHIS2 to generate min-max values. We discuss these limitations here.
Min-max values can currently only be viewed within the data entry app; the dedicated “min-max analysis” component of the Data quality app has been deprecated.
In the data entry app, double clicking within an input field (i.e. the cells for data entry) open a pop-up window with information about that particular data element and category option combination.

The section in the top right corner of the window shows any currently set min-max limits, and allows users with the appropriate permissions to remove and/or save new min-max values. As explained below, these values will then be applicable to that particular combination of data element, category option combination and organization units. The Data element history graph will also show the maximum value when set.
In the data entry (beta) app, information about min-max values is shown by highlighting an input field (i.e. the cells for data entry) and clicking the View details button in the toolbar at the bottom of the app.
This opens a Details panel on the right side of the screen, with a dedicated section for min-max limits. Any user can see the currently set min-max values, and users with the appropriate permissions can also edit or delete them.

DHIS2 includes functionality to generate and remove min-max values in bulk for one or more data sets for a selection of organisation units. This functionality is found in the Data administration app. Follow these steps to generate or remove min-max values in bulk:
Note: min-max values are only generated for combinations for data element, category option combination and orgunit for which data already exists, and this happens independently of how the data set is assigned.

DHIS2 generates min-max values by determining the mean of all existing data values (for a given data element/category option combo/organisation unit combination) and then calculating lower and upper bounds based on a certain number of standard deviations from this mean. The number of standard deviations that is used is based on a system setting property called Data analysis std dev factor. The default value that is used is 2 standard deviations. This can be changed in the System settings app, under the General section.

As a general rule, we do not recommend using the Min-Max value generation tool with its current functionality, as it has several major limitations that causes it to generate min-max values that are too restrictive. This means too many values will be flagged as potentially wrong in the data entry app, which can both be a nuisance to data entry personnel and potentially lead them to incorrectly edit values so that they are within the limits.
There are some cases where this functionality might work sufficiently well to be used: if there is enough historical data to base the statistical analysis on, data is reasonably normally distributed (i.e. not seasonal, and not changing over time), and there are no facilities that always report very low numbers. In reality, however, there are very few cases where this is the case. In practice, one or more of these requirements are most often not met:
There will be certain small health facilities that consistently report very low numbers every month. In a hypothetical example of a health facility that reports values of 2 or 3 every second month in one year, the threshold based on 2 standard deviations above/below the mean will be 1,5 and 3,5. In other words, if the facility reports 1 or 4 in a month it would be outside the threshold.
Data is very often not normally distributed. The typical example of this is data associated with rainy seasons, such as malaria. However, even data that is not typically considered seasonal will have certain months in the year with higher or lower numbers, for example reproductive health (including as a consequence immunizations, PMTCT etc).
Min-max values will be generated for all combinations of data element, category option combination and orgunit for which there is any value. So for example, even is a health facility has only recently started reporting in DHIS2 and data only exists for a couple of months, min-max values will be generated - but from a very limited basis.
Because the built in min-max generation can only be done based on the mean of the existing data, it is sensitive to any existing outliers.
There is a DHIS2 API that allows saving and removing min-max values. It is therefore possible to generate the min-max values outside using other tools, and then import them via the API. A limitation of this approach is that the API only allows you to POST or DELETE individual values (for one data element, category option combination, orgunit combination). However, since this min-max does not need to be updated frequently (unlike for example analytics) it is possible to work around this limitation.
A prototype to test improved methods for generating min-max values has been developed. This is a python tool created with more flexibility in mind for the generation of min-max values. Detailed documentation on how to use this tool is available in the github repository.
This tool is designed to address the main shortcomings of the built-in min-max generation functionality:
It allows setting different parameters according to the median values reported by orgunits; for example, min-max for small facilities can be set based on the previously highest values rather than standard deviations, and larger facilities can have a stricter threshold.
It allows setting a minimum completeness of data for an orgunit before it tries to generate min-max values.
It allows doing normalization of data using box-cox transformation before setting min-max values, to work better with data that is not normally distributed.
Note: the tool is for now only a prototype, and should be tested thoroughly in a test environment before it is used in a production environment.
No user action is required to review min-max values in the data entry app: when a number outside the specified min-max value is entered, a pop-up window immediately appears with a warning message, and the cell is highlighted in dark orange.


Upon marking the data set as complete or using the Run validation button, the min-max violations are also listed in a similar way as validation rule violations.

Min-max values can be reviewed in batch as part of Outlier detection in the Data Quality app. Min-max is available as one of the available “Algorithms”.

To perform an analysis of values outside the min-max thresholds:
The result is presented as a list showing the data element, period and organization unit where a value outside the min and max thresholds have been reported.

The Value column is the reported data value, Deviation is how much above the max or below the min thresholds the number is, and the Min and Max columns show the min-max thresholds for the particular data element and organization unit. The table is sorted by Deviation, since the violations with the highest deviation have the biggest impact on the overall data. Follow-up allows data values to be marked for follow-up; they can then be review later using the Follow-up analysis functionality.
DHIS2 has a wide range of functions for assessing data quality, available across different apps and functions, and this section gives and overview of this functionality. It is structured according to three types of data quality metrics:
Completeness of reporting gives an indication of how much of the expected data has actually been reported. In DHIS2, most of the completeness checks are based on assessing the data set completeness, i.e. how many data sets (forms) have been submitted by organisation unit and period. The timeliness calculation is based on a system setting called "Days after period end to qualify for timely data submission."
The built-in functionality for completeness and timeliness in DHIS2, e.g. what is built into the Data Visualizer, Reports and Maps application, refers to data set reporting rates. However, we can also configure DHIS2 to assess the proportion of facilities that are consistently reporting, as well as the completeness of individual data elements.
The completeness reports will also show which organisation units in an area are reporting on time, and the percentage of timely reporting facilities in a given area.
Data set completeness and timeliness can be reviewed in the reports app as well as core visualization apps (Data visualizer and Maps). The core visualization apps allow for you to review completeness and timeliness in more significant detail across multiple org units and periods; however the reports app has a simplified user experience that has been validated by its widely observed use in comparison to other apps within DHIS2.
In order to review completeness and timeliness within the reports app, navigate to apps -> Reports

From here, select “Get Report” under the Reporting Rate Summary heading

Start by selecting your inputs:
Which organisation units you want to review. You select the parent organsation unit, and all of the children within that parent will be selected (along with the overall result for the organisation unit selected).
Select the data set you want to review completeness and timeliness information.
Selecting the reporting period, followed by the period itself/

If you select Show more options, you can use an organisation unit group set to select organisation unit groups to further filter your report; however this is optional.

After you have selected all of your inputs, select “Get report” to produce the report.

This will produce a report with the following columns
Name: The name of the organisation unit
[Dataset name] - Actual reports: This is the number of reports within the period you selected that were marked as complete
[Dataset name] - Expected reports: This is the number of expected reports within the period you selected. This is automatically calculated based on the time dimension and the assignment of the data set to orgunits.
[Dataset name] - Reporting rate: This is the reporting rate: actual reports reports/expected reports x 100%
[Dataset name] - Actual reports on time: This is the number of reports within the period you selected that were marked as complete within the timeframe that is defined as “on time” for the selected dataset
[Dataset name] - Reporting rate on time : This rate = actual reports reports on time /expected reports x 100%
In data visualizer, you will be able to review dataset completeness and timeliness measures similar to the reports app; however you are now free to select multiple data sets, periods and organisation units at the same time. You can also add completeness and timeliness measures to charts and tables that include other data, such as health service delivery data, to verify that the data you are reviewing is representative of the situation within the country you are working with. This gives you much more flexibility when compared to the reports app; however the additional options can make it less accessible compared to the reports app. Ideally, these visualizations are pre-made and placed on a dashboard for users to review routinely; however it is useful for a subset of users to know how to create outputs using these metrics within the data visualizer.
Within data visualizer, select your “Data” input, along with “Data Set” as the data type. This will allow you to search or add filters for the data set and metric type that you want to add to your visualization.
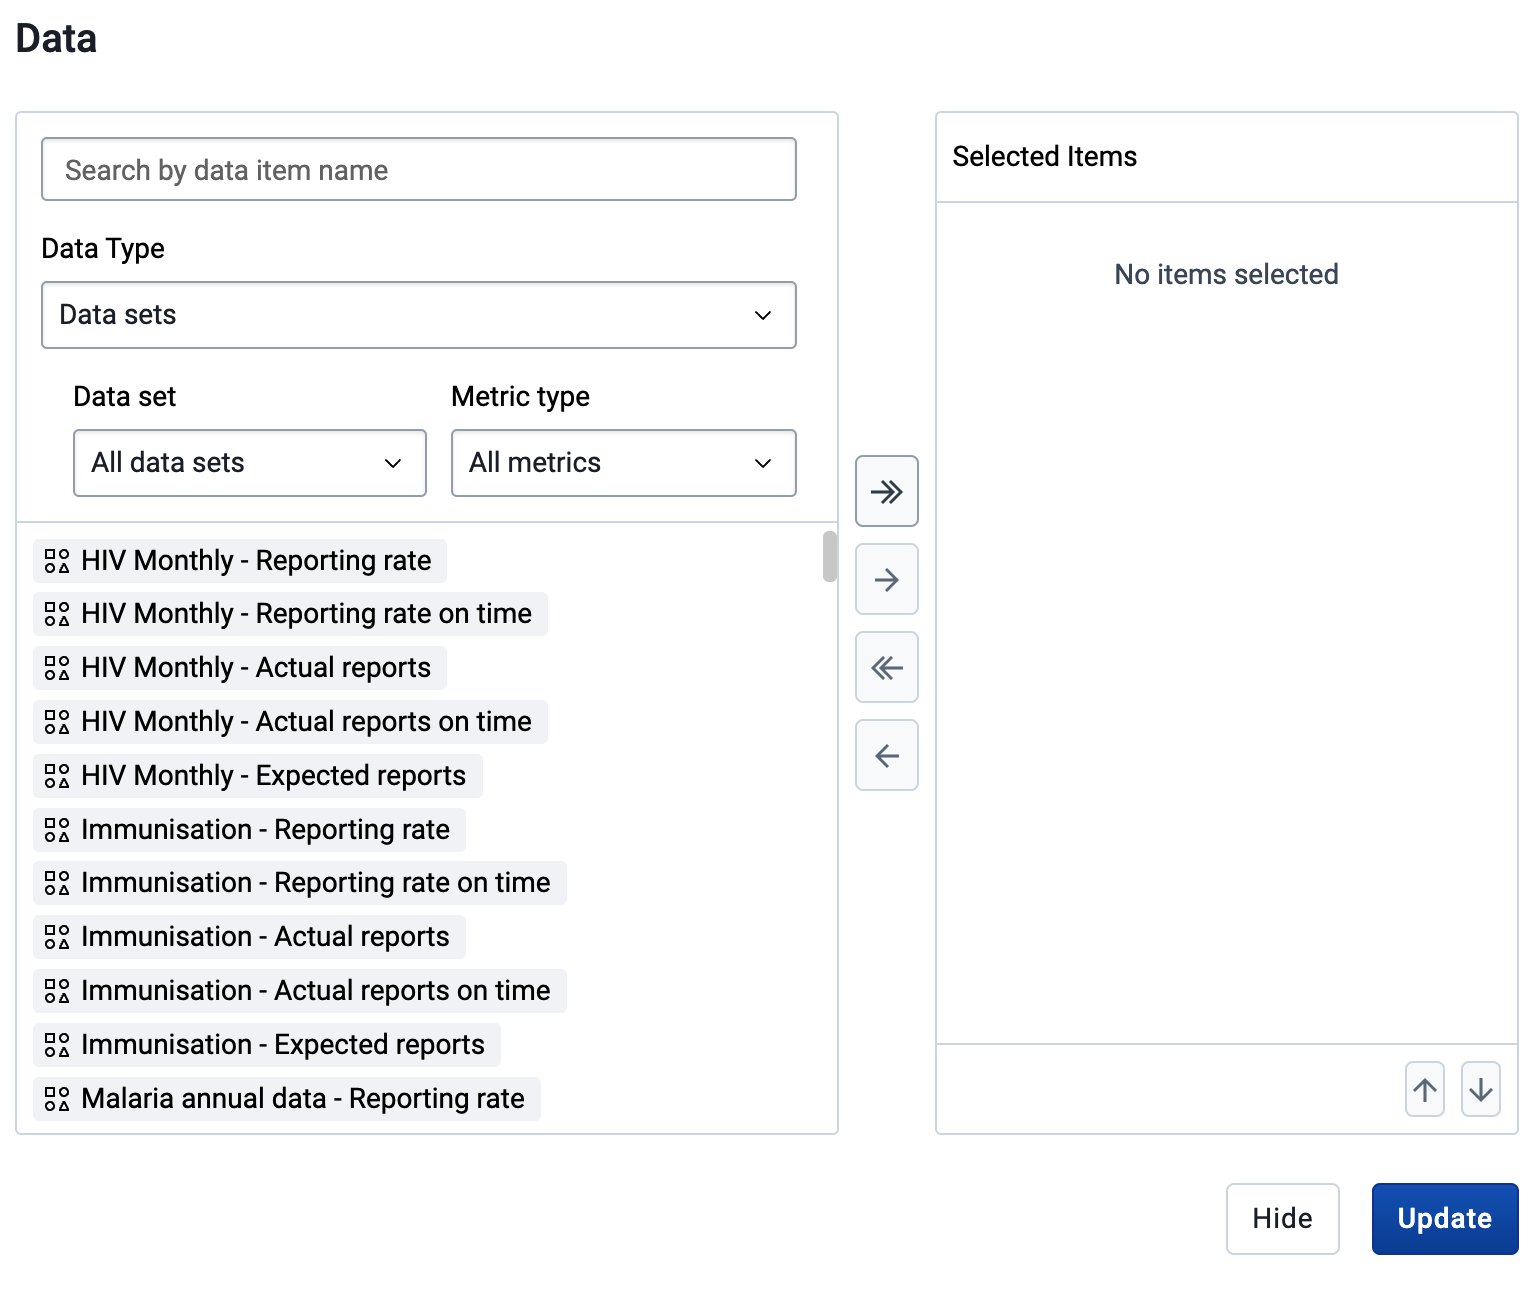
Here is an example of a chart comparing BCG doses given with the reporting rate of the immunization data set
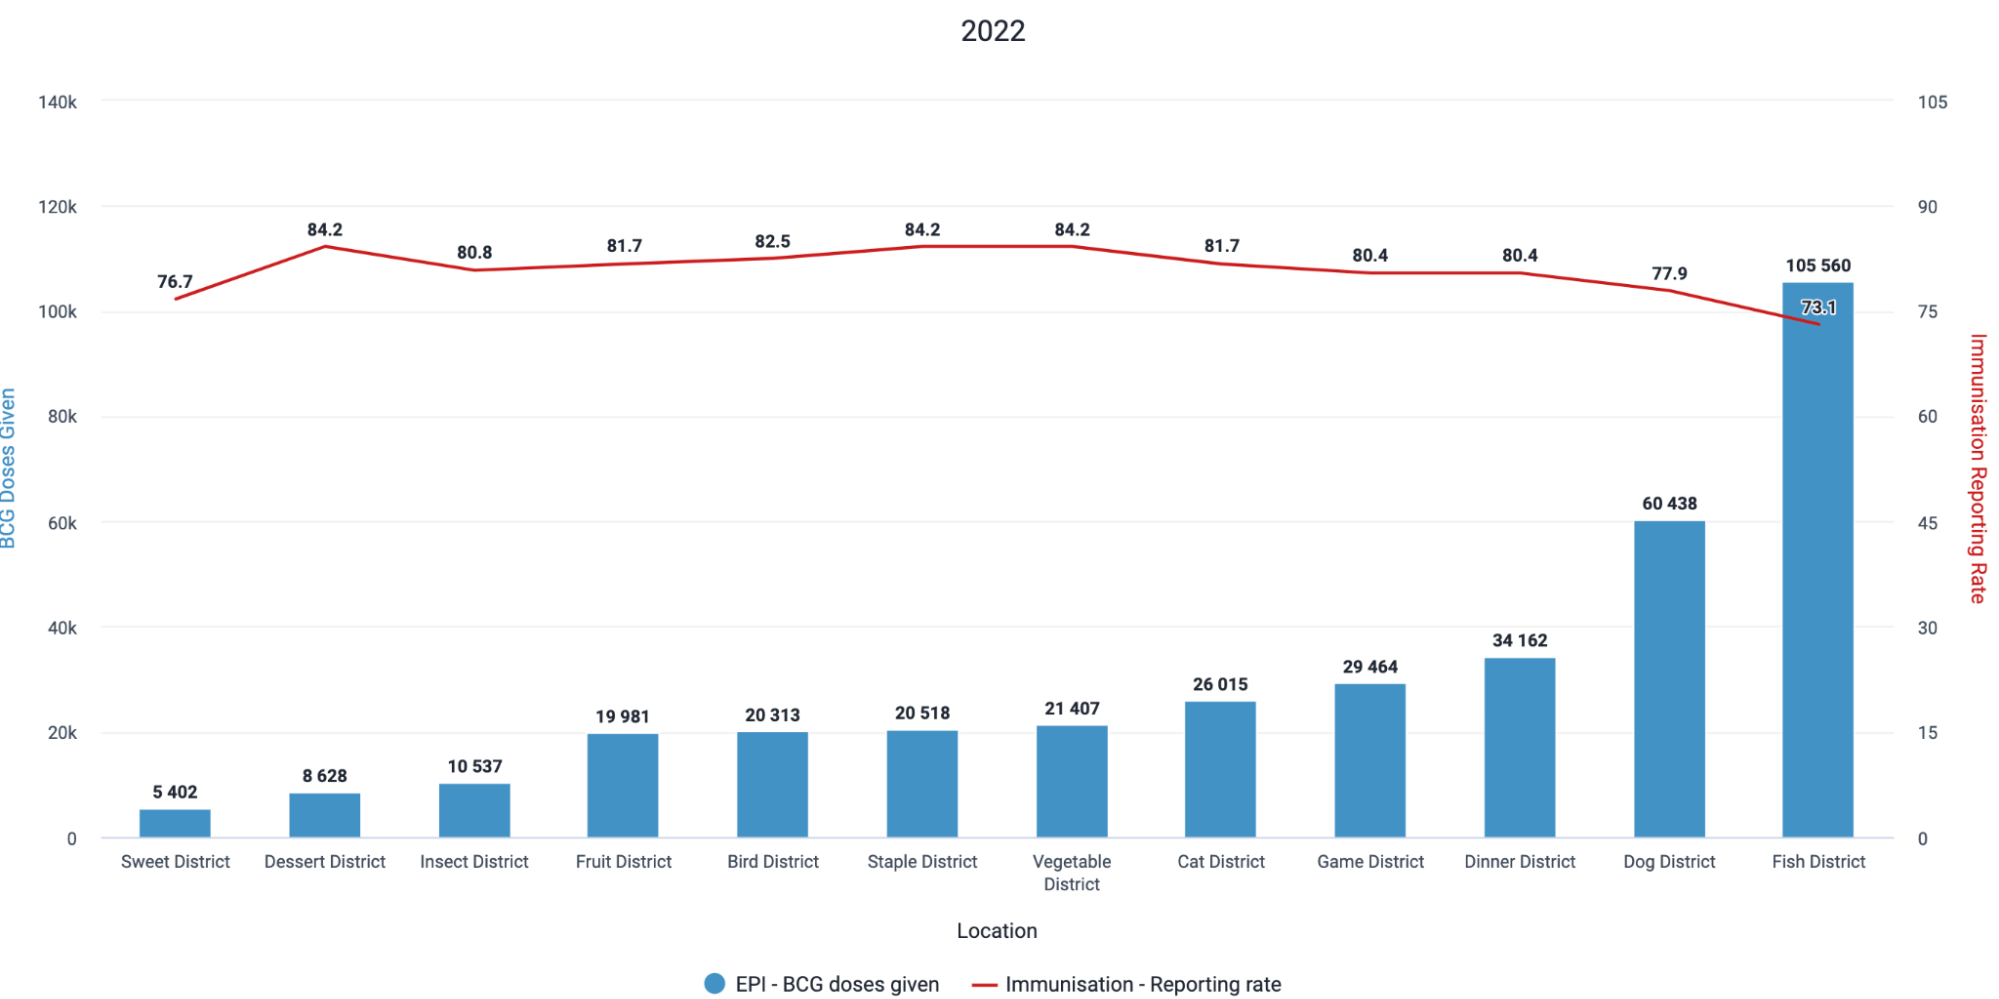
We can quickly note that several of the districts have reporting rates < 80%, and therefore the data being displayed may not be fully representative of the situation in the country. It may be important to verify this through a more detailed analysis reviewing the facilities affecting this value and/or using data element completeness.
We can go through some examples of tables and charts you could potentially create when reviewing completeness and timeliness within the data visualizer app
Select Pivot table as the output type


Either hide or update the data selector and proceed to modify your periods and organisation units
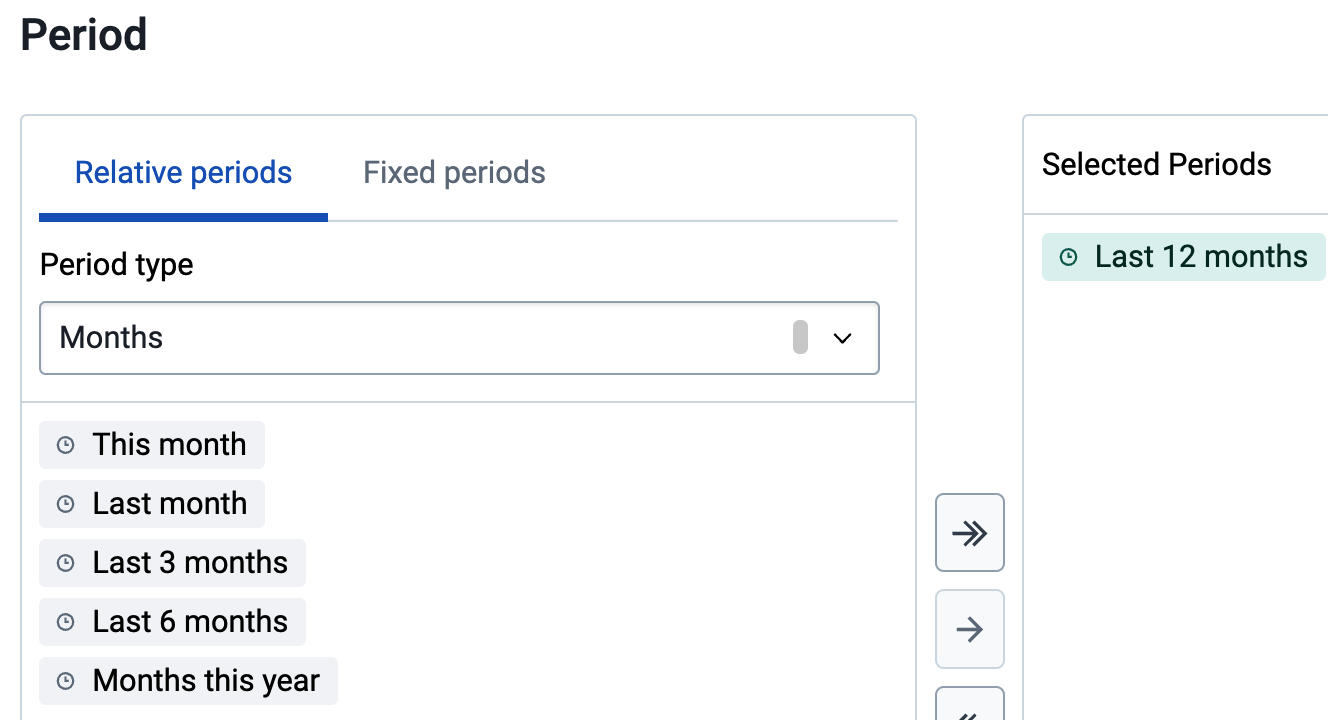
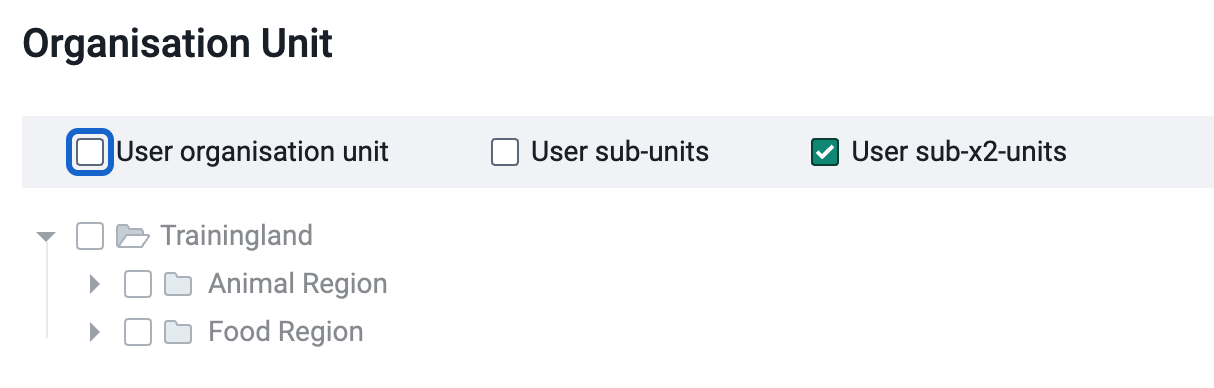
After all of your selections are made modify your layout and update your table

You should now be able to see the table with your inputs selected.

Select line as the output type
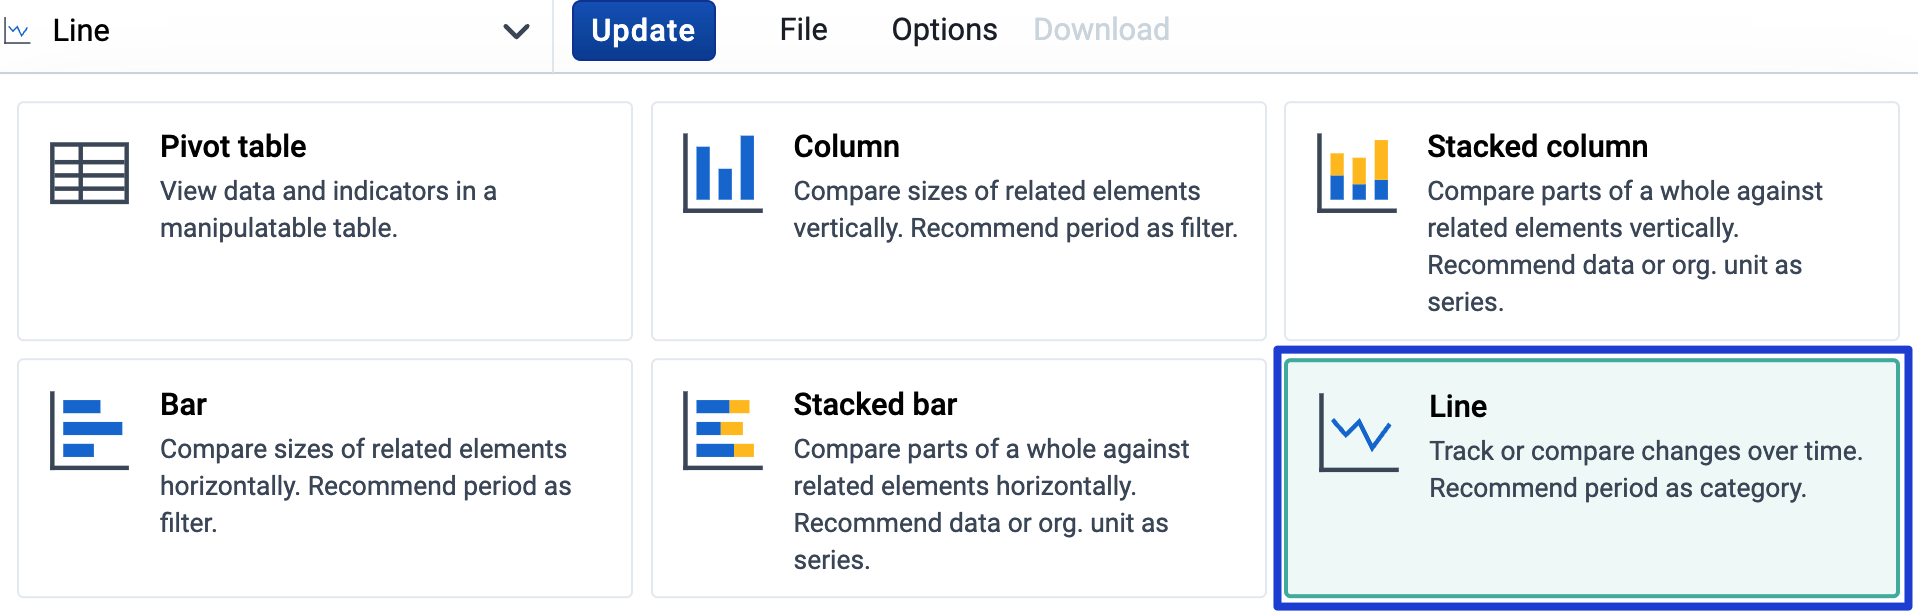
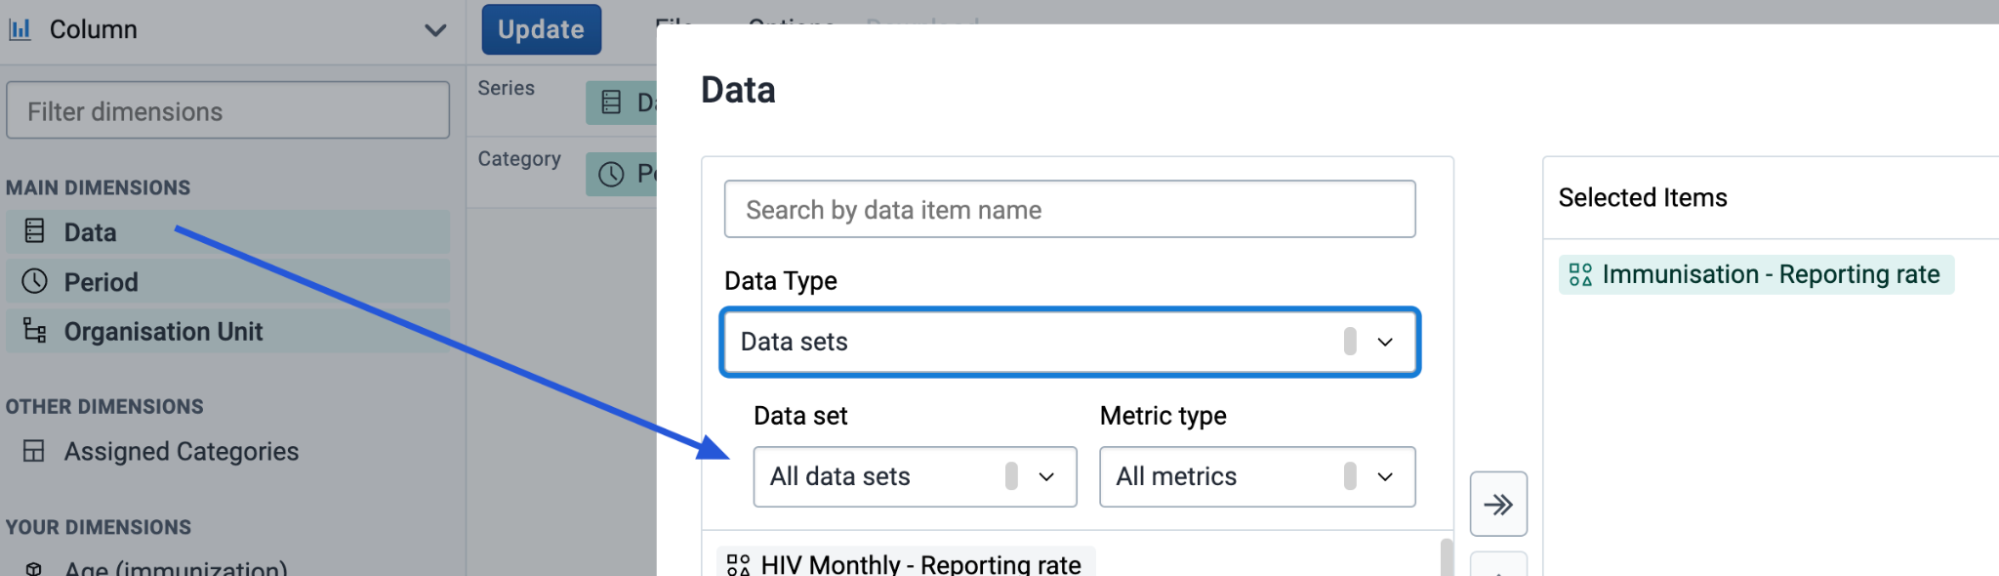

Select column as the output type


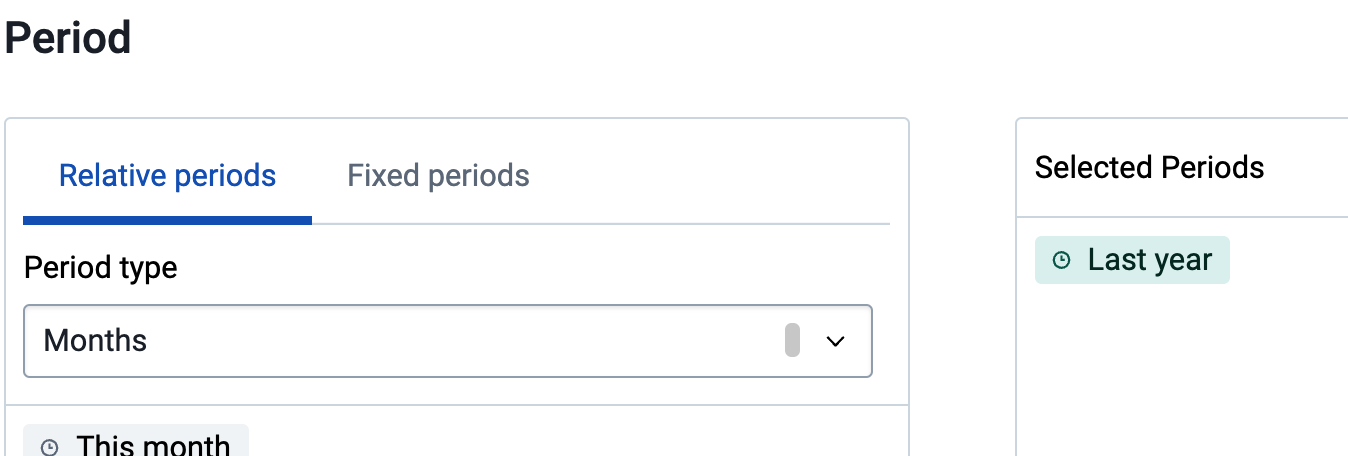


Data Set completeness is based on the organisation unit assignment of your dataset. This determines the value for your expected reports based on the periodicity of the dataset. This is configured within the maintenance app
Navigate to maintenance -> data set -> and select or create the intended data set. Within this data set scroll to the very bottom to find the organisation unit assignment

You can assign your dataset to organisation units by selecting them individually or using levels or groups.
The important factor to consider here is to make sure that the dataset IS NOT assigned to any organisation units that are not expected to report on the dataset. This is because the number of expected reports will be consistently incorrect. For example, in the above screenshot this dataset is assigned to 185 organisation units. Let us say that this dataset is reported on monthly. Each month, 185 submissions will be expected. If only 160 organisation units report on this data set, your completenesss will never exceed 160/185 x 100% = 86% in any given month. This is because those additional 25 organisation units will never fill in the data set as they are not meant to. This is a key consideration when assigning your dataset to organisation units correctly.
Timeliness is also configured within the maintenance app when creating or editing a dataset, using the field “days after period to qualify for a timely submission.”
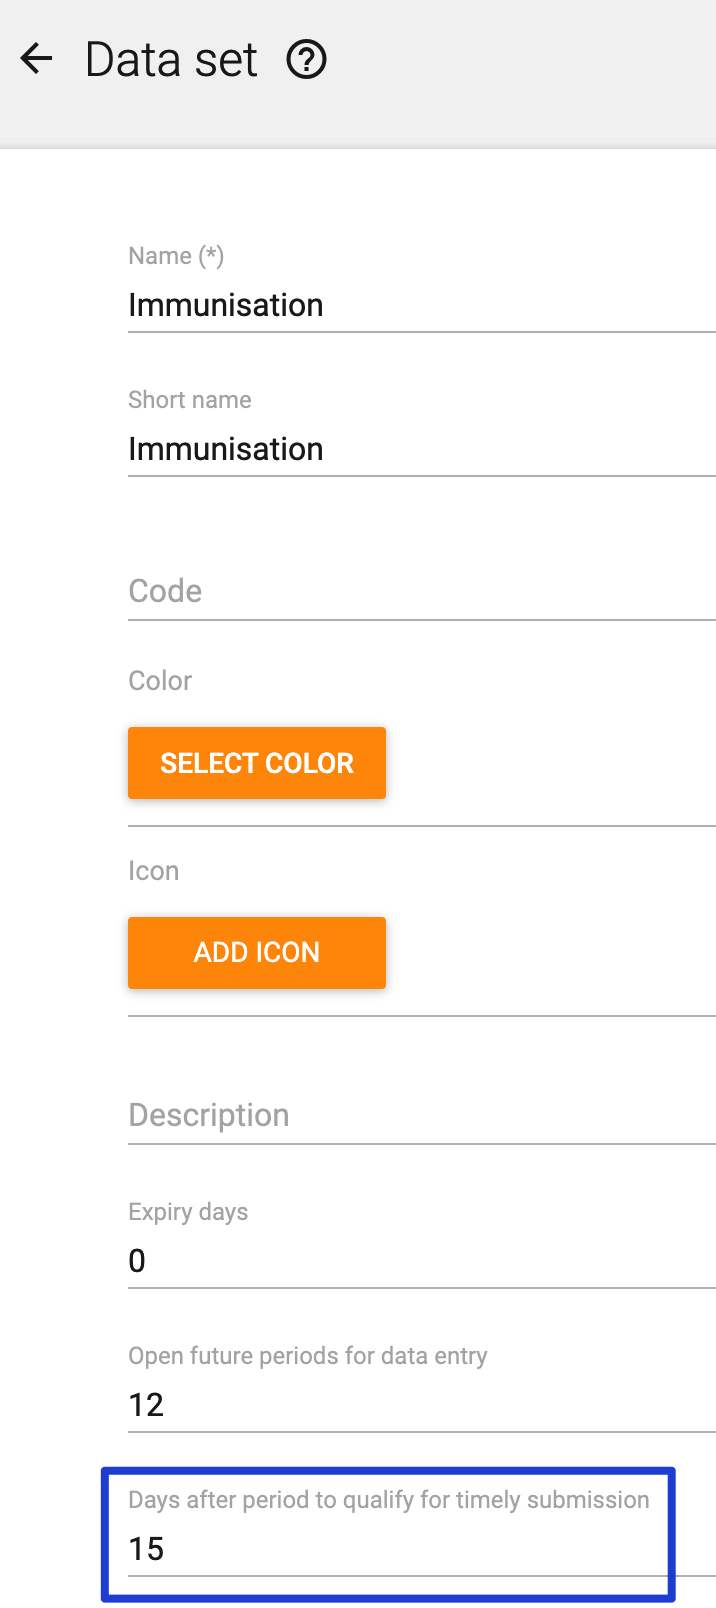
In the above example, the data set is collected monthly and the timeliness is set to 15. This means that the data set must be completed within 15 days after the end of the previous month in order to qualify as a timely submission.
Data set completeness and timeliness are useful measures to monitor the overall reporting performance of the system. However, there are several conditions that needs to be met for the data set completeness to give a representative indication of completeness of the data within the data set:
Users must remember to mark the data set as complete when data has been entered
User must actually enter data in the form before marking it as complete
Assignment of data set to orgunits (facilities) must be correct
Often, one or more of these conditions are not met, which means that it is necessary to also do additional analysis of the reporting completeness. In this section we show
How to analyse the proportion of facilities that consistently report data element values over a time period, and
How to analyse completeness of an individual data element
Common for the approaches outlined is that they require us to configure additional metadata for each variable we want to assess. In practice, this means that they can only be implemented for a limited set of data elements. The implementation section discusses this further.
Assessing the proportion of facilities that consistently report over a time period is a completeness metric that adds another dimension to our understanding of data completeness compared to the data set completeness. In cases where a subset of facilities only report intermittently, it is useful to know what percentage of health facility that consistently report over a certain time period, such as one year. For example, if in one month a dispensary reports and a district hospital does not, and the next month it is opposite, the completeness numbers will remain constant but the data on service delivery is likely quite different within that district.
We defined facilities consistently reporting as: 100 X (Facilities reporting every period within a time period)/(Facilities reporting in any period within a time period)
This check could in principle be done based both on the overall data set reporting, or based on a data element within the data set. In the example provided here, we show how to do the latter, since assessing this at the data set level could be achieved by looking at the annual data set reporting rate for individual facilities.
We will show how to make an indicator for percentage of orgunits (facilities) consistently reporting for one particular data element. It is not possible to calculate this as an indicator directly, so we will use predictors.
This means that we will configure:
Data elements:
Predictors:
Indicator:
In addition, visualisations should be made and shared with users, and we suggest organising the metadata in groups, and potentially also a data set for the data elements. Whether these groups should be in dedicated Data quality groups or part of existing groups for each health programme (or both) depends on the configuration standards and SoPs in a particular implementation; for clarity, the demo instance where an example of this configuration can be reviewed uses dedicated groups.
In the following, we will use ANC 1 (i.e. pregnant women making their first antenatal care visit) as an example.
Data elements are needed to hold the aggregate data values generated by the two predictors doing the actual calculations for this indicator. The data elements should be named according to local naming convention, be in the aggregate domain, and (in most cases) have value type Positive or zero integer.
For ANC 1, we could create these two data elements:
Next, we must set up two predictors to calculate the data values for our two data elements. Documentation on predictors is available here


Specify the period type of the predictor; this should match the period type of the data element we are assessing. In this example, we are assessing ANC 1, which we assume is collected monthly.
Specify the organisation unit level. For this data quality indicator, this should be the level at which data is collected, typically the facility level. \ We also need to make a selection in the “Organisation units providing data”, which should be “At selected level(s) only”, since we are calculating the consistently of reporting only based on the level we have selected as the data collection level.

Next, we must specify the Generator. This is where we define the actual expression for calculating the consistency of reporting.
To calculate the predictor for “number of orgunits reported in all the last 12 Months”, we use the formula “if( sum( if(isNotNull([data element]), 1, 0)) == 12, 1, 0)”

To calculate the predictor for “number of orgunits reported in _any _of the last 12 Months”, we use the formula “if(isNotNull([data element]),1,0)”
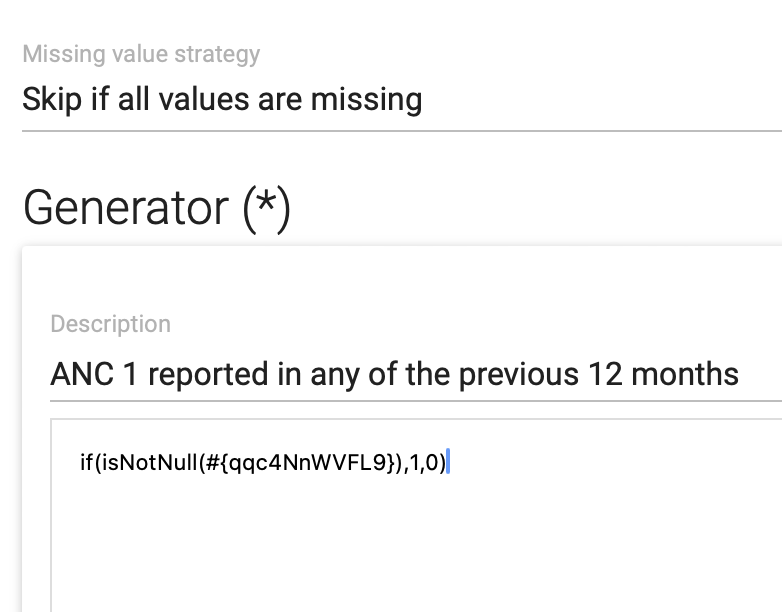
Finally, we need to specify the sample and skip counts. Sample skip test should not be set. Sequential sample count should be set to the number of periods we want to calculate the consistency of reporting for. For monthly data that we want to assess for one year, we should set the Sequential sample count to 12. This means that the 12 months preceding the period which we are generating the predictor for will be checked. \ Annual sample count and sequential sample count should both be 0.
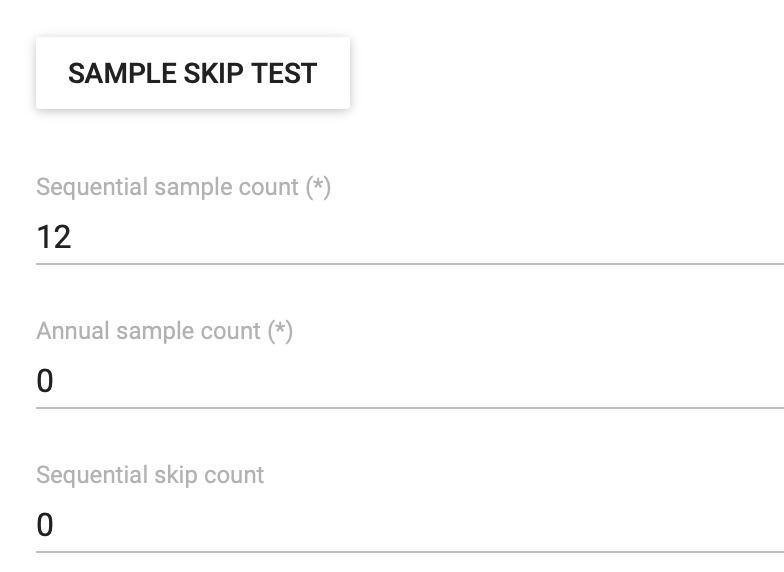
When the two data elements and two predictors have been defined, we can define the indicator that produces the actual data quality metric we are interested in: the percentage of facilities that have consistently reported a given data element in the last year.

The indicator should** not** be annualized, and the indicator type should be Percentage (factor = 100)
The numerator expression should be Facilities that have reported in all the previous 12 months (assuming the data is monthly)
The denominator expression should be Facilities that have reported in any of the previous 12 months (assuming the data is monthly)


After predictors have been generated and aggregate analytics have been run (see below, the indicator is available for use in the Data visualizer and Maps applications..
In some DHIS2 implementations it has been observed that reporting is inconsistent for all data elements in a data set. DHIS2 by default only assesses the reporting rates of data sets and not of the individual data elements in that data set. The goal of a data element reporting rate is to assess the reporting consistency of a single value. This is for aggregate data elements only.
A reporting rate is: 100 x (Number of received values / Number of expected values)
To calculate the reporting rate for a data element we have to define an indicator with the numerator (number of received values) and the denominator (number of expected values), and with a factor of 100 (percentage indicator type). While the numerator is always the count of data values, there are various options for defining the denominator, and which one of these is appropriate must be decided based on the local situation.
How data element completeness is configured in DHIS2 also depends on the DHIS2 version: some ways of defining the numerator and denominator requires that predictors are used as an intermediate step in the calculation, in particular in 2.37 and below. Note that predictors will need to be scheduled to run on the server, see the final section for guidance on instructions.
We first review how to define the numerator of our data element completeness indicator. As explained above, this will always be the count of data values that has been reported for a certain data element. There are nonetheless a few things that must be considered.
Zero value storage
For several reasons, it is generally recommended to not store zero values being reported for data elements unless there is a clear reason for it (for example the “aggregation type” being of a type where zeros are relevant, such as average). This has implications when reviewing data element completeness, since for data elements where zero values are not entered and stored we cannot differentiate between facilities that have 0 to report and facilities that have not reported. One option is to enable zero values storage for the specific data elements where you want to define data element completeness indicators. However, this is difficult to implement in practice since data entry users must then know for what specific data input fields a 0 is expected. A more practical option is to focus configuration of data element completeness on data elements where all or almost all facilities are expected to have a value > 0 to report, and being explicit in descriptions of the indicator and visualizations that reaching 100% data element completeness is not necessarily expected.
Disaggregations
How to take into consideration any disaggregations that might be applied to the data element is critical, because it affects how to configure the indicator expressions and also whether use of predictors are needed or not. For example, if a data element for a child vaccination such as BCG that is disaggregated by < 1 year and 1+ year, should the data element completeness be based on:
One specific category option combination. For example, “reported” means having reported for “BCG doses < 1 year”.
Both category option combinations. For example, “reported” means having reported for “BCG doses < 1 year” or “BCG doses < 1 year”.
Either of category option combination. For example, “reported” means having reported for “BCG doses < 1 year” or “BCG doses < 1 year”
The decision on this depends on the specific data element and disaggregation. For child vaccinations, the target age group for vaccinations is < 1 year, and it might be common that there is no data to report in the 1+ year age group. Thus it would make sense to define the completeness for < 1 year specifically. On the other hand, if “Confirmed malaria cases” is disaggregated into < 5 years and 5+ years, facilities can be expected to have a values for each age group and it would make sense to consider both values to be expected; in this case, the denominator must be adjusted accordingly.
The same consideration applies when data sets are disaggregated with an attribute option combination, though this is less common.
The following table outlines the alternative approaches for configuring the numerator, considering whether the data element is disaggregated, how to evaluate completeness of disaggregations when applicable, and whether they can be configured directly in indicators or first using predictors.
| 2.38 and above | 2.37 and below | |
|---|---|---|
| Data element with no disaggregation | Indicator (with subExpression) | Predictor |
| Data element with disaggregation - analysis of one category option combo | Indicator (with subExpression) | Predictor |
| Data element with disaggregations - counting each category option combo with a value as “reported” | Indicator (with subExpression); multiply denominator with number of categoryOptionCombos | Predictor |
| Data element with disaggregation - all category option combos must have value for data element to be “reported” | Predictor | Predictor |
| Data element with disaggregation - if any category option combos has a value the data element is considered “reported” | Predictor | Predictor |
We explain first how to configure the options that can be done with indicators directly, and then we show the configuration with predictors,
As explained above, the numerator should be the count of values for a data element (with or without disaggregation). From version 2.38, this can be done directly in an aggregate indicator using a subExpression with a isNotNull conditional statement in the expression. This will return a 1 value for any time there is a number (including zero) entered for this data element. An example is given below.
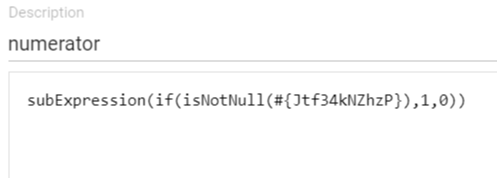
if(isNotNull([data element id]**), 1, 0) **will return 1 for every value for that data element, 0 otherwise.
If the data element has no disaggregation, it will return 1 or 0 depending on whether data has been reported.
If the id specified inside isNotNull() includes a specific category option combination (for example isNotNull(#{TWWbtMMWD51.JKuWbG5bWAu})), it will return 1 or 0 depending on whether data has been reported for that specific data element + category option combination
If the data element is disaggregated, but no category option combination is specified, it will return 1 for each data value across category option combination. So if a data element has a < 1 year, 1+ year disaggregation and a facility has reported a value for both, the expression will return 2. In this case, the denominator must be adjusted accordingly.
subExpression if(isNotNull([data element id])** ) **ensures that the if(isNotNull()) statement is executed at the level of data collection, before the expression is aggregated over time and up the organization unit hierarchy.
To summarise, what should be used as a expression for the numerator is:
| Method | Expression with example data element | |
|---|---|---|
| Data element with no disaggregation | Indicator | subExpression( if( isNotNull(#{TWWbtMMWD51}), 1, 0)) |
| Data element with disaggregation - analysis of one category option combo | Indicator | subExpression( if( isNotNull(#{TWWbtMMWD51.JKuWbG5bWAu}), 1, 0)) |
| Data element with disaggregations - counting each category option combo with a value as “reported” | Indicator; denominator must be adjusted | subExpression( if( isNotNull(#{TWWbtMMWD51}), 1, 0)) |
Versions 2.37 and below does not support subExpressions in indicators. For this you have to make a predictor that uses isNotNull() conditional statements in the generator.
As explained above, whether the data element is disaggregated or not, and how to account for the disaggregation in terms of completeness dictates exactly how the Generator expression should be defined. The following table shows each of the alternative approaches and the corresponding generator expression to use:
| Generator expression with sample data element | |
|---|---|
| Data element with no disaggregation | if( isNotNull(#{OWk2WulfJYQ}), 1, 0) |
| Data element with disaggregation - analysis of one category option combo | if( isNotNull(#{TWWbtMMWD51.JKuWbG5bWAu}), 1, 0) |
| Data element with disaggregations - counting each category option combo with a value as “reported” | if( isNotNull(#{TWWbtMMWD51.JKuWbG5bWAu}), 1, 0) + if( isNotNull(#{TWWbtMMWD51.UIQxmxgioxH}), 1, 0) |
| Data element with disaggregation - all category option combos must have value for data element to be “reported” | if( isNotNull(#{TWWbtMMWD51.JKuWbG5bWAu}) && isNotNull(#{TWWbtMMWD51.UIQxmxgioxH}), 1, 0) |
| Data element with disaggregation - if any category option combos has a value the data element is considered “reported” | if( isNotNull(#{OWk2WulfJYQ}), 1, 0) |
When you have decided on what appropriate approach, follow these steps to make the predictor:
Make your output data element.
Assign the output data element to your predictor.
Set the period type (typically monthly).
Assign the org unit level for the analysis (typically facility level).
Configure the generator as below.
Set the sequential sample count to 0
Set the annual sample count to 0
Leave the sequential skip count blank
Define the Generator, using one of the expressions outlined above.
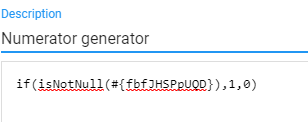
While the numerator for a data element completeness indicator is always the count of data values received (with some variations in how disaggregations are managed), there are several ways to define the “expected reports received” denominator. These options include:
Count of orgunits to which the data set(s) the data element is part of is assigned
Count of orgunits for which the data set(s) the data element is part of has been marked as completed (reported)
Count of reported values of another data element that is part of the same data set
Count of orgunits that have previously reported on the data element itself

Which of these options are appropriate depends several contextual factors, such as how correct and updated the assignment of data set is, and whether the purpose is to look at the overall completeness of the data element (how much of the true figure do I capture) or the completeness within a data set (how completely are facility staff and data entry clerks filling in the reporting form). Each option is outlined below, with instructions for configuration both in 2.38 and above, and 2.37 and below.
The first option is to use the assignment of the data set that the data element is part of as the basis for calculating completeness. This measure is quite similar to how the data set completeness (reporting rates) described above works. This option is relatively straightforward to configure, since the “expected reports” of a data set is available directly to use in indicator expressions. The main limitation of using the data set expected reports as the denominator for data element completeness is that it assumes that data set assignment is correct and kept up to date.
To use this as a denominator, simply choose the expected reports variable that is available when configuring the indicator denominator:

The denominator expression is R{[data set id].EXPECTED_REPORTS}, for example R{tQc4Gv2Jwco.EXPECTED_REPORTS}
Special care needs to be taken in cases where the same data element is reported in multiple data sets. If the data sets are not used in the same organization units, adding up the expected reports for each data set will give a correct denominator. However, if there is a risk that the same organization units will have two data sets assigned with the data element included, this option will not provide a reliable denominator.
Option 2 is similar to option 1, but instead of using the actual reports as denominator rather than expected reports. Choosing actual reports will give an indicator that assesses the completeness of the data element among the organization units that reported, i.e. a measure of how often a particular data element is filled in the data sets that are submitted.

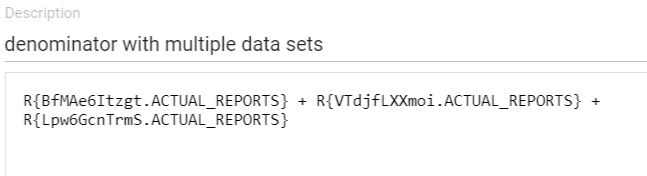
Again, special care needs to be taken in cases where the same data element is reported in multiple data sets. If the data sets are not used in the same organization units, adding up the expected reports for each data set will give a correct denominator. However, if there is a risk that the same organization units will have two data sets assigned with the data element included, this option will not provide a reliable denominator.
This option is based on using the number of reported values for another data element as the expected values in the completeness calculation. This other data element can be chosen based on different criteria, described below. Note that when looking at data element completeness based on other data elements, the results should be analyzed together with the overall data set completeness.
Based on data element in the same data set
This option is similar to the above, but using a data element reported in the same data set or data set section as the data element you are calculating the reporting rate for (numerator) - without necessarily being logically related. With this approach, you should choose a data element that is always (or often) reported on in the data set. For example, in a data set with maternal health data, more health facilities will likely report on a data element for “Antenatal care first visits” than for “Assisted delivery”, and “Antenatal care first visits” would therefore be a better estimation of the number of expected reports.
Based on core indicator
If the data element you want to get a reporting rate for is used in a key performance indicator calculation with routinely reported data in the denominator, using the count of values reported for the denominator to calculate completeness is recommended. This option is not viable if the data element is not used in an indicator calculations, or if the denominator is based on a population estimate or other value that is not reported with the same periodicity as the numerator.
As an example, consider the indicator Suspected cases tested for Malaria (%):
100 x (Malaria tested cases / Suspected cases)
In this case, it can be useful to look at the completeness of Malaria cases tested with the count of Suspected cases as denominator.
The advantage of this option is that it gives a good indication of the completeness/consistency of data used to calculate a particular core indicator.
Based on related data element
This option is similar to the above, but using a data element that is closely related to the data element in the numerator to calculate the denominator. For example, if you are looking at a reporting rate for inpatient malaria cases under 5 years (numerator), then you might consider using the count of inpatient malaria cases 5 years and above, inpatient malaria deaths, outpatient malaria cases or similar as denominator.
Configuration
Please refer to the section on how to configure the numerator[LINK] if using a related data element as denominator. The exact same considerations and configuration steps apply.
The final option is to use the count of facilities that have reported on the data element previously, within a given time frame, as denominator. This is similar to the denominator used for the indicator on “facilities consistently reporting.” This can be a good estimation of the number of expected reports, in particular in cases where data set assignment is not accurate: if a facilities has reported on a particular data element previously, it typically means the the facility is providing whatever service/diagnostic the data element represents and one can expect it should report on it routinely. However, the results should still be analyzed together with the overall data set completeness since it will not include facilities that are supposed to report, but have not done so in the given time period.
To calculate the count of times an orgunit has reported on the data element you are assessing in any of the previous last 12 months, we must use a predictor and extra data element. This is the same calculation as for the denominator described above in the section on Orgunits consistently reporting. In summary, a predictor with a generator
if(isNotNull([data element]**), 1, 0) **
and sequential sample count set to the number of previous periods you want to assess will produce the count to use as denominator.
The approaches outlined above for calculating data element completeness gives many alternatives in terms of how exactly to define the numerator and denominator, and allows us to produce indicators that can be used in charts, maps and tables on a dashboard. However, because they require us to add at least one new metadata object for every variable we want to assess, they are best suited to be configured for a subset of key data elements.
To get a better understanding of data element completeness of a large number of data elements within a data set, we can relatively easily produce this in the data visualizer app as a Pivot table or chart by following these steps:

In the Advanced section, change the Aggregation type to “Count”
Update the visualization, and optionally sort the total column from high to low (note: the total for “expected reports” will show NaN, but remain at the top)
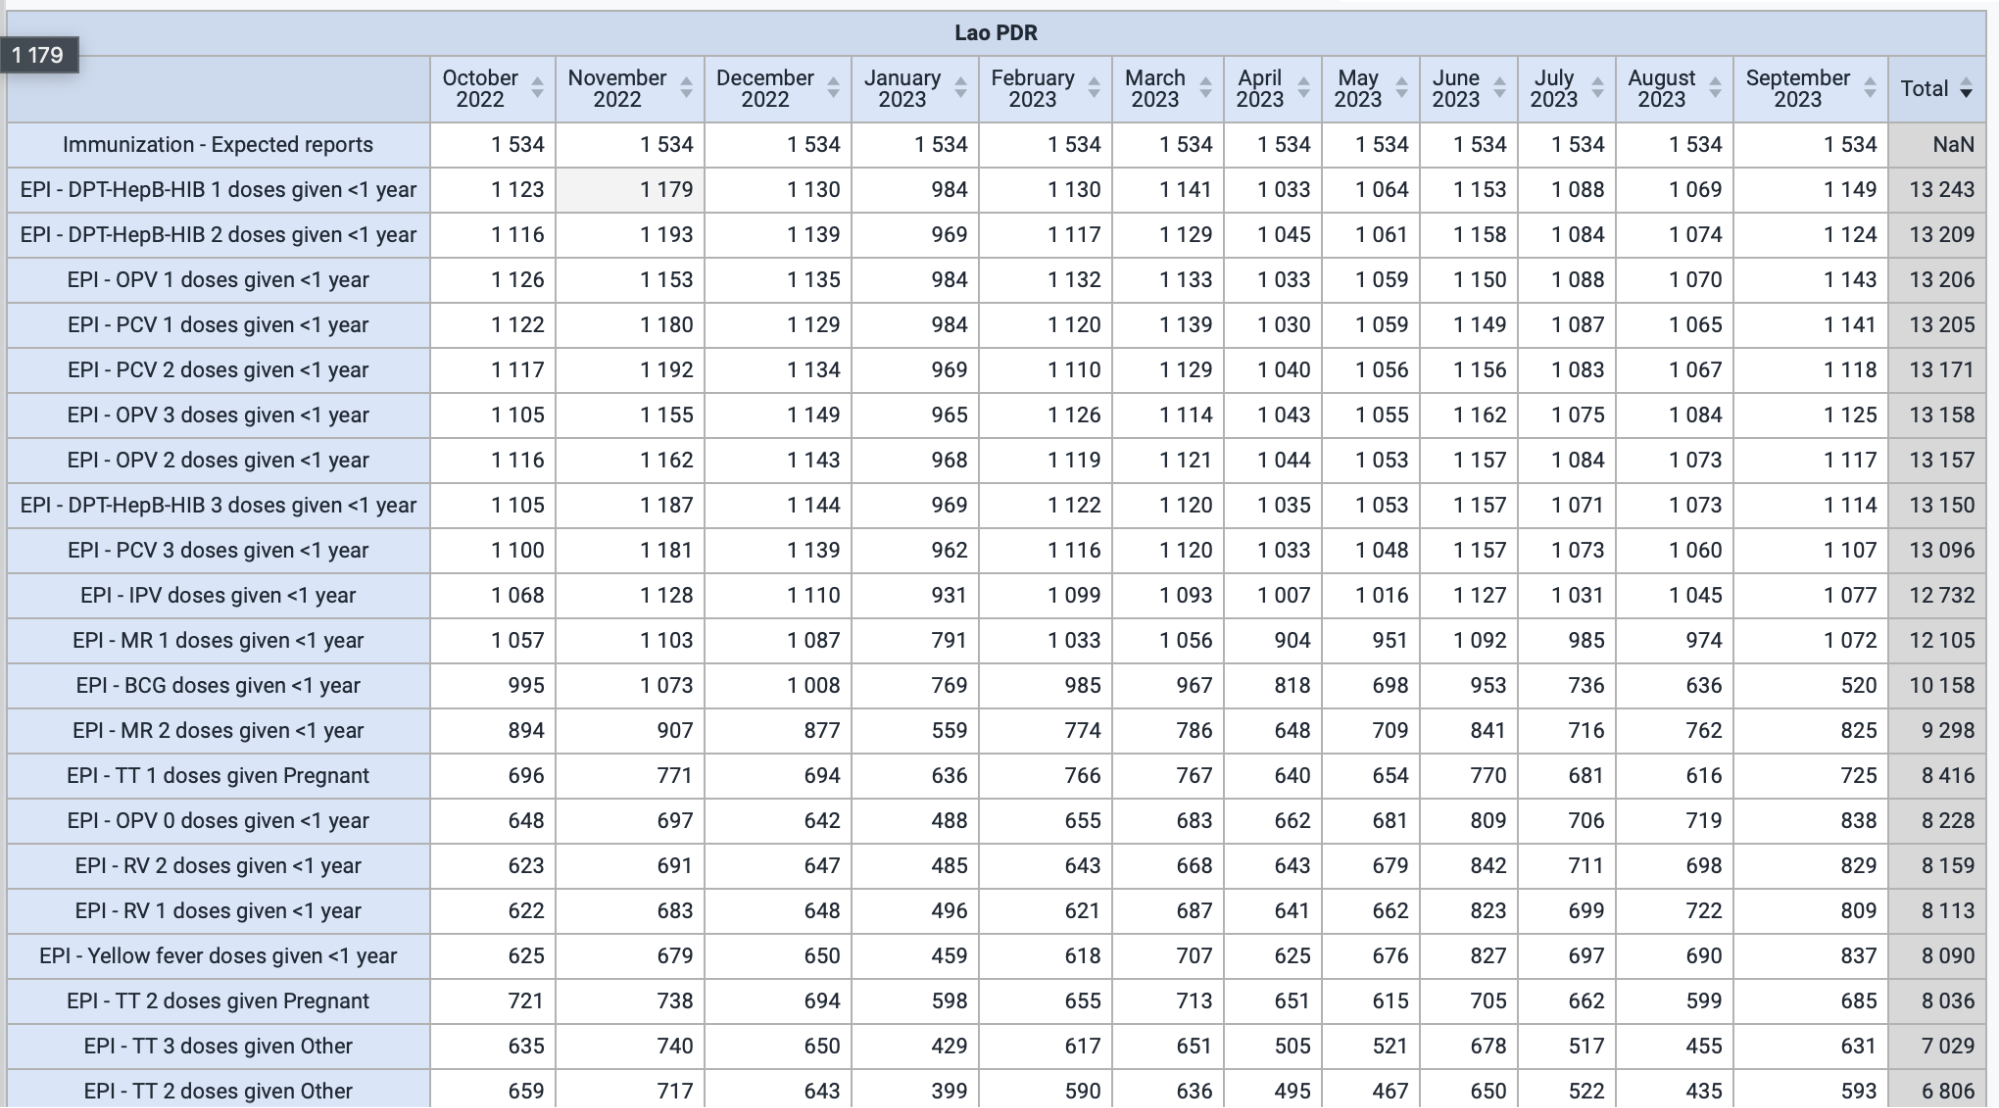
The table produced is now showing on the top row the data element completeness “denominator”, i.e. the expected reports based on the data set (actual reports can also be used). In the other rows, the data element completeness “numerator” for each data element (with disaggregation) is shown. This table allows you to quickly review the completeness of a large number of data elements within a data set.
Following the same approach (using aggregation type “Count”), if looking at a single period a bar chart sorted from High to low will give a quick overview of data element completeness.
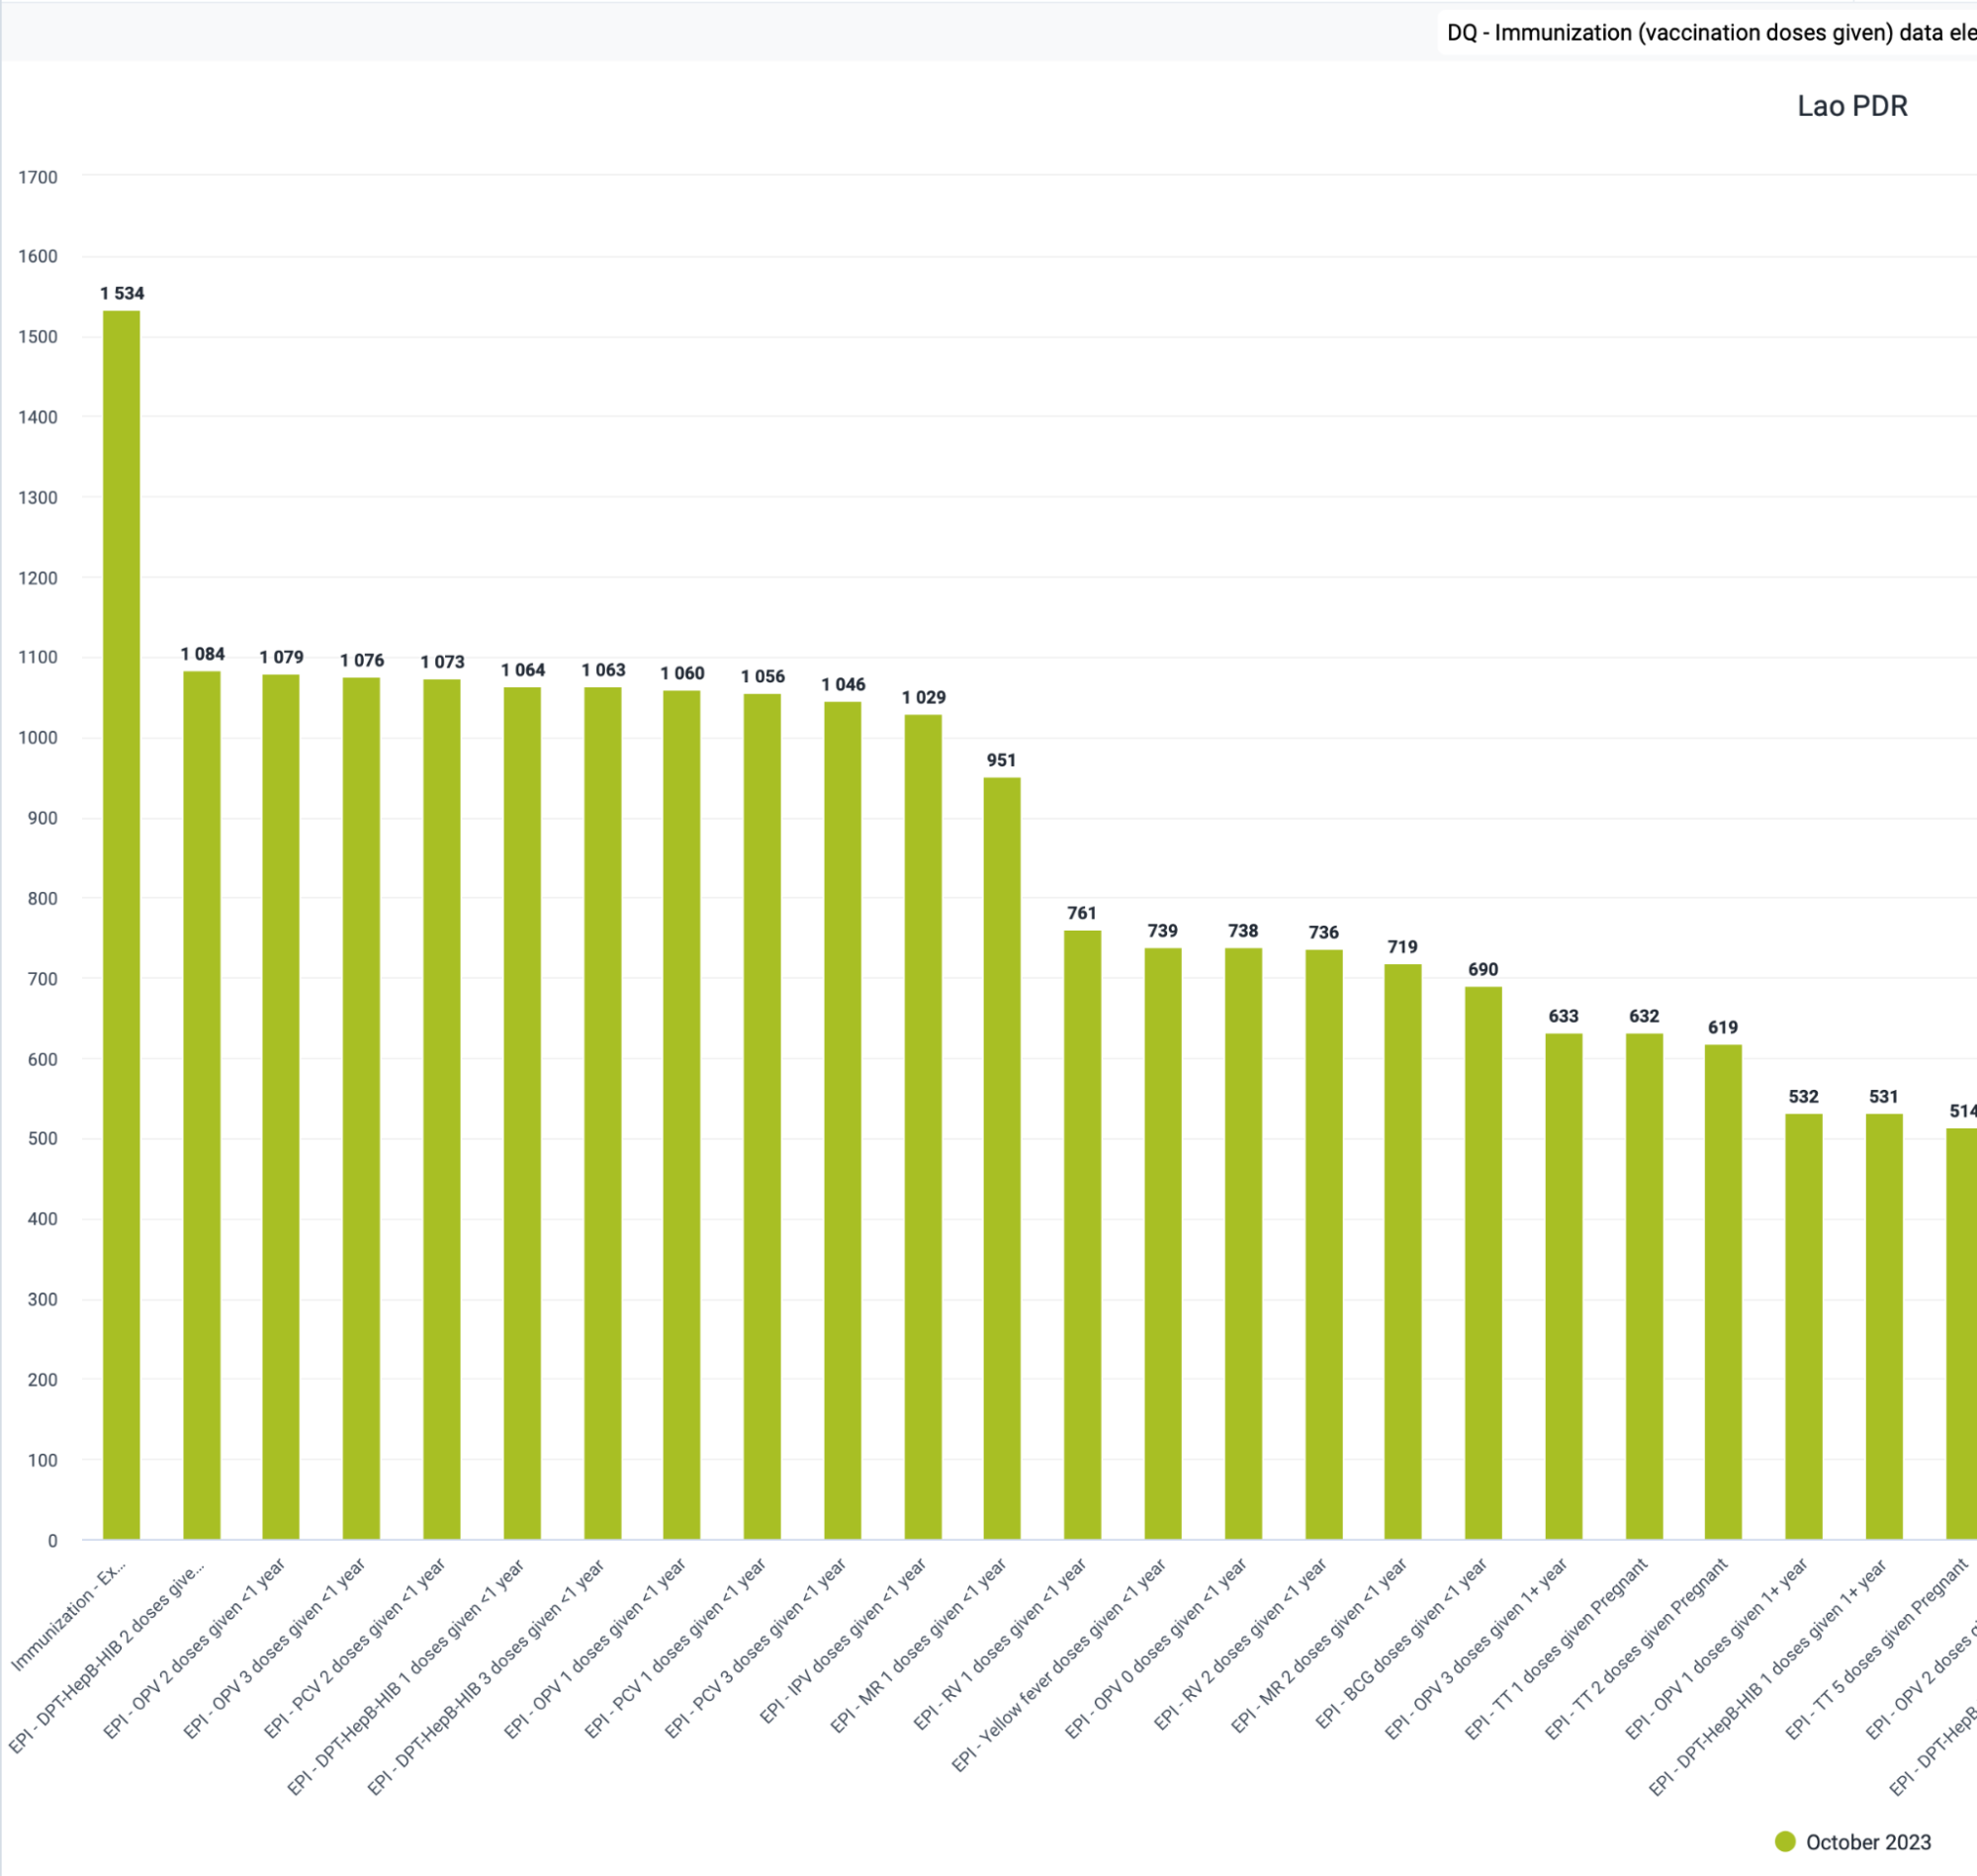
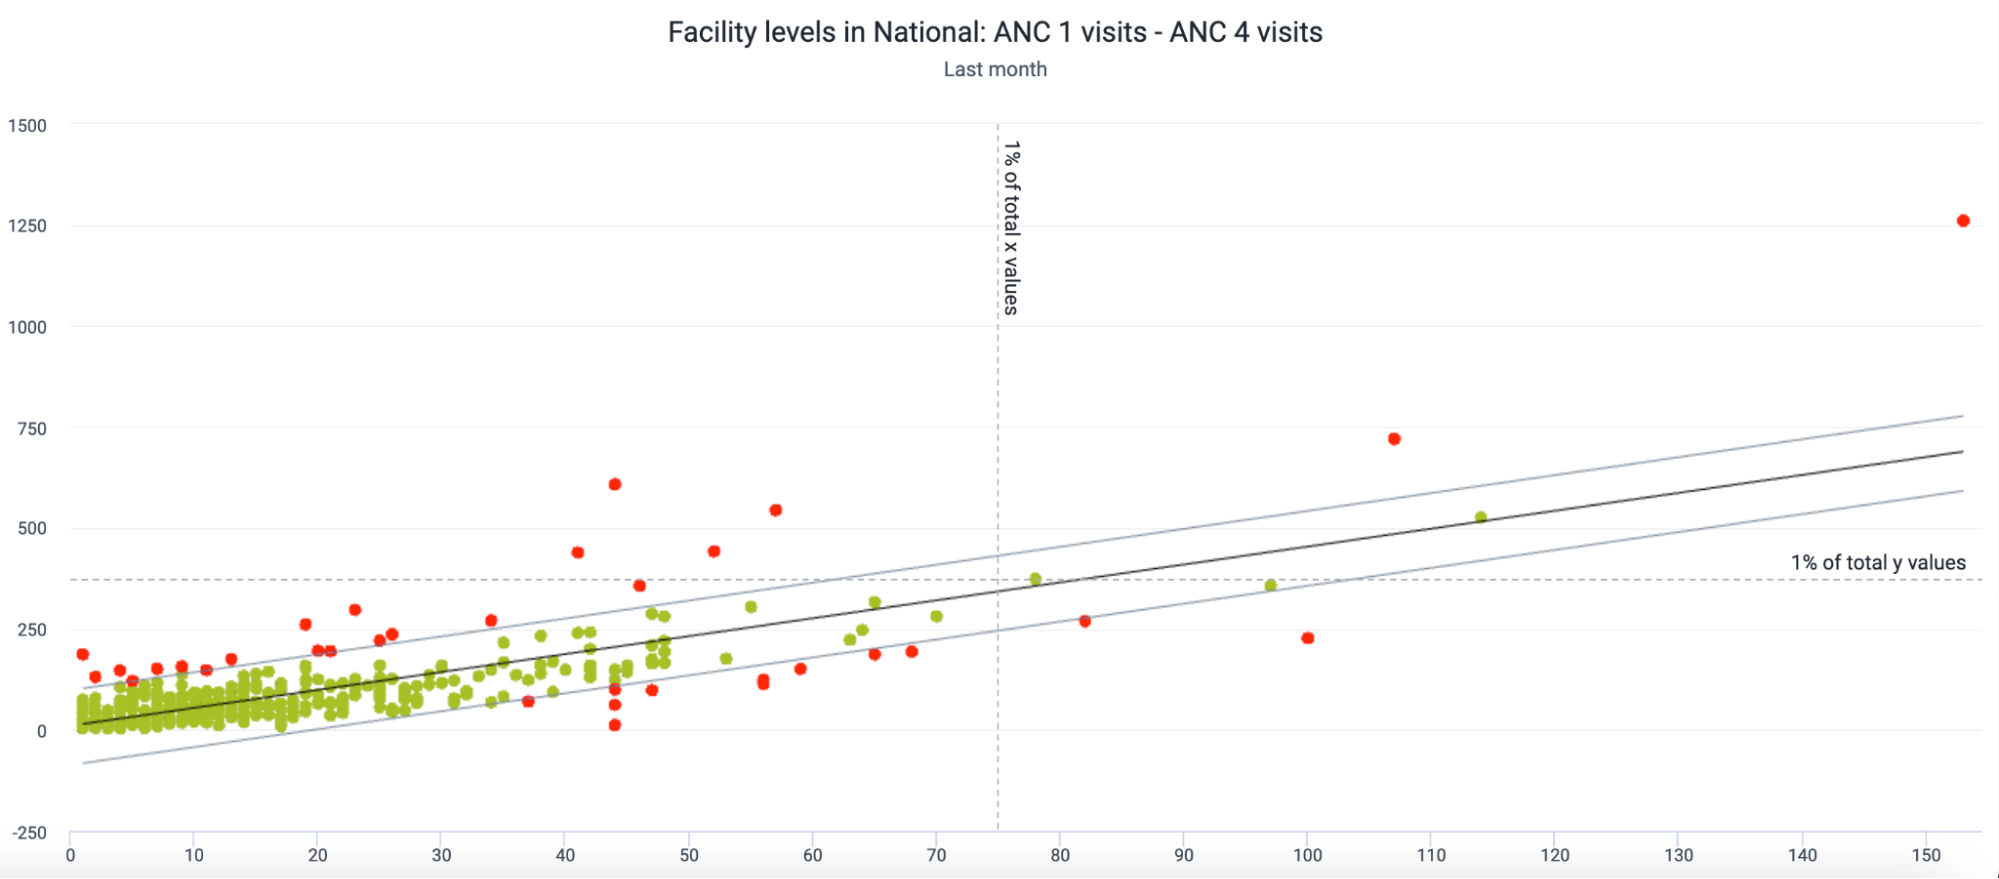
This is a scatterplot in which an outlier analysis or two related variables at the facility level is being performed. The two variables on this chart are related to one another - ANC 1 and ANC 4 - and this is why you can see many of the values so closely clustered together in green colour.
Outlier analyses within data visualizer using scatterplots allows you to identify if related values fit into an expected model or deviate in some way. Red values on the chart do not fit the expected model, and the farther these red values are from the outlier lines, the more likely there is an underlying issue causing these values to not fit the expected model correctly.
These scatterplots can use several methods to identify these outliers, and each of these methods have different levels of sensitivity (ie. each one will detect more or less outliers based on their calculation). The different methods currently available are
Z-score has been included as it is a well understood method; however it is the least sensitive of the 3 methods.
Scatter plots can be created in the data visualizer app.
Start the process by selecting the scatter plot from the visualization selector in data visualizer.

Review the layout after selecting this chart type. Certain items are locked which differentiates it from a number of charts. You must select data items for both the vertical (Y) and horizontal (X) axes of the chart. The points will also always be org units. As discussed, you should select related data items for this type of chart. If you select unrelated data items, your output is unlikely to be useful.
Select your vertical and horizontal data. We will select ANC 1 and ANC 4 as they are related (you will typically see less ANC4 than ANC1 within an identified period for example).
Select your org unit (in this case all facilities)

Select your period

Update your chart.
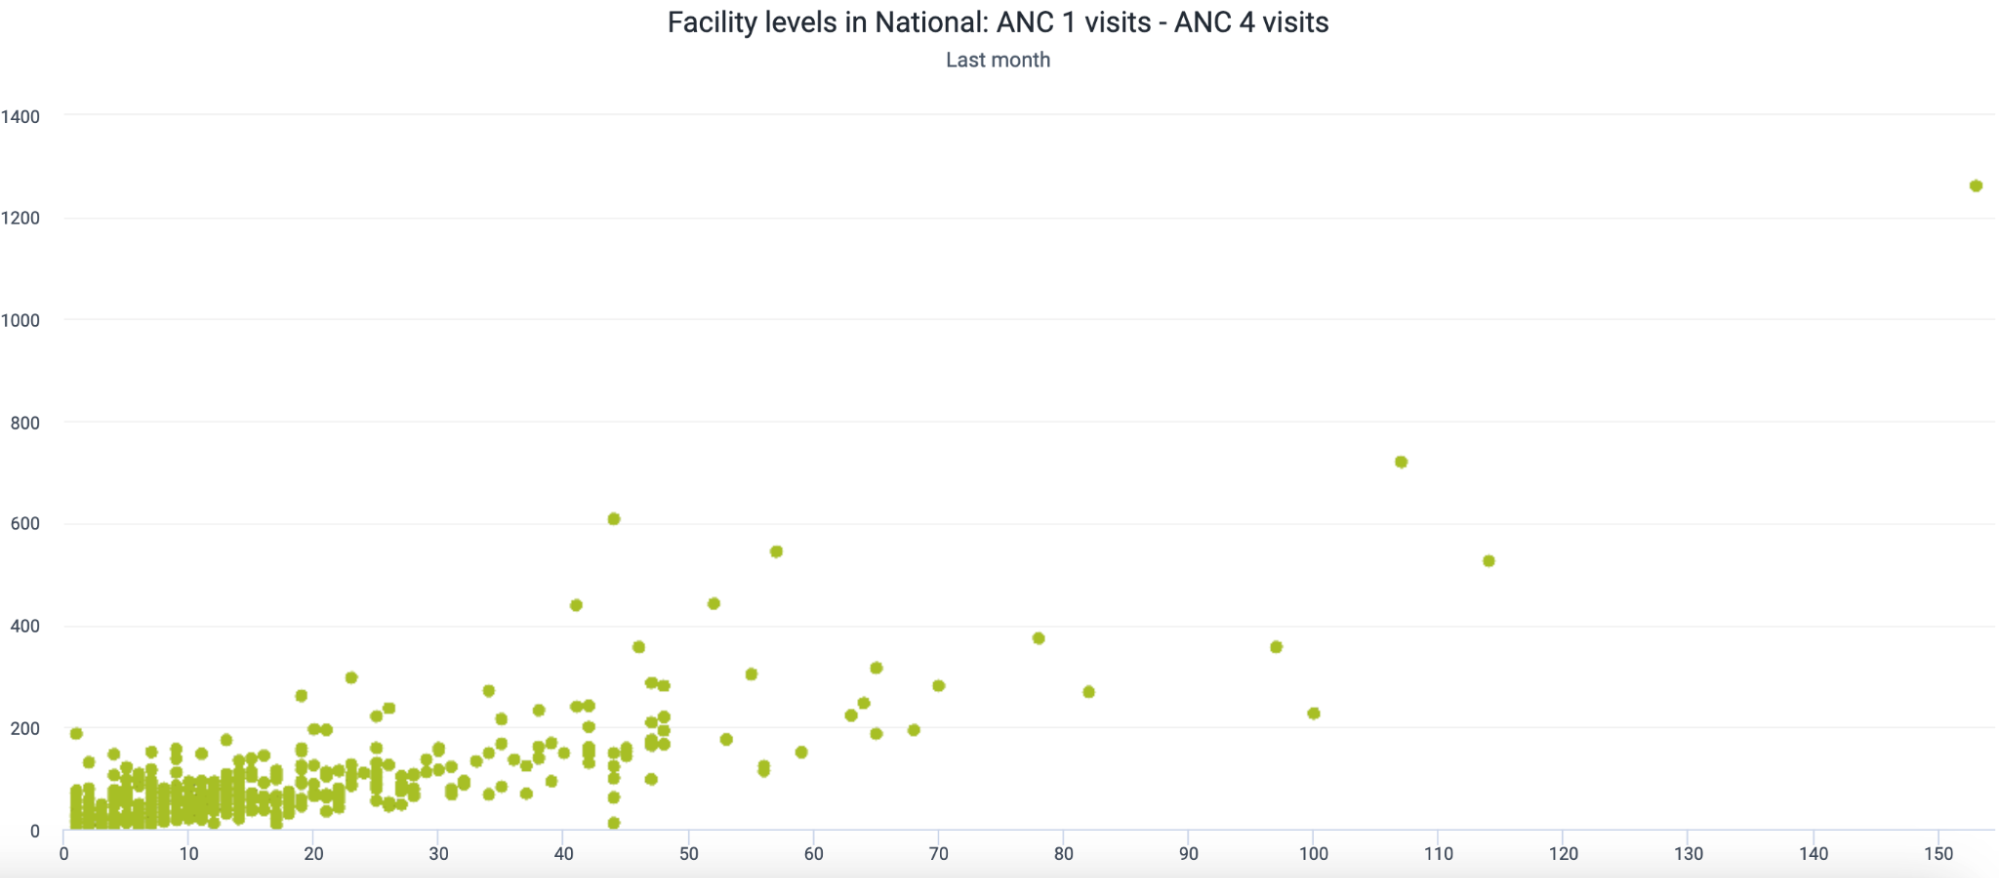
You will now see the scatterplot between these two related items. We can see how they are clustered closely in the bottom left corner of the chart as this is where the majority of values lie. We have not yet added our outlier information to this chart; we can do this as a next step.
To add in the outlier details select the chart options and the “outliers” section
Enable both the outlier analysis as well as the extreme lines.
For the outlier analysis, we will use the method of interquartile range. This is a method of outlier detection that can be applied to scatterplot data. Here is a reference if you need more info : https://medium.com/analytics-vidhya/outliers-in-data-and-ways-to-detect-them-1c3a5f2c6b1e
You do not need to completely understand this method of outlier detection; just note that all 3 methods will determine outliers by seeing if they fit a model as described by the different methods selected.
You can also select the “Extreme lines” option. This will help you to identify the most extreme outlier values that are potential sources of error

After selecting these options, update your chart.
Let us review how we can interpret our output. First, let us zoom in on our cluster of values to review them more closely. We can do this by dragging our mouse cursor over the area we want to zoom into.

We can reset the zoom if needed by selecting “reset zoom” after we have zoomed in
Review one of the outlier values highlighted in red
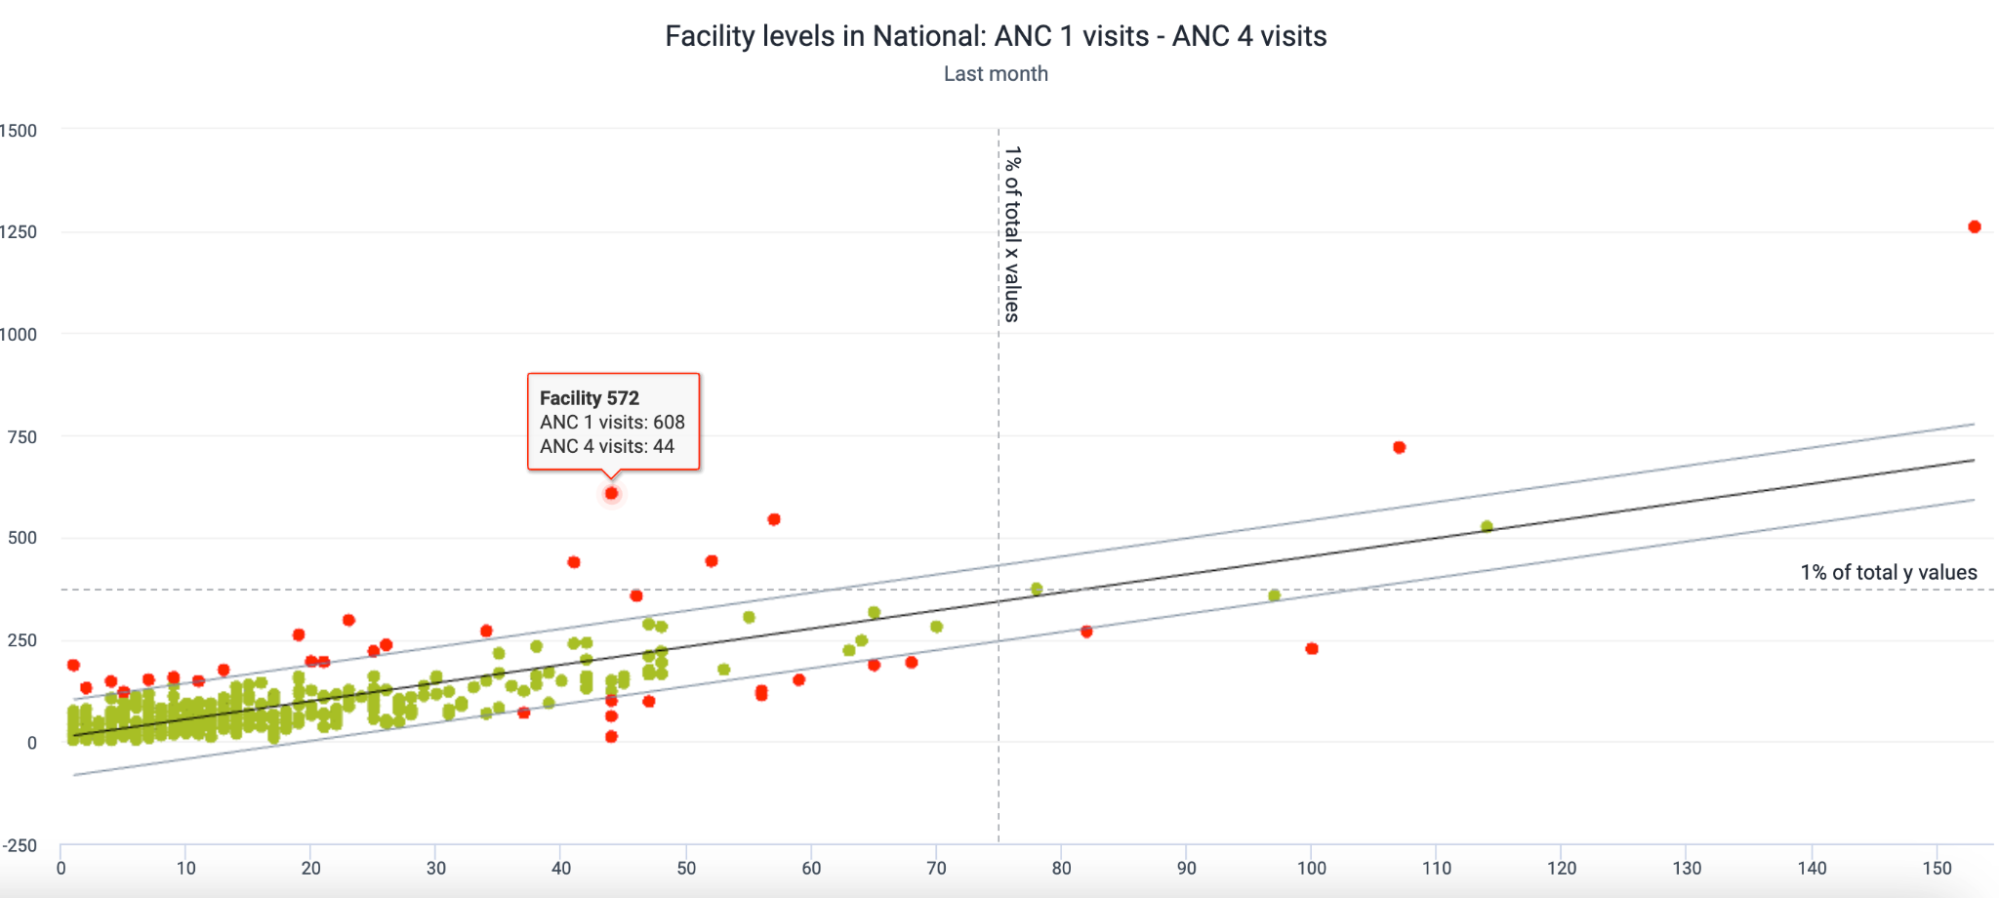
The model for this data is very narrow (ie, most values are closely clustered together); however we see some values that are quite far outside of the outlier boundaries. Neither of these values on its own may be considered an outlier (there are other ANC 1 values that are higher, and other ANC 4 values that are higher); however, this value pairing we have highlighted on the above chart lies outside of the range of 1% of the total y values (which represents ANC 1). This is because a typical ANC 4 value in this range has a much lower ANC 1 value in comparison when reviewing the majority of the other data values.
When reviewing this type of chart, you therefore must review the relationship between the two items being compared and also compare the values to the cluster that falls within the boundaries of the outlier model. In this case, either ANC 1 or ANC 4 values could be incorrect (if we decrease the ANC 1 values OR increase the ANC 4 values, this facility will likely fit in the model accordingly); or this could just be an anomaly having a different ratio between ANC 1 and ANC 4 higher than the interquartile range threshold of 1.5 that has been defined (ie. these values are correct and do not need to be modified). It is more likely that the ANC 1 value is the problem however, as the majority of ANC 4 values in this range have a lower ANC 1 value. As it is such a high outlier as compared to the rest of the data however (given its distance from the outlier boundary and that is outside the 1% y-value line) it does warrant investigation to determine if these values are correct within this facility.
Validation rules are integrated into the data entry apps of DHIS2, and can be reviewed there during data entry[LINK to above section]. Validation rule violations can also be viewed in the Validation rule analysis section of the Data quality app. This is useful as it allows you to review validation rule violations in bulk; rather than reviewing them for a specific organisation unit, period and dataset you can review them for many organisation units over any specified period of time. This also makes it possible for users who do not do data entry, or even have access to the data entry app, to analyse and monitor validation rule violations.
When reviewing validation rules using this method, it is best to divide your validation rules into validation rule groups. The configuration of these groups is shown in the section on validation rule groups.
In order to run validation rule analysis, go to the data quality app and select “Run validation”
Apps -> Data Quality

Select Run validation under the “Validation Rule Analysis” heading

From here, you will need to select your inputs. This includes the following:

Once you have selected the inputs select “Validate.” It may take a little while to run the validation analysis depending on the amount of data you have selected to review. If you are planning to review large amounts of data at once (for example many org units across many periods including many validation rules), the validation rule analysis will take longer to run in comparison to running it for a smaller amount of data.
If there are no violations of the validation rules, you'll see a message saying “Validation passed successfully.” If there are validation violations, they will be presented in a list like the following:

To review the validation details, select the info button under the details column.

This will open up a pop-window with more information on the violation
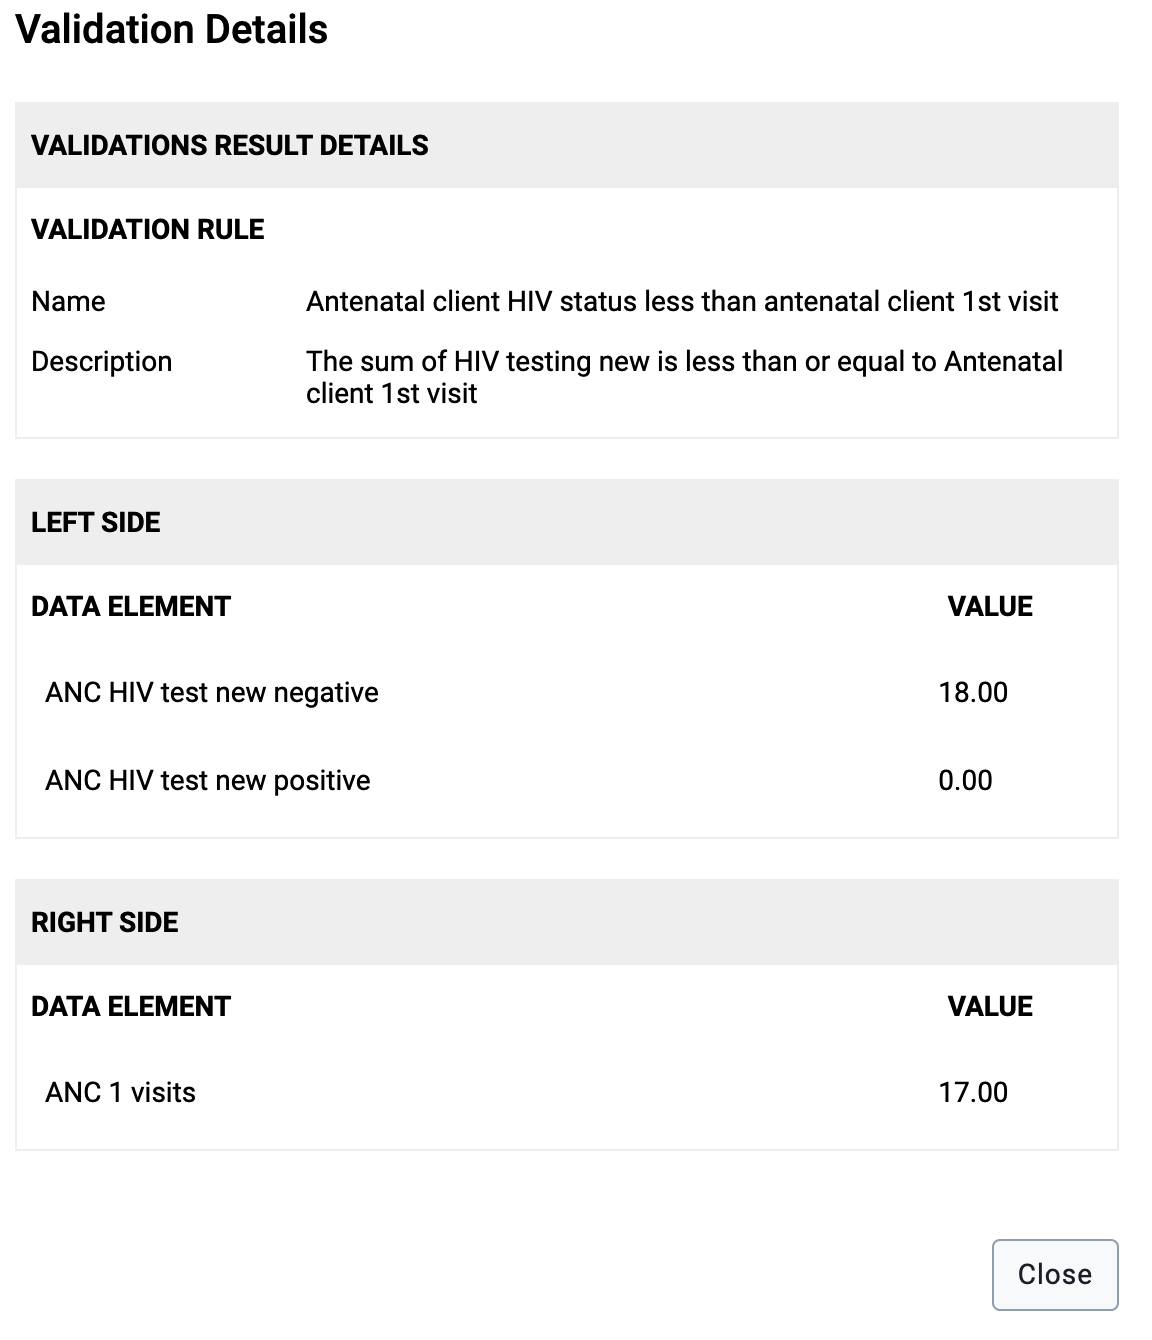
We can see how validation rule analysis can be useful in reviewing the violations for multiple org units/time periods at once, as we can also see all the component parts of the violation. This can allow us to identify exactly which value is incorrect and requires further follow-up.
The validation details show a the name and description of the violation along with all of the data elements that are part of the validation rule along with their values.
You are also able to download these validation rule violations. This may be helpful if you want to refer to this list and follow-up on values to fix them over time. Do this by selecting one of the file types in the top right corner after running validation analysis.

[section coming later]
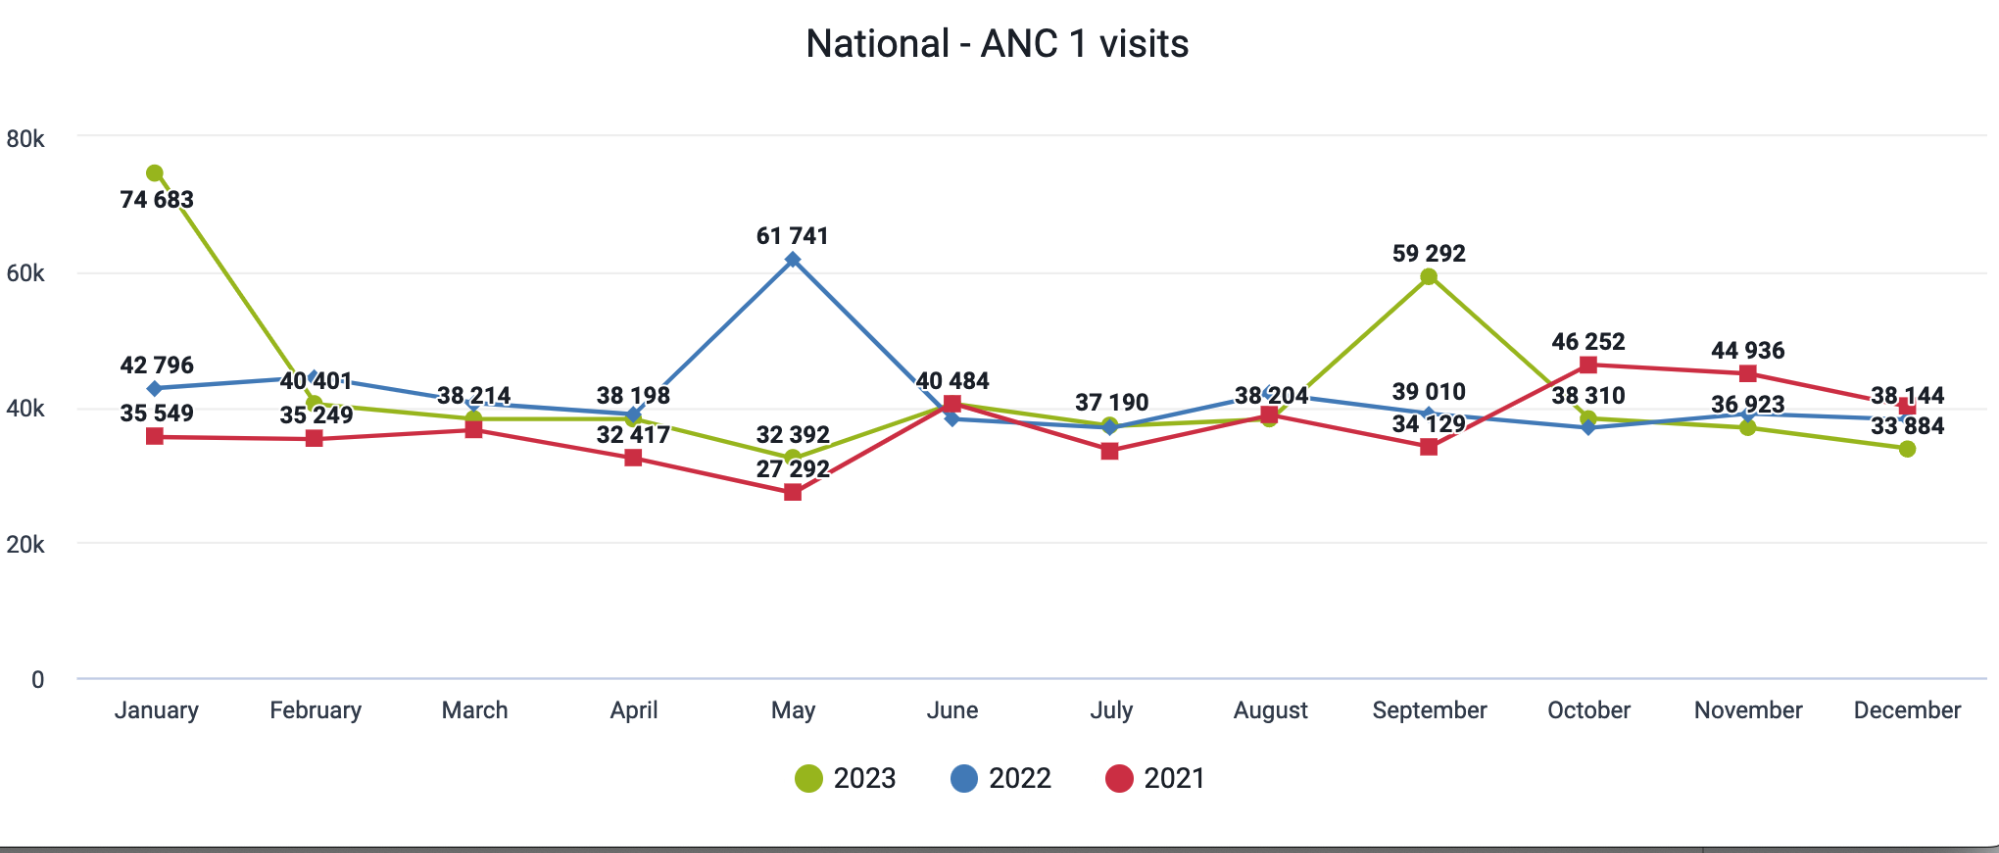
This is a year-over-year (line) chart. A year-over-year (line) chart is used to evaluate consistency over time of a single data type (data element, indicator, etc.). In this example, we are displaying data for ANC 1 visits for all 12 months within a year for 2023, 2022 and 2021. This chart allows us to easily identify obvious outliers as we are able to see increases or decreases (if they exist) quite easily when compared to current and previous data. As an example, you can see obvious outliers in January 2023, May 2022 and September 2023 by reviewing each of the lines on this chart and comparing them to their own historical trends. The next step would be taking this chart and drilling down into the hierarchy for these specific periods in order to find the source of these outliers. These charts could be placed on a dashboard for key variables within your workflow to allow for staff to review these on a routine basis based on how frequently the data is collected.
In order to create this visualization, you will use data visualizer
Select year-over-year (line) to start creating this chart
After we select this chart type, we can see that both the category and the series are automatically populated with period types. The period selection on the left menu where other dimensions are selected is also greyed out. Organisation units and data are automatically placed in the filter. For this reason, this chart type works best when only one data item is selected for comparison. Multiple organisation units can be used in the filter however depending on what you want displayed (it will filter the data belonging to these organisation units).
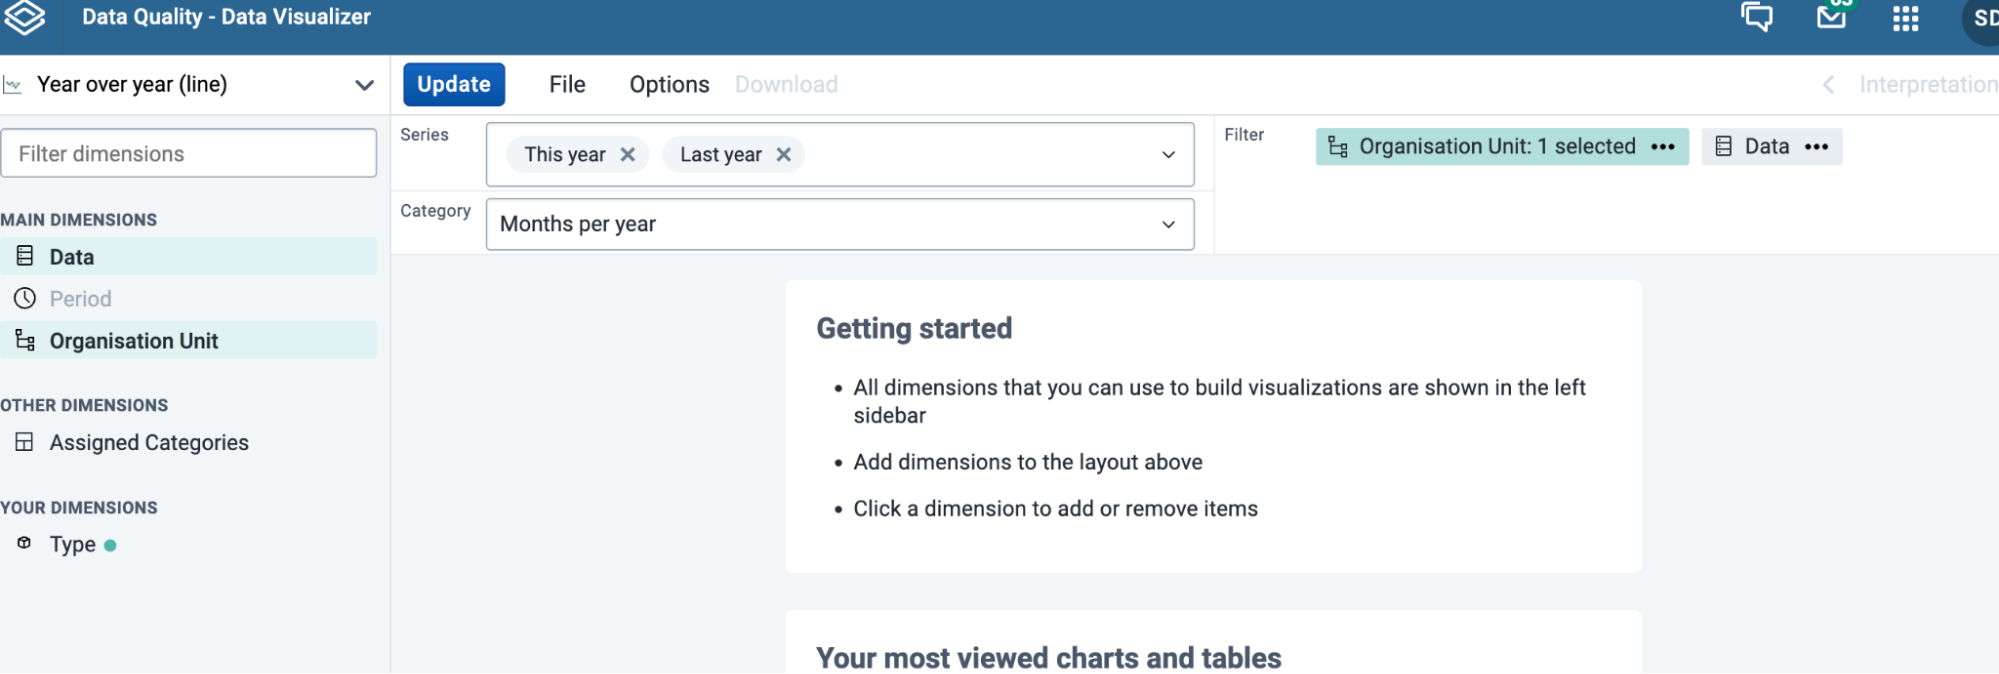
In this example, the category determines the periods that will be displayed along the x-axis and group the data together. So with “months per year” selected, all the months within a year from January - December will be displayed. If we were to select “Quarters per year” it would instead display the 4 quarters of a year along the x-axis.
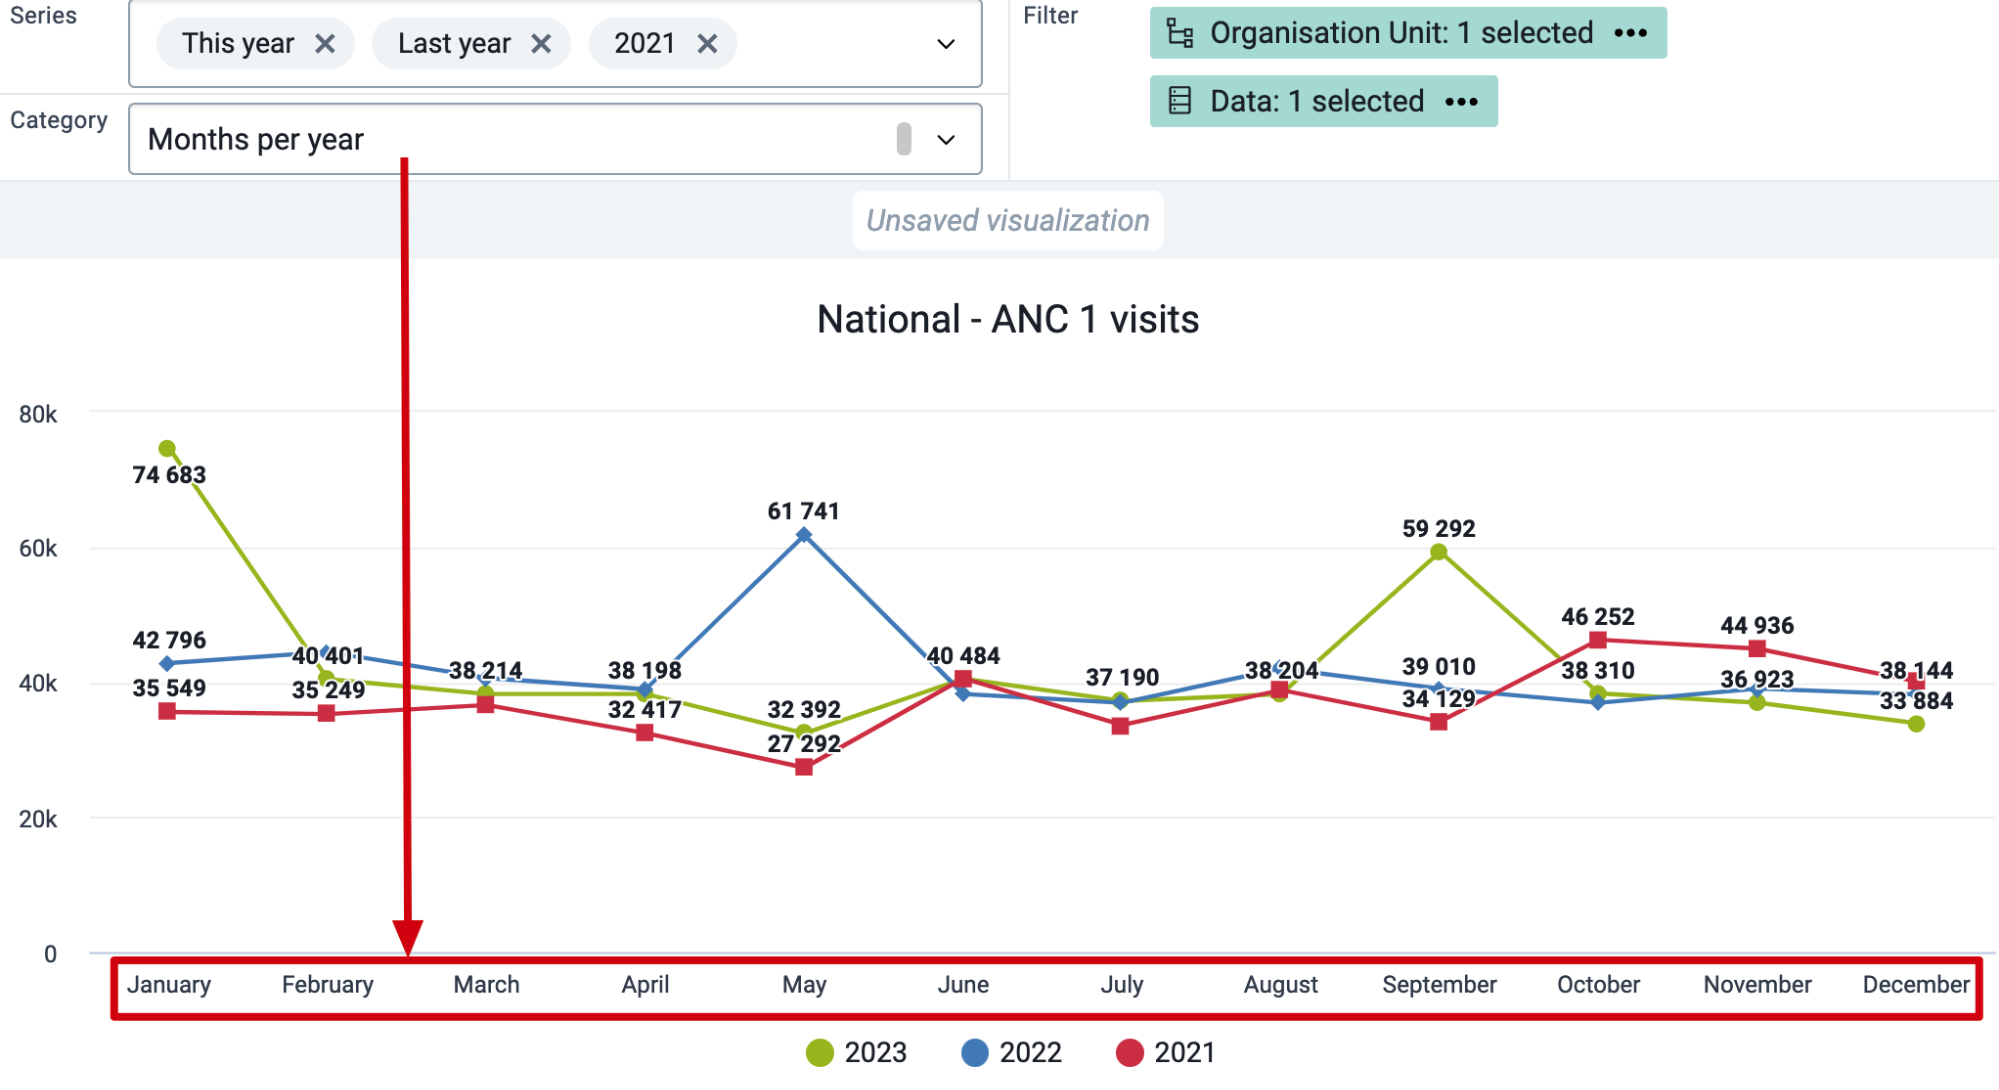
You will notice that the selections in the categories are all relative periods, you can not select for example specific months in the category in this chart type.
The series determines which years you will be displaying data for. If I have this year and last year selected, it will display these years respectively based on the current date. I can also specify years rather than a relative period, for example 2021, 2022 and 2023.
With these two options selected I am now creating a chart which will display data from January - December (due to the category selection) along the x-axis. And with 2021, 2022 and 2023 selected as my series, data values from these 3 years will be displayed by month on the year over year chart.
When selecting data, it is best to only select one data item. These could be supplemented by choosing groups or disaggregations to further filter the data by, however as the data selection is automatically added to the filter and can not be moved, adding in more than one data item will have no effect on the chart.
Update and review the chart
We can now update our chart. In this case we are using the default country organisation unit, however we could also change this if necessary.
We can see how the chart has been generated based on our category and series period selection as well as the selection of our data item (in this case ANC 1st visit).
The series has determined which years we are displaying data for, while the category determines how to group the data along the x-axis.
"Extreme outliers" are values which are highly suspicious and which need to be double checked for accuracy. These are different from the values normally reported by a health facility. If extreme outliers are found to be incorrect, then they should be edited following local procedures outlining how data values should be edited. In this section, we show how outliers in the time dimension can be identified in DHIS2 using predictors, and with the outlier analysis function. We specify over time to differentiate this from the outliers described in the section on scatter plots, which identify organization units that are outliers for a single period.
The two functions presented for identifying outliers each have some advantages. The DHIS2 Data Quality app permits doing analysis in bulk (i.e. for large numbers of variables at the same time) without any prior configuration. It lets the users choose different statistical methods for the outlier calculation, and run it on any data set and period combination. It is thus both flexible and powerful, but requires users to open the app, choose the appropriate parameters, and wait for the analysis to finish. By using predictors to calculate outliers thresholds and related data elements and indicators, we can create notifications, view these values on the dashboard, or use it in combination with other DHIS2 functionality such as validation rules. This results in a greater flexibility in how to make the results of the outlier analysis available to users in different ways, but requires configuration of multiple metadata objects for each variable we want to assess. The two methods should therefore be considered complementary.
Note
In a live implementation, predictors can be resource intensive and specific care needs to be taken to stress test the DHIS2 system in order to ensure it is able to generate predictors on an ongoing, regularly scheduled basis as new data is added prior to live implementation. In addition, even after the Predictor has generated new data, the data will not be visible until Analytics has been updated; this is another step which may require significant time depending on the size of the system. As a result, considerable patience and several prolonged pauses in the workflow are likely to be required the first time guidance is followed. It is important to replicate and test predictors on development systems first, so they can be thoroughly tested without affecting a production system.
Predictors provides generic functionality in DHIS2, which we will here show how to apply for the purpose of outlier detection and analysis. While the initial process of creating predictors can be time consuming, once you have successfully configured one data element/indicator and confirmed that the resulting outputs are correct, the configuration process for each subsequent data element or indicator should take less time.
Configuring predictors for outlier detection requires two sets of predictors:
one predictor to calculate the outlier threshold. This is defined from analyzing previously reported data, and defining thresholds over which values are considered outliers (for a combination of data element and organization unit).
one or more predictors that use the outlier threshold in further calculations, such as counting how many facilities have reported outliers, assigning only outlier or non-outlier values to separate data elements for analysis etc.
Since predictors produce data values that need to be stored before they're used in further calculations, each new predictor needs to be associated with a data element. These data elements could be organized in one or more new data sets.
There are several alternatives in terms of what predictors/data elements and indicators that can be configure for each of the variables you would like to analyze/monitor:
Outlier threshold (predictor/data element)
Count of values that are outliers (predictor/data element)
Count of values that are not outliers (predictor/data element)
Values that are outliers (%) (indicator)
Values that are outliers (predictor/data element)
Values that are not outliers (predictor data element)
Data values excluding outliers (indicator)
These are further defined and explained below. First, it is important to understand how the data flow is for these metadata objects, outlined in this figure
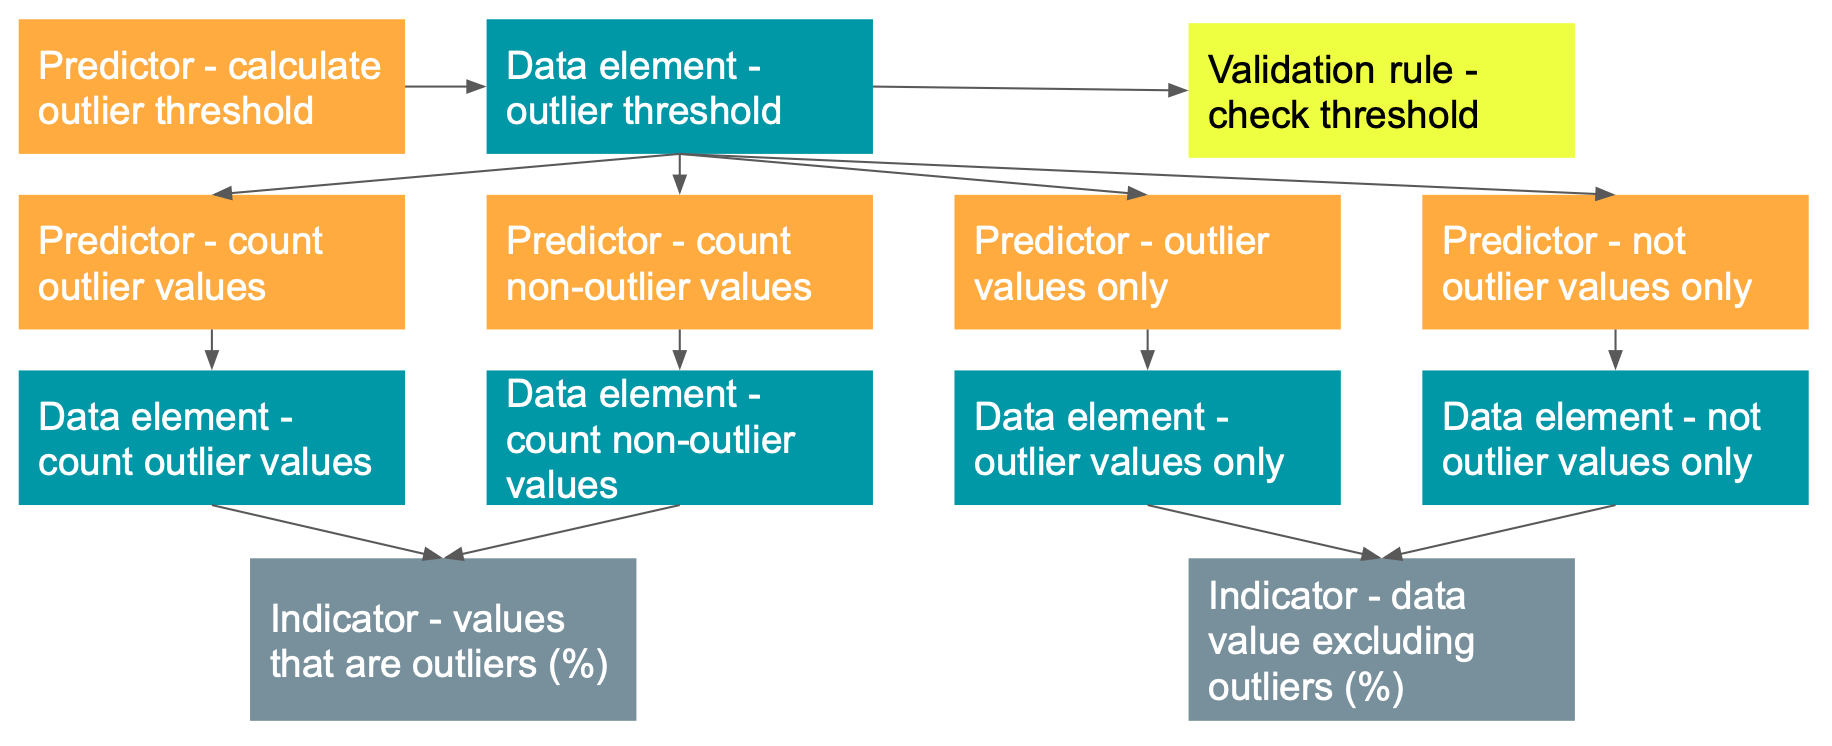
Predictors must be scheduled to run by the system, just like the analytics process. Scheduling is therefore critical for this to work. For the indicators to be available to end users, we first need to run the first set of predictors (calculating thresholds), then the second set of predictors, and finally the normal analytics process for the data sets and indicators to be available in Data visualizer and other analysis tools. This is discussed further here.
We first configure the predictor and data element that calculates the outlier threshold for a particular variable, either a data element (default/total) or one particular disaggregation (category option combination). In the following example we'll use Malaria confirmed cases as an example.
Configuration steps
Create a data element to store the outlier threshold value:
Name: "DQ - Malaria confirmed cases outlier threshold (mean + 3 SD)"
Description: "Auto-generated from predictor. Outlier threshold for the Malaria confirmed cases data element (total for all disaggregations), based on the average + 3 standard deviations over the previous 12 months. This can be used for identifying potential outliers."
Type: Aggregate
Value type: Positive or zero integer
Create a new predictor with basic properties:
Name: "DQ - Malaria confirmed cases outlier threshold (mean + 3 SD)"
Description: "Generates the outlier threshold for malaria confirmed cases, defined as mean + 3 standard deviations, not including the values for last month."
Set the Output data element to point to the data element created in step 1.
Set Period type to match the data collection frequency of the data element we are assessing. For our Malaria confirmed cases example this is collected Monthly.
Set Organisation units levels to the level at which the data is collected, which in most cases will be Facility.
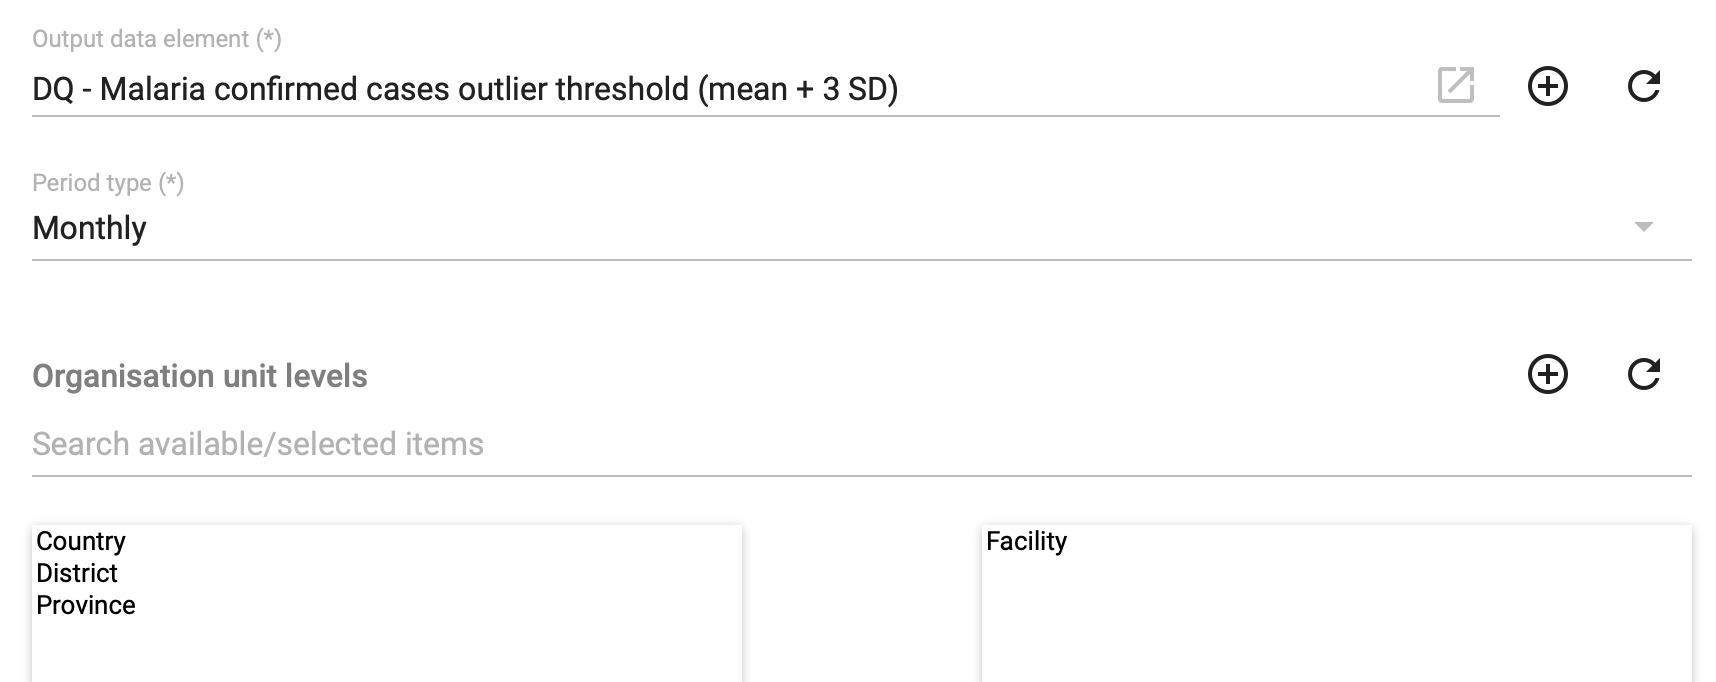
Configure the Generator, which is the expression that defines the actual calculation performed by the predictor.
Set Missing value strategy to Skip if all values are missing.
The expression in this case should be:
avg({data_element_uid}) + (3 * stddevPop({data_element_uid}))
avg() gives us the average/mean for the data element in the periods we are assessing (defined in the next step. stddevPop() gives us the population-based standard deviation for the data element in the periods we're assessing, and we multiply this with 3 since we want the thresholds to be 3 standard deviations above the average. We use 3 here because it's often used as the definition of extreme outliers, but other values can be used.
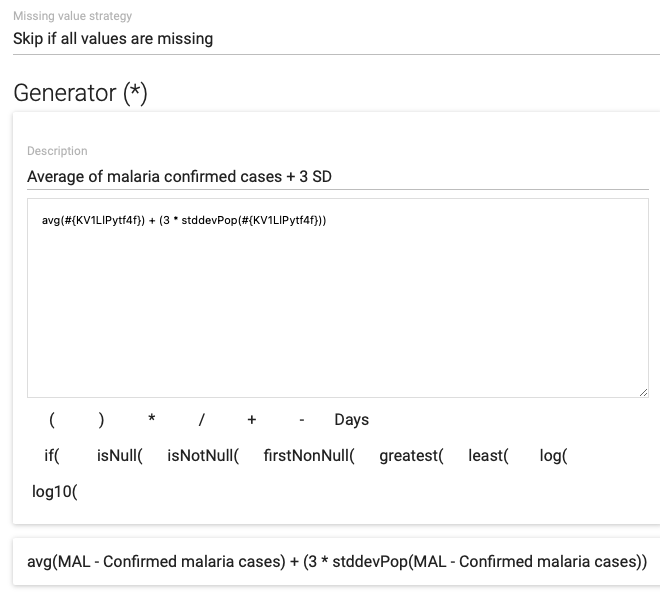
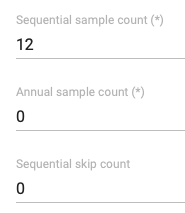
When the outlier threshold is defined and stored as a data element value, we can create additional predictors to do more specific calculations. These are configured in the same way, except the actual Generator expression. We outline the general steps to create the predictors once, whilst the actual expression for each of the specific predictors are provided in table below.
We will review how to create four different predictors/data elements using the outlier threshold:
| Data element excluding outliers | Data element values that are not outliers. |
|---|---|
| Data element outliers | Data element values that are outliers. |
| Data element non-outlier count | Count of data element values that are not outliers. |
| Data element outlier count | Count of data element values that are outliers. |
The following example (with ANC 1st visit as the data element we are assessing) shows for an time series what output the different predictors are expected to produce
| Jan | Feb | Mar | Apr | May | Jun | Jul | |
|---|---|---|---|---|---|---|---|
| ANC 1 | 165 | 196 | 214 | 204 | 219 | 4243 | 195 |
| ANC 1 outlier threshold | 253 | 265 | 253 | 244 | 242 | 246 | 4716 |
| ANC 1 excl outliers | 165 | 196 | 214 | 204 | 219 | 195 | |
| ANC 1 outliers | 4243 | ||||||
| ANC 1 non-outlier count | 1 | 1 | 1 | 1 | 1 | 1 | |
| ANC 1 outlier count | 1 |
To configure these predictors, follow these general steps after first creating data elements to which the values can be assigned:
Create a new predictor
Set the Output data element to point to the data element that has been created
Set Period type to match the data collection frequency of the data element we are assessing.
Set Organisation units levels to the level at which the data is collected, in most cases Facility.
Configure the Generator, using the appropriate expression from the table below
Set the Sequential sample count to 1, the annual sample count to 0, and sequential skip count to 0.
This table provides the expressions that should be used in Generator of the different predictors:
| Predictor | Expression | Example | Explanation |
|---|---|---|---|
| Data element excluding outliers | if( {DE} <= {DE threshold}, {DE}, 0) | if(#{KV1LlPytf4f}<=#{dx8Y0ZrHji7}, #{KV1LlPytf4f}, 0) | If the data element value is below the threshold, use the data element value, else return 0. |
| Data element outliers | if( {DE} > {DE threshold}, {DE}, 0) | if(#{KV1LlPytf4f} > #{dx8Y0ZrHji7}, #{KV1LlPytf4f}, 0) | If the data element value is above the threshold, use the data element value, else return 0. |
| Data element non-outlier count | if( {DE} <= {DE threshold}, 1, 0) | if(#{KV1LlPytf4f}<=#{dx8Y0ZrHji7}, 1, 0) | If the data element value is below the threshold, return 1, else return 0. |
| Data element outlier count | if( {DE} > {DE threshold}, 1, 0) | if(#{KV1LlPytf4f}>#{dx8Y0ZrHji7}, 1, 0) | If the data element value is above the threshold, return 1, else return 0. |
The data elements populated by these predictors can be used in visualizations and on dashboards directly, e.g. showing the reported values against the threshold, having a simple counter of the number of outliers that were flagged in the previous month, or producing tables that highlight the specific outlier values by facility.
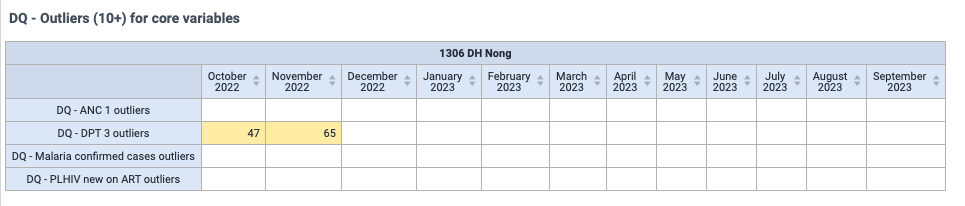
When predictors and data elements have been configured for these core data quality measure as explained above, we can define two indicators:
Percentage of values that are outlier values for a particular data element:
Numerator: count of outlier values
Denominator: count of outlier values + count of non-outlier values
Factor: 100
Purpose: metric of the data quality, and can be used to look at geographical comparisons or changes over time
Value excluding outliers as a percentage of the overall value for a particular data element:
Numerator: the values for the data element that are not outliers
Denominator: all values for the data element
Factor: 100
Purpose: metric for the significance the outlier values has on the overall value for a data element, and can be used both for time trends and geographical comparisons. Also gives an indication of how significantly outliers affect the overall data which is an important consideration when analyzing data.
Configuration of these indicators are straightforward once the underlying predictors/data elements are available (options a and b below refers to each of the above indicators)
Create a new indicator with an appropriate name and description. Description is important here since these indicators might be new to most users.
Set the indicator type to be Percentage (exact name can vary, but the factor of the indicator type should be 100)
Configure the numerator
a. Count of outliers (example: Malaria confirmed cases outlier count)
b. Values excluding outliers (example: Malaria confirmed cases excluding outliers)
Configure the denominator
a. Count of outlier values + count of non-outlier values (example: Malaria confirmed cases outlier count + Malaria confirmed cases non-outlier count)
b. Data element values (example: Malaria confirmed cases)
Save the indicator and assign it to appropriate groups
These indicators can now be used in visualizations and dashboards, allowing users to easily monitor trends in outliers, make geographical comparisons, and monitor the overall impact of outliers on the data element in question.
It is not realistic to configure a set of predictors, data elements and indicators for every data element. Outlier analysis in the Data Quality makes it possible to run outlier analysis on whole data sets, and is therefore a useful complement to the predictor-based outlier checks.
To run outlier analysis, open the Data Quality app, and click Analyze under Outlier detection.
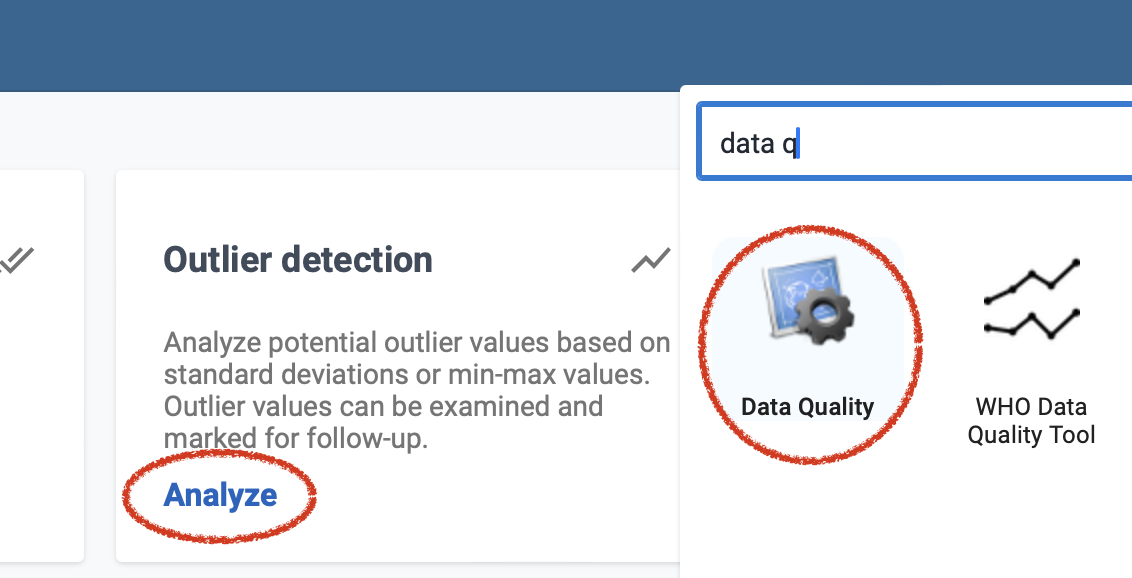
Start by selecting the key parameters for the analysis:
Data set - choose one or more data sets to include in the analysis
Organization units - choose one or more organization units to include; all orgunits below the selected units will be included.
Start and end dates - periods within this date range will be included. Note that these are the periods we are analyzing for outliers. Data from all periods for a particular organization unit and data element is included when the average/median and standard deviation is calculated, unless otherwise specified (see advanced options below).
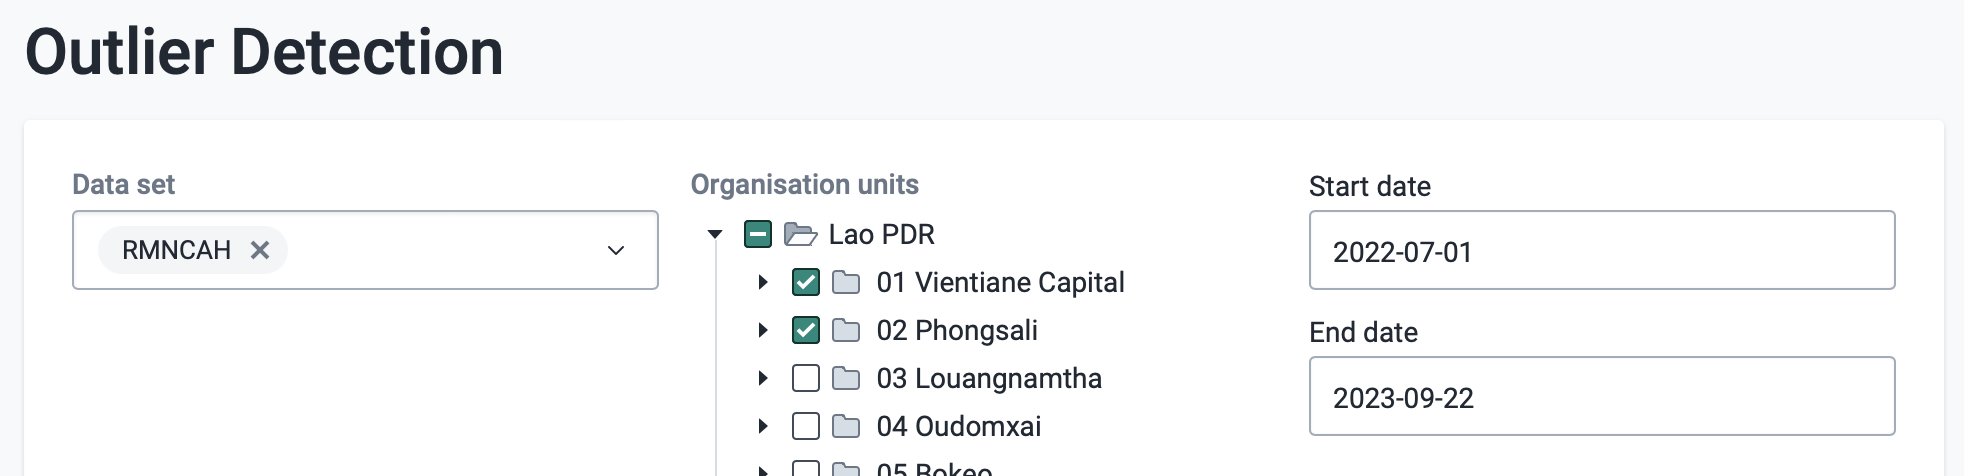
Next, specify the statistical methods and parameters to use for the analysis.
Algorithm:
Z-score - detection of outliers based on standard deviations from the mean. More information [about z-score]{.ul}.
Modified z-score - detection of outliers based on standard deviations from the median.
Min-max - based on min-max values, discussed here
Threshold - the number of standard deviations from the mean/median a value must be before it is considered an outlier. The default is 3, which is often used as a default definition of an "extreme" outlier.
Max results - the maximum number of outliers that will be included in the results table.
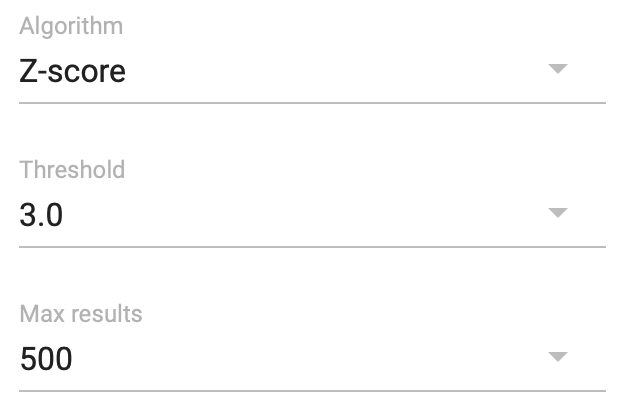
Optionally, change the advanced options:
Data start and end date - allows you to limit what data is used as the basis for calculating the mean/median and standard deviations, overriding the default options which is to include all data. Note that a certain number of periods are needed for the statistical calculations to be meaningful.
Sort by - specified how the results are sorted, with two options
Absolute deviation from median/mean (default) - this sorts the resulting table of outliers according to the absolute deviation of the outlier from the median/mean. In general, this means that the outliers with the biggest significance/impact on the result is shown first.
Z-score/modified z-score - this sorts the resulting table according to the z-score, i.e. "how extreme" the outlier is. This means that a relatively small value (i.e. from a small facility) could be displayed before a much larger number (i.e. from a big facility), if the smaller value is further from the mean/median.
Finally, click Start to run the analysis. Depending on the parameters selected and size of the database, this may take some time. The resulting table lists all the outliers that have been detected (up to the maximum allowed results), with information on:
Data element
Period
Organization unit
Value - the value that has been identified as an outlier
Z-score - the z-score of the outlier
Deviation - the deviation of the outlier, i.e. the difference between the mean/median and the actual value
Std Dev - the value of one standard deviation.
Median/mean - median/mean value, depending on the method used
Min and Max - min and max value for the data element, based on the specified number of standard deviations set in the parameters section.
Follow-up - check-box that allows values to be marked for follow-up, which means they can be listed using the "Follow-up analysis" function of the Data Quality app.
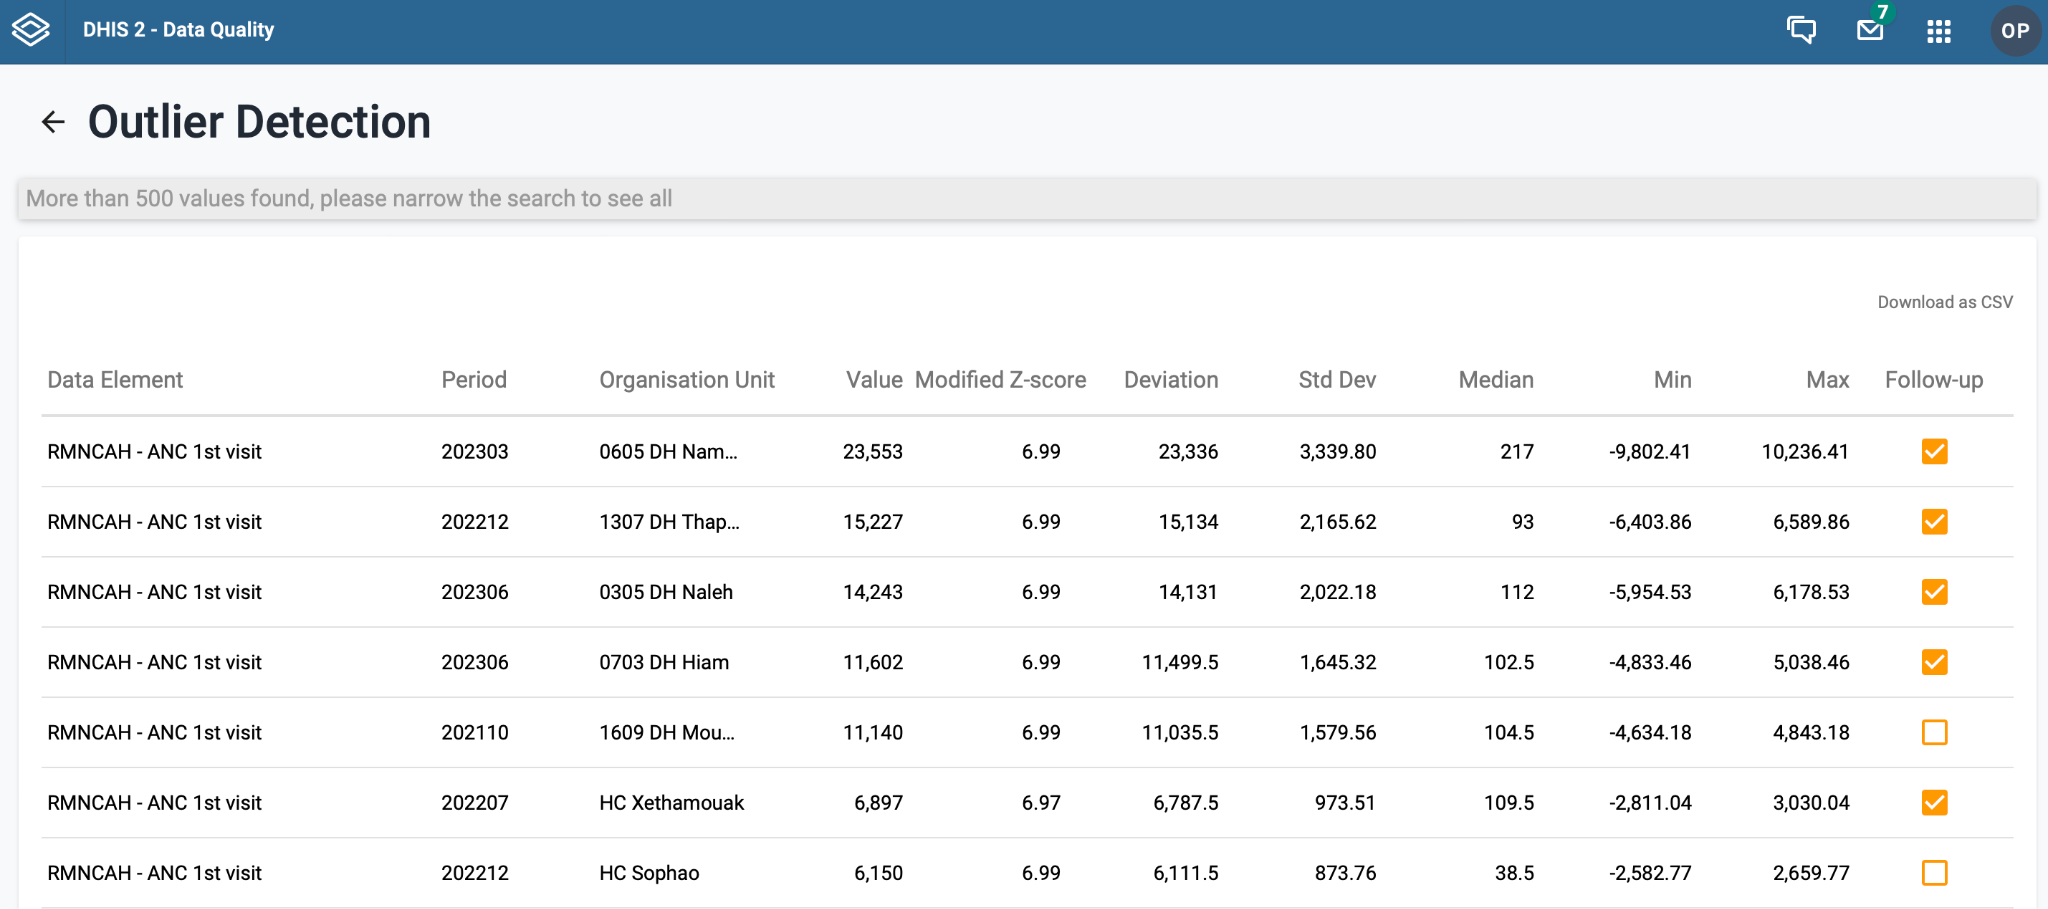
The outlier table is a new feature available from DHIS2 version 41 and is meant, in part, to replicate and expand upon the outlier table functionality that was previously available within the WHO data quality tool.
Similar to the outlier table in the WHO data quality tool, the outlier table displays data and analyzes them for outliers using either the standard z-score or modified z-score (modified z-score is used by default).
The outlier table is accessible as a visualization type within the data visualizer application.
Making an outlier table is very easy:
Select the outlier table visualization type from the visualization selector in the data visualizer app
Select the inputs for the data, period and organisations units and "Update" the table. These 3 inputs are locked, meaning that all 3 are needed and inputs must be selected for them. Note that you are able to select multiple data items to use on this table.
After updating you should see a table like the following:
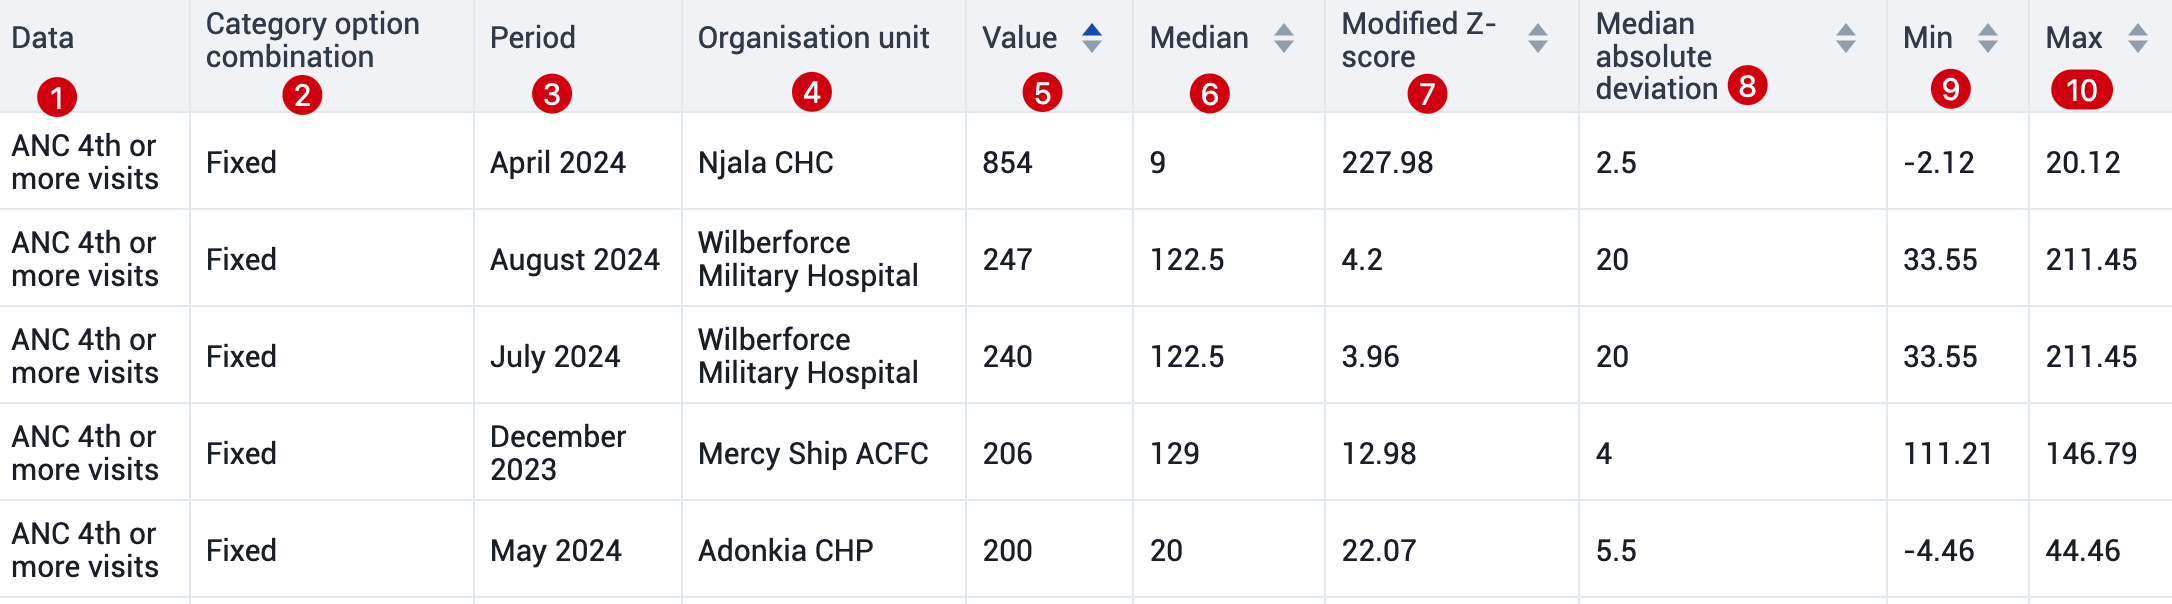
A review of the items available on this table is located here:
Modifying the outlier table
You are able to modify the outlier table by using the table options. There are 3 items you can alter:
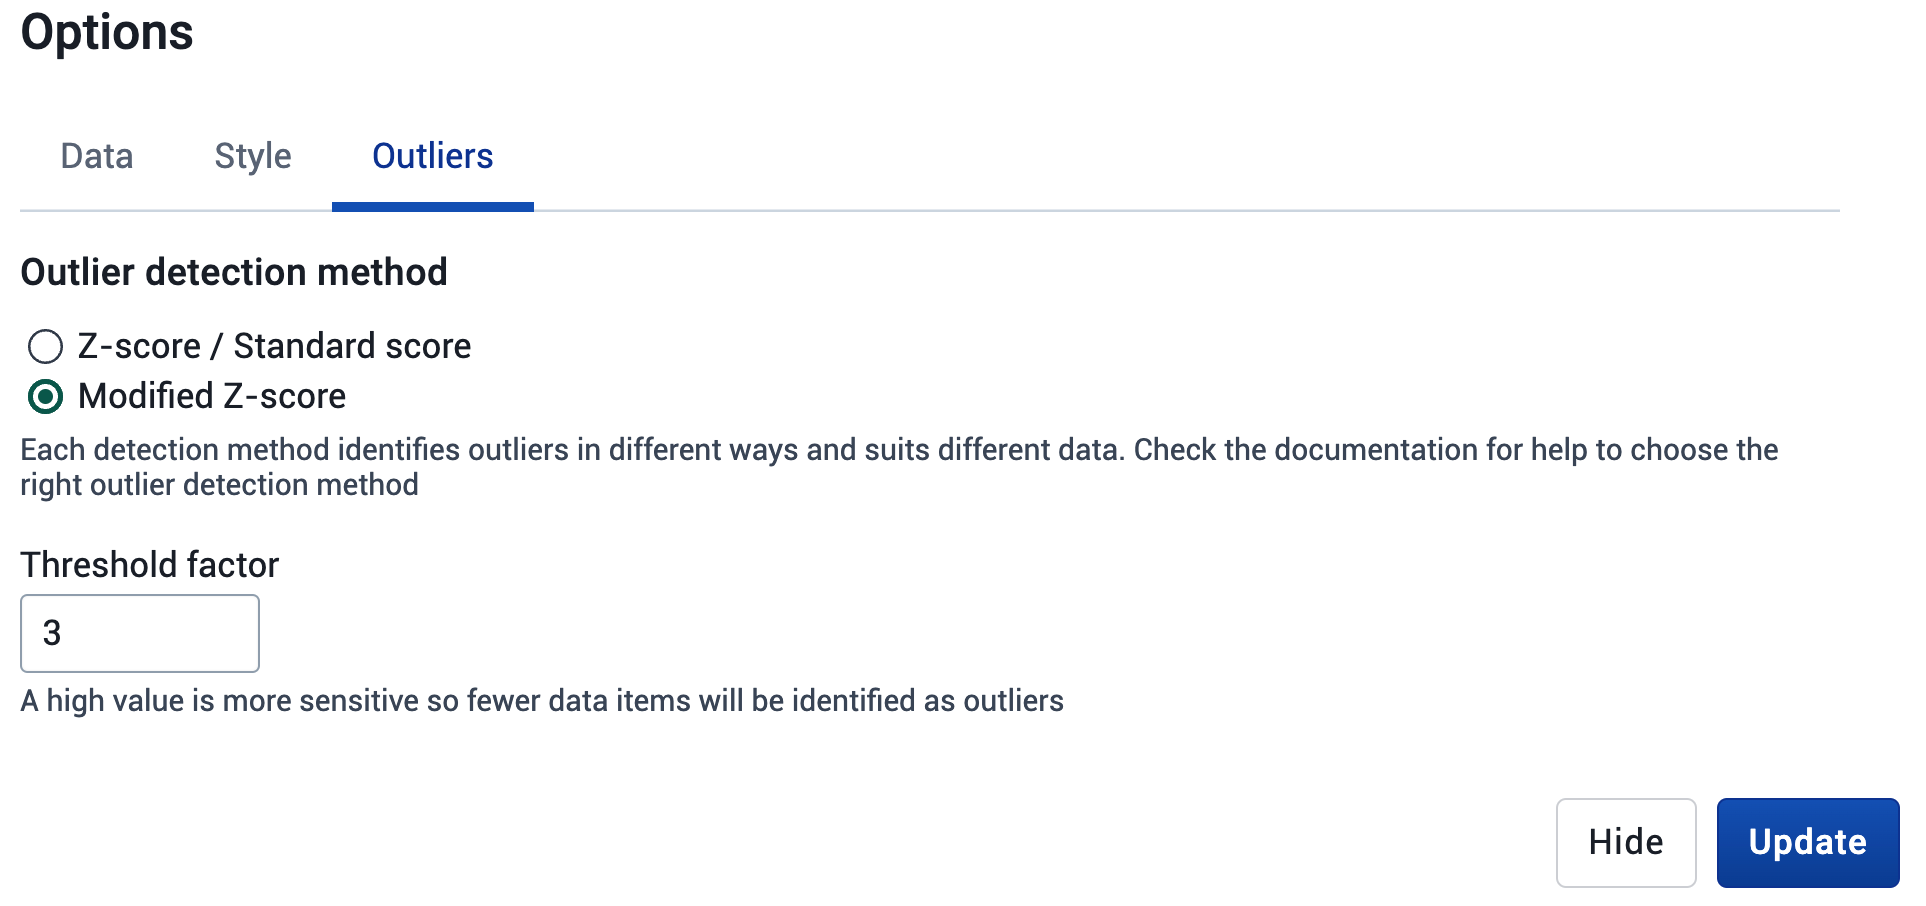
The WHO Data Quality Tool is an application available in the DHIS2 App Hub, supporting a range of data quality analysis functionality based on the WHO Data Quality Review framework. At the time it was released around 2016, much of the data quality analysis functionality was not available in the core DHIS2 applications. Over the years, this has changed and most of the analysis can now be done in DHIS2 core. In the coming 1-2 years, the WHO Data Quality app will no longer be updated for new DHIS2 versions. A new and modernized application is being developed to fill remaining functionality gaps, primarily related to automatic generation of annual data quality reports.
The below table gives an overview of what functionality is available in the WHO Data Quality Tool and what is available in DHIS2 core (as of 2.38).
| Analysis functionality | WHO Data Quality Tool | DHIS2 core apps |
|---|---|---|
| Completeness and timeliness of data sets | Supported | Supported |
| Completeness and timeliness of data elements | Limited support (in annual report only) | Supported |
| Validation rule analysis | Not supported | Supported |
| Min-Max outlier analysis | Not supported | Supported |
| Consistency of related data using scatterplots | Supported | Supported |
| Analysis of negative dropout rates | Supported | Supported |
| Year-over-year charts | Supported | Supported |
| Outlier analysis (time series) | Supported | Supported |
| Consistency over time using scatterplots | Supported | Not supported |
| Automatic generation of annual data quality report | Supported | Not supported (NB: this is supported in the data quality annual report app) |
A dedicated user manual along with a training package is available for the WHO Data Quality Tool, and its functionality is therefore not discussed in this guide.
As outlined in the sections on data quality features related to data entry and analysis, there is a plethora of functionality for ensuring data quality in DHIS2. However, the existence of functionality does not automatically lead to them being used. This section discusses approaches to increase uptake of this functionality. We cover three topics related to this:
To encourage users to review data quality on a routine basis, data quality functionality must be easily available and "pushed" to users as much as possible. In DHIS2, there are primarily two ways of doing this:
Dashboards with data quality metrics is the main way in which automated data quality analysis can be pushed to users. As discussed below on minimal standards, different groups of users should each have access to automated data quality analysis through dashboards designed specifically for their needs. In planning and designing dashboards for different users groups, there are several issues that need to be considered.
Many of the more in-depth data quality metrics we can define in DHIS2 requires a substantial amount of configuration work and additional metadata (such as predictors, data elements to store calculations, and indicators) for every core variable we want to be able to assess. This means that such metrics can realistically only be done for a set of core indicators. The WHO DQA toolkit provides a list of core indicators for certain health programmes, which together with core indicators defined in national M&E plans provide a good starting point in terms of what variables to prioritize. This also means that while dashboards can give an overview of data quality issues and more in-depth information for certain key variables, users must still be trained in how to use other data quality functionality, and there should be SOPs outlining what data quality-related activities they should perform routinely.
The second element to consider is to what extent the automated dashboards should be designed to be operational vs analytical tools, or a combination. At the district and facility level, where users are directly responsible for entering accurate data in a timely fashion, dashboards can be designed to be more operational. For example, highlighting specific data values flagged as potential outliers, or individual facilities that have not yet reported for the current period. For analysts at national level, needs are more likely to be around assessing whether the data is of an acceptable quality to make informed decisions based on it. Thus seeing individual outlier values is less relevant, but a measure of what proportion of the reported data values are potential outliers is relevant for the analysis. Analytics can also have an operational focus at higher levels, such as being able to monitor trends or make geographical comparisons of data quality issues so that interventions can be made.
Dashboards should be tailored to and shared with groups of users with similar information needs and roles in relation to data quality. Technically, it is easy in DHIS2 to provide all users with access to a large number of dashboards by using the sharing functionality to make them public (to all users); however, while a set of public dashboards could be developed covering all key aspects of data quality, it is less likely that users will find and review the information available in a set of dashboards if only a small subset of this information is relevant to them. Key groups of users should therefore be identified for which tailored, automated analytics can be developed in the form of dashboards.
Two dimensions are key in defining these groups of users: the level of the health system at which users are based (national, district, facility etc), and the health area(s) for which they work. The two are closely related, since users at higher levels are typically more specialized in terms of health area/programmes, whilst users at lower levels have broader responsibilities. For example, in a small facility, one or two people might be responsible for data and reporting for all health services, in the district there could be people responsible both for the cross-cutting HMIS reporting as well as more specialized focal points for specific programmes, whilst at national level each health programme might have a team of data analysts.
When considering what user groups to target in terms of DHIS2 data quality dashboard requirements, it is important to keep in mind that individual users can be part of multiple groups of users - both in their actual work, and technically in terms of user groups in DHIS2. For example, if two data quality dashboards have been developed specifically for monitoring Malaria data quality and to provide key data quality metrics for districts, users working in a district that are also responsible for malaria should have access to both dashboards (i.e. be part of both "district users" and "malaria programme users" groups). Assuming relative orgunits and relative periods are used according to best practice for visualization and dashboard design, the same dashboards can often be re-used both at national and sub-national level. The exception is at the facility level, since any analysis involving comparisons across multiple organizational units will not work well for facility users.
As references to how DHIS2 data quality functionality can be implemented, example data quality dashboards are available in the integrated HMIS demo database environment maintained by the HISP Centre. These dashboards generally follow the data quality principles outlined in the data quality principles section and the WHO DQA framework; however, given that the focus is on routine monitoring (e.g. monthly/quarterly), the data quality checks around denominator consistency and external consistency (e.g. with household surveys) are not included since these change at most annually under normal circumstances.
Apart from external consistency checks, the dashboard examples provides metrics on each of the key data quality dimensions:
completeness and timeliness of data, at the data set and data element level
consistency between related data
consistency over time (outlier detection)
Four indicators are used in the example dashboards, based on the core indicators recommended in the WHO DQA framework (the fifth core indicator, TB notifications, has not been included in the initial version of the dashboards due to limitations of the data available in the HMIS demo database).
The dashboard "DQ - Data Quality Core" is available in the HMIS demo database using the following login details: - Username : demo_en / Password: District1# - Username : demo_dq_district / Password: District1#
The dashboard is best reviewed by logging into DHIS2, but a summary of the key components of the dashboard is provided here.
Completeness
Line charts showing the 12-month trend for the core indicators:
Reporting completeness (per data set)
Facilities reporting consistently the previous 12 months
Single value charts for each core indicator, for the last month:
Data element completeness
Facilities reporting consistently the previous 12 months
Tables with key completeness/timeliness metrics for the last month, comparing orgunits (at user's level and below). One table is included for each core indicator. Uses a customized legend set to color cells according to completeness.
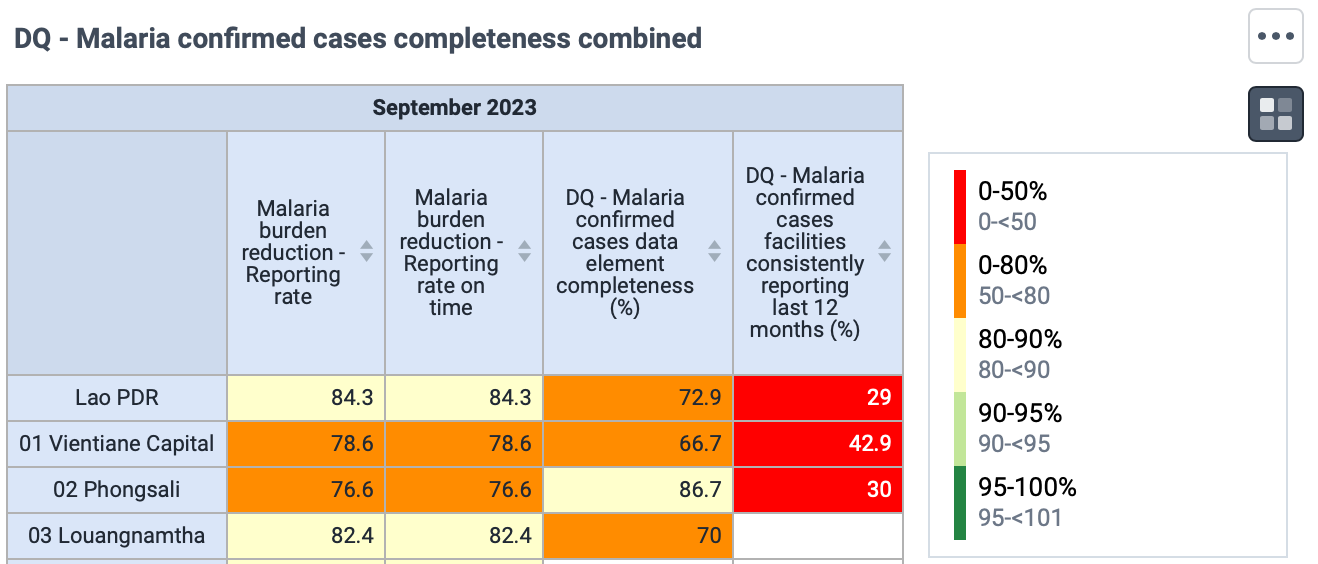
Consistency of related data
Scatterplots showing the core variables against a related variable, across multiple organization units (one level below the user). The outlier detection is enabled, highlighting orgunits with value more than 3 SD from the median using a modified z-score method.
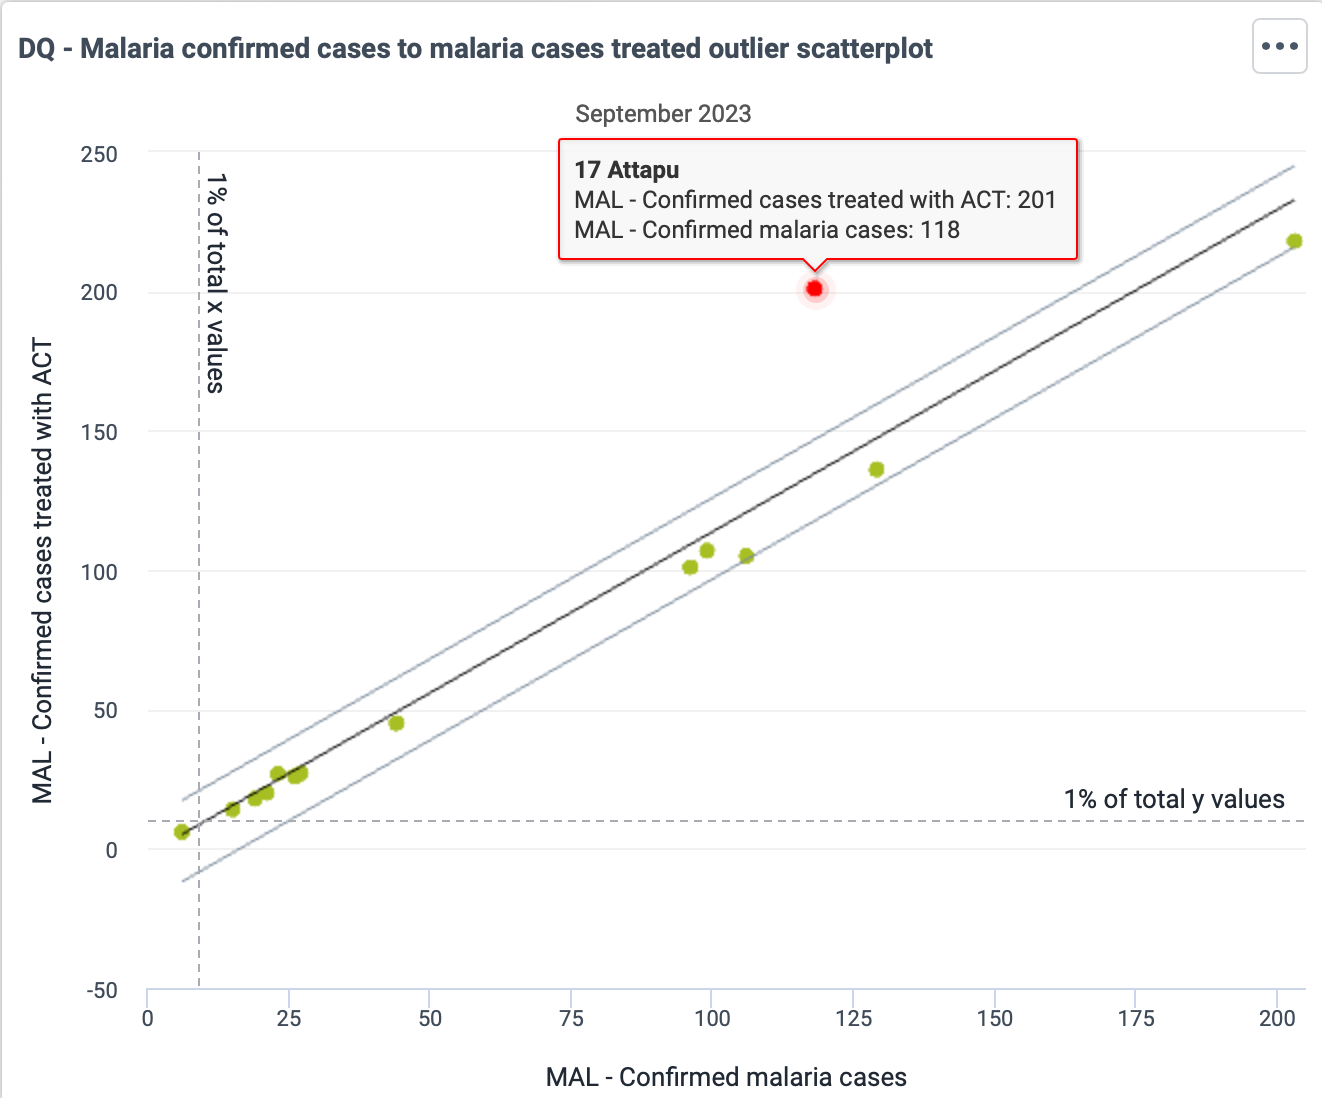
Dropout rates (for variables where applicable) over the last 12 months, presented with a column chart sorted from low to high with negative values highlighted and a corresponding table listing the organization units with negative values.
Consistency over time
Year-over-year charts for each variable, showing the monthly values for the current year and the preceding 5 years.
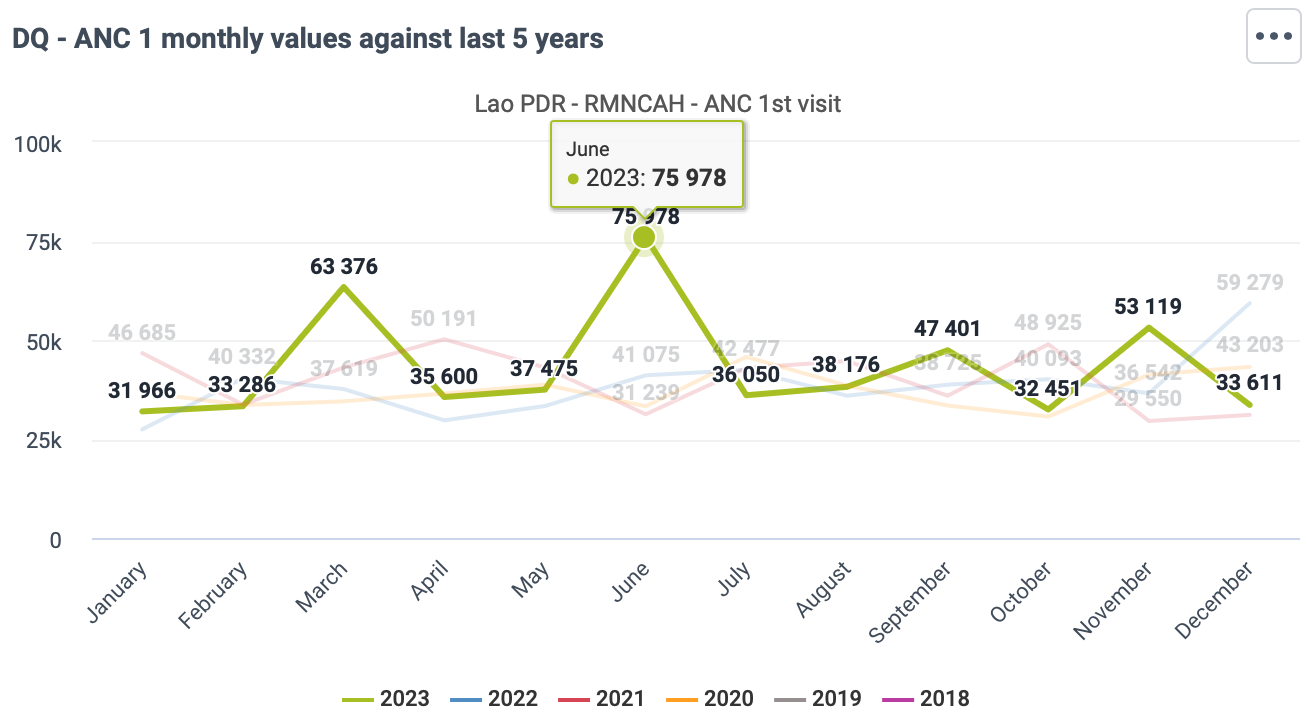
Value excluding outliers for each of the four variables:
Single value charts for the last month
Table with values for the last 12 month, with legend set applied

Table with large outliers for each of the variables in the last 3 months for orgunits below the user' level, with legend set applied according to size of the outlier.
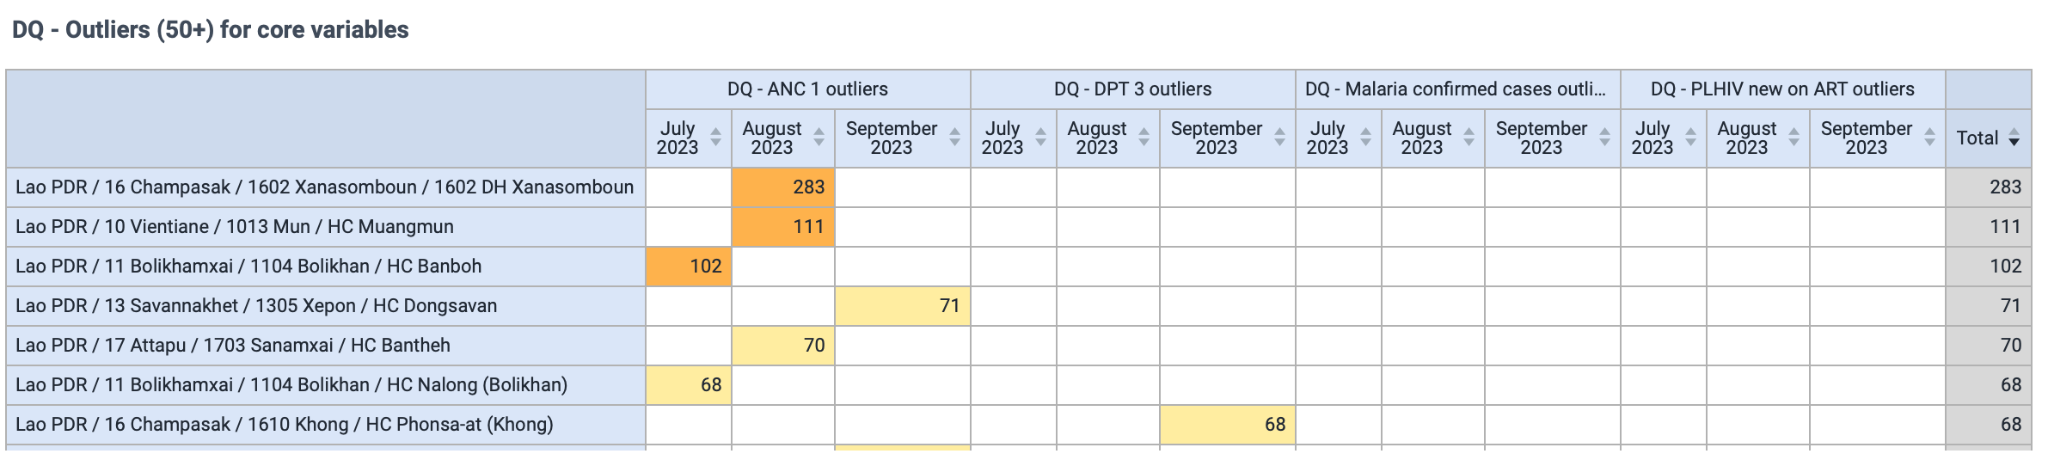
The dashboard "DQ - Data Quality Core" is available in the HMIS demo database using these login details: - Username: district_dq_facility / Password: District1#
The dashboard is best reviewed by logging into DHIS2, but a summary of the key components of the dashboard is provided here.
Completeness
Tables with key completeness/timeliness metrics for the 12 last month (one table for each core indicator), showing:
Data set expected reports: 1 if the facility is supposed to report, 0 otherwise
Data set actual reports: 1 if the facility has marked the data set as complete, 0 otherwise
Data set actual reports on time: 1 if the facility has marked the data set as complete before the reporting deadline, 0 otherwise
Variable value (e.g. ANC 1st visits): the actual data value, to directly assess the data element completeness
Uses a customized legend set to highlight values of 0, but in a neutral color since some facilities are not expected to report on all key variables.

Consistency of related data
Dropout rates (for variables where applicable) over the last 12 months, presented as a single column chart with negative values highlighted and a corresponding table listing the organization units with negative values.
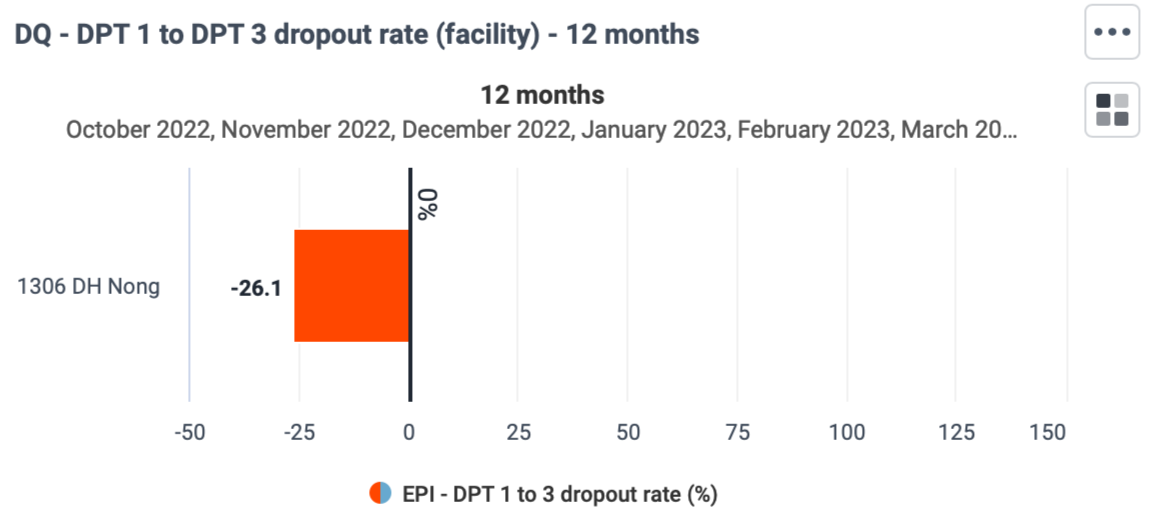
Consistency over time
Year-over-year charts for each variable, showing the monthly values for the current year and the preceding 5 years.
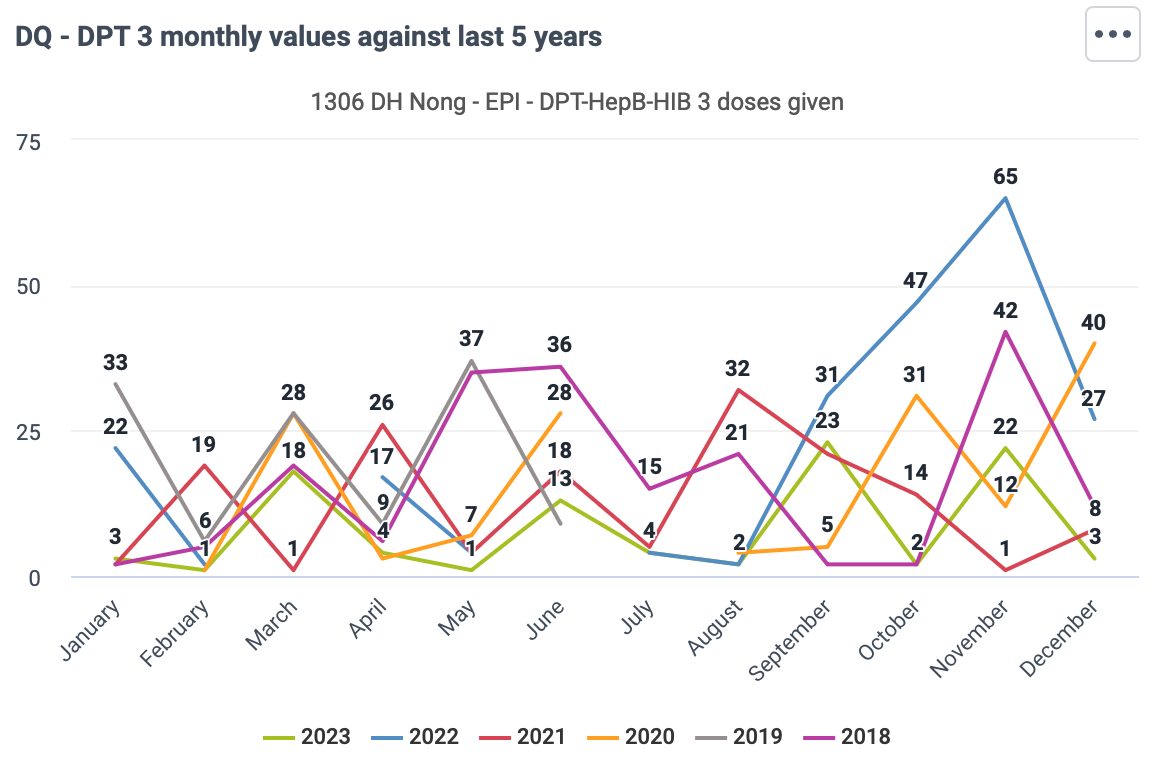
Table with large outliers (values of 10+ only) for each of the variables in the last 12 months for the user's orgunit, with legend set applied according to size of the outlier.
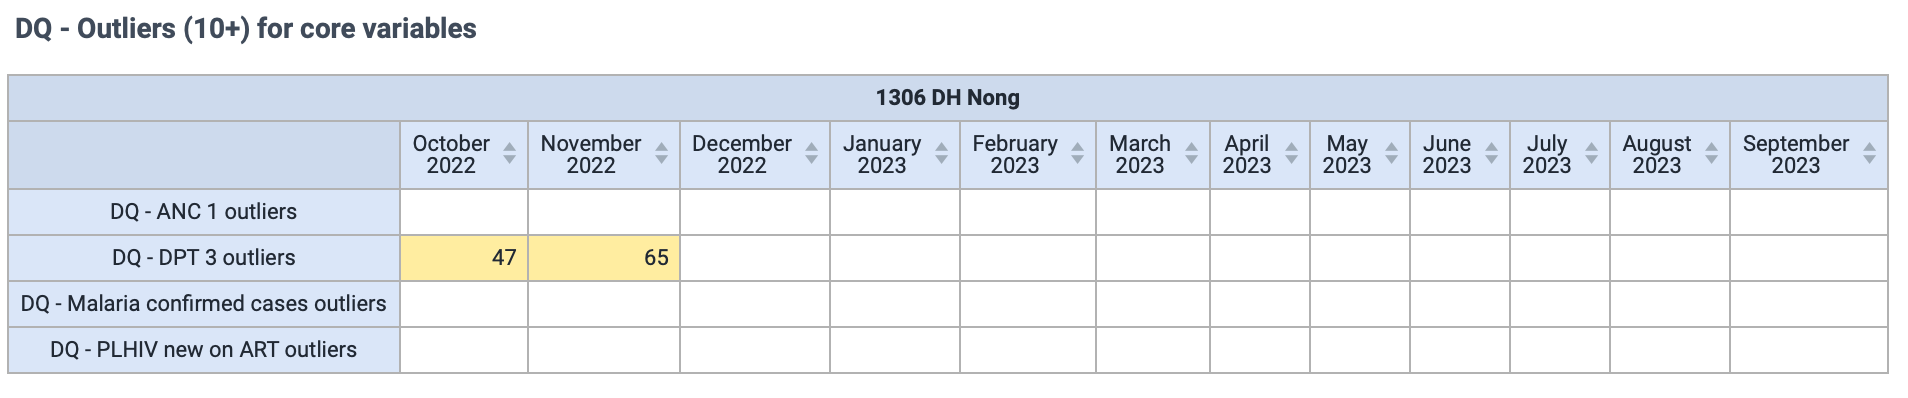
Charts comparing reported values with the calculated outlier for each of the variables in the last 12 months for the user's orgunit.
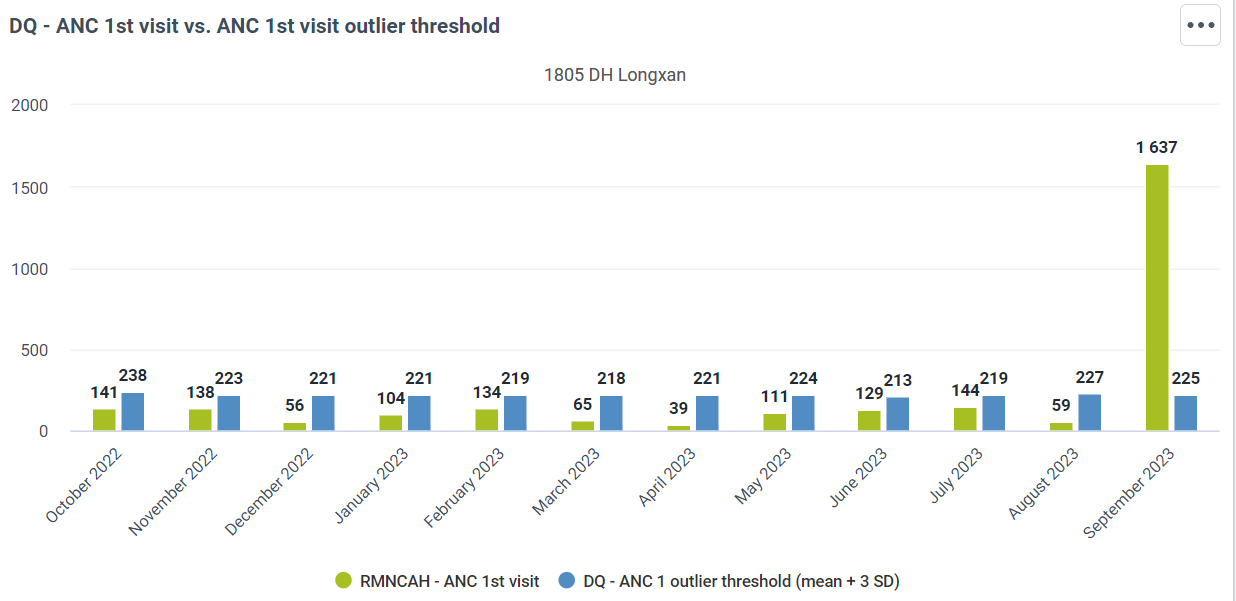
As part of the health data toolkits, data quality dashboards are being included for specific health programmes. These are valuable resources that should be reviewed when implementing data quality dashboards for each respective area. Currently, the Malaria data quality dashboard has been published and is available in the HMIS demo database. Data quality dashboards for TB and HIV are in development, and will be published and made available in the HMIS demo database by the end of 2023.
Dashboards are the main way of providing automated data quality analysis to users. However, validation rule notifications can also be used for this purpose, and be a useful complement if configured correctly. Depending on how DHIS2 is configured, validation rule notifications can be set up so that users receives messages within DHIS2, email or SMS if a certain logical test is true. For data quality, this means that a value is above a certain threshold so that it is flagged as a potential outlier.
Implementation of this functionality needs to be managed carefully, since sending too many messages can lead to people stopping to pay attention. This is particularly true if notifications:
are sent to people for whom the message is not relevant (i.e. they have no responsibility for checking/correcting the potential error)
include too many false positives (i.e. values that turn out not to be data quality errors)
are not significant enough to warrant sending out a dedicated message
Validation rule notifications should therefore be used with caution for data quality monitoring, and is best suited for very high priority variables for which there have been consistent problems with data quality.
Below is a reference list of the data quality metrics and analytics that can be configured in DHIS2 and provided as automated analysis through dashboards or push notifications, for a single variable.
Completeness
Data set completeness and timeliness.
Data element completeness. Can be configured with different measures for the denominator ("expected reports").
Orgunits/facilities consistently reporting
Consistency between related data
Scatterplots, against a related variable
Charts highlighting negative dropout rates (where applicable)
Consistency over time
Year-over-Year charts for visually identifying outliers
Outlier measure
Overall value excluding outlier values
Count and proportion of outlier values
Lists of outlier values by period/organization units
Notifications (DHIS2 message, email or SMS) if values our over outlier threshold
DHIS2 has a wide range of functionality for ensuring and assessing data quality; however, much of this requires configuration by the DHIS2 core team, and it must be made available for end users. Beyond the DHIS2 configuration, it is essential that the training provided to end users of DHIS2 includes data quality functionality and that there are SoPs for staff at all levels that clearly states what their role is in ensuring that data is of good quality. This section outlines what we consider a minimum of configuration and implementation standards for ensuring data quality.
Validation rules configured for all data sets currently in use, covering all data elements where it is possible to define logical comparisons according to validation rule best practices.
Data sets that have been used routinely for at least one year with reasonable reporting completeness should be considered for generation of min-max values.
Data quality indicators should be configured for (at least) high-priority MoH/health programme indicators:
Data element completeness
Facilities consistently reporting
Data excluding outliers
Data quality dashboards should developed and made available to all users, according to their data quality analysis needs
Users should have access to the core "Data quality" application, and other data quality applications that are installed/configured (e.g. WHO Data Quality Tool). This includes:
As a minimum, all users responsible for entering and validating data
Unless there are clear arguments otherwise, other users with data analysis access
WHO Data Quality Tool installed and configured to support annual data quality reviews
Validation rule notification considered (actually implementing this is not considered part of a minimum data quality standard)
Training curriculum and material for staff using DHIS2 should cover use of data quality functionality
Job aides, user manuals and other resources available to users should include cover data quality functionality
SOPs for data quality should be defined and available to users
SOPs covering data quality should be available for users working with data at all levels of the health systems. The SOPs should outline who would do what, when - and how it should be done. This means that the key roles related to data quality must be defined, and the responsibilities of each role. Example of data quality-related activities that should be described include:
What actions should be taken if validation rule or min/max violations occur during data entry?
When should data be reported by, and when should it be reviewed by?
What are the steps that should be taken by different levels of the health system in order to review the data
What should be done when an incorrect value or outlier is identified?
Data data quality SOP have to be developed according to the context and established procedures in each implementation. However, a data quality SOP template is available here which can be a starting point for the development of a country-specific version.
In order for the data quality functionality described here to function as intended, certain underlying functionality must also be set up.
Several data quality metrics rely on use of predictors to perform underlying calculations. In the case of outliers, two sets of predictors are needed: first to calculate outlier thresholds, then to evaluate data against these thresholds. Predictors must be scheduled using the Scheduler app, and it should run so that it is finished before the analytics table generation job takes place, typically every night.
Scheduled jobs cannot be chained together so that one job starts when the previous one is completed. Thus to ensure that the required jobs run in the correct order, you must measure the time it takes for each job to finish and schedule them accordingly.
Here is an example of generating the predictors and using them for analysis
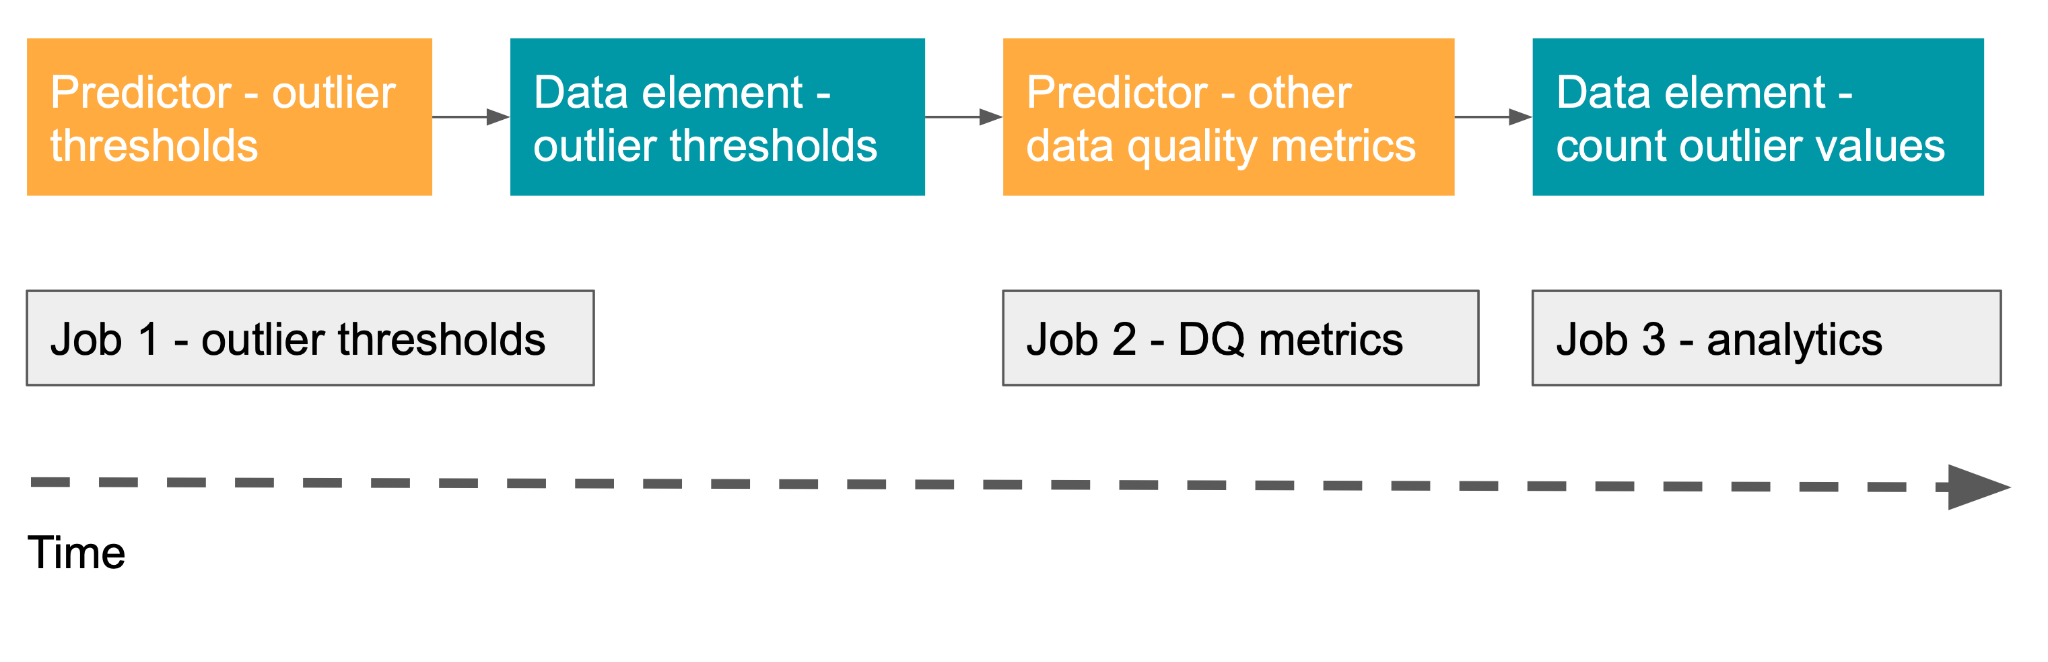
In this second example, we can add the monitoring job for the use of validation rules and notifications
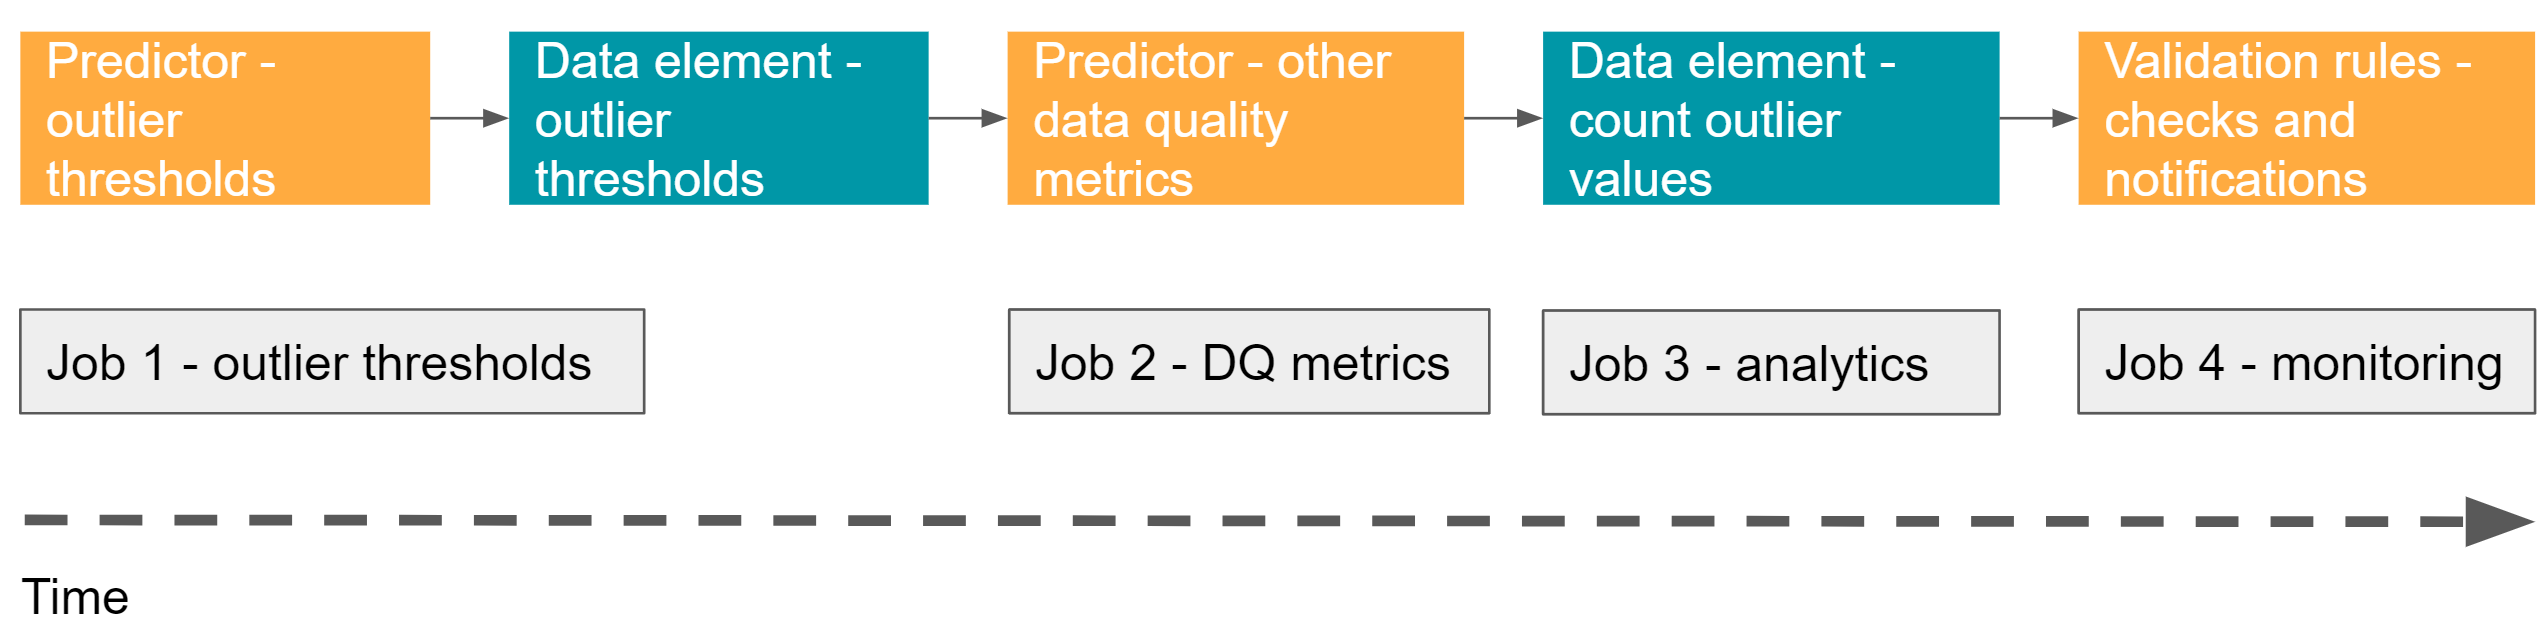
In the below example, predictors to calculate data quality thresholds starts at 23:00 and finishes in about 15 minutes. Predictors to calculate other data quality metrics starts at 23:30 and takes 45 minutes. Finally, the analytics table update jobs starts at 02:00. Perform tests carefully in a development system to track the amount of time each job takes and schedule them accordingly.

Messages, whether direct messages sent by users, validation notifications or system notifications are by default sent as internal DHIS2 messages. For these messages to also be forwarded via email and/or SMS, DHIS2 needs to be configured appropriately and the user needs to enable email/SMS notifications.
For DHIS2 to send email notifications, an SMTP server needs to be configured under system settings. Any mail provider offering an SMTP service can in principle be used for this. A tutorial is also available to set up an email service on DHIS2 host server.
For DHIS2 to send (and receive) SMS messages, an SMS gateway needs to be configured. Alternative options for SMS gateways for DHIS2 are discussed here. Using an android device as a gateway is technically possible, but only recommended for testing and small-scale pilots. Dedicated SMS gateways are typically offered by commercial providers or mobile operators (for a fee), and these service providers will provide the parameters needed to configure the gateway.
The specific steps to configure SMS gateways in DHIS2 are described here, with additional details here.
It is up to each user to choose to enable/disable forwarding of these messages also to SMS or email (assuming these have been configured as described above). This is done by opening Users settings from the DHIS2 menu bar and turning each option for SMS/email on or off (set the settings to "Yes" in order to enable them).
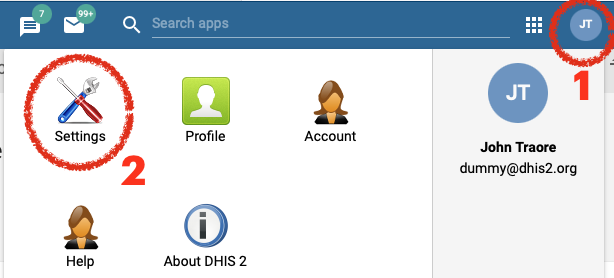
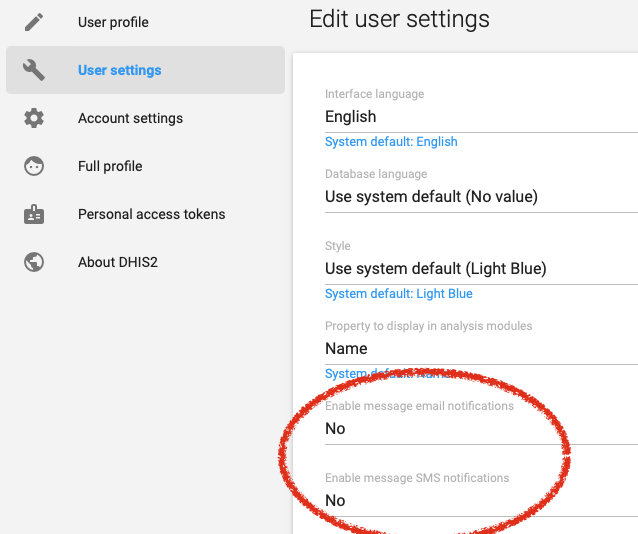
In DHIS2 the location of the data, the geographical context, is represented as organisational units. Organisational units can be either a health facility or department/sub-unit providing services or an administrative unit representing a geographical area (e.g. a health district).
Organisation units are located within a hierarchy, also referred to as a tree. The hierarchy will reflect the health administrative structure and its levels. Typical levels in such a hierarchy are the national, province, district and facility levels. In DHIS2 there is a single organisational hierarchy so the way this is defined and mapped to the reality needs careful consideration. Which geographical areas and levels are defined in the main organisational hierarchy will have major impact on the usability and performance of the application. Additionally, there are ways of addressing alternative hierarchies and levels as explained in the section called Organisation unit groups and group sets further down.
The process of designing a sensible organisation unit hierarchy has many aspects:
Include all reporting health facilities: All health facilities which contribute to the national data collection should be included in the system. Facilities of all kinds of ownership should be incorporated, including private, public, NGO and faith-oriented facilities. Often private facilities constitute half of the total number of facilities in a country and have policies for data reporting imposed on them, which means that incorporating data from such facilities are necessary to get realistic, national aggregate figures.
Emphasize the health administrative hierarchy: A country typically has multiple administrative hierarchies which are often not well coordinated nor harmonized. When considering what to emphasize when designing the DHIS2 database one should keep in mind what areas are most interesting and will be most frequently requested for data analysis. DHIS2 is primarily managing health data and performing analysis based on the health administrative structure. This implies that even if adjustments might be made to cater for areas such as finance and local government, the point of departure for the DHIS2 organisation unit hierarchy should be the health administrative areas.
Limit the number of organisation unit hierarchy levels: To cater for analysis requirements coming from various organisational bodies such as local government and the treasury, it is tempting to include all of these areas as organisation units in the DHIS2 database. However, due to performance considerations one should try to limit the organisation unit hierarchy levels to the smallest possible number. The hierarchy is used as the basis for aggregation of data to be presented in any of the reporting tools, so when producing aggregate data for the higher levels, the DHIS2 application must search for and add together data registered for all organisation units located further down the hierarchy. Increasing the number of organisation units will hence negatively impact the performance of the application and an excessively large number might become a significant problem in that regard.
In addition, a central part in most of the analysis tools in DHIS2 is based around dynamically selecting the “parent” organisation unit of those which are intended to be included. For instance, one would want to select a province and have the districts belonging to that province included in the report. If the district level is the most interesting level from an analysis point of view and several hierarchy levels exist between this and the province level, this kind of report will be rendered unusable. When building up the hierarchy, one should focus on the levels that will be used frequently in reports and data analysis and leave out levels that are rarely or never used as this will have an impact on both the performance and usability of the application.
Avoid one-to-one relationships: Another guiding principle for designing the hierarchy is to avoid connecting levels that have near one-to-one parent-child ratios, meaning that for instance a district (parent) should have on average more than one local council (child) at the level below before it make sense to add a local council level to the hierarchy. Parent-child ratios from 1:4 or more are much more useful for data analysis purposes as one can start to look at e.g. how a district’s data is distributed in the different sub-areas and how these vary. Such drill-down exercises are not very useful when the level below has the same target population and the same serving health facilities as the parent.
Skipping geographical levels when mapping the reality to the DHIS2 organisation unit hierarchy can be difficult and can easily lead to resistance among certain stakeholders, but one should have in mind that there are actually ways of producing reports based on geographical levels that are not part of the organisational hierarchy in DHIS2, as will be explained in the next section.
In DHIS2, organisation units can be grouped in organisation unit groups, and these groups can be further organised into group sets. Together they can mimic an alternative organisational hierarchy which can be used when creating reports and other data output. In addition to representing alternative geographical locations not part of the main hierarchy, these groups are useful for assigning classification schemes to health facilities, e.g. based on the type or ownership of the facilities. Any number of group sets and groups can be defined in the application through the user interface, and all these are defined locally for each DHIS2 database.
An example illustrates this best: Typically one would want to provide analysis based on the ownership of the facilities. In that case one would create a group for each ownership type, for instance “MoH”, “Private” and “NGO”. All facilities in the database must then be classified and assigned to one and only one of these three groups. Next one would create a group set called “Ownership” to which the three groups above are assigned, as illustrated in the figure below.
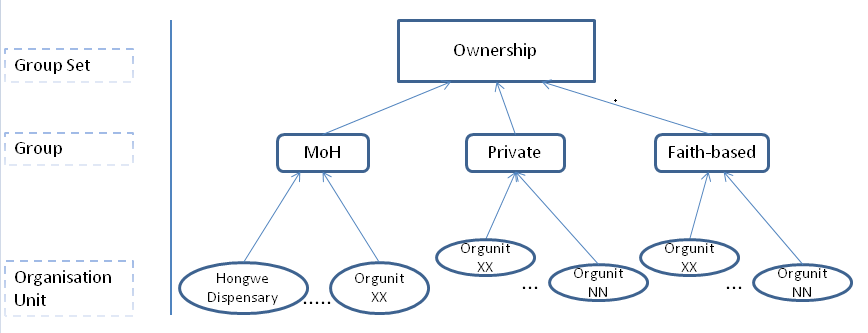
In a similar way one can create a group set for an additional administrative level, e.g. local councils. All local councils must be defined as organisation unit groups and then assigned to a group set called “Local Council”. The final step is then to assign all health facilities to one and only one of the local council groups. This enables the DHIS2 to produce aggregate reports by each local council (adding together data for all assigned health facilities) without having to include the local council level in the main organisational hierarchy. The same approach can be followed for any additional administrative or geographical level that is needed, with one group set per additional level. Before going ahead and designing this in DHIS2, a mapping between the areas of the additional geographical level and the health facilities in each area is needed.
A key property of the group set concept in DHIS2 to understand is exclusivity, which implies that an organisation unit can be member of exactly one of the groups in a group set. A violation of this rule would lead to duplication of data when aggregating health facility data by the different groups, as a facility assigned to two groups in the same group set would be counted twice.
With this structure in place, DHIS2 can provide aggregated data for each of the organisation unit ownership types through the “Organisation unit group set report” in “Reporting” module or through the Excel pivot table third-party tool. For instance one can view and compare utilisation rates aggregated by the different types of ownership (e.g. MoH, Private, NGO). In addition, DHIS2 can provide statistics of the distribution of facilities in “Organisation unit distribution report” in “Reporting” module. For instance one can view how many facilities exist under any given organisation unit in the hierarchy for each of the various ownership types. In the GIS module, given that health facility coordinates have been registered in the system, one can view the locations of the different types of health facilities (with different symbols for each type), and also combine this information with another map layer showing indicators e.g. by district.
This chapter first discusses an important building block of the system: the data element. Second it discusses the category model and how it can be used to achieve highly customized meta-data structure for storage of data.
The data element is together with the organisation unit the most important building block of a DHIS2 database. It represents the what dimension and explains what is being collected or analysed. In some contexts this is referred to an indicator, however in DHIS2 this meta-data element of data collection and analysis is referred to as a data element. The data element often represents a count of some event and its name describes what is being counted, e.g. "BCG doses given" or "Malaria cases". When data is collected, validated, analysed or presented it is the data elements or expressions built with data elements that describe what phenomenon, event or case the data is registered for. Hence the data elements become important for all aspects of the system and decide not only how data is collected, but more importantly how the data is represented in the database and how data can be analysed and presented.
An important principle behind designing data elements is to think of data elements as a self-contained description of a phenomenon or event and not as a field in a data entry form. Each data element lives on its own in the database, completely detached and independent from the collection form. It is important to consider that data elements are used directly in reports, charts and other tools for data analysis, in which the context in any given data entry form is not accessible nor relevant. In other words, it must be possible to clearly identify what event a data element represents by only looking at its name. Based on this, it is considered best practice to create the name of the data element such that it is able to stand on its own. Any user should be able to read the name and understand what event it represents, even outside of the context of the data entry form.
As an example, a data element called “Malaria” might be concise when seen in a data entry form capturing mortality data, in a form capturing drug stocks as well as in a form for out-patient data. When viewed in a report, however, outside the context of the data entry form, it is impossible to decide what event this data element represents. If the data element had been called “Malaria deaths”, “Malaria stock doses received” or “Malaria prophalaxis given” it would have been clear from a user perspective what the report is trying to express. In this case we are dealing with three different data elements with completely different semantics.
Certain requirements for data capture necessitate a fine-grained breakdown of the dimension describing the event being counted. For instance one would want to collect the number of “Malaria cases” broken down on gender and age groups, such as “female”, “male” and “\< 5 years” and “> 5 years”. What characterizes this is that the breakdown is typically repeated for a number of “base” data elements: For instance one would like to reuse this break-down for other data elements such as “TB” and “HIV”. In order to make the meta-data more dynamic, reusable and suitable for analysis, it makes sense to define the mentioned diseases as data elements and create a separate model for the breakdown attributes. This can be achieved by using the category model, which is described in the following.
The category model has four main elements which are best described using the above example:
Category options, which correspond to “Female”, “Male” and “\< 5 years” and “> 5 years”. Category options are the fine grained attributes which are related in some common way.
A category, which corresponds to “Gender” and “Age group”. Categories are used to group related category options according to a common theme.
A category combination, which is a combination of multiple categories together. In the example above, we might assign both the "Gender" and "Age Group" categories to a category combination called "Age/Gender".
Category option combinations result from all possible combinations of all category options within a category combination. In the example above, the following category option combinations would be created: "Female/\<5 years", "Female/>5 years", "Male/\<5 years", "Male/>5 years"
It is worth noting that the category model is completely indepent of the data element model. Data elements are loosely coupled to categories, in that the association between them can be changed at any time without losing any data. As a practical example from above, perhaps data needs to be collected for malaria cases with more granular age bands. Instead of just "\<5" and "/>5", a new category could be created for "\<1", "1-5",">5" to describe the finer age bands. This category could then in turn be associated with the data element in a new data entry form to collect the data at a more granular level. The advantage with this approach would be that the same data element is used, which simplifies analysis of data over time.
It is generally not recommended to change the association between data elements and their category combinations trivially or often because of potential incompatibility between data which has been collected using differing category combinations. Potential approaches to solve this problem using "category option group sets" will be discussed in another section of this document.
Note that there is no intrisic limit on the number of category options in a category or number of categories in a category combination, however there is a natural limit to where the structure becomes messy and unwieldy. Very large category combinations with many options can quickly inflate to become many thousands of category option combinations which in turn can have a negative impact on performance.
A pair of data element and category combination can now be used to represent any level of breakdown. It is important to understand that what is actually happening is that a number of custom dimensions are assigned to the data. Just like the data element represents a mandatory dimension to the data values, the categories add custom dimensions to it. In the above example we can now, through the DHIS2 output tools, perform analysis based on both “Gender” and “Age group” for those data elements, in the same way as one can perform analysis based on data elements, organisation units and periods.
This category model can be utilized both in data entry form designs and in analysis and tabular reports. For analysis purposes, DHIS2 will automatically produce sub-totals and totals for each data element associated with a category combination. The rule for this calculation is that all category options should sum up to a meaningful total. The above example shows such a meaningful total since when summarizing “Malaria cases” captured for “Female \< 5 years”, “Male \< 5 years”, “Female > 5 years” and “Male > 5 years” one will get the total number of “Malaria cases”.
For data capture purposes, DHIS2 can automatically generate tabular data entry forms where the data elements are represented as rows and the category option combinations are represented as columns. This will in many situations lead to compelling forms with a minimal effort. It is necessary to note that this however represents a dilemma as these two concerns are sometimes not compatible. For instance one might want to quickly create data entry forms by using categories which do not adhere to the rule of a meaningful total. We do however consider this a better alternative than maintaining two independent and separate models for data entry and data analysis.
An important point about the category model is that data values are persisted and associated with a category option combination. This implies that adding or removing categories from a category combination renders these combinations invalid and a low-level database operation must be done to correct it. It is hence recommended to thoughtfully consider which breakdowns are required and to not change them too often.
All aggregate data in DHIS2 is always associated with four primary dimensions:
Additional categories may be required in order to support data entry and analysis however. An additional free form dimension is also available to implementers, known as the "attribute combination". Attribute combinations are very similar to category combinations in terms of how they are implemented in the system. The difference however, is that they are not directly associated with individual data elements, but rather groups of data elements.
Expanding on the example from above using the data element "Malaria cases", there may be a need to collect data at the same organisation unit and same time period for two different partners which work in that facility. In order to be able to attribute data to these partners, we could create a category called "Partner" which would contain the names of each partner as category options. This category could then be used as an attribute combination for the dataset which the "Malaria cases" is a part of. During data entry, an additional drop down option becomes available in the data entry screen, which would allow the user to choose which partner the data is associated with.
Thus, while attribute option combinations are structurally equivalent to category option combinations, they are used to disaggregate data at the level of the data set. All data value which are part of a data set which is associated with an attribute combination, would be recorded and disaggregated with an additional fifth dimension, in addition to the four primary dimensions listed above. There are no restrictions on how an attribute combination can be constructed, which in turn allows for implementers to design arbitrary dimensions for specific data sets.
Category and attribute combinations are used during data entry to disaggregate data in certain ways, for instance by age and sex breakdowns. When the data is later analyzed, there may be a need to aggregate or group the data in different ways. Consider a category with the following age bands:
Data may be entered with these age groups, but when analyzed in the analytics apps of DHIS2, there may be a need to group the data according to more coarse age bands. Using a category option group set, we could create two category groups, such as \<15 and 15+. Each of the original category options could then be placed into the corresponding category option group. Each of the groups can then be associated with a category option group set, which becomes available as an additional dimension in the analytics apps.
Category option group sets are particularly useful for creating higher level groupings of common category options. This approach is often useful for combining data elements which may have been collected according to related, but different category combinations.
Data elements which are related to one another can be grouped together with a data element group. Data element groups are completely flexible in terms of both their names and their memberships.
Groups are useful both for browsing and presenting related data, and can also be used to aggregate values captured for data elements in the group. Groups are loosely coupled to data elements and not tied directly to the data values which means they can be modified and added at any point in time without interfering with the low-level data.
Similar to category option group sets, data element group sets can be used to aggregate related data elements together. We might be interested in determining the total number of communicable and non-communicable diseases from a morbidity data set. A data element group set could be created with two groups: "Communicable diseases" and "Non-communicable diseases". Data elements could be placed into each of these groups.
During a pivot table analysis, the data elemement group set could be used to aggregate data by each of the data element groups within the group set.
This approach allows for highly flexible types of analyses where the exact defintion of the combination of data elements are not known or which may be difficult to define in the form of an indicator.
This chapter discusses data sets and forms, what types of forms are available and describes best practises for the process of moving from paper based to electronic forms.
All data entry in DHIS2 is organised through the use of data sets. A data set is a collection of data elements grouped together for data collection, and in the case of distributed installs they also define chunks of data for export and import between instances of DHIS2 (e.g. from a district office local installation to a national server). Data sets are not linked directly to the data values, only through their data elements and frequencies, and as such a data set can be modified, deleted or added at any point in time without affecting the raw data already captured in the system, but such changes will of course affect how new data will be collected.
A data set has a period type which controls the data collection frequency, which can be daily, weekly, monthly, quarterly, six-monthly, or yearly. Both the data elements to include in the data set and the period type is defined by the user, together with a name, short name, and code. If calculated fields are needed in the collection form (and not only in the reports), then indicators can be assigned to the data set as well, but these can only be used in custom forms (see further down).
In order to use a data set to collect data for a specific organisation unit the user must assign the organisation unit to the data set. This mechanism controls which organisation units can use which data sets, and at the same time defines the target values for data completeness (e.g. how many health facilities in a district are expected to submit the RCH data set every month).
A data element can belong to multiple data sets, but this requires careful thinking as it may lead to overlapping and inconstant data being collected if e.g. the data sets are given different frequencies and are used by the same organisation units.
Once you have assigned a data set to an organisation unit that data set will be made available in Data Entry (under Services) for the organisation units you have assigned it to and for the valid periods according to the data set's period type. A default data entry form will then be shown, which is simply a list of the data elements belonging to the data set together with a column for inputting the values. If your data set contains data elements with categories such as age groups or gender, then additional columns will be automatically generated in the default form based on the categories. In addition to the default list-based data entry form there are two more alternatives, the section-based form and the custom form.
DHIS2 currently features three different types of forms which are described in the following.
A default data entry form is simply a list of the data elements belonging to the data set together with a column for inputting the values. If your data set contains data elements with a non-default category combination, such as age groups or gender then additional columns will be automatically generated in the default form based on the different options/dimensions. If you use more than one category combination in a data set you will get one table per category combination in the default form, with different column headings for the options.
Section forms allow for a bit more flexibility when it comes to using tabular forms and are quick and simple to design. Often your data entry form will need multiple tables with subheadings, and sometimes you need to disable (grey out) a few fields in the table (e.g. some categories do not apply to all data elements), both of these functions are supported in section forms. After defining a data set you can define it's sections with subsets of data elements, a heading and possible grey fields in the section's table. The order of sections in a data set can also be defined. In Data Entry you can now start using the Section form (which should appear automatically when sections are available for the selected data set). Most tabular data entry forms should be possible to do with sections forms. Utilizing the section or default forms makes life easy as there is no need to maintain a fixed form design which includes references to data elements. If these two types of forms are not meeting your requirements then the third option is the completely flexible, although more time-consuming, custom data entry forms.
When the form you want to design is too complicated for the default or section forms then your last option is to use a custom form. This takes more time, but gives you full flexibility in terms of the design. In DHIS2 there is a built in HTML editor (CK Editor) in the form designer which allows you to either design the form in the GUI or paste in your html directly (using the "source" window in the editor). In the custom form you can insert static text or data fields (linked to data elements + category option combination) in any position on the form and you have complete freedom to design the layout of the form. Once a custom form has been added to a data set it will be available in Data Entry and used automatically.
When using a custom form it is possible to use calculated fields to display e.g. running totals or other calculations based on the data captured in the form. This can e.g. be useful when dealing with stock or logistics forms that need item balance, items needed for next period etc. In order to do so, the user must first define the calculated expressions as indicators and then assign these indicators to the data set in question. In the custom form designer the user can then assign indicators to the form the same way data elements are assigned. The limitation to the calculated expression is that all the data elements used in the expression must be available in the same data set since the calculations are done on the fly inside the form, and are not based on data values already stored in the database.
When introducing an electronic health information system the system being replaced is often paper based reporting. The process of migrating to electronic data capture and analysis has some challenges. The following sections suggest best practises on how to overcome these.
Typically the design of a DHIS2 data set is based on some requirements from a paper form that is already in use. The logic of paper forms are not the same as the data element and data set model of DHIS, e.g. often a field in a tabular paper form is described both by column headings and text on each row, and sometimes also with some introductory table heading that provides more context. In the database this is captured for one atomic data element with no reference to a position in a visual table format so it is important to make sure the data element, with the optional data element categories, captures the full meaning of each individual field in the paper form.
Another important thing to have in mind while designing data sets is that the data set and the corresponding data entry form (which is a data set with layout) is a data collection tool and not a report or analysis tool. There are other far more sophisticated tools for data output and reporting in DHIS2 than the data entry forms. Paper forms are often designed with both data collection and reporting in mind and therefore you might see things such as cumulative values (in addition to the monthly values), repetition of annual data (the same population data reported every month) or even indicator values such as coverage rates in the same form as the monthly raw data. When you store the raw data in the DHIS2 database every month and have all the processing power you need within the computerised tool, there is no need (in fact it would be wrong and most likely cause inconsistency) to register manually calculated values such as the ones mentioned above. You only want to capture the raw data in your data sets/forms and leave the calculations to the computer, and presentation of such values to the reporting tools in DHIS. Through the functionality of data set reports all tabular section forms will automatically get extra columns at the far right providing subtotal and total values for each row (data element).
This chapter covers the following topics:
What is an indicator
Purposes of indicators
Indicator-driven data collection
Managing indicators in DHIS2
The following describes these topics in greater detail.
In DHIS2, the indicator is a core element of data analysis. An indicator is a calculated formula based on a combination of data elements, category options, possibly constants and a factor. There are two foms of indicators, those with a denominator and those which do not have a denominator. Calculated totals, which may be composed of multiple data elements do not have denominators. Coverage indicators (ratios, percentages, etc) are composed of two formulas of data elements, one representing the numerator and another representing the denominator.
Indicators are thus made up of formulas of data elements and other components and are always multiplied by a factor (e.g. 1, 100, 100, 100 000). The factor is essentially a number which is multiplied by the result of the numerator divided by denominator. As a concrete example, the indicator "BCG coverage <1 year" is defined by a formula with a factor 100 (in order to obtain a percentage), a numerator ("BCG doses given to children under 1 year") and a denominator ("Target population under 1 year"). The indicator "DPT1 to DPT3 drop out rate" is a formula of 100 % x ("DPT1 doses given"- "DPT3 doses given") / ("DPT1 doses given").
| Indicator | Formula | Numerator | Denominator | Factor |
|---|---|---|---|---|
| Fully immunized <1 year coverage | Fully immunized/Population < 1 year x 100 | Fully immunized | Population < 1 | 100 (Percentage) |
| Maternal Mortality Rate | Maternal deaths/Live births x 100 000 | Maternal deaths | Live births | 100 000 (MMR is measured per 100 000) |
| Cumulative number of people Enrolled in Care | Cumulative number of people Enrolled in Care x 1 | Cumulative number Enrolled in Care (Male, Age<18) +Cumulative number Enrolled in Care (Male, Age18+) +Cumulative number Enrolled in Care (Female, Age<18) +Cumulative number Enrolled in Care (Female, Age18+) | None | 1 |
Indicators which are defined with both numerators and denominators are typically more useful for analysis. Because they are proportions, they are comparable across time and space, which is very important since units of analysis and comparison, such as districts, vary in size and change over time. A district with population of 1000 people may have fewer cases of a given disease than a district with a population of 10,000. However, the incidence values of a given disease will be comparable between the two districts because of the use of the respective populations for each district.
Indicators thus allow comparison, and are the prime tool for data analysis. DHIS2 should provide relevant indicators for analysis for all health programs, not just the raw data. Most report modules in DHIS2 support both data elements and indicators and you can also combine these in custom reports.
Since indicators are more suited for analysis compared to data elements, the calculation of indicators should be the main driving force for collection of data. A usual situation is that much data is collected but never used in any indicator, which significantly reduces the usability of the data. Either the captured data elements should be included in indicators used for management or they should probably not be collected at all.
For implementation purposes, a list of indicators used for management should be defined and implemented in DHIS2. For analysis, training should focus on the use of indicators and why these are better suited than data elements for this purpose.
Indicators can be added, deleted, or modified at any time in DHIS2 without affecting the data. Indicators are not stored as values in DHIS2, but as formulas, which are calculated whenever the user needs them. Thus a change in the formulas will only lead to different data elements being called for when using the indicator for analysis, without any changes to the underlying data values taking place. For information how to manage indicators, please refer to the chapter on indicators in the DHIS2 user documentation.
This sections discusses procedures and recommendations related to the long-term maintenance of metadata a DHIS2 implementation. It describes procedural challenges associated with co-ordinating long-term configuration processes and provides example standard operating procedures that can be adapted and used to better co-ordinate these processes.
Procedural issues that can result in complications when managing metadata include
When working on your DHIS2 configuration, it is recommended that you have at least 1 development instance available for you to use. If you have more then 1 production instance, then you should consider having a copy of each of these instances for the purposes of creating new metadata or otherwise modifying your configuration (Figure 1).

Many metadata challenges result from users adding metadata directly on a production system. This metadata is either not configured correctly, or not used in the system resulting in changes that need to be cleaned up when discovered later on.
By using a development system you can avoid these challenges, as items on the development system should be able to be removed if not needed without any implications on the production system configuration or data.
SOPs for adding metadata should be available for all DHIS2 implementations. You can view some example standard operating procedures for adding aggregate metadata and users respectively.
When implementing a standard operating procedure, training on each specific procedure should be performed and evaluation of its implementation should continue until the defined procedure is standard practice. These procedures often go beyond the mechanics of customization/modification of metadata and require those that are adding to or modifying the configuration to closely consider how objects are added and the effect this has on the overall ease of use of the system.
Beyond having specific procedures for adding metadata or modifying the configuration, these actions should be conducted in a co-ordinated manner. This co-ordination can be simple, such as internal discussions between team members, or complex, such as a committee who has an overview of all planned projects and can schedule modifications accordingly and will depend on the context of the implementation.
Lack of coordination can often lead to duplicate versions of metadata being created. As an example, if there are two admins adding the same new aggregate form within a system without informing each other, then a number of duplicate pieces of metadata will likely end up within the system.
In these scenarios, having a coordination mechanism outlined that informs those involved in configuring the DHIS 2 system what is happening can save significant time and effort later on as cleaning these duplicates can be a time consuming process.
WHO packages or other standards based configuration that is being imported into a system may add a significant amount of duplicate metadata. As an example, packages solely use indicators on their dashboard. These indicators may be duplicates of existing data elements. In addition, if items in an existing system populated with existing metadata are not matched before a standards based package is imported, then this may result in duplicate items (such as category options, option sets, etc.) being created during the import.
As a general rule, when importing a standards based package, try to re-use as much existing metadata as possible. This will likely involve editing the json file for the package prior to importing it so that IDs in the import file match existing IDs in the system you are importing to.
For the dashboards, the duplicate indicators may not be problematic, particularly if they are grouped together correctly. This should be judged on a case-by-case basis to determine their impact on the system prior to importing the package.
Note : Importing packages should always be attempted in a development system first. Only when all issues have been sorted out should they be imported to a production system
When data collection tools are updated over time, measures can be taken to re-use various objects rather then create a duplicate version of them.
There should be no hesitation in reusing metadata between different event and tracker programs where possible. This metadata is always tied to the specific program that is being created and will maintain the required separation within the system.
For aggregate data sets, re-use of metadata may be less clear. A common problem is when disaggregations are modified from one form to the next. Let us take the example outlined in Figure 2.

From this form we can see that the disaggregations for each of the data elements have been changed. Rather then create new data elements in which to apply these new disaggregations to; you can use a function called "Category combination over ride." This feature allows a data element to be associated with multiple category combinations over time.
To override the category combination, open up your data set from maintenance. Where you add your data elements, you will see a small wrench icon. When you hover over it it will say “Over ride the data element category combination” (Figure 3).

From here you will open a menu which lists your data elements on the left side and allows you to over ride the category combinations on the right side (Figure 4)

Figure 4
Just select the category combination for the data element you want to over ride using this menu.
Note : You may need to create new category options, categories and category combinations. If you do, please review the example aggregate metadata procedure.
This has the distinct advantage of allowing you to review the data within these re-used data elements over longer periods of time. Any data entered into these data elements using the old form can still be reviewed and compared with periods in which the the new form (and disaggregations) are being used.
When creating a new data set that will replace a previous data set, you should consider rationalizing your reporting rates if needed, as the new dataset you make would not have any of your previous reporting rates associated with it by default. If you want to maintain the reporting rates together, you can export/import them from the old data set to the new data set so you can review all of the legacy reporting rates with the new ones together if that is needed. You should test this process in a development instance prior to performing it on your production system. Always take a backup before performing any import operations.
In order to retrieve the existing reporting rates, you can interact with the /completeDataSetRegistrations resource and use the following query
api/completeDataSetRegistrations?dataSet=XA8e9AVn8Vo&startDate=2000-01-01&endDate=2017-07-01&orgUnit=mPlB2jqKNP0&children=true
NB: note that you should replace the dataset ID in this example with the dataset ID in your own system, the dates with your dates that you require and the organisation unit ID's with your own IDs. In this example we are selecting the reporting rate from all child orgunits, so you replace the organisation unit ID with the parent ID.
This will return a result consisting of the following parameters for each period that is covered in your query.
{completeDataSetRegistrations: [{"period":"201408","dataSet":"XvcWsuHBsGA","organisationUnit":"ZUwksatWvE8","attributeOptionCombo":"HllvX50cXC0","date":"2014-09-15","storedBy":"automatic"}]}
Once you have retrieved the reporting rates, you can push them to the new data set using a POST request to the following endpoint
api/completeDataSetRegistrations
NB: note that you should replace the dataset IDs returned in the initial query with the dataset ID of the new dataset you are importing these reporting rates to. Do this prior to posting the information to the completeDataSetRegistrations resource.
In the event you have made new data elements to represent a concept that was partially represented previously, it may be worthwhile to create indicators that link these data elements together so this data can be viewed longitudinally over time (ie. you can view data from both new and old forms in one variable when you create an output). This principal operates under the assumption that there is no overlap in the data of the previous and new data elements (ie. they are not being collected during the same period, as this would result in the indicator having an incorrect/duplicated value).
In order to do this, create a new indicator and sum the previous data element(s) with the new data element(s). This will allow you to create various outputs that show both the historic and current data represented by the same variable within a single output. If you do not do this, you would have to select the 2 (or more) separate data elements that now represent this concept when performing analysis. This would also seem disjointed as they would be represented by different lines in a chart, different rows or columns in a table etc., with data only showing for the variables during the period in which collection was being performed.
While metadata quality can be somewhat subjective, there are a number of key principles that can be objectively assessed and should be universally followed throughout DHIS2 implementations. In order to assess metadata quality, a metadata assessment can be performed. In this context, we can define metadata assessment as the review of the quality of a specific implementations configuration. While this is wide-ranging in scope, our goal is to break down the assessment process into manageable pieces that can be reviewed, prioritized and fixed over time. Regular metadata assessment and ongoing upkeep is an important part of long-term DHIS2 configuration and maintenance. While configuration tasks can often be performed quickly through a number of different mechanisms, without proper co-ordination there can be a number of challenges that a DHIS2 systems configuration can face over time. Some examples of the effects of these configuration challenges include:
The purpose of this guide is to provide tools and procedures to identify problems with metadata. A separate guide on metadata maintenance is being developed that discusses configuration practices that can lead to metadata quality problems, and discusses how these can be avoided e.g. by avoiding to do configuration work in production systems and establishing SoPs for metadata modifications. Finally, a future section on Working with metadata will give guidance on how address metadata issues, such as removing objects that are no longer used.
Metadata maintenance and metadata assessment should be seen as related processes that feed into one another.
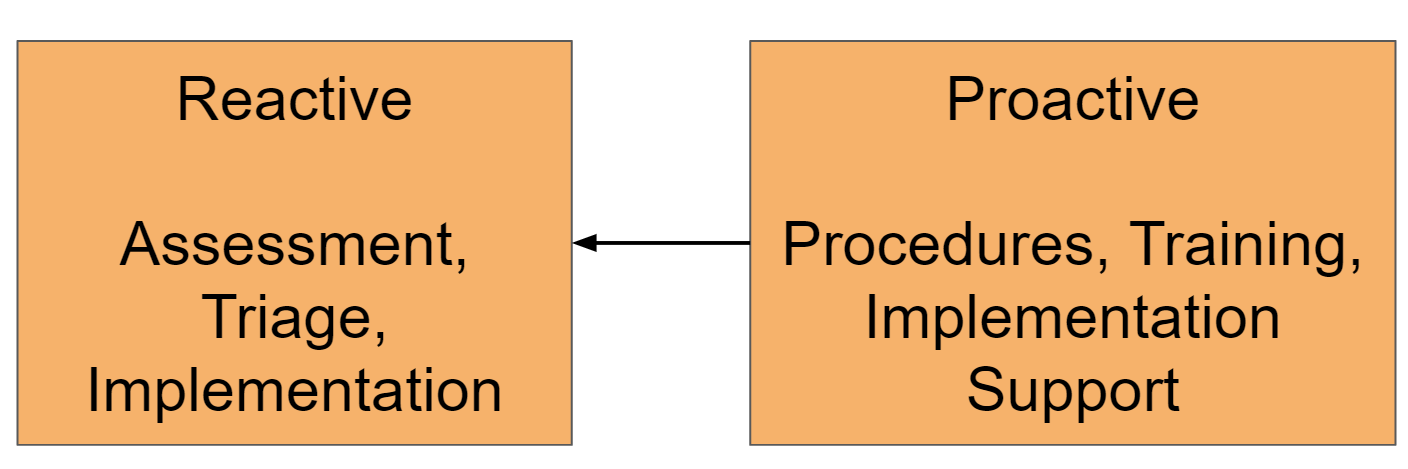
Reactive processes are about assessing metadata to identify potential challenges, and addressing these challenges. This can be a demanding process that needs to be properly planned, with time and resources dedicated to identify and resolve issues. While the planning and execution of a metadata assessment is discussed briefly below, the focus in this guide is on the more practical and technical aspects of assessing metadata and addressing common issues.
This guide focuses primarily on two approaches to assessing metadata:
Both of these approaches are described below.
In order to perform the assessment, you may want to start by getting buy-in from a wide variety of stakeholders. In doing so, it may be useful to document the extent of the issues discussed within this guide by generating summary statistics on the problems that have been identified. This can be very useful to present to a large audience and can be used to support buy-in by providing brief explanations of the issues that have been identified. Within the Metadata Assessment Reference Guide you will find tools that will support you to both create quick summary counts of problems that you find in your own implementation as well as tools that generate more detailed reports on each specific item that requires attention. We recommend that the assessment includes the following components:
Use of the metadata assessment tool and the built-in data integrity checks is an efficient way of identifying many metadata problems in DHIS2, some review processes can not be automated. This includes the review of:
Reviewing metadata to identify potential issues should always be done with a goal of addressing these issues. Fixes can sometimes be done immediately, but in many cases this is not possible. For example, it may be necessary to consult with different stakeholders to identify the appropriate data source or metadata definitions, or resolving the issues are technically complicated and require proper testing and review. It is therefore important to establish a mechanism for capturing the issues that are identified, so that they can be kept track of and a plan made to address them.
For a full breakdown on the principles behind good naming conventions, please view this resource. Where possible, you should consider implementing these in the system(s) you are reviewing.
To update the names of your metadata in bulk, consider using the DHIS2 metadata editor. This will allow you to edit all of your metadata in a google sheet and synchronize your information back to the server. You can view the full guide for the metadata editor here.
A manual review of indicator formula may be needed in order to determine if the indicator formula are correct. The review of indicator formula, while potentially a configuration issue, has the potential to affect data quality and data outputs if incorrect assumptions are being made about the formula. Examples of issues you will want to check when reviewing indicator formula include:
You can use the DHIS2 metadata editor to review some of the formulas if you are familiar with how this is set up, however a more traditional method of browsing indicators through the user interface can be done using the WHO metadata browser app.
Duplicate data sources arise when you have multiple variables within a DHIS2 system reporting on the same concept. There are typically 3 types of duplicated data sources that you may see in DHIS2:
This occurs when one or more data elements is providing a total that is duplicated by one or more other data elements on the same form. As an example, we can review the forms available in Figure 1.
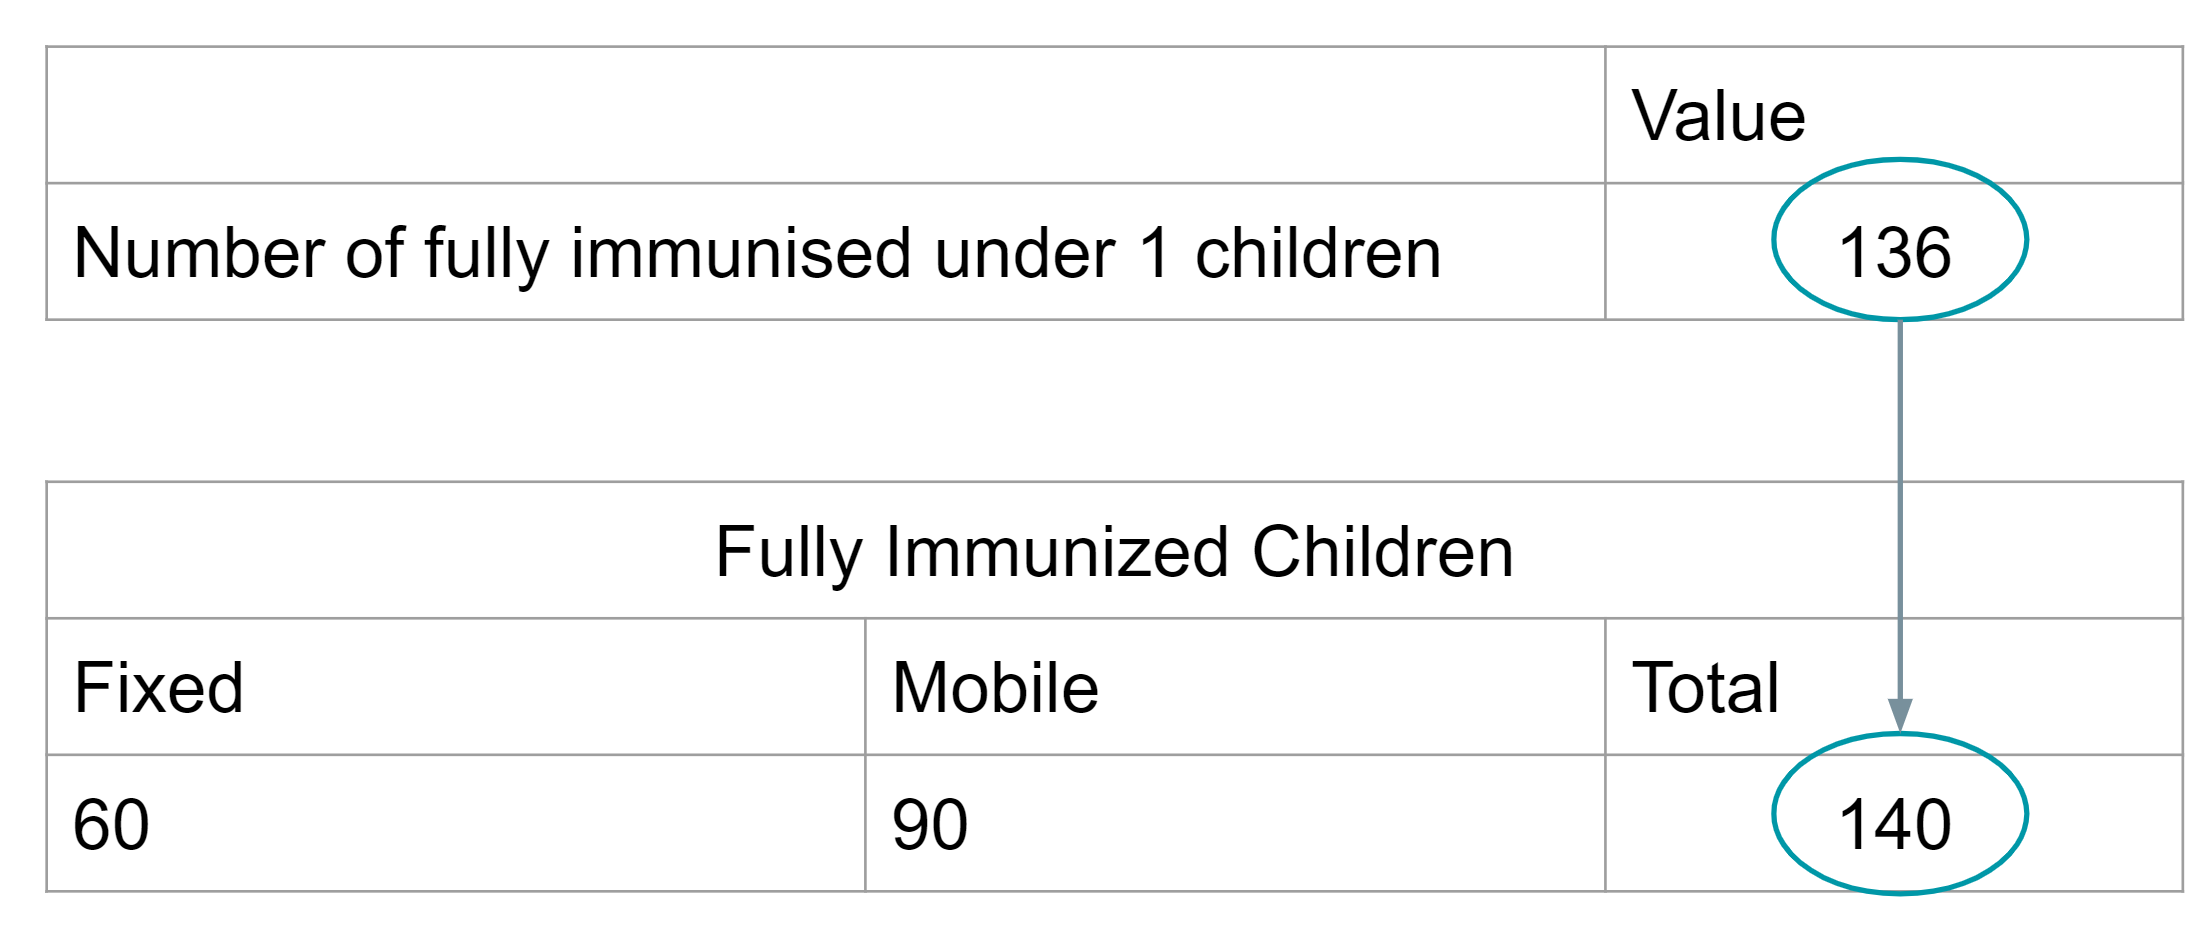
When this occurs, it is difficult to determine what is the correct value.
This occurs when you have two or more programs within an integrated system that are collecting the same information (Figure 2). In some cases programs can not agree on the value and this may need to be maintained as is. This will become problematic when trying to determine an agreed national value however as the values may be different between the different programs and this is not recommended to be maintained as is.
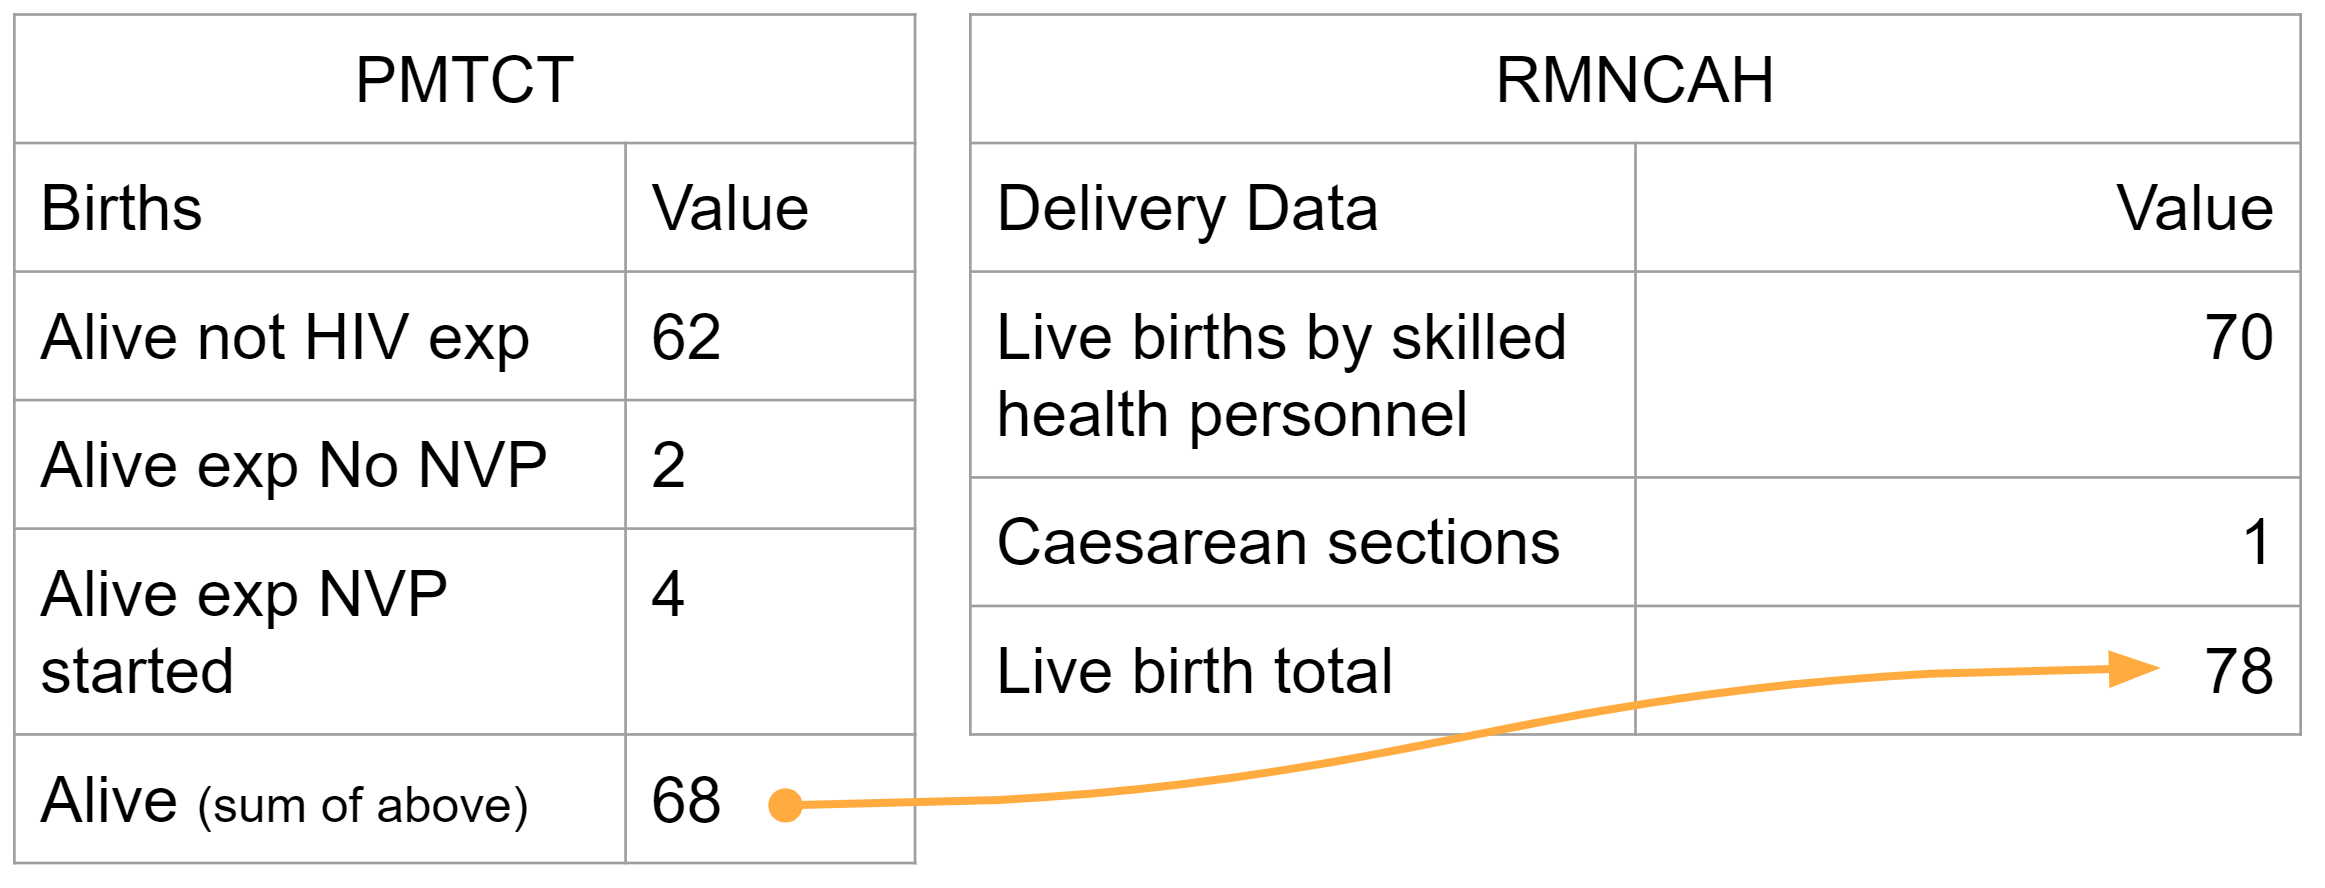
This occurs when the same information is being collected within the same program (Figure 3). This can be problematic as there should be agreement between values when possible (and this may not be the case when this issue is found)
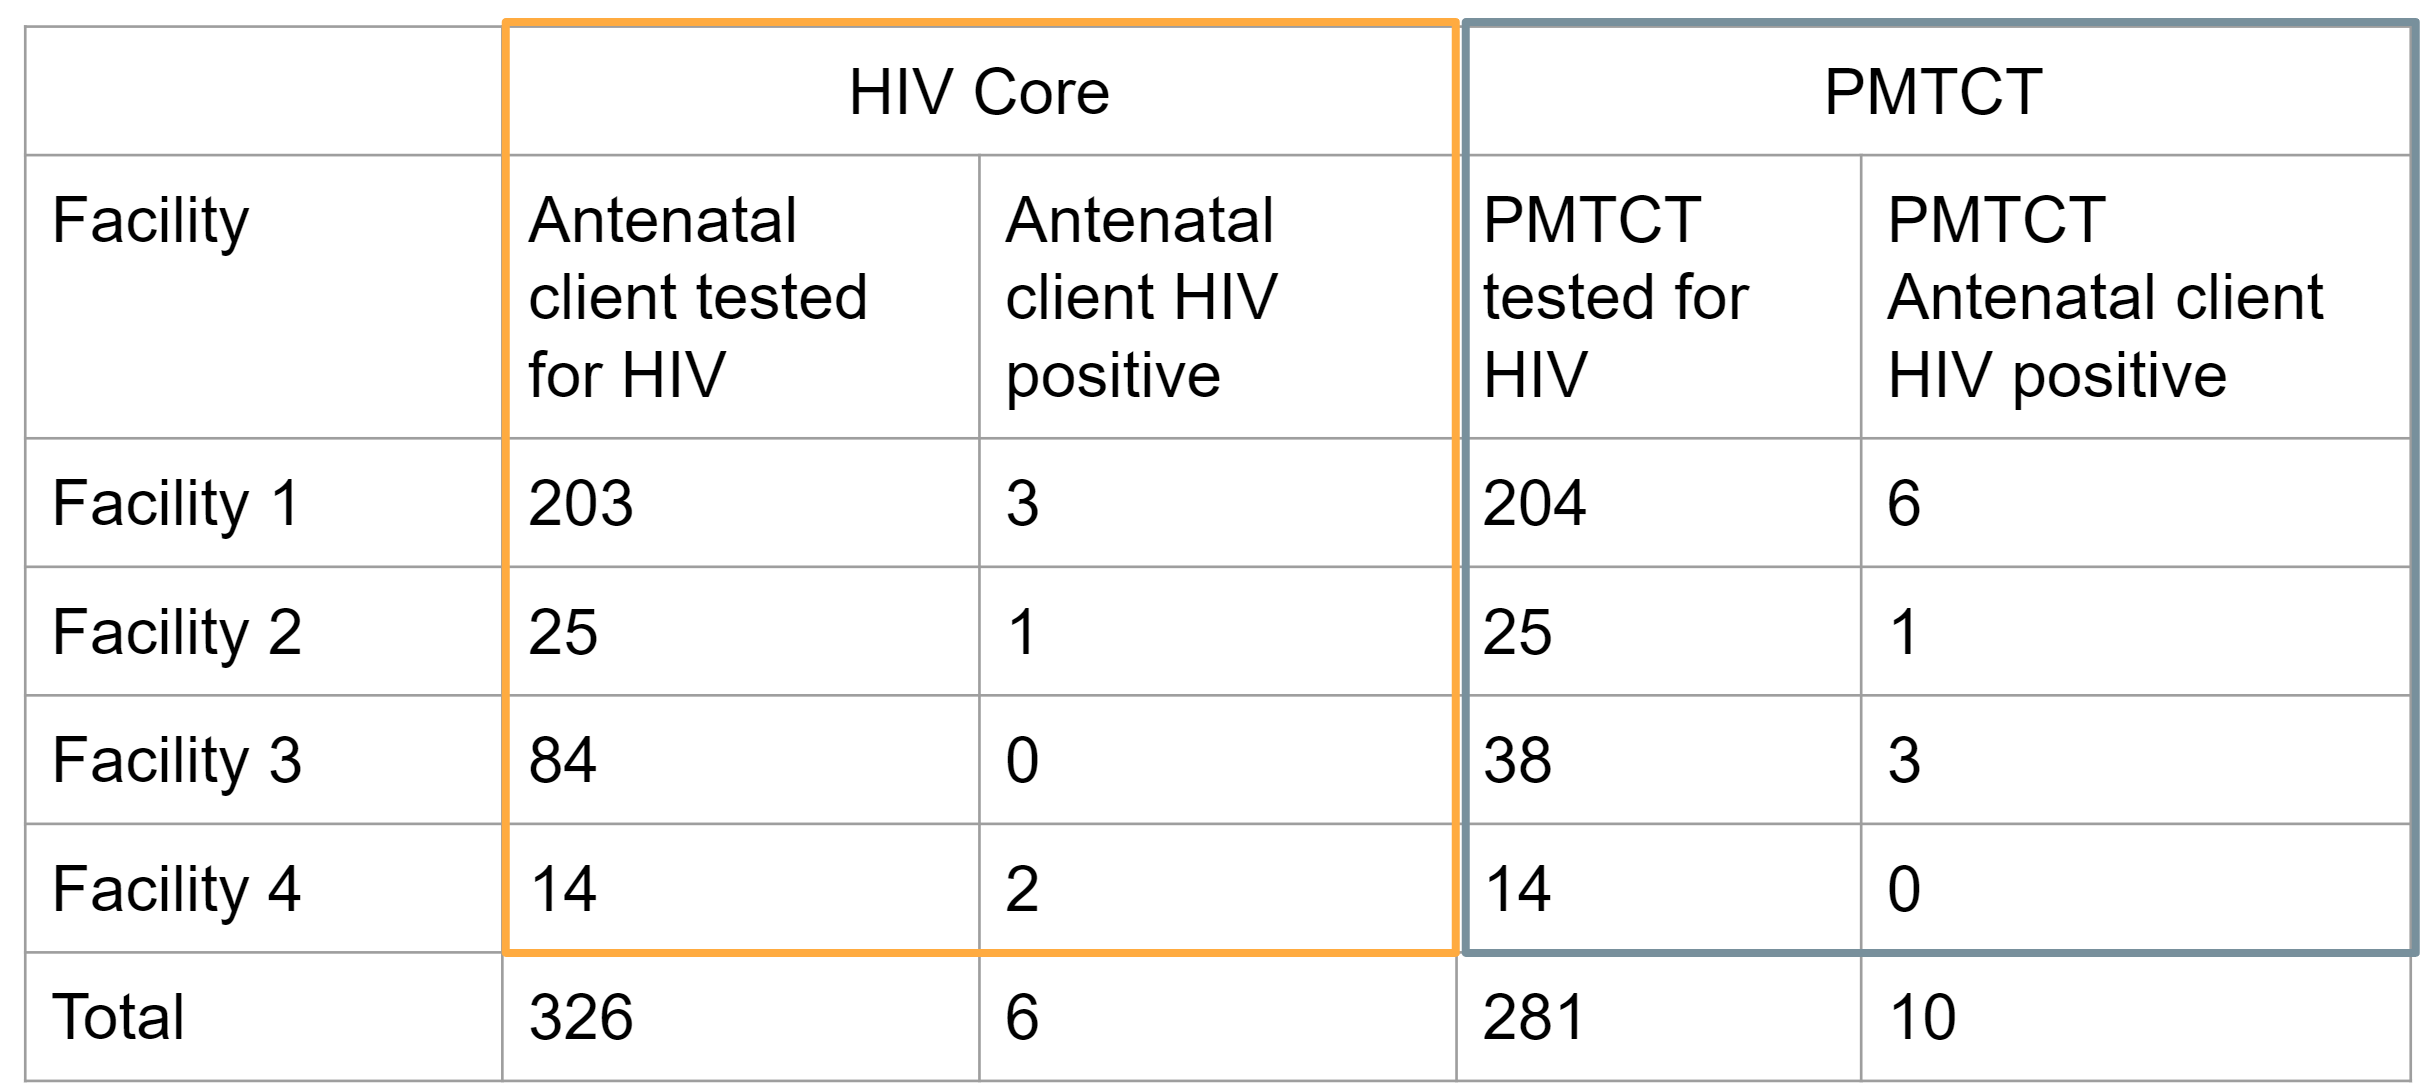
Similar to issues with defining denominators, this may need to be left for a more detailed data quality review. As these findings will often require form review/revision across various programs in order to rationalize these duplicate data sources, this issue will likely not be resolved through an immediate configuration change. It is important to identify these issues however and work with the programs to resolve them based on local procedures.
There are two considerations to make when you are reviewing dashboard items:
If it is the case where a dashboard item needs to show data for a fixed period or organisation unit, then there will be no need to apply any relativity to the item. If the item should be updated with new data routinely, or the users in which the dashboard is shared with do not have access to the fixed organisation units selected within the item, then these items should be reviewed and updated with correct relative period and organisation unit selections as appropriate.
Check if the programs and data sets are assigned only to organisation units that are expected to report on them. For datasets this can cause problems with reporting rate completeness (the number of expected reports may be higher then it should be) and potentially data being entered where it should not be; while in the case of programs you could have tracked entities and/or events registered in organisation units they should not be.
Check if the metadata and data sharing settings have been applied correctly to both programs and data sets. In particular, if there are users or groups of users that can not perform operations on the programs or data sets that they should be able to, then these sharing settings may need to be modified.
A more detailed breakdown on the application of sharing settings to programs and data sets can be found in both the documentation as well as through a number of videos on YouTube.
Category options can and should be re-used across multiple categories to represent the same concept (e.g. an age group). In addition to reducing the clutter and potential confusing of having multiple options for the same concept, this facilities data analysis since data elements using the same category option can be presented together with the same disaggregation in visualisation tools.
If duplicate category options are identified and these are included in categories that are part of category combinations already associated with data, you should not attempt to de-duplicate these. However, if one of the category options have not yet been used, this could be removed and the other options used.
The category options in a data element category should in general add up to a meaningful total, as discussed in the aggregate system design section. It is the total of the category that is displayed by default if looking at the value for a data element disaggregated by that data element. An example of this bad practice is to create a category for "Outpatients" with options "Cases" and "Deaths", which is applied to data elements for different diagnosis such as "Malaria". By default, a user looking at the "Malaria" data element will get the sum of "Malaria cases" and "Malaria deaths", which is a number that does not make sense.
There are certain cases where it may make sense to diverge from this general rule, in particular when the use of such a category can substantially reduce the number of data elements required. In these cases, the option to "Skip category total in reports" should be enabled for the category combination that category is part of.
While manual checks are necessary for a number of issues, a metadata assessment tool has also been developed to automate a number of data quality checks. This includes the possibility of getting the summary results (number of violations) of the built-in Data integrity checks. The metadata assessment tool is currently not integrated in DHIS2 itself, but is a standalone tool based on R. This section will discuss how to interpret and use the output of the assessment tool, whilst how to download, install and run the tool is described on the GitHub repository of the tool. A list with descriptions of the metadata checks included in the tool are described in the Annex A.
The metadata assessment tool is based primarily on DHIS2 SQL views: the tool imports a set of SQL views into the DHIS2 database being assessed (two for each data quality metric), and the accesses the outputs of those SQL views via the Web API and presents to the users. In addition, the tool presents certain outputs based directly on Web API queries (related to users), and can also show results of the built-in Data integrity checks.
Warning The tool should not be used directly in production databases. While the only change the tool does to a database is to import SQL views, certain checks can be long-running and resource-intensive and may affect users interacting with the system. A parameter is available to disable slow queries.
The report itself is organised into four sections.
The "Metadata Issues" summary table gives an overview of all the different metadata quality metrics, and allows sorting and filtering. This is useful to get a quick overview of the results (for example if there are any "critical" or "severe" issues), or if looking for specific issues (for example if there are any issues related to organisation units).

The "Users" section provides key metrics related to users in the system. In addition to basic information about the total number of users and the number of users logging within a certain period, it also includes information that may be the basis to changes in user management practices:
In addition, two graphs showing the distribution over time of when users last logged in, and the distribution of users in the organisation unit hierarchy may be useful to understand if user assignment and management is handled correctly.

The guidance section presents the same metrics as the summary table (and repeated in Annex A), but together with an explanation and recommended action. It is organised into sections by topic.
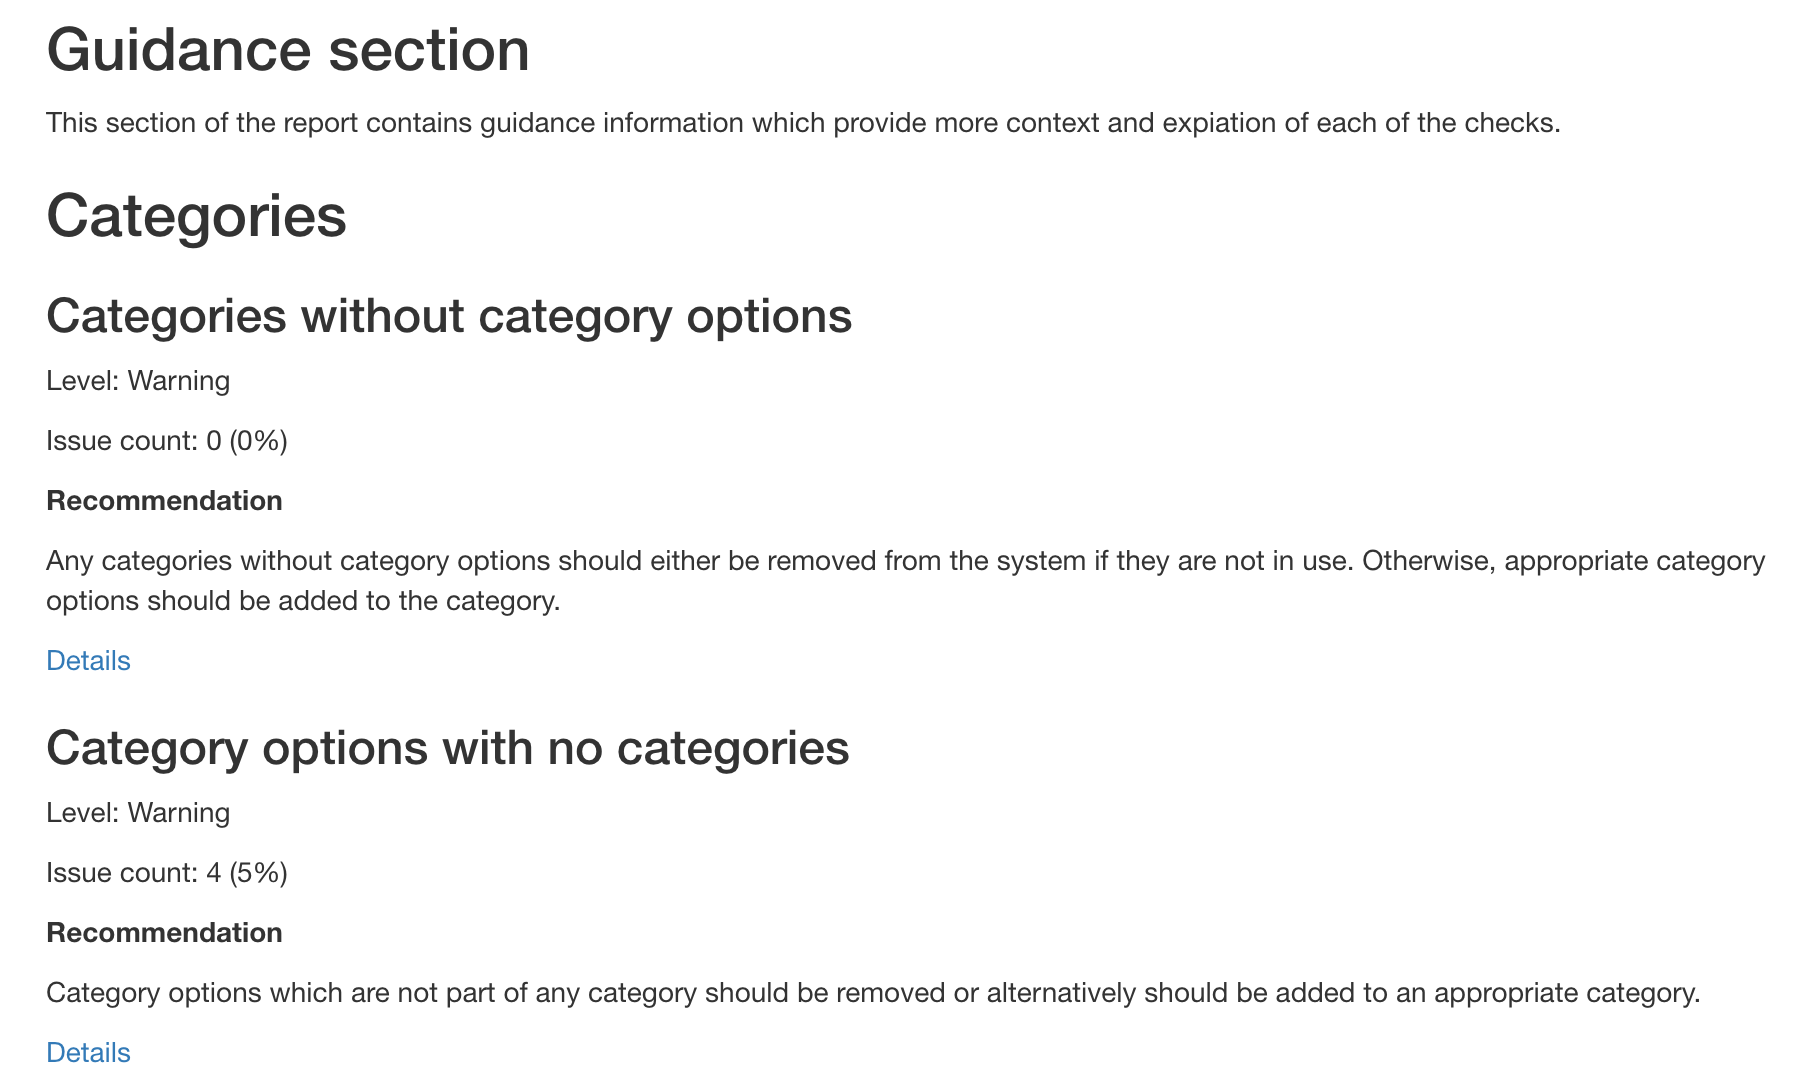
When interpreting the results of the report, it's important to keep in mind that not all the issues listed in the report are necessarily actual issues. The Severity of the different checks are important to keep in mind in this regards:
While the different data quality metrics each include a recommendation on how the particular issue should be address, it generally does not go into the detail, technical steps that should be taken to fix the issue. It is not possible to give clear guidance for all issues, and the issues vary from the very basic (such as grouping data elements) to the very complex (for example duplicate category option combinations within a category combination). In general, it is recommended to solve the issues through the DHIS2 UI or the Web API as far as possible, as this provides some validation of the changes being made. Only as a last resort should issues be corrected in the database correctly. All but the most basic changes (such as grouping data elements) should be tested thoroughly in a non-production system.
A separate section in the implementation guide is in development that will provide more examples and guidance on addressing common metadata issues, such as batch edits, deleting data elements with data etc.
Updated 14.02.2022.
Categories should always have at least a single category option.
Severity: Warning
Recommendation: Any categories without category options should either be removed from the system if they are not in use. Otherwise, appropriate category options should be added to the category.
There should only be a single 'default' category option combination in the system. Having multiple default category option combinations may lead to irregularities in both data entry as well as analytical outputs.
Severity: Critical
Recommendation: All references to the additional default category option combination should be replaced with the desired default category option combination.
All category options should belong to at least one category.
Severity: Warning
Recommendation: Category options which are not part of any category should be removed or alternatively should be added to an appropriate category.
Under certain circumstances, category option combinations may exist in the system, but not have any direct association with category options which are associated with the category combinations. This situation usually occurs when category options have been added to a category and then the category is added to a category combination. New category option combinations are created in the system at this point. If any of the category options are then removed in one of the underlying categories, a so-called disjoint category option combination may result. This is a category option combination which has no direct association with any category options in any of the categories.
Severity: Severe
Recommendation: The disjoint category option combinations should be removed from the system if possible. However, if any data is associated with the category option combination, a determination will need to be made in regards of how to deal with this data.
All category option combinations should have exactly the same number of category option associations as the number of categories in the category combination. If there are two categories in a category combination, then every category option combination should have exactly two category options.
Severity: Severe
Recommendation: Category option combinations which have an incorrect cardinality will be ignored by the DHIS2 analytics system and should be removed.
Nulla vitae feugiat blandit natoque placerat elementum pharetra senectus et aenean faucibus pellentesque. Quam, donec auctor in et mi penatibus penatibus. Mauris massa mauris sem vehicula eu hac fermentum odio mattis sed. Habitant convallis, pellentesque aenean, a nunc vitae non sapien eu suspendisse. Amet nisi sed quam hac.
Severity: Severe
Recommendation: Bibendum pellentesque nibh nisl vitae rutrum quis vestibulum feugiat porta et netus parturient mauris. Nec nascetur libero lacinia id vel mauris pulvinar at augue pharetra. Elementum urna eget mauris magnis proin. Risus sed sapien ante himenaeos. Hac vitae vestibulum vestibulum nulla vestibulum ut non consectetur vel lectus ultricies euismod. Suscipit sed sed orci.
All category combinations should be associated with one or more categories.
Severity: Warning
Recommendation: Category combinations without categories are not usable by DHIS2. They should either be removed or the correct cateogries should be added to the category combo.
All category option combinations should be associated with a category combo. In certain cases, when category combinations are deleted,the linkage between a category option combination and a category combination may become corrupted.
Severity: Warning
Recommendation: Check if any data is associated with the category combinations in question. Likely, the data should either be deleted or migrated to a valid category option combination. Any data which is associated with any of these category option combinations will not be available through either the data entry modules or any of the analytical apps.
Within each category combination, a unique set of category option combinations should exist. In certain circumstances, duplicate category option combinations may exist in the system. This usually results from changes to category combinations after they have been created, or direct manipulation of the various category tables in the database. This may result in certain data element/category option combinations not appearing or being unavailable in the data entry screens and/or analytics apps.
Severity: Severe
Recommendation: Duplicated category option combinations within a category combination will require you to merge category option combinations together. This will require direct manipulation of the database, and should always be conducted first in a testing environment. Only after you have thoroughly tested your procedure, and have confidence that it works, should you perform the procedure on your production environment. The DHIS2 implementation team has created a series of SQL functions to help you remove these duplicated COCs from your system.
Categories with the exact same category options should be considered to be merged. Categoriesw with the exact same category options may be easily confused by users in analysis.
Severity: Warning
Recommendation: If category combinations have already been created with duplicative categories, it is recommended that you do not take any action, but rather ensure that users understand that there may be two categories which are duplicative.
If one of the categories is not in use in any category combination, it should consider to be removed from the system.
Charts should be regularly viewed in the system. In many cases, users may create charts for temporary purposes and then never delete this. This can eventually lead to a lack of tidiness in the system. This can lead to charts being difficult to find in the visualization app.
Severity: Warning
Recommendation: Unused charts can be removed directly using the data visualization app by a user with sufficient authority. If charts are a part of any dashboard however, they will also need to be removed from the dashboard.
Total number of dashboards in the system. Severity: Info
Recommendation: DHIS2 should contain useful dashboards for users.
Dashboards that are not viewed by users can indicate limited data use, that the dashboards have not been designed with an intention of reuse (for example as part of a training exersice or one-off data analysis), or that the user owning the dashboard is not longer active.
Severity: Warning
Recommendation: If the dashboards are relevant and useful but not view, efforts should be made to increase data use (e.g. review sharing settings, communicate with users, plan training exercises etc). In other cases, users with superuser permission should be able to delete dashboards by looking up the name or in batches. You should also confirm that the dashboard is not in use by any push analysis before removing it from the system.
Dashboards that are not viewed by users can indicate limited data use, that the dashboards have not been designed with an intention of reuse (for example as part of a training exersice or one-off data analysis), or that the user owning the dashboard is not longer active.
Severity: Warning
Recommendation: If the dashboards are relevant and useful but not view, efforts should be made to increase data use (e.g. review sharing settings, communicate with users, plan training exercises etc). In other cases, users with superuser permission should be able to delete dashboards by looking up the name or in batches. You should also confirm that the dashboard is not in use by any push analysis before removing it from the system.
All dashboards should have content on them. Dashboards without any content do not serve any purpose, and can make it more difficult to find relevant dashboard with content.
Severity: Info
Recommendation: Dashboards without content that have not been modified in the last e.g. 14 days should be considered for deletion.
Overview of the number of aggregate data elements in the system. Severity: Info
Recommendation: DHIS2 should contain useful data elements for users.
All aggregatge data elements that are captured in DHIS2 should be used to produce some type of analysis output (charts, maps, tables). This can be by using them directly in an output, or by having them contribute to an indicator calculation that is used an output.
Severity: Warning
Recommendation: Data elements that are not routinely being reviewed in analysis, either directly or indirectly through indicators, should be reviewed to determine if they still need to be collected. If these are meant to be used in routine review, then associated outputs should be created using them. If these data elements are not going to be used for any type of information review, consideration should be made to either archive them or delete them.
Data elements which are part of an aggregate dataset should be assigned to at least one organisation unit.
Severity: Warning
Recommendation: If the dataset is active, then review the organisation unit assignments. If the dataset is not active, then the dataset and its associated data elements should be removed from the system.
All data elements should be in a data element group. This allows users to find the data elements more easily in analysis apps and also contributes to having more complete data element group sets. Maintenance operations can also be made more efficient by applying bulk settings (ex. sharing) to all data elements within a data element group.
Severity: Warning
Recommendation: Data elements that are not in a data element group should be added to a relevant data element group. If the data elements are not needed, they should be deleted.
"Abandoned" data elements. These are data elements that have not been modified in at least 100 days and do not have any data values associated with them. Often, these are the result of new or changed configurations that have been abandonded at some point.
Severity: Warning
Recommendation: Data elements that have no data associated with them and which there are no plans to start using for data collection should be deleted.
Data elements should generally always be associated with data values. If data elements exist in a data set which is active, but there are no data values associated with them, they may not be part of the data entry screens.
Severity: Warning
Recommendation: Consider removing data elements with no data values.
Data elements with no recent data values are likely to fall into one of two categories: 1) they have been used previously and hold useful/relevant data, 2) they have not been used in any meaningful way (e.g. data values stem from testing during configuration or a small pilot) and the data is not useful/relevant.
Severity: Warning
Recommendation: If the data elements hold useful historical data, they should be kept. Consider renaming the data elements and/or data sets to make it clear they are not used for data collection any more. Data elements which are not actively used and have no valueable data associated.
Overview of the number of tracker data elements in the system. Severity: Info
Recommendation: DHIS2 should contain useful data elements for users.
All data elements should be in a data element group. This allows users to find the data elements more easily in analysis apps and also contributes to having more complete data element group sets. Maintenance operations can also be made more efficient by applying bulk settings (ex. sharing) to all data elements within a data element group.
Severity: Warning
Recommendation: Data elements that are not in a data element group should be added to a relevant data element group. If the data elements are not needed, they should be deleted.
Total number of datasets in the system. Severity: Info
Recommendation: DHIS2 should contain datasets which are useful for data entry.
Datasets should generally be assigned to multiple organisation units if they are used, or be modified recently (e.g. last 100 days) if they are under development. Unused datasets represent unnecessary clutter in the database and may confuse users and administrators. The exception is data sets which are associated with historical data, for example reporting forms from previous years which are no longer used, and datasets that is designed to be used in only on organisation unit (e.g. at national level).
Severity: Warning
Recommendation: Datasets which are not activly used or in development should be removed from the system to decrease system clutter and metadata size. Before removing the data sets, verify that the data set is not associated with historical data and kept for that reason.
Data sets with no recent data values associated with them are likely to fall into one of two categories: 1) they have been used previously and hold useful/relevant data, 2) they have not been used in any meaningful way (e.g. data values stem from testing during configuration or a small pilot) and the data is not useful/relevant.
Severity: Warning
Recommendation: If the data elements hold useful historical data, they should be kept. Consider renaming the data elements and/or data sets to make it clear they are not used for data collection any more. Data elements which are not actively used and have no valueable data associated
Dataset sections are used to group certain related sections in a section data entry form. They can also be ordered. The order of the sections may become corrupted if sections are added or deleted.
Severity: Warning
Recommendation: It is possible to fix the sort order of data set sections by using the fixSortOrder SQL function which is available in the dhis2-utils Github repository (https://github.com/dhis2/dhis2-utils/tree/master/resources/sql). Using this script you can fix the sort order for each affected data set section.
Identifiable objects with names should not contain leading spaces.
Severity: Warning
Recommendation: These objects may be able to be corrected through the user interface of DHIS2. Alternatively, they can be corrected directly in the database using SQL. You can use the following SQL as a pattern to help you create the exact query which you need:
UPDATE chart as a  SET name = b.name_new from ( SELECT chartid,REGEXP_REPLACE(name,'^\s+','') as
name_new from chart where name ~ '^\s+') b where a.chartid = b.chartid;
Identifiable objects with names should not contain trailing spaces.
Severity: Warning
Recommendation: These objects may be able to be corrected through the user interface of DHIS2. Alternatively, they can be corrected directly in the database using SQL. You can use the following SQL as a pattern to help you create the exact query which you need:
UPDATE chart as a SET name = b.name_new from ( SELECT chartid,REGEXP_REPLACE(name,'\s+$','') as name_new from chart where name ~ '\s+$') b where a.chartid = b.chartid;
Identifiable objects with names should not contain leading spaces.
Severity: Warning
Recommendation: These objects may be able to be corrected through the user interface of DHIS2. Alternatively, they can be corrected directly in the database using SQL. You can use the following SQL as a pattern to help you create the exact query which you need:
UPDATE categorycombo as a  SET name = b.name_new from ( SELECT categorycomboid,REGEXP_REPLACE(name,'\s{2,}',' ') as
name_new from categorycombo where name ~ '\s{2,}') b where a.categorycomboid = b.categorycomboid;
Overview of the number of indicators in the system. Severity: Info
Recommendation: DHIS2 should contain useful indicators for users.
All indicators should be in an indicator group. This allows users to find the indicators more easily in analysis apps and also contributes to having more complete indicators group sets. Maintenance operations can also be made more efficient by applying bulk settings (ex. sharing, filtering) to all indicators within an indicator group.
Severity: Warning
Recommendation: Indicators that are not in a indicator group should be added to a relevant indicator group. If the indicators are not needed, they should be deleted.
All indicators that are calculated should be used to produce some type of analysis output (charts, maps, tables), alternatively to provide feedback during data entry by being part of a data set.
Severity: Warning
Recommendation: Indicators that are not routinely being reviewed in analysis, either in an output or data set, should be reviewed to determine if they still need to be calculated. If these are meant to be used for routine review, then associated outputs should be created using them. If these indicators are not going to be used for any type of information review, consideration should be made to either archive them or delete them.
Indicators should be used to produce some type of analysis output (charts, maps, tables). Note: indicators used in datasets to provide feedback during data entry are not counted as being used in analytical objects.
Severity: Warning
Recommendation: Indicators that are not routinely being reviewed in analysis should be reviewed to determine if they are useful and needed. If these are meant to be used for routine review, then associated outputs should be created using them. If these indicators are not going to be used for any type of information review, and are not used in data sets for feedback during data entry, consideration should be made to either delete them.
Option sets should be used for some purpose either with attributes, data elements, or comments.
Severity: Warning
Recommendation: Consider deleting unused option sets, or alternatively, ensure that they have been properly assigned.
All option sets should generally include at least two items. Empty option sets serve no purpose.
Severity: Warning
Recommendation: Options should either be added to the option set, or the option set should be deleted.
Option sets contain options which can be ordered. The sort_order property should always start with 1 and have a sequential sequence. If there are three options in the option set, then the sort order should be 1,2,3. In certain circumstances, options may be deleted from an option set, and the sort order may become corrupted. This may lead to a situation where it becomes impossible to update the option set from the maintenance app, and may lead to problems when attempting to using the option set in the data entry app.
Severity: Severe
Recommendation: If it is possible to open the option set in the maintenance app, you can resort the option set, which should correct the problem. Another possible solution is to directly update the sort_order property of in the optionset table in the database, ensuring that a valid sequence is present for all options in the option set.
Any organisation unit groups which have been marked as compulsory should contain all organization units in the system. If certain organization units are omitted from the groups in the group set, this may cause irregularities in analytical outputs, such as data being omitted.
Severity: Severe
Recommendation: Add all organization units to exactly one group within a compulsory organization unit group.
If a closing date has been defined for an organisation unit, it should always be after the opening date (if one has been defined).
Severity: Severe
Recommendation: Alter either the opening or closing date of all affected organisation units so that the closing date is after the opening date.
Trailing spaces in organisation units are superfluous.
Severity: Warning
Recommendation: If the number of affected organisation units is small, the easiest remedy is to correct them directly from the user interface. Another possible option would be to replace all of the multiple spaces using SQL.
Facilities are often represented as points in the DHIS2 hierarchy. Their parent organisation units geometry should contain all facilities which have been associated with them.
Severity: Warning
Recommendation: Often boundary files are simplified when they are uploaded into DHIS2. This process may result in facilities which are located close to the border of a given district to fall outside of the district when the boundary is simplified. This is considered to be more of a cosmetic problem for most DHIS2 installations, but could become an issue if any geospatial analysis is attempted using the boundaries and point coordinates.
In cases where the facility falls outside of its parent's boundary you should confirm that the coordinates are correct. If the location is close to the boundary, you may want to reconsider how the boundary files have been simplified. Otherwise, if the location of the facility is completely incorrect, it should be rectified.
A common problem when importing coordinates is the inclusion of coordinates situated around the point of Null Island. This is the point on the earths surface where the Prime Meridian and Equator intersect with a latitude of 0 and a longitude of zero. The point also happens to be situated currently in the middle of the ocean. This query identifies any points located within 100 km of the point having latitude and longitude equal to zero.
Severity: Severe
Recommendation: Update the coordinates of the affected organization unit to the correct location.
Names of organisation units should not contain multiple spaces. They are superfluous and may complicate the location of organisation units when they are searched.
Severity: Warning
Recommendation: If the number of affected organisation units is small, the easiest remedy is to correct them directly from the user interface. Another possible option would be to replace all of the multiple spaces using SQL.
DHIS2 uses the PostGIS database extenstion to manage the geographical information associated with organsiation units. There are various reasons why geometries may be considered to be invalid including self-inclusions, self-intersections, and sliver polygons. Please see the PostGIS documentation for a more in-depth discussion on this topic.
Severity: Critical
Recommendation: Update the geometry of the affected organisation units to a valid geometry. It may be possible to use the PostGIS function ST_MakeValid to automatically fix the problem. However, in other cases the geometry may need to be edited in a GIS tool, and then updated again in DHIS2.
Every DHIS2 system should have a single root organisation unit. This means a single organisation unit from which all other branches of the hierarchy are descendants.
Severity: Critical
Recommendation: Once you have decided which organisation unit should be the real root of the organisation unit hierarchy, you should update the parent organisation unit. This can be done by using the DHIS2 API or my updating the value directly in the organisationunit table.
Ideally, all organisation units contained in the DHIS2 hierarchy should have a valid set of coordinates. Usually for all organisation units above the facility level, these coordinates should be a polygon which provides the boundary of the organisation unit. For facilities, these are usually represented as point coordinates.
There can obviously be exceptions to this rule. Mobile health facilities may not have a fixed location. Community health workers or wards below the facility level may also not have a defined or definable coordinate.
This check is intended to allow you to review all organisation units which do not have any coordinates and make a determination as to whether they should be updated.
Severity: Warning
Recommendation: Where appropriate, update the geometry of each organisation unit with a valid geometry. You may need to contact the appropriate local government office to obtain a copy of district boundaries, commonly referred to as "shape files". Another possibility is to use freely available boundary files from GADM (https://gadm.org)
If facilities are missing coordinates, it may be possible to obtain these from the facility staff using their smart phone to get the coordinates. Images from Google Maps can also often be used to estimate the position of a facility, assuming that you have good enough resolution and local knowledge of where it is located.
Orphaned organisation units are those which have neither parents nor any children. This means that they have no relationship to the main organisation unit hierarchy. These may be created by faulty metadata imports or direct manipulation of the database.
Severity: Critical
Recommendation: The orphaned organisation units should be assigned a parent or removed from the system. It is recommended to use the DHIS2 API for this task if possible. If this is not possible, then they may need to be removed through direct SQL on the DHIS2 database.
Organisation units should belong to exactly one group within each organisation unit group set of which they are a member. If the organisation unit belongs to multiple groups, this will lead to unpredictable results in analysis.
Severity: Severe
Recommendation: Using the maintenance app, assign the organisation units in the details list to exactly one group within each group set membership.
Different periods should not have exactly the same start and end date.
Severity: Critical
Recommendation: All references to the duplicate periods should be removed from the system and reassigned. It is recommended to use the period with the lower periodid.
Periods in DHIS2 are automatically generated by the system. As new data is entered into the system, new periods are automatically created. In some cases, periods may mistakenly be created when data is sent to DHIS2 for periods which are in the far future. Different data entry clients may not properly validate for periods which are in the future, and thus any periods in the future should be reviewed. In some cases, data may be valid for future dates, e.g. targets which are set for the next fiscal year.
Severity: Warning
Recommendation: If any periods exist in the system in the future, you should review the raw data either directly in the datavalue table, or alternatively though the pivot tables to ensure that this data is correct.
In many cases, clients may mean to transmit data for January 2021, but due to data entry errors, January 2031 is selected. Thus, any data in the far future should be investigated to ensure it does not result from data entry errors.
Periods in DHIS2 are automatically generated by the system. As new data is entered into the system, new periods are automatically created. In some cases, periods may mistakenly be created when data is sent to DHIS2 for periods which are in the distant past. Different data entry clients may not properly validate for periods which are in the distant past, and thus these periods should be triaged to ensure that data has not been entered against them by mistake.
Severity: Warning
Recommendation: If any periods exist in the system in the distant past, you should review the raw data either directly in the datavalue table, or alternatively though the pivot tables to ensure that this data is correct.
In many cases, clients may mean to transmit data for January 2021, but due to data entry errors, January 2031 is selected. Thus, any data in the far future should be investigated to ensure it does not result from data entry errors.
All program rules should have an action.
Severity: Severe
Recommendation: Using the DHIS2 user interface, assign an action to each of the program rules which is missing one. Alternatively, if the program rule is not in use, then consider removing it.
All program rules should be assigned a priority.
Severity: Severe
Recommendation: Using the DHIS2 user interface, assign a priority to each of the program rules which is missing one.
Program rule actions of type "Send message" or "Schedule message" should have an associated message template.
Severity: Severe
Recommendation: Using the DHIS2 user interface, assign a message template to each of the program rule actions which send or schedule messages but which does not have an association with a message template.
The total number of users in the system.
Severity: Info
Recommendation: Information only.
All users should log in routinely, either to enter data, or to view analyses. This metric measures the number of users who are enabled, but have not logged in during the past 30 days.
Severity: Warning
Recommendation: Review if these users should be active, otherwise consider disabling the accounts.
Only users who routinely access the system should have active user accounts. Users who have not logged in the last year may not use or need access to the system, they may have left their position and should, or the account may be the result of an invitation to register an account that has not been used.
Severity: Warning
Recommendation: User accounts that are not associated with real, active users should as a minimum be disabled, alternatively deleted.
Validation rules are composed of a left and right side expression. In certain systems the missing value strategy may not be defined. This may lead to an exception during validation rule analysis. The affected validation rules should be corrected to with an appropriate missing value strategy.
Severity: Severe
Recommendation: Using the results of the the details SQL view, identify the affected validation rules and which side of the rule the missing value strategy has not been specified. Using the mainteance app, make the appropriate corrections and save the rule.
Multiple users can access DHIS2 simultaneously and each user can have different authorities. You can fine-tune these authorities so that certain users can only enter data, while others can only generate reports.
You can create as many users, user roles and user groups as you need.
You can assign specific authorities to user groups or individual users via user roles.
You can create multiple user roles each with their own authorities.
You can assign user roles to users to grant the users the corresponding authorities.
You can assign each user to organisation units. Then the user can enter data for the assigned organisation units.
| Term | Definition | Example |
|---|---|---|
| Authority | A permission to perform one or several specific tasks | Create a new data element Update an organisation unit View a report |
| User | A person's DHIS2 user account | admin traore guest |
| User role | A group of authorities | Data entry clerk System administrator Antenatal care program access |
| User group | A group of users | Kenya staff Feedback message recipients HIV program coordinators |
You manager users, user roles and user groups in the Users app.
| Object type | Available functions |
|---|---|
| User | Create, edit, invite, clone, disable, display by organisation unit, delete and show details |
| User role | Create, edit, share, delete and show details |
| User group | Create, edit, join, leave, share, delete and show details |
Each user in DHIS2 must have a user account which is identified by a user name. You should register a first and last name for each user as well as contact information, for example an email address and a phone number.
It is important that you register the correct contact information. DHIS2 uses this information to contact users directly, for example sending emails to notify users about important events. You can also use the contact information to share for example dashboards and pivot tables.
A user in DHIS2 is associated with an organisation unit. You should assign the organisation unit where the user works.
When you create a user account for a district record officer, you should assign the district where he/she works as the organisation unit.
The assigned organisation unit affects how the user can use DHIS2:
In the Data Entry app, a user can only enter data for the organisation unit she is associated with and the organisation units below that in the hierarchy. For instance, a district records officer will be able to register data for her district and the facilities below that district only.
In the Users app, a user can only create new users for the organisation unit she is associated with in addition to the organisation units below that in the hierarchy.
In the Reports app, a user can only view reports for her organisation unit and those below. (This is something we consider to open up to allow for comparison reports.)
An important part of user management is to control which users are allowed to create new users with which authorities. In DHIS2, you can control which users are allowed to perform this task. The key principle is that a user can only grant authorities and access to data sets that the user itself has access to. The number of users at national, province and district level are often relatively few and can be created and managed by the system administrators. If a large proportion of the facilities are entering data directly into the system, the number of users might become unwieldy. It is recommended to delegate and decentralize this task to the district officers, it will make the process more efficient and support the facility users better.
A user role in DHIS2 is a group of authorities. An authority means the permission to perform one or more specific tasks.
A user role can contain authorities to create a new data element, update an organisation unit or view a report.
A user can have multiple user roles. If so, the user's authorities will be the sum of all authorities and data sets in the user roles. This means that you can mix and match user roles for special purposes instead of only creating new ones.
A user role is associated with a collection of data sets. This affects the Data Entry app: a user can only enter data for the data sets registered for his/her user role. This can be useful when, for example, you want to allow officers from health programs to enter data only for their relevant data entry forms.
Recommendations:
Create one user role for each position within the organisation.
Create the user roles in parallel with defining which user is doing which tasks in the system.
Only give the user roles the exact authorities they need to perform their job, not more. Only those who are supposed to perform a task should have the authorities to perform it.
A user group is a group of users. You use user groups when you set up sharing of objects or notifications, for example push reports or program notifications.
See also:
Define the positions you need for your project and identify which tasks the different positions will perform.
Create roughly one user role for each position.
Create users.
Assign user roles to the users.
Assign the users to organisation units.
(Optional) Group users in user groups.
Share datasets with users or user-groups via the Sharing Dialog in Data set management section of the Maintenance app
Tip
For users to be able to enter data, you must add them to an organisational unit level and share a dataset with them.
In a health system, users are logically grouped with respect to the task they perform and the position they occupy.
Define which users should have the role as system administrators. They are often part of the national HIS division and should have full authority in the system.
Create roughly one user role for each position.
Examples of common positions are:
| Position | Typical tasks | Recommended authorities | Comment |
|---|---|---|---|
| System administrators | Set up the basic structure (metadata) of the system. | Add, update and delete the core elements of the system, for example data elements, indicators and data sets. | Only system administrators should modify metadata. If you allow users outside the system administrators team to modify the metadata, it might lead to problems with coordination. Updates to the system should only be performed by the administrators of the system. |
| National health managers Province health managers | Monitor and analyse data | Access to the reports module, the Maps, Data Quality apps and the dashboard. | Don't need access to enter data, modify data elements or data sets. |
| National health information system division officers (HISO) District health records and information officers (DHRIO) Facility health records and information officers (HRIO) | Enter data that comes from facilities which are not able to do so directly Monitor, evaluate and analyse data | Access to all the analysis and validation apps Access to the Data Entry app. | - |
| Data entry clerks | - | - | - |
The de facto standard way of DHIS 2 deployment has become online meaning that a single instance of the application is set up on a server connected to the Internet and all users connect to the application using a web browser over internet. This was made possible possible thanks to the steady increase of internet availability (mostly mobile internet), the offerings of readily available and cheap cloud-computing resources combined with the fact that DHIS 2 does not request a significant bandwidth. These developments make it possible to access on-line servers in even the most rural areas using mobile Internet modems (also referred to as dongles).
This on-line deployment style has huge positive implications for the implementation process and application maintenance compared to the traditional off-line standalone style:
Hardware: Hardware requirements on the end-user side are limited to a reasonably modern computer/laptop and Internet connectivity through a fixed line or a mobile modem. There is no need for a specialized server for each user, any Internet enabled computer will be sufficient. A server will be required for on-line deployments, but since there is only one (or several) servers which need to be procured and maintained, this is significantly simpler (and cheaper) than maintaining many separate servers is disparate locations. Given that cloud-computing resources continue to steadily decrease in price while increasing in computational power, setting up a powerful server in the cloud is far cheaper than procuring hardware.
Software platform: The end users only need a web browser to connect to the on-line server. All popular operating systems today are shipped with a web browser and there is no special requirement on what type or version. This means that if severe problems such as virus infections or software corruption occur one can always resort to re-formatting and installing the computer operating system or obtain a new computer/laptop. The user can continue with data entry where it was left and no data will be lost.
Software application: The central server deployment style means that the application can be upgraded and maintained in a centralized fashion. When new versions of the applications are released with new features and bug-fixes it can be deployed to the single on-line server. All changes will then be reflected on the client side the next time end users connect over the Internet. This obviously has a huge positive impact for the process of improving the system as new features can be distributed to users immediately, all users will be accessing the same application version, and bugs and issues can be sorted out and deployed on-the-fly.
Database maintenance: Similar to the previous point, changes to the meta-data can be done on the on-line server in a centralized fashion and will automatically propagate to all clients next time they connect to the server. This effectively removes the vast issues related to maintaining an upgraded and standardized meta-data set related to the traditional off-line deployment style. It is extremely convenient for instance during the initial database development phase and during the annual database revision processes as end users will be accessing a consistent and standardized database even when changes occur frequently.
Although a DHIS 2 implementation can be labeled as online, it is worth noting that such deployment may not purely online and may some local variation depending local constraints. For example, while most users in countries enjoy easy access to their national DHIS 2 instance using their mobile internet or better connectivity means, some unfortunately still struggle to access the system either for data entry or analysis in places where Internet connectivity is volatile or missing in long periods of time. And for these struggling users, alternatives ways to interact with the system need to be found.
This guideline aims at providing advice on how mitigate the effect of lack reliable internet in challenging settings.
In this section, we will examine possible challenging cases and describe possible ways to address them or to minimize their effects on users and the entire system on a short term. Obviously, the possible solutions proposed in this guidelines should be adapted in each context by taking into account many other parameters such as security, local practices and rules etc. The thinking in this guideline is not to prescribe bullet proof solutions that can work everywhere but propose ways of addressing connectivity issues in some places in the country.
We identify three (3) main scenarios:
We recognize that these scenarios are very simplistic because in practice a health facility can have for instance one small weekly form for disease surveillance, one big form for monthly progress report and a middle sized form for a health program. This makes the number of possible scenarios for a given setting greater than what is spelled out here. It will be therefore for up to each implementation team to discuss with the stakeholders to make simple choices that address all of the scenarios in a given setting. In most cases about 80 to 95% of districts (or health facilities if data entry is done at this level) will have the same configuration regarding internet availability and only the the remain 5 to 20% will need alternative ways to get their data in DHIS 2.
By limited internet availability, we mean case where:
And by data entry form small we mean data entry form having less than one hundred fields.
So if internet connectivity is limited and data entry forms are small, there are two possibilities to address the connectivity problem: Android data capture app and web data entry offline capability.
The Data Capture for DHIS 2 app allows users to enter data into a DHIS 2 server with an Android device. The app downloads instances of forms which are required to enter data from the server, and stores them on the device. This means that users can enter data offline for facilities they are assigned to and then upload it to the DHIS 2 server when they have network coverage.
To do this, the users will be request to go to the Google Play from their Android device and type DHIS 2 data capture and get the following screen.
Then install the app called Data Capture for DHIS 2.

Once the app is installed and launched, the user will be requested to provide the url of their national DHIS 2, the username and password and tap LOG IN.
|  |
After a successful log in, the app will download automatically the forms and organization units the user is assigned to and store them locally for data entry. From here, any subsequent use of the app for data entry will not require internet connection as instances of forms are already stored locally. Internet connection will be needed only to sync data with the server. This can be done when internet is available locally.
| 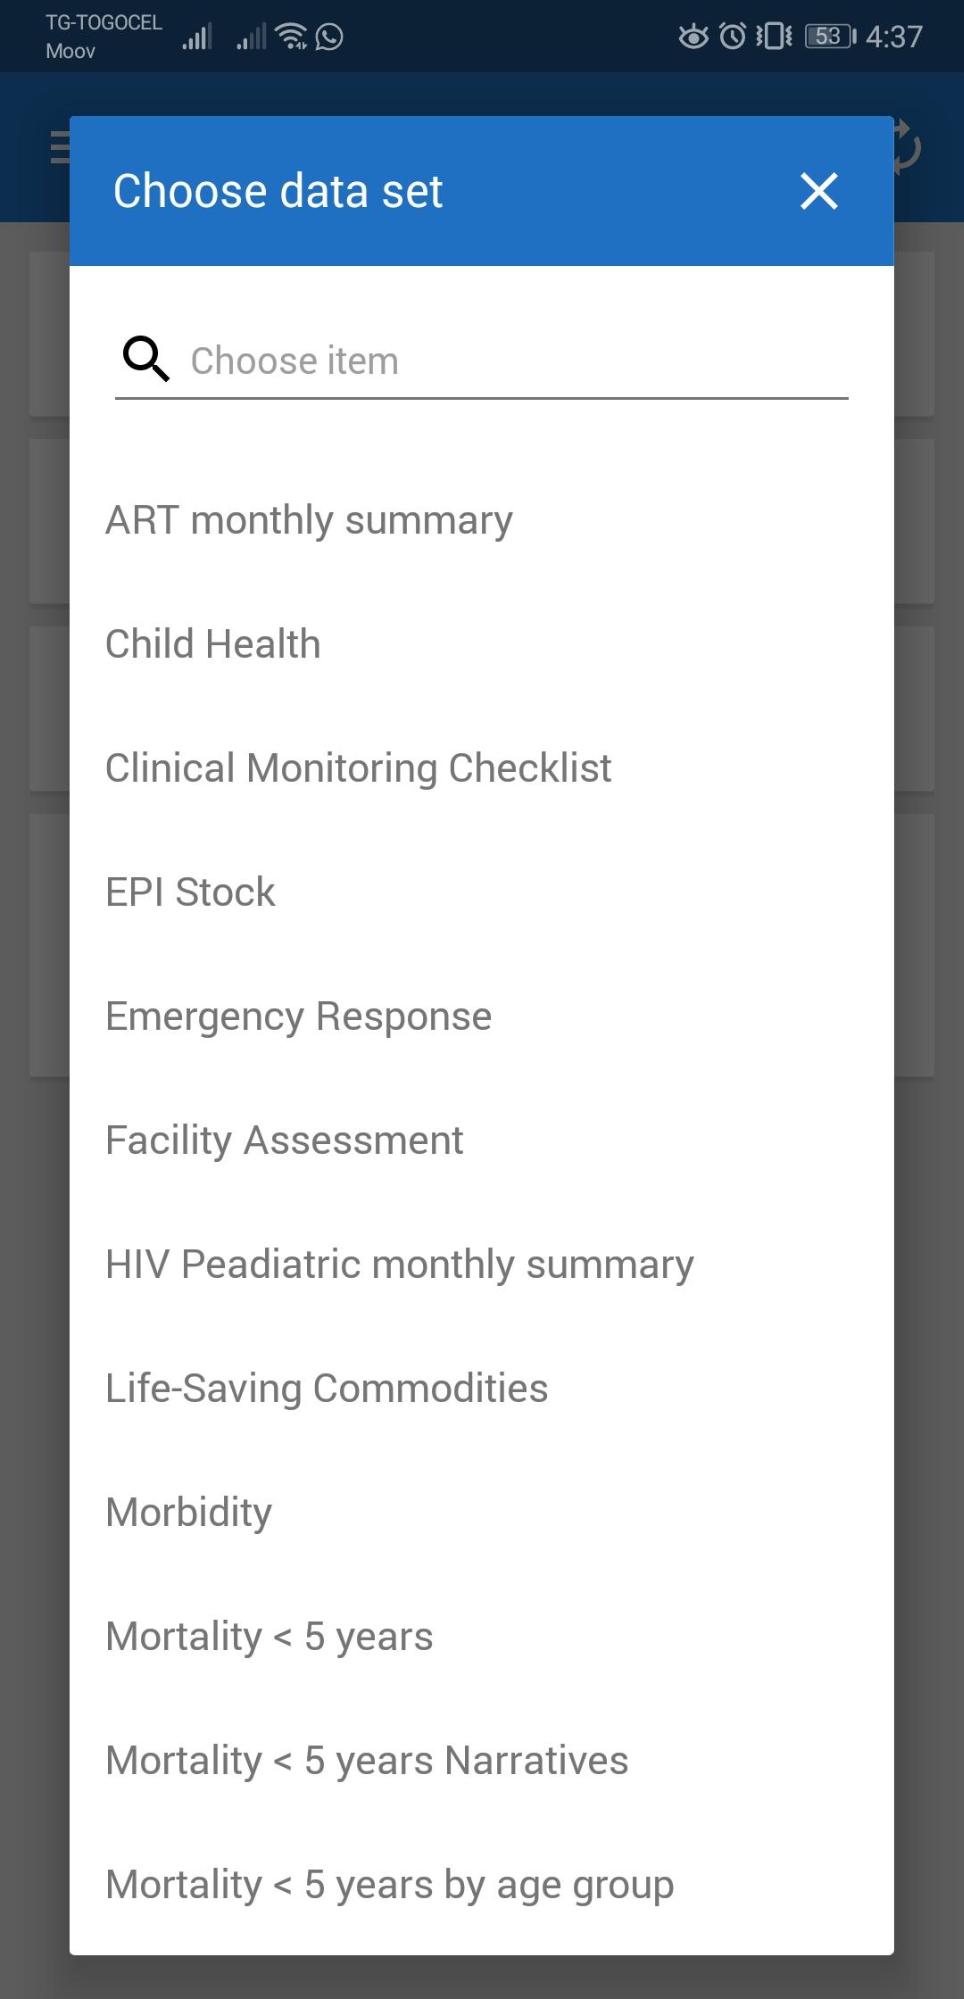 | 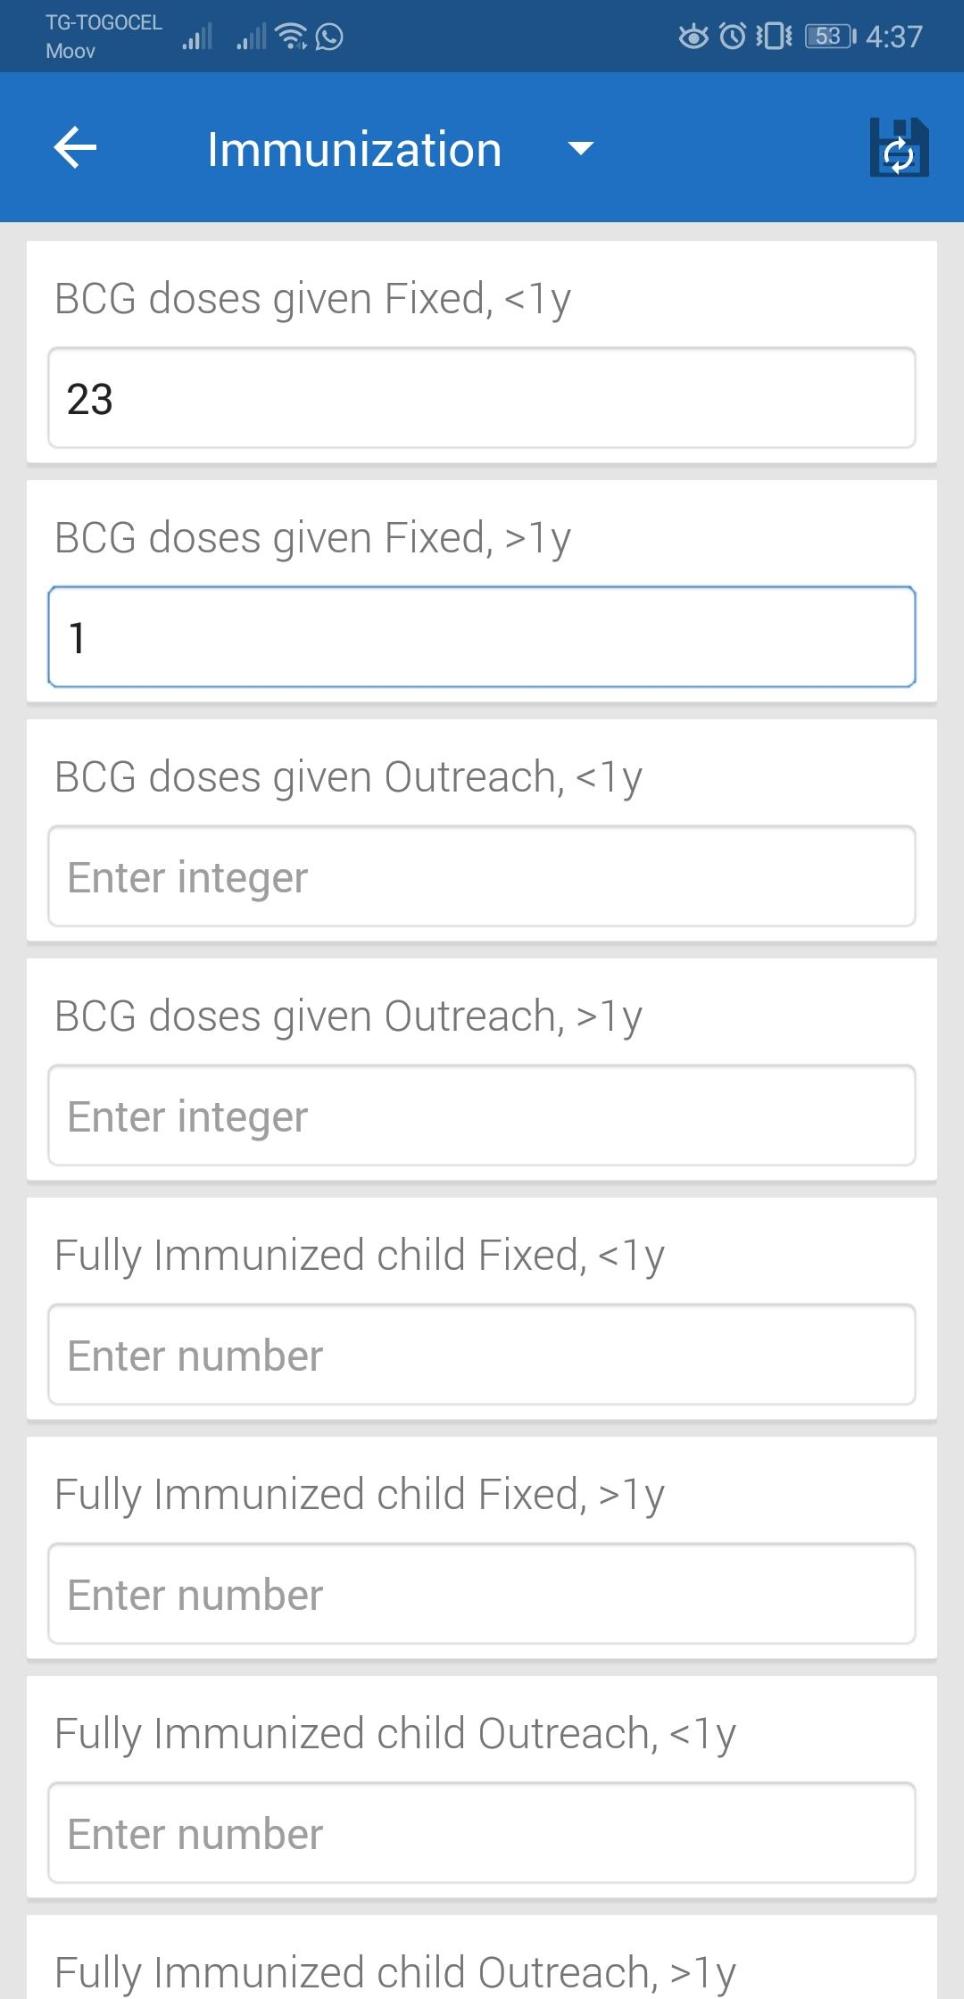 |
On the system administration side, organizing the data entry form into sections in DHIS 2 will make data entry experience more fluid and enjoyable.
As for the synchronization, when internet connectivity is not available when needed, the user take the mobile device to the district – during the district meeting – or to the nearest area where internet is available.
The web data entry module is the module inside DHIS 2 allowing for data entry using the we browser. The is in DHIS 2 the regular way of data entry online. However it does have also an “offline” capability that support the continuation of data entry even when the internet is interrupted. This means that is the user want to do data entry at the end of the month for instant, he has to first connect to internet, log in to DHIS 2 and open the data entry forms for at least one of the facilities he is assigned to. From this step, he can disconnect his internet and continue data entry for all his facilities and for the periods he wants as long as the data entry web page window is not closed in the web browser. After finishing the data entry, he can close the browser and event shutdown his computer. The data entered will be stored locally in the cache of the browser and the next time the user will get online and log in DHIS 2 he will be asked to click on a button to upload it.
For this case, it is possible to use either android data entry app or the semi-offline web based feature in DHIS 2 or both depending on the size of data entry forms. However, clearing the cache of the browser will result in the lost of the data stored locally. Therefore, it is recommended to not clear the cache without making sure that data locally stored is synced.
When the user is logged in and internet is cut (deliberately or not)

When internet is back and the user log in DHIS 2

When internet but the availability is limited but the data entry form contains several hundreds of fields, it limits possible solutions. In this case it is not advisable to use the android capture for two reasons:
Thus the only option available is to use the web data entry module offline capability described above or move to the nearest place where internet is available when the user cannot afford to wait the next time internet will be available in his area.
In this case there are three options:
Most governments and other organisations deploying DHIS2 use both the aggregate and individual-level (tracker) functionality. In DHIS2, these are represented by different data models, and both the data collection and analytics apps and APIs are different. However, there are many use cases where bringing the two types of data together is required or useful, and this guide discusses different approaches to achieve this. Some examples of such use cases include:
There are several ways in which this can be achieved, suitable for different purposes and with different advantages and disadvantages. The main approaches supported by core DHIS2 functionality are:
- Combining tracker & aggregate data side-by-side in analytics/dashboards. This is an approach that is easy to implement, but it assumes >that the aggregate and tracker data is available in the same DHIS2 instance. It is also limited what types of analysis can be done with this >approach.
- Combining tracker and aggregate data using aggregate indicators that reference both tracker program indicators or data elements and >aggregate data elements. This requires more configuration to work, and also assumes all data is available in the same DHIS2 instance.
- Saving aggregated tracker data as aggregate data values, i.e. moving data from the tracker data model to the aggregate data model - >often referred to in the DHIS2 community as “tracker to aggregate”. This involves the most comprehensive configuration and ongoing >maintenance of supporting service. However, it is also the most flexible approach, allowing the most comprehensive data analysis, and supports >the common scenario where tracker and aggregate data is collected in different DHIS2 instances.
This guide is focused on the last of these approaches, which is what we believe will be the preferred approach in most DHIS2 implementations. There are other approaches to integration of tracker and aggregate data that rely on custom scripts, manual data transfer, or use of various third-party tools and apps. These are not discussed here.
Saving aggregated tracker data as aggregate data values using the core functionality of DHIS2 involves some key steps:
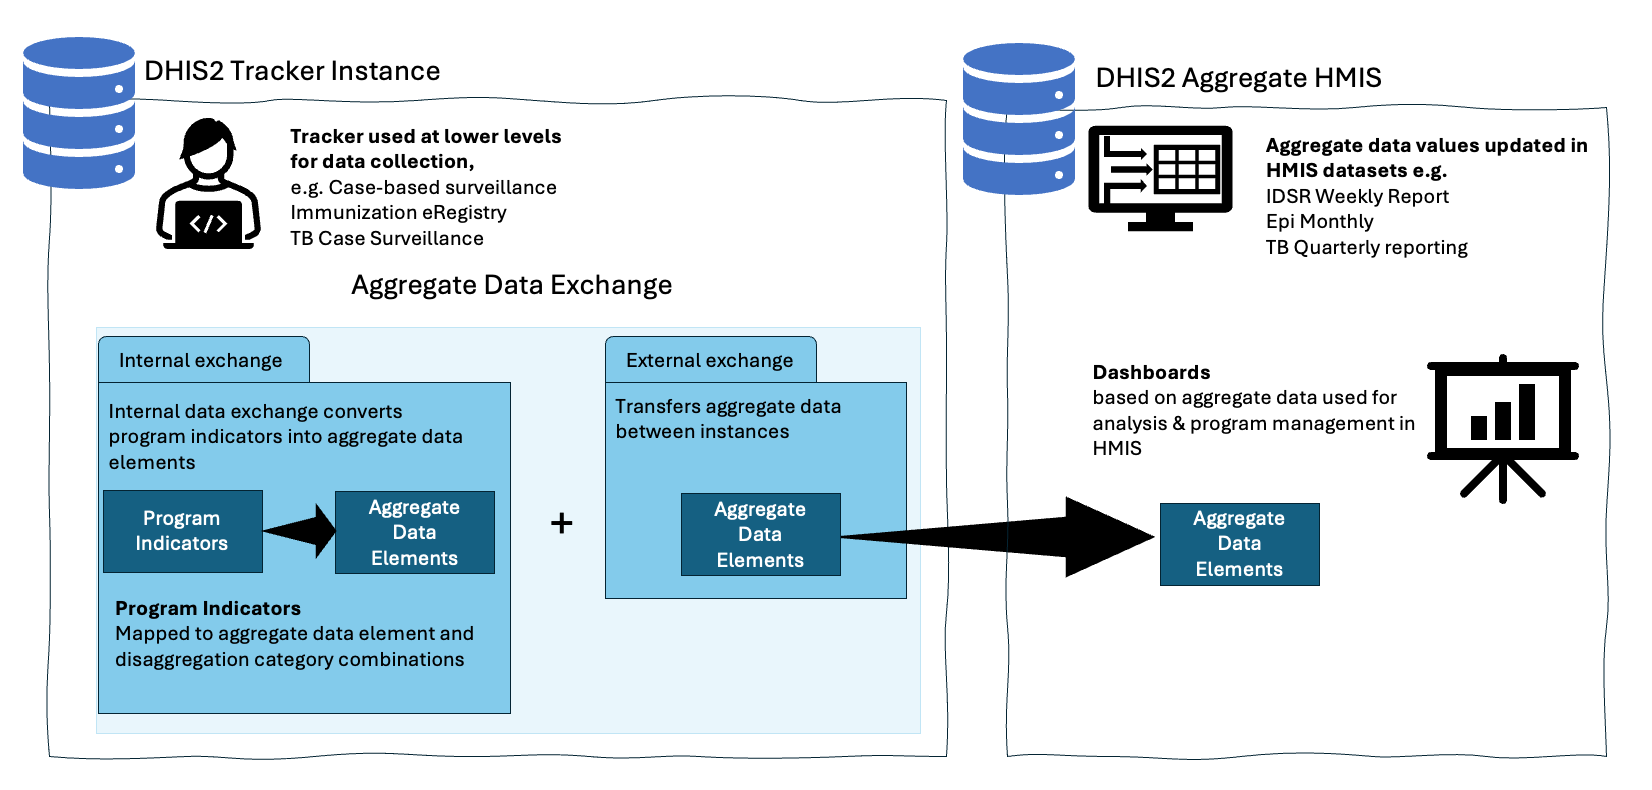
How to aggregate data from tracker programmes is defined through the configuration of programme indicators and (where relevant) program indicator disaggregations if using DHIS2 v42 or later. To populate an aggregate data set such as a monthly facility report from a tracker programme, you will typically define one program indicator for each aggregate data element and one program indicator disaggregation for each aggregate data element category. Typical examples of such disaggregations are age and sex. This is illustrated in the following figure.
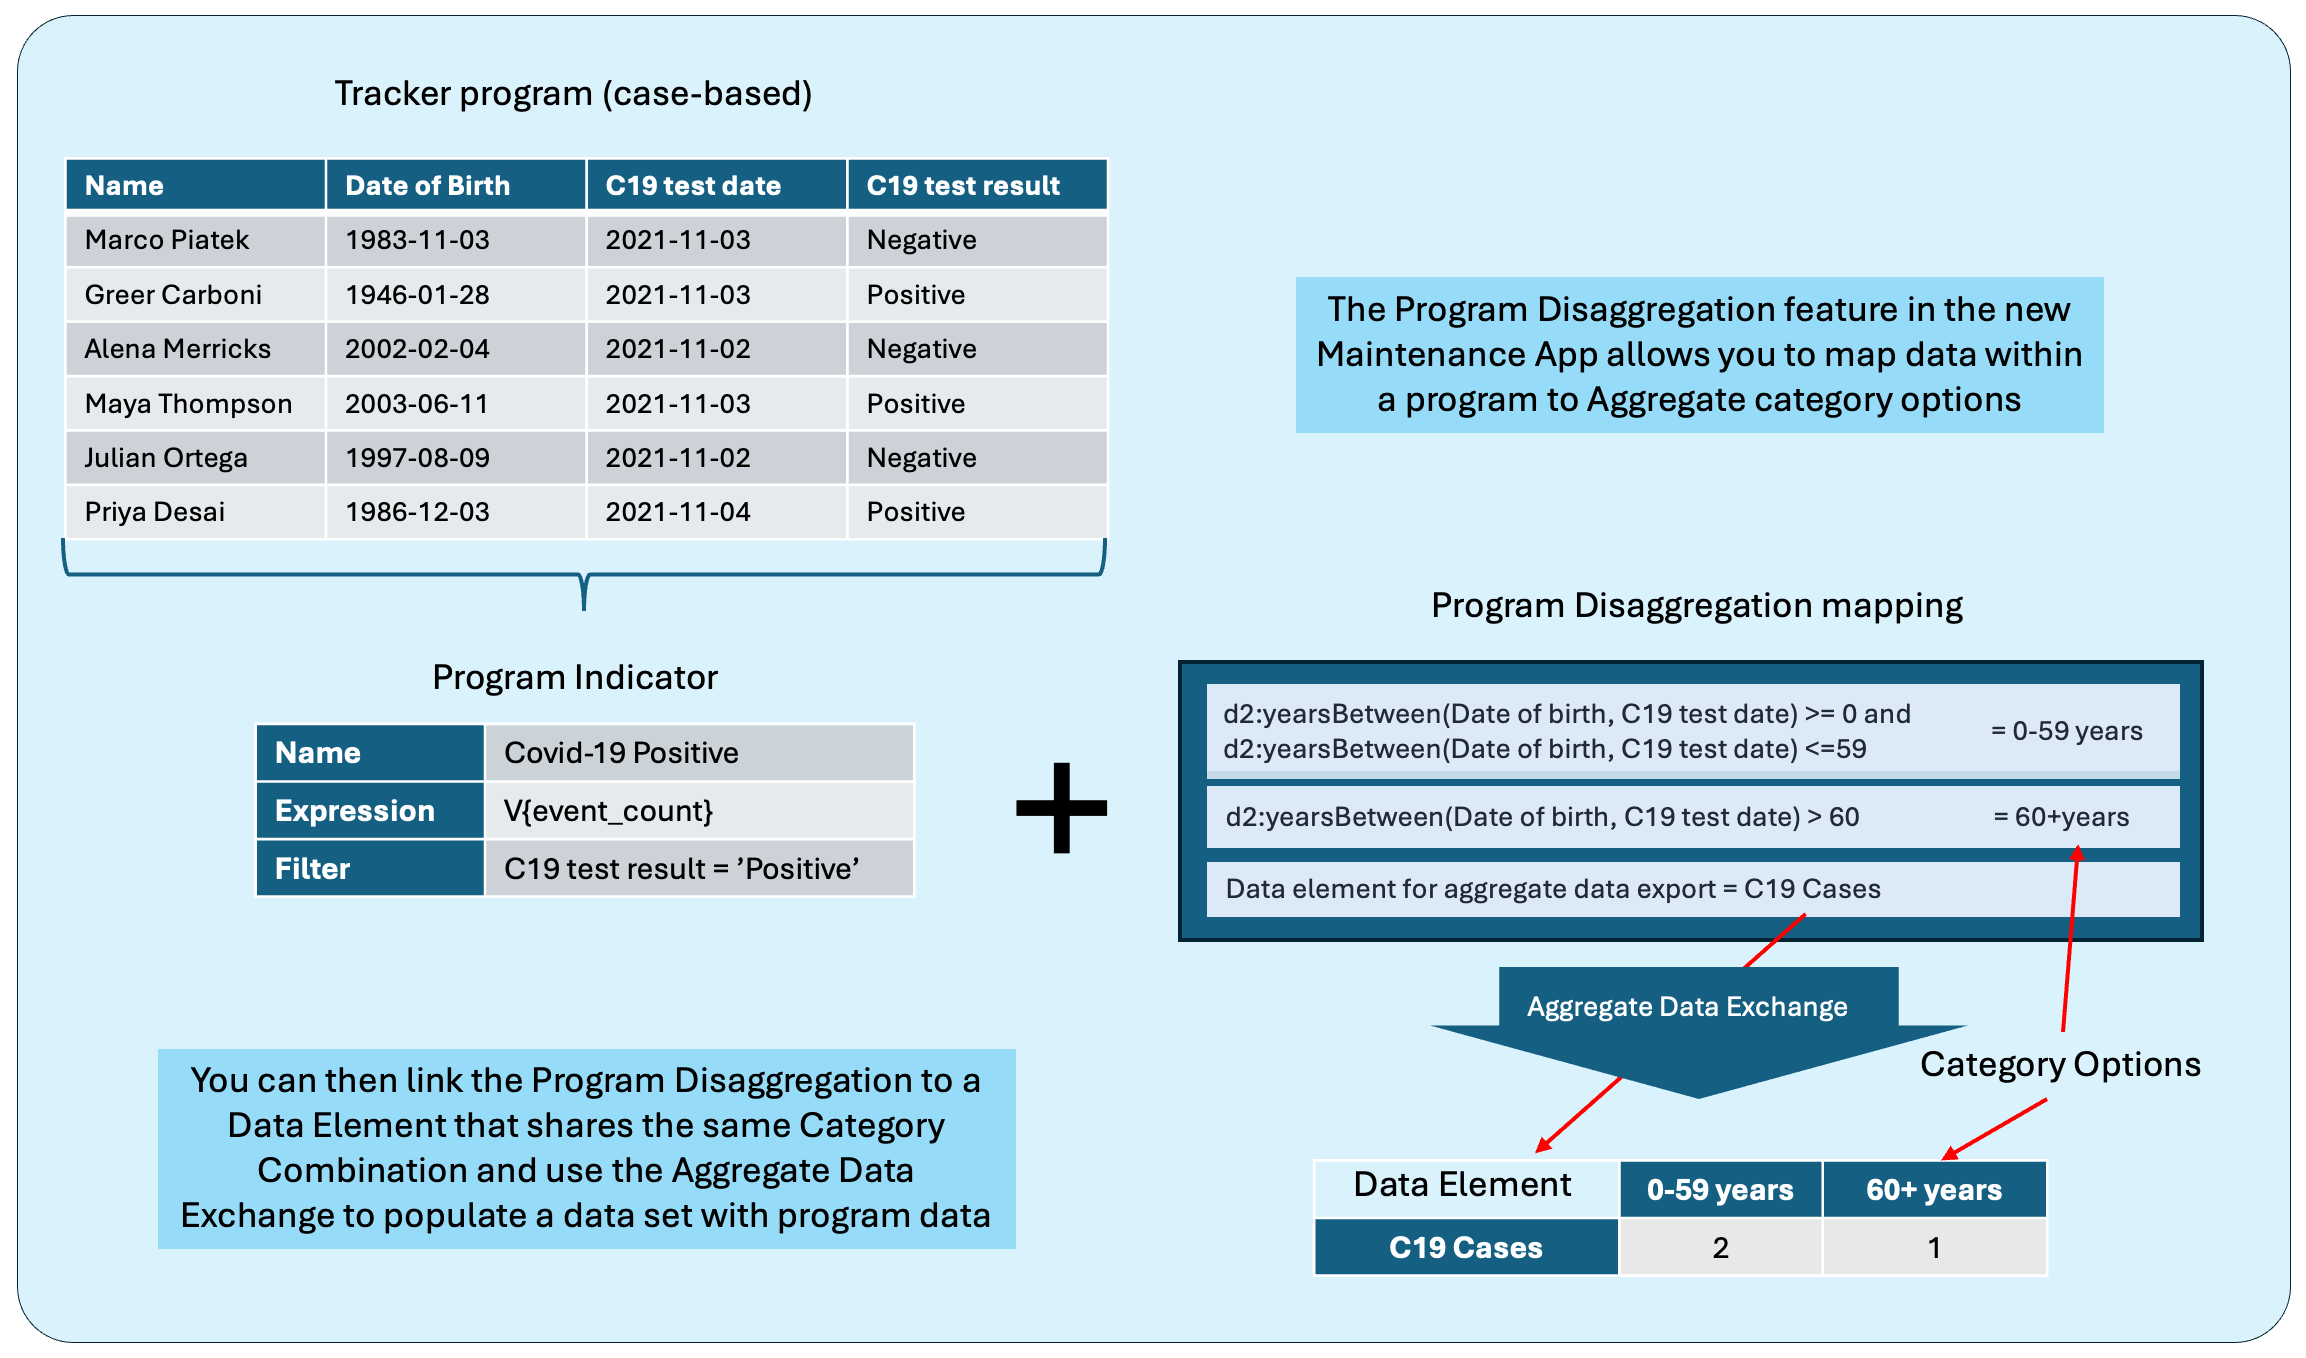
While not shown in the figure, program indicator mapping also applies for attribute category combinations, i.e. disaggregations applied to whole data sets. Thus if the target aggregate data set is disaggregated with an attribute category combo such as “implementing partner” and the implementing partner info is captured in the tracker programme, an expression can be configured to produce the attribute disaggregation as well.
Refer to User guides/Configuring the system/Programs/Setting up new Program disaggregation Mappings for detailed instructions on setting up program indicator disaggregation.
In DHIS2 v41 and below, the program indicator disaggregation functionality is not available. This means that in v41 and earlier, one program indicator must be configured for each individual data element + category option combination (+ attribute option combination). This is typically more demanding to configure and maintain, and it also leads to worse performance (in some cases significantly).
Each program indicator for which data is to be stored as an aggregate data value needs to be mapped to an aggregate data element, using some form of identifier. When using the program indicator disaggregation functionality in DHIS2 v42 and higher, mapping of identifiers from the tracker data model to the appropriate aggregate category option combinations and attribute option combinations are handled automatically by DHIS2. Mapping from program indicators to data elements is not automatic, but can be done using the “Data element for aggregate data export” field - include the id of the data element here. To keep the mapping of program indicators to data elements in one place, you can use the same approach also for program indicators that are not disaggregated by setting the Disaggregation/Attribute category combination dropdowns to “None”.
*make sure categories are the same if you plan to exchange with an HMIS
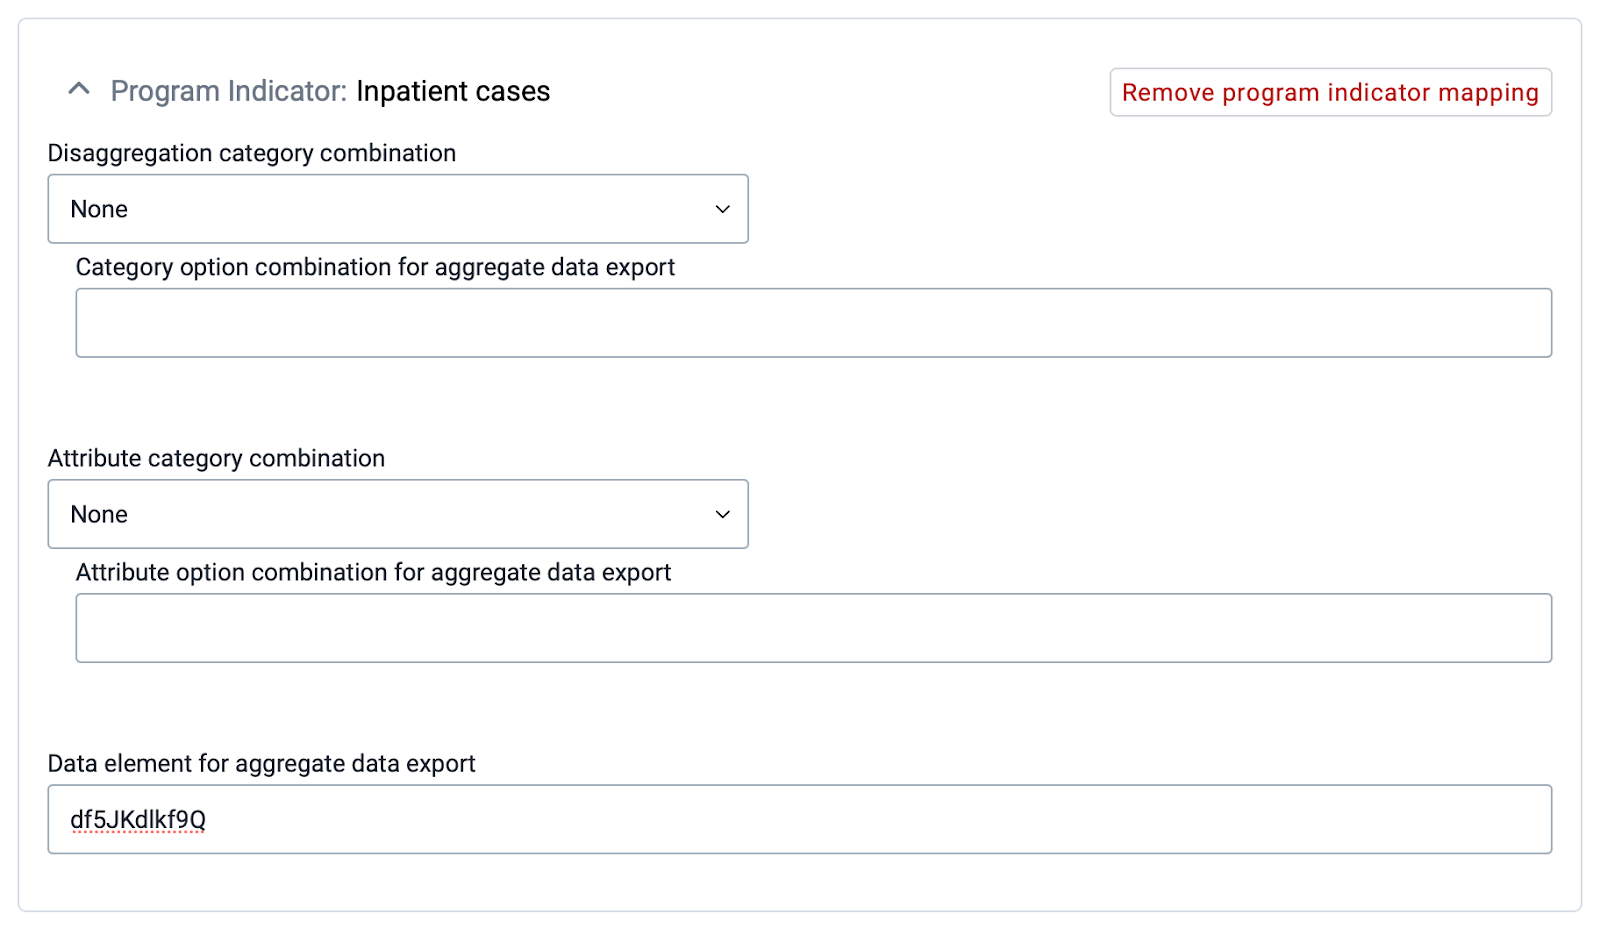
In general, we recommend using the program indicator disaggregation functionality when running v42 or higher; even when some or all program indicators are not actually disaggregated, it lets you maintain the mapping from program indicators to data elements in one place without the need for custom attributes etc. However, if working in a DHIS2 instance that does not support program indicator disaggregation or where for some reason the program indicator disaggregation functionality is not yet used (e.g. mapping was done in an earlier version), the mapping must be set up as part of the program indicator definition itself. This can be done in different ways, and you can in theory use the name, code, id or a custom attribute of the program indicator, and match this with either the name, code, id or a custom attribute of the aggregate data element in any combination you want. You specify in the aggregate data exchange job what identifier to use on the program indicator and data element side respectively.
A common pattern for this mapping is to assign the id of the target data element to a custom attribute of the program indicator. Program indicators have built-in properties specifically for the category option combination and attribute option combination identifier. However, there is by default no corresponding field for which to specify the identifier (i.e. code or id) of the data element. In principle, the code of the program indicator itself could be used, but this will fail if multiple program indicators are linked to the same data element (with different category option combinations). Instead, it is recommended to create an attribute that is assigned to program indicators.
The attribute:
- Should be of type Text
- Should not be mandatory, since not all program indicators will be linked to aggregate data elements.
- Should not be unique, since multiple program indicators may point to the same data element identifier.
- Should be applied to "Program indicator" only, since it is not relevant elsewhere.
Other properties like name, description and code can be defined according to the metadata naming convention of the particular implementation.
Once the custom attribute is assigned to program indicators, it will appear as a new field/attribute when adding or editing program indicators in the Maintenance app. Every program indicator for which data is to be transferred to aggregate data elements needs to be created and/or modified to include the code of the corresponding data element and category option combination code (this field can be empty for the default category option combination).
When program indicators have been defined and mapped to aggregate data elements, the last step is to actually extract the tracker data and store it as aggregate data values. The recommended tool for this in DHIS2 is the Aggregate Data Exchange service (available from DHIS2 v2.39) and the corresponding Data Exchange app. This is a generic service to export data from the analytics API of a “source” DHIS2 instance and import the data as aggregate data values in a “target” DHIS2 instance. Note that the source and target instances can be the same, meaning the data is simply transferred internally. To save tracker data as aggregate data values, we extract the program indicator data values from the “source” instance and save them into aggregate data elements in the “target” instance.
In many organisations, tracker and aggregate data are collected and managed in separate instances. For example, there might be a dedicated tracker instance for various case-based surveillance programmes, which should feed data into a separate HMIS instance hosting the routine, aggregate data. In these cases, the data exchange can be set up to send data directly from the tracker instance to the aggregate instance, without actually storing the aggregate data values in the tracker instances first. However, we recommend instead doing this in two separate steps: first storing tracker data as aggregate data element values within the same tracker instance, and then moving the aggregate data values to the aggregate (e.g. HMIS) instance.
The reason for this is two-fold:
The main downside to this is that the aggregate metadata must be maintained in two places.
Whether the data exchange is “internal” or move data directly between two instances, the mapping described above is what is used to link the data from the source to the appropriate metadata in the target, thus the exchange relies on consistent and resolvable identifiers that are maintained over time. With DHIS2 v42 and later, program indicator disaggregations simplify mapping of category and attribute option combinations from tracker to aggregate. When the program indicator disaggregation functionality with its built in mapping is not used, it is critical to configure the data exchanges with the appropriate identifier schemas:
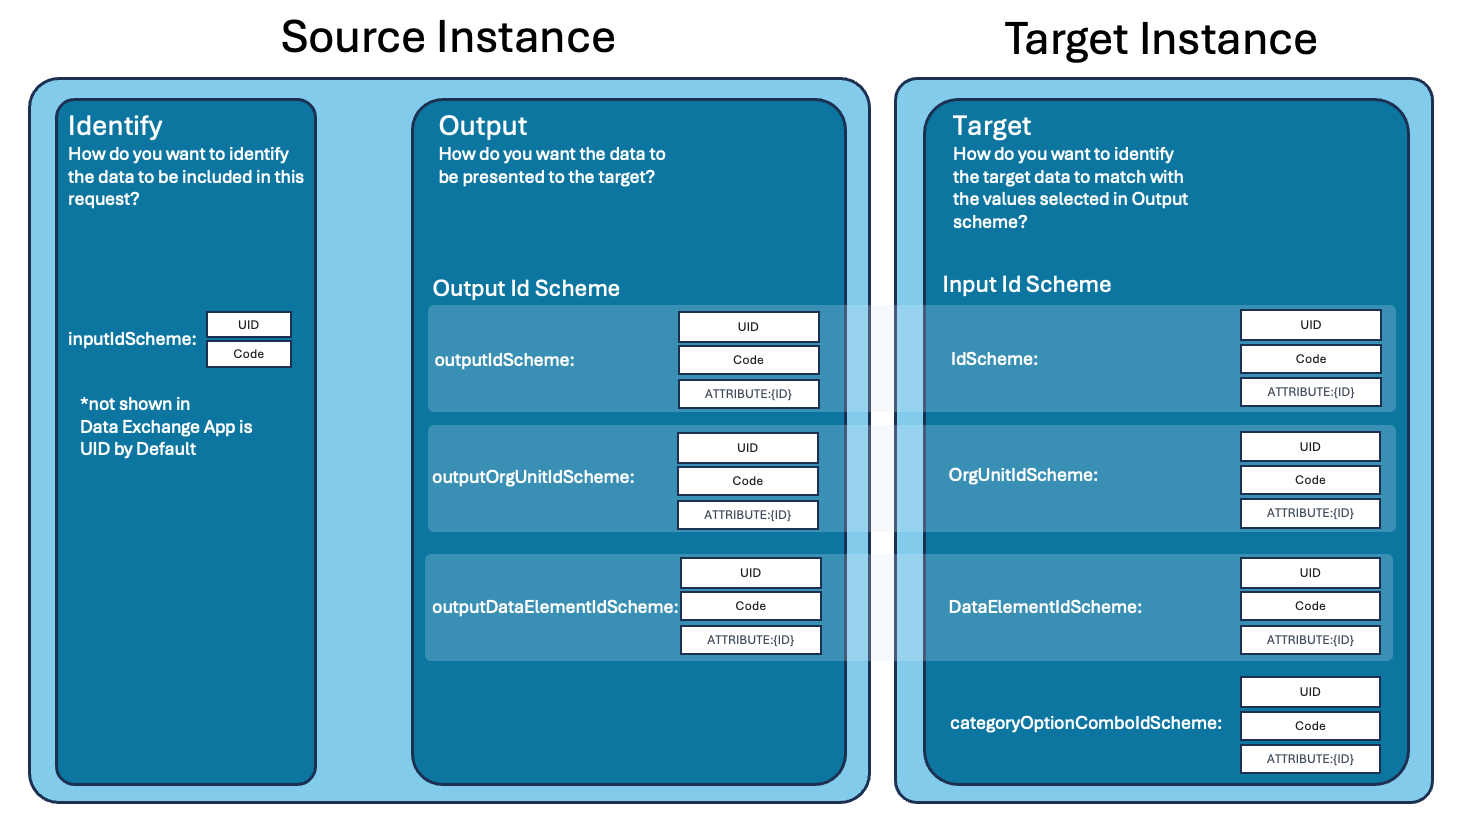
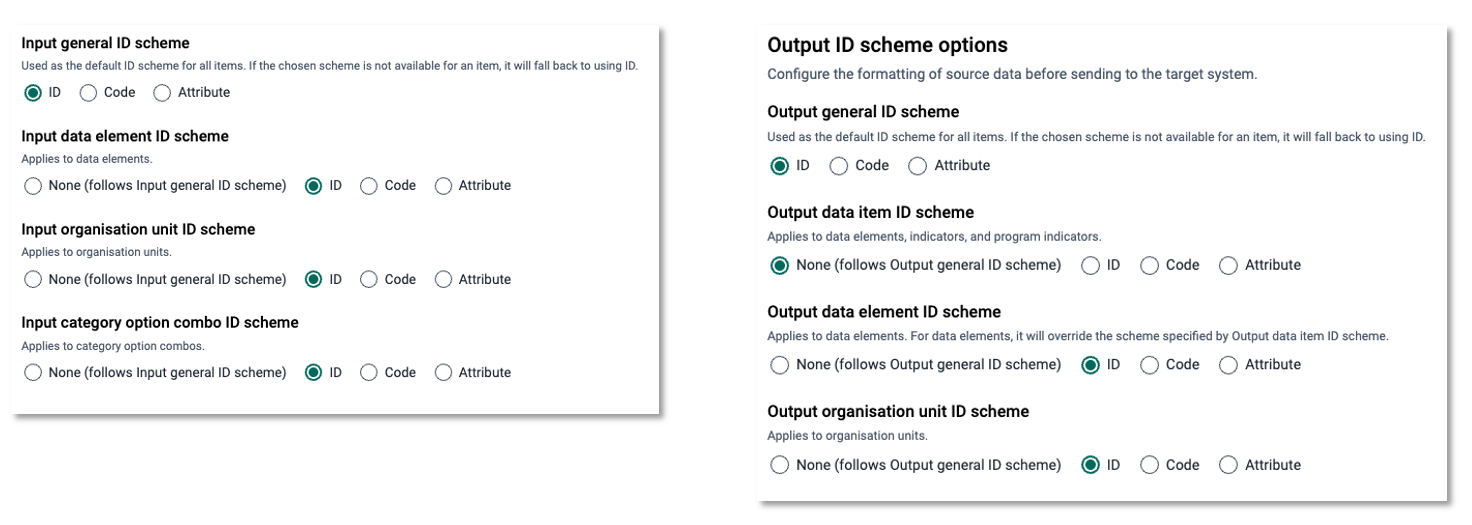
For example, if a custom attribute on the program indicator is used to store the id of the target data element, the output data item ID scheme should specify that custom attribute, whilst the “input data element ID scheme” should be id. When using the program indicator disaggregation to manage mapping (including of data elements), you do need to worry about the ID schemas.
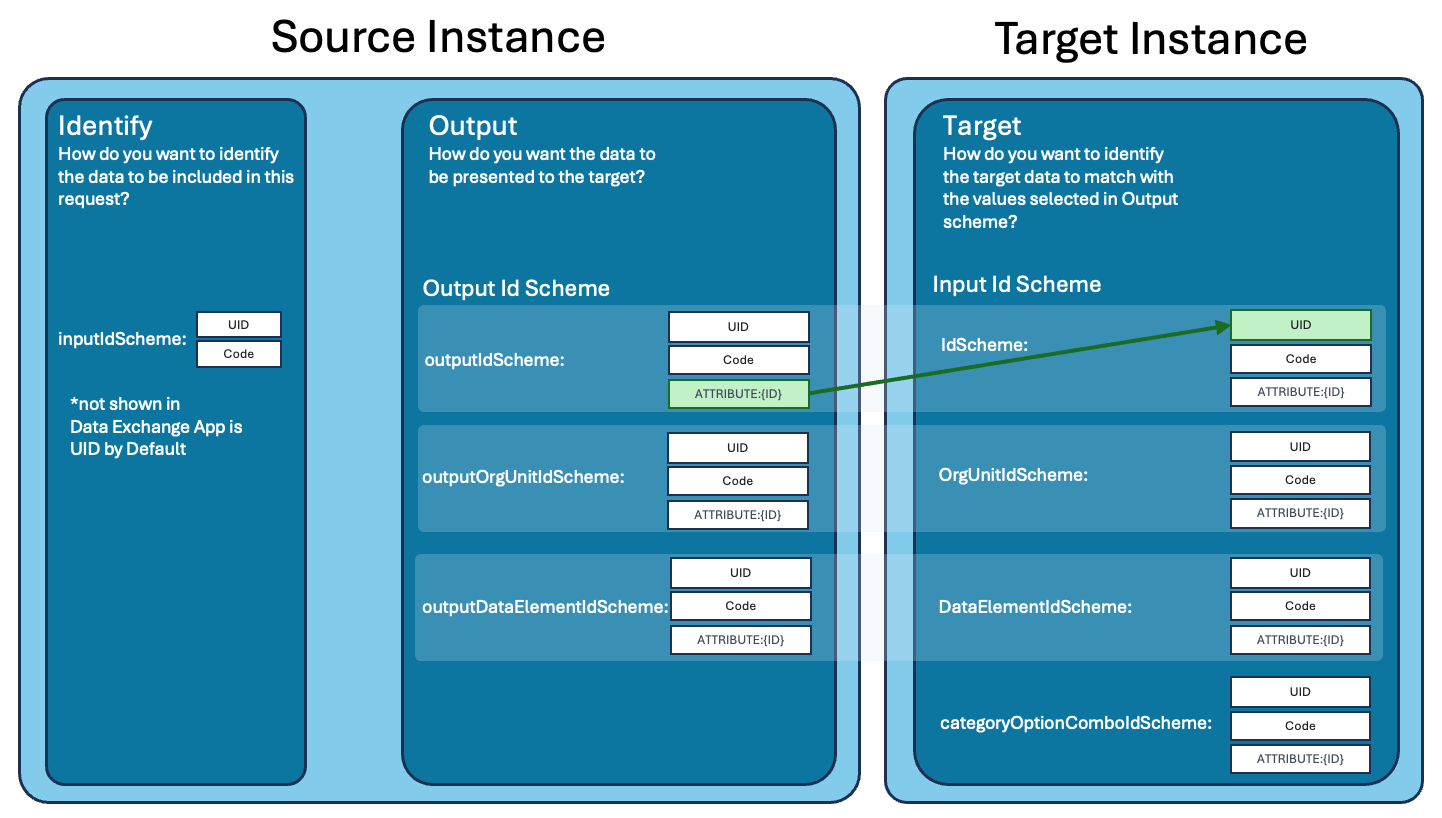
Data exchanges can be run manually in the Data Exchange app or via the API. However, a common scenario is to automate this process to run e.g. every night or every week. Data exchanges can therefore be scheduled to run automatically using the Scheduler app.
Because data exchanges pull data from the analytics API, scheduling of data exchanges must be coordinated with scheduling of analytic table updates. Typically, the order should be:
This will ensure that the latest tracker data will be included in the exchange, and that the aggregate data is available for analysis and/or for a second exchange moving it to a separate instance.
More information about configuring and scheduling aggregate data exchanges is available in other parts of the documentation:
- Data exchange app user guide
- Data exchange service documentation
- Scheduling documentation
The sections below list the core decisions, practical options and recommended defaults to guide implementation.
The new program indicator disaggregation functionality introduced in DHIS2 v42 offers several advantages over the previous approach of configuring individual program indicators for each disaggregation. In addition to reducing the number of individual program indicators that need to be configured and maintained over time, it can significantly improve performance - making the data transfer several times faster in many cases.
If you have already configured “tracker to aggregate” in an earlier version of DHIS2 without using the program indicator disaggregations, you should plan to update the configuration to use this new functionality - assuming the data set in question does in fact include disaggregated data. In particular, you should consider this if you are facing performance issues.
There are two key considerations related to the transfer of data
How often should aggregated data be transferred from tracker to aggregate data values? When the transfer is automated, the frequency of the transfer can be anything from daily to only once per reporting/aggregation period (e.g. weekly, monthly, quarterly). More frequent updates mean that data becomes available as aggregate data values and can be used and analysed more quickly, and are kept up to date as new and updated information comes in. Whether or not this is useful depends on the tracker programme in question. For example, having daily updated data over the course of a reporting period may be useful information if made available to facility-level staff, but is less useful if the purpose of the aggregation is primarily to facilitate and automate routine HMIS reporting to higher levels.
How far back in time should data be added and updated? When setting up the aggregate data exchange, you must be decide for how far back (how many periods) data should be updated, and whether or not to transfer data for the current period (for which data will not be complete, see previous point). This decision may have to be aligned with potentially existing practices around aggregate data, such as when or how it is validated and whether or not it is at some point locked for editing, discussed further below. Related to this is the question of whether to differentiate between migrating new data values and making updates to previously reported values.
Discussions on these issues need to take into account that tracker data is in many cases entered retroactively based on paper registers, rather than directly during service provision or patient encounters. Furthermore, corrections and edits may happen to the data for quite some time after the actual event took place, for example, if during a follow-up visit an error is detected in the data for the previous visit.
Unless there are strong reasons to do otherwise, it is suggested that updates and edits are done as far back in time as there is a reasonable chance of additions and updates being made to the underlying tracker data. This ensures that the most correct and updated information is what is used, even though it may necessitate changes to HMIS data management standards around e.g. data validation and locking.
Note: there is currently a limitation to the aggregate data exchange service when it comes to updating previously generated values. Consider this situation:
- A data exchange job has been run and updated aggregate data values for a period with a non-zero value for a particular program indicator in a particular orgunit
- The tracker data is updated so that the same program indicator does not produce a non-zero value for that orgunit
- A data exchange job is run again for the same period to update the existing aggregate data values
In this scenario, the data exchange job in step 3 will not remove the value produced in step 1. Work is ongoing to improve this situation.
Ensuring data quality is a key concern both for tracker and aggregate data, and linking the two introduces new potential dilemmas in this area. There are tools and methods for reducing the chance of errors being introduced in tracker data collection. Nonetheless, there is always a chance that errors are introduced. Within the period in which the tracker-based aggregate data is still being updated on a regular basis (as described in the previous section), corrections in the tracker data flows automatically to the aggregate data as well. However, there are two scenarios for which it must be decided how to address corrections to the data:
If errors are detected and corrected in tracker, after the time period in which data is routinely migrated and/or after which the aggregate data has been validated and/or locked. Possible ways to address this includes:
- Living with the discrepancy in the aggregate data (if the error is minor);
- Doing an ad-hoc transfer of the data for affected periods;
- Manually correcting the aggregate data.
If data quality issues are detected in the aggregate data. This is a less likely scenario, since only relatively large or systematic errors in the tracker data will be visible when the information is aggregated, or if the data is obviously incomplete. Possible ways to address this includes:
- Correcting the source data in tracker and then re-transferring the data (if possible);
- Correcting/editing the aggregate data (if possible), and accepting the discrepancy.
Another data quality topic of relevance when aggregating tracker data relates to the timeliness and completeness of data, which are key data quality metrics of aggregate reporting (e.g. in the HMIS). When aggregate data is reported directly through DHIS2, users click a button to indicate that a particular data set (reporting form) has been reported in full. This is used as the basis for calculating both the timeliness (submissions by a specified deadline) and completeness of data. When aggregate data is generated based on tracker data, no completeness and timeliness information is available. Several approaches can be considered concerning this issues:
Generally, when tracker data is used to produce aggregate data values, this is a form of secondary use of data beyond what it was primarily collected in order to do. It is important that it is clearly communicated to the users how issues of data validation and corrections are managed, how issues such as "completeness" are dealt with, and that the "source of truth" for the data is clearly defined.
Access to both tracker and aggregate data in DHIS2 is controlled through sharing, based on user groups. Sharing of tracker data and of the aggregate data values generated from the tracker data can thus be different, and in the common scenario that the two types of data are hosted in different DHIS2 instances the same users may not have access to the system at all. This has certain advantages, for example, the aggregate data values may be shared more widely than the tracker data without privacy/security implications. At the same time, it requires that appropriate data sharing is set up in two different instances, and it may also necessitate that users access two different systems. (It is possible to use OpenID Connect to allow users to share username and password across the two instances.)
Related to data access is the issue of ownership of data, an issue also linked to data quality and validation. There needs to be clear procedures in place that indicate who are responsible and "own" both the tracker and the aggregate data values generated from tracker. This is particularly important in scenarios where multiple health programmes are involved. For example, if an immunisation tracker programmes feeds data into an integrated, aggregate HMIS data set for which a separate HMIS unit is responsible.
When tracker data is aggregated for the purpose of replacing established aggregate reporting (such as existing routine HMIS reports), it is often useful to plan for maintaining parallel reporting for a period of time, for example 6 months. In this period, aggregate numbers generated from tracker and from the existing manual reporting procedures should be compared. It is unlikely that they will ever be completely identical, but such comparisons are useful because they:
- Should trigger a discussion around the source of the discrepancies, for example where there are data quality problems (in either of the data sources).
- Informs decisions around when the tracker data is of the same or better completeness and quality as the manual reporting, so that the parallel reporting can be stopped.
Technically, this can be achieved by having a separate "shadow" data set with separate data elements in the aggregate instance, so that two parallel sets of aggregate data can be kept and compared there. Alternatively, a copy of the aggregate data set can be kept in the tracker instance and used for comparisons.
When the tracker data and aggregate data are hosted in separate DHIS2 instances, a key requirement to move data between them is that the organization units in the two databases are aligned. This applies whether the aggregation and transfers happens in one operation (aggregate data exchange) or in two separate operations. Please refer to the dedicated section on this organisation unit maintenance for additional information.
While the approach to save tracker data as aggregate data values outlines the approach most relevant for e.g. integrating case-based surveillance systems with a routine system like an HMIS, there are also other more direct ways of brining tracker and aggregate data together. These are outlined below.
Note: A key limitation of these approaches, in particular for aggregate counts calculated with program indicators, has previously been the lack of dimensionality of data. For example being able to analyse age disaggregation and sex disaggregations as separate data dimensions used directly in charts and tables, for filtering, and re-used across variables. However, with the program indicator disaggregations introduced in v42, this is no longer the case - program indicators with disaggregations can also be used directly in data analysis tools, without first storing the data as aggregate data element values.
Aggregate and tracker data can be shown and analysed together by including it within the same Data Visualizer charts or tables. Furthermore, visualisations of tracker-based data can be created in the Event Report and Event Visualizer apps, and combined with visualisations of aggregate data on Dashboards. Any user can access to both types of data in the DHIS2 analytics apps can use this approach.
Advantages:
- Easy to set up
- Works well for presenting and analysing complimentary data
- Detailed data can be included (e.g. line lists of cases)
Disadvantages:
- Requires the tracker and aggregate data to be in the same DHIS2 instance
Indicators can be based on both aggregate and tracker data, separately or combined in a single indicator. Tracker data elements, tracked entity attributes and program indicators can all be included in the calculation of indicators.
This approach can be useful in several scenarios:
Advantages:
- Relatively easy to set up
- Can potentially hide some of the complexity of integrating aggregate and tracker data to end users
Disadvantages:
- Difficult to manage in cases where there may be overlapping data
- Requires the tracker and aggregate data to be in the same DHIS2 instance
This chapter offers an overview of the available tools for data analysis provided by DHIS2 along with a description of the purpose and benefits of each. If you are looking for a detailed guide on how to use each tool we recommend to continue to read the user guide after finishing this chapter. The following list shows the various tools:
Standard reports
Data set reports
Data completeness reports
Static reports
Organisation unit distribution reports
Report tables
Charts
Web Pivot table
GIS
The following section gives a description of each tool.
Standard reports are reports with predefined designs. This means that the reports are easily accessible with a few clicks and can be consumed by users at all levels of experience. The report can contain statistics in the form of tables and charts and can be tailored to suit most requirements. The report solution in DHIS2 is based on JasperReports and reports are most often designed with the iReport report designer. Even though the report design is fixed, data can be dynamically loaded into the report based on any organisation unit from within the hierarchy and with a variety of time periods.
Data set reports displays the design of data entry forms as a report populated with aggregated data (as opposed to captured low-level data). This report is easily accessible for all types of users and gives quick access to aggregate data. There is often a legacy requirement for viewing data entry forms as reports which this tool efficiently provides for. The data set report supports all types of data entry forms including section and custom forms.
The data completeness report produces statistics for the degree of completeness of data entry forms. The statistical data can be analysed per individual data sets or per a list of organisation units with a common parent in the hierarchy. It provides a percentage value for the total completeness and for the completeness of timely submissions. One can use various definitions of completeness as basis for the statistics: First based on number of data sets marked manually as complete by the user entering data. Second based on whether all data element defined as compulsory are being filled in for a data set. Third based on the percentage of number of values filled over the total number of values in a data set.
Static reports provides two methods for linking to existing resources in the user interface. First it provides the possibility to link to a resource on the Internet trough a URL. Second it provides the possibility to upload files to the system and link to those files. The type of files to upload can be any kind of document, image or video. Useful examples of documents to link to are health surveys, policy documents and annual plans. URLs can point to relevant web sites such as the Ministry of Health home page, sources of health related information. In addition it can be used as an interface to third-party web based analysis tools by pointing at specific resources. One example is pointing a URL to a report served by the BIRT reporting framework.
The organisation unit distribution report provides statistics on the facilities (organisation units) in the hierarchy based on their classification. The classification is based on organisation unit groups and group sets. For instance facilities can be classified by type through assignment to the relevant group from the group set for organisation unit type. The distribution report produces the number of facilities for each class and can be generated for all organisation units and for all group sets in the system.
Report tables are reports based on aggregated data in a tabular format. A report table can be used as a stand-alone report or can be used as data source for a more sophisticated standard report design. The tabular format can be cross-tabulated with any number of dimensions appearing as columns. It can contain indicator and data element aggregate data as well as completeness data for data sets. It can contain relative periods which enables the report to be reused over time. It can contain user selectable parameters for organisation units and periods to enable the report to be reused for all organisation units in the hierarchy. The report table can be limited to the top results and sorted ascending or descending. When generated the report table data can be downloaded as PDF, Excel workbook, CSV file and Jasper report.
The chart component offers a wide variety of charts including the standard bar, line and pie charts. The charts can contain indicators, data elements, periods and organisation units on both the x and y axis as well as a fixed horizontal target line. Charts can be view directly or as part of the dashboard as will be explained later.
The web pivot table offers quick access to statistical data in a tabular format and provides the ability to “pivot” any number of the dimensions such as indicators, data elements, organisation units and periods to appear on columns and rows in order to create tailored views. Each cell in the table can be visualized as a bar chart.
The GIS module gives the ability to visualize aggregate data on maps. The GIS module can provide thematic mapping of polygons such as provinces and districts and of points such as facilities in separate layers. The mentioned layers can be displayed together and be combined with custom overlays. Such map views can be easily navigated back in history, saved for easy access at a later stage and saved to disk as an image file. The GIS module provides automatic and fixed class breaks for thematic mapping, predefined and automatic legend sets, ability to display labels (names) for the geographical elements and the ability to measure the distance between points in the map. Mapping can be viewed for any indicator or data element and for any level in the organisation unit hierarchy. There is also a special layer for displaying facilities on the map where each one is represented with a symbol based on its type.
Localization involves the adaptation of an application to a specific location. When implementing DHIS 2 in a given country, adequate resources should be allocated to translate and localize the application if required. Translation of the user interface elements, messages, layout, date and time formats, currency and other aspects must be considered. In addition to translation of the user interface itself, metadata content which is contained in the database must also be considered to be translated.
Interface translations are compiled into the system itself, such that new translations can only be accessed by taking a newer version of DHIS 2. Database translations, on the other hand, are specific to your implementation and can be added to your existing DHIS 2 instance.
These two aspects are managed independently and the processes and tools are outlined below.
DHIS 2 supports internationalization (i18n) of the user interface through the use of Java property strings and PO files. Java property files are used when messages originate from the back-end Java server, while PO files are used for front-end apps written in JavaScript. The DHIS 2 Android apps use a specific XML format.
Note
The translator need not worry about the different resource file formats; the translation platform hides the details, and only displays the strings that require translation.
For example, the figure below shows the source and target strings when translating a resource to French.
There should always be an English string for all messages in DHIS 2. When the user selects a given language, and a translation is present in that language, then the translation will be shown. However, if the string in the desired language is missing then fallback rules will be applied. In cases when two given translations, such as Portuguese and Brazilian Portuguese share common messages, it is not required to perform a full translation in the variant language. Only messages which are different should be translated.
Fallback rules are then applied in the following manner (assuming the user has chooses Brazilian Portuguese as their language:
Display the message in Brazilian Portuguese if it exists.
If it does not exist in the variant language, then use the Portuguese message, if it exists.
If there is no message in either the base language or the variant language, choose the ultimate fallback language, English.
Important
There are a number of source strings such as "dd MMM yyyy 'to '" which are used for date/time formatting in various parts of DHIS 2. Part of the value should not be translated because it is actually a special formatting field used by either Java or JavaScript to interpolate or format a string. In this example the part of the value which can be translated would be "to", for instance to "a" in Spanish. The special string which should not be translated is "dd MMM yyyy". If these date format template strings are translated, it may result in errors in the application!
Important
Some special variables (e.g. {0} ) use curly brackets. This denotes a variable which will be replaced by a number or other value by the application. You must place this variable notation in the correct position and be sure not to modify it.
DHIS2 is now using transifex as our main platform for managing translations. You can access the DHIS2 resources at translate.dhis2.org, or directly at [https://explore.transifex.com/hisp-uio/].
The first step is to get access to the project. There are two ways to do this:
Navigate to the platform and create an account with transifex, then
Email the DHIS 2 team at translate@dhis2.org to request access.
Please provide:
Once you have access as a translator, you can start translating through the transifex Web Editor.
Transifex have a useful guide here: Translating Online with the Web Editor
As far as possible, the projects represent DHIS 2 apps one-to-one. For example, the APP: Data Visualizer project contains the translation strings for the Data Visualizer app.
Our transifex projects for DHIS2 User Interface all start with one of the following:
In addition, APP: Server-Side Resources contains some strings that are used by several apps; namely: - "Data Entry" - "Maintenance" - "Pivot Tables" - "Reports"
Within the projects we have resources, which represent localization files in the source code. In order to support multiple DHIS2 versions, with the same localization files, the version is associated with each instance of the file. So, for APP: Data Visualizer the list of resources looks like this in the Web Editor:
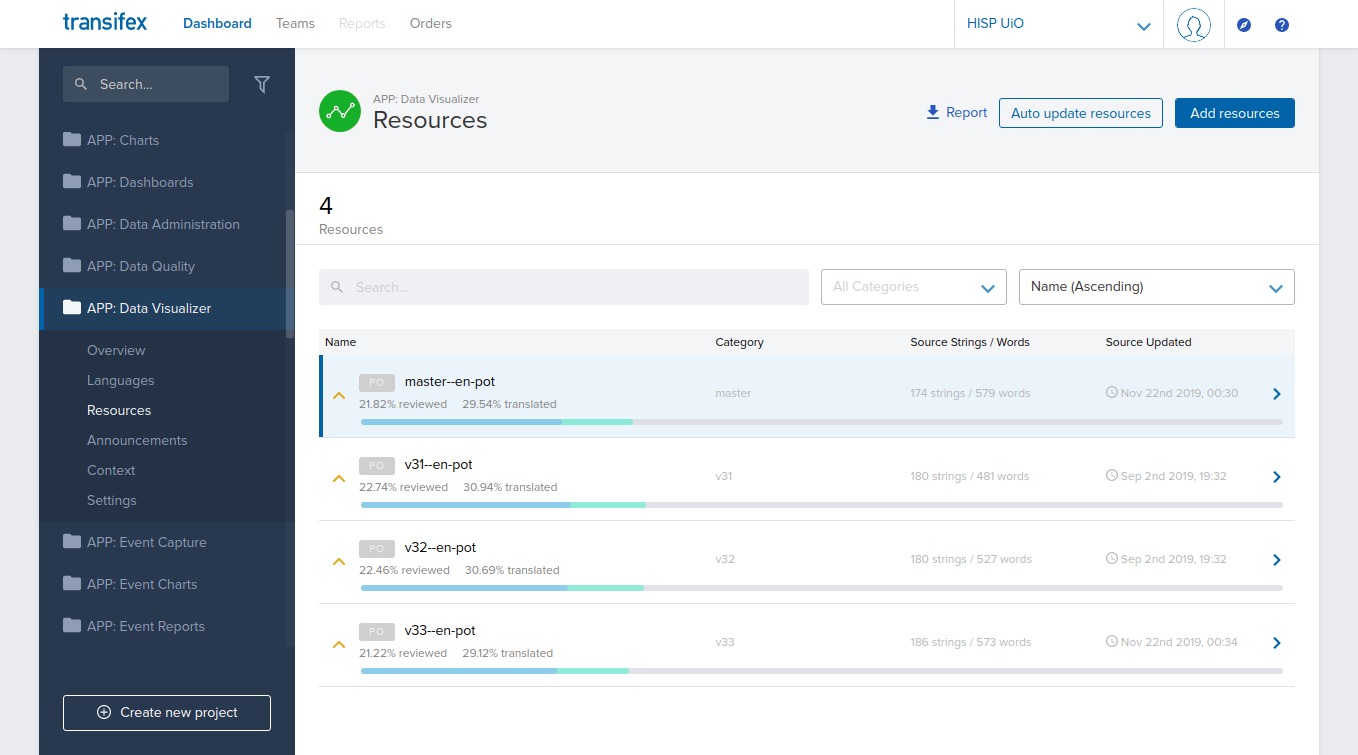
i.e. there is only one source resource for the app (en.pot), but we have added the versions from 2.31 (v31) up to the latest development (master). The version is shown in the "Category" field, and is also visible as a prefix to the resource name, e.g. v31--en-pot.
Note
In general, we request translators focus on the "master" resource; it usually contains all strings from previous versions, and when translations are added the platform will fill in matching translations on the previous versions too. See the localization section of our website.
Tip
For a specific language and DHIS2 version, you can get an overview of the tranlation coverage, as well as direct links to all relevant resources on transifex, from the localization section of our website.
We have a nightly service that pulls new translations from the transifex platform and opens a pull request on the source code.
The service loops over all projects and supported languages and does the following:
The pull requests are reviewed and merged into the code base as part of the normal development process.
Info
The translations added to transifex will, in general, be in the next available stable release for all supported DHIS 2 versions
If you need to ensure that your translations are in the next stable release, contact us (translate@dhis2.org) expalining your needs, and we'll let you know what we can do.
Tip
The translations you add in transifex should be visible in all development demo versions on our play server (https://play.dhis2.org) within a few days, in most cases.
Please contact us via email translate@dhis2.org, or on the Community of Practice and we'll add that language to the projects on transifex.
Once resources for that language are more than 20% translated, they will start to be pulled into the system. They will then become visible in the development demo versions, and be available in future releases.
Note
DHIS 2 manages metadata (database) locales independently from the UI. See the Metadata/Database section below.
Starting in core version 43.0, there is an option to add custom translations or text overrides for core apps using the datastore. This can be used to translate strings that haven't been translated yet by other means (Transifex), or to override the text in apps in other ways, for example to use domain-specific language.
Important
This is an experimental feature and may be subject to change.
Configuring custom translations requires either knowledge of Transifex or some simple API usage in the browser.
Using the feature takes three steps: 1. Enable custom translations from the System Settings app, under the Appearance section 2. Configure the controller in the datastore 3. Configure the app and locale text overrides
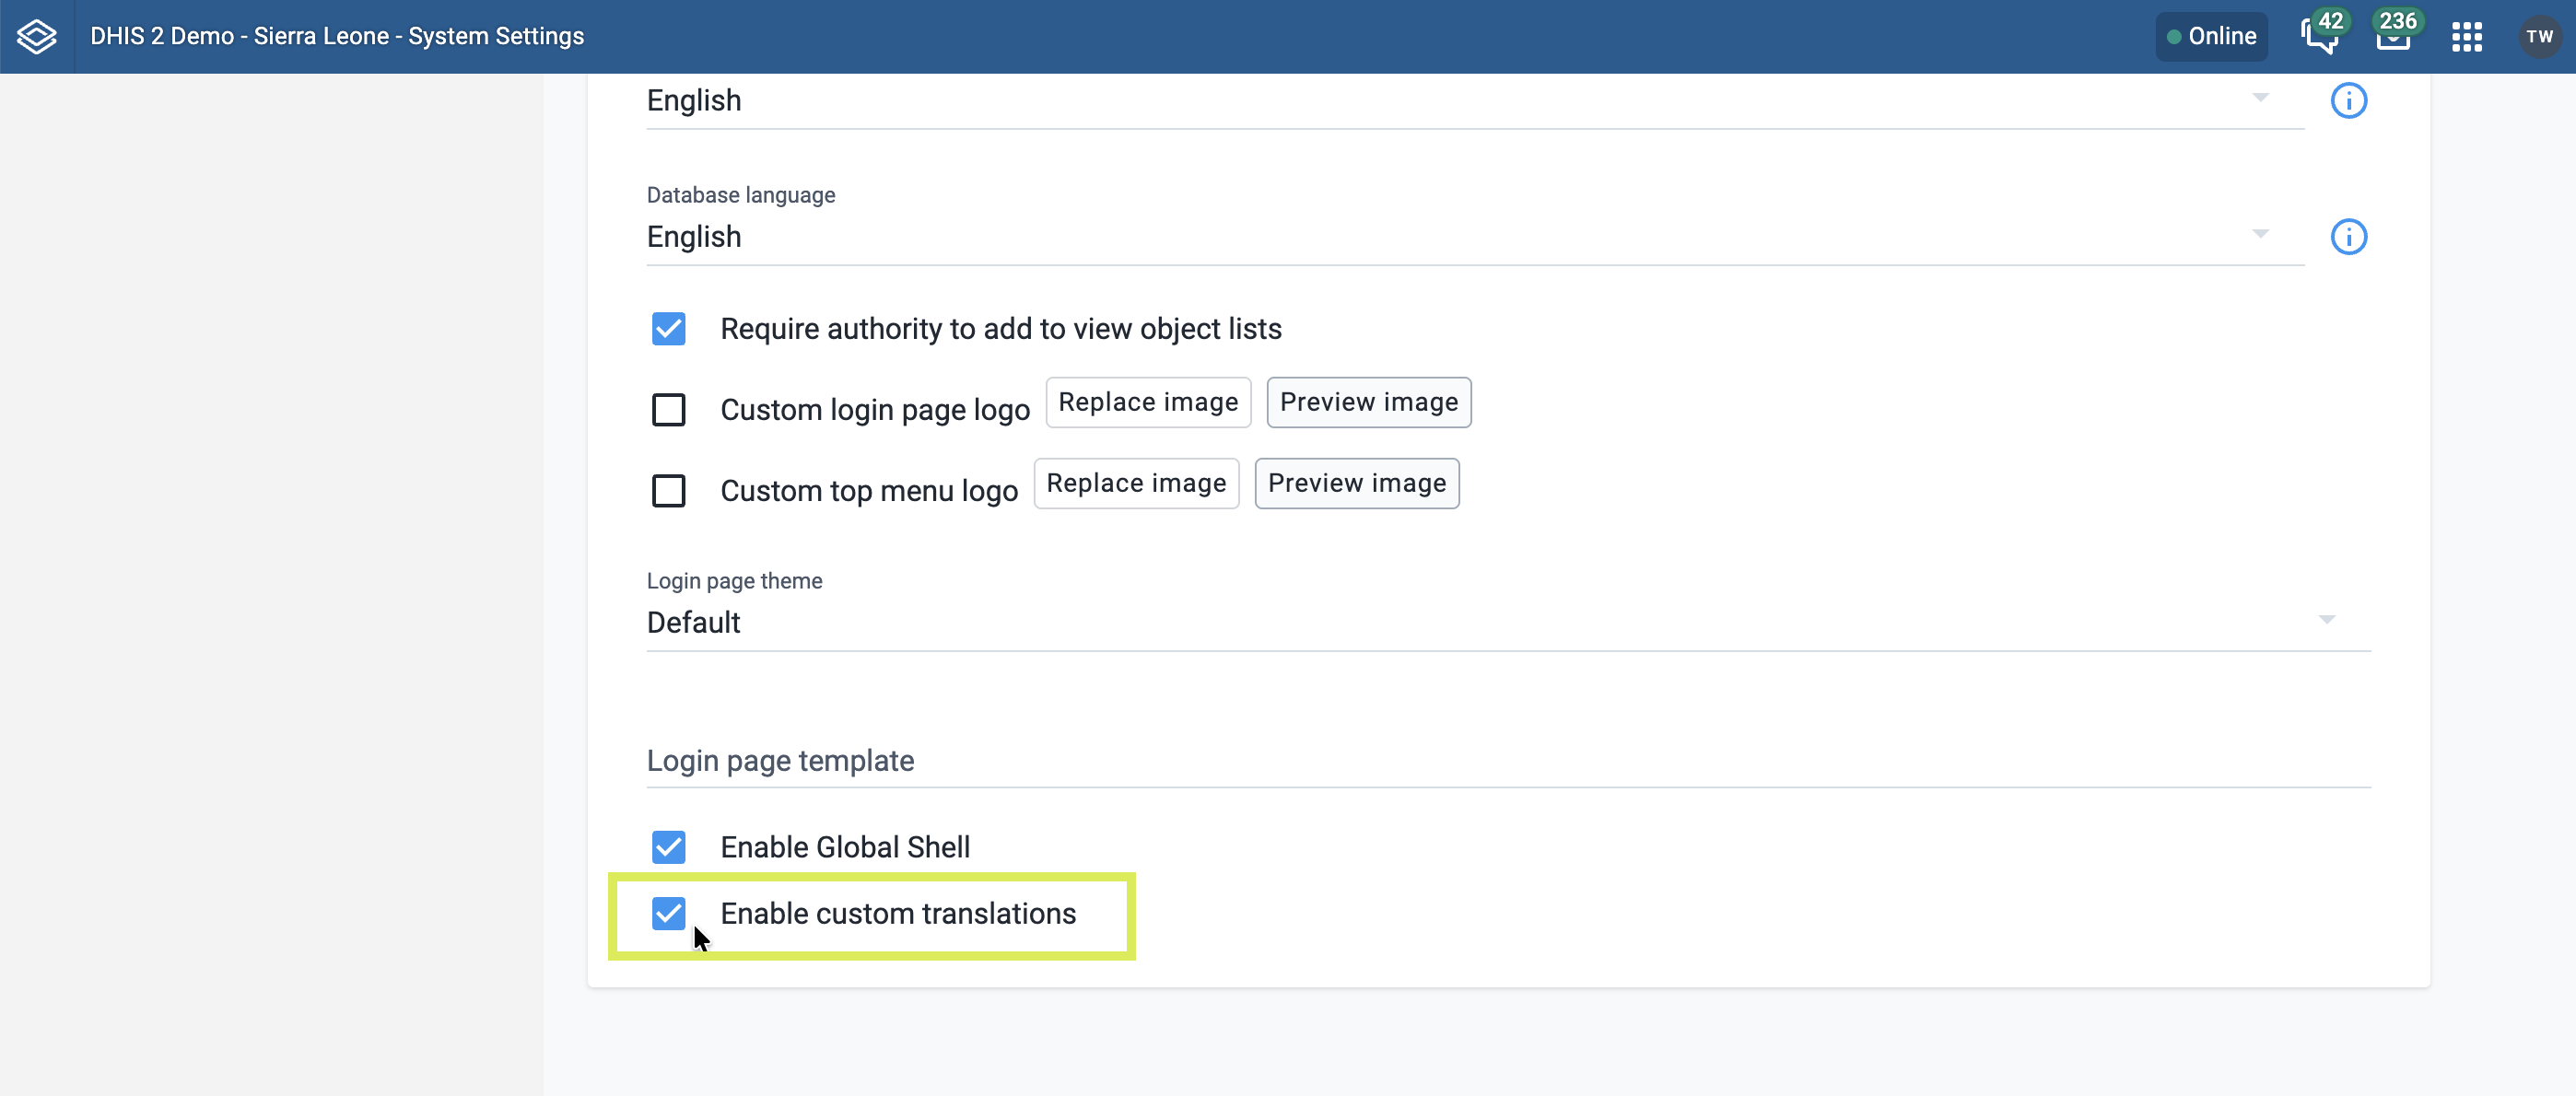
The controller acts as an allow-list for the specified apps to load custom translations for the specified locales. This is a mechanism for saving network requests in apps and not loading unwanted overrides.
custom-translations. Key = controller 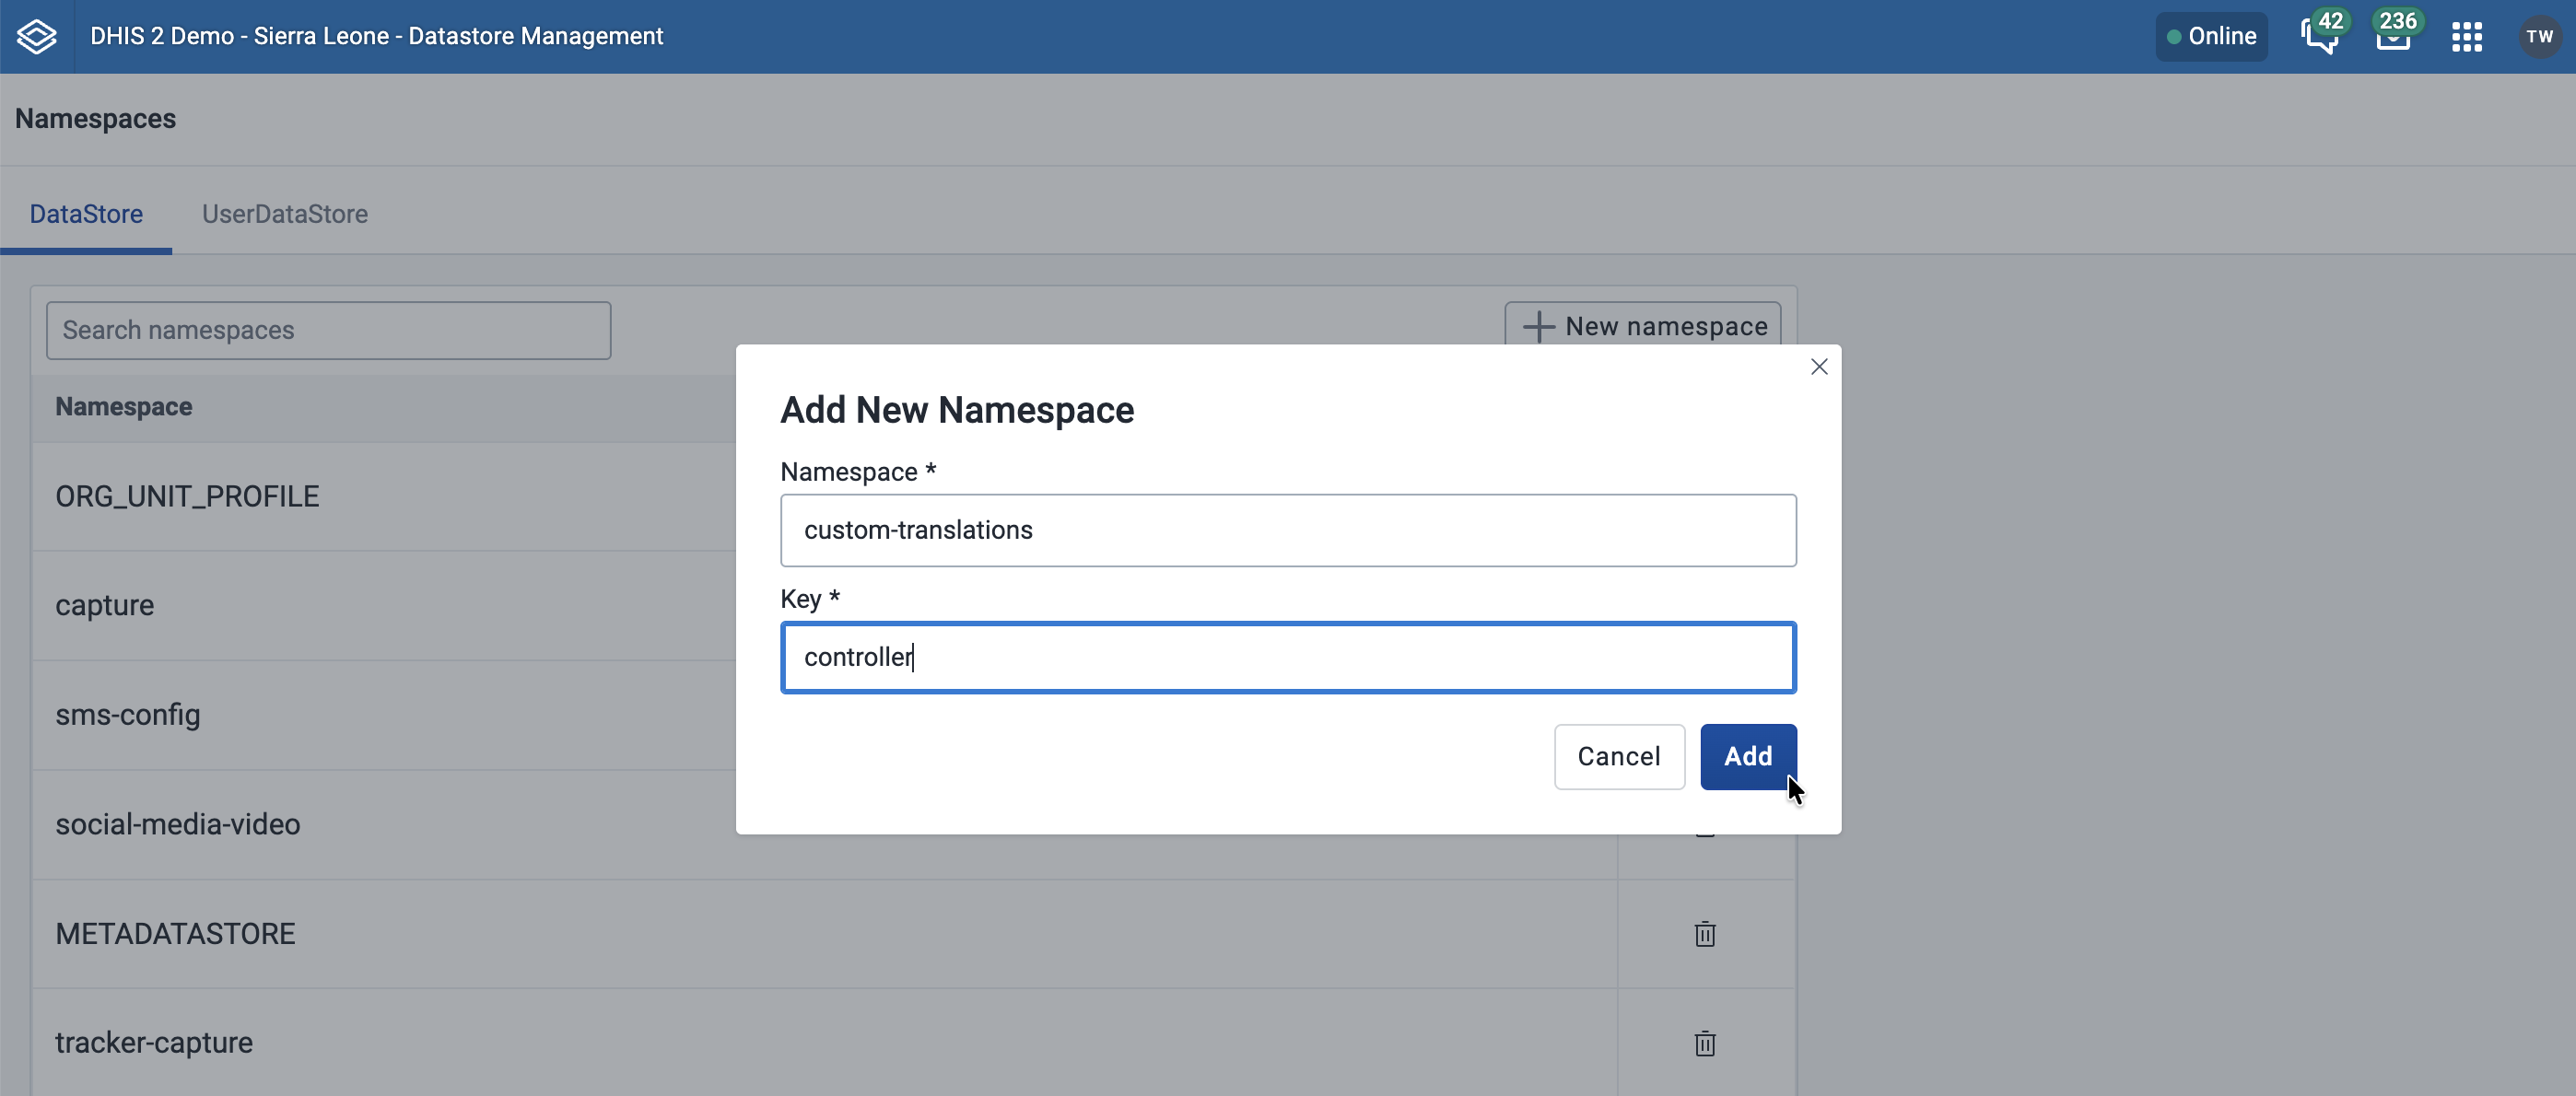
custom-translations namespace, click the Sharing button (three connected dots) on the controller key and edit the sharing settings so the public can only view the key, and only you and other trusted app administrators can edit the key. Click Save.Important
Configuring these sharing settings is important because the datastore is publicly editable by default, and these translations should only be editable by privileged users.
{ "<app-identifier>": ["<locale1>", "<locale2>"] }. See the screenshot below for an example.capture, aggregate-data-entry, and data-visualizer. Here are some formats you might find:<baseUrl>[/api]/apps/data-visualizer => data-visualizer<baseUrl>/dhis-web-capture/ => capturekey value from the /api/apps response.pt_BR.<dhis2BaseUrl>/api/locales/ui in the browser, find the locale you want to translate for, then use the locale property as the locale identifier. 
custom-translations namespace, click the New key button at the top.<app-identifier>__<locale-identifier>, for example capture__pt_BR. NB: There are two underscores between the app and locale identifiers.controller key.{ "<text identifier>": "Override text" }. See below for more information on how to find the right text identifiers to use. 
There are a few options for finding the identifiers (source string/msgid) for strings of text in the app:
msgid property in the /i18n/en.pot file for each app. Here is the file for the Capture app, for example./src/locales directory when building an app using the App Platform.Here are some more details to keep in mind: * Make sure "interpolation values" like {{ count }} or {{ category }} are copied exactly in the override string * Plurals need multiple entries to handle "one" and "many" cases. Observe how plurals are accomplished in the screenshot above, for example for {{ count }} event and {{ count }} event_plural
Now, these three conditions should be met: 1. Custom translations have been enabled in the Settings app 2. The custom-translations namespace and controller key in the datastore have been set up with an app and locale allow-list 3. Text overrides for the app and locale have been added to a datastore key for the app and locale
At this stage, the affected apps should now show the new string overrides in the selected locales when the apps are loaded (notice how education-themed strings from the datastore screenshot above are visible in the Capture app below).
To remove an override for one string, remove that line from the <app>__<locale> datastore key in the custom-translations namespace for the app and locale of interest.
To remove all the custom translations for an app and locale, remove that locale from the app's list in the controller key in the custom-translations datastore namespace. You can either keep the <app>__<locale> key to use again later, or remove the key to clean up.
To remove all custom translations for all apps and locales, remove all the contents of the controller key (but don't delete it -- it can be useful later) and uncheck the "Enable custom translations" option in the Appearance section of the Settings app. You can either keep or remove the <app>__<locale> keys in the custom-translations datastore namespace.
Apps using App Platform v12.11.0 can use custom translations via the datastore.
Strings from libraries that an app uses, like the UI library, must also meet the same App Platform requirement to be translatable.
In addition to translation of the user interface, DHIS 2 also supports the localization of the metadata content in the database. It is possible to translate individual objects through the Maintenance app, but in order to better support a standard translation workflow, a specialized app has been developed for this purpose.
New metadata locales can be added in Maintenance app > Locales.
The DHIS 2 Translation app can be used to translate all metadata (data elements, categories, organization units, etc) into any locale which is present in the database.
To get started, simply choose the Translations app from the top level menu.
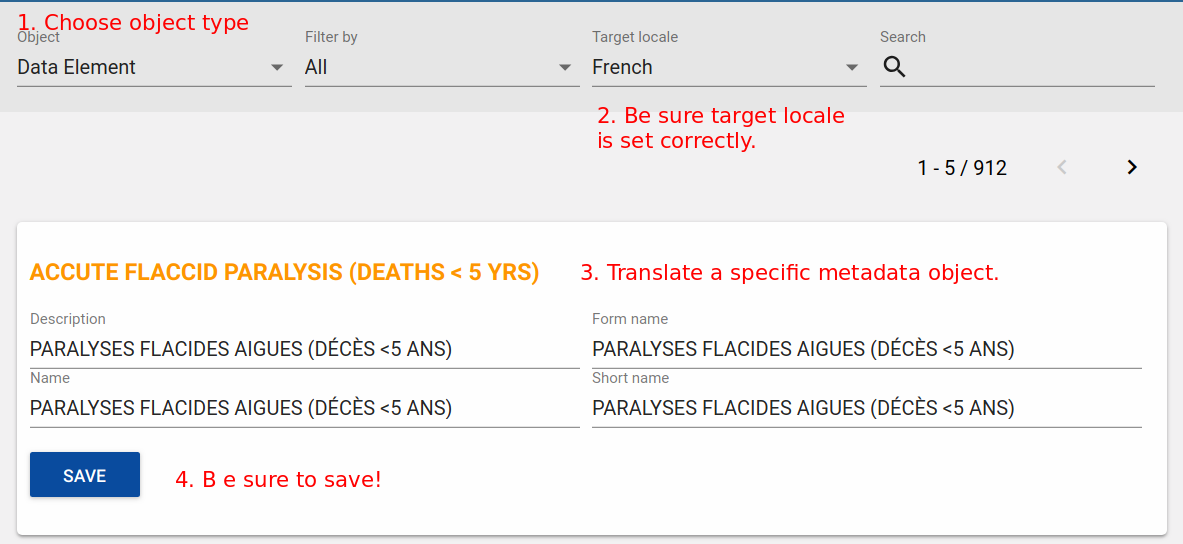
Choose the type of object you wish to translate from the Object drop-down menu, such as "Data elements".
Be sure you have set the Target Locale to the correct language.
Choose the specific object you wish to translate, and translate each of the properties (Name, Short name, Description, etc). These properties vary from object to object.
Press "Save" when you are done translating the specific object to save your changes.
Note
You can search for a specific term using the search feature in the upper right hand corner of the app.
DHIS 2 is a web-based information management system under very active development with typically two major releases per year. Each release typically includes a number of new features and additional functionality. Given the fast pace of development, the system's wide user base and distributed, global nature of development, a comprehensive documentation system is required.
In this chapter, we will describe the documentation system of DHIS 2 and how you can contribute.
The DHIS 2 documentation is written in Commonmark markdown format. One of the main advantages of markdown is that there is complete separation between the content and presentation. Commonmark is a strongly defined, highly compatible specification of markdown. Since markdown can be transformed into a wide variety of formats (HTML, PDF, etc) and is a text-based format, it serves as an ideal format for documentation of the system.
There exist a wide range of text editors which can be used for the creation of markdown files. For Linux and Windows, ghostwriter is a nice option; it is free and supports side-by-side preview and custom style sheets.
One of the key concepts to keep in mind when authoring documentation in markdown, or other presentation neutral formats, is that the content of the document should be considered first. The presentation of the document will take place in a separate transformation step, whereby the source text will be rendered into different formats, such as HTML and PDF. It is therefore important that the document is well organised and structured, with appropriate tags and structural elements being considered.
It is good practice to break your document in to various sections using the section headings. In this way, very complex chapters can be split into smaller, more manageable pieces. This concept is essentially the same as Microsoft Word or other word processing programs. The rendering process will automatically take care of numbering the sections for you when the document is produced.
The DHIS 2 documentation system is managed at GitHub across a variety of source code repositories. GitHub is a platform that enables multiple people to work on software projects collaboratively. In order for this to be possible, a version control system is necessary to manage all the changes that multiple users may make. GitHub uses the git source control system. While it is beyond the scope of this document to describe the functionality of git, users who wish to create documentation will need to gain at least a basic understanding of how the system works. A basic guide is provided in the next section. The reader is referred to the git manual for further information.
In order to start adding or editing the documentation, you should first perform a checkout of the source code. If you do not already have a GitHub account, you will need to get one. This can be done here. Once you register with GitHub, you will need to request access to the dhis2-documenters group if you wish to modify the source code of the documentation directly. However, anyone can clone the documentation into their own repository, commit the changes to that fork, and request that the changes be merged with the source of the documentation with a pull request to the parent repository.
The structure of the documentation site is defined in the build repository dhis2-docs-builder. If you wish to add new parts to the structure, changes will have to be made there; this is usually only relevant to the internal DHIS2 team.
Tip
The best way to find the source of the document you wish to edit is to find the document on the docs.dhis2.org website and click the "Edit" icon at the top of the page.
In order to edit the documentation, you will need to download the source of the documentation to your computer. GitHub uses a version control system known as git . There are different methods for getting Git working on your system, depending on which operating system you are using. A good step-by-step guide for Microsoft operating systems can be viewed here. Alternatively, if you are comfortable using the command line, you can download git from this page If you are using Linux, you will need to install git on your system through your package manager, or from source code. A very thorough reference for how git is used is available in a number of different formats here.
Once you have installed git on your system, you will need to download the document source. Just follow this procedure:
Make sure you have git installed.
On Windows systems, visit the relevant repository URL and press "Clone in Desktop". If you are using the command line, just type git clone git@github.com:dhis2/dhis2-docs.git (note that in this example dhis2 is owner of the repository and dhis2-docs is the name of the repository)
The download process should start and all the documentation source files will be downloaded to the folder that you specified.
Once you have the source, be sure to create your own branch for editing. Simply executegit checkout -b mybranch where mybranch is the name of the branch you wish to create.
When writing or editing documentation, there are a few key project-specific conventions that you should be aware of, which are outlined in this section. In addition, several markdown extensions are implemented and are demonstrated for convenience in the Markdown support and extensions later in this document.
Image resources should be included as relative paths inside a sub-folder relative to the current document. e.g. for the chapter content/android/android-event-capture-app.md, the images are somewhere under content/android/resources/images/<rest-of-path> and are referenced like 
If you want to control the alignment and size of images, you can take advantage of a markdown extensionthat we use. It allows you to set attributes such as width, height and class in curly brackets at the end of the image definition. For example:
{ width=50% }
{ .center width=50% }
.center class in css). When images are written like

For screenshots of the DHIS 2 web interface, we recommend using Chrome browser, with the following two extensions: 1. Window Resizer. Use this to set the resolution to 1440x900 2. Fireshot. Use this to quickly create a snapshot of the visible part
Fireshot can even capture the full page, i.e. scrolled, if desired. It can also capture just a selected area (but the maximum width should always be 1440px)
When taking screenshots of the Android app, size should be set to 360x640.
Localisation of images is supported by storing language-specific versions of an image alongside the original image. The filename should be the same as the original English version, but should include _ plus the language code at the end of the name, before the extension.
For example, if you want to have a French version of
resources/images/my_screenshot.png
You can simply create the French version and save it as
resources/images/my_screenshot_fr.png
The link in the documention should still point at the original image. When the documentation site is built for each language, localised images will be identified and used instead of the English originals.
The language code is the first part of the URL that you see after the "docs.dhis2.org/" when viewing the localised version of the documentation. At the time of writing, for example, we have
fr,es_419,pt,csandzh.
In order to provide fixed references (anchors) within the documentation, we can set a fixed text string to be applied to any section. For our markdown processor this is done by adding a hash id in curly brackets at the end of the line with the section title, e.g.
## Validation { #webapi_validation }

To generate a data validation summary you can interact ...
Will set the section id of the level 2 heading Validation to "webapi_validation", which may then be referenced as "#webapi_validation" from any html file.
Note
In order to support linking by anchor reference from other documents, please try to keep the section ids unique. For example, if "#webapi_validation" is unique across the documentation, then you can refer to it from any other part of the documentation simply with
[link name](#webapi_validation).
If the section id being referenced is not unique, the document processor will attempt to resolve to the "closest" anchor with that name. When the linking file belongs to a specific version, the processor will ignore anchors belonging to different versions.
Caution
Our documentation is compiled into both pages and full documents. For this reason it is not advised to include paths in inter-document references. Please use unique section ids as described above in order for the links to resolve correctly in both document types.
Please follow the convention of lowercase letters and underscores, in order to create id's that are also valid as filenames in cases where we split files as part of the document generation.
As an extension to pure commonmark, we also support GFM tables (defined with pipes |), such as:
| Table Type | Description |
|:--|:----|
|Commonmark (HTML)| Tables described in pure HTML |
|Github Flavour Markdown (GFM)| Tables described with pipes: easier to read/edit, but limited in complexity|
which produces output like:
| Table Type | Description |
|---|---|
| Commonmark (HTML) | Tables described in pure HTML |
| Github Flavour Markdown (GFM) | Tables described with pipes: easier to read/edit, but limited in complexity |
For simple tables these are much more convenient for working with. They are limited to single lines of text (i.e. each row must be on a single line), but you can, for example use <br> tags to create line breaks and effectively split up paragraphs within cells, if necessary. You can also continue to use HTML tables when you really need more complexity (but you can also consider whether there is a better way of presenting the data).
Bilbliographic references are currently not supported in the markdown version of DHIS 2 documentation.
The DHIS 2 documentation has been translated into a number of different languages including French, Spanish and Portuguese. If you would like to create a translation of the documentation or contribute to one of the existing translations, please contact the DHIS 2 documentation team at the email provided at the end of this chapter.
Once you have finished editing your document, you will need to commit your changes back to GitHub. Open up a command prompt on Windows or a shell on Linux, and navigate to the folder where you have placed your documentation. If you have added any new files or folders to your local repository, you will need to add them to the source tree with the git add command, followed by the folder or file name(s) that you have added. Be sure to include a descriptive comment with your commit.
git commit -m "Improved documentation on organisation unit imports with CSV."
Finally, you should push the changes back to the repository with git push origin mybranch, where "mybranch" is the name of the branch which you created when you checked out the document source or which you happent o be working on. In order to do this, you will need the necessary permissions to commit to the repository.When you have committed your changes, you can issue a pull request to have them merged with the master branch. You changes will be reviewed by the core documentation team and tested to ensure they do not break the build, as well as reviwed for quality. As mentioned previously, you can also push your changes to your own GitHub repo, if you do not have access to the main repo, and submit a pull request for your changes to be merged.
If you have any questions, or cannot find that you can get started, just raise a question on our development community of practice.
This section attempts to capture the markdown and extensions that are supported for DHIS 2 documentation, and to provide a preview of the applied styles.
Body text.
___

---

***
This is bold text
This is bold text
This is italic text
This is italic text
Strikethrough
Basic blockquote
Blockquotes can also be nested...
...by using additional greater-than signs right next to each other...
...or with spaces between arrows.
Note that nested blockquotes have a special style applie to help to indicate hierarchical structures.
You can also manually apply the nested style to single blockquotes
> Basic blockquote

> Blockquotes can also be nested...
>> ...by using additional greater-than signs right next to each other...
> > > ...or with spaces between arrows.

Note that nested blockquotes have a special style applie to help to indicate hierarchical structures.

> You can also manually apply the nested style to single blockquotes { .nested }
Inline code
Inline highlighted code var test = 0; made within
`#!js var test = 0;`
Indented code
// Some comments
line 1 of code
line 2 of code
line 3 of code
Block code "fences"
Sample text here...
Syntax highlighting
var foo = function (bar) {
  return bar++;
};

console.log(foo(5));
Long lines
Buffalo buffalo (the animals called "buffalo" from the city of Buffalo) [that] Buffalo buffalo buffalo (that the animals from the city bully) buffalo Buffalo buffalo (are bullying these animals from that city).
Highlight specific lines
def bubble_sort(items):
    for i in range(len(items)):
        for j in range(len(items) - 1 - i):
            if items[j] > items[j + 1]:
                items[j], items[j + 1] = items[j + 1], items[j]
``` py hl_lines="2 3"
def bubble_sort(items):
    for i in range(len(items)):
        for j in range(len(items) - 1 - i):
            if items[j] > items[j + 1]:
                items[j], items[j + 1] = items[j + 1], items[j]
```
Add a title
def bubble_sort(items):
    for i in range(len(items)):
        for j in range(len(items) - 1 - i):
            if items[j] > items[j + 1]:
                items[j], items[j + 1] = items[j + 1], items[j]
``` py hl_lines="2 3" title="bubble_sort.py"
def bubble_sort(items):
    for i in range(len(items)):
        for j in range(len(items) - 1 - i):
            if items[j] > items[j + 1]:
                items[j], items[j + 1] = items[j + 1], items[j]
```
Unordered
+, -, or *Marker character change forces new list start:
Facilisis in pretium nisl aliquet
an indented code block
Nulla volutpat aliquam velit
Ordered
Integer molestie lorem at massa
You can use sequential numbers...
1.Start numbering with offset?:
Multi-Levels
a block of code at the third level
| Return Parameter | Description |
|---|---|
| aoc | Attribute option combination identifier |
| pe | Period identifier |
| ou | Organisation Unit identifier |
| permissions | The permissions: 'mayApprove', 'mayUnapprove', 'mayAccept', 'mayUnaccept', and 'mayReadData' (same definitions as for get single approval status.) |
| state | One of the data approval states (same as for get single approval status.) |
| wf | Data approval workflow identifier |
Right aligned and centred columns
| Return Parameter | Description |
|---|---|
| aoc | Attribute option combination identifier |
| pe | Period identifier |
| ou | Organisation Unit identifier |
| permissions | The permissions: 'mayApprove', 'mayUnapprove', 'mayAccept', 'mayUnaccept', and 'mayReadData' (same definitions as for get single approval status.) |
| state | One of the data approval states (same as for get single approval status.) |
| wf | Data approval workflow identifier |
Autoconverted link https://github.com/dhis2
Images are shown full size with a max-width of 100%

Adding a title automatically causes rendering as a figure. Inline classes and styles can be added in curly brackets.
{ .center width=50% }
Youtube videos can be embedded in a similar way to images. Simply provide the youtube embed link instead of an image file

Note
Be sure to use the "embed" youtube link!
As with images, adding a title will render the video as a figure

The following admonitions are supported, with pre-defined styles, in addition to general blockquotes.
Note
A note contains additional information which should be considered or a reference to more information which may be helpful.
> **Note**
>
> A note contains additional information which should be considered or a
> reference to more information which may be helpful.
Tip
A tip can be a useful piece of advice, such as how to perform a particular task more efficiently.
> **Tip**
>
> A tip can be a useful piece of advice, such as how to perform a
> particular task more efficiently.
Important
Important information should not be ignored, and usually indicates something which is required by the application.
> **Important**
>
> Important information should not be ignored, and usually indicates
> something which is required by the application.
Caution
Information contained in these sections should be carefully considered, and if not heeded, could result in unexpected results in analysis, performance, or functionality.
> **Caution**
>
> Information contained in these sections should be carefully
> considered, and if not heeded, could result in unexpected results in
> analysis, performance, or functionality.
Warning
Information contained in these sections, if not heeded, could result in permanent data loss or affect the overall usability of the system.
> **Warning**
>
> Information contained in these sections, if not heeded, could result
> in permanent data loss or affect the overall usability of the system.
Work In Progress
Information contained in these sections, will indicate that these are issues or errors we are currently working on.
> **Work In Progress**
>
> Information contained in these sections, will indicate that these are issues or errors we are currently working on.
Example
A way to bring special attention to examples.
Admonitions can include a code blocks
var foo = function (bar) {
  return bar++;
};

console.log(foo(5));
> **Example**
>
> A way to bring special attention to examples.
>
> Admonitions can include a code blocks
>
> ```js
> var foo = function (bar) {
>   return bar++;
> };
>
> console.log(foo(5));
> ```
MathJax provides support for displaying mathematical content in the browser with support for mathematical typesetting in different notations (e.g. LaTeX, MathML, AsciiMath).
Blocks must be enclosed in \[ ... \] or $$ ... $$ or \begin{} ... \end{} on separate lines.
Inline blocks must be enclosed in $...$ or \(...\).
The wave equation for u is
where \nabla^2 is the spatial Laplacian and c is constant.
This equation p(x|y) = \frac{p(y|x)p(x)}{p(y)} is inline.
The homomorphism f is injective if and only if its kernel is only the singleton set e_G, because otherwise \exists a,b\in G with a\neq b such that f(a)=f(b).
\[
Indicator = {\frac{BcgVaccinationsUnder1Year}{TargetPopulationUnder1Year}} \times 100
\]

\[3 < 4\]

\begin{align}
    p(v_i=1|\mathbf{h}) & = \sigma\left(\sum_j w_{ij}h_j + b_i\right) \\
    p(h_j=1|\mathbf{v}) & = \sigma\left(\sum_i w_{ij}v_i + c_j\right)
\end{align}

The wave equation for \( u \) is

\begin{equation}
  \frac{\partial^2u}{\partial t^2} = c^2\nabla^2u
\end{equation}

where \( \nabla^2 \) is the spatial Laplacian and \( c \) is constant.

This equation $p(x|y) = \frac{p(y|x)p(x)}{p(y)}$ is inline.

The homomorphism $f$ is injective if and only if its kernel is only the
singleton set $e_G$, because otherwise $\exists a,b\in G$ with $a\neq b$ such that $f(a)=f(b)$.
| Markdown | Result |
|---|---|
(tm) | ™ |
(c) | (c) |
(r) | ® |
c/o | ℅ |
+/- | ± |
--> | → |
<-- | ← |
<--> | ↔ |
=/= | ≠ |
1/4, etc. | ¼, etc. |
1st 2nd etc. | 1st 2nd etc. |
- 19^th^
- H~2~O
++Inserted text++
Marked text
Footnote 1 link1.
Footnote 2 link2.
Inline footnote^[Text of inline footnote] definition.
Duplicated footnote reference2.
Definition 2
{ some code, part of Definition 2 }
Third paragraph of definition 2.
Keys is an extension to make entering and styling keyboard key presses easier. Syntactically, Keys is built around the + symbol. A key or combination of key presses is surrounded by ++ with each key press separated with a single +.
Example
Ctrl+Alt+Del.
++ctrl+alt+delete++
The following key rendering is supported.
| Name | Display | Aliases |
|---|---|---|
alt | Alt | |
left-alt | Left Alt | lalt |
right-alt | Right Alt | ralt |
alt-graph | AltGr | altgr |
command | Cmd | cmd |
left-command | Left Command | lcommand, lcmd, left-cmd |
right-command | Right Command | rcommand, rcmd, right-cmd |
control | Ctrl | ctrl |
left-control | Left Ctrl | lcontrol, lctrl, left-ctrl |
right-control | Right Ctrl | rcontrol, rctrl, right-ctrl |
function | Fn | fn |
meta | Meta | |
left-meta | Left Meta | lmeta |
right-meta | Right Meta | rmeta |
option | Option | opt |
left-option | Left Option | loption, lopt, left-opt |
right-option | Right Option | roption, ropt, right-opt |
shift | Shift | |
left-shift | Left Shift | lshift |
right-shift | Right Shift | rshift |
super | Super | |
left-super | Left Super | lsuper |
right-super | Right Super | rsuper |
windows | Win | win |
left-windows | Left Win | lwindows, left-win, lwin |
right-windows | Right Win | rwindows, right-win, rwin |
| Name | Display | Aliases |
|---|---|---|
f1 | F1 | |
f2 | F2 | |
f3 | F3 | |
f4 | F4 | |
f5 | F5 | |
f6 | F6 | |
f7 | F7 | |
f8 | F8 | |
f9 | F9 | |
f10 | F10 | |
f11 | F11 | |
f12 | F12 | |
f13 | F13 | |
f14 | F14 | |
f15 | F15 | |
f16 | F16 | |
f17 | F17 | |
f18 | F18 | |
f19 | F19 | |
f20 | F20 | |
f21 | F21 | |
f22 | F22 | |
f23 | F23 | |
f24 | F24 |
| Name | Display | Aliases |
|---|---|---|
0 | 0 | |
1 | 1 | |
2 | 2 | |
3 | 3 | |
4 | 4 | |
5 | 5 | |
6 | 6 | |
7 | 7 | |
8 | 8 | |
9 | 9 | |
a | A | |
b | B | |
c | C | |
d | D | |
e | E | |
f | F | |
g | G | |
h | H | |
i | I | |
j | J | |
k | K | |
l | L | |
m | M | |
n | N | |
o | O | |
p | P | |
q | Q | |
r | R | |
s | S | |
t | T | |
u | U | |
v | V | |
w | W | |
x | X | |
y | Y | |
z | Z | |
space | Space | spc |
| Name | Display | Aliases |
|---|---|---|
backslash | \ | |
bar | | | pipe |
brace-left | { | open-brace |
brace-right | } | close-bracket |
bracket-left | [ | open-bracket |
bracket-right | ] | close-bracket |
colon | : | |
comma | , | |
double-quote | " | dblquote |
equal | = | |
exclam | ! | exclamation |
grave | ` | grave-accent |
greater | > | greater-than, gt |
less | < | less-than, lt |
minus | - | hyphen |
period | . | |
plus | + | |
question | ? | question-mark |
semicolon | ; | |
single-quote | ' | |
slash | / | |
tilde | ~ | |
underscore | _ |
| Name | Display | Aliases |
|---|---|---|
arrow-up | Up | up |
arrow-down | Down | down |
arrow-left | Left | left |
arrow-right | Right | right |
page-up | Page Up | prior, page-up, pg-up |
page-down | Page Down | next, page-dn, pg-dn |
home | Home | |
end | End | |
tab | Tab | tabulator |
| Name | Display | Aliases |
|---|---|---|
backspace | Backspace | back, bksp |
delete | Del | del |
insert | Ins | ins |
| Name | Display | Aliases |
|---|---|---|
break | Break | cancel |
caps-lock | Caps Lock | capital, cplk |
clear | Clear | clr |
eject | Eject | |
enter | Enter | return |
escape | Esc | esc |
help | Help | |
print-screen | Print Screen | prtsc |
scroll-lock | Scroll Lock | scroll |
| Name | Display | Aliases |
|---|---|---|
num0 | Num 0 | |
num1 | Num 1 | |
num2 | Num 2 | |
num3 | Num 3 | |
num4 | Num 4 | |
num5 | Num 5 | |
num6 | Num 6 | |
num7 | Num 7 | |
num8 | Num 8 | |
num9 | Num 9 | |
num-asterisk | Num * | multiply |
num-clear | Num Clear | |
num-delete | Num Del | num-del |
num-equal | Num = | |
num-lock | Num Lock | numlk, numlock |
num-minus | Num - | subtract |
num-plus | Num + | add |
num-separator | Num . | decimal, separator |
num-slash | Num / | divide |
num-enter | Num Enter |
| Name | Display | Aliases |
|---|---|---|
backtab | Back Tab | bktab |
browser-back | Browser Back | |
browser-favorites | Browser Favorites | favorites |
browser-forward | Browser Forward | forward |
browser-home | Browser Home | |
browser-refresh | Browser Refresh | refresh |
browser-search | Browser Search | search |
browser-stop | Browser Stop | |
copy | Copy | |
context-menu | Menu | apps, menu |
fingerprint | Fingerprint | fingerprint |
mail | launch-mail | |
media | Media | launch-media |
media-next-track | Next Track | next-track |
media-pause | Pause | pause |
media-play | Play | play |
media-play-pause | Play/Pause | play-pause |
media-prev-track | Previous Track | prev-track |
media-stop | Stop | stop |
power | Power | |
print | ||
reset | Reset | |
select | Select | |
sleep | Sleep | |
volume-down | Volume Down | vol-down |
volume-mute | Mute | mute |
volume-up | Volume Up | vol-up |
zoom | Zoom |
| Name | Display | Aliases |
|---|---|---|
left-button | Left Button | lbutton |
middle-button | Middle Button | mbutton |
right-button | Right Button | rbutton |
x-button1 | X Button 1 | xbutton1 |
x-button2 | X Button 2 | xbutton2 |
Several sets of emojies are supported by entering the emoji name surrounded by colons: e.g :smile:. Below are list of common sets, those that are not rendered are currently not supported.
:bowtie: 


 :neckbeard:


 :person_with_pouting_face: :person_frowning:


 :person_with_blond_hair:


 :octocat: :squirrel:


 :black_square: :white_square:


 :shipit:
Mermaid.js diagrams are now supported natively.
Flowcharts are diagrams that represent workflows or processes. The steps are rendered as nodes of various kinds and are connected by edges, describing the necessary order of steps:
graph LR
A[Start] --> B{Error?};
B -->|Yes| C[Hmm...];
C --> D[Debug];
D --> B;
B ---->|No| E[Yay!];
    ``` mermaid
    graph LR
    A[Start] --> B{Error?};
    B -->|Yes| C[Hmm...];
    C --> D[Debug];
    D --> B;
    B ---->|No| E[Yay!];
    ```
Sequence diagrams describe a specific scenario as sequential interactions between multiple objects or actors, including the messages that are exchanged between those actors:
%%{init: {'mirrorActors': false } }%%

sequenceDiagram

    autonumber
    participant G as package URL<br><br>(github/S3)
    participant M as metatran
    participant T as transifex
    participant F as filesystem<br><br>(path)
    G->>M: package file
    T->>M: pull latest translation strings
    opt
        note over M: swap base language
    end

    opt
        note over M: include/exclude languages
    end
    M->>+F: New package file
    ``` mermaid
    %%{init: {'mirrorActors': false } }%%

    sequenceDiagram

        autonumber
        participant G as package URL<br><br>(github/S3)
        participant M as metatran
        participant T as transifex
        participant F as filesystem<br><br>(path)
        G->>M: package file
        T->>M: pull latest translation strings
        opt
            note over M: swap base language
        end

        opt
            note over M: include/exclude languages
        end
        M->>+F: New package file
    ```
Git graphs provide a pictorial representation of git commits and git actions on various branches.
%%{init: { 'logLevel': 'debug', 'theme': 'dark', 'gitGraph': {
'showBranches': true,
'showCommitLabel':false,
'mainBranchName': 'master'}}
}%%

gitGraph
    commit
    commit
    branch "2.39"
    checkout "2.39"
    commit
    checkout master
    commit
    checkout "2.39"
    branch "patch/2.39.0"
    checkout "patch/2.39.0"
    commit
    checkout master
    commit
    checkout "2.39"
    commit
    checkout "patch/2.39.0"
    commit tag: "2.39.0"
    checkout master
    commit
    checkout "2.39"
    commit
    commit
    checkout "master"
    commit
    checkout "2.39"
    branch "patch/2.39.1"
    checkout "patch/2.39.1"
    commit
    commit tag: "2.39.1"
    checkout "2.39"
    commit
    checkout "patch/2.39.1"
    branch "hotfix 2.39.1.1"
    commit tag: "2.39.1.1"
    ``` mermaid
    %%{init: { 'logLevel': 'debug', 'theme': 'dark', 'gitGraph': {
    'showBranches': true,
    'showCommitLabel':false,
    'mainBranchName': 'master'}}
    }%%

    gitGraph
        commit
        commit
        branch "2.39"
        checkout "2.39"
        commit
        checkout master
        commit
        checkout "2.39"
        branch "patch/2.39.0"
        checkout "patch/2.39.0"
        commit
        checkout master
        commit
        checkout "2.39"
        commit
        checkout "patch/2.39.0"
        commit tag: "2.39.0"
        checkout master
        commit
        checkout "2.39"
        commit
        commit
        checkout "master"
        commit
        checkout "2.39"
        branch "patch/2.39.1"
        checkout "patch/2.39.1"
        commit
        commit tag: "2.39.1"
        checkout "2.39"
        commit
        checkout "patch/2.39.1"
        branch "hotfix 2.39.1.1"
        commit tag: "2.39.1.1"
    ```
For small changes to a document, it's actually very easy for anyone to submit changes without going through the whole process of raising a JIRA issue against DHIS 2. This can be done directly in GitHub and requires no knowledge of git. All you need is a GitHub account!.
This section is intended as a walk-through guide to making simple changes.
In this scenario, we are reading the documentation and find a typo (the word manditory should be mand**a**tory):

This is in the chapter on "Using the Capture app" in the DHIS 2 User Manual. We want to fix this, so...
We log on to GitHub: https://github.com/dhis2/dhis2-docs
If you don't have an account, follow the Sign up link on the GitHub site
(public accounts are free) 
Now we need to find the chapter that we want to change in GitHub. We simply go to the page we want to change on the DHIS2 documentation site and scroll to the top of the page. On the right side, above the main content, is an edit (pencil) icon. For pages with multiple versions, we select the one we want before editing; here we have selected the master version.
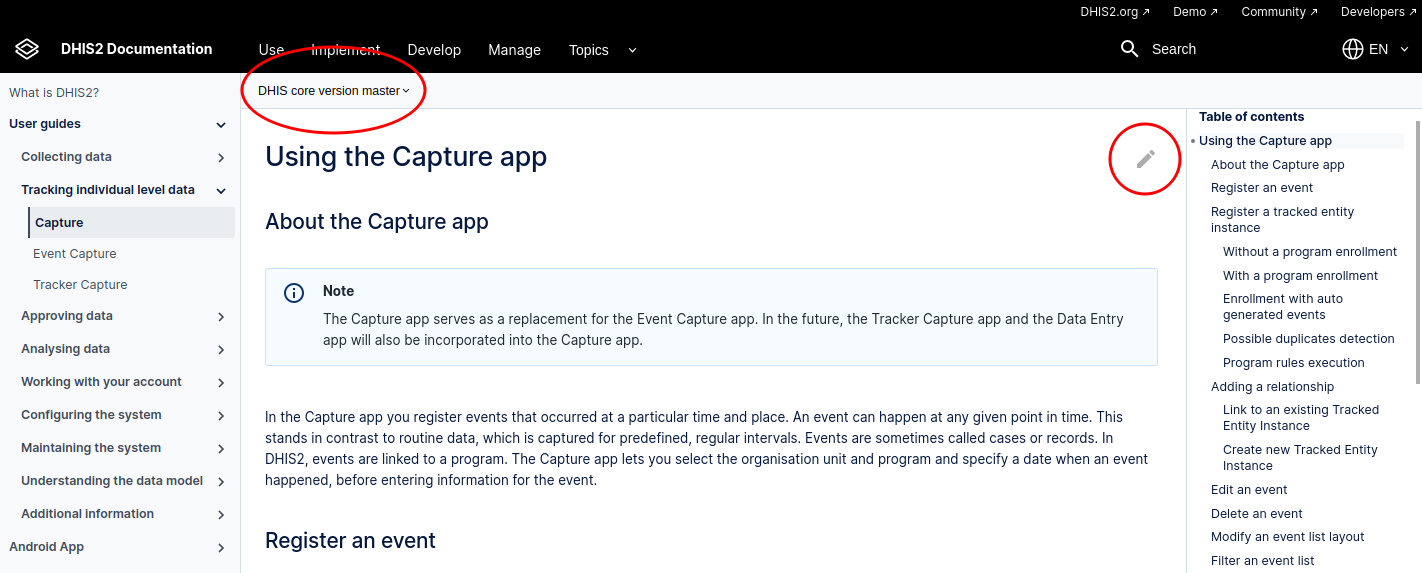
Clicking the edit icon on the docs site takes us directly to the relevant file in GitHub.
From here we can choose to edit the file (pencil icon). An edit panel is displayed:
Here we have found and highlighted the offending word! 
Don't worry about the blue warning at the top that says we don't have write access to the file!
We can make the change and preview it in the Preview changes tab if we want.
Here is the preview: 
Finally we can submit our change as a Pull Request (PR). We add a title for the change (and an optional description) and click Propose file change 
a. We see a summary of our changes and click Create pull request: 
All done!
A pull request is now in the system, which can be easily reviewed and accepted by the DHIS 2 team. 
Once accepted, the change will appear in the next build of the documentation!
Go to: https://jira.dhis2.org.
Create an account with your name and email address.
Tip
Uncertain whether something is a missing feature, a bug or deprecated? We'd really appreciate that you ask on the developer list before reporting a bug directly. Thanks!
Click Create in the top menu.
Select a Project from the list.
Select an Issue Type:
Improvement - if you’d like to tell us about something that could be better such as usability or design suggestions.
New feature - if you want to suggest a feature.
Task - if you’ve been asked to work on a DHIS2 task.
Bug - if you’ve found something that needs fixing.
Epic - if you’d like to submit an idea for a new DHIS2 area such as an app. Epic is used for issues more complex than new features.
Click Create.
Tip
To create several issues in one go, select Create another.
Fill out the issue form. Please give us plenty of context! Include server logs, JavaScript console logs, the DHIS2 version and the web browser you’re using.
Click Issues > Search for issues.
If you click Advanced, you can order your search criteria using the predefined fields. You can also enter search terms in the search field. See also: Search syntax for text fields.
You can save your search results as filters to get back to them faster. A filter is very similar to a favorite. We’ve created filters for features intended for release numbers 2.26, 2.27 and 2.28 and for all open bugs.
To create a filter, go to Issues > Search for issues.
Add filters to your search such as:
Project – the main software project is DHIS 2.
Type – you can filter by Standard Issue Types such as New Features, Improvements, Bugs or Epic or Sub-Task Issue Types.
Status – filter by To Do (not started) and Done, for example.
Version - click More > All Criteria > Fix version to filter by DHIS2 release number.
Internal- click More > Internal feature to exclude low-level (back end) features from your search.
Click Save As. This button is at the top of the Search pane.

Enter a name for your search filter and click Submit. Your filter is now available in Favorite Filters. Use the arrow to modify your filter. Your filter is also available on the System Dashboard.

To add a filter to your profile, click Issues > Manage filters and click the star icon next to each filter.
Click the cross to remove search filter terms you previously added from your search.
To share information, clarify requirements, or discuss details about an issue, do this using issue comments.
Select the issue you want to comment.
In the Issue Detail view click Comment and enter your text.
To email others about your comment, simply enter @User's Name in the comment field. An email will be sent to the users' email addresses that are registered with their JIRA accounts.
Click Add.
The DHIS2 community uses a set of collaboration and coordination platforms for information and provision of downloads, documentation, development, source code, functionality specifications, bug tracking. This chapter will describe these in more detail.
The DHIS2 home page is found at https://www.dhis2.org/. The Downloads page provides links to downloads of the DHIS2 WAR files, the Android Capture mobile application, the source code, sample databases, and links to additional resources and guides. Please note that we provide maintenance patch updates for the last three versions of DHIS2. We recommend that you check back regularly on the download page and update your online server with the latest stable patch for your DHIS2 version. The version information and build revision can be found under the About DHIS2 page inside your DHIS2 instance.
The navigation menu provides clear descriptions of the content of the site, and a search field in the top header allows you to easily search across the website.
The primary DHIS2 collaboration platform is the DHIS2 Community of Practice. The site can be accessed at https://community.dhis2.org/ and is based on the Discourse platform.
The Community of Practice is used to facilitate community support for DHIS2 user issues, as well as to help identify potential bugs in existing software versions and feature requests for future versions. It is also a place where members of the community can share stories, best practices, and challenges from their DHIS2 implementations, collaborate with others on projects, and offer their services to the larger community. Users can set up their Community of Practice accounts based on individual preferences for notification settings, and can reply to existing topics by email.
The Support section of the Community of Practice includes all topics that were created using DHIS2's previous collaboration platform, Launchpad, which is no longer active.
Bugs identified on the Community of Practice should be submitted to the DHIS2 core team on Jira
If you encounter a problem while using DHIS2, take these steps first:
Clear the web browser cache (also called history or browsing data) completely (you can use the Browser Cache Cleaner app in DHIS2; select all options before clearing).
Clear the DHIS2 application cache: Go to Data administration -> Maintenance check "Clear application cache" and click "PERFORM MAINTENANCE".
If the problem persists, go to the Community of Practice and use key terms to search for topics that other users have posted which describe similar issues to find out if your issue has already been reported and resolved. If you are not able to find a thread with a similar issue, you should create a new topic in the Support category. Members of the community and the DHIS2 team will respond to attempt to assist with resolving your issue.
If the response you received in the Community of Practice indicates that you have identified a bug, you should post a bug report on the DHIS2 Jira.
Jira is the place to report issues, and to follow requirements, progress and roadmap for the DHIS2 software. The DHIS2 Jira site can be accessed at https://jira.dhis2.org/.
If you find a bug in DHIS2 you can report it on Jira by navigating to the DHIS2 Jira homepage, clicking create in the top menu, selecting "bug" as the issue type, and filling out the required fields.
For the developers to be able to help you need to provide as much useful information as possible:
DHIS2 version: Look in the Help -> About page inside DHIS2 and provide the version and build revision.
Web browser including version.
Operating system including version.
Servlet container / Tomcat log: Provide any output in the Tomcat log (typically catalina.out) related to your problem.
Web browser console: In the Chrome web browser, click F12, then "Console", and look for exceptions related to your problem.
Actions leading to the problem: Describe as clearly as possible which steps you take leading to the problem or exception.
Problem description: Describe the problem clearly, why you think it is a problem and which behavior you would expect from the system.
Your bug report will be investigated by the Testing/QA team and be given a status. If valid its status will be set to "TO DO" and will be visible for the development team in their planning of milestones and releases. It can then be assigned to a developer and be fixed. Note that bugfixes are incorporated into the master branch and branches of up to the three latest (supported) DHIS2 releases - so more testing and feedback to the developer teams leads to higher quality of your software.
If you want to suggest new functionality to be implemented in DHIS2 you should first start a discussion on the Community of Practice to get feedback on your idea and confirm that the functionality you are suggesting does not already exist. Once you have completed these steps, you can submit a feature request on DHIS2 Jira by clicking "Create" in the top menu and selecting "Feature" as the issue type. Your feature request will be considered by the core development team and if accepted it will be assigned a developer and release version. DHIS2 users can vote to show support for feature requests that have been submitted. Existing feature requests can be browsed by using the "filter" function on Jira.
The various source code branches including master and release branches can be browsed at https://github.com/dhis2