O dimenzích dat
Datové dimenze: Základní stavební bloky v DHIS2
Datová hodnota v DHIS2 je popsána alespoň třemi dimenzemi: 1) datový prvek, 2) organizační jednotka a 3) období. Tyto dimenze tvoří základní stavební kameny datového modelu.

As an example, if you want to know how many children that were immunised for measles in Gerehun CHC in December 2014, the three dimensions which describe that value are the data element "Measles doses given", the organisation unit "Gerehun CHC", and the period "December 2014". All data values have at least these three dimensions describing what, where, and when.
In addition to the data element, organisation unit, and period dimensions, data values may also be associated with additional data dimensions. A common use of this feature is to describe data values which are reported by multiple partners in the same location for the same data element and time period. In principle, it can be used as a "free-form" dimension, to describe multiple observations of the same phenomena at the same place and time. For more information about this, see Chapter 34: Additional data dimensions.
| OrganisationUnit | Datový prvek | Období | Hodnota |
|---|---|---|---|
| Gerehun CHC | Podané dávky spalniček | Prosinec-09 | 22 |
| Tugbebu CHP | Podané dávky spalniček | Prosinec-09 | 18 |
Datové prvky: dimenze co
Kategorie datových prvků
The data element mentioned above ,"Measles doses given", can be further disaggregated into by combinations of data element categories. Each system administrator of DHIS2 is free to define any data element category dimensions for data elements. There are however, certain best practices which should generally be followed.
Given the example of Measles vaccination, if you want to know whether these vaccines were given at the facility (fixed) or out in the community as part of the outreach services then you could add a dimension called—e.g., "Place of service", with the two possible options "Fixed" and "Outreach". Then all data collected on measles immunisation would have to be disaggregated along these to options. In addition to this you might be interested in knowing how many of these children who were under 1 year or above 1 year of age. If so you can add an Age dimension to the data element with the two possible options "\<1 y" and ">1 y". This implies further detail on the data collection process. You can also apply both categories "Place of service" and "Age" and combine these into a data element category combination e.g. called "EPI disaggregation". You would then be able to look at four different more detailed values in stead of only one as in the example above for the data element "Measles doses given": 1) "Fixed and \<1 y, 2) Fixed and >1 y, 3) Outreach and \<1 y, and 4) Outreach and >1 y. This adds complexity to how data is collected by the health facilities, but at the same time opens up for new possibilities of detailed data analysis of Measles immunisation.
Tabulka: Příklad podrobného uložení hodnot dat při použití kategorií datových prvků „Místo služby“ a „Věk“ (zjednodušeno pro čitelnost oproti skutečné databázové tabulce)
| OrganisationUnit | Datový prvek | Místo služby | Věk | Období | Hodnota |
|---|---|---|---|---|---|
| Gerehun CHC | Podané dávky spalniček | Pevný | \<1 r | Prosinec-09 | 12 |
| Gerehun CHC | Podané dávky spalniček | Dosah | \<1 r | Prosinec-09 | 4 |
| Gerehun CHC | Podané dávky spalniček | Pevný | >1 r | Prosinec-09 | 4 |
| Gerehun CHC | Podané dávky spalniček | Dosah | >1 r | Prosinec-09 | 2 |
| Tugbebu CHP | Podané dávky spalniček | Pevný | \<1 r | Prosinec-09 | 10 |
| Tugbebu CHP | Podané dávky spalniček | Dosah | \<1 r | Prosinec-09 | 4 |
| Tugbebu CHP | Podané dávky spalniček | Pevný | >1 r | Prosinec-09 | 3 |
| Tugbebu CHP | Podané dávky spalniček | Dosah | >1 r | Prosinec-09 | 1 |
Sady skupin datových prvků
While the data element categories and their options described above provide the level of detail (disaggregation) at the point of data collection and how data values get stored in the database, the data element group sets and groups can be used to add more information to data elements after data collection. As an example, if you are analysing many data elements at the same time in a report, you would want to group these based on some criteria. Instead of looking at all the data captured in a form for immunisation and nutrition, you might want to separate or group data elements along a programme dimension (known as a data element group set in DHIS2) where "Immunisation" (or EPI) and "Nutrition" would be the two groups.
Expanding the report to include data from other programs or larger themes of health data would mean more groups to such a group set dimension, like "Malaria", "Reproductive Health", "Stocks". For this example, you would create a data element group set called "Programme" (or whatever name you find appropriate), and to represent the different programmes in this dimension you would define data elements groups called "EPI", "Nutrition", "Malaria", "Reproductive health" and so on, and add all these groups to the "Programme" group set. To link or tag the data element "Measles doses given" to such a dimension you must (in our example) add it to the "EPI" group. Which groups you add "Measles doses given" to does not affect how health facilities collect the data, but adds more possibilities to your data analysis. So for the group set dimensions there are three levels; the group set (e.g. "Programme"), the group (e.g. "EPI"), and the data element (e.g. "Measles doses given").
Indicators can be grouped into indicator groups and further into indicator group sets (dimensions) in exactly the same way as data elements.
| OrganisationUnit | Datový prvek | Program | Období | Hodnota |
|---|---|---|---|---|
| Gerehun CHC | Podané dávky spalniček | EPI | Prosinec-09 | 22 |
| Gerehun CHC | Vitamin A podán | Výživa | Prosinec-09 | 16 |
| Tugbebu CHP | Podané dávky spalniček | EPI | Prosinec-09 | 18 |
| Tugbebu CHP | Vitamin A podán | Výživa | Prosinec-09 | 12 |
| Gerehun CHC | Nové případy malárie | Malárie | Prosinec-09 | 32 |
| Tugbebu CHP | Nové případy malárie | Malárie | Prosinec-09 | 23 |
Organizační jednotky: dimenze kde
Organisation units in DHIS2 should typically represent a location, such as a Community Health Centre or referral hospitals, or an administrative unit like "MoHS Sierra Leone", "Bo District" or "Baoma Chiefdom". In non-health sector applications, they could be "schools" or "water points". Orgunits are represented in a default hierarchy, usually the default administrative hierarchy of a country or region, and are therefore assigned an organisational level. As an example, Sierra Leone has four organisation unit levels; National, District, Chiefdom, and Facility, and all orgunits are linked to one of these levels. An orgunit hierarchy in DHIS2 can have any number of levels. Normally data is collected at the lowest level, at the health facility, but can be collected at any level within the hierarchy, such as both the districts as well as the facility level.
Při navrhování zpráv na vyšších úrovních s daty agregovanými na úrovni okresů nebo provincií použije DHIS2 hierarchickou strukturu k agregaci všech dat zdravotnických zařízení pro danou jednotku na jakékoli úrovni. Úroveň organizační jednotky zachycující data vždy představuje nejnižší úroveň podrobností, kterou lze při analýze dat použít, a organizační úrovně definují dostupné úrovně agregace podél geografické dimenze.
Skupiny a sady skupin organizačních jednotek
While facility level is typically the lowest geographical level for disaggregation in DHIS2, there are ways to flexibly group organisation units into any number of dimensions by using the organisation unit groups and group set functionality. As an example, if all facilities are given an official type like "Community health center" or "District Hospital, it is possible to create an organisation unit group set called "Type" and add groups with the names of the types mentioned above. In order for the group sets to function properly in analysis, each organisation unit should be a member of a single group (compulsory and exclusive) within a group set. Stated somewhat differently, a facility should not be both a "Community health center" as well as a "District hospital".
Dědění hodnoty sady skupin organizačních jednotek
You can improve the completeness of your aggregated data by inheriting the settings of a "parent" organisation unit in your organisation unit hierarchy. This is particularly helpful if you are aggregating the data of more than 100 organisation units. See the Maintenance app documentation for more details.
Alternativní hierarchie organizačních jednotek - pokročilé používání sad skupin a skupin
A more advanced use of organisation unit group sets is to create alternative hierarchies e.g. use administrative borders from other ministries. In Sierra Leone that could mean an alternative hierarchy of 1:MoHS, 2:Districts, and 3: Local councils, instead of the four-level hierarchy with chiefdoms and facilities. For instance, if all facilities are linked to a specific local council, it would be possible to look at data aggregated by local council instead of chiefdom. Then you would first need to create a group set called "Local council" and then create one organisation unit group for every local council, and finally link all facilities to their corresponding local council group.
| Okres | Typ organizační jednotky | Datový prvek | Období | Hodnota |
|---|---|---|---|---|
| Bo | CHC | Podané dávky spalniček | Prosinec-09 | 121 |
| Bo | CHP | Podané dávky spalniček | Prosinec-09 | 98 |
| Bo | MCHP | Podané dávky spalniček | Prosinec-09 | 87 |
| Bombali | CHC | Podané dávky spalniček | Prosinec-09 | 110 |
| Bombali | CHP | Podané dávky spalniček | Prosinec-09 | 67 |
| Bombali | MCHP | Podané dávky spalniček | Prosinec-09 | 59 |
Osvědčené postupy při používání sad skupin a skupin
As mentioned above, all organisation units should be a member of a single group within a group set. If an organisation unit is not present in any group or is present in multiple group members in a group set, this can lead to unexpected results in the analysis modules. DHIS2 has integrity checks to identify organisation units which are not present in any organisation unit group set member, or which is present in multiple groups.
Period: the when dimension
The period dimension becomes an important factor when analysing data over time e.g. when looking at cumulative data, when creating quarterly or annual aggregated reports, or when doing analysis that combines data with different characteristics like monthly routine data, annual census/population data or six-monthly staff data.
Druhy období
In DHIS2, periods are organised according to a set of fixed period types described below. The following list is for the default ISO 8601 calendar type.
-
Denně
-
Weekly: The system supports various weekly period types, with Monday, Wednesday, Thursday, Saturday and Sunday as the first day of the week. You collect data through data sets configured to use the desired weekly period type. The analytics engine will attribute weekly data to the month which contains four days or more of the week.
-
Bi-weekly: Two week periods beginning with the first week of the year.
-
Měsíční: Odkazuje na standardní kalendářní měsíce.
-
Dvouměsíční: Dvouměsíční období začínající v lednu.
-
Čtvrtletní: Standardní čtvrtletí ISO, počínaje lednem.
-
Šestiměsíční: Šestiměsíční období začínající v lednu
-
Roční: Týká se kalendářního roku.
-
Financial April: Financial year period beginning on April 1st and ending on March 31st of the calendar next year
-
Financial July: Financial year period beginning on July 1st and ending on June 31st of the calendar next year
-
Financial Oct: Financial year period beginning on October 1st and ending on September 31st of the calendar next year
-
Six-monthly April: Six-month periods beginning on April 1st with a duration of six calendar months.
Obecně platí, že všechny organizační jednotky by měly shromažďovat stejná data se stejnou frekvencí nebo periodicitou. Formulář pro zadávání údajů je proto spojen s jedním typem období, aby bylo zajištěno, že data budou v celé zemi vždy shromažďována podle správné a stejné periodicity.
It is possible however to collect the same data elements using different period types by assigning the same data elements to multiple data sets with different period types, however then it becomes crucial to make sure no organisation unit is collecting data using both data sets/period types as that would create overlap and duplication of data values. If configured correctly the aggregation service in DHIS2 will aggregate the data together, e.g. the monthly data from one part of the country with quarterly data from another part of the country into a national quarterly report. For simplicity and to avoid data duplication it is advised to use the same period type for all organisation units for the same data elements when possible.
Relativní období
In addition to the fixed period types described in the previous section, DHIS2 also support relative periods for use in the analysis modules.
When creating analytical resources within DHIS2 it is possible to make use of the relative periods functionality. The simplest scenario is when you want to design a monthly report that can be reused every month without having to make changes to the report template to accommodate for the changes in period. The relative period called "Last month" allows for this, and the user can at the time of report generation through a report parameter select the month to use in the report.
Trochu pokročilejším případem použití je situace, kdy chcete vytvořit měsíční souhrnný výkaz pro imunizaci a chcete se podívat na data z aktuálního (vykazujícího) měsíce společně s kumulativní hodnotou pro daný rok. Relativní období s názvem „Tento rok“ poskytuje takovou kumulativní hodnotu ve vztahu k vykazovanému měsíci, který byl vybrán při spuštění sestavy. Dalšími relativními obdobími jsou období posledních 3,6 nebo 12 měsíců, což jsou kumulativní hodnoty vypočítané zpět z vybraného vykazovaného měsíce. Pokud chcete vytvořit zprávu s daty agregovanými podle čtvrtletí (těch, která v roce prošla dosud), můžete vybrat možnost „Poslední čtyři čtvrtletí“. Další relativní období jsou popsána v části příručky k tabulce hlášení.
| OrganisationUnit | Datový prvek | Vykazovací měsíc | Letos zatím | Název měsíce přehledu |
|---|---|---|---|---|
| Gerehun CHC | Podané dávky spalniček | 15 | 167 | Říjen-09 |
| Tugbebu CHP | Podané dávky spalniček | 17 | 155 | Říjen-09 |
Souhrn období
While data needs to be collected on a given frequency to standardise data collection and management, this does not put limitations on the period types that can be used in data analysis and reports. Just like data gets aggregated up the organisational hierarchy, data is also aggregated according to a period hierarchy, so you can create quarterly and annual reports based on data that is being collected on a Monthly basis. The defined period type for a data entry form (data set) defines the lowest level of period detail possible in a report.
Součet a průměrná agregace v dimenzi období
Při agregaci údajů o dimenzi období existují dvě možnosti, jak se výpočet provádí, a to součet nebo průměr. Tato možnost je specifikována na datový prvek v DHIS2 pomocí atributu 'agregační operátor' v dialogu Přidat / Upravit datové prvky.
Většina údajů shromážděných rutinně by měla být agregována sečtením měsíců nebo týdnů, například pro vytvoření čtvrtletní zprávy o očkování proti spalničkám by byly shrnuty tři měsíční hodnoty pro „Podané dávky spalniček“.
Other types of data that are more permanently valid over time like "Number of staff in the facility" or an annual population estimate of "Population under 1 year" need to be aggregated differently. These values are static for all months as long as there are valid data. For example, the "Estimated population under 1", calculated from the census data ,is the same for all months of a given year, or the number of nurses working in a given facility is the same for every month in the 6 months period the number is reported for.
This difference becomes important when calculating an annual value for the indicator morbidity service burden for a facility. The monthly head-counts are summed up for the 12 months to get the annual headcount, while the number of staff for the facility is calculated as the average of the two 6-monthly values reported through the 6-monthly staff report. So in this example the data element "OPD headcount" would have the aggregation operator "SUM" and the data element "Number of staff" would have it set to "AVERAGE".
Another important feature of average data elements is the validity period concept. Average data values are standing values for any period type within the borders of the period they are registered for. For example, an annual population estimate following the calendar year, will have the same value for any period that falls within that year no matter what the period type. If the population under 1 for a given facility is 250 for the year of 2015 that means that the value will be 250 for Jan-15, for Q3-15, for Week 12 of 2015 and for any period within 2015. This has implications for how coverage indicators are calculated, as the full annual population will be used as denominator value even when doing monthly reports. If you want to look at an estimated annual coverage value for a given month, then you will have the option of setting the indicator to "Annualised" which means that a monthly coverage value will be multiplied by a factor of 12, a quarterly value by 4, in order to generate an effective yearly total. The annualised indicator feature can therefore be used to mimic the use of monthly population estimates.
Sběr dat vs. analýza dat
Sběr a ukládání dat
Datasets determine what raw data that is available in the system, as they describe how data is collected in terms of periodicity as well as spatial extent. Data sets define the building blocks of the data to be captured and stored in DHIS2. For each data dimension we decide what level of detail the data should be collected at namely 1) the data element (e.g. diagnosis, vaccine, or any event taking place) and its categories (e.g. age and gender), 2) the period/frequency dimension, and 3) the organisation unit dimension. For any report or data analysis you can never retrieve more detailed data than what is defined in the data sets, so the design of the datasets and their corresponding data entry forms (the data collection tools) dictate what kind of data analysis will be possible.
Vstup se nerovná výstupu
Je důležité si uvědomit, že samotné datové formuláře nebo datové sady nejsou vnitřně spojeny s hodnotou podkladových dat a že význam dat je popsán pouze datovým prvkem (a jeho kategoriemi). Díky tomu je naprosto bezpečné upravovat datové sady a formuláře beze změny dat (pokud datové prvky zůstanou stejné). Toto volné propojení mezi formuláři a daty činí server DHIS2 pružným, pokud jde o navrhování a změnu nových formulářů a poskytování přesně takových formulářů, jaké uživatelé chtějí.
Another benefit of only linking data to data elements and not to forms, is the flexibility of creating indicators and validation rules based on data elements, and also in providing any kind of output report (in pivot tables, charts, maps etc.) that can combine data individually or across forms, e.g. to correlate data from different health programs. Due to this flexibility of enabling integration of data from various programs (forms) and sources (routine and semi permanent (population, staff, equipment)) a DHIS2 database is used as an integrated data repository for many or all parts of the aggregated data in a larger HIS. The figure below illustrates this flexibility.

V tomto příkladu vidíme, že datové prvky z více formulářů lze kombinovat a vytvořit daný indikátor. Konkrétnějším příkladem může být shromáždění „populace do jednoho roku věku“ v ročním souboru údajů podle okresů a poté shromáždění datového prvku jako „plně imunizované děti“ podle měsíce na úrovni zařízení. Prostřednictvím anualizace populace můžeme vygenerovat aproximaci efektivní měsíční populace a jejím zkombinováním s celkovým součtem počtu plně imunizovaných dětí podle měsíce by bylo možné vygenerovat indikátor „Plně imunizované pokrytí“, skládající se z souhrnný celkový počet dětí, které jsou plně imunizované, dělené efektivní měsíční populací.
Rozšířené příklady datových prvků a formulářů
The table below combines data element the two group sets Diagnosis (all the diseases) and Morbidity/Mortality (New cases, Follow-ups, Referrals, Deaths) with the data element category PHU/Community. Deaths are captured in a separate form with other dimensions (e.g. the PHU/Community) than morbidity.

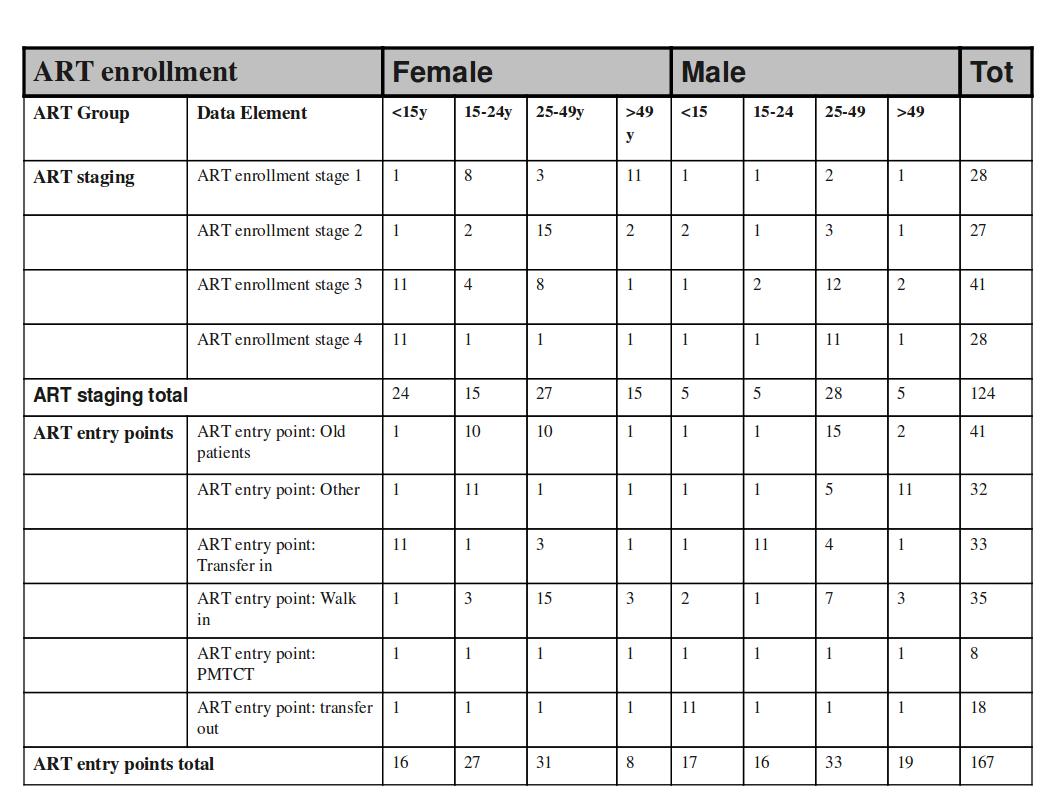
This output table combines the two data element categories HIV_Age and Gender with the data element group set ART Group. The group enables subtotals for staging and entry points summing up the data elements in that group. Subtotals for either age groups and gender would be other possible columns to easily include here.
Jak to funguje v kontingenčních tabulkách
When doing data analysis in Excel pivot tables or any other OLAP based tool the dimensions become extremely powerful in providing many different views into the data. Each data element category or group set become a pivot field, and the options or groups become values within each of these fields. In fact categories and groupsets are treated exactly the same way in pivot tables, and so are orgunits, periods, and data elements. All these become dimensions to the data value that can be used to rearrange, pivot, filter, and to drill down into the data. Here we will show some examples of how the data dimensions are used in pivot tables.
Using the example of morbidity and mortality data, a pivot table can show how the dimensions can be used to view data for different aggregation levels.
The completely aggregated number is viewed when none of the pivot fields are arranged in the table area, as column or row fields, but are listed above the table itself as page field (filter).

Here we have selected to look at the Morbidity total. The various data elements on morbidity have been ordered into the main_de_groups Morbidity (we will get back to Mortality later). The fields above the table itself are all set to "All", meaning that the totals in the table will contain data from all Countries, Districts, Chiefdom, ou_type, year, months, the various categories as listed in the red fields, and all data elements in the Morbidity group.
As we have seen, this is not a very useful representation, as Morbidity is organized into new cases, follow-ups, referrals, and then again in age groups. Also, we do not see the various diagnoses. The first step is to include the diagnoses field (which is a group set), which is done by dragging the "diagnosis" field down to be a row field, as shown in the figure below, and to add the group set called "morbiditymortality" in the column field to display new cases, follow-up, and referrals.

Porovnejte toto číslo s obrázkem níže.
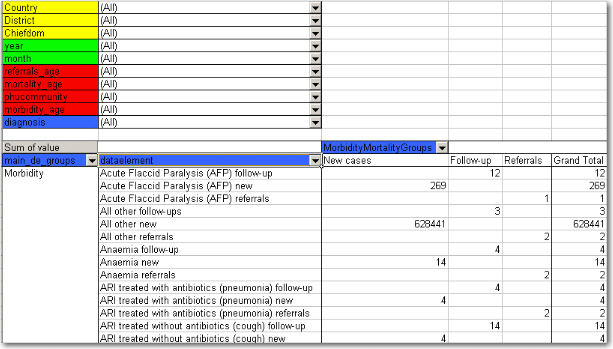
They both show the same data (some of the rows have been cut in the screenshot due to image size), albeit in a different way.
-
The "dataelement" field, used in the bottom figure, displays each diagnosis as three elements; one follow-up, one new, and one referrals. This is the way the data elements have been defined in DHIS2, as this makes sense for aggregation. You would not like to aggregate follow-ups and new, thus these have not been made as categories, the whole point of is to ease aggregation and disaggregation.
-
The "diagnosis" group set has instead been made to lump these three (follow-up, new, referrals) together, which can then be split with another group set, namely the one called "morbiditymortality". This allows us to organize the data as in the first of the two figures, where we have the single diagnosis per row, and the groups new, follow-up, referrals as rows.
Myšlenka použití skupinových sad spočívá v tom, že můžete v jakékoli sadě kombinovat různé datové prvky. Pokud tedy přidáme údaje o úmrtnosti (kontrolou z rozevírací nabídky pole main_de_groups a přesunutím tohoto pole z tabulky), můžeme vidět také úmrtí, protože datové prvky úmrtnosti byly zahrnuta jako skupina „úmrtí“ do sady skupin „morbiditymortality“. Výsledek je uveden níže.

Výsledkem je mnohem uživatelsky přívětivější kontingenční tabulka. Nyní další obrázek ukazuje vztah mezi skupinami a prvky skupiny (jedná se o falešné hodnoty dat).
This small detail of the pivot table show how the actual data elements link to the group sets:
-
The four data elements, as defined in DHIS2, are Measles death, Measles follow-up, Measles new, and Measles referrals
-
They all belong to the group set "diagnosis", where they have been lumped together in the group Measles
-
The group set "morbiditymortality" contains the groups New cases, Follow-up, Referrals, and Deaths.
-
Only the data element Measles deaths has data related to the group Deaths, thus this is where the data value (20) is shown, at the upper right corner. The same for Measles new; the value (224) is shown at the intersection of the data element Measles new and the group New cases (in the group set morbiditymortality)
-
All the intersections where the data element does not link with the groups in morbiditymortality are left blank. Thus in this case we would get a nice table if we excluded the data element from the table, and just had diagnosis and the group set morbiditymortality, as in the figure shown earlier
Now lets see how the data element categories can be used. In the data entry form for Morbidity the new cases and follow-ups use one age category, the referral data another,, and the mortality data a third age breakup, so these are available as three individual age group fields in the pivot tables called morbidity_age, referrals_age and mortality_age. It doesn't make sense to use these while looking at these data together (as in the examples above), but e.g. if we only want to look at the only the new cases we can put the MobidityMortalityGroups field back up as a page field and there select the New cases group as a filter. Then we can drag the Morbidity_age field down to the column area and we get the following view:

The following table illustrates the benefits of reusing data element categories across datasets and category combinations. The VCCT, ART and PMTCT data are collected in three different datasets, the first two with both gender and age breakdown, and the PMTCT only age (gender is given). All three share the same age groups and therefore it is possible to view data elements from all these three datasets in the same table and use the age dimension. In the previous example with morbidity and mortality data this was not possible since new cases, referrals and deaths all have different age groups.

In the table below PMTCT data has been removed from the table and the gender category added to the column area so that you can analyse the data for VCCT and ART by age and gender. An optional subtotal for gender has also been added, as well as a grand total for all age and gender.

Případová studie: Od papírových formulářů po vícedimenzionální datové sady - poučení
Návrh datové sady DHIS2 je obvykle založen na některých požadavcích z papírového formuláře, který se již používá. Logika papírových formulářů není stejná jako datový prvek a model datové sady DHIS2, např. pole v tabulkové papírové podobě je často popsáno jak záhlavími sloupců, tak textem na každém řádku, a někdy také nějakým úvodním záhlaví tabulky, které poskytuje více kontextu. V databázi je to zachyceno v jednom atomovém datovém prvku bez odkazu na pozici ve formátu vizuální tabulky, takže je důležité zajistit, aby datový prvek s volitelnými kategoriemi datových prvků zachytil plný význam každého jednotlivého pole v papírovém formuláři.
Another important thing to have in mind while designing datasets is that the dataset and the corresponding data entry form (which is a dataset with layout) is a data collection tool and not a report or analysis tool. There are other far more sophisticated tools for data output and reporting in DHIS2 than the data entry forms. Paper forms are often designed with both data collection and reporting in mind and therefore you might see things such as cumulative values (in addition to the monthly values), repetition of annual data (the same population data reported every month) or even indicator values such as coverage rates in the same form as the monthly raw data. When you store the raw data in DHIS2 every month and have all the processing power you need within the computerised tool there is no need (in fact it would be stupid and most likely cause inconsistency) to register manually calculated values such as the ones mentioned above. You only want to capture the raw data in your datasets/forms and leave the calculations to the computer, and presentation of such values to the reporting tools in DHIS2.
Od tabulek po kombinace kategorií - návrh vícerozměrných datových sad
Jak jsme viděli v příkladech výše, kategorie datových prvků a možnosti kategorií jsou užitečné při reprezentaci tabulkových dat při přidávání dimenzí do pole v papírové podobě. Také jsme viděli, jak je datový prvek jednou z požadovaných dimenzí, které popisují data v DHIS2. Jak uvidíme v níže uvedeném příkladu, existuje často více než jeden způsob, jak reprezentovat papírovou formu v DHIS2, a může být obtížné vědět, kterou dimenzi reprezentovat s názvem datového prvku a kterou reprezentovat jako kategorie, nebo dokonce jako skupiny jak jsme viděli výše. Zde je několik obecných poznatků získaných při práci s kombinacemi datových prvků a kategorií:
-
Design your dimensions with data use in mind, not data collection. This means that disaggregation of data values at collection time should be easily aggregated up along the various dimensions, as in adding up to a meaningful total.
-
Reuse dimensions as much as possible as this increases the ability to compare disaggregated data (e.g. age groups, fixed/outreach, gender).
-
Disaggregation dimensions should add up to a total. In certain cases, data elements may be collected a subsets of each other. In this case, use of categories to disaggregate the data element should not be used. As an example, we might collect "Number of confirmed malaria cases" and disaggregate this by "Under 5" and "Over 5". A third data element "Number of confirmed malaria cases under 1" might also exist on the form. It would seem reasonable then to create three age groups : Under 1, Under 5 and Over 5, to describe the disaggregation. However, the Under 1 is actually a subset of the Under 5 group, and when totalled, would result in duplication. Thus, categories should be generally be composed of mutually exclusive category options, such that the sum of individual category options results in a coherent total.
-
Different levels of dimensions; 1) disaggregation and 2) grouping. Disaggregation dimensions dictate how you collect and how detailed you store your data, so plan these carefully. The group dimension is more flexible and can be changed and added to even after data collection (think of it as tagging).
-
It is best to think of how the data would be used in an integrated data repository and not how it will actually be collected on forms or by programs when designing the meta-data model. Ideally, the same type of disaggregation should be used across forms and datasets for data elements which will be analysed together, or used to build indicators. Reuse definitions so that the database can integrate even though the forms themselves might be duplicated (which in practice, is often the case).
In order to better explain the approach and the possibilities we present an example paper form and will walk through it step by step and design data elements, categories, category options and category combinations.

This form has many tables and each of them potentially represent a data element category combination (from now on referred to as a catcombo). As such there is no restriction on a dataset to only have one set of dimensions or catcombo, it can have many and as we see above this is necessary as the dimensions are very different from table to table. In the following paragraphs, we will analyse how to break down this form into its component pieces and suggest an implementation pathway in DHIS2.
ANC table. This table in the top left corner is one the simpler ones in this form. It has two dimensions, the first column with the ANC activity or service (1st visit, IPT 2nd dose etc) and the second and third column which represent the place where the service was given with the two options "Fixed" and "Outreach". Since the ANC service is the key phenomena to analyse here, and often there is a need for looking at the total of "ANC 1st visits" no matter where they actually took placed, it makes a lot of sense to use this dimension as the data element dimension.
Thus, all items on the first column from "1st ANC" visit to "2nd IPT dose given by TBA" are represented as individual data elements. The where dimension is represented as a data element category (from now on referred to as category) with the name "fixed/outreach" with the two data element category options (from now on catoptions) "fixed" and "outreach". There is no other dimension here so we add a new catcombo with the name "Fixed/Outreach" with one category "Fixed/Outreach". Strictly speaking there is another dimension in this table, and that is the at PHU or by TBA dimension which is repeated for the two doses of IPT, but since none of the other ANC services listed have this dimension it does not seem like a good idea to separate out two data elements from this table and give them another catcombo with both fixed/outreach and at PHU/by TBA. reusing the same catcombo for all the ANC services makes more sense since it will be easier to look at these together in reports etc. and also the fact that there is not much to lose by repeating the at PHU or by TBA information as part of the data element name when it is only for four data elements in a table of eleven data elements.
DELIVERY table. This table is more tricky as it has a lot of information and you can see that not all the rows have the same columns (some columns are merged and a one field is greyed out/disabled.). If we start by looking at the first column "Deliveries assisted by" that seems to be one dimension, but only down to the "Untrained TBA" row, as the remaining three rows are not related to who assisted the delivery at all. Another dimension is the place of delivery, either In PHU or in Community as stated on the top column headings. These deliveries are further split into the outcome of the delivery, whether it is a live or still birth, which seems to be another dimension. So if we disregard the three bottom rows for a moment there seems to be 3 dimensions here, 1) assisted by, 2) place of delivery, and 3) delivery outcome. The key decision to make is what to use as the data element, the main dimension, the total that you will most often use and want easily available in reports and data analysis.
In this case, the outcome dimension as "Total live births" is a very commonly used value in many indicators (maternal mortality ratio, births attended by skilled health personnel etc.). In this case the "Assisted By" dimension could also have been used without any problem, but the added value of easily getting the total live births information was the decisive point for us. This means that from this table (or sub-table of row 1 to 6) there are only two data elements; "Live births" and "Still births".
Next, there are two more dimensions, the "PHU/Community" with its two options and a "Births attended by" with options ("MCH Aides", "SECHN", "Midwives", "CHO", "Trained TBA", "Untrained TBA"). These two categories make up the catcombo "Births" which is assigned to the two data elements "Live births" and "Still births". Considering the final three rows of the delivery table we can see that "Complicated Deliveries" does not have the assisted by dimension, but has the place and the outcome. "Low birth weight" also does not have the assisted by dimension and not the outcome either. The LLITN given after delivery does not have any additional dimension at all. Since not any of the three rows can share catcombo with any other row we decided to represent these fields as so called flat data elements, meaning data elements with no categories at all, and simply adding the additional information from the column headings to the data element name, and therefore ended up with the following data elements with the default (same as none) catcombo; "Complicated deliveries in PHU live birth", "Complicated deliveries in PHU still births", "Complicated deliveries in community live birth", "Complicated deliveries in community still births", "Low birth weight in PHU", "Low birth weight in community", and "LLITN given after delivery".
POST-NATAL CARE table This table is simple and we used the same approach as for the ANC table. 3 data elements listed in the first column and then link these to the catcombo called "fixed/outreach". Reusing the same category fixed/outreach for these data elements enables analysis on fixed/outreach together with ANC data and other data using the same category.
TT table This table is somewhat more complex than the previous examples.We decided to use "TT1", "TT2" ... "TT5" as data elements which makes it easy to get the total of each one of these. There is fixed/outreach dimension here, but there is also the "In school place" that is only applied to the Non-Pregnant, or more correctly to any of the two as the school immunisation is done whether the girls are pregnant or not. We consulted the program people behind the form and found out that it would be OK to register all school TT immunisations as non-pregnant, which simplifies the model a bit since we can reuse the "TT1" to "TT5" data elements. So we ended up with a new category called "TT place" with the three options (Fixed, Outreach, In School), and another category called "Pregnant/Non-pregnant" with two options. The new catcombo "TT" is then a combination of these two and applied to the 5 TT data elements. Since we agreed to put all In Schools immunisations under Non-pregnant in means that the combination of options (Pregnant+In School) will never be used in any data entry form, and hence become a possible optioncombo, which is OK. As long as the form is custom designed then you can choose which combinations of options to use or not, and therefore it is not a problem to have such passive or unused catoptions. Having school as one option in the TT place category simplifies the model and therefore we thought it was worth it. The alternative would be to create 5 more data elements for "TT1 in school" ... "TT5 in school", but then it would be a bit confusing to add these together with the "TT1" ..."TT5" plus TT catcombo. Having school as a place in the TT place category makes it a lot easier to get the total of TT1.. TT5 vaccines given, which are the most important numbers and most often used values for data analysis.
Complications of early and late pregnancy and labour tables We treat these two tables as one, and will explain why. These two tables are a bit confusing and not the best design. The most important data coming out of these tables are the pregnancy complications and the maternal deaths. These data elements contain further detail on the cause of the complication or death (the first column in both tables), as well as a place of death (in PHU or community), and an outcome of the complication (when its not a death) that can be either "Managed at PHU" or " Referred". We decided to create two data elements for these two tables; "Pregnancy complications", and "Maternal Deaths", and two category combinations, one for each of the data elements. For the Pregnancy Complications data element there are two additional dimensions, the cause of the complication (the combined list of the first column in the two tables) and the outcome (managed at PHU or Referred), so these are the categories and options that make up that category combination. For the "Maternal deaths" data element the same category with the different causes are used and then another category for the place of death (in PHU or In community). This way the two data elements can share one category and it will be easy to derive the total number of pregnancy complications and maternal deaths. While the list of complications on the paper form is divided into two (early and late/labour) you can see that e.g. the malaria in 2nd and 3rd trimester are listed under early, but in fact are for a later phase of the pregnancy. There is no clear divide between early and late complications in the form, and therefore we gave up trying to make this distinction in the database.
Family Planning Services table This table has 2 dimensions, the family planning method (contraceptive) and whether the client is new or continuing. We ended up with one data element only "Family planning clients" and then added two categories "FP method" with all the contraceptives as options, and another category "FP client type" with new or continuing as options. This way it will be easy to get the total number of family planning clients which is the major value to look at in data analysis, and from there you can easily get the details on method or how many new clients there are.
Postupný přístup k návrhu datových sad
-
Identify the different tables (or sub datasets) in the paper form that share the same dimensions
-
U každé tabulky identifikujte dimenze, které popisují datová pole
-
Identify the key dimension, the one that makes most sense to look at in isolation (when the others are collapsed, summed up). This is your data element dimension, the starting point and core of your multidimensional model (sub dataset). The data element dimension can be a merger of two or more dimensions if that makes more sense for data analysis. The key is to identify which total that makes most sense to look at alone when the other dimensions are collapsed.
-
For all other/additional dimensions identify their options, and come up with explanatory names for dimensions and their options.
-
Each of these additional dimensions will be a data element category and their options will be category options.
-
Combine all categories for each sub dataset into one category combination and assign this to all the data elements in your table (or sub dataset if you like).
-
When you are done with all the tables (sub datasets), create a new dataset and add all the data elements you have identified (in the whole paper form) to that dataset.
-
Your dataset will then consist of a set of data elements that are linked to one or more category combinations.