Kontrola kvality dat
O kontrolách kvality dat
The Data Quality app contains tools to validate the accuracy and reliability of the data in the system. You can assess different dimensions of data quality as outlined in the table below:
| Dimenze | Popis |
|---|---|
| Správnost | Údaje by měly být v normálním rozsahu pro údaje shromážděné v tomto zařízení. Při porovnání s údaji ze souvisejících datových prvků by neměly existovat žádné hrubé nesrovnalosti. |
| Úplnost | Měly být předloženy údaje pro všechny prvky údajů za všechny jednotky vykazující organizace. |
| Konzistence | Údaje by měly být konzistentní s údaji zadanými během předchozích měsíců a let a zároveň by měly umožňovat změny s reorganizací, zvýšenou pracovní zátěží atd. a konzistentní s jinými podobnými zařízeními. |
| Včasnost | Všechny údaje ze všech jednotek vykazující organizace by měly být předloženy ve stanovený čas. |
Kvalitu dat můžete ověřit různými způsoby, například:
-
At point of data entry, DHIS 2 can check the data entered to see if it falls within the minimum maximum value ranges of that data element (based on all previous data registered).
-
By defining validation rules, which can be run once the user has finished data entry. The user can also check the entered data for a particular period and organization unit(s) against the validation rules, and display the violations for these validation rules.
-
Analýzou datových sad, tedy zkoumáním mezer v datech.
-
By data triangulation, that is, comparing the same data or indicator from different sources.
Analýza ověřovacích pravidel
O analýze ověřovacích pravidel
A validation rule is based on an expression which defines a numeric relationship between data element values. The expression forms a condition which should assert that certain logical criteria are met.
Výraz se skládá z:
-
levá strana
-
pravá strana
-
operátor
A validation rule could assert that "Suspected malaria cases tested" >= "Confirmed malaria cases".
Levá a pravá strana musí vracet číselné hodnoty.
The validation rule analysis tests validation rules against the data registered in the system. Validation violations are reported when the condition defined in the validation rule expression is not met, which means when the condition is false.
You can configure a validation rule analysis to automatically send out information about validation violations to selected user groups. These messages are called validation notifications and you create them in the Maintenance app. Validation notifications are sent via the internal DHIS 2 messaging system.
Pracovní postup
-
In the Maintenance app, create validation rules and validation rule groups.
-
(Optional) In the Maintenance app, create validation notifications.
-
Spusťte analýzu ověřovacích pravidel, buď automaticky, nebo ručně.
-
In the Scheduler app, you schedule the validation rule analysis to run automatically for all validation rules included in one or several validation rule groups. After the system has run the analysis, you'll see the validation violations (if any) in the validation notifications sent via the internal DHIS 2 messaging system.
-
In the Data Quality app, you run the validation rule analysis manually for selected validation rules. After the analysis process has finished, you'll see a list of validation violations (if any).
-
Naplánujte automatické spuštění analýzy ověřovacích pravidel
Note
Only validation rules that are included in one or several validation notifications will be a part of the validation rule analysis. If there is no corresponding validation notification for a validation rule, no notification will be sent.
Note
While running validation rule analysis automatically, any results not already persisted, will be persisted during this run. Persisted results can currently only be accessed trough the API. Consult the developers guide for more information about how persisted validation rule violations can be accessed.
-
Verify that you have created all the validation rules, validation rule groups and validation notifications you need.
-
Otevřete aplikaci Plánovač a klikněte na tlačítko Přidat v pravém dolním rohu.
-
Vyberte vhodný Název pro novou úlohu.
-
V rozevírací nabídce vyberte Monitorování Typu úlohy.
-
Vyberte frekvenci běhu úlohy, tj. Kdy a jak často by úloha měla běžet.
-
Vyplňte část Parametry, včetně skupin pravidel ověření.
-
Stisknutím tlačítka Přidat úlohu potvrďte vytvoření úlohy. Další informace o přidávání úloh najdete v části Plánování.
Spusťte analýzu ověřovacích pravidel ručně

-
Verify that you have created all the validation rules, validation rule groups and validation notifications you need.
-
Open the Data Quality app and click Validation rule analysis.
-
Vyberte Datum zahájení a Datum ukončení.
-
Select which Validation rule group you want to include in the analysis.
You can select all validation rules or all validation rules from a single validation rule group.
-
(Optional) Select Send notifications to trigger validation notifications.
Note
If you want to send out validation notifications, you must first create them in the Maintenance app.
-
(Optional) Select Persist new results to persist any non-persisted results found during the analysis
-
Vyberte nadřazenou organizační jednotku.
-
Klikněte na Ověřit.
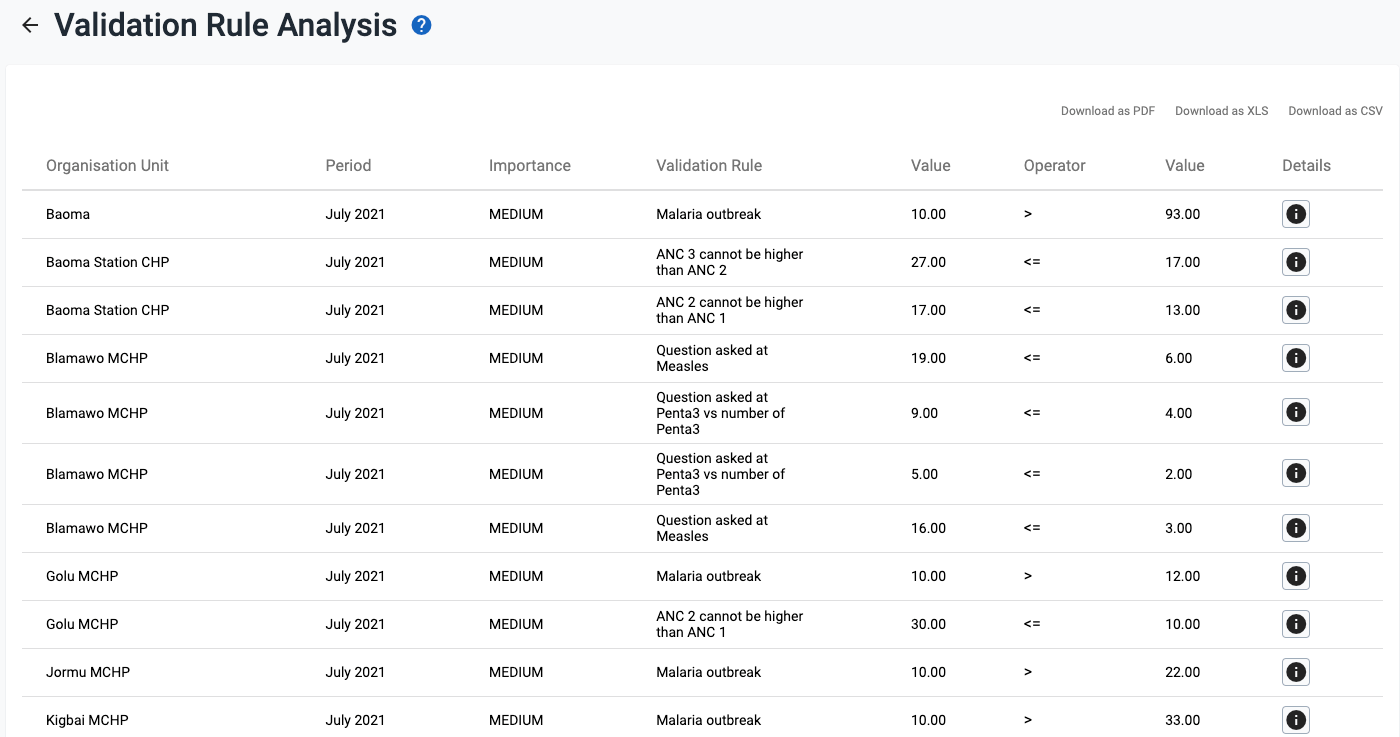
The analysis process duration depends on the amount of data that is being analysed. If there are no violations of the validation rules, you'll see a message saying Validation passed successfully. If there are validation violations, they will be presented in a list.
-
(Optional) Click the show details icon to get more information about a validation violation. In the pop-up window you'll find information about the data elements included in the validation rules and their corresponding data values. You can use this information to identify the source of the validation rule violation.
-
(Optional) Click Download as PDF, Download as Excel or Download as CSV to download the validation violations list in PDF, Excel or CSV formats.
Viz také
Outlier detection
About outlier detection
The outlier detection tool identifies values which are numerically distant from the rest of the data, potentially indicating that they are outliers. The analysis is based on the standard normal distribution. DHIS 2 calculates the mean of all values for an organisation unit, data element, category option combination and attribute option combination.
Note
As indicated above, this data quality analysis is only appropriate for data which is normally distributed. Data with large seasonal variation, or which may be distributed according to other statistical models (e.g. logistical ) may lead values being flagged which actually should be considered valid. It is therefore recommended to first confirm whether the data actually is normally distributed before running a standard deviation outlier analysis.
Run outlier detection

-
Otevřete aplikaci Kvalita dat a klikněte na Detekce odlehlých hodnot.
-
Vyberte jednu nebo více datových sad.
-
Vyberte Organizační jednotky.
Lze vybrat více organizačních jednotek. Analýza se provádí na hrubých datech pro všechny organizační jednotky v subhierarchii vybraných jednotek, nikoli na agregovaných datech.
-
Vyberte Od data a Do dne.
-
Set the Algorithm to use.
Z-skóre (na základě střední hodnoty datových hodnot), Upravené Z-skóre (na základě mediánu datových hodnot) a Min-max hodnoty (na základě uložených min-max datové hodnoty) jsou dostupné algoritmy.
-
Vyberte Práh.
To se týká počtu směrodatných odchylek, u nichž se údaje mohou odchýlit od průměru, než budou klasifikovány jako odlehlé hodnoty.
- Vyberte Maximální počet výsledků.
To se týká maximálního počtu odlehlých hodnot uvedených ve výsledcích.
- (Volitelné) Vyberte Datum zahájení dat a Datum ukončení dat
Tato pole lze použít k provedení analýzy detekce odlehlých hodnot na podmnožině dat v rámci poskytnutého rozsahu dat. Pokud ponecháte prázdné, použije se přirozené datum začátku a konce datové sady (v pokročilé sekci).
- (Volitelné) Vyberte míru, kterou chcete Seřadit podle.
Odlehlé hodnoty lze třídit podle Z-skóre nebo podle Absolutní odchylky od průměru (v pokročilé sekci).
-
Klikněte na Start The analysis process duration depends on the amount of data that is being analysed. If there are standard deviations outliers, they will be presented in a list.
 For each outlier, you will see the data element, period, organisation unit, value, z-score, deviation, standard deviation, mean, min, and max. The minimum and maximum values refer to the border values derived from the number of standard deviations selected for the analysis.
 -
(Volitelné) Kliknutím na Stáhnout jako CSV stáhnete seznam ve formátu CSV.
Tip
Klepnutím na zaškrtávací políčko označte mimořádnou hodnotu pro další sledování.
Minimum maximum outlier detection
About minimum maximum value based outlier detection
You can verify the data quality at the point of data entry by setting a minimun/maximum value range for each data value. You can define the value ranges manually or generate them automatically.
The auto-generated minimum maximum value range is suitable only for normally distributed data. DHIS2 will determine the arithmetic mean and standard deviation of all values for a given data element, category option, organisation unit and attribute combination. Then the system will calculate the minimum maximum value range based on the Data analysis std dev factor specified in the System Settings app.
For data which is highly-skewed or zero inflated (as is often the case with aggregate data), the values which DHIS2 auto-generates may not provide an accurate minimum maximum value range. This can lead to excessive false violations, for example if you analyse values related to seasonal diseases.
Note
Minimum maximum value ranges are calculated across all attribute combination options for a given data element, category option and organisation unit combination.
Pracovní postup
-
Create a minimum maximum value range, either automatically or manually.
-
In the Data Administration app, you generate value ranges automatically.
-
V aplikaci Zadávání dat můžete rozsahy hodnot nastavit ručně.
-
-
V aplikaci Kvalita dat spusťte Min.-max. Analýza odlehlých hodnot.
Configure a minimum maximum outlier detection
Automaticky vytvořte rozsah minimální maximální hodnoty
Note
Auto-generated minimum maximum value ranges can be useful for many situations, but it's recommended to verify that the data is actually normally distributed prior to using this function.
You generate minimum maximum value ranges calculated by data set in the Data Administration app. The new value ranges override any value ranges that the system has calculated previously.
-
Nastavte směrodatnou odchylku (standardní odchylku) analýzy dat:
-
Otevřete aplikaci Nastavení systému a klikněte na Obecné.
-
Do pole Analýza dat std dev faktor zadejte hodnotu.
This sets the number of standard deviations to use in the outlier analysis. The default value is 2. Higher values indicate a broader distribution, which may lead to outliers not being flagged correctly by the analysis.
-
-
Otevřete aplikaci Správa dat a klikněte na Generování minimální a maximální hodnoty.
-
Vyberte datovou sadu(y).
-
Vyberte Organizační jednotku.
-
Klikněte na Generovat.
New minimum maximum value ranges for all data elements in the selected data sets for all organisation units (including descendants) of the selected organisation units are generated.
Vytvořte rozsah minimální / maximální hodnoty ručně

-
V aplikaci Zadávání dat otevřete formulář pro zadávání údajů.
-
Poklepejte na pole, pro které chcete nastavit rozsah minimální / maximální hodnoty.
-
V zobrazeném dialogovém okně zadejte Minimální limit a Maximální limit.
-
Klikněte Uložit.
If values don't fall within the new value range the next time you enter data, the data entry cell will appear with an orange background.
-
(Optional) Type a comment to explain the reason for the discrepancy, for example an event at a facility which may have generated a large number of clients.
-
(Volitelné) Klikněte na Uložit komentář.
Tip
Kliknutím na ikonu hvězdičky označte hodnotu pro další sledování.
Odstraňte rozsah minimální maximální hodnoty
You can permanently delete all minimum maximum value ranges for selected data sets and organisation units in the Data Administration app.
-
Otevřete aplikaci Správa dat a klikněte na Generování minimální a maximální hodnoty.
-
Vyberte datovou sadu(y).
-
Select an Organisation unit. Note, that the selection cascades to descendant organisation units!
-
Klikněte na Odebrat.
Run a minimum maximum outlier detection
-
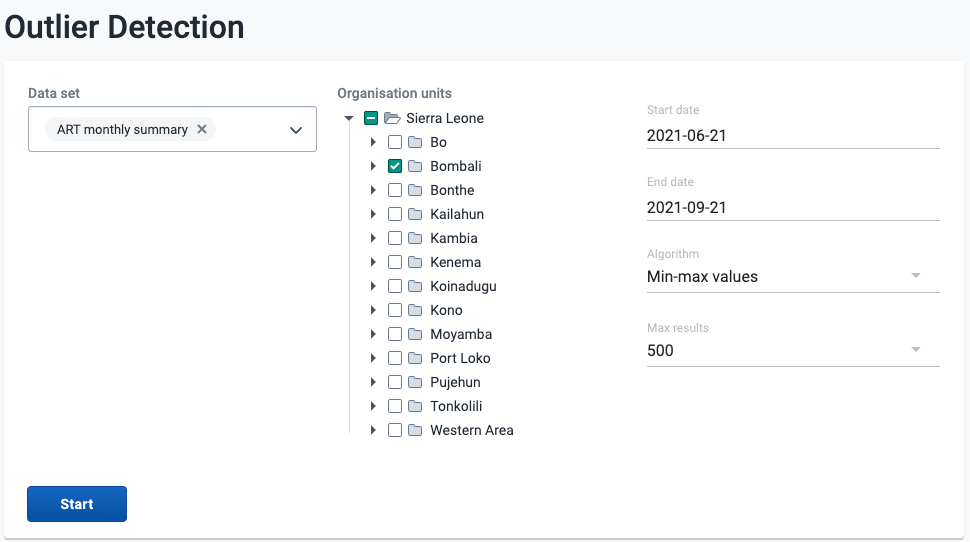
Ověřte, že jste vytvořili rozsahy minimálních a maximálních hodnot.
-
Otevřete aplikaci Kvalita dat a klikněte na Detekce odlehlých hodnot.
-
Vyberte datovou sadu(y).
-
Vyberte Nadřazená organizační jednotka.
Lze vybrat více organizačních jednotek. Analýza se provádí na hrubých datech pro všechny organizační jednotky v subhierarchii vybraných jednotek, nikoli na agregovaných datech.
-
Vyberte Od data a Do dne.
-
Nastavte Algoritmus na Min-max hodnoty.
-
Vyberte Maximální počet výsledků
To se týká maximálního počtu odlehlých hodnot uvedených ve výsledcích.
-
Klikněte na Start
The analysis process duration depends on the amount of data that is being analysed. If there are standard deviations outliers, they will be presented in a list.

For each outlier, you will see the data element, period, organisation unit, value, deviation, min, and max.
-
(Volitelné) Kliknutím na Stáhnout jako CSV stáhnete seznam ve formátu CSV.
Tip
Klepnutím na zaškrtávací políčko označte hodnotu pro další sledování.
Následná analýza
O následné analýze
The follow-up analysis creates a list of all data values marked for follow-up. You can mark a data value for follow-up in the Data Entry app and in the result list you get from a standard deviation outlier or minimum maximum outlier analysis.
Vytvořte seznam datových hodnot označených pro další sledování

-
Otevřete aplikaci Kvalita dat a klikněte na Následná analýza.
-
Vyberte datovou sadu nebo více datových sad.
-
Vyberte Organizační jednotky.
Lze vybrat více organizačních jednotek. Analýza se provádí na nezpracovaných datech „pod“ organizační jednotkou, nikoli na agregovaných datech.
-
Select a Start Date and End Date which defines the periods which you are interested in looking for values which have been marked for follow up.
-
Press Follow up to generate a list of values which have been marked for follow up.
-
(Volitelné) Kliknutím na Stáhnout jako PDF, Stáhnout jako Excel nebo Stáhnout jako CSV stáhnete seznam porušení ověření ve formátech PDF, Excel nebo CSV.

Tip
Check the Unfollow checkbox in the list and click the Unfollow-button to remove the follow-up tags from the marked data values. You can also enter a comment in the field to indicate any additional information regarding the value.