Správa ovládacích panelů
About the Dashboards app
The Dashboards app makes it possible to present a high level overview of your data, including displaying analytical objects such as maps, charts, reports, tables, and line lists, as well as displaying text-based information, resource links, plugins and app widgets.
Mezi funkce aplikace Ovládací panel patří:
- Zobrazení a tisk ovládacích panelů
- Slideshow
- Vytvoření a úprava ovládacích panelů
- Sdílení ovládacích panelů s uživateli a skupinami uživatelů
- Aplikujte dočasné filtry při prohlížení ovládacích panelů
- Responzivní zobrazení na mobilních zařízeních a malých obrazovkách
- Přístup k ovládacím panelům offline
Rozvržení aplikace Ovládací panel
Dashboards have a title, description, dashboard items. The title and actions bar is at the top of the page under the header bar, and shows the title, a dropdown for searching and selecting dashboards, and actions that can be taken with the current dashboard. There is also a + button for creating a new dashboard.
The Dashboards app has two modes: view and edit/create. When you first log in to DHIS2, your most recently used dashboard will be displayed in view mode, if you are on the same computer as you were previously. If you are using a different computer or browser, then the first starred dashboard will be displayed. If there are no starred dashboards, then the first dashboard (alphabetically) will be displayed. Starred dashboards always show first in the dashboard list.
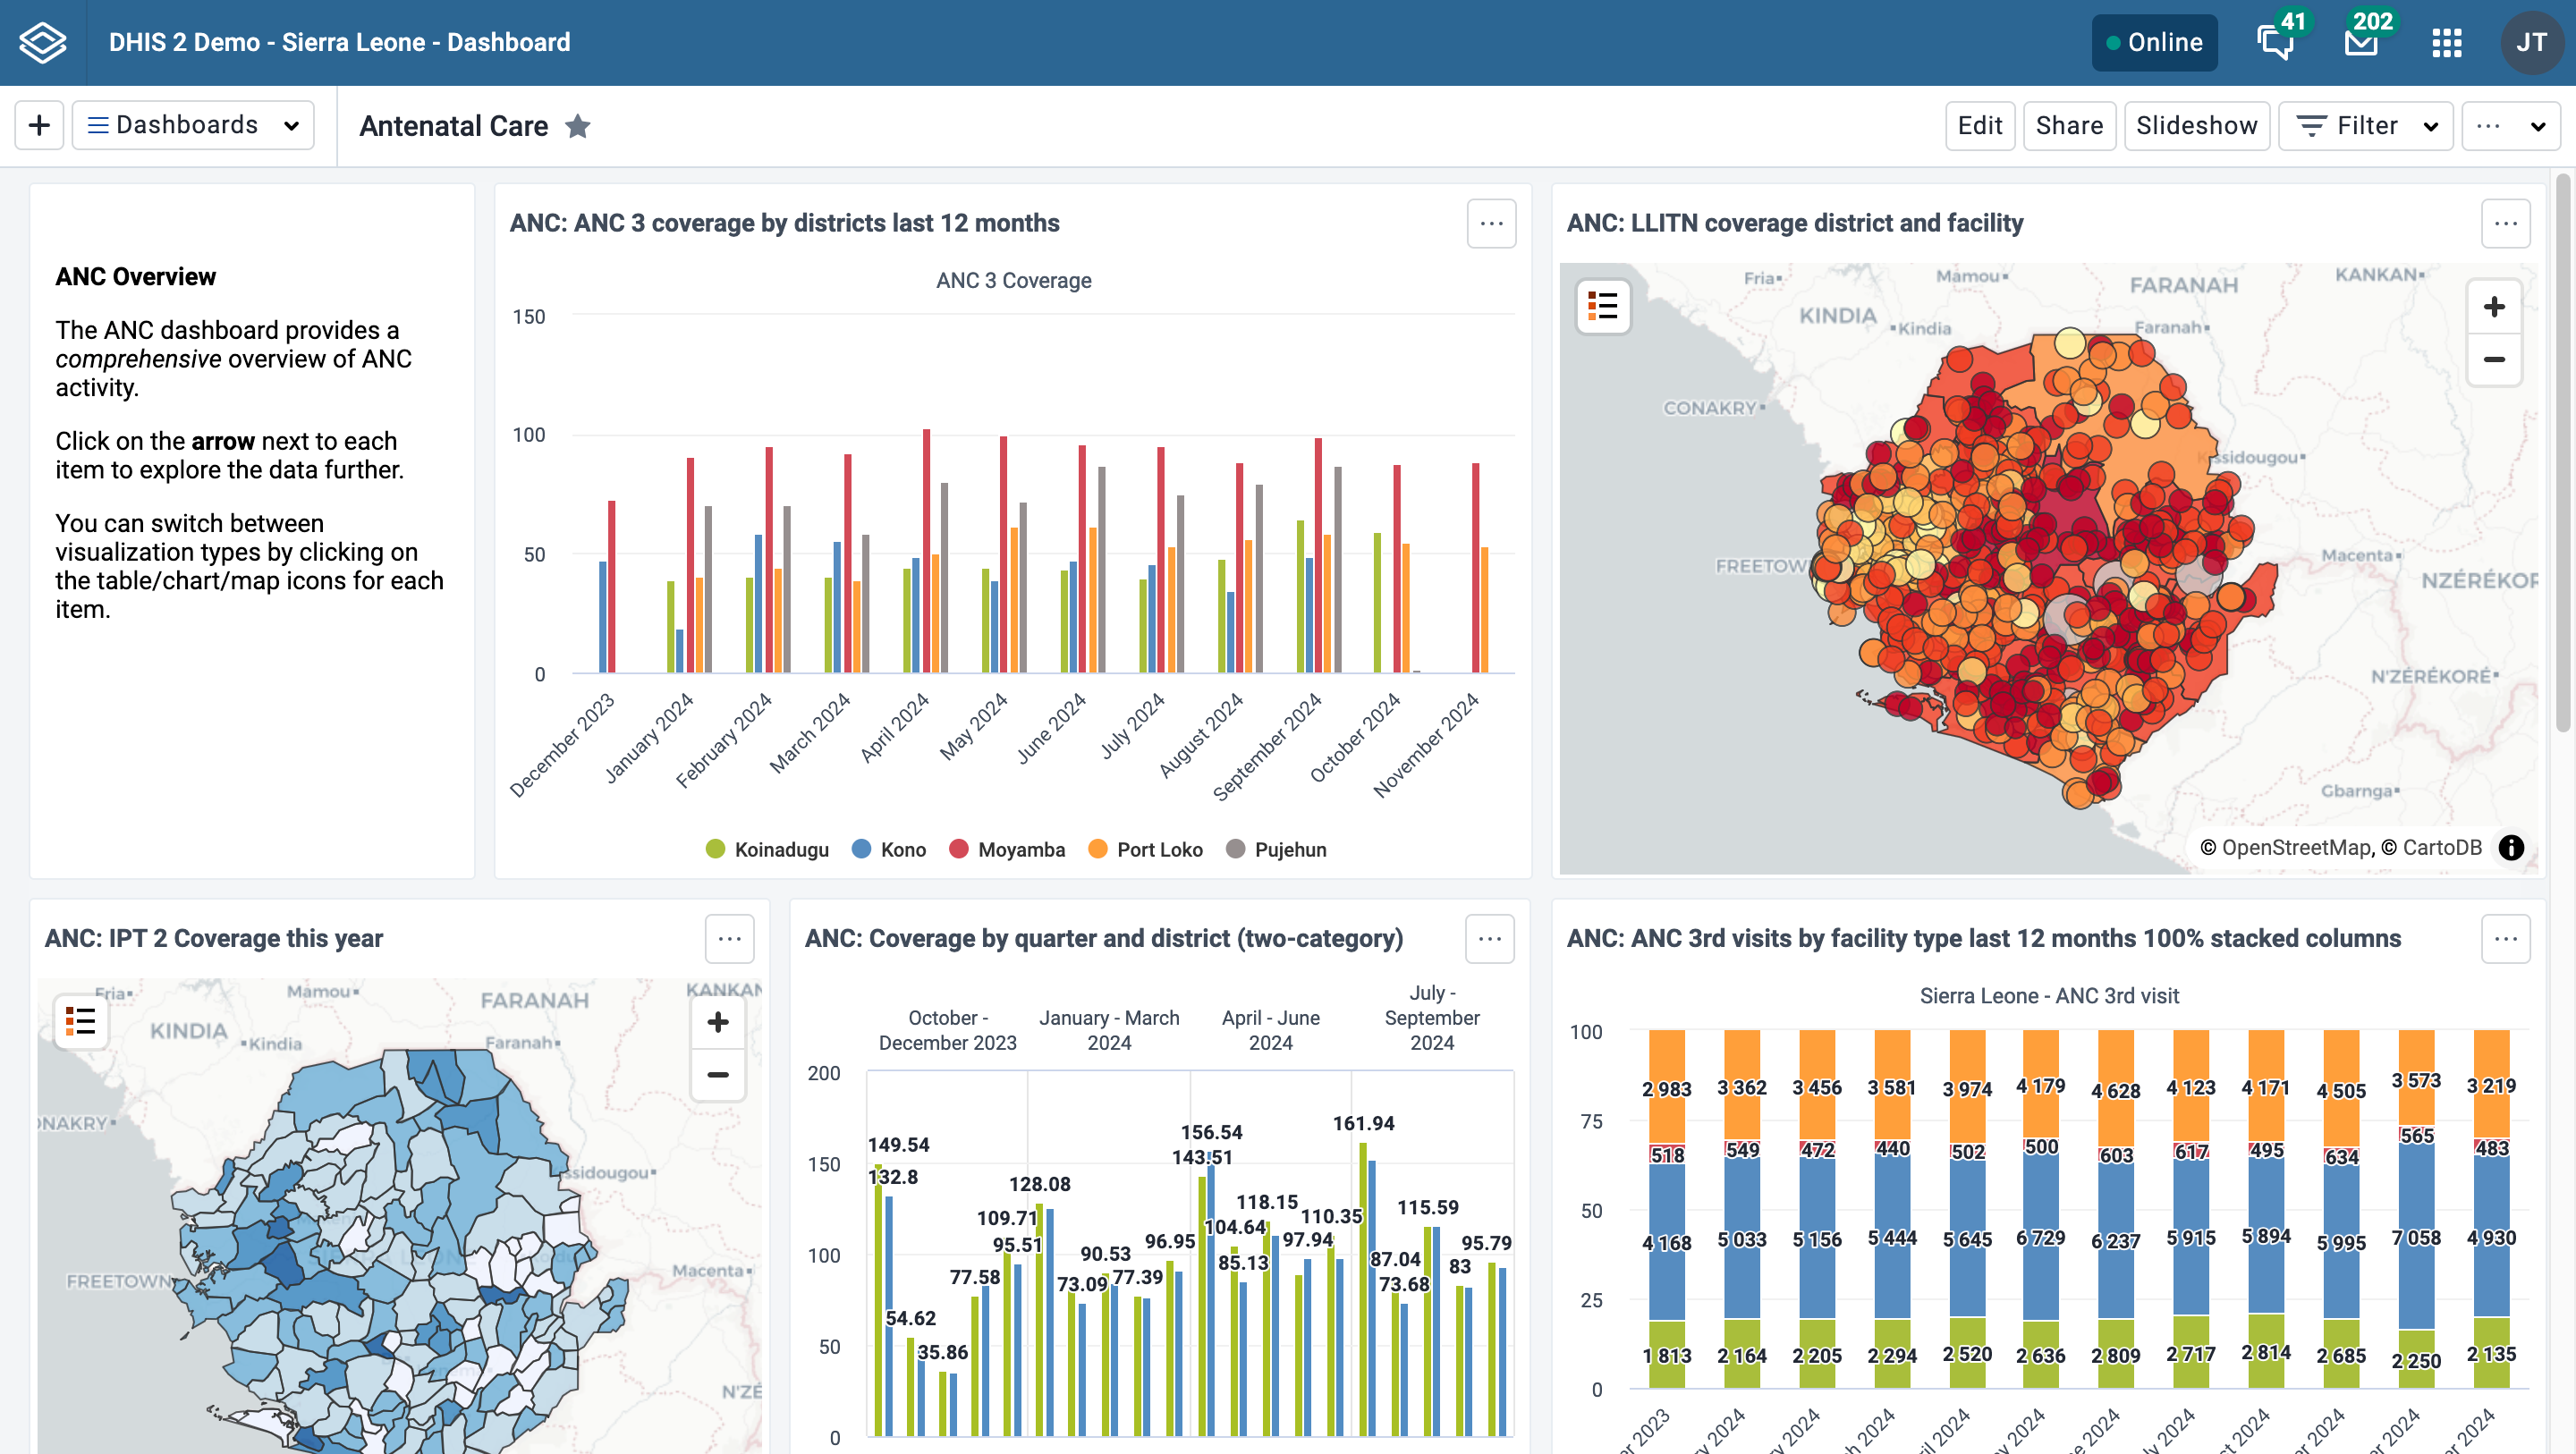
Below is a dashboard named "Antenatal Care", which has been populated with charts and maps:
Personalization
To adjust the Dashboards app to suit your needs, you can:
- Označení hvězdičkou pro rychlý přístup k vašim oblíbeným ovládacím panelům
- Zobrazení nebo skrytí popisu ovládacího panelu
Responsive view on small screens
When viewing dashboards on small screens like mobile phones, the dashboard will adapt to the screen and show all items in a single column. Some options, including editing, filtering and sharing, will not be available.

Searching for a dashboard
You can search for a specific dashboard using the search field available from the Dashboards dropdown selector in the title bar. The search is case insensitive, and as you type, the list of dashboards will be narrowed down to those that match your search text.

Creating and editing a dashboard
To create a new dashboard, click the + button in the upper corner of the title bar to enter create/edit mode:

To edit an existing dashboard, click the Edit button (you must have edit access to see this button):

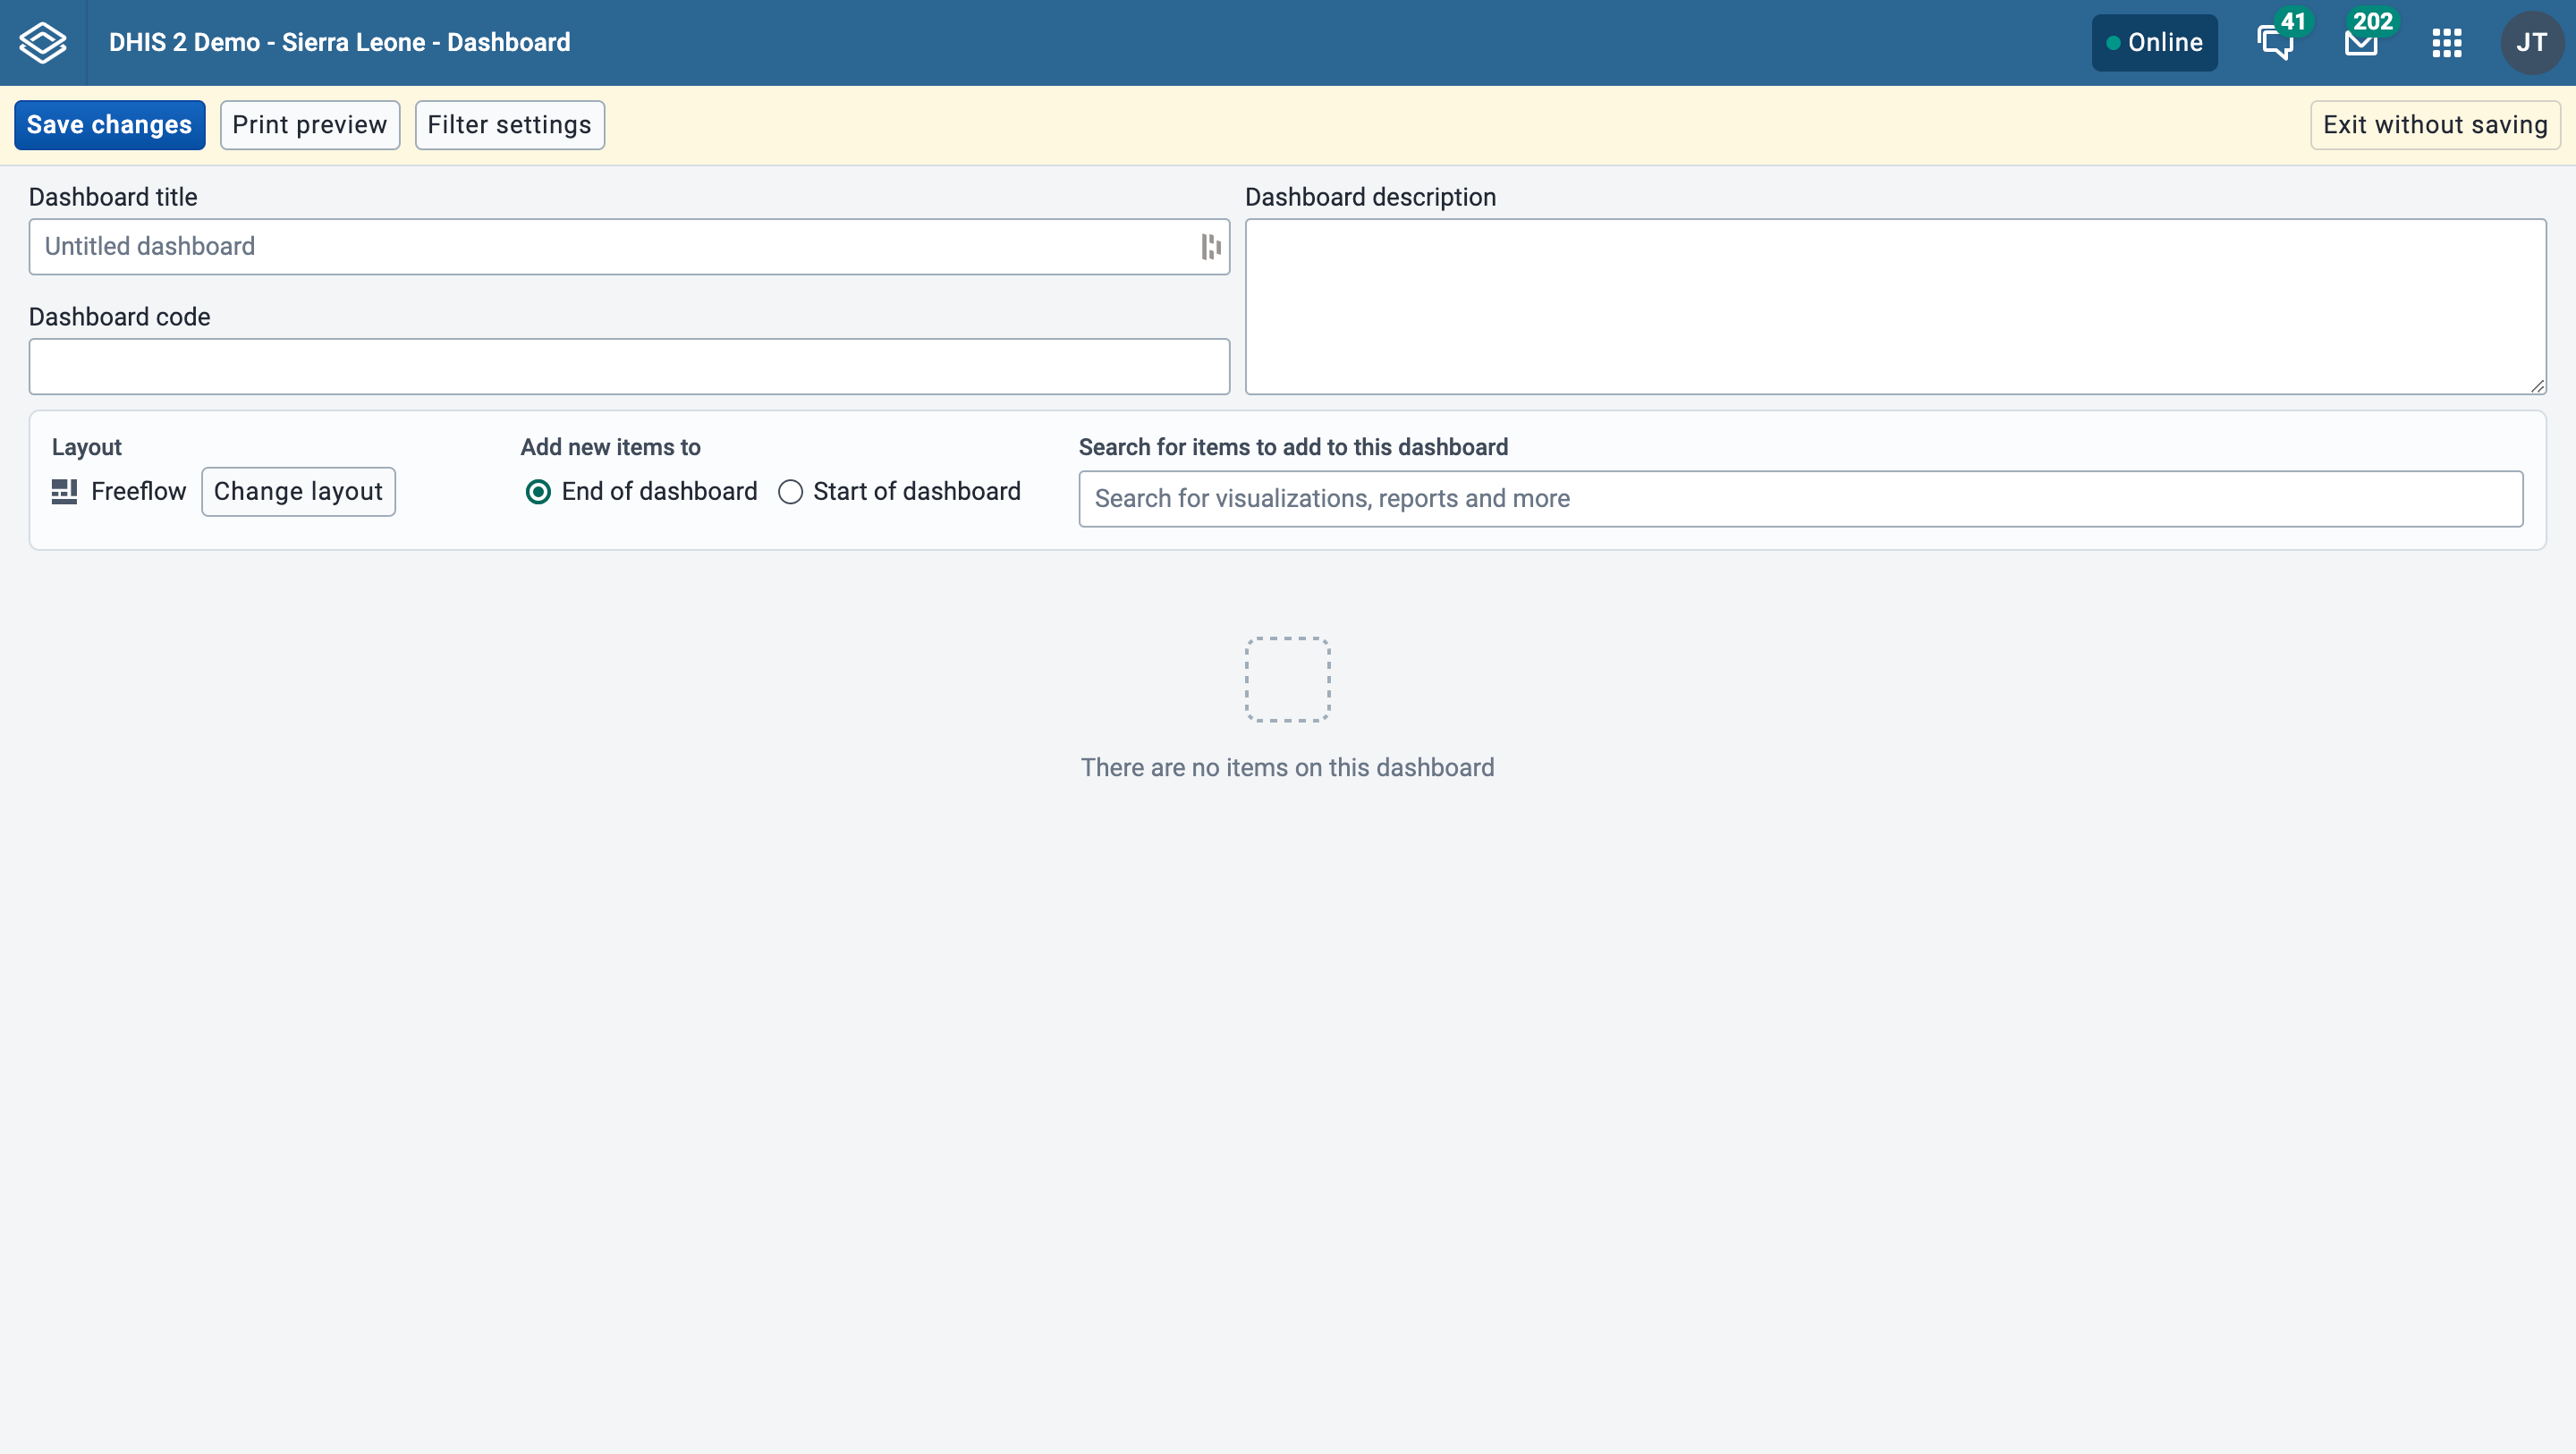
In create/edit mode, you can add or change the dashboard title, description, dashboard code and dashboard items. If you do not add a title, the dashboard will automatically be titled "Untitled dashboard".
If the system has been configured to support embedded dashboards, then you will have the option of creating a regular (internal) dashboard or embedding a dashboard from an external source. See this section for more information.
Přidávání položek na ovládací panel
Add items to the dashboard by searching for items using the Search for items to add to this dashboard dropdown selector. Item types are:
- Visualizations (charts and pivot tables)
- Mapy
- Line lists
- Zprávy o událostech
- Grafy událostí
- Zprávy
- Zdroje
- Third party plugins and app widgets
- Zprávy
- Textová pole
- Pružné mezery

The list of items in the dropdown initially displays 10 visualizations (charts and tables), and 5 from each of the other categories, based on the search text you enter. To view more items, click on Show more, and the list for that type will be extended to 25 items. If you still do not find the item you want, try typing a more specific search text. Messages (Email), text boxes and spacer items can also be chosen from the list.
Dashboard layout and placement of new items
Při přidávání položek na ovládací panel si můžete vybrat celkové rozvržení kliknutím na tlačítko Změnit rozvržení. Toto nastavení rozložení můžete kdykoli změnit.
- S rozložením Freeflow lze přidané položky přesouvat pomocí myši kliknutím na položku a přetažením na požadované místo. Velikost položek lze také změnit pomocí myši kliknutím na táhlo přetažení v pravém dolním rohu položky a přetažením na požadovanou velikost.
- With Fixed columns layout, you can choose the number of columns to have on the dashboard, and the dashboard will automatically be layed out for you. Items cannot be moved or resized in Fixed columns layout. If you want to make custom adjustments to a Fixed columns layout, return to a Freeflow layout.
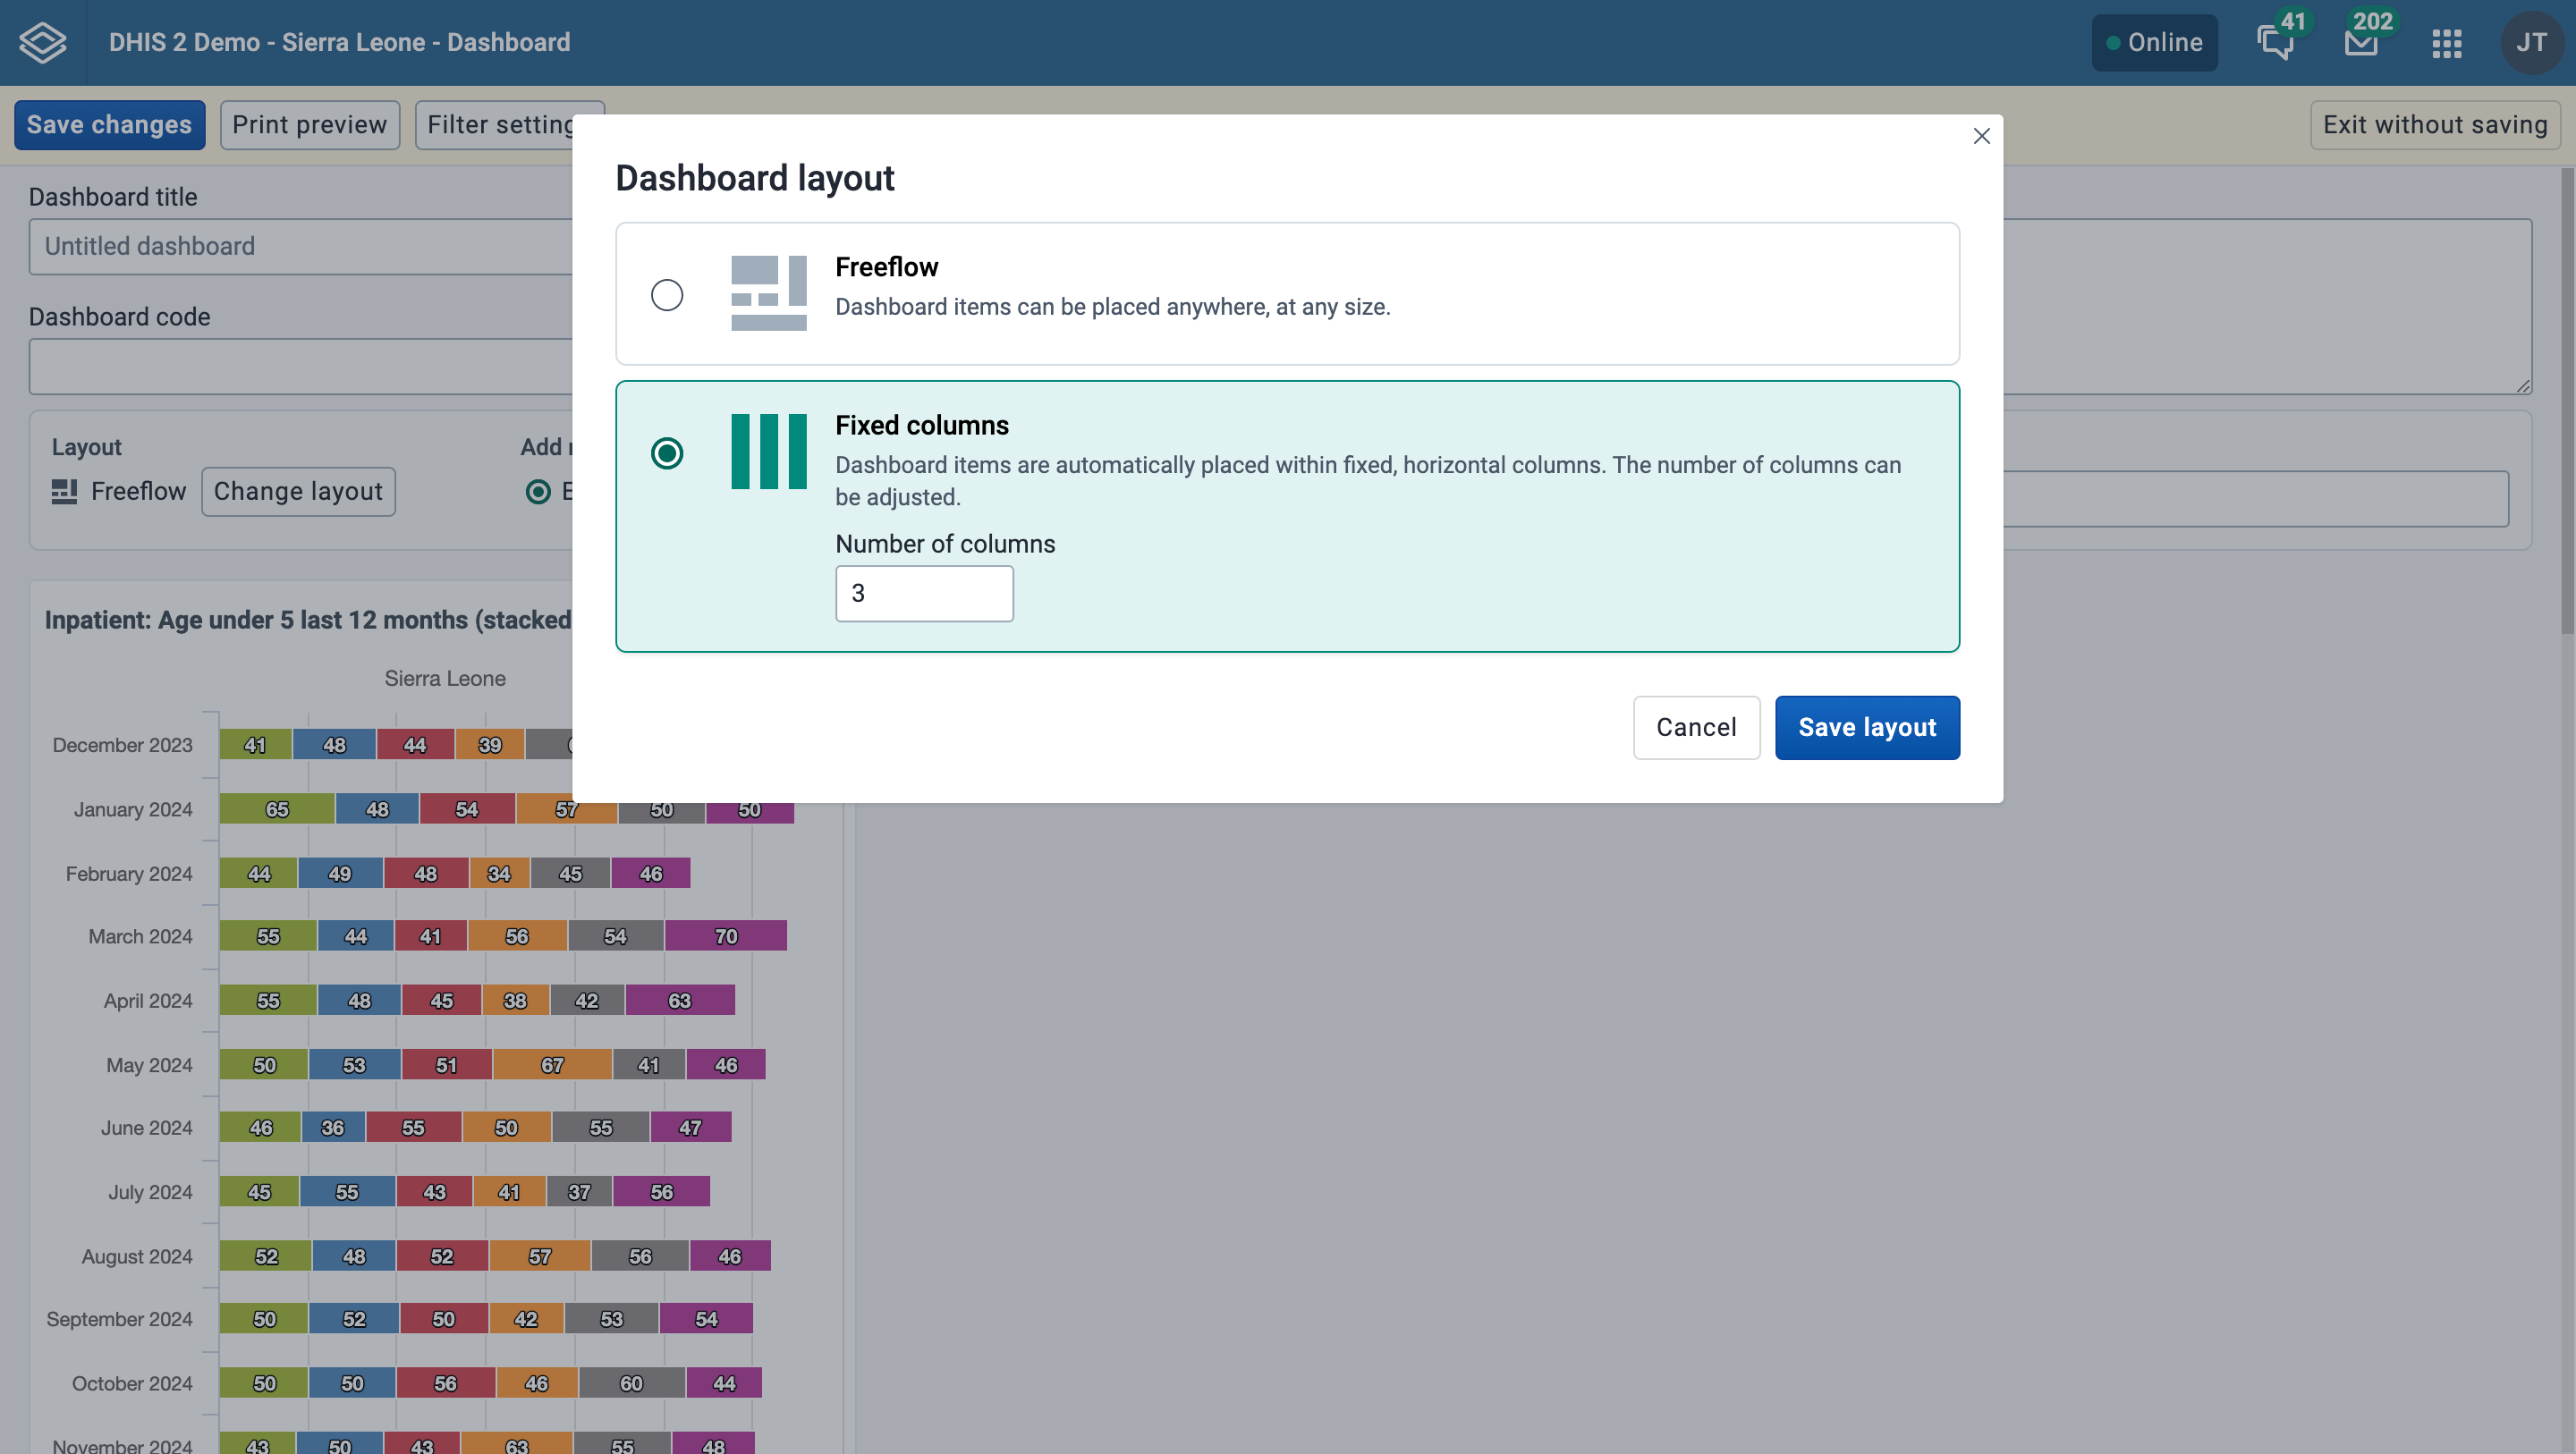
Výběrem požadované možnosti můžete také nakonfigurovat, zda se nově přidané položky automaticky umístí na začátek nebo konec ovládacího panelu. Tuto možnost lze kdykoli změnit.

Text boxes
A text box lets you add formatted text to a dashboard. While editing a text box, use the toolbar buttons for bold, italic, links, user mentions and emoji. In addition, the text box supports a subset of Markdown syntax that does not have toolbar buttons:
| Funkce | How to write it |
|---|---|
| Headings | Start a line with # for a heading. Use more # characters for smaller headings, for example ## or ###. |
| Numbered list | Start each line with a number followed by a period, for example 1., 2., 3. |
| Bulleted list | Start each line with -, * or + |
| Bold | Wrap text in single asterisks: *bold* |
| Italic | Wrap text in single underscores: _italic_ |
| Line break | Press Enter to start a new line |
For example, the following text:
# Monthly report

Key indicators for _this month_:

1. ANC coverage
2. Immunization rate

Remember to:

- Validate the data
- *Complete* the review
renders as a level-one heading, an italicised phrase, a numbered list and a bulleted list. Formatting is not shown while you type; click the Preview button in the text box toolbar (or save and view the dashboard) to see the rendered result.
Distanční prvky
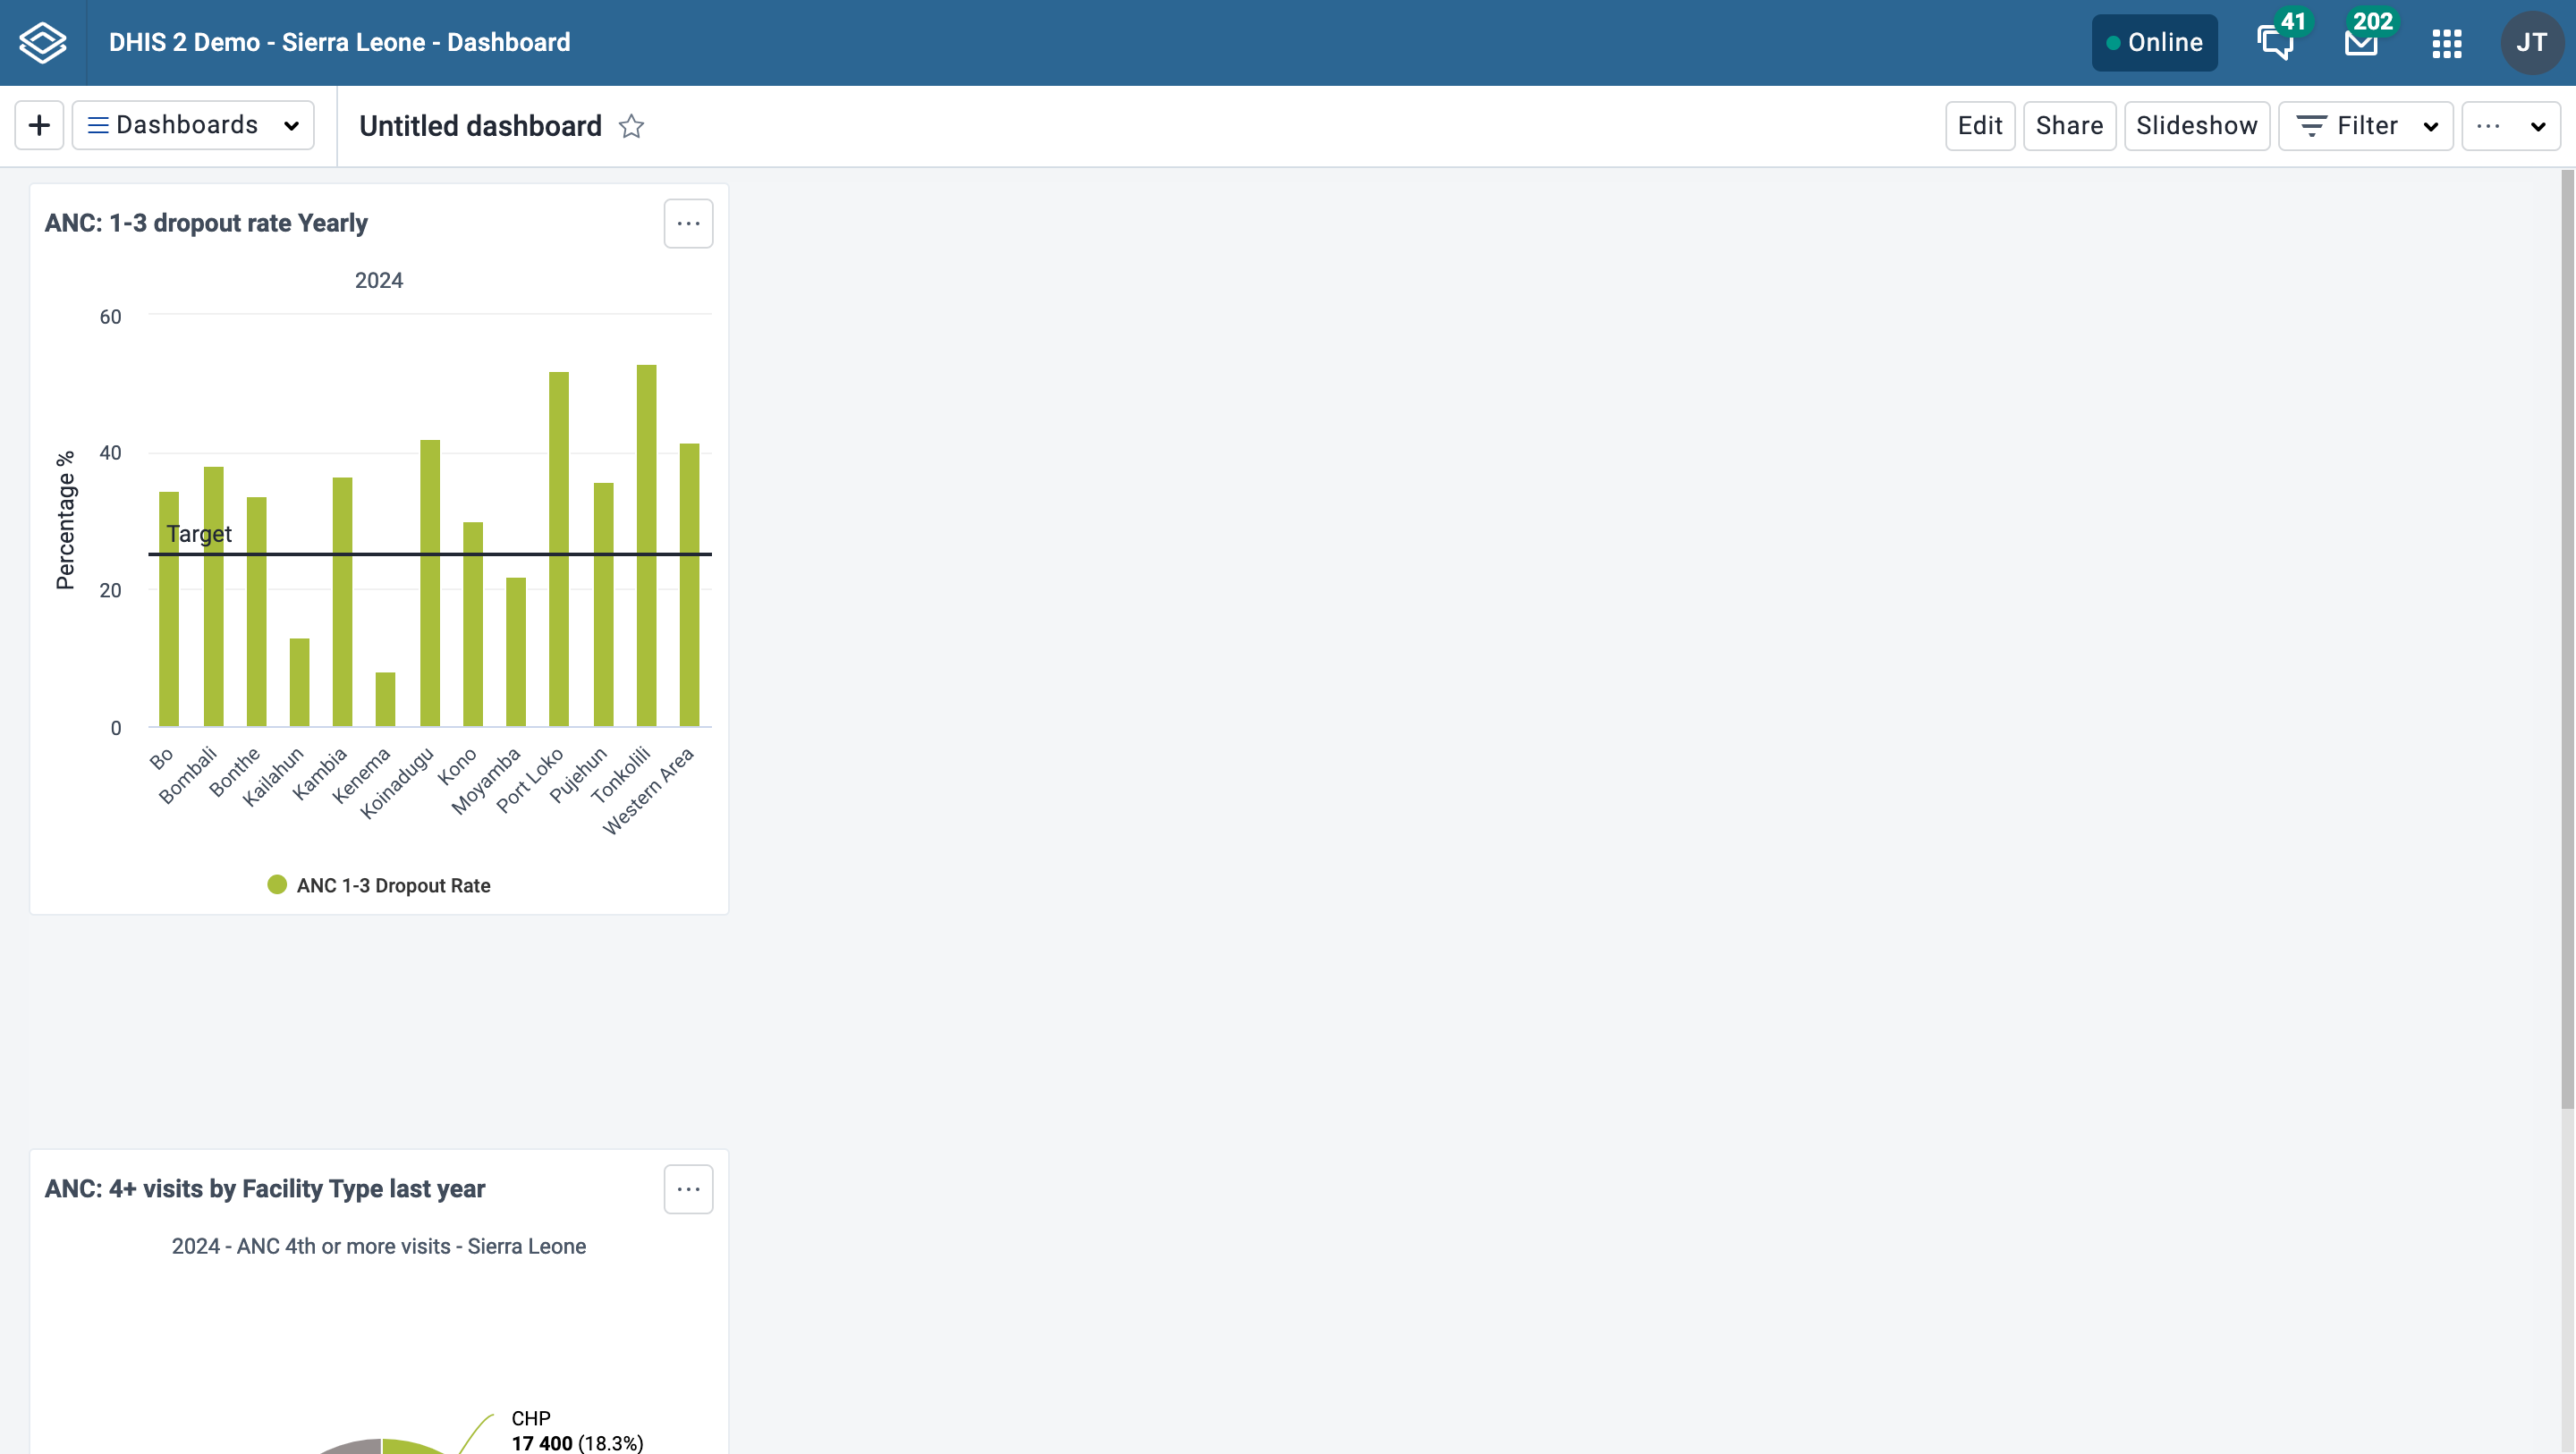
Při přidávání položek na ovládací panel pomocí rozvržení Freeflow se budou „zvedat“ nahoru, dokud nenarazí na jinou položku. Chcete-li vynutit prázdnou svislou mezeru mezi položkami (jako je prázdný řádek), můžete na ovládací panel přidat vymezovací prvky. Jsou viditelné pouze v režimu úprav/vytváření. V režimu prohlížení se nezobrazují, ale zabírají definované místo.
Distanční prvek v režimu úpravy / vytvoření:

Distanční prvek v režimu zobrazení:
Odebírání položek
Remove items by clicking on the red trash can at the upper right of the item. Be aware that when you remove an item while in Freeflow layout, the items that are positioned below the removed item will "rise" upwards until they bump into an item above. in Fixed columns layout, the items will be adjusted to fill every column in the layout so there are no empty column slots.
Actions in create/edit mode
V režimu vytváření/úprav uvidíte na liště akcí v horní části stránky následující tlačítka: Uložit změny, Náhled tisku, Nastavení filtru, Přeložit, Smazat a Ukončit bez uložení. Tlačítka Přeložit a Smazat se zobrazí pouze v případě, že upravujete existující ovládací panel.

Ukládání ovládacího panelu
Při vytváření nebo úpravě ovládacího panelu se změny uloží, když kliknete na tlačítko Uložit změny. Pokud změny uložit nechcete, klikněte na tlačítko Ukončit bez uložení. Poté se vrátíte do režimu zobrazení s ovládacím panelem, který jste si prohlíželi dříve.
Náhled před tiskem
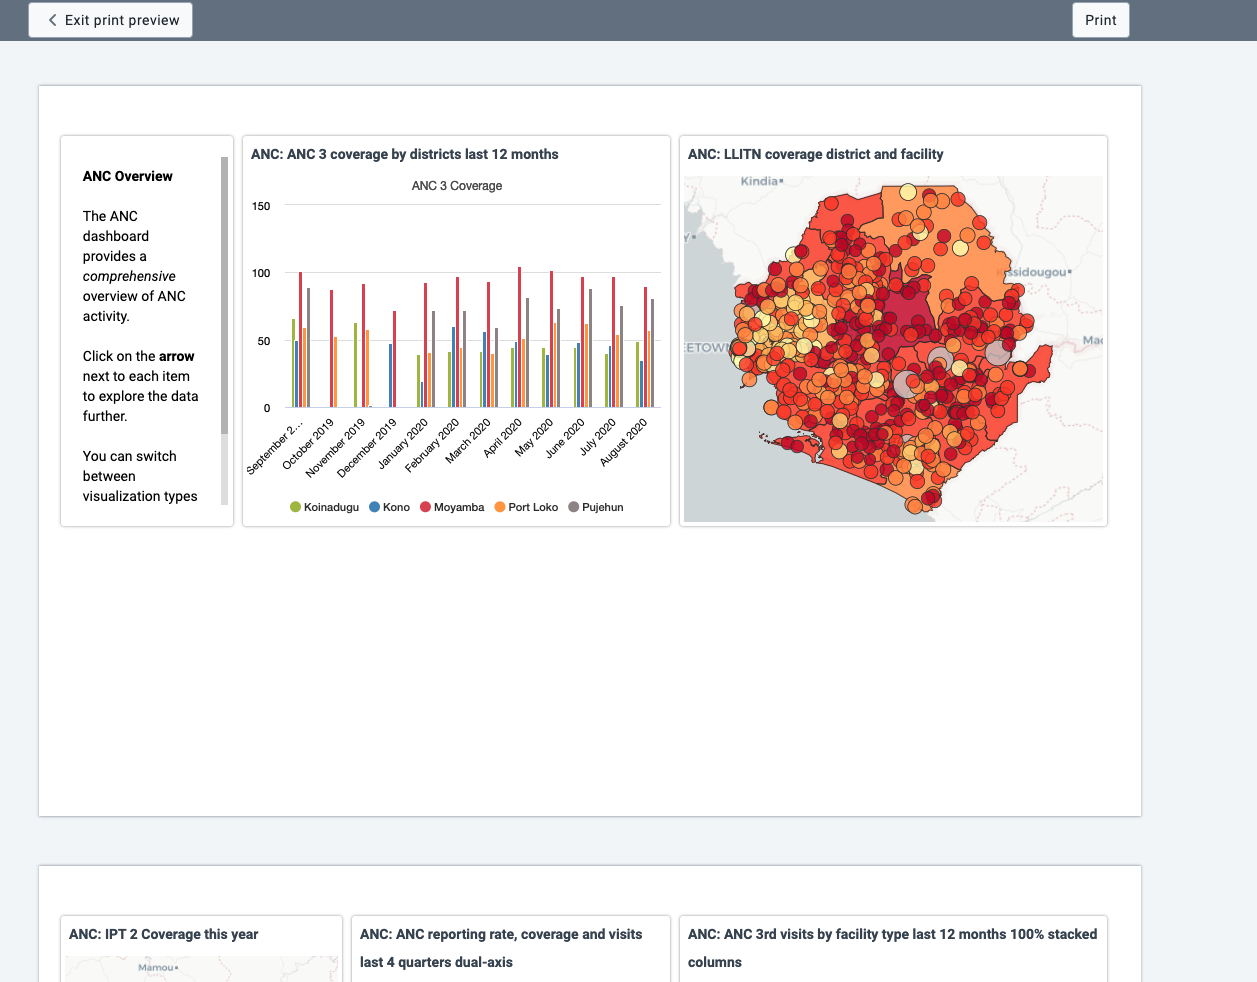
Kliknutím na tlačítko Náhled tisku zobrazíte, jak bude ovládací panel vypadat při tisku pomocí možnost rozvržení ovládacího panelu.
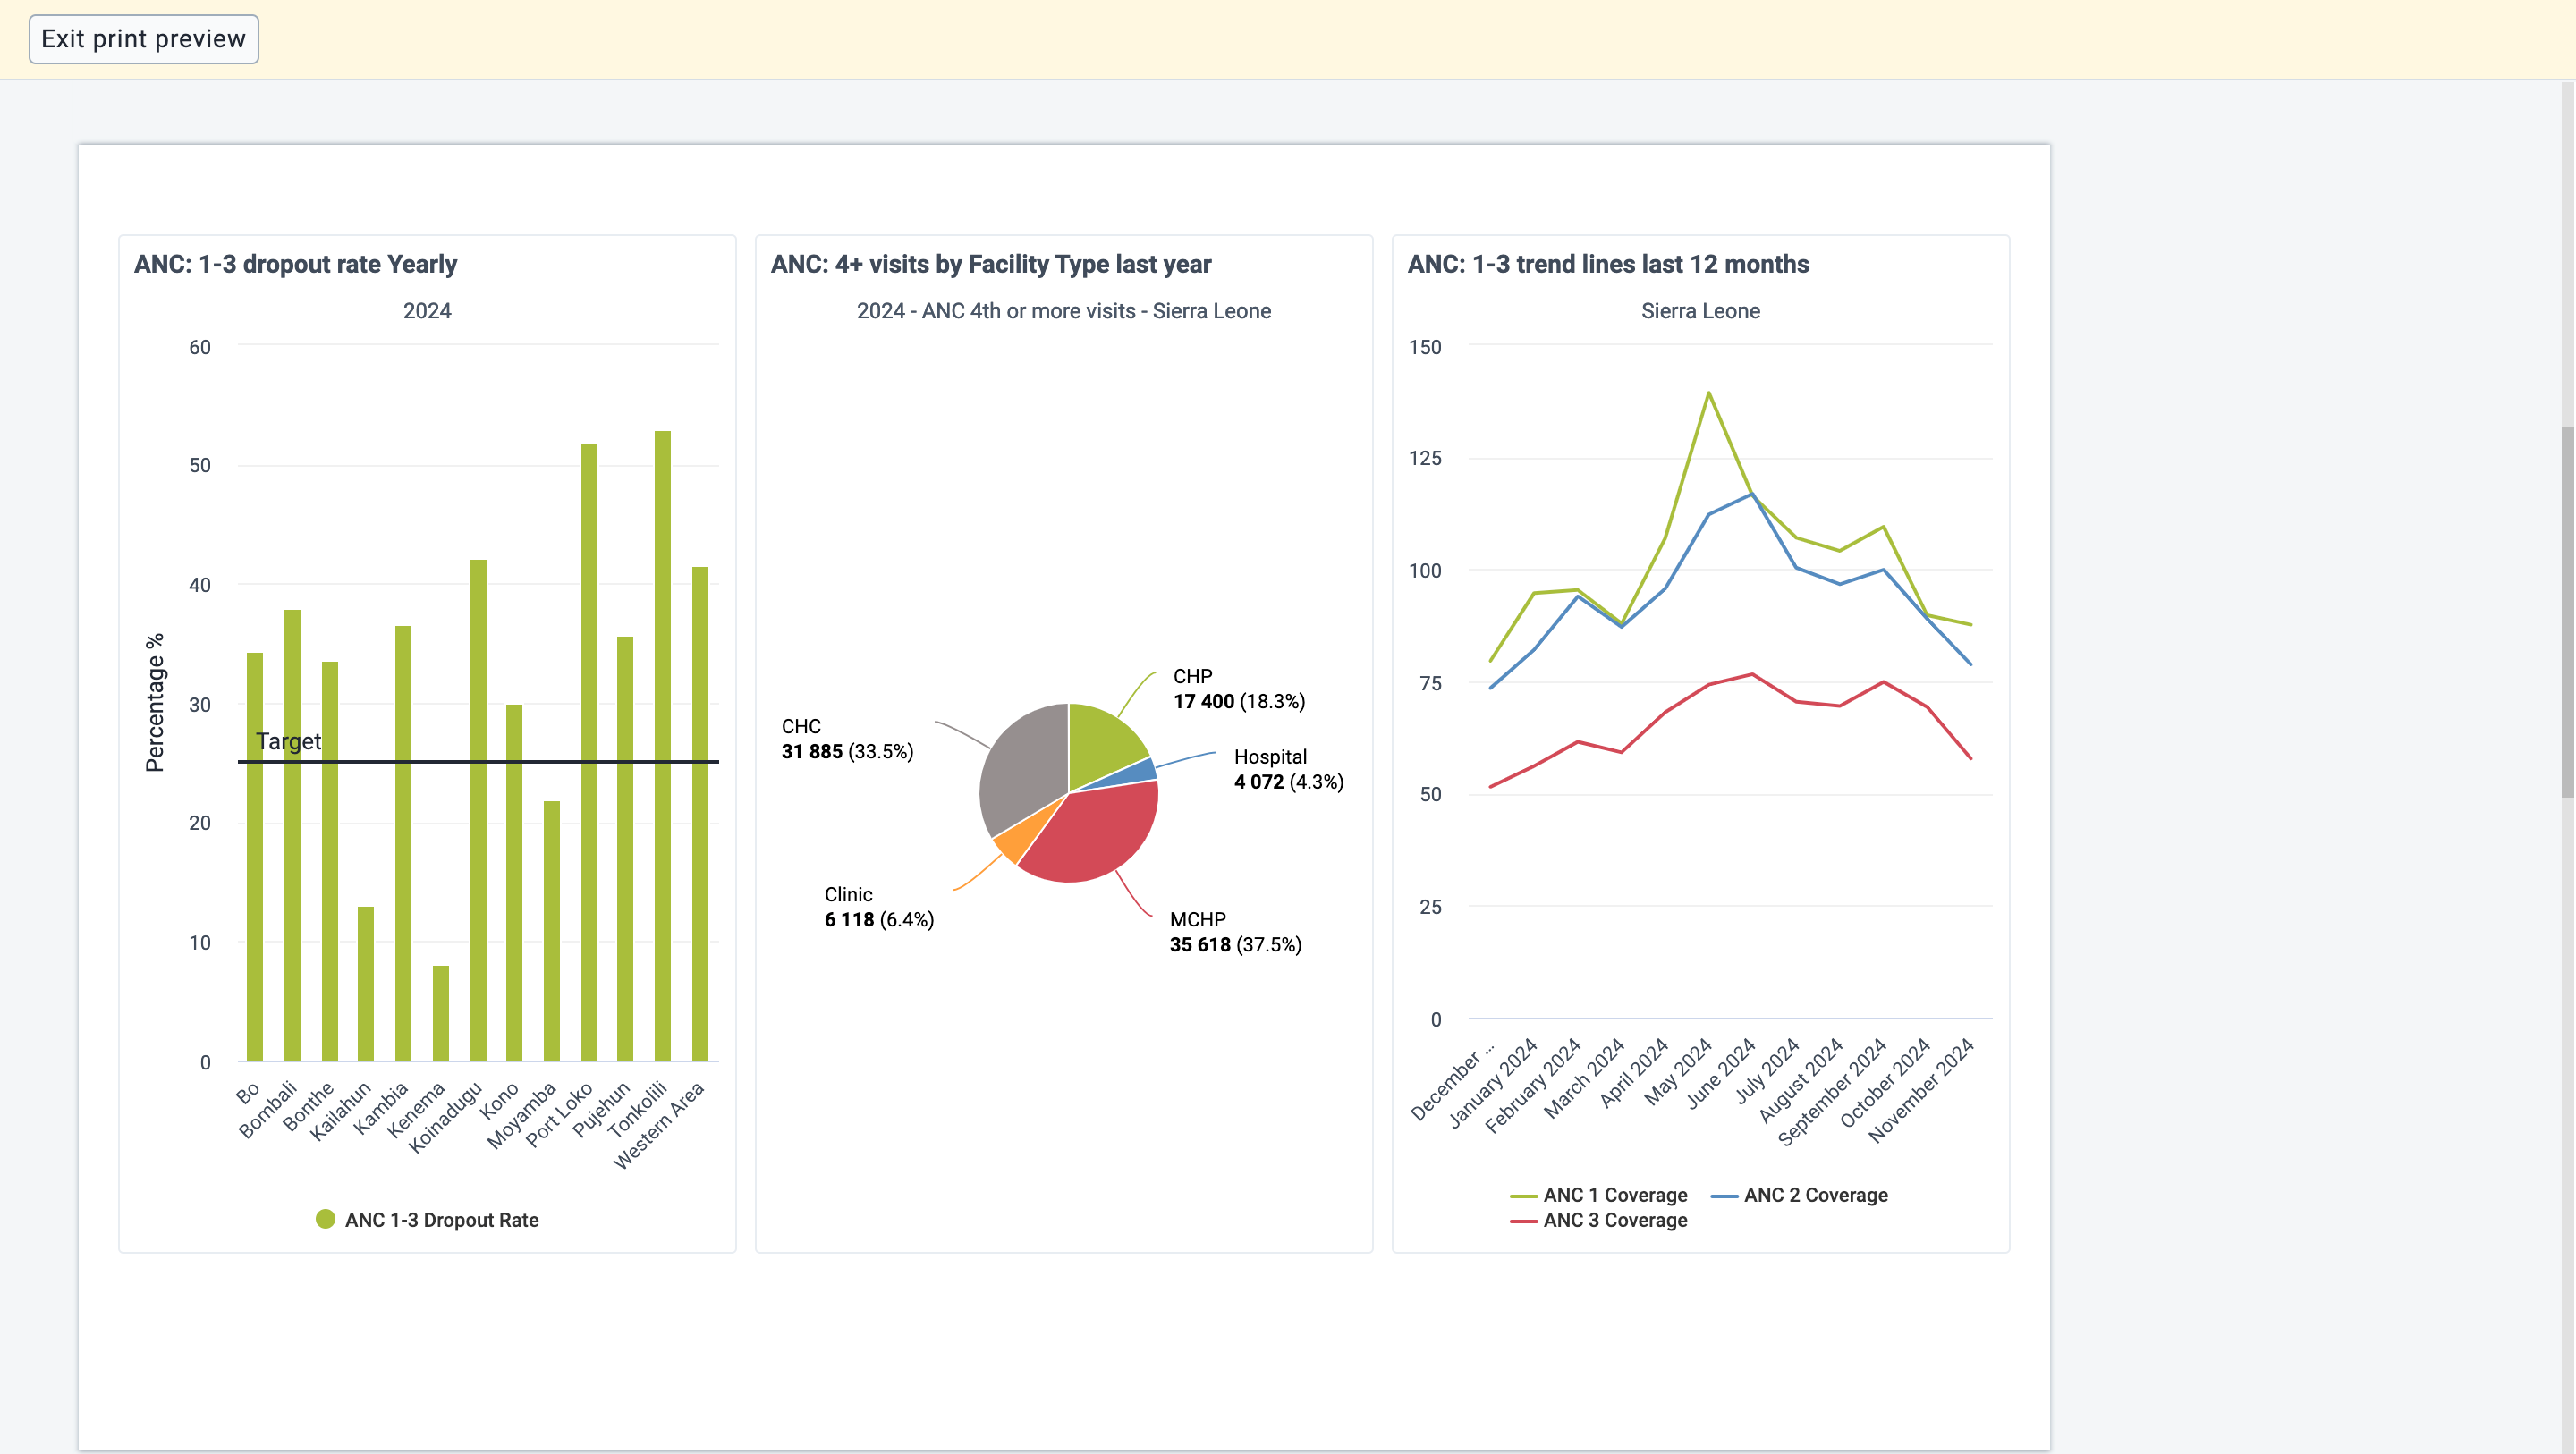
Kliknutím na Ukončit náhled tisku se vrátíte k úpravám ovládacího panelu.
Pamatujte, že některé položky mohou být přesunuty na další stránku, aby nebyly rozděleny na dvě stránky. Položky lze také zkrátit, aby se vešly na jednu stránku. U položek, které jsou zkrácené, se v náhledu zobrazuje ikona informací v pravém horním rohu položky. Informační ikona není ve skutečném tisku viditelná.
Omezení filtrů ovládacího panelu
Ve výchozím nastavení budou uživatelé moci filtrovat položky ovládacího panelu podle jakékoli dimenze definované v instanci DHIS2. Nastavení filtru ovládacího panelu lze upravit pro ovládací panel kliknutím na Nastavení filtru.
Chcete-li omezit dostupné filtry, můžete kliknout na Povolit filtrování pouze podle vybraných dimenzí a vybrat filtry, které chcete na řídicím panelu povolit. Období a organizační jednotka jsou vybrány ve výchozím nastavení, ale lze je v případě potřeby odebrat. Při zobrazení ovládacího panelu si uživatelé budou moci vybrat pouze z vybraných filtrů.

Chcete-li uložit aktualizace nastavení filtru, musíte nejprve kliknutím na Potvrdit zavřete dialogové okno Nastavení filtru a poté kliknutím na Uložit změny uložíte změny ovládacího panelu.

Překlad názvu a popisu ovládacího panelu
If you are editing an existing dashboard, then there will be a Translate button. Click on this button to open the Translation dialog, which provides a list of languages to translate to, and shows the original dashboard title and description. First choose the language you want to translate for, then fill in the dashboard name and description translation.

Odstranění ovládacího panelu
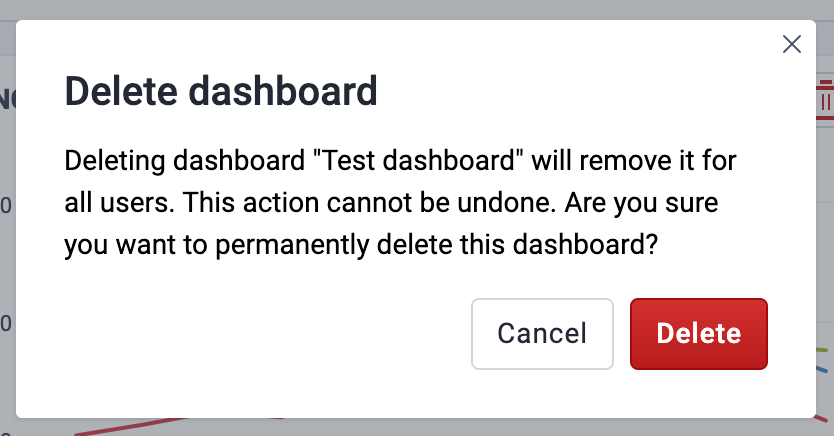
Pokud máte přístup k odstranění ovládacího panelu, bude zde tlačítko Smazat. Když kliknete na tlačítko Smazat, zobrazí se nejprve potvrzovací dialog pro potvrzení, že chcete ovládací panel smazat.
Creating and editing an external dashboard
If the system has been configured to support embedded (Superset) dashboards, and you start creating a new dashboard by clicking the + button, you will be presented with a choice:

If you choose the "External" option here and click "continue", you will be taken to a modal form where you can create an embedded dashboard:
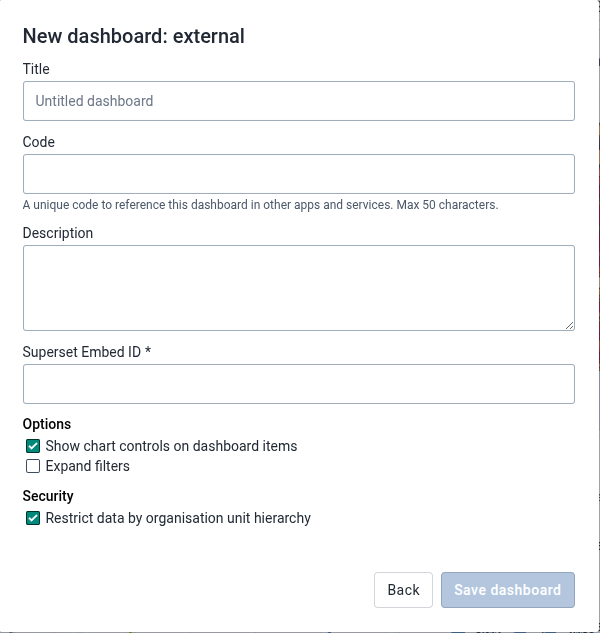
The "Title", "Code" and "Description" fields in this form are identical to the fields with the same names you see when creating a regular (internal) dashboard, but there are also some notable differences:
- Since the dashboard content is coming from an external system (Superset), there is no need to add dashboard items
- A "Superset Embed ID" needs to be provided so the app can retrieve the correct dashboard from the external Superset service
- The "Show chart controls on dashboard items" checkbox controls whether or not each embedded dashboard item has a dropdown menu
- The "Expand filters" checkbox controls whether or not the filter section of the embedded dashboard is initially expanded or collapsed
- The "Restrict data by organisation unit hierarchy" checkbox controls whether or not organisation unit user access will be applied to the external data source. Only visible in this dialog when it is supported by the Superset Gateway.

Once the dashboard is created, you can star/unstar, edit and share it. You can also show and hide the description and close the dashboard. It is not possible to show it in slideshow mode, filter it, or enter print view mode.
Configuring the system for embedded Superset dashboards
In order for the embedded Superset dashboards feature to work, the following prerequisites need to be met:
- The system must have access to a Superset service (installation instructions)
- The Superset Gateway must be installed (instructions)
- Support for embedded dashboards must be enabled in the "Analytics" section of the DHIS2 System Settings App
Zobrazení ovládacího panelu
The following actions are available on the dashboard in view mode:
- Set the show/hide description setting
- Star the dashboard so it appears first in the dashboard list
- Filter the dashboard
- Print the dashboard
- Display the dashboard in a slideshow
- Make the dashboard available offline
- Share the dashboard with other users and user groups
- Close the dashboard

Zobrazit popis
To toggle the description, open the ... menu and choose Show description (or Hide description). This setting will be remembered for all dashboards that you open. This setting applies to you, not other users.
Ovládací panely označené hvězdičkou
Your starred dashboards are listed first in the list of dashboards for quick access. To star a dashboard, click on the star button to the right of the title. You can also toggle the star from the ... menu. When the star is “filled”, that means the dashboard is starred. Starring a dashboard only applies to you, not other users.
Filter a dashboard
Použitím filtrů na ovládací panel změníte data zobrazená v položkách ovládacího panelu obsahujících vizualizace. Filtry se aplikují na každou položku ovládacího panelu stejným způsobem: každý přidaný filtr přepíše původní hodnotu pro danou dimenzi v původním grafu, tabulce nebo mapě. V závislosti na instanci DHIS2 je možné filtrovat podle organizačních jednotek a období a také podle dynamických dimenzí. Na ovládací panel můžete použít více filtrů.
To add a filter, click on the Filter button and choose a dimension:

Otevře se dialogové okno, kde lze provést výběr filtru.

Kliknutím na Potvrdit v dialogovém okně použijete filtr na aktuální ovládací panel.
Filtry se neukládají, takže při přepnutí na jinou palubní desku se resetují. Nad položkami ovládacího panelu se zobrazují černé odznaky filtrů, které označují, které filtry byly použity na vizualizace ovládacího panelu.

Filtr můžete upravit kliknutím na odznak filtru, čímž se otevře dialog pro výběr filtru. Filtr lze odstranit kliknutím na tlačítko Odebrat na odznaku. Kdykoli je filtr přidán, upraven nebo odstraněn, položky ovládacího panelu se znovu načtou, aby se zobrazila aktualizovaná data. Odznaky filtru jsou vždy viditelné v horní části stránky při posouvání obsahu ovládacího panelu.
Ve výchozím nastavení mohou uživatelé filtrovat položky ovládacího panelu podle libovolné dimenze definované v instanci DHIS2. Chcete-li omezit dostupné filtry, přečtěte si část Omezení filtrů ovládacího panelu.
Display the dashboard in a slideshow
The dashboard can be displayed in a slideshow by clicking on the Slideshow button. Once in slideshow mode, you'll find all the slideshow controls, including the manual navigation buttons, autoplay controls, and exit button in the slideshow control bar at the bottom of the page.

Slideshow control bar:

The slideshow can be autoplayed, or navigated manually.
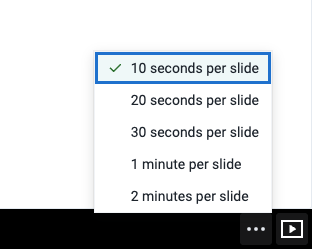
When you enter the slideshow, it is paused. Click the play/pause button in the control bar to start the autoplay, and the slides will automatically advance according to the timing setting. A countdown bar is visible on the play/pause button while the slideshow is playing. Once the slideshow has reached the last slide, it will restart automatically. If 24 hours has passed since the slideshow began, a message stating as such will appear in the control bar, since data does not refresh during the slideshow and may be considered out of date for certain visualizations.
The autoplay controls include the play/pause button and the timing settings button. The user's most recent selected timing setting is remembered for the next time the slideshow is started.
You can also navigate the slides manually both when the slideshow is playing and paused. Use the manual navigation buttons or forward/back arrow keys on the keyboard to navigate through the slides. If the slideshow is playing, the timer resets when manually navigating, and the slideshow will automatically advance unless you click pause.
Exit the slideshow with the esc key or by pressing the exit button.
Any filters that are applied will be displayed in the slideshow control bar. Note that messages and spacer items are not displayed in the slideshow.

Make dashboards available offline
To make a dashboard available offline, choose the Make available offline option in the ... menu. This will cause a reload of the dashboard where requests to the server are recorded and saved in browser storage. Note that offline dashboards are only available on the computer and browser where you set it to offline. If you currently have a filter applied when requesting the dashboard be made available offline, a dialog will appear to confirm the removal of the filters.
Note that some dashboard items may not be displayed when offline. Specifically, third party plugins that have not implemented offline handling, as well as maps with Google Earth Engine layers will not be displayed when offline.

Dashboards that have been saved for offline display a tag next to the dashboard title showing the time it was saved. In the dashboard selector, an icon is displayed if the dashboard is available offline.
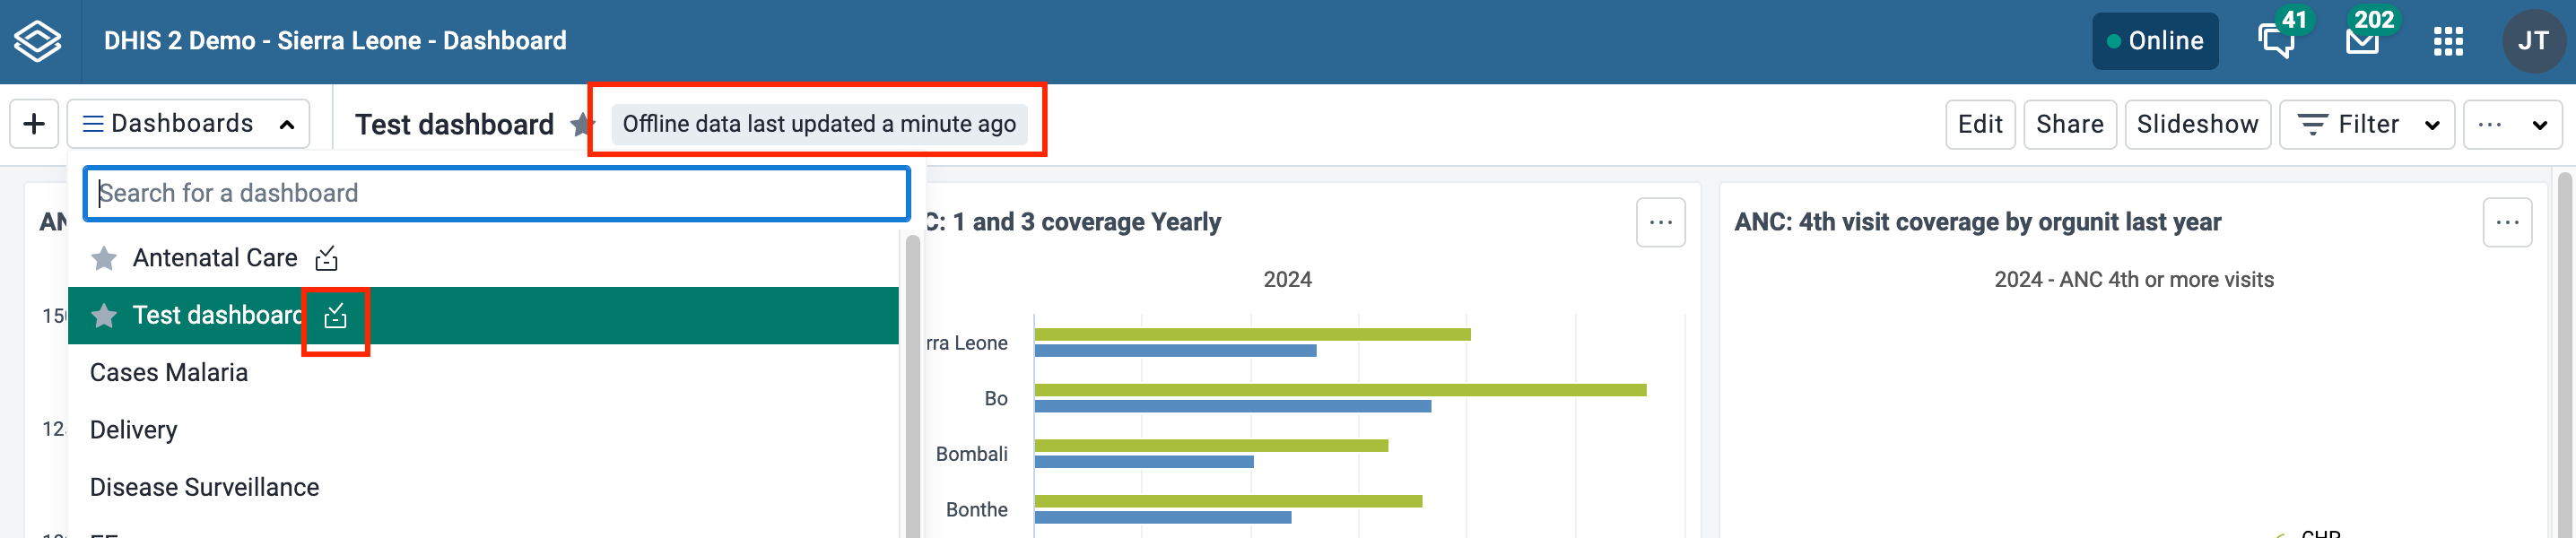
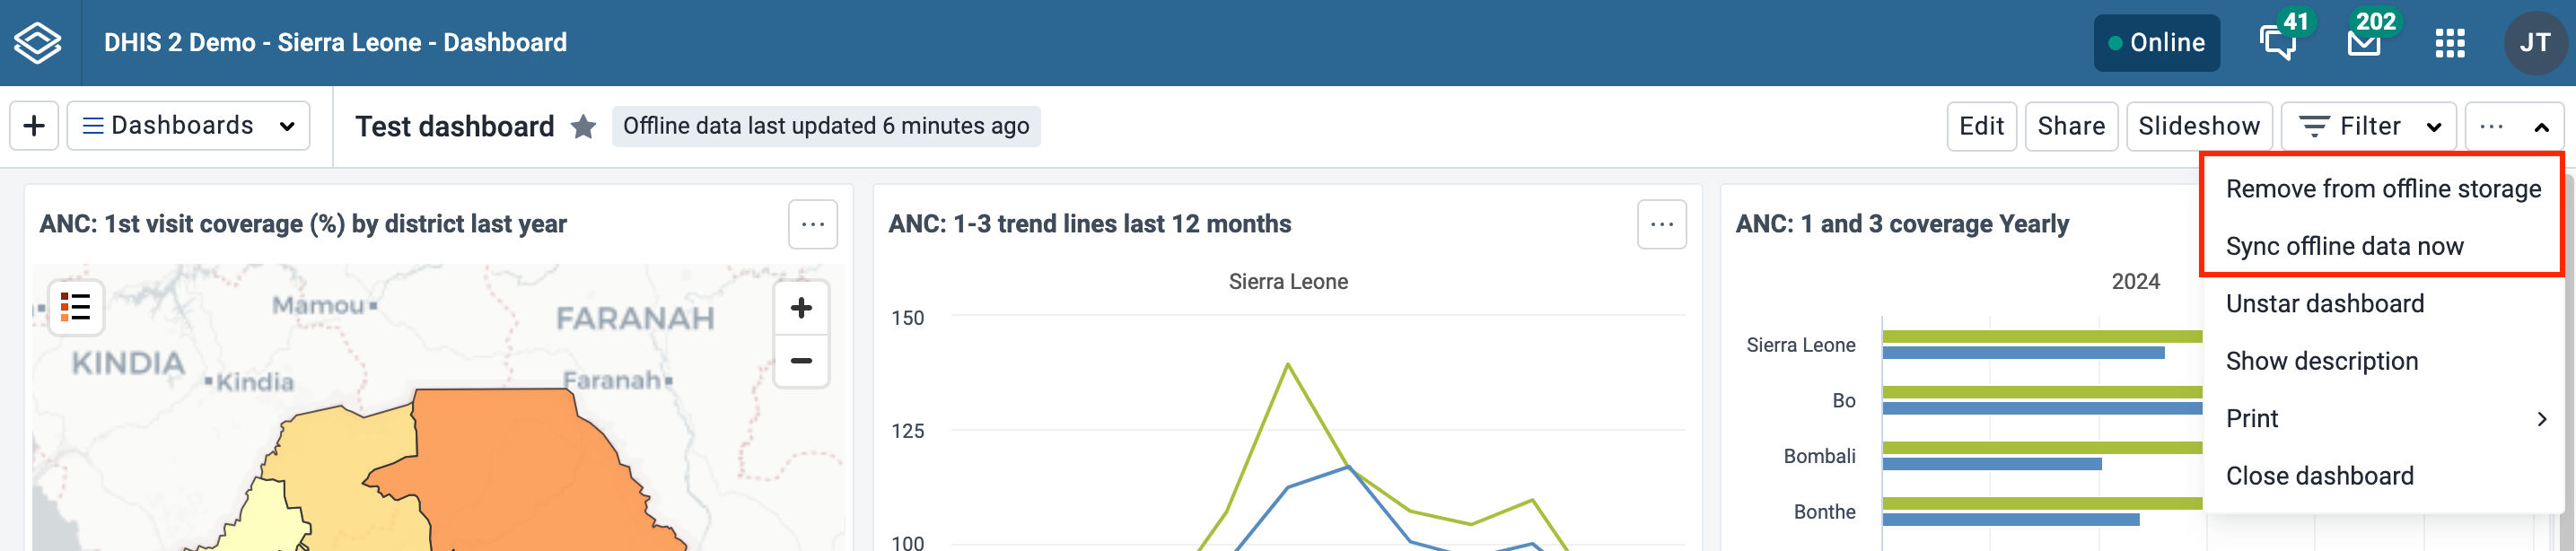
If the dashboard has been changed since you made it available offline, either by you or someone else, you'll need to choose Sync offline data now from the ... menu to save the latest version of the dashboard.
You can remove a dashboard from offline storaged by choosing Remove from offline storage in the ... menu.
Other notes about Dashboards app when you are offline
Pokud se ručně odhlásíte z instance DHIS2, všechny ovládací panely uložené v mezipaměti budou vymazány a již nebudou dostupné offline.
Pokud jste offline, všechna tlačítka nebo akce, které k úspěšnému dokončení vyžadují připojení, jsou zakázány. Po obnovení připojení budou znovu povoleny.
Tisk ovládacího panelu
From the ... menu you can print the current dashboard. There are two styles of dashboard print: Dashboard layout and One item per page. For both styles, a title page is added that shows the dashboard title, description (if the Show description setting is enabled), and any applied dashboard filters.

Pro nejlepší výsledky tisku:
- použijte Chrome nebo Edge
- před tiskem počkejte, až se načtou všechny položky na ovládacím panelu
- použijte nastavení A4 na šířku s nastavenými výchozími okraji a zapnutou grafikou na pozadí
Tisk rozvržení ovládacího panelu
Tisk rozvržení ovládacího panelu bude přibližovat rozvržení ovládacího panelu tak, jak je zobrazeno v prohlížeči. Všimněte si, že může být nutné provést některé úpravy rozvržení, aby se zabránilo rozdělení položek na více stránek: položky, které by byly oříznuty zalomením stránky, se přesunou na další stránku a položky, které jsou vyšší než jedna stránka, se zkrátí. aby se vešly na jednu stránku.
Jakmile jste v režimu tisku, klikněte na tlačítko Tisk v pravém horním rohu pro spuštění funkce tisku prohlížeče.
Vytiskněte jednu položku na stránku
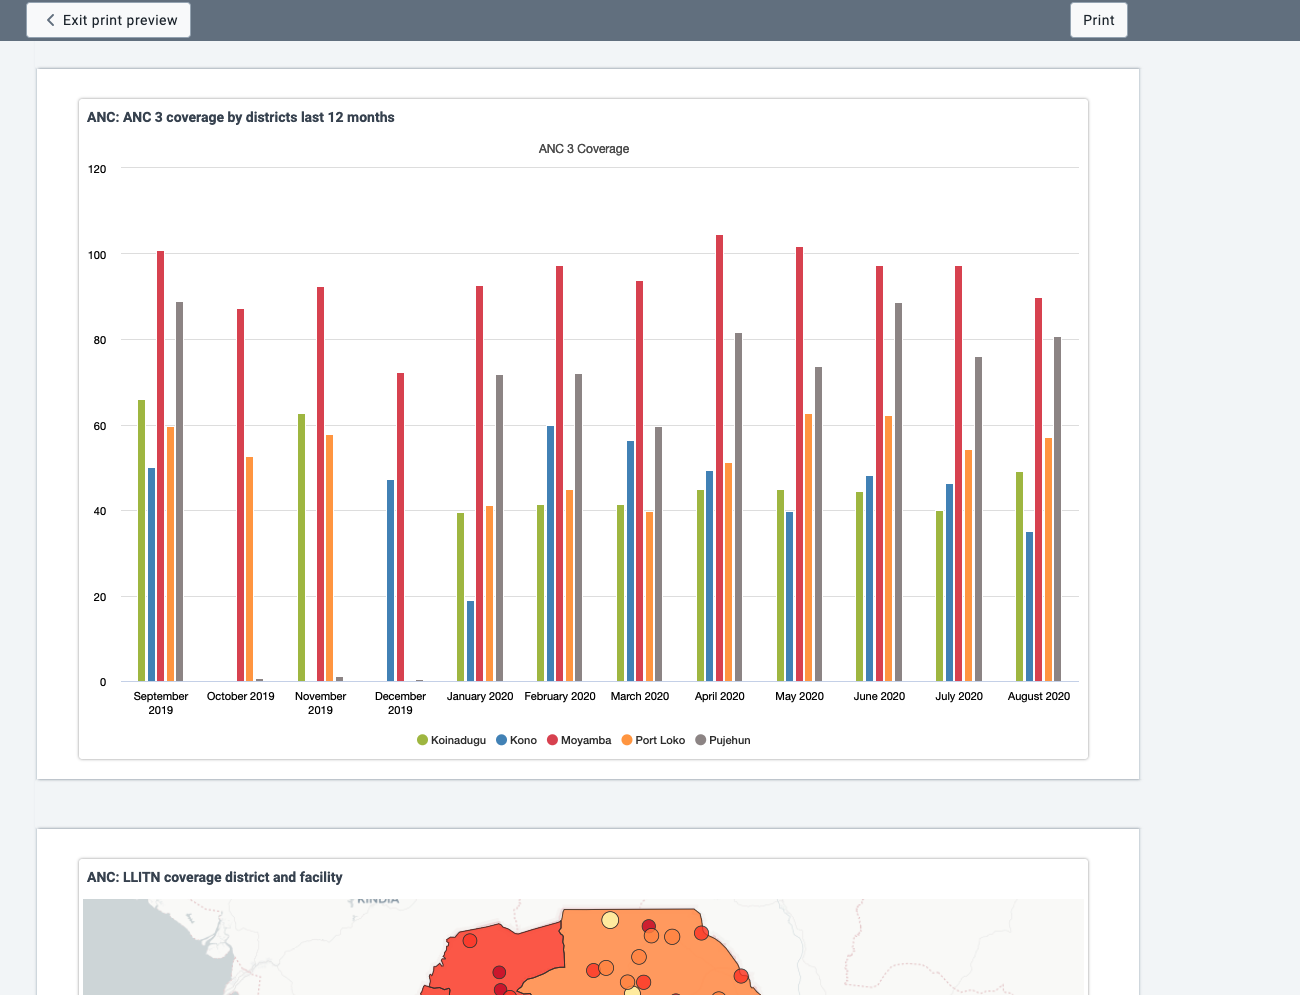
Tento styl tisku vytiskne každou položku ovládacího panelu na samostatnou stránku, čímž se maximalizuje využití velikosti papíru.
Kliknutím na tlačítko Tisk v pravém horním rohu spustíte funkci tisku prohlížeče.
Dashboard items with charts, pivot tables, maps and line lists
Dashboard items with charts, pivot table, maps, line lists, event reports and event charts may have an item menu button in the upper right corner of the item with additional viewing options, depending on the system settings that have been configured for the DHIS2 instance. If all the relevant system settings have been disabled by the DHIS2 instance, then there will not be an item menu button. Here are the possible item menu options:
Přepínání mezi vizualizacemi
It is possible to toggle the visualization view of charts, pivot tables and maps, and between event charts and reports. Click on the item menu button and choose the desired view (e.g., View as Table, View as Map, View as Chart):

View item in fullscreen
To view the chart, table, map or line list in fullscreen, click on the View fullscreen option. To exit fullscreen, you can either press esc key or click the exit button in the upper right corner of the fullscreen view. Note that you actually enter the slideshow in a paused state, and can then use the navigation bar or click the play button as described in the Slideshow section to navigate to other dashboard items in fullscreen.
Open in app
Chcete-li otevřít vizualizaci v příslušné aplikaci (např. Data Visualizer, Maps), klikněte na možnost Otevřít v aplikaci [název aplikace].
Show interpretations and details
You can write interpretations for charts, pivot tables, maps, line lists, event reports, and event charts by clicking on Show interpretations and details. The item will be expanded vertically underneath to show the description, interpretations and replies:

You can like an interpretation, reply to an interpretation, and add your own interpretations. You can edit, share or delete your own interpretations and replies, and if you have moderator access, you can delete others’ interpretations.
It is possible to format interpretation text with bold, italic by using the Markdown style markers * and _ for bold and italic respectively. The text field for writing new interpretations has a toolbar for adding rich text. Keyboard shortcuts are also available: Ctrl/Cmd + B and Ctrl/Cmd + I. A limited set of smilies is supported and can be used by typing one of the following character combinations: :) :-) :( :-( :+1 :-1. URLs are automatically detected and converted into a clickable link.
Interpretace jsou seřazeny podle data v sestupném pořadí, nejnovější jsou zobrazeny nahoře. Odpovědi na interpretaci jsou řazeny vzestupně podle data, přičemž nejstarší jsou zobrazeny nahoře.

Share the dashboard
In order to share the dashboard with users and user groups, click on the Share button to the right of the dashboard title to display the Sharing and access dialog.

Pro ovládací panel jsou k dispozici tři úrovně oprávnění ke sdílení:
-
Žádný přístup
Uživatel nebo skupina uživatelů nemůže zobrazit ani upravit ovládací panel. Pokud se pokusí získat přístup k ovládacímu panelu pomocí adresy URL, aplikace Ovládací panel zobrazí zprávu „Požadovaný ovládací panel nenalezen“.
-
Pouze prohlížet
Uživatel nebo skupina uživatelů může zobrazit ovládací panel, ale nemůže jej upravovat.
-
Zobrazit a upravit
Uživatel nebo skupina uživatelů může prohlížet a upravovat ovládací panel. Tato úroveň sdílení umožňuje všechny typy změn, včetně změny rozvržení, změny velikosti a odebrání položek, přejmenování a odstranění ovládacího panelu atd.
Všechny ovládací panely mají ve výchozím nastavení skupinu Všichni uživatelé nastavenou na Bez přístupu. Skupina Všichni uživatelé zahrnuje všechny přihlášené uživatele.
Add users and user groups
Chcete-li sdílet ovládací panel s konkrétními uživateli a skupinami uživatelů, zadejte název do vstupního pole, vyberte požadovanou úroveň přístupu a klikněte na Udělit přístup.
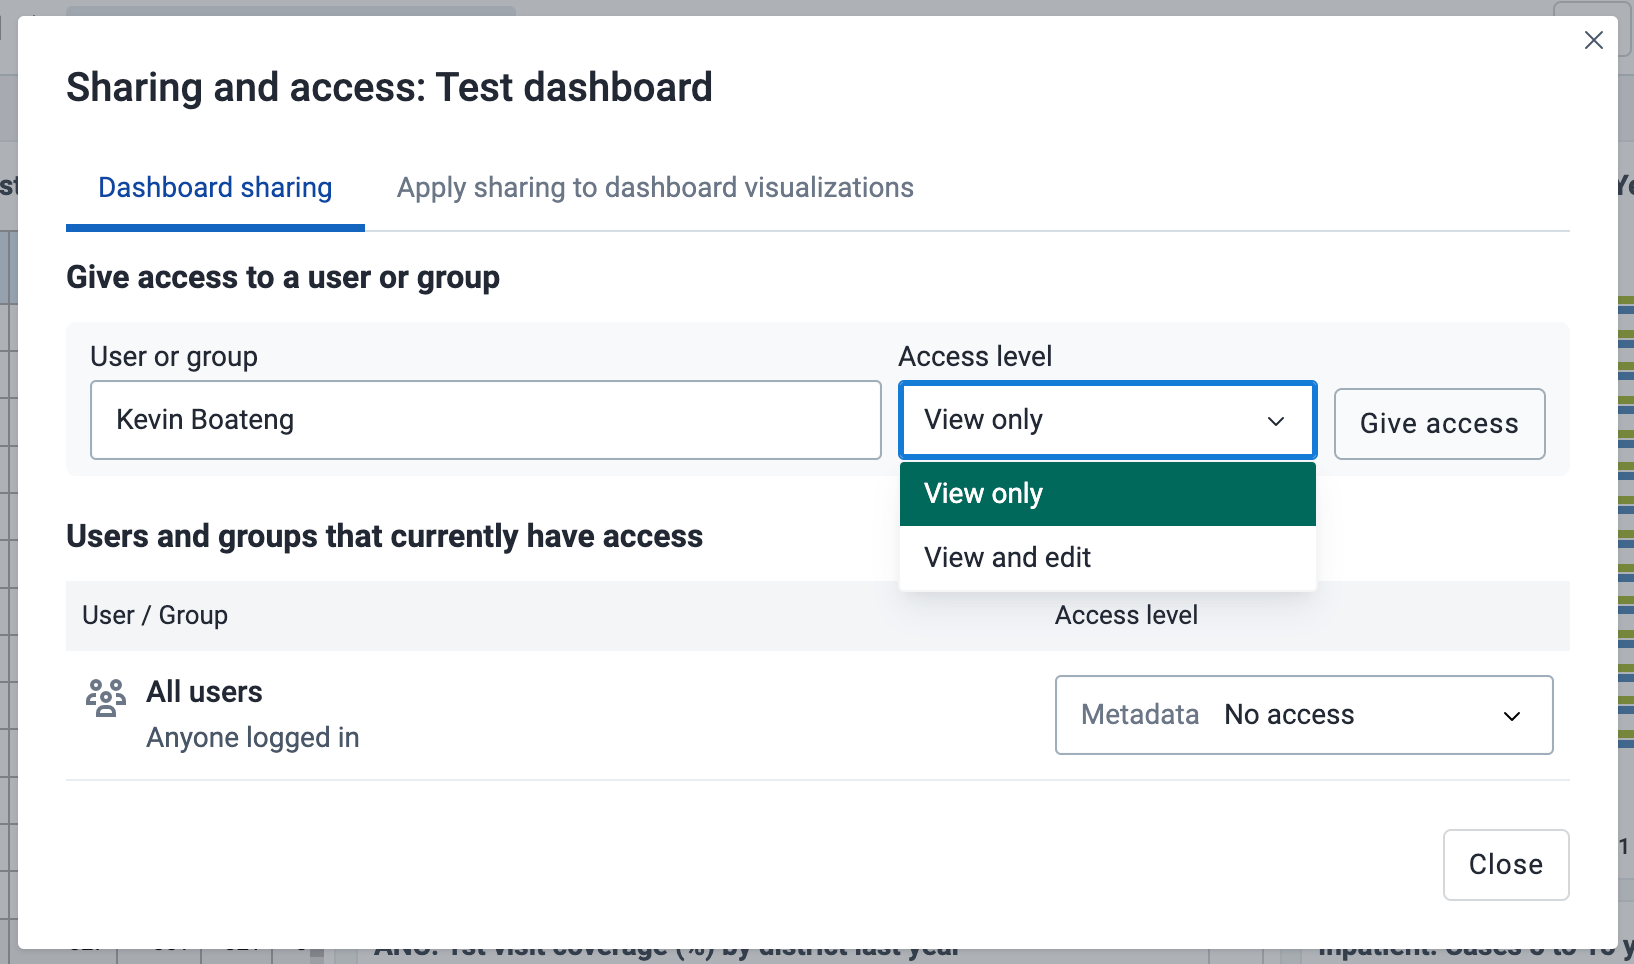
Uživatelům můžete poskytnout adresu URL ovládacího panelu, která jim umožní přejít přímo na ovládací panel. Chcete-li získat adresu URL ovládacího panelu, stačí otevřít ovládací panel v režimu zobrazení a zkopírovat adresu URL prohlížeče. Například adresa URL panelu Antenatal Care na play.dhis2.org/dev je:
https://play.dhis2.org/dev/dhis-web-dashboard/#/nghVC4wtyzi
Cascade sharing of visualizations on the dashboard
Chcete-li zajistit, aby všechny grafy, mapy a tabulky na ovládacím panelu byly sdíleny s vybranými uživateli a skupinami uživatelů, klikněte na tlačítko Použít sdílení na položky ovládacího panelu.
