Analýza a interpretace BNA
3.2 BNA Analysis and Interpretation
Once the configuration is done by Administrator,users have an option to access interventions configured and shared with them for viewing analysis charts.For each intervention shared to the users, users will be able to further select periods and organization units (locations) for which they want to view bottleneck analysis for.
Poznámka: Uživatelé mají přístup pouze k intervencím, které s nimi sdílí správci, kteří zásah nakonfigurovali
Přístup k zásahu pro analýzu
Search for Bottleneck Analysis application and click on it
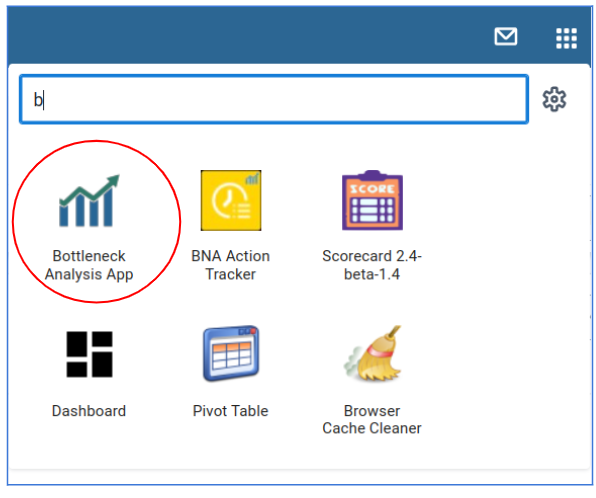
Po načtení aplikace BNA budou mít uživatelé přístup k dostupným zásahům a možnost vyhledávat další zásahy. Přístup ke sdíleným zásahům je omezen na úroveň přístupu, kterou sdílejí.
Výběr období pro analýzu
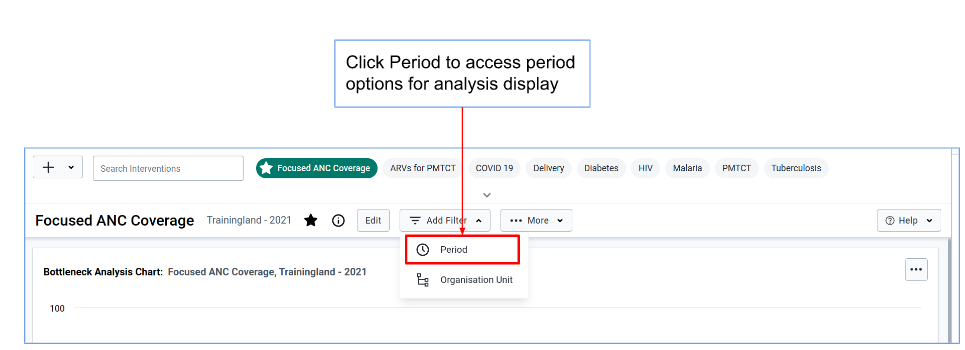
Po výběru zásahu k analýze může uživatel určit, pro které období chce analýzu zobrazit. Chcete-li získat přístup a změnit období, klikněte na Přidat filtr a poté na záložku období.

Výběr organizačních jednotek
The BNA App allows the user to make organization unit selections based on groups,levels and user organization units,these are known as selection modes.

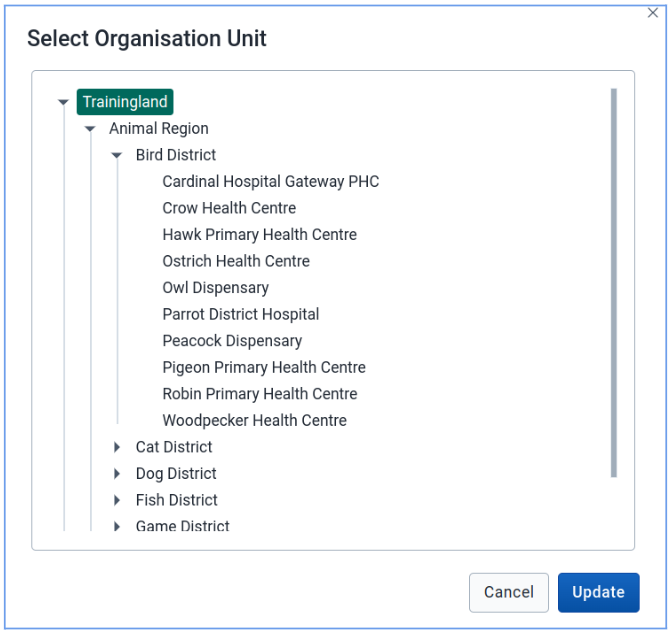
Poznámka: Po dokončení výběru organizačních jednotek musí uživatel kliknout na tlačítko Aktualizovat pro uložení změn
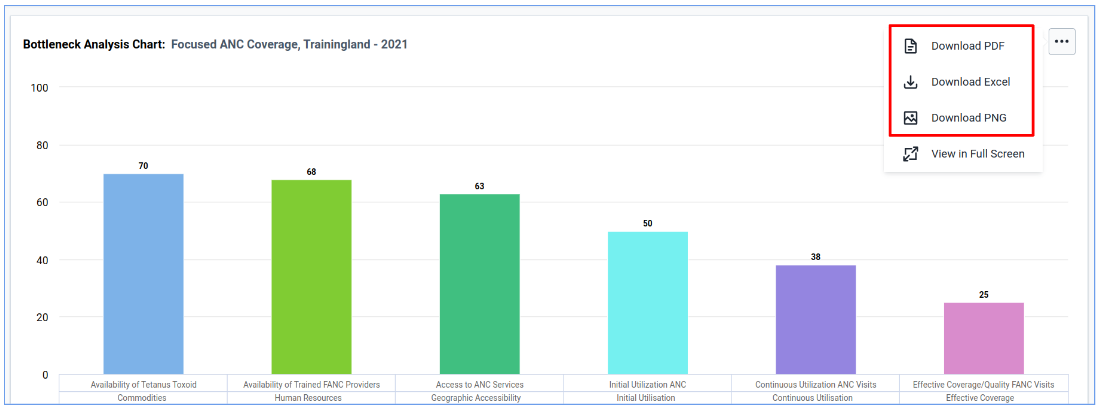
Downloading bottleneck analysis chart
To download the displayed bottleneck analysis chart, users can choose from the three dots on the right side of the chart with options to download as PDF,Excel and PNG.
Výklad Analýzy překážek
Analýza úzkých míst je systematický způsob, jak se podívat na hlavní determinanty efektivního pokrytí u vybraných intervencí s cílem identifikovat problémové oblasti a cíleně na ně reagovat. Šest determinant pokrytí, od strany nabídky až po poptávku, dokazuje mechanismus pro analýzu toho, kde existují úzká místa zdravotního systému. Úzké místo je ztráta efektivity systému. (Upraveno podle modelu Tanahashi)
Each intervention in the bottleneck analysis application comes with three intervention items,the bottleneck analysis chart,sublevel analysis table and root cause analysis widget which are there to assist the district user in analyzing the bottlenecks and enter the route causes and solutions for each identified bottleneck.
Operace úzkého hrdla grafu
The bottleneck analysis chart is a bar graph of the bottleneck indicators sub-divided in groups of their determinants.The bottleneck analysis chart can be configured through the global filters whereas the national level administrators can make data selections and sort the arrangement of determinants, determinant group color, organization unit and period filters for other national users who are not administrators, regional and district users to make changes on organization unit and period filters.

Analýza grafů úzkých míst
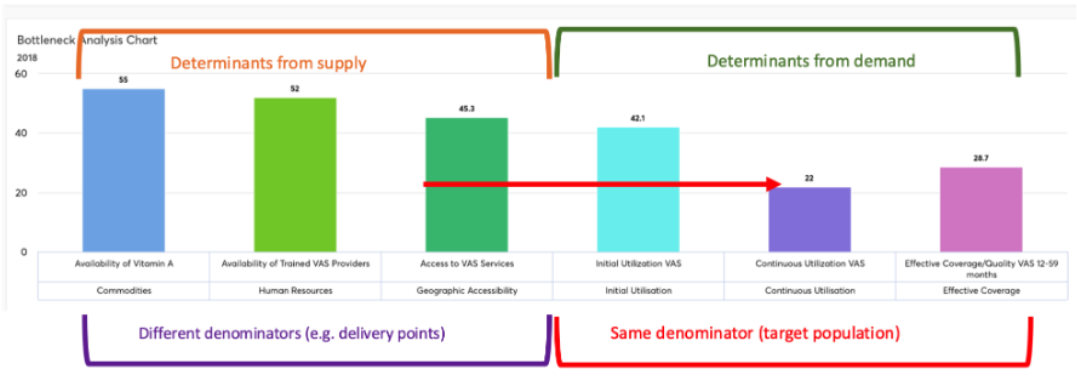
- Začněte zleva doprava: nejprve nabídka, poté poptávka, poté kvalita
2)Identify the lowest bar in the supply side (weakest determinant in the existing system)
3) Identifikujte největší pokles na straně poptávky a kvality
A bottleneck is a significant gap or drop in coverage determinant between the expected and the observed.Services must be available first before they are used. Therefore, bottlenecks are analyzed starting with supply,followed by demand and finally by quality.The cascade rule means that quality can not be higher than demand and demand higher than supply.
Chcete-li zvýraznit úzká místa v grafech, jednoduše klikněte na pruh, který představuje identifikované úzké místo. Barvu pruhu byste měli změnit na ČERVENOU. Tato barva není uložena jako součást hodnot, které představují rozdílné výkony.

When the graph seems different from what we expect, care should be given to assess common factors e.g using different denominators for supply,demand and quality.
Podúrovňová analýza
The sublevel analysis table makes use of the global filters that the bottleneck analysis chart makes use of with an additional operation of legend configurations for each indicator that has been selected.It presents sublevel analysis of performance of each of the indicators in determinant groups for selected intervention.
In the sublevel analysis table, users can switch the layout of the table to between determinant rows and org unit rows presentations.To achieve this one can use the two buttons at the top right of the table.
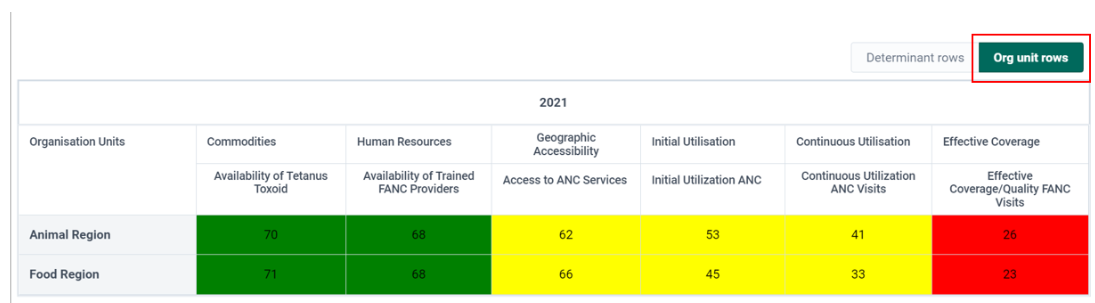

Zobrazení slovníku indikátorů
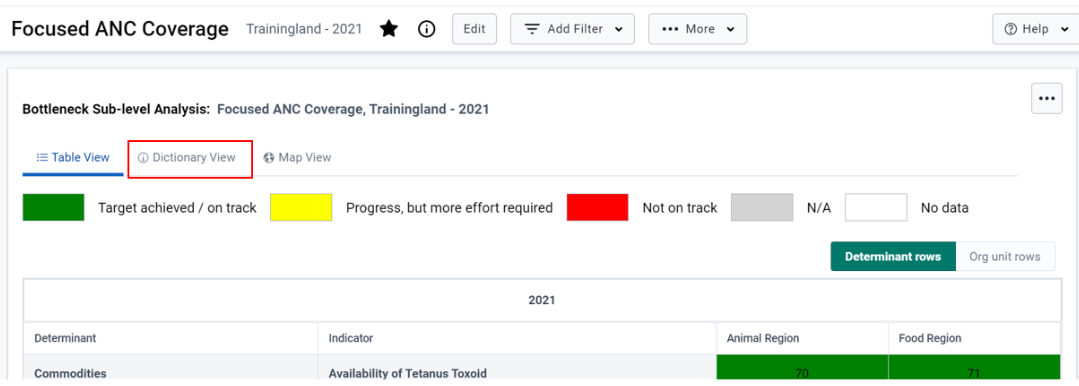
Aplikace BNA je vybavena slovníkem indikátorů, který poskytuje další informace o indikátorech používaných při definici a vytváření diagramu BNA. Chcete-li se dostat do slovníku indikátorů, klikněte na zobrazení slovníku v tabulce analýzy podúrovně.
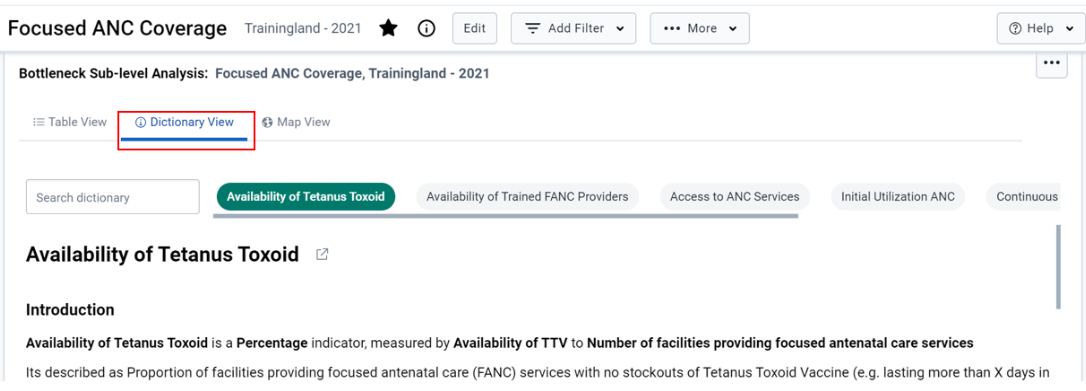
The indicator dictionary will display the list of indicators used in creating the BNA chart, including numerators and denominators, calculation details and corresponding data elements.