Zambia Education Management System (EMIS)
Akros is an NGO that is experienced in the design and implementation of data-driven systems that improve the health and well-being of disadvantaged communities.
Following the highly successful Water, Sanitation, and Hygiene (WASH) program, which was rolled out across Zambia’s 172 districts, Akros is now using the same DHIS 2 visualization tool for chiefdoms to access education data.www.akros.com
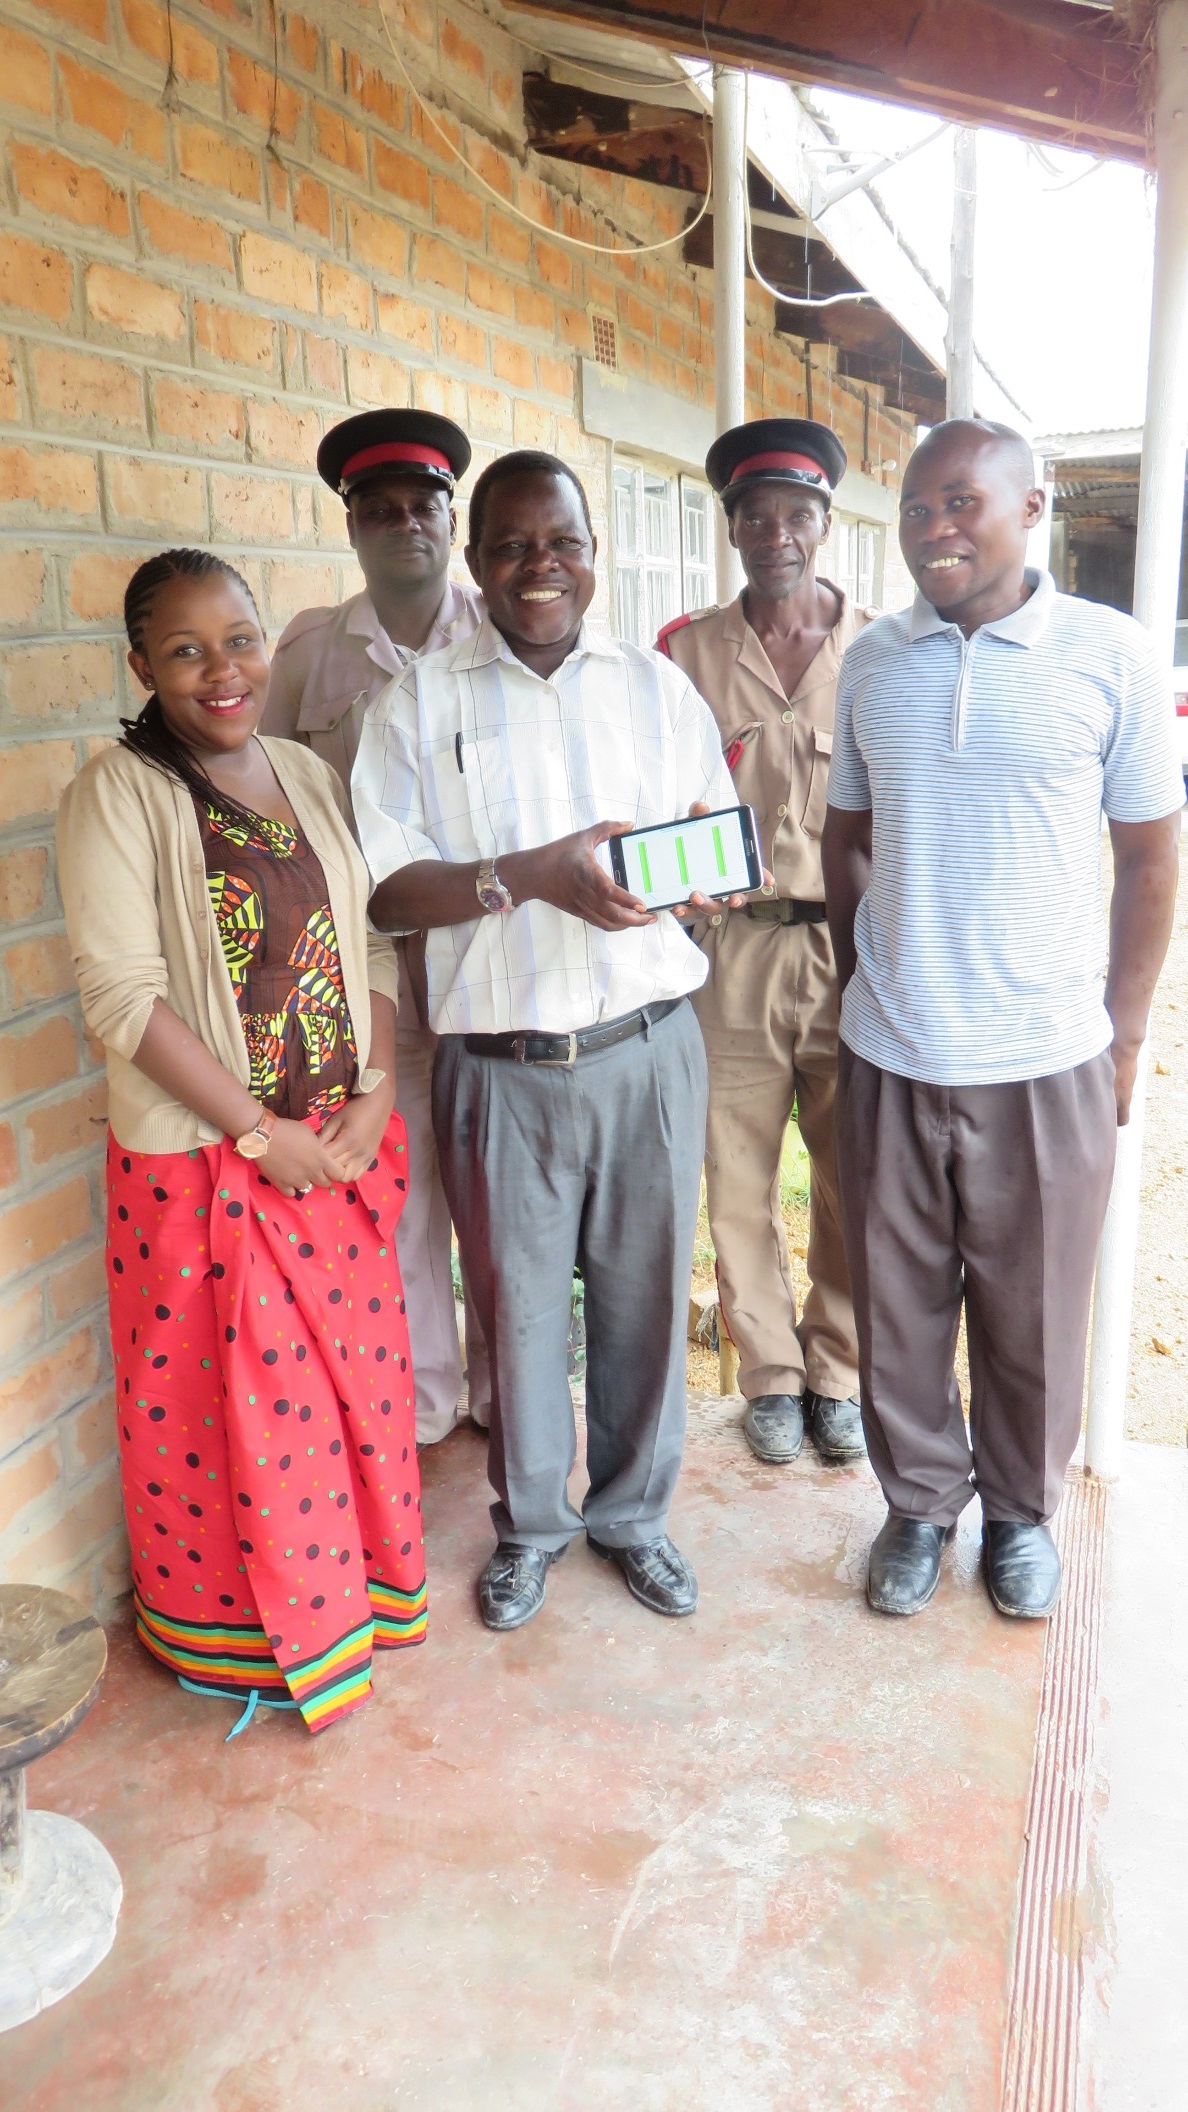

Who is involved in this program? This program is our latest project; it began in 2016. In partnership with the Ministry of General Education with support from UNICEF, Akros has developed and implemented an Education Management Information System (EMIS) in Namwala District, Zambia using DHIS2.

**What did the situation look like before this initiative?**Prior to this EMIS, the ministry depended on annual reports from schools that were put into a Microsoft Access database. The yearly reporting prevented data capture of critical education information like attendance or quarterly standardized exam scores. This placed significant limitation in terms of the data available to the ministry for decision and policy making at all levels

**No reliable attendance data.**Prior to EMIS, yearly enrollment information was the only indicator available for the number of students going to school. As a result, the average daily attendance was often significantly different from enrollment figures.

**What type of data is being reported with DHIS2?**As mentioned, we’re capturing aggregate data on a monthly basis that shows us the enrollment and attendance figures of teachers and students. We also capture Water, Sanitation and Hygiene (WASH) information. We’re retrieving exam scores in literacy and numeracy, and lastly, we’re getting data on school feeding days and the commodities being consumed. For event capture, we’re gathering termly data about the drop-out rate of teachers and students and commodity requests for education materials, pens, textbooks, etc.

**An example of an EMIS indicator:**To work out the percentage of enrolled students attending classes, the indicator is calculated by adding all students attending class every day divided by the number of teaching days that month.

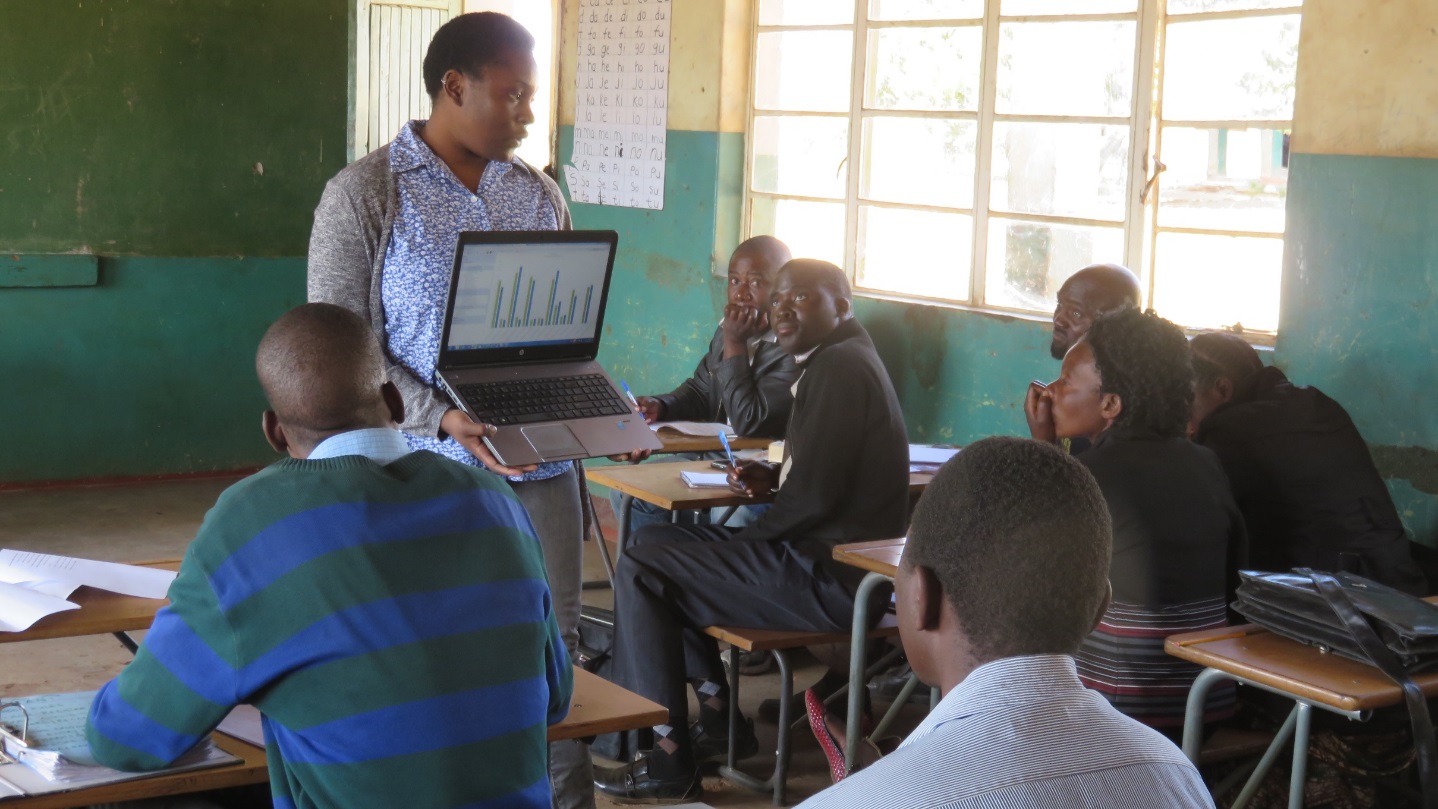
**How well is the EMIS system doing?**We’re making progress in areas such as helping teachers and chiefs to understanding the importance of data and accountability. Participants are becoming more aware of how standardized reporting generates consistent results. The decision-making data we’ve retrieved, in areas such as real-time attendance and learner outcome data, is more reliable than ever before. For example, the ministry can now see results as soon as exams are taken; interventions and teacher support can be immediately developed based on exam scores.

**And the challenges?**There was only yearly paper reporting prior to EMIS and so we’ve had a bit of a learning curve to address in terms of getting participants comfortable using a tablet to enter data with a matrix presentation. We’re striving to keep the data simple; we’ve moved from 27 pages of data down to 1 monthly report and one termly report. However, some paper trail still remains. Finally, we’re facing a challenge with the low capacity of data entry personnel available

**What’s ahead?**We’re keen on setting up feedback loops that include teachers, Parent Teacher Associations (PTAs), chiefs, and district officers. We’d like to have standardized dashboards in place and data quality assessment tools that include validation rules and standard operating procedures. We’re hoping to implement national level reports. Finally, we wish to scale to additional districts in Zambia. A lot to think about!