Analysing PostgreSQL logs using pgBadger
As a DHIS2 system administrator, knowing what goes on with your PostgreSQL database is of great importance. Looking at the PostgreSQL logs will give you a clue, however simply browsing the logs with a text editor is difficult since the logs become very large with lots of repetitive content.
The pgBadger PostgreSQL log analysis tool is simple to install and easy to understand. It lets you analyse log files from the command line with simple commands. This tutorials explains how the pgbadger PostgreSQL log analysis tool can help you get useful information from your logs. It is based on a Debian/Ubuntu environment but will be similar in other environments.
Perl is required, so first make sure you have it installed.
sudo apt install perl
Download the pgbadger installation package from the GitHub release page.
https://github.com/darold/pgbadger/releases
Extract it and install. Adjust for the version in the filename.
tar xvf pgbadger-13.1.tar.gz
cd pgbadger-13.1
perl Makefile.PL
make && sudo make install
You will have to adjust your PostgreSQL configuration file to give pgBadger the information it needs. First you need to set the log_line_prefix setting.
log_line_prefix = '%t [%p]: [%l-1] '
You should enable the log_min_duration_statement setting. This setting causes PostgreSQL to log all statements which run for longer than the given value in milliseconds, where a value of 0 will log everything. Make sure that the log_statement is set to none, otherwise the log_min_duration_statement setting will not log anything (none is the default value anyway).
log_statement = 'none'
log_min_duration_statement = 0
You should enable logging of checkpoints, locks and more to get maximum value out of the log analysis.
log_checkpoints = on
log_connections = on
log_disconnections = on
log_lock_waits = on
log_temp_files = 0
log_autovacuum_min_duration = 0
You can also get the config snippet here. Note that you do not need to restart PostgreSQL to make the changes take effect, simply log into the psql command line and invoke the following statement.
select pg_reload_conf();
Of course, logging all statements has a performance impact on your system, so you could enable it for enough time to give you between 50MB and 200MB worth of logs, then disable it again.
Now with DHIS2 we already know the analytics table generation and indexing process has some very long-running queries. We do not want those to take all attention from pgBadger so we create a new log file where we omit these statements with the following command in a terminal.
cat pg.log | grep -viE "create index|insert into analytics|vacuum analyze analytics" > pg_clean.log
We are now ready to do the analysis. Invoke the below command.
pgbadger -j 4 pg_clean.log
Here the -j option refers to the number of CPUs you would like to use for the process. By default it uses a single CPU but allowing more CPUs speeds up the process a lot. Finally, pg_clean.log refers to your log file.
Note that if you are on Amazon RDS for PostgreSQL, it does not let you change the log_line_prefix setting. Instead, you can run pgBadger with the -p option which lets you specify a custom prefix for the analysis.
pgbadger -j 4 -p '%t:%r:%u@%d:[%p]:' pg_clean.log
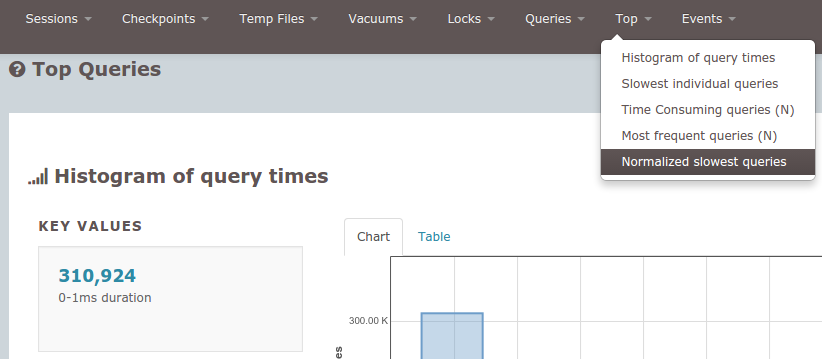
The pgbdager tool will now create a nice presentation of the analysis in a HTML file called out.html. Open the file in a web browser.
The most interesting part might be the "Top" menu item. It provides very useful statistics including individual slowest queries and normalized most time-consuming queries, most frequent queries and slowest queries. Here, normalized means that the SQL query parameters are ignored. This is useful to understand which queries are the slowest from an application perspective.
From doing analysis on a specific DHIS2 instance I learned that the validation functionality causes quite long-running queries which could be optimized. You are encouraged to analyze your own DHIS 2 instance to see which queries take long. Based on this you could optimize the database with indexes or provide feedback to the DHIS2 software developer team about potential bottlenecks and expensive queries.
Happy monitoring!