Malaria - System Design Document
Verze 2.1.0
Background and Purpose
Dokument Malaria Core Aggregate System Design poskytuje přehled principů návrhu a pokynů používaných k vývoji balíčku digitálních dat pro rutinní souhrnné hlášení malárie v HMIS jednotlivých zemí. Tento dokument je určen pro použití implementátory DHIS2 na národní a regionální úrovni, aby mohli podpořit implementaci a lokalizaci balíčku. Balíček metadat o malárii lze přizpůsobit místním potřebám a národním směrnicím. Při lokalizaci a přijímání programů zahrnutých v tomto balíčku je třeba vzít v úvahu zejména místní pracovní toky a národní směrnice.
Všechny soubory dat byly založeny buď na doporučeních WHO a příkladech osvědčených postupů, nebo na publikovaných rámcích hlášení Sledování nemocí pro kontrolu malárie.
Tyto soubory údajů budou muset být v mnoha případech v různé míře upraveny tak, aby odpovídaly vnitrostátním systémům podávání zpráv. Na jedné straně mohou existovat další proměnné, které jsou důležité v národním kontextu, které je třeba přidat. Na druhé straně mohou existovat informace, které jednoduše nejsou k dispozici pro hlášení, například pokud údaje nejsou zachyceny v registrech jednotlivých případů na klinické úrovni.
Přehled návrhu systému
Package Structure
Program malárie se skládá ze 3 různých souborů dat, které lze kdykoli použít na základě potřeb programu:
| Datová sada | Popis |
|---|---|
| Roční údaje o malárii | The malaria annual data set is recommended in all settings. It contains the key info on the target/catchment population. As the name indicates, this information is to only be collected once a year. This data set contains a mostly flat structure. It is suggested to assign the dataset at district level, though the assignment can change at local level depending on the availability of population data. |
| Snížení zátěže malárie | Jedná se o měsíční soubor dat, který je určen pro oblasti, ve kterých je snížení zátěže malárie prioritou. Datová sada je navržena tak, aby reportovala data na nejnižší administrativní úrovni přítomné v hierarchii organizační jednotky. |
| odstranění malárie | Jedná se o měsíční soubor dat určený pro oblasti, kde je prioritou odstranění malárie. Datová sada je navržena tak, aby reportovala data na nejnižší administrativní úrovni přítomné v hierarchii organizační jednotky. |
NOTE:
The malaria elimination and malaria burden reduction data sets can be used either separately or in conjunction with one-another depending on the type of public health responses being implemented within a particular geographical area (ie. in one district the burden reduction data set may be used, while in another the malaria elimination data set may be used).
Datové prvky
The full list of data elements belonging to the different datasets can be found in the Malaria Metadata Reference File.
Please note that there are a number of additional data elements that could potentially be used within the Malaria Burden Reduction and Malaria Elimination data sets, however are not currently assigned to either of the datasets. These data elements can be found within the Malaria unassigned data element group.
| Datová sada | Unassigned DEs |
|---|---|
| Malárie, Snížení zátěže | Migrant and mobile population (MMP) positive Malaria cases tested at community level Malaria confirmed cases (Mic + RDT) Plasmodium falciparum (Mic + RDT) Malaria cases positive at community level Migrant and mobile population (MMP) tested Migrant and mobile population (MMP) followed up for 14 days Mixed malaria species (Mic + RDT) Plasmodium vivax (Mic + RDT) Malaria tested cases (Mic + RDT) Malaria cases treated at community level Mixed/Other malaria species (Mic + RDT) |
| Malárie, Eliminace | Malaria tested from cross-borders Malaria cases notified within (N1) timeframe of the guideline (24hrs) Malaria cases investigated within (N2)* timeframe of the guideline Malaria positive from cross-borders followed for 14 days Malaria positive from cross-borders Other malaria species (microscopy) |
Předpokládaní uživatelé
- Health facility users: capture and report key data on malaria activities
- Programoví manažeři: manažeři na národní a nižší než národní úrovni mohou být zodpovědní za podporu zadávání dat a analýzy.
- National and local health authorities: to monitor and analyze the surveillance of data through dashboards and analytics tools, to conduct risk assessments and plan response measures; to generate reports for regional and global reporting
Data Set - Malaria Annual Data
Population at risk

This disaggregation of the population was set as a category combination, as it is more efficient to disaggregate this population data element by the three age category options rather than create three data elements separately.
Interventions

The section has a flat structure and focuses on the preventive interventions carried out in the target area and within the groups most at risk of infection. Contrary to the annual demographic data, this information is rather meant to be compiled at the end of a LLINs distribution intervention.
Data Set - Malaria Burden Reduction
The Malaria Burden Reduction dataset is split in seven sections. Two of these sections are identical both in this dataset and in the Malaria Elimination dataset: Laboratory, Treatment.
Patients Volume

The age category combination (0-4, 5-14, 15+ years) drastically reduces the number of data elements. The totals for all of these data elements can also be used for analysis purposes.
Laboratory

The age/sex category combination {Age (0-4, 5-14, 15+ years)/Sex (Male, Female)} drastically reduces the number of data elements. The totals for all of these data elements can also be used for analysis purposes; allowing you to pivot both the age and sex dimensions and place them where required.
Léčba

Several of the data elements in this section are subsets of one another. Making totals from these would not be meaningful. Though this increases the data element count, it makes interpreting the output easier.
Intermittent Preventive Treatment in pregnancy (IPTp)
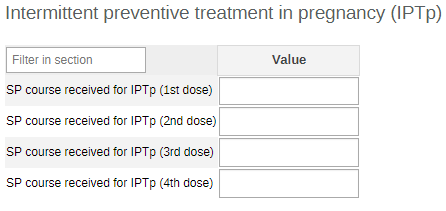
While it could potentially be argued that a category combination could potentially be used here in order to output the total number of doses administered, understanding the breakdown of the number of doses by their schedule takes precedence in the analysis. For this reason, no category combination is used.
Pregnant Women

Všechny datové prvky v této části mají různé definice. Nejsou nutná žádná členění.
Data Set - Malaria Elimination
The Malaria Elimination dataset is split in seven sections. Two of these sections are identical both in this dataset and in the Malaria Burden Reduction dataset: Laboratory, Treatment.
All-cause inpatients and outpatients

The age category combination (0-4, 5-14, 15+ years) reduces the number of data elements. The totals for the two data elements can also be used for analysis purposes.
Case Investigation

The age/sex category combination {Age (0-4, 5-14, 15+ years)/Sex (Male, Female)} drastically reduces the number of data elements. The totals for all of these data elements can also be used for analysis purposes.
Laboratory
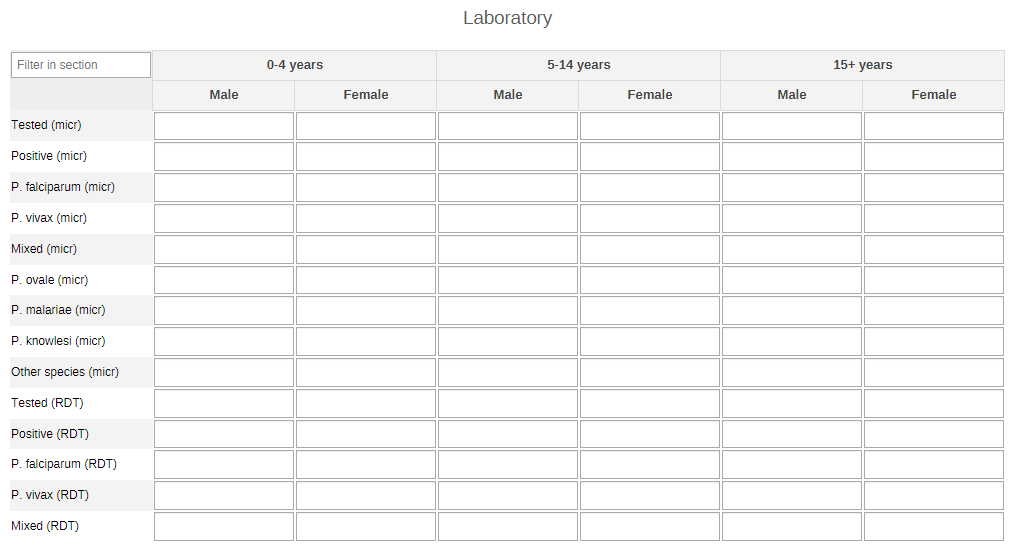
The age/sex category combination {Age (0-4, 5-14, 15+ years)/Sex (Male, Female)} drastically reduces the number of data elements. The totals for all of these data elements can also be used for analysis purposes; allowing you to pivot both the age and sex dimensions and place them where required.
Active Case Detection
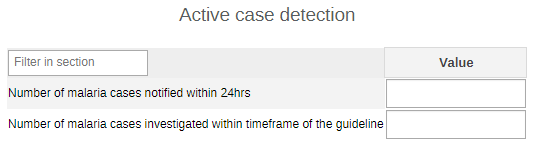
All of the data elements in this section have different definitions. No disaggregations required. Case Investigation
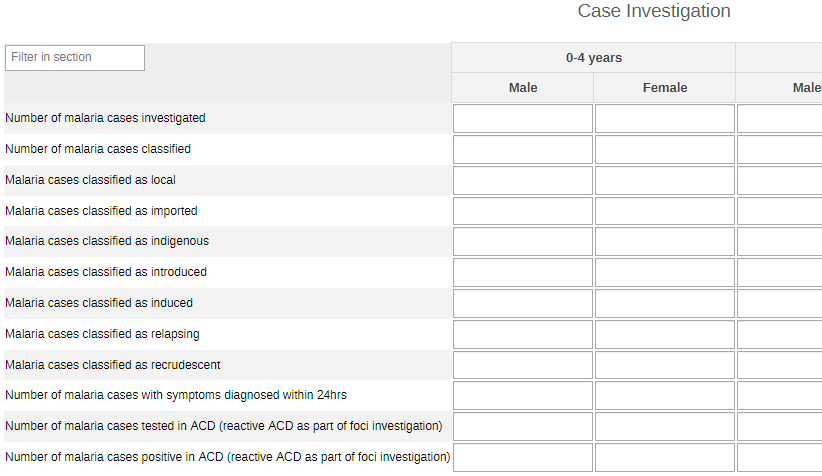
The age/sex category combination {Age (0-4, 5-14, 15+ years)/Sex (Male, Female)} drastically reduces the number of data elements. The totals for all of these data elements can also be used for analysis purposes; allowing you to pivot both the age and sex dimensions and place them where required.
Léčba

Several of the data elements in this section are subsets of one another. Making totals from these would not be meaningful. Though this increases the data element count, it makes interpreting the output easier.
Foci Investigation
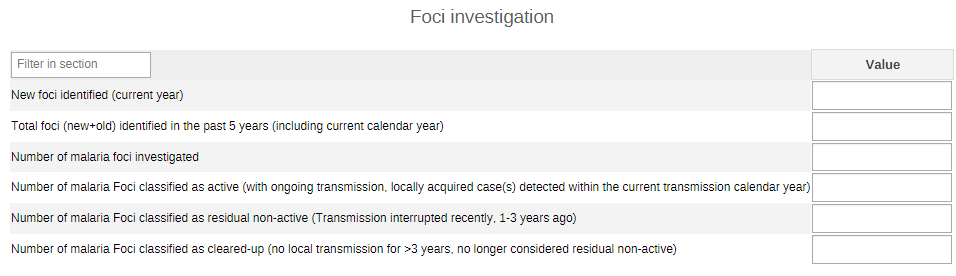
Several of the data elements in this section are subsets of one another. Making totals from these would not be meaningful. Though this increases the data element count, it makes interpreting the output easier.
Foci Classification and Response
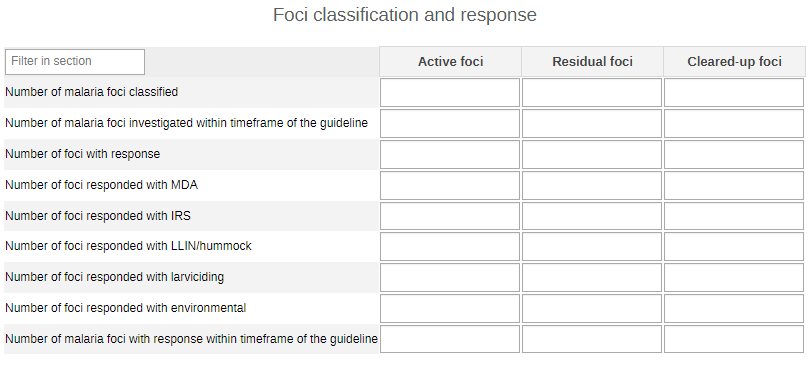
The foci classification category combination (Active, Residual, Cleared-up) allows for simplified classification of the data elements based on the three foci category options. The total of this category combination when applied to the data elements is useful for analysis as well.
Analytics and Indicators
The full list of indicators and indicator groups is available in the Malaria Metadata Reference File.
Please refer to the section “Special Considerations: Malaria by health sector” of this design guide for further guidance on how to obtain further information on the cases of malaria detected in the different health sectors (private, public, and community).
Pravidla ověření
Pravidla pro ověřování malárie jsou rozdělena do tří skupin:
- Malaria: burden reduction
- Malaria: elimination
- Malaria: other
The full list of validation rules that have been set-up to ensure the quality of data are available in the Malaria Metadata Reference File.
Ovládací panely
The Malaria package includes nine predefined dashboards, each focusing on different aspects of the preventive, curative, and reactive sides of the health programmes against malaria:
- MAL - 1.Malaria Burden Reduction
- MAL - 2.Testing and diagnosis
- MAL - 3.Malaria Maps
- MAL - 4.Treatment
- MAL - 5.Intervention Coverage
- MAL - 6.Malaria Quality Control
- MAL - 7.Malaria Data Quality
- MAL - 8.Malaria Elimination
- MAL - 10.Malaria District Dashboard
The full list of items (graphs and tables) available in each dashboard is available in the Malaria Metadata Reference File.
The table below lists only the dashboards in which there are notes of interest for the implementation of the package and the set-up of the dashboards
| Ovládací panel | Komentář |
|---|---|
| MAL - 1.Malaria Burden Reduction | In the graph and table entitled “Reported malaria cases “ , the DE MAL- Confirmed malaria cases (reported), depending on the local implementation and guidelines, could be used instead of the DE “confirmed malaria cases (micr + RDT)” The graph entitled “Epidemic detection” uses in its default configuration the DE MAL - Malaria confirmed MEAN+2 STD (threshold). Countries should choose either the mean+2SD OR the MEDIAN (threshold), but not both. The latter is suggested for elimination settings. The DEs are in the burden reduction data elements group. |
| MAL - 4.Treatment | The graphs entitled “Treatment of P.vivax” and “G6PD testing and treatment of P.vivax” are optional and only relevant depending on the context. |
Malaria Data Quality Dashboard
This dashboard complements other DHIS2 apps and tools such as the WHO Data Quality App for DHIS2.
The main objective of the data quality dashboard is to bring key data quality metrics to the users routinely through use of DHIS2 dashboards to facilitate data quality improvement activities at all levels (health facility, district, and national management).
- Monitor completeness and timeliness of reporting malaria data:
- The default dashboard includes a text box with some key definitions to ensure the correct understanding and interpretation of the concepts of "completeness" by variable and by reporting frame, and "timeliness".
- The legends in the pivot tables have been set with default values in reference to the global guidelines. They should be adapted according to the local guidelines if needed.
- Monitor internal consistency between variables to detect inconsistencies for quality improvements:
- The text box in tghe consistency and validity section of the dashboard provides the guide for the interpretation of "consistency".
- The scatterplots have been set by default to follow a 2xZ-score (high and low) - depending on the local efforts and allowance for discrepancies within variables, the Z-score can be adapted and adjusted.
- Compare trends of key malaria indicators at the various reporting levels and rapidly detect anomalies as red flags for poor data quality (year over year graphs).
Like all dashboard packages for DHIS2, the data visualizations are configured to display data for the organisation units for which the user has data capture access in the user configuration. In this way, the dashboard can be used at national, district or other sub-national levels to monitor data quality for the geographic area most relevant to the user. This enables actions to improve data quality to be taken as close to the point of data collection and validation as possible. Configuration of users and assignment to user groups to be able to access the dashboard should be considered within country context to ensure access is provided properly to users.
Malaria District Dashboard
The objective of this dashboard was to create an operational level (district or equivalent) specific dashboard to become one of the primary dashboards for district malaria managers and/or Health Facility supervisors. Depending on the organization of the malaria program, other levels can also find it useful - e.g. Health Facility level using the population based on heir services.
The dashboard gives a primary at glance overview of the key information of the malaria activities that can be later drilled down with more detail in the more focused dashboards dedicated to burden reduction, quality, stock, etc. The pivot tables provide the outline of the eventual decline of the core indicators for program monitoring keeping as reference the current period and the same previous period (e.g. current period January 2022, previous period January 2021). The applied legends use as thresholds placeholders taken from the global guidelines and should be locally adapted if need be. In the "Special considerations" section of this guide implementers will be able to find more information on how to better adapt the dashboard in order for the users to appreciate also a comparative analysis with neighbouring districts.
User groups
As part of the package configuration, user groups have been created to be used to manage sharing settings in the metadata for all the modules. Core metadata that use these sharing settings include mainly the dataSets, dashboard, indicators and data Elements. The three user groups created include:
| Uživatelská skupina | Ovládací panel | Metadata | Data |
|---|---|---|---|
| MAL - Admin | Může upravovat a prohlížet | Může upravovat a prohlížet | Lze pouze prohlížet |
| MAL - Access | Lze pouze prohlížet | Lze pouze prohlížet | Lze pouze prohlížet |
| MAL - Data capture | Žádný přístup | Lze pouze prohlížet | Může zachytit a zobrazit |
I když je důležité udržovat tyto userGroups při instalaci tohoto balíčku, neváhejte je zkontrolovat v souladu s jakýmkoli existujícím nastavením nebo zásadou userGroups v instanci hostitele.
Special Considerations
Disaggregation by public facility vs. private sector vs community service delivery
As mentioned in the section on Analytics and Indicators of this design guide, this section is set to provide some suggestions and considerations on the analysis and visualization of the detected cases of malaria according to the type of facility ownership (public or private), and the cases detected in the community.
The WHO requirements for the CORE malaria aggregate data reporting included the following indicators:
- “MAL - Malaria cases detected in the public sector (%)”
- “MAL - Malaria cases detected in the private sector (%)”
- “MAL - Malaria cases detected in the community (%)”
Given the wide range of set-ups and configurations of the hierarchy and organizational units (OUs), this section will advise the users and implementers a few solutions and propositions.
Scenario 1: Community data and/or private sector facilities are maintained as their own organisation units in the DHIS2 org unit hierarchy. * The same data elements can be reused, while orgunit groups can enable filtering and org unit group sets can enable slicing/disaggregating the data by public/private/community. For example, an Org Unit Group Set for 'Facility/Service Delivery Type' can contain org unit groups for Public Facility, Private Facility, CHW to disaggregate reported malaria cases, tests, etc/
Scenario 2: Community and/or private sector data are not reported through separate org units, but instead reported at (public) facility or district level * In this scenario, separate data elements for community or private sector reported data can be created to signify the source of reporting; new indicators can be added to sum up community, private sector and facility cases reported across these data elements. This can be the case when using the CHIS package for malaria, which contains a separate set of data elements for community reporting of malaria cases. * Another alternative is to add a facility/private sector/community category for disaggregation of 1) data elements, or 2) the whole data set. In this case, indicators for malaria cases by public vs. private vs. community would need to be configured for each CatCombo.
Malaria cases detected in the public and private sector
As of the latest DHIS2 version release (2.37), indicators counting the number of organisation units (e.g. facilities) can only be obtained by setting up a predictor.
In order to ease the technical configuration of the package, a solution to this could be the use of a DE or an indicator (e.g. MAL - Confirmed malaria cases (micr + RDT) or MAL - Malaria cases detected) and filter the analysis by the groupSet assigned to the OUs (private or public).
In the screenshot below, an example of the Private and Public OU Groups and below the facilities selected to belong to the Public group.


Once the OUs are arranged by OU groups, the Public and Private groups can be further categorized in an “Ownership” OU Group Set and it should be of type data dimension for it to be used as analytic filter or dimension.
Once the data is entered in the datasets in all the required OUs, the user can analyze the data in the system by health sector. Depending on the final purpose of this specific analysis, the data can be visualized using the wide range of DHIS2 core analytics. The examples below show some of the visualizations that can be obtained when analyzing the malaria data by "Ownership".


Malaria cases detected in the community
Depending on the local implementation and context, the community level of the health activities and interventions can either be set-up aside, or can be already fully integrated among the health facilities and various admin levels of the OUs.
There are two options that can be used in order to analyze the data coming from the community:
1) Use the same approach as outlined in the previous section and create an OU group for the communities in the hierarchy. The procedure and analysis of the data will then follow the same method as the public and private OU groups.
2) Download and update the relevant metadata from the Community Health Information System (CHIS) package, map the relevant metadata, and triangulate the information with the ones obtained from the malaria package(s). In particular there are two monthly datasets that can be useful for this specific purpose within the CHIS package: The CH - Malaria dataset and the CH - Community-based Surveillance dataset. Some relevant DEs for the data triangulation of malaria information can also be obtained from the CH - Integrated Community Case Management monthly dataset in the CHIS package.
District Dashboard: Analysis of neighbouring districts
While District Managers will be able to easily analyze the trends of the district(s) under their supervision, at times, especially in areas of high malaria burden, the analysis may benefit of a comparative breakdown of the district under focus vs its neighbouring district to better appreciate general trends and investigate differences and the impact of the running activities. This type of analysis, although part of the core WHO requirements and anlysis suggestions, cannot be included by default in the general package as it is highly dependent on a range of local factors: users, hierarchy, customizations. Moreover, the system is not capable of "guessing" and filtering the bordering areas just based on users and metadata.
The default visualizations of the dashboard include the full llist of all the districts present in the hierarchy. This could be useful when the analysis is run at national level in order to get the overall snapshot of the program on a larger scale. District managers should normally have their own dedicated user and access to the aggregated ditrict data. Possibly, depending on the implementation, they will also have access to the detailed data of the health structures under the district. As each implementation differs, the first step for this type of analysis to function, is to agree among the parties in charge that the users of the district managers will be able to have access to at least the aggregated data of the neighbouring districts. Once the data privacy and access step is solved, the district dashboard can be customized locally in order to display just the right districts surrounding each district user. The same concept can be applied to lower (facility) and higher end users (regional and/or provincial users).
Here below a practical example: Taking as a reference the map below, the district manager of the Staple district would want to see the progress of the malaria program in their neighbouring districts: Dessert, Dinner, and Fruit.

In this case the admin setting up the dashboard for the local district, having access to the whole hierarchy, will set up and assign to the district user of the Staple district the possibility to visualize in the relevant dashboard items also the neighbouring aforementioned districts.

District Dashboard: Analysis of operational facilities
The district dashboard in its default preconfiguration includes a visualization for "MAL - Functional status of health facilities, last month". The pie chart was set to have an easy overview of the proportion of functional and non-functional facilties within the district under analysis. Given the wide range of set-ups and configurations of the hierarchy and organizational units (OUs), it is suggested to follow the same principles and inputs provided in the section "Disaggregation by public facility vs. private sector vs community service deliver" as the same theory, fully dependent on the local implementation, applies.
Reference
World Health Organization (2012). Disease Surveillance for Malaria Control. An operational manual. Printed by the WHO Document Production Services, Geneva, Switzerland. ISBN 978 92 4 150334 1. URL: https://apps.who.int/iris/bitstream/handle/10665/44851/9789241503341_eng.pdf;jsessionid=7D2258370F31444A72815B5CFB2E1FE8?ua=1?sequence=1