AEFI - Dashboard Navigation
DHIS2 Immunization Toolkit
Nežádoucí účinky po imunizaci (AEFI)
Otevřete aplikaci Ovládací panel
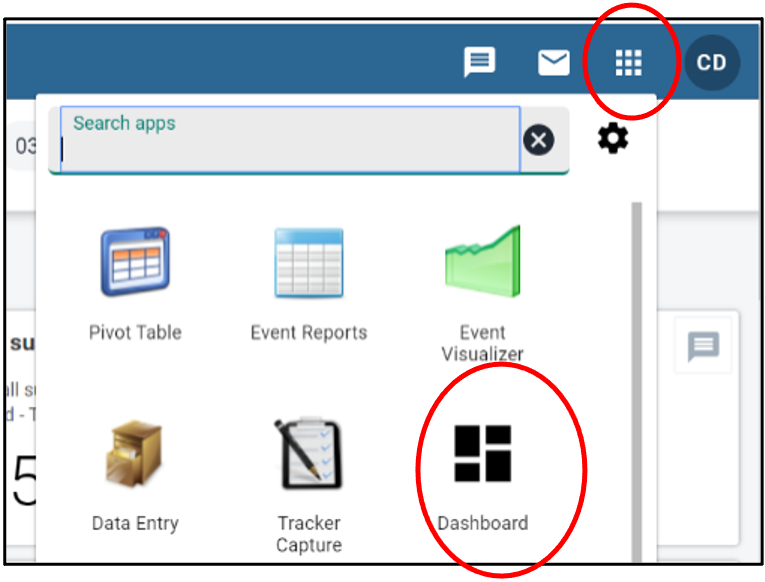
- Klikněte na ikonu „Aplikace“
- Klikněte na aplikaci „Ovládací panel“
Přepínání záložek na ovládacím panelu

Na této liště v horní části můžete přepínat mezi záložkami ovládacího panelu
The AEFI tab/dashboard
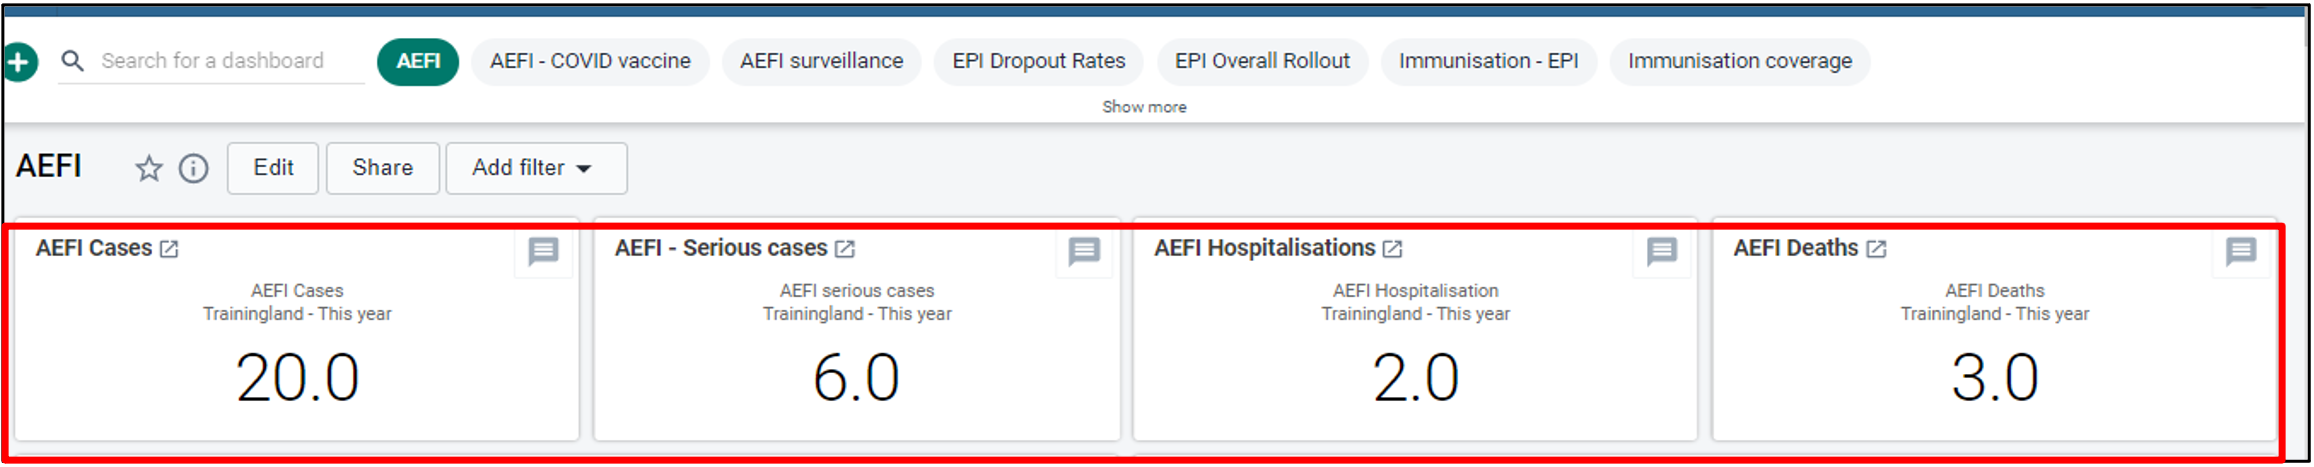
Displays the recent stats on the top

Horizontal and Vertical Bar graphs present data such as "Monthly Incidence of AEFI Cases (last 12 months)’ and ‘Types of AEFI reported for all Vaccines

Pie charts present data such as "Annual number of AEFI cases by Gender" and "Annual number and percentage of AEFI cases by Age"
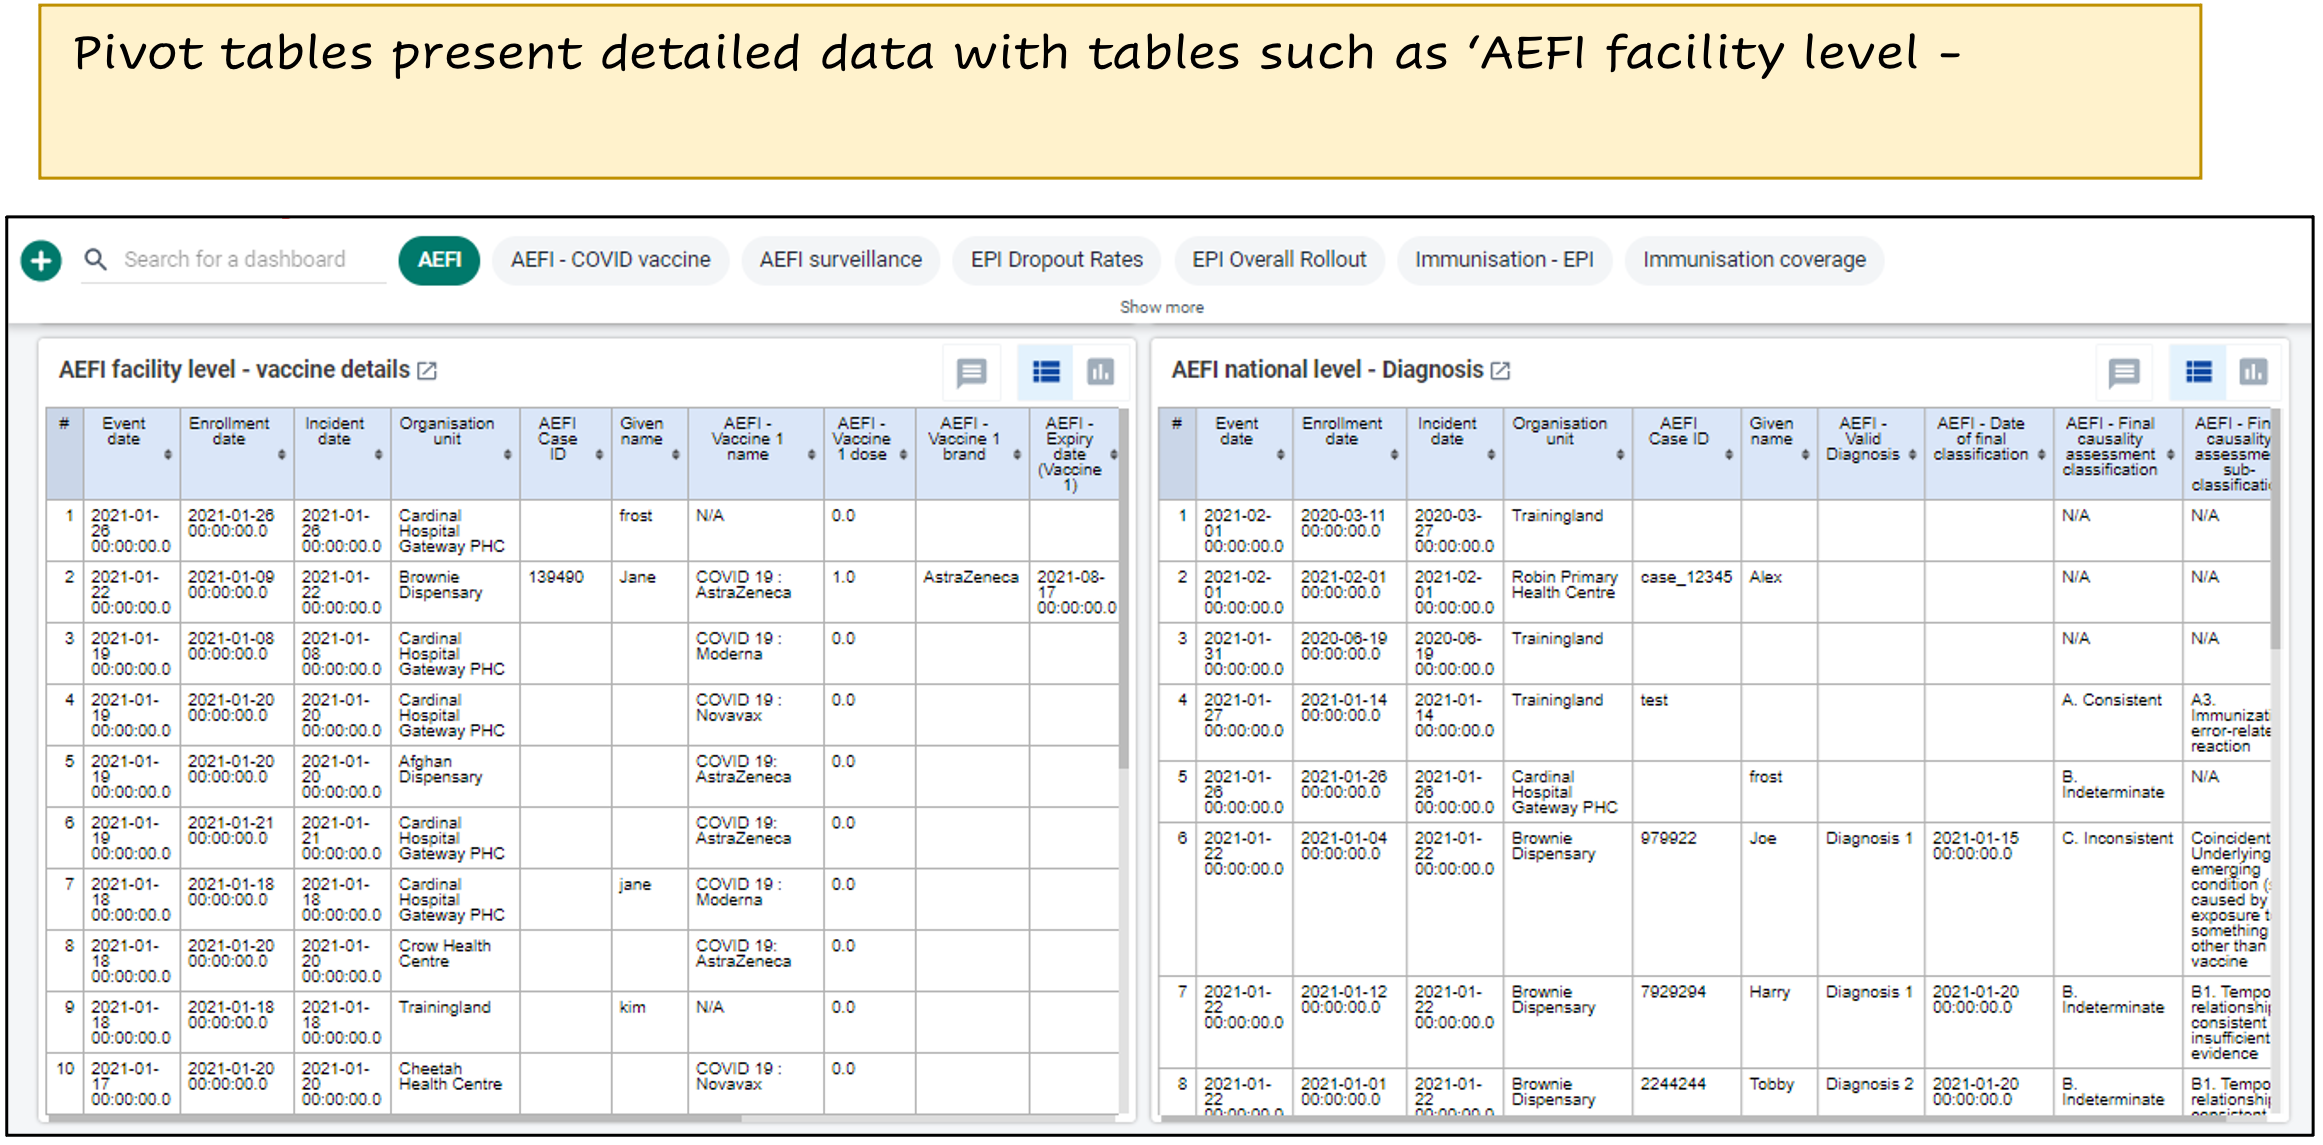
Pivot tables present detailed data with tables such as "AEFI facility level - vaccine details" and "AEFI national level - Diagnosis"
Switching to AEFI surveillance tab/dashboard

Select ‘AEFI surveillance’ from the tab to view its components
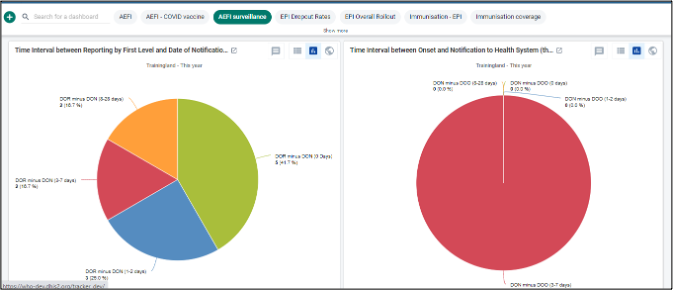
Pie charts such as "Time Interval between Reporting by First Level and Date of Notification" and "Time Interval between Onset and Notification to Health System" are found in AEFI surveillance