دليل المدرب لإنشاء مؤشرات البرنامج
قم بإجراء ذلك في نظام المؤشر
استخدم الأحرف الأولى من اسمك عند إنشاء مؤشر
ما هو هذا الدليل؟
يعد هذا الدليل بمثابة وثيقة دعم لمدربي أكاديمية DHIS2 لجلسة "العرض التوضيحي - مؤشرات البرنامج". تتبع هذه الجلسة نهج التدريب القياسي للأكاديمية مع
- جلسة عرض مباشرة يقوم فيها المدرب بعرض وشرح مؤشرات البرنامج.
- جلسة عملية تتضمن تمارين تمكن المشاركين من فهم وتحليل مؤشرات البرنامج.
سيساعد هذا الدليل المدرب على الاستعداد للجلسة التجريبية المباشرة. يحتوي قسم "العرض التوضيحي المباشر خطوة بخطوة" على إرشادات تفصيلية لجميع الخطوات التي سيتم توضيحها مع التوضيحات ولقطات الشاشة التي يجب أن يكون من السهل متابعتها. استخدم ذلك عند التحضير للجلسة التجريبية المباشرة.
يوجد أيضًا دليل سريع يسرد الخطوات باختصار شديد والمقصود منه أن يكون بمثابة دليل بحث أو "ورقة غش" أثناء إجراء العرض التوضيحي، لمساعدة المدرب على تذكر جميع الخطوات وتدفق العرض التوضيحي.
الأهداف التعليمية لهذه الجلسة
بحلول نهاية هذه الجلسة، يجب أن يكون المستخدمون على دراية بأساسيات إنشاء مؤشرات البرنامج ضمن DHIS2. ويجب أن يكون المستخدمون أيضًا على دراية بكيفية دمج مؤشرات البرنامج مع عناصر البيانات التجميعية لإنشاء مؤشرات مجمعة. هناك عدة مفاهيم يجب أن يكون المشارك على دراية بها في نهاية هذه الدورة:
- وصف مفهوم مؤشر البرنامج
- وصف المكونات الفردية التي تشكل جزءًا من مؤشر البرنامج
- نوع التجميع
- نوع التحليل
- التعبير
- الفلتر
- إنشاء مؤشرات البرنامج في DHIS2
- إنشاء مؤشرات مجمعة (بيانات المتعقب+ بيانات تجميعية) في DHIS2
متطلبات الوقت
العرض المباشر: 1.5 ساعة
تمارين عملية: 1.5 ساعة
خلفية
لقد أثبتت جلسة مؤشرات البرنامج أنها صعبة لعدة أسباب خلال الأكاديميات السابقة. إن السماح للمشاركين بالمتابعة معك ومحاولة رؤية نتائج المؤشرات التي قاموا بإنشائها على الفور أم لا هما نهجان مختلفان يمكن تطبيقهما خلال هذه الجلسة. تتمثل ميزة متابعة الجلسة دون مقاطعة في أن المشاركين جميعاً سيتابعون العرض التوضيحي بنفس الوقت. ومع ذلك، فهذه أيضًا إحدى الجلسات التي يواجه فيها المشاركون صعوبة في المتابعة. من خلال اتباع الخطوات خطوة بخطوة وجعلهم يكررون ما تفعله، قد يفهمون المزيد، لكن سيتم تشويش الجلسة تمامًا بهذه الطريقة. قد يستغرق بعض المشاركين وقتًا أطول من غيرهم، والسؤال هنا: في أي مرحلة يمكنك المتابعة؟ في هذه الحالة، الأمر متروك لفريق الأكاديمية ليقرر أفضل طريقة لتقديم هذه الجلسة. كلاهما لهما إيجابيات وسلبيات محتملة، وسيتعين على الفريق قياس مدى ارتياح المشاركين للمحتوى حتى هذه اللحظة.
ضع في اعتبارك أن مؤشرات البرنامج يتم حسابها بشكل فوري، وليست هناك حاجة لتشغيل جداول التحليلات بعد إنشاء مؤشر البرنامج. يمكنك التحقق من ذلك مباشرة مع المجموعة لتبين لهم أن ما قمت به يعمل بشكل صحيح. بالنسبة للمؤشرات المجمّعة (المُركّبة)، يجب تشغيل جداول التحليلات قبل عرض النتيجة.
الدليل السريع
المؤشر 1
البرنامج: TB Treatment Card
المؤشر: Extra-Pulmonary TB
الاسم المختصر: EPTB
نوع التجميع: Count
نوع التحليل: Event
أداء التمرين 1
المؤشر 2
البرنامج: TB Treatment Card
المؤشر: New, Pulmonary TB cases
الاسم المختصر: NPTB
نوع التجميع: Count
نوع التحليل: Event
أداء التمرين 2
المؤشر 3
البرنامج: TB Treatment Card
المؤشر: TO - failure or died
الاسم المختصر: TO - failure or died
نوع التجميع: Count
نوع التحليل: Event
قم بإنشاء نسخة من هذا المؤشر بنفس الخصائص، ولكن قم بتصفية الجنس = ذكر، العمر> 60
أداء التمرين 3
المؤشر 4
البرنامج: TB Treatment Card
المؤشر: Hospitalized - Initial and Continuation
الاسم المختصر: All Treatment Hospitalized
الكود: AT_HOSP
نوع التجميع: Count
نوع التحليل: Enrollment
أداء التمرين 4
المؤشر 5
البرنامج: TB Treatment Card
قم بإنشاء مؤشر برنامج من نوع Enrollment. يجب أن يحسب هذا الفرق في الوزن بين مرحلتي التشخيص الأولي ونهاية العلاج عندما تكون نتيجة الزراعة سلبية وتكون نتيجة العلاج إما شفيت أو اكتملت.
أداء التمرين 5
المؤشر 6
مؤشر مُركّب
البرنامج: TB Treatment Card
المؤشر: TB incidence rate per 100,000
البسط: TB new cases
المقام: Population Total
أداء التمرين 6
العرض التوضيحي المباشر خطوة بخطوة
ابدأ بعرض الشرائح 1-6 في عرض مؤشرات البرنامج هنا:
https://docs.google.com/presentation/d/18D1sY_F-HznxDGLvnE572W_30lg2lUDef-yNGArCuoo/edit?usp=sharing
ثم عد إلى العرض التوضيحي
المؤشر 1: EPTB Cases
تصور المؤشر
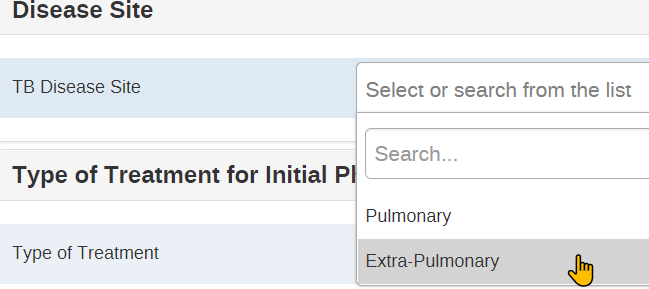
نريد حساب عدد حالات السل الغير رئوي. هذا مأخوذ من حقل موقع المرض، والذي يحتوي على مجموعة خيارات حيث يمكنني تحديد هذه القيمة.
تحرير تفاصيل المؤشر
انتقل إلى الصيانة -> المؤشر-> مؤشر البرنامج
اختر "TB Treatment Card" كبرنامج
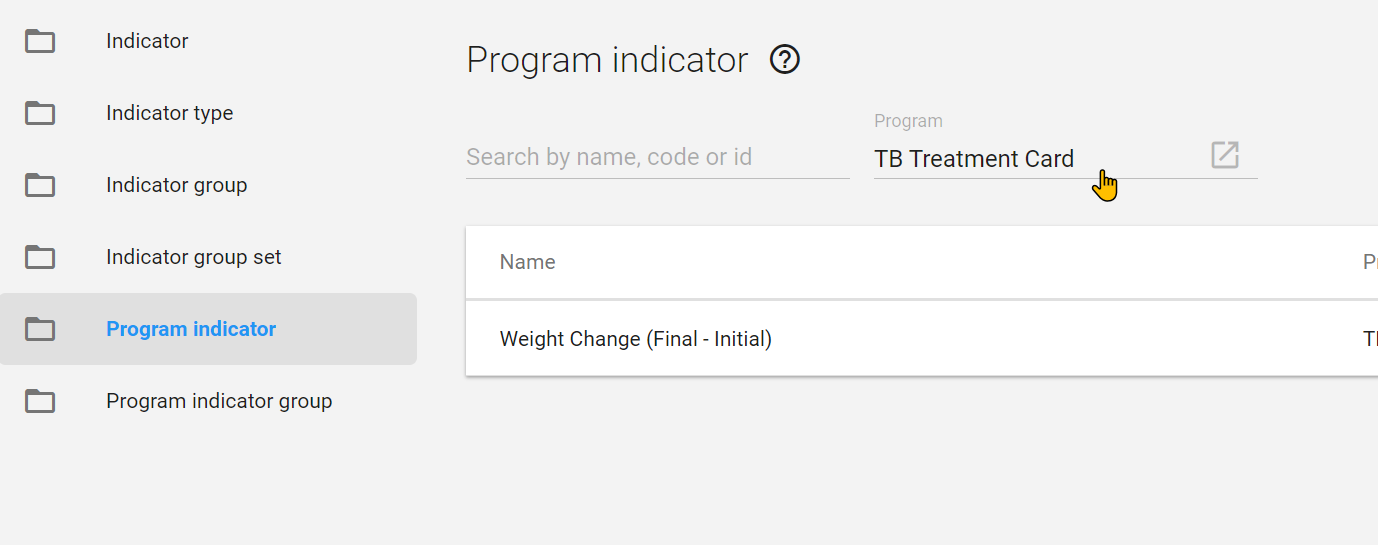
قم بإضافة مؤشر جديد وعدّل تفاصيله{ #add-a-new-indicator-and-edit-the-program-indicator-details }
حدد علامة الزائد الأزرق لإضافة مؤشر جديد.
أولاً، قم بتحرير الاسم، الاسم المختصر وتفاصيل الكود.

تخطى اللون والأيقونة
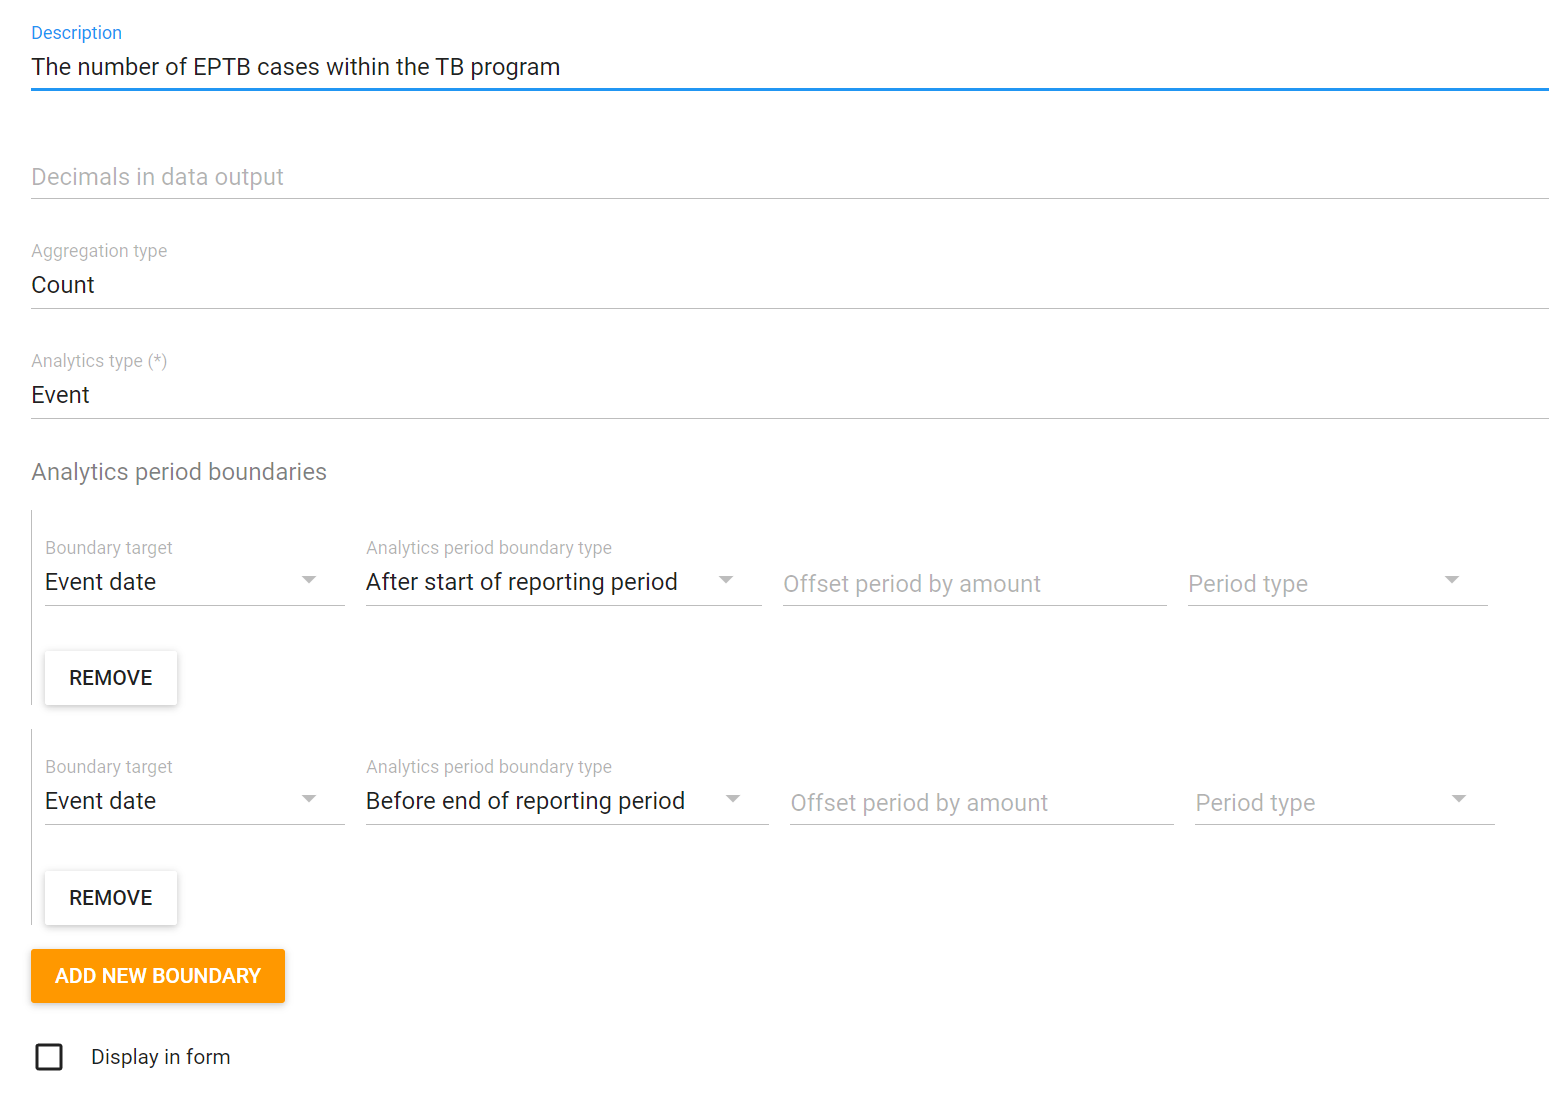
بعد ذلك، قم بإضافة وصف.
قم بمراجعة نوع التجميع، ماذا نحاول أن نفعل بهذا المؤشر؟ نريد حساب عدد الحالات التي تمثل EPTB.
مراجعة نوع التحليل. نحتاج فقط إلى بيانات من مرحلة واحدة في البرنامج، وهذه المرحلة غير متكررة. في هذا السيناريو، نوع التحليل هو Event.
بعد تحديد نوع التحليل، ستظهر لك "Analytics period boundaries." اترك القيم الافتراضية كما هي، لن نغطيها في هذه الأكاديمية. يمكنك معرفة المزيد عنها في docs .
تحرير التعبير
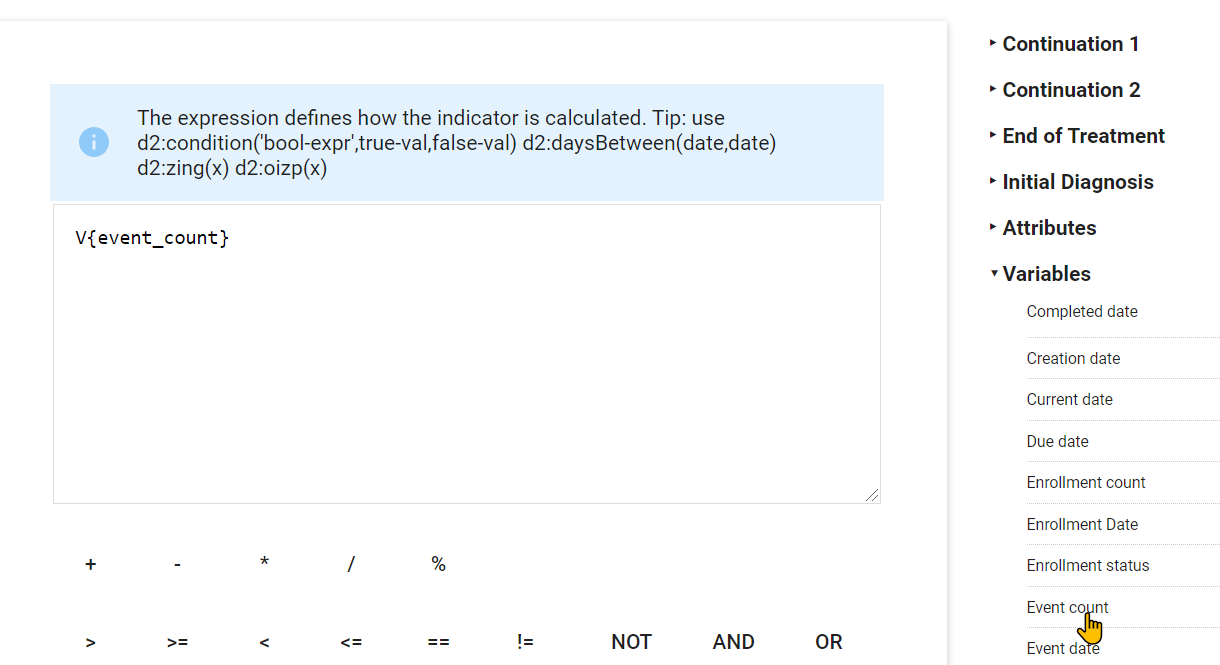
حدد علامة تبويب التعبير من أجل تحرير التعبير. هذا هو المكان الذي نحدد فيه ما نريد أن يحدث رياضيًا.
عندما تقوم بإنشاء مؤشر برنامج في برنامج متعقب، سترى جميع مراحل البرنامج موجودة في القائمة اليمنى. ومن هنا يمكنك تحديد أي من عناصر البيانات التابعة لتلك المراحل. ستتمكن أيضًا من تحديد الخصائص التابعة لهذا البرنامج. بالإضافة إلى ذلك، لدينا أيضًا متغيرات وثوابت يمكننا استخدامها في حساباتنا.
في هذه الحالة، يمكننا استخدام متغير بسيط، يسمى عدد الأحداث، لتحديد التعبير الخاص بنا. وذلك لأننا نريد حساب عدد الأحداث التي تستوفي معايير معينة. هذا متغير من المحتمل أن تجد نفسك تستخدمه كثيرًا.
تعديل الفلتر
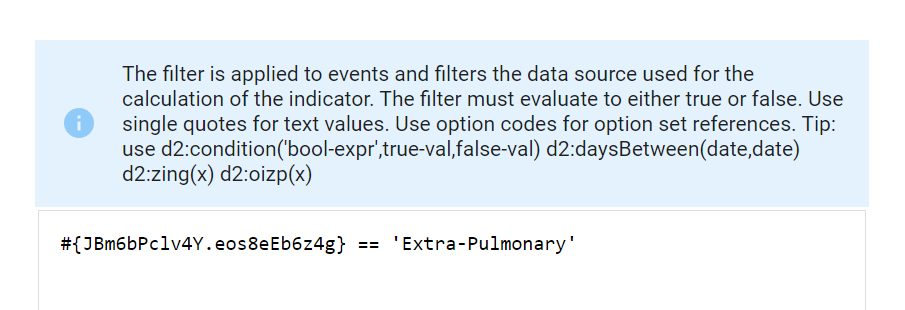
حدد علامة تبويب الفلتر من أجل تحرير الفلتر. نحدد هنا المعايير التي نريد تضمينها في حساباتنا الرياضية. نريد أن نحصي الأحداث، ولكن أي منها؟ في حالتنا، تلك التي يكون موقع المرض فيها غير رئوي.
موقع المرض هو أحد عناصر البيانات في برنامجنا، لذا يمكننا تحديده
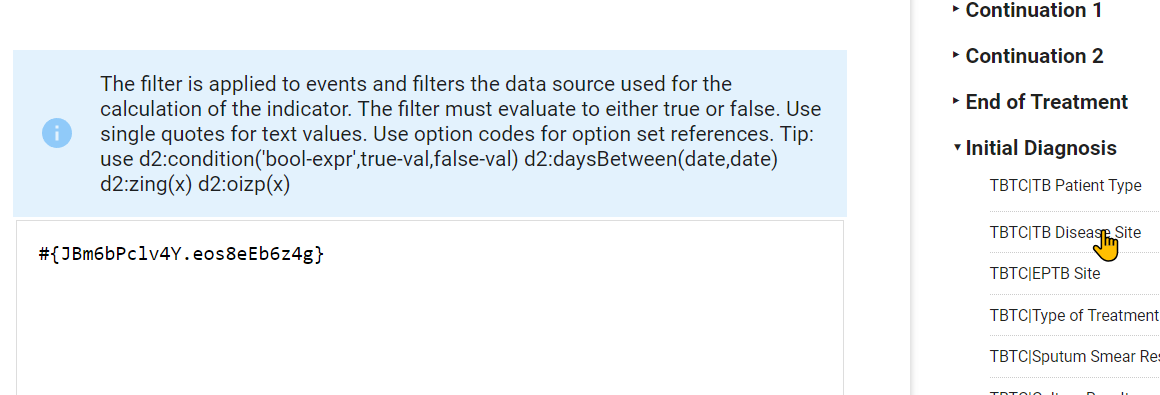
بعد ذلك، يمكننا استخدام العامل "يساوي".
في مؤشرات البرنامج، يتم تحديد الخيارات عبر الكود الخاص بها ضمن مجموعة الخيارات. في هذا المثال، الاسم والكود متماثلان، ولكن إذا لم تكن على دراية به، فمن الجيد عادةً التحقق من كود الخيار الذي تستخدمه.
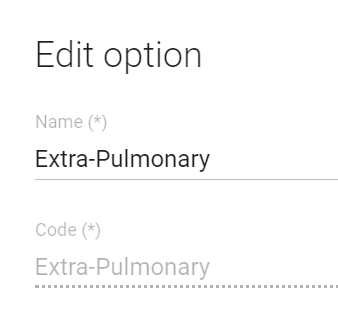
انسخ الكود وأضفه إلى الفلتر. نضيفها بين علامتي الاقتباس لأنها قيمة نصية. يجب أن تكون جميع القيم النصية بين علامات الاقتباس.
اختبر مؤشر البرنامج
Now that you have created the program indicator, it is a good idea to test if it is functional. You can compare the properly configured indicator with the one you have created to ensure that the value is correct. In order to do this you can navigate to the pivot table app.
Navigate to the data visualizer app
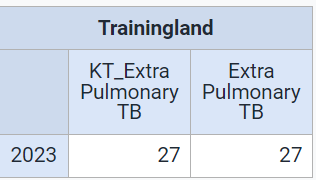
Create a new pivot table with the following details
- Data : the program indicator you made, the program indicator “Extra Pulmonary TB”
- Period : Last year
- Organisation Unit : Trainingland
Click on update to verify that the values are equal in the indicators. This will provide some validation that the indicator is created correctly.
STOP - Perform Exercise 1
Indicator 2 : New, Pulmonary TB Cases
تصور المؤشر
We want to COUNT the number of New, Pulmonary TB cases
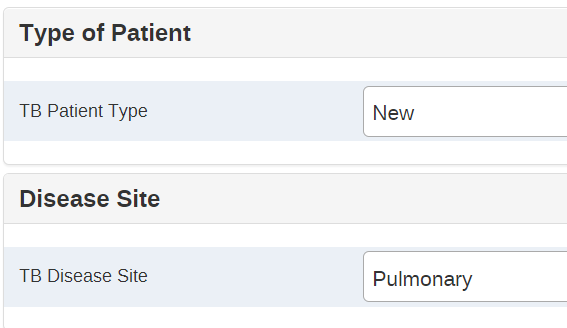
These values are taken from 2 different data elements, TB Patient Type and TB Disease Site, both with option set values to select from. This means that we will need to consider the codes of these values again.
تحرير تفاصيل المؤشر
انتقل إلى الصيانة -> المؤشر-> مؤشر البرنامج
اختر "TB Treatment Card" كبرنامج
قم بإضافة مؤشر جديد وعدّل تفاصيله{ #add-a-new-indicator-and-edit-the-program-indicator-details }
حدد علامة الزائد الأزرق لإضافة مؤشر جديد.
أولاً، قم بتحرير الاسم، الاسم المختصر وتفاصيل الكود.
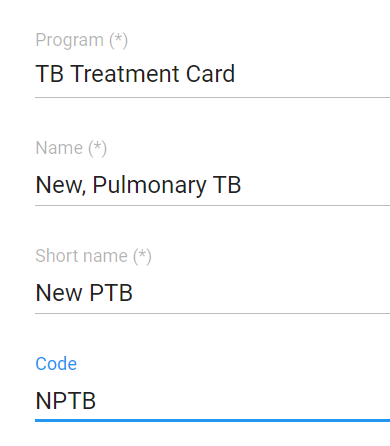
تخطى اللون والأيقونة
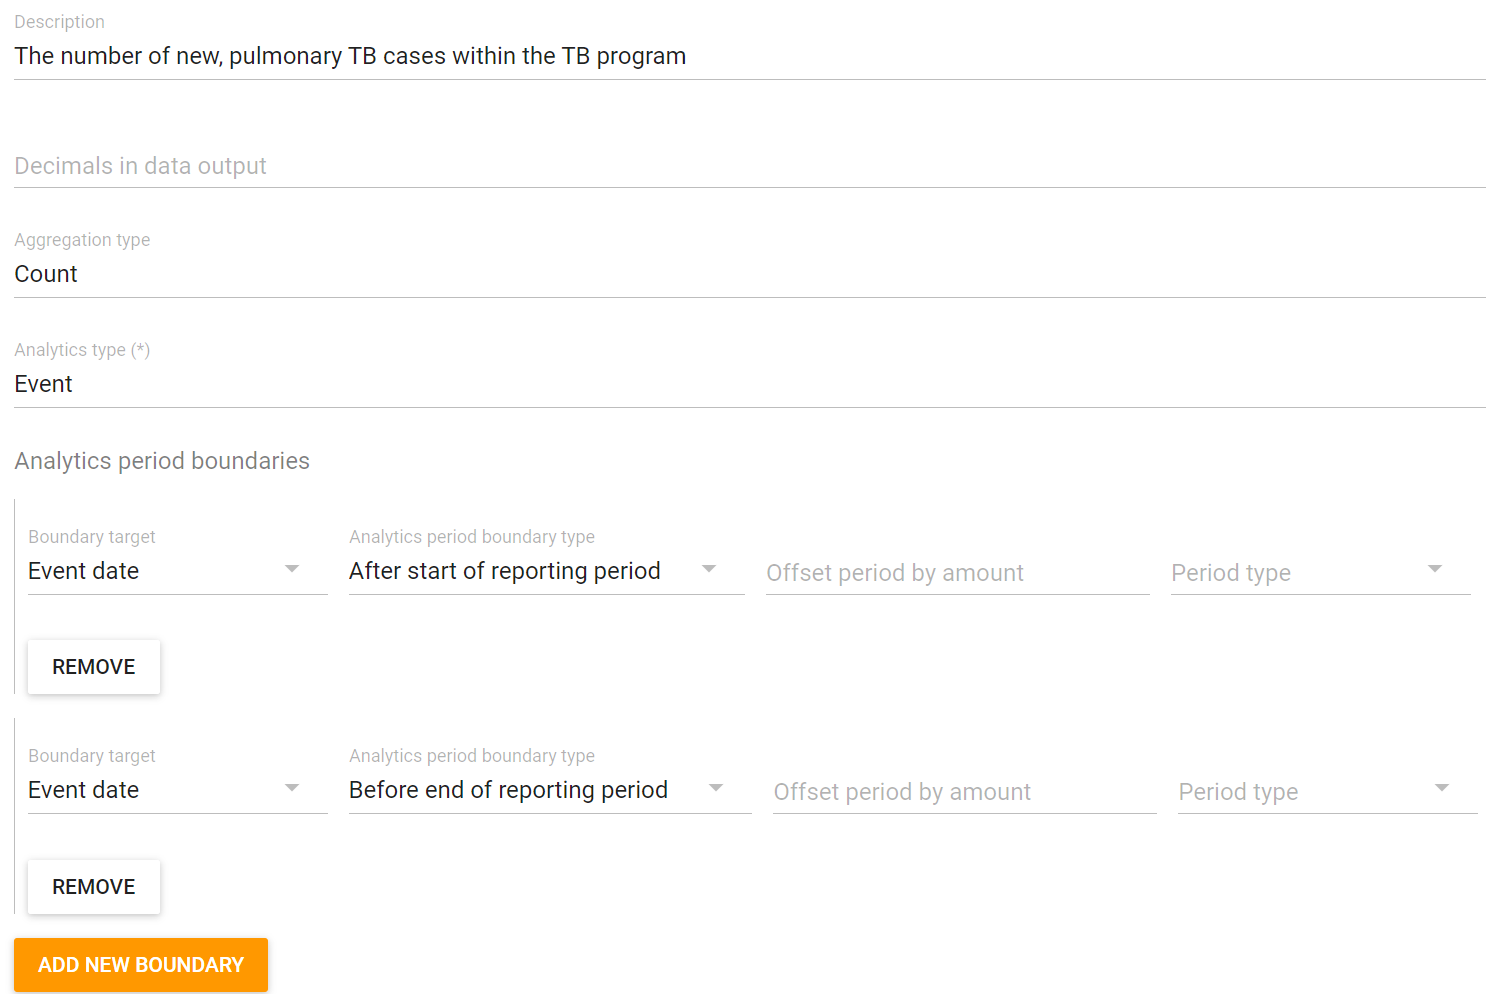
Next, add a description.
Review the aggregation type, what are we trying to do with this indicator? We want to COUNT the number of cases that are EPTB.
مراجعة نوع التحليل. نحتاج فقط إلى بيانات من مرحلة واحدة في البرنامج، وهذه المرحلة غير متكررة. في هذا السيناريو، نوع التحليل هو Event.
بعد تحديد نوع التحليل، ستظهر لك "Analytics period boundaries." اترك القيم الافتراضية كما هي، لن نغطيها في هذه الأكاديمية. يمكنك معرفة المزيد عنها في docs .
Edit the expression
حدد علامة تبويب التعبير من أجل تحرير التعبير. هذا هو المكان الذي نحدد فيه ما نريد أن يحدث رياضيًا.
In this case, we can use a simple variable, called event count, to define our expression. This is because we want to count the number of events that meet a certain criteria. This is a variable you will likely find yourself using quite often.
Edit the filter
Select the filter tab in order to edit the filter. Here we define what criteria we want to include in our mathematical calculation. We want to count events, but which ones? In our case, those where the patient type is new AND the disease site is pulmonary.
Patient Type and Disease site is a data element in our program, so we can select them. Let us first select Patient type
بعد ذلك، يمكننا استخدام العامل "يساوي".
في مؤشرات البرنامج، يتم تحديد الخيارات عبر الكود الخاص بها ضمن مجموعة الخيارات. في هذا المثال، الاسم والكود متماثلان، ولكن إذا لم تكن على دراية به، فمن الجيد عادةً التحقق من كود الخيار الذي تستخدمه.
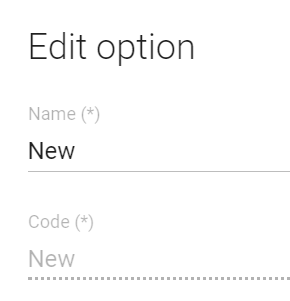
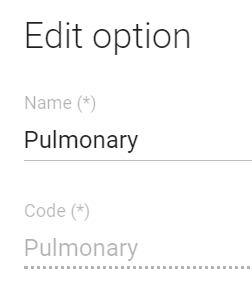
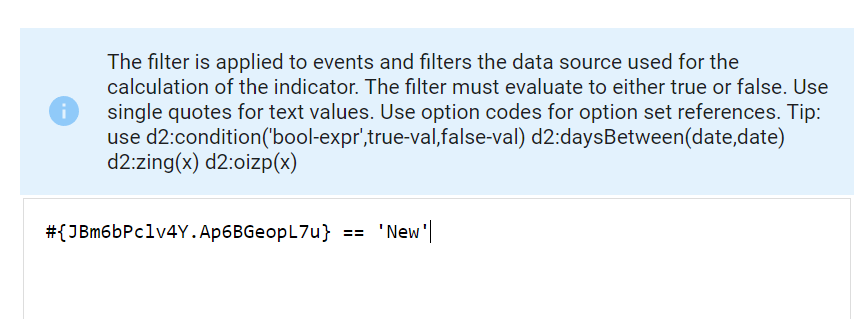
Copy the code and add it into the filter. We add it in between quotes as it is a text value. All text values need to be in-between quotes.
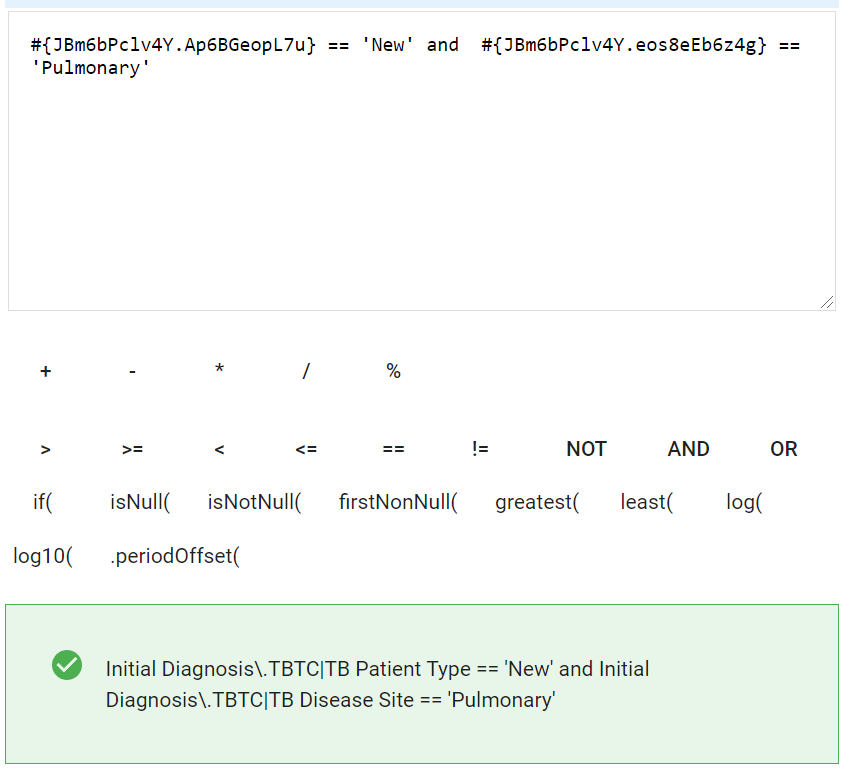
In order for this indicator to meet our required criteria, the patient has to be new AND the disease site has to be pulmonary. We therefore must use the ‘and’ logical operator in this scenario. Select the disease site data element and complete the filter.
اختبر مؤشر البرنامج
Now that you have created the program indicator, it is a good idea to test if it is functional. You can compare the properly configured indicator with the one you have created to ensure that the value is correct. In order to do this you can navigate to the pivot table app.
Navigate to the data visualizer app
Create a new pivot table with the following details
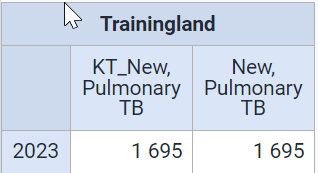
- Data : the program indicator you made, the program indicator “New, Pulmonary TB”
- Period : Last year
- Organisation Unit : Trainingland
Click on update to verify that the values are equal in the indicators. This will provide some validation that the indicator is created correctly.
STOP - Perform Exercise 2
Indicator 3 : Patients on who failed treatment or died
تصور المؤشر
We want to COUNT the number of cases that either died or treatment failed
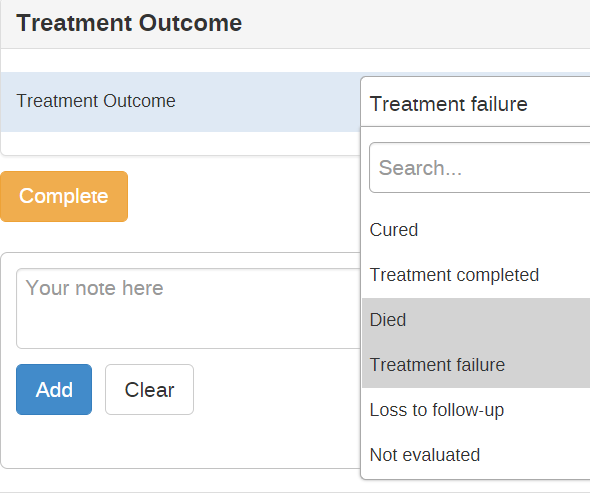
These values are taken from 1 data element, Treatment Outcome, with option set values to select from. This means that we will need to consider the codes of these values again.
تحرير تفاصيل المؤشر
انتقل إلى الصيانة -> المؤشر-> مؤشر البرنامج
اختر "TB Treatment Card" كبرنامج
قم بإضافة مؤشر جديد وعدّل تفاصيله{ #add-a-new-indicator-and-edit-the-program-indicator-details }
حدد علامة الزائد الأزرق لإضافة مؤشر جديد.
أولاً، قم بتحرير الاسم، الاسم المختصر وتفاصيل الكود.

تخطى اللون والأيقونة
Next, add a description.
Review the aggregation type, what are we trying to do with this indicator? We want to COUNT the number of cases that are either on facility or community based DOT.
مراجعة نوع التحليل. نحتاج فقط إلى بيانات من مرحلة واحدة في البرنامج، وهذه المرحلة غير متكررة. في هذا السيناريو، نوع التحليل هو Event.
بعد تحديد نوع التحليل، ستظهر لك "Analytics period boundaries." اترك القيم الافتراضية كما هي، لن نغطيها في هذه الأكاديمية. يمكنك معرفة المزيد عنها في docs .
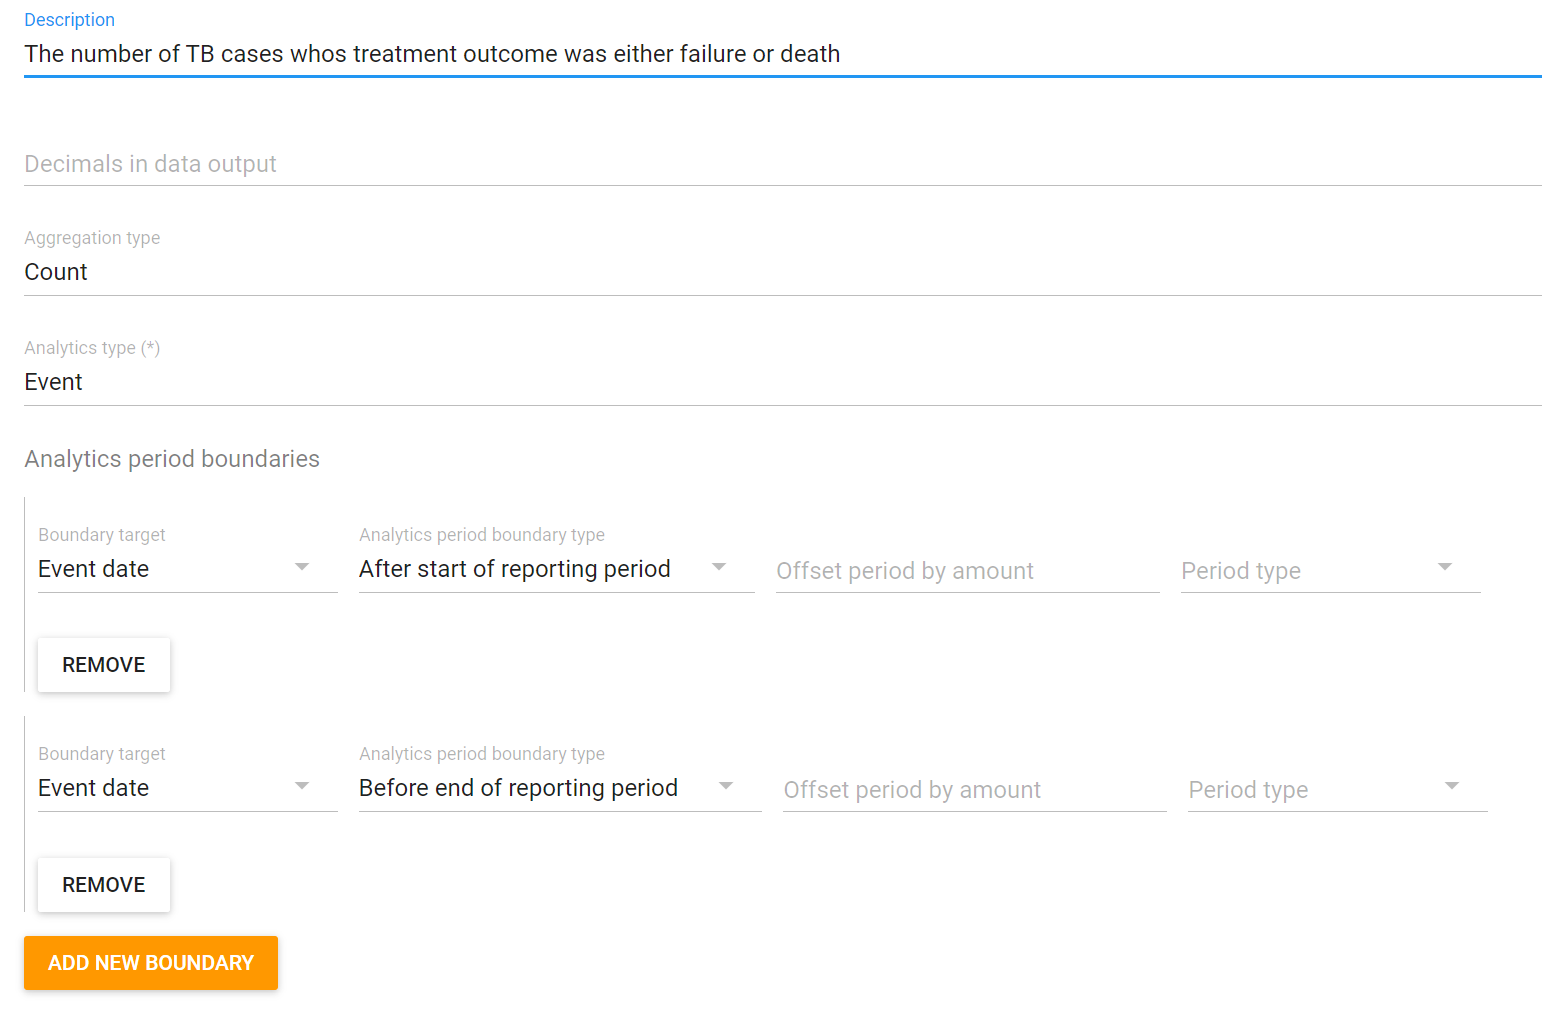
Edit the expression
حدد علامة تبويب التعبير من أجل تحرير التعبير. هذا هو المكان الذي نحدد فيه ما نريد أن يحدث رياضيًا.
In this case, we can use a simple variable, called event count, to define our expression. This is because we want to count the number of events that meet a certain criteria. This is a variable you will likely find yourself using quite often.
Edit the filter
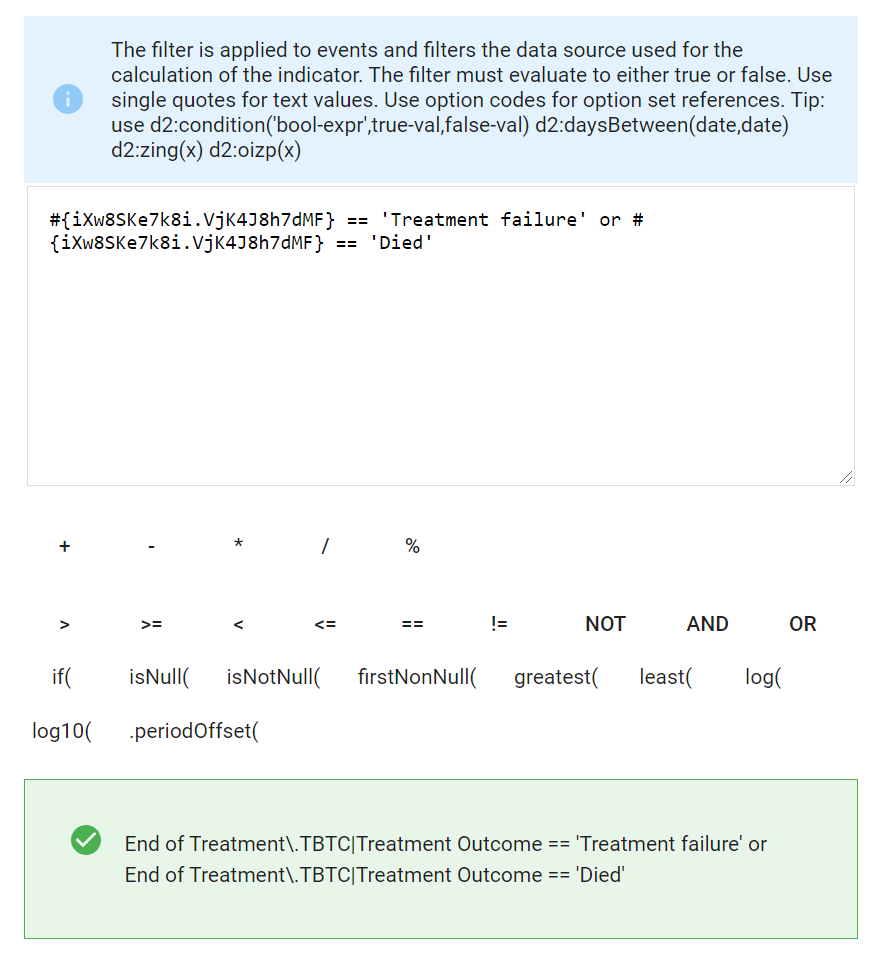
Select the filter tab in order to edit the filter. Here we define what criteria we want to include in our mathematical calculation. We want to count events, but which ones? In our case, those where the treatment outcome is either treatment failure or died.
Treatment outcomet is a data element in the the end treatment stage of our program, so we can select it.
بعد ذلك، يمكننا استخدام العامل "يساوي".
في مؤشرات البرنامج، يتم تحديد الخيارات عبر الكود الخاص بها ضمن مجموعة الخيارات. في هذا المثال، الاسم والكود متماثلان، ولكن إذا لم تكن على دراية به، فمن الجيد عادةً التحقق من كود الخيار الذي تستخدمه.

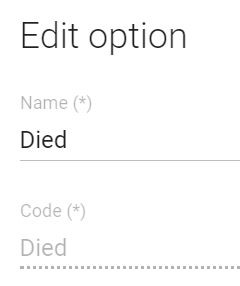
Copy the code and add it into the filter. We add it in between quotes as it is a text value. All text values need to be in-between quotes.
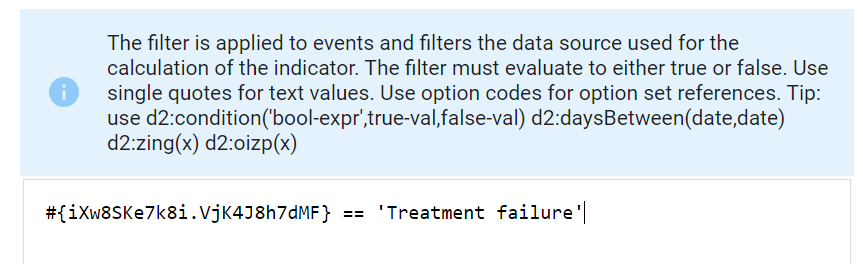
In order for this indicator to meet our required criteria, the patient can be on facility based OR community based DOT. We therefore must use the ‘or’ logical operator in this scenario. Select the disease site data element and complete the filter.
اختبر مؤشر البرنامج
Now that you have created the program indicator, it is a good idea to test if it is functional. You can compare the properly configured indicator with the one you have created to ensure that the value is correct. In order to do this you can navigate to the pivot table app.
Navigate to the data visualizer app
Create a new pivot table with the following details
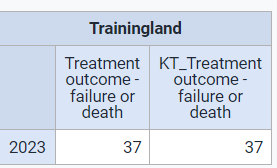
- Data : the program indicator you made, the program indicator “Treatment outcome - failure or death”
- Period : Last year
- Organisation Unit : Trainingland
Click on update to verify that the values are equal in the indicators. This will provide some validation that the indicator is created correctly.
Adding more filter information
What if we want to modify this indicator to only count those cases that were Male and >60?
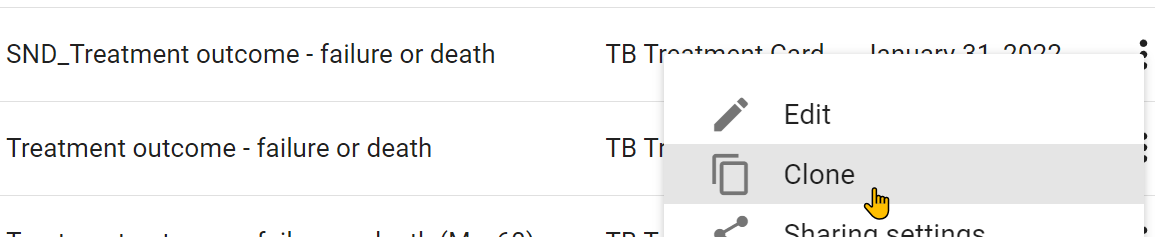
In order to do this, we need to modify our indicator filter. As we are adding on to the previous indicator, let us find it and clone it.
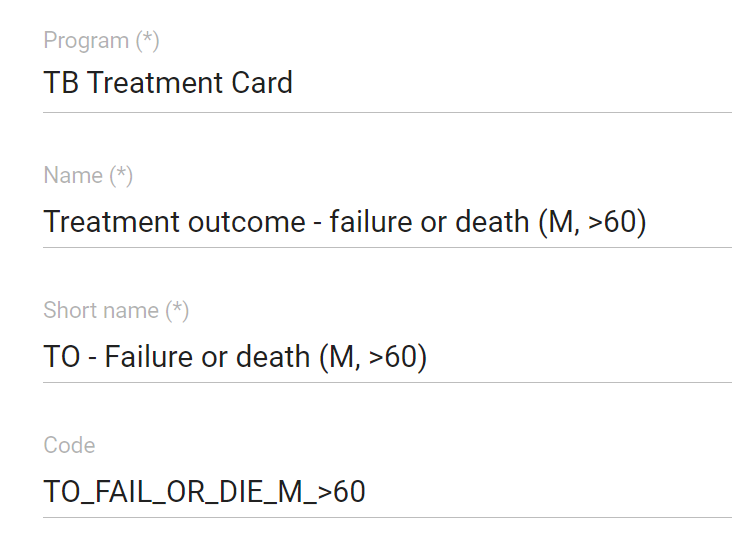
Update the name, short name, code and description

Aggregation type and analytics type remain the same.
The expression is also the same (V{event_count}).
We do need to update our filter however.
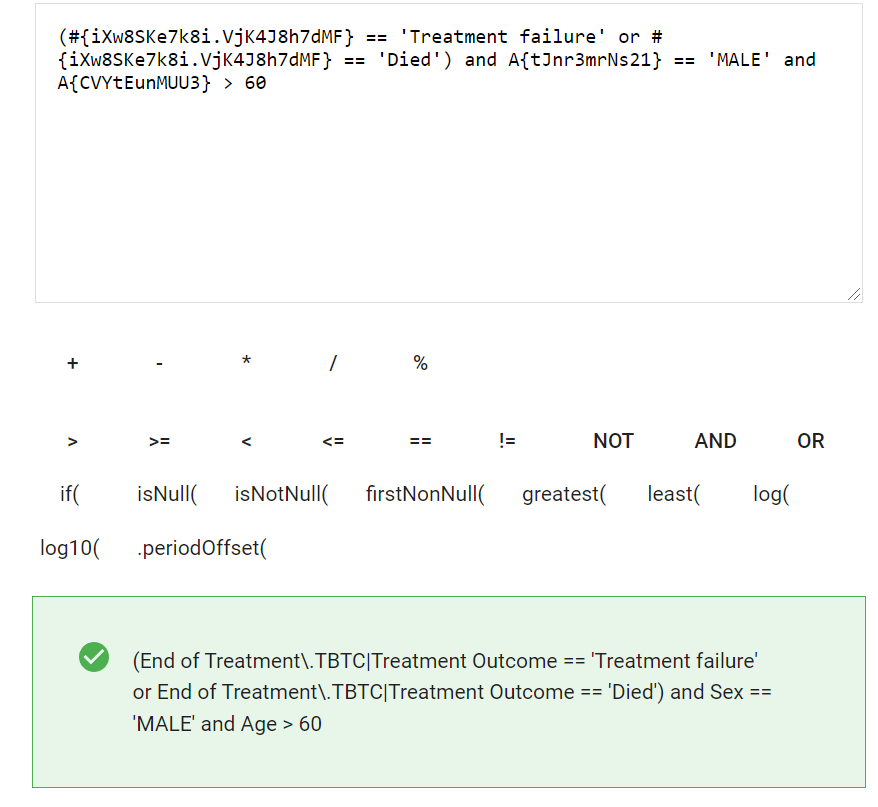
Let’s review what’s changed.
- We introduced grouping by bracketing the or statement
- We added two additional filters for age and sex using and statements
Note that if you are grouping multiple and/or conditions together to create a specific filter criteria, then you will need to use brackets. This acts as a sort of order of operations. Save the indicator after you have entered and explained the filter.
After we save this, we should be able to verify this indicator in data visualizer
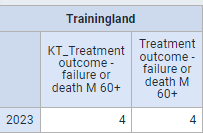
STOP - Perform Exercise 3
Create Enrollment Type Indicators
Indicator 4 : Patients hospitalized the entire treatment
تصور المؤشر
We want to COUNT the number of cases that were hospitalized in both the initial AND continuation phases. This means we are retrieving data from 2 program stages.
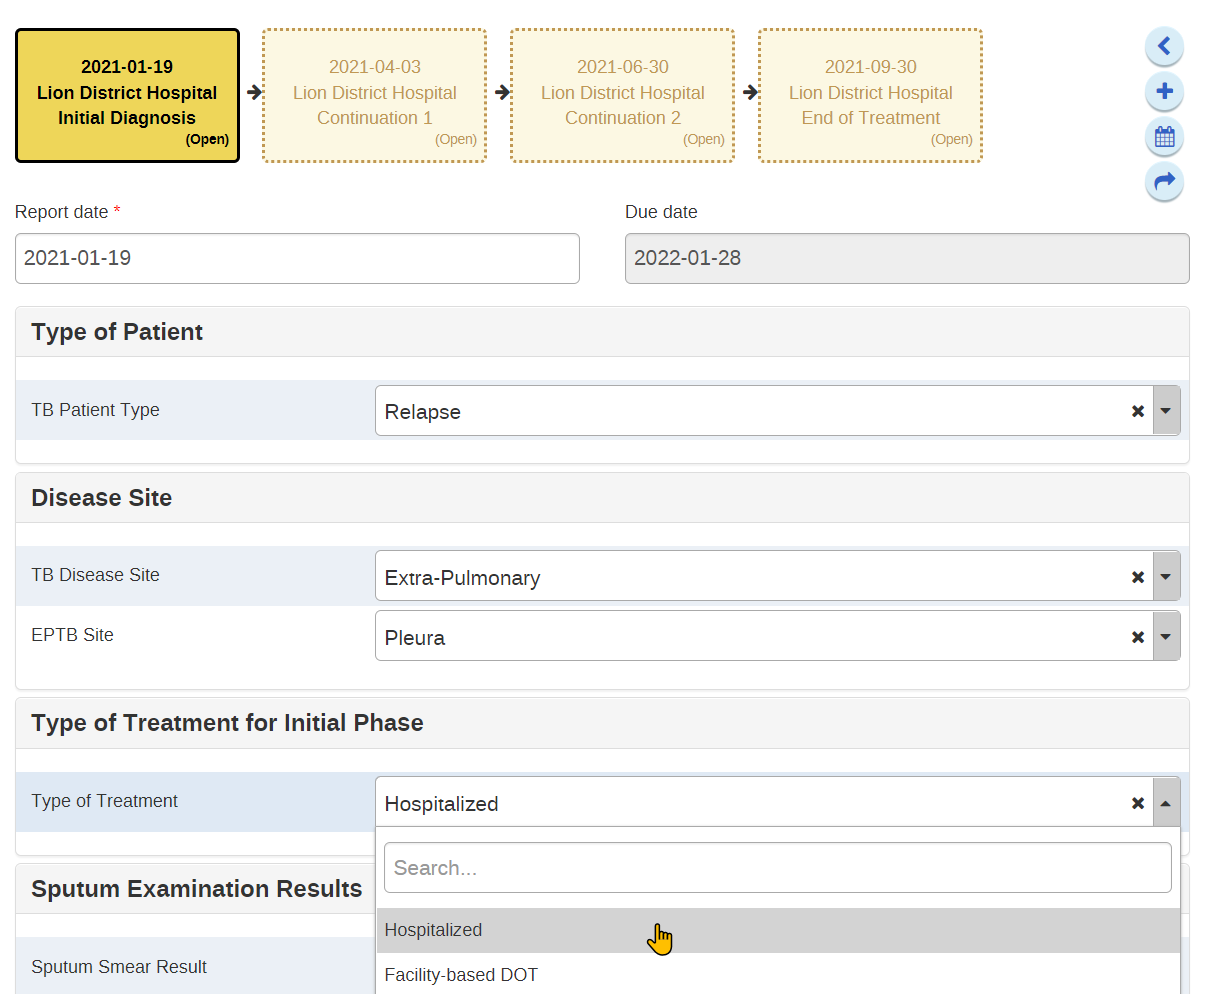
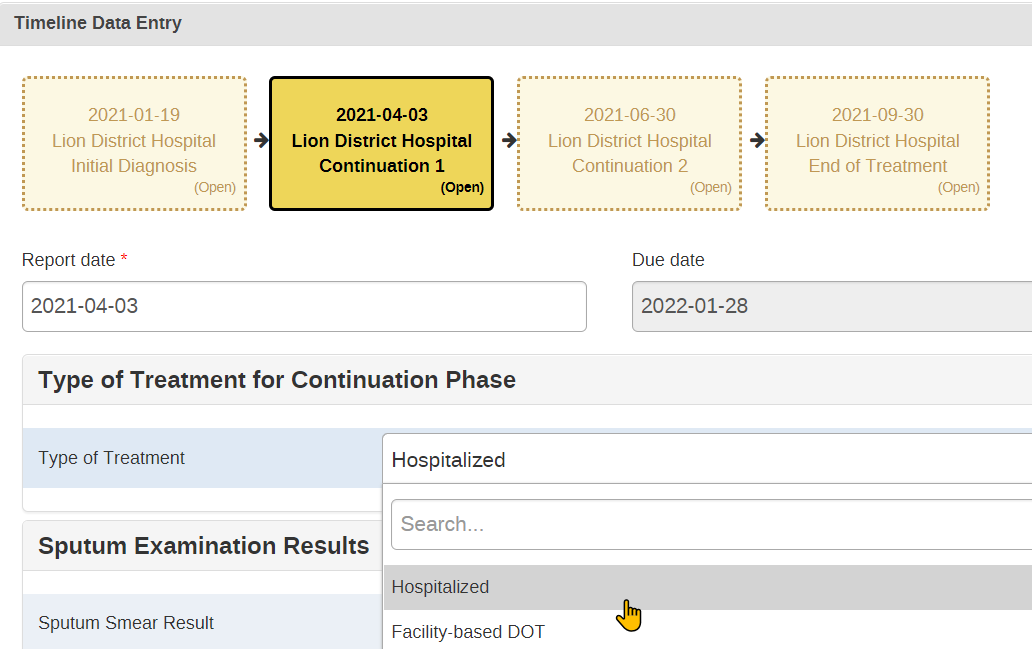
تحرير تفاصيل المؤشر
انتقل إلى الصيانة -> المؤشر-> مؤشر البرنامج
اختر "TB Treatment Card" كبرنامج
قم بإضافة مؤشر جديد وعدّل تفاصيله{ #add-a-new-indicator-and-edit-the-program-indicator-details }
حدد علامة الزائد الأزرق لإضافة مؤشر جديد.
أولاً، قم بتحرير الاسم، الاسم المختصر وتفاصيل الكود.
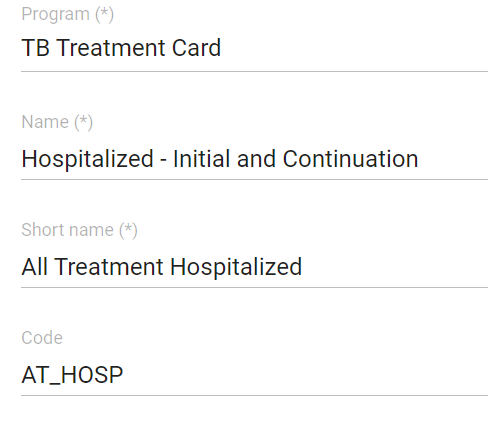
Skip color and icon Next, add a description.
Review the aggregation type, what are we trying to do with this indicator? We want to COUNT the number of cases that were hospitalized during both the initial and continuation phases od treatment.
Review the analytics type. Now we need data from more than one stage, so our analytics type will be ENROLLMENT!
In this particular example, we are creating an enrollment indicator which calculates and displays its information. Note that you can also create a program indicator that calculates the number of enrollments that meet certain criteria. This may be useful if, for example, you want to use data elements with options sets from multiple program stages within the same program in order to filter out the number of enrollments in calculating your indicator. Make sure you let the participants know this, as this will be part of their exercise.
بعد تحديد نوع التحليل، ستظهر لك "Analytics period boundaries." اترك القيم الافتراضية كما هي، لن نغطيها في هذه الأكاديمية. يمكنك معرفة المزيد عنها في docs .
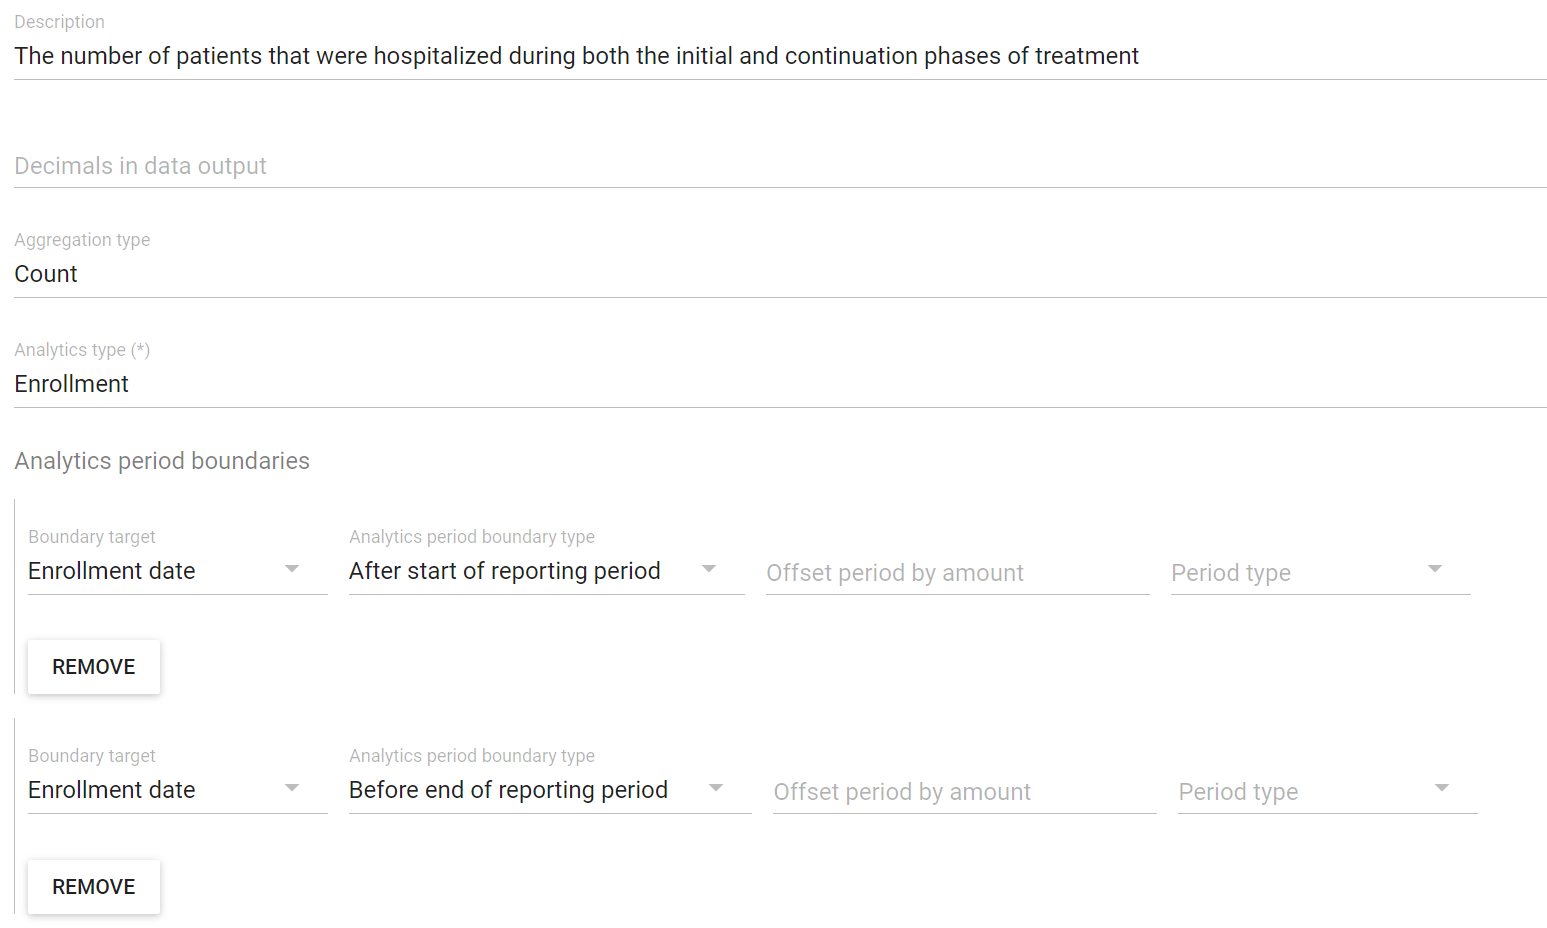
Edit the expression
حدد علامة تبويب التعبير من أجل تحرير التعبير. هذا هو المكان الذي نحدد فيه ما نريد أن يحدث رياضيًا.
In this case, we can use a simple variable, called enrollment count, to define our expression. We are no longer counting events, but enrollments, as we want to combine information across the enrollment and then evaluate it using our filter.

Edit the filter
Select the filter tab in order to edit the filter. Here we define what criteria we want to include in our mathematical calculation. We want to count events, but which ones? In our case, those where the treatment outcome is either treatment failure or died.
Type of treatment is included in both the initial and continuation 1 program stages. Data elements we put into our expression include identification of which program stage it belongs to. This allows us to combine and evaluate data from multiple program stages.
في مؤشرات البرنامج، يتم تحديد الخيارات عبر الكود الخاص بها ضمن مجموعة الخيارات. في هذا المثال، الاسم والكود متماثلان، ولكن إذا لم تكن على دراية به، فمن الجيد عادةً التحقق من كود الخيار الذي تستخدمه.
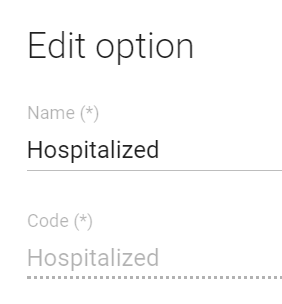
Edit the expression
Let’s review the expression
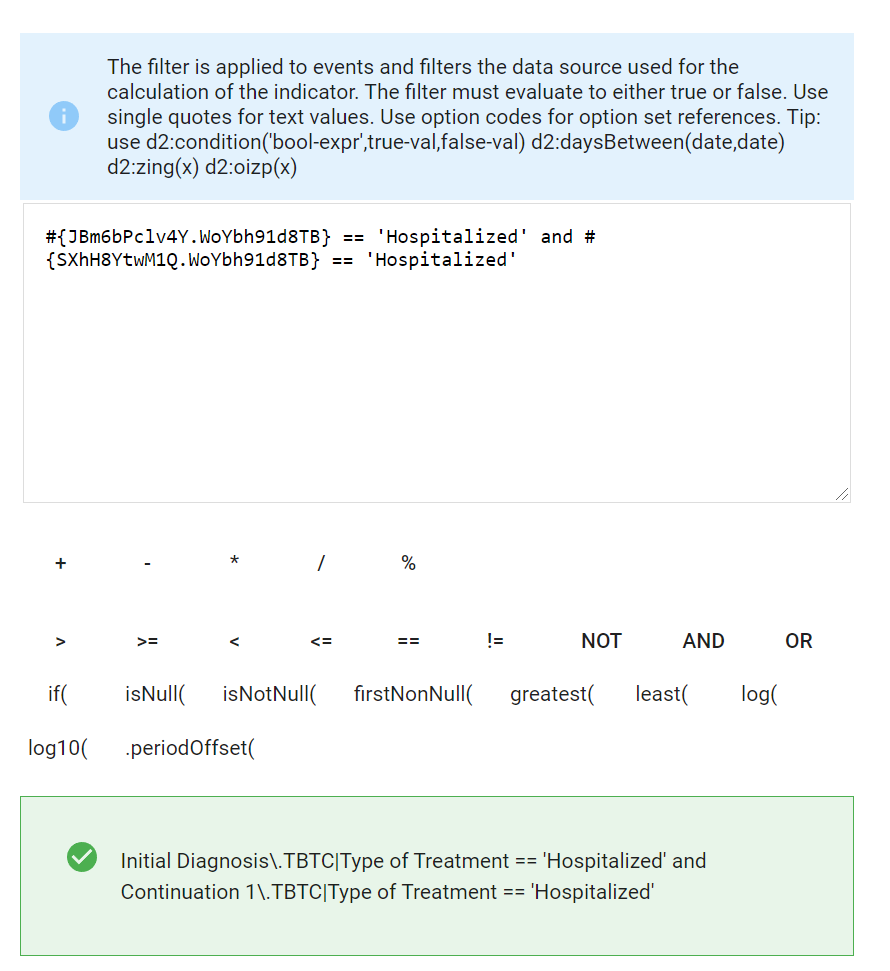
The data elements in our expression are identified as {program stage.data element}. We can see we have the same data element, but the program stage id is different. We can also see this in the green verification box below.
اختبر مؤشر البرنامج
Now that you have created the program indicator, it is a good idea to test if it is functional. You can compare the properly configured indicator with the one you have created to ensure that the value is correct. In order to do this you can navigate to the pivot table app.
Navigate to the data visualizer app
Create a new pivot table with the following details
- Data : the program indicator you made, the program indicator “Hospitalized - Initial and Continuation”
- Period : Last year
- Organisation Unit : Trainingland
Click on update to verify that the values are equal in the indicators. This will provide some validation that the indicator is created correctly.
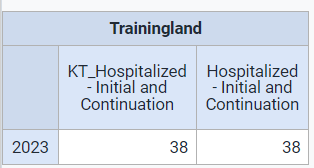
STOP - Perform Exercise 4
Indicator 5 - Change in Weight
Navigate back to Indicators -> Program Indicators and click on New to create a new indicator

Program: TB Treatment Card
تصور المؤشر
Create a program indicator which calculates the difference in weight between the initial diagnosis and end of treatment. This should only be calculated on the condition that the culture result is negative and the treatment outcome is either cured or completed.
Edit the program indicator details
After selecting the plus sign, ensure the program you are working with is selected. Fill in the details as follows (replace your initials with the ones in the screenshot). Note in this case you are using “Enrollment” as the aggregation type. This type of program indicator calculates the indicator using parameters across the entire enrollment, rather than within an event.
We want this indicator to calculate on the fly and then be displayed directly in tracker capture. In order to accomplish this, ensure that “Display in form” is checked.
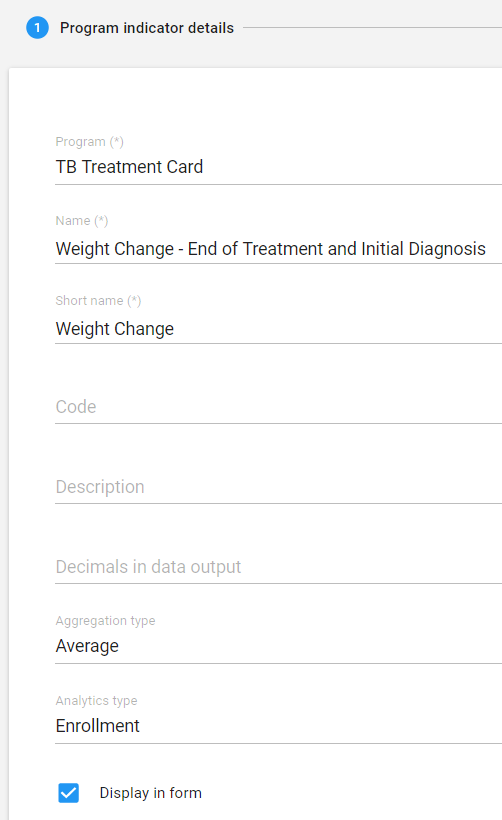
Edit the expression
Select edit expression from the timeline menu
For the expression, you want to take the difference between the weight during the end of treatment stage and the initial diagnosis stage. TB tends to cause additional weight loss often, and after treatment they should hopefully gain some of this back.

Edit the Filter
Select edit filter from the timeline menu

We are now going to create our criteria which will filter out the events required (culture result is negative and the treatment outcome is either cured or completed).
When we set criteria within a filter using option sets, we must use the option code. The option code may be different than the name, We will have to set three criteria using the available data elements from the program:
- Culture Result == ‘Negative (0 colonies)’ and
- Treatment Outcome == ‘Cured’ or Treatment Outcome == ‘Treatment completed’
You can select the data elements from the right side menu as before. In the filter box, you will see the programuid.dataelementuid in the expression. Underneath in the green box, you will see this represented in plain text which is easier to decipher.
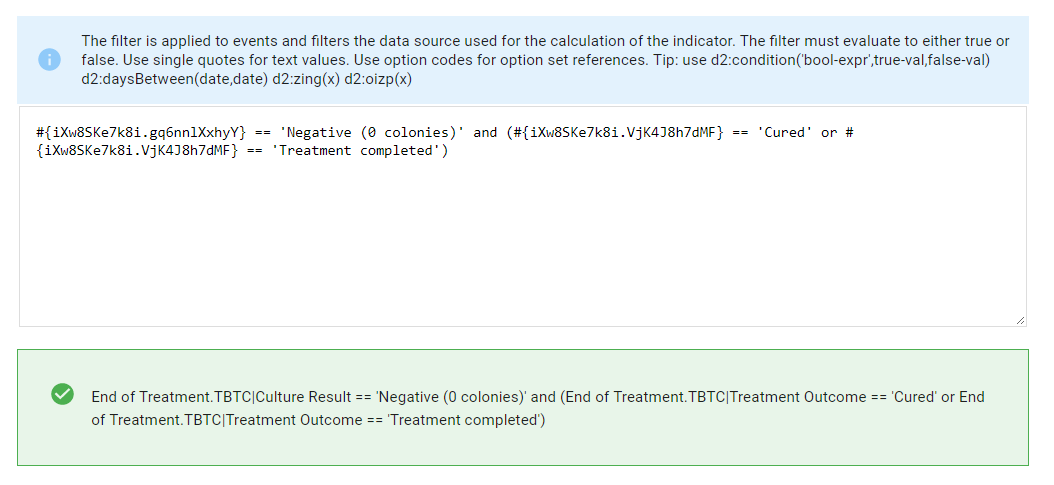
Notice how the or condition is contained within brackets. This is required to ensure the filter runs properly. Note that if you are grouping multiple and/or conditions together to create a specific filter criteria, then you will need to use brackets. Save the indicator after you have entered and explained the filter.
اختبر مؤشر البرنامج
Navigate to tracker capture in this case to test the program indicator. Clear your cache if you have accessed the program already.
Select any Facility that has the TB Treatment Card program.
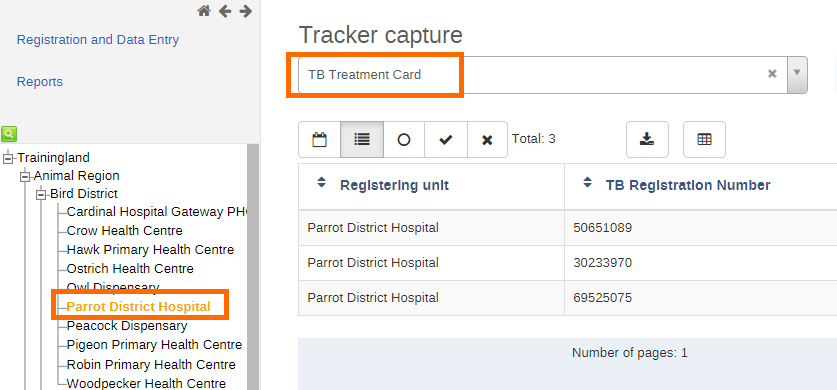
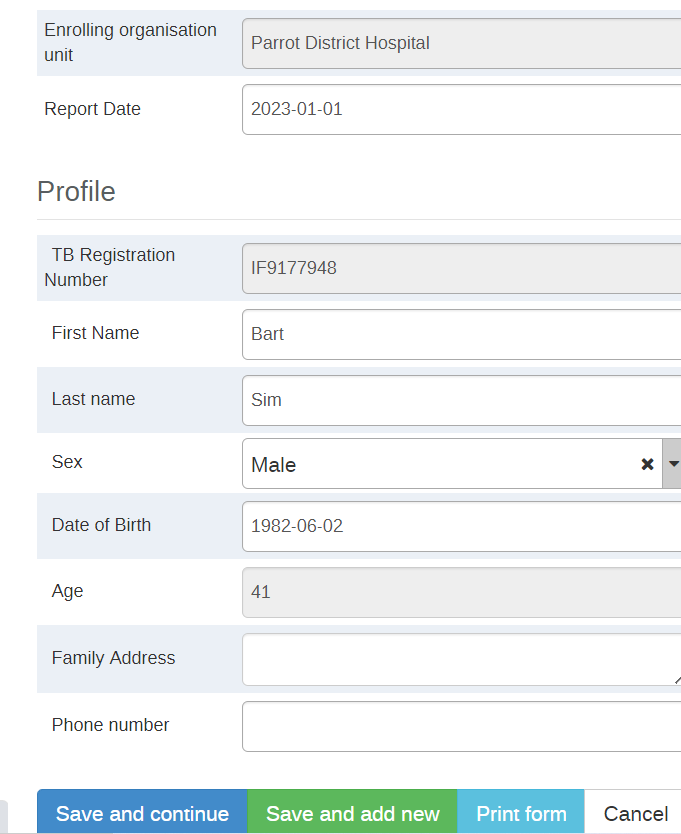
Proceed to register a new TEI. Click on Save and continue when the details are entered. You may want to select a report date that is ~5-6 months back from the current date as this is the average difference between the initial diagnosis and end of treatment stages.
In the tracker dashboard, you will see a space for indicators as well as the timeline data entry. The weight indicator will appear when the filter meets your criteria that was set earlier
- Culture Result == ‘Negative (0 colonies)’ and
- Treatment Outcome == ‘Cured’ or Treatment Outcome == ‘Treatment completed’
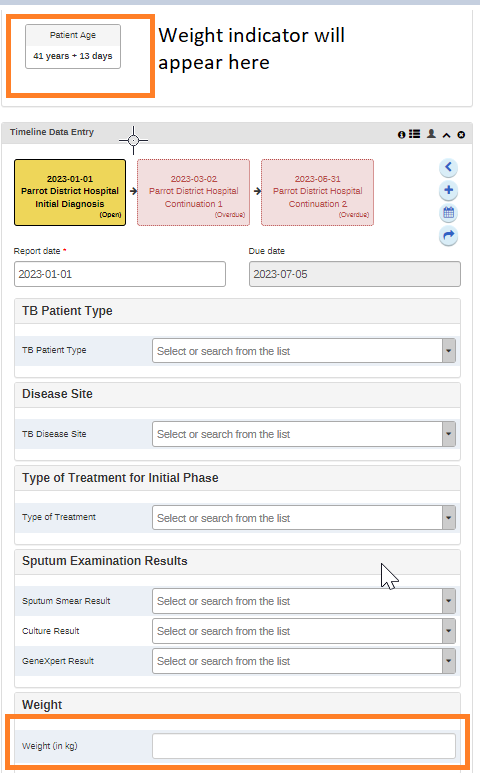
To get started enter a weight value in the Initial Diagnosis stage
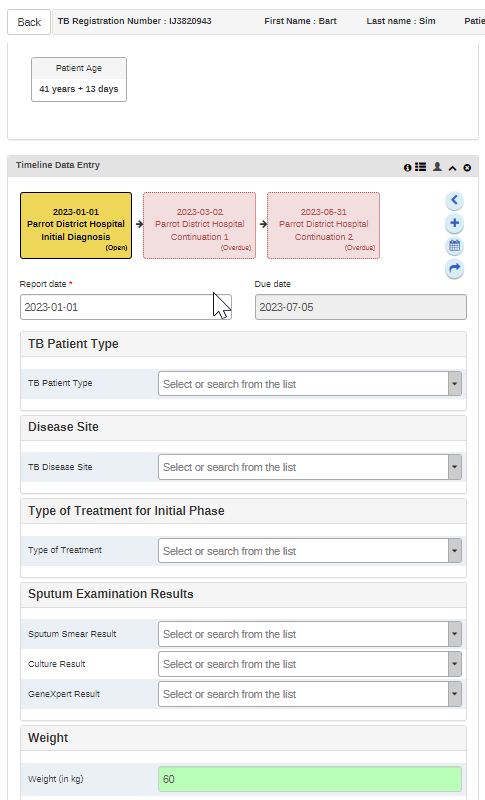
Than add an event for the end of treatment stage
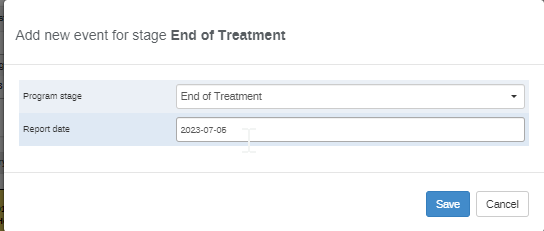
Enter a weight value, select negative **as the_ **culture result_ and select either Cured or Treatment completed as the treatment outcome.
Note to the participants that the weight indicator does not appear unless these criteria are met.

STOP - Perform Exercise 5
إنشاء مؤشرات مُركبة (مجمعة)
Indicator 6 : TB Incidence rate per 100,000
After you have made a couple program indicators, it is a good idea to show the participants how to create combined indicators. This would have been discussed briefly in the program indicators presentation. Here we can take program indicators and combine them with aggregate data elements to make indicators as required. We do this by using the regular indicators app.
تصور المؤشر
We want to calculate the TB incidence rate per 100, 000 population. This is equal to:
(The number of new TB cases/Total Population) * 100, 000
If we break this down,
- We can retrieve the number of new TB cases from our TB treatment card program. We need to create a program indicator to retrieve this total
- The total population is an aggregate data element that we might import into DHIS2 from a census or other estimation survey
- We multiply the divided values by 100,000 to calculate our incidence rate
Review the program indicator
A program indicator, TB new cases, has already been created as part of this demonstration. You can review it quickly to see the aggregation type, expression and filter.

Review the denominator
We can use the data element “Total Population” as our denominator. This already exists as a data element in our system and also already has data within it.
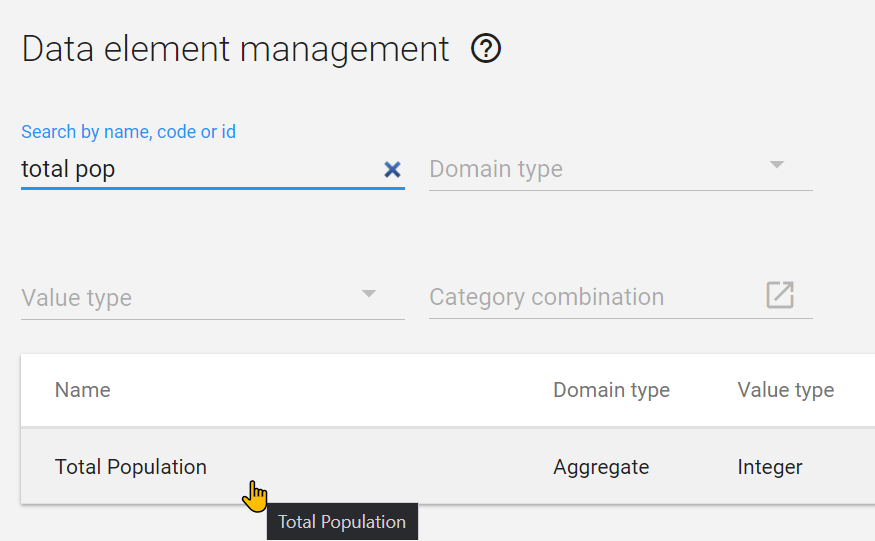
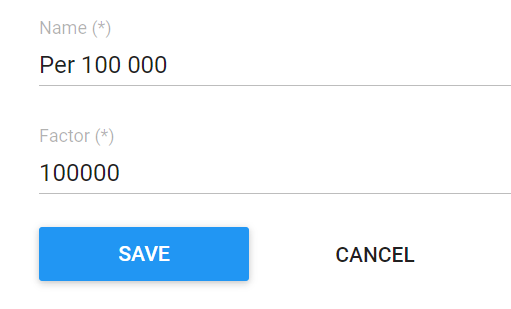
Review the indicator type
We want to create an indicator with a factor of 100, 000. This already exists in our system and we can use it when we build our indicator.
Create a new indicator
Navigate to the indicator management page (Maintenance -> Indicator) and proceed to create a new indicator.
Add in the details of your indicator
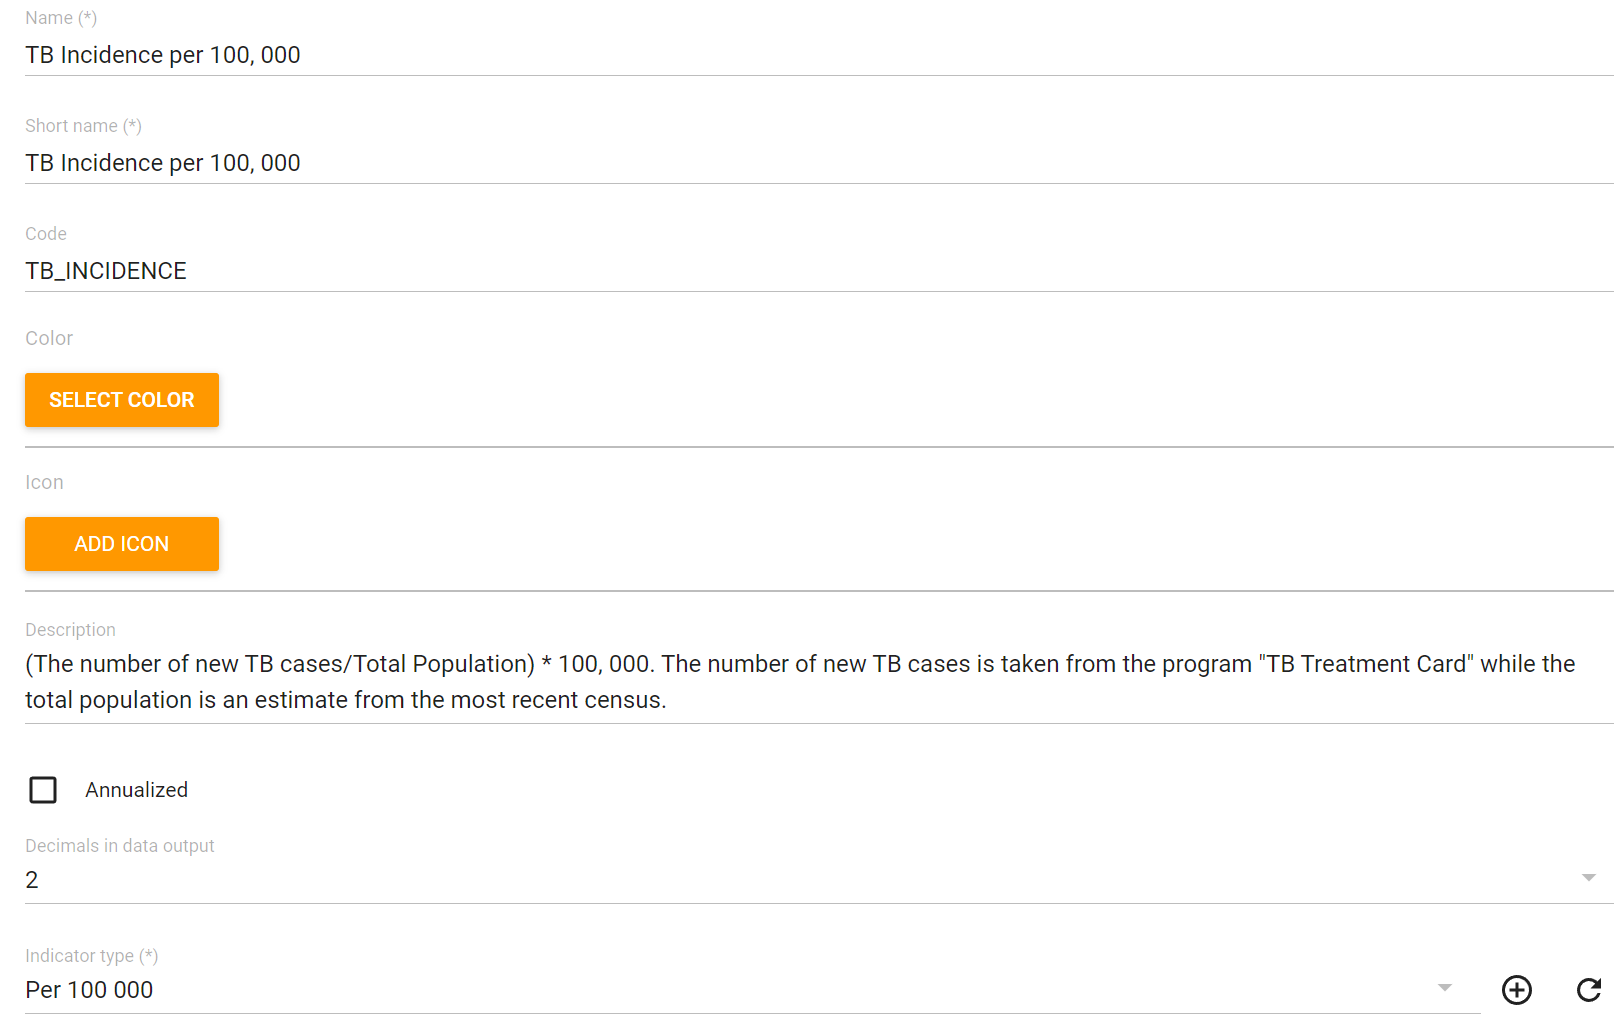
Here is an example description:
(The number of new TB cases/Total Population) * 100, 000. The number of new TB cases is taken from the program "TB Treatment Card" while the total population is an estimate from the most recent census.
Edit the numerator
I am able to select program indicators as a source here in the indicator management page.
Select
- Programs
- TB Treatment Card
- Indicators
- The indicator TB new cases
- Enter a description
- Save

Edit the denominator
Select
- عناصر البيانات
- The data element Total Population
- Enter a description
- Save
Save the indicator before proceeding
Allow the others to create the indicator than give everyone a break. You will need to run analytics before you can see the output of this indicator.
Verify the indicator in data visualizer
Create a pivot table with the inputs:
- Data:
- TB new cases (program indicator from TB treatment card)
- Total population (data element)
- TB Incidence per 100,000 (the indicator you just made)
- Period : Last year
- Org unit : Trainingland
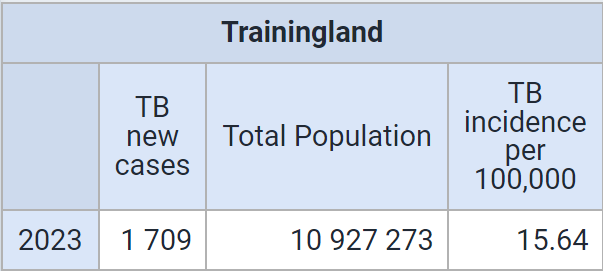
You can verify the calculation manually and see if the result is correct!