TB Data Quality Dashboard
Purpose and Scope
This document provides the standard procedures to be followed in conducting data quality checks on routinely reported tuberculosis surveillance data in DHIS2. The purpose of this document is to provide guidance for all levels using national health management information system (HMIS).
The TB “Data Quality” (DQ) dashboard aims to assist countries in improving data quality. It includes basic guidance and the steps to take to ensure that the data collected are of the sufficient quality to carry out analysis of trends in core indicators.
Intended Users
-
Primarily for sub-national level program coordinators to monitor data quality and detect facilities where data quality improvement may be needed. The dashboard can be used support routine data reviews, checking for data quality errors and cleaning (according to national policies & SOPs). The dashboard can also be used to provide quick summarised feedback to facilities and to benchmark plans for data quality improvement.
-
Health facility managers can view and monitor their performance in comparison with other facilities, with regard to completeness and consistency of data reported
-
National level program M&E managers could use the dashboard to monitor data quality, understand the issues and limitations at health facilities, develop national data quality improvement plans, develop training materials and provide technical assistance to improve the subnational level capacity to analyse and use their routinely reported data.
The DQ Dashboard
Dealing with Discrepancies
Where data discrepancies and errors are identified, these should be documented following the national guidance on data quality (such as the DQA checklists) and the data entry clerk designated for that district or health facility should be notified.
It is important to approach investigations on data discrepancy from a process improvement lens, looking at opportunities for mentorship and corrective action at organisational level rather than as a personnel fault-finding mission.
Disaggregation
The data quality dashboard provides options to filter and display subgroup summaries such as summaries for lower-level geographic areas, and by private versus public sector subunits. This is useful for the sub national level program coordinator to investigate concerns with reported data.
Dashboard Components
Reporting Completeness and Timeliness, TB Notifications and Outcomes
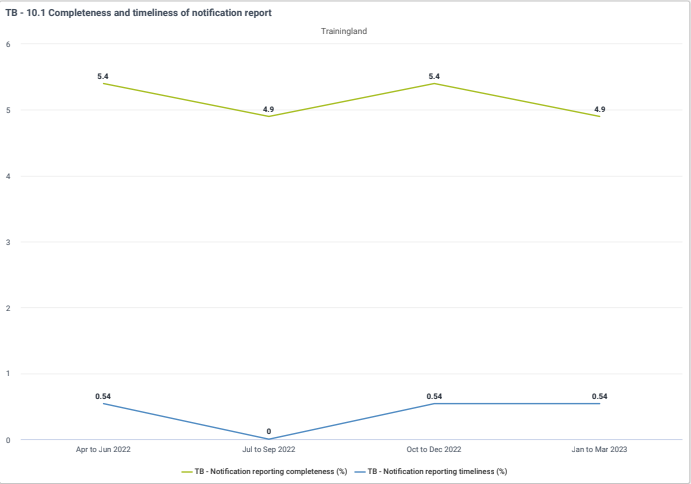
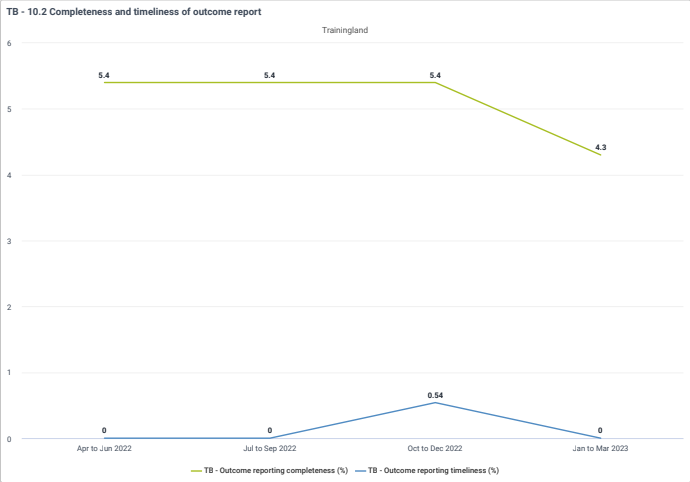
Interpretation of TB notification trends and outcomes relies greatly on consistent and complete reporting from the basic management units. The first two charts on the dashboard display:
a) In green, the proportion (as a percentage) of expected reporting subunits (TB basic management units) that completed and submitted the input form for reporting TB notifications (chart 1) and outcomes (chart 2). b) In blue, the proportion (as a percentage) of expected reporting subunits (TB basic management units) that completed and submitted the input form for reporting TB notifications (chart 1) and outcomes (chart 2), within the stipulated reporting timelines.
In DHIS2, the data entry form completeness indicators are triggered only upon form submission. Forms reporting zero cases are counted if they have been submitted.
- Number of reports expected = Number of basic management units that were assigned this form
- Number of reports received = Data entry forms where the “complete” button was clicked
In some settings the timeliness may be a reflection of the hierarchical system of transmission of health facility reports to lower-level administrative units and how quickly these can enter the data onto the system. In other settings, data may be keyed in at health facility level and the timeliness of data entry would be a closer reflection of the actual reporting timeline.
Interpretation and Actions
Actions for the data manager at the sub national level include:
i) Regularly confirming that the basic management units that are included in the denominator are correct. For instance, facilities no longer diagnosing or treating TB cases or those not functioning (therefore not expected to report) should be excluded, and an updated . This is particularly important among the private sector.
ii) Data are considered reported when their respective data entry form(s) have been marked as completed (they have clicked the “complete” button on the data entry page). Use this chart to track periods when reporting was incomplete.
iii) Depending on a country's specific DHIS2's configuration, basic management units may be allowed to update their previous quarter's reports within a specified time period. This means that the numerator values of the completeness indicator in the last reporting period may improve if feedback is provided in a timely manner to ensure that a basic management unit completes the submission of their corrected report.
Completeness of Variables in Actual Reports
These tables display a list of key data elements and the unit level completeness in each of the last four reporting periods, for subunits within the selected organizational unit. For example, the first data element in table 3 "new pulmonary bacteriologically confirmed TB cases notified" would be individually assessed for completeness by calculating the predefined indicators for each reporting period.
These lists can be used to further interrogate inconsistencies with indicators that are being tracked for analyses of trends and geographical variations. Indicators highlighted in red, orange and yellow may be unreliable as less than three in five (<60%) facilities expected to report, would have reported a valid value for the respective data element.
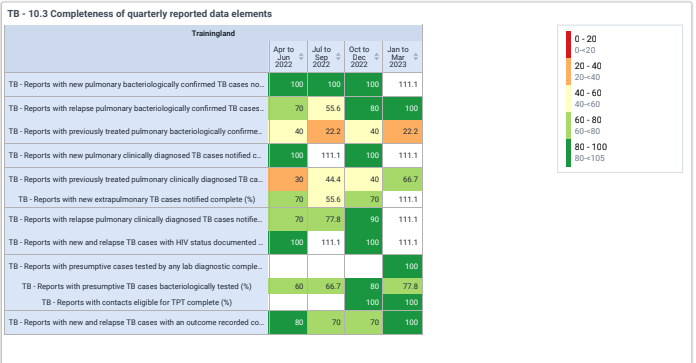
The list of variables in Table 3 includes:
- Number of new pulmonary bacteriologically confirmed TB cases notified
- Number of recurrent/relapse pulmonary bacteriologically confirmed TB cases notifie
- Number of previously treated (excluding relapse) pulmonary bacteriologically confirmed TB cases notified
- Number of new pulmonary clinically diagnosed TB cases notified
- Number of recurrent/relapse pulmonary clinically diagnosed TB cases notified -Number of previously treated (excluding relapse) pulmonary clinically diagnosed TB cases notified
- Number of new extrapulmonary TB cases notified
- Number of TB cases (new and recurrent/relapse) with HIV status documented
- Number of new TB cases tested for rifampicin susceptibility
- TB-LAB - Presumptive cases tested by any lab diagnostic
- TB - Presumptive TB cases bacteriologically tested
- HH - Contacts eligible for TPT
- Number of new and relapse TB cases with an outcome recorded.
This is expected to lag by one year and therefore would be blank (white) in the 4 most recent quarter.
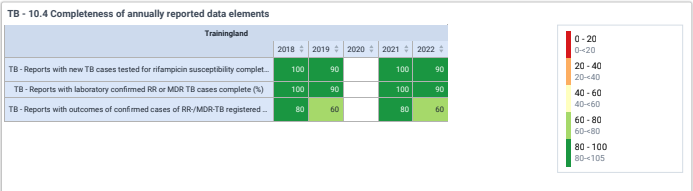
The list of variables in Table 4 includes:
- Number of laboratory confirmed RR or MDR TB cases
- TB - New TB cases tested for rifampicin susceptibility
- Number of cases registered on second-line treatment (treatment cohort).
Interpretation and Actions
Actions for the data manager at the sub national level may include:
i) Checking for repeated item level missingness in specific basic management units, to address during supportive supervision or continuous quality improvement interventions. Consistent item level incompleteness may be due to a misunderstanding of data element calculation or of the need for zero reporting within specific data elements.
ii) Recommending the enforcement of mandatory fields with error identification, at the time of form submission. In DHIS2, if key data elements are persistently missing, then it may be preferred to make these elements mandatory at data entry. A change in the forms would still need to be accompanied by persistent follow-up during the time of reporting, to assist the data entry personnel to familiarise with error messages and corrective mechanisms.
Internal Consistency
This table displays some of the core indicators used for assessing internal consistency of routinely collected tuberculosis data. It is used to highlight discrepancies in the data that may need further followup. All of the indicators listed in this table should be relatively consistent over time in a robust and well-functioning surveillance system with good data validation unless a major intervention, or changes in diagnostic and treatment practices and/or services have occurred; especially those which target or affect specific populations.
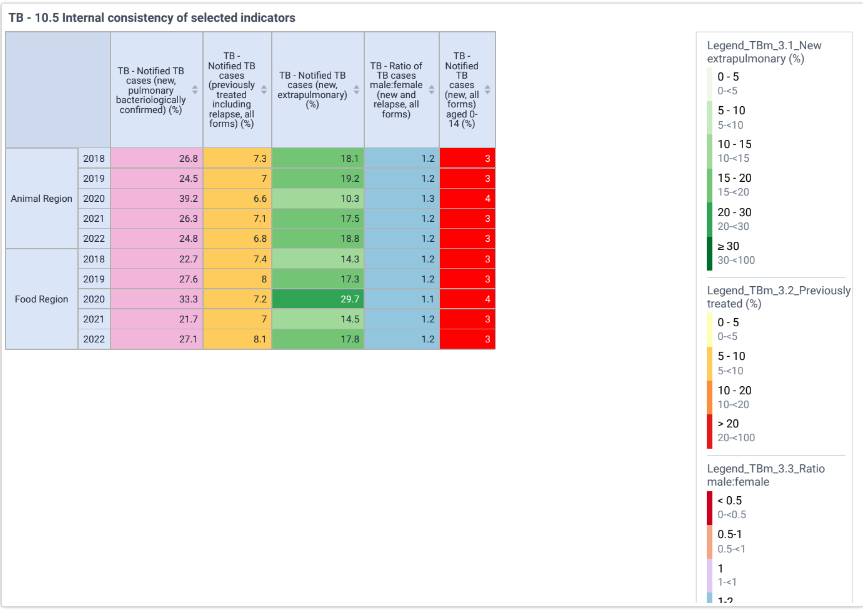
The following indicators are presented in this table:
- The proportion of new episodes of pulmonary tuberculosis that are bacteriologically confirmed is expected to be in the range 70–90%
- The proportion of all tuberculosis cases that are previously treated
- The proportion of all tuberculosis cases that are previously treated
- The ratio of male to female new episodes of tuberculosis is expected to be greater than 1
- The proportion of new episodes of tuberculosis that are children under 15 years is expected to fall within the range 5–15% in low- and middle-income countries, and below 10% in high income countries
Interpretation and Actions
Any erratic trend in these indicators, or persistent trends outside expected ranges, should be investigated to ascertain whether it's as a result of incomplete reporting or a transcription error with a particular facility's report (eg switching the male and female rows during data entry or switching the new and retreatment rows during data entry).
It's worth noting that special programmatic activities such as school based screening may be associated with real changes in some of these trends, and such may also need to be investigated to account for the erratic trends.
Finally, if the denominator value is small, there may be increased variation in the indicator. In these cases, consistency checks would be best assessed at subnational level using annual aggregated data instead of quarterly reported data.
Chatrs 3 and 4 provide another way to visualise and compare variables for consistency where the data sources differ. A scatter plot is charted of the following indicators:
- Number of new pulmonary bacteriologically confirmed TB cases notified as the Y axis variable against New TB cases tested for rifampicin susceptibility as the X axis variable.
- Number of new pulmonary bacteriologically confirmed TB cases notified as the Y axis variable against Presumptive TB cases that are bacteriologically tested and positive as the X axis variable.
In both cases, the tuberculosis basic management units are plotted and those outside the specified range are labelled for further enquiry. These charts assist to flag basic management units where records are not adequately updated across different registers, or where patient data are not captured seamlessly across different service delivery areas.


Interpretation and actions
The scatter plot shows the correlation between different data points, and includes a visual guide line summarising the average linear relationship plus two lines showing the bounds of the area lying within two standard deviations of the average. These lines are only visual guides and should not be used for inferential analyses.
Inconsistencies may arise due to various reasons beyond incomplete reporting. BMUs in the upper left quadrant of the plot should be investigated for challenges in documentation of screening and diagnostic results or challenges in updating of the presumptive case registers. BMUs in the bottom right quadrant may on the other hand be investigated for incomplete procedures for documenting referral to treatment sites.
Comparison of Notification versus Treatment Outcome Cohort Numbers
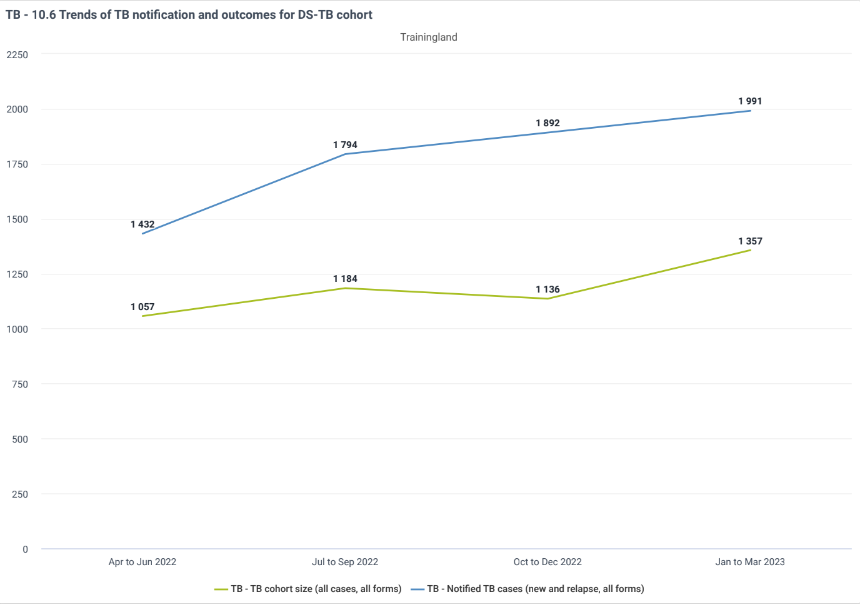
This chart compares the notification and corresponding treatment outcome cohorts. These lines should be consistent in direction and trend. The lines should overlie each other at the national level but may not necessarily match at facility level due to delays in accounting for cases transferred in on treatment.
Interpretation and Actions
Differences in treatment cohort numbers should be examined for causes. Differences may arise due to incorrect understanding / definition of treatment outcome cohort periods, or poor or inconsistent documentation of treatment outcomes. Treatment outcome cohorts are defined based on the period of initiation of treatment, and therefore may bear slight differences with notifications in cases where there are delays in initiation of treatment.
Consistency of Population Data
Use this chart check that the subnational population trends are consistent.

Outlier Detection
Detection and removal of outliers is also key to having reliable data. DHIS2 has an in-built outlier detection tool revamped in version 2.36. The WHO DQ app is better equipped to detect and isolate outliers. (DQ APP: outlier dashboard).
Using the in-built DHIS2 Outlier Detection app
Use this app to
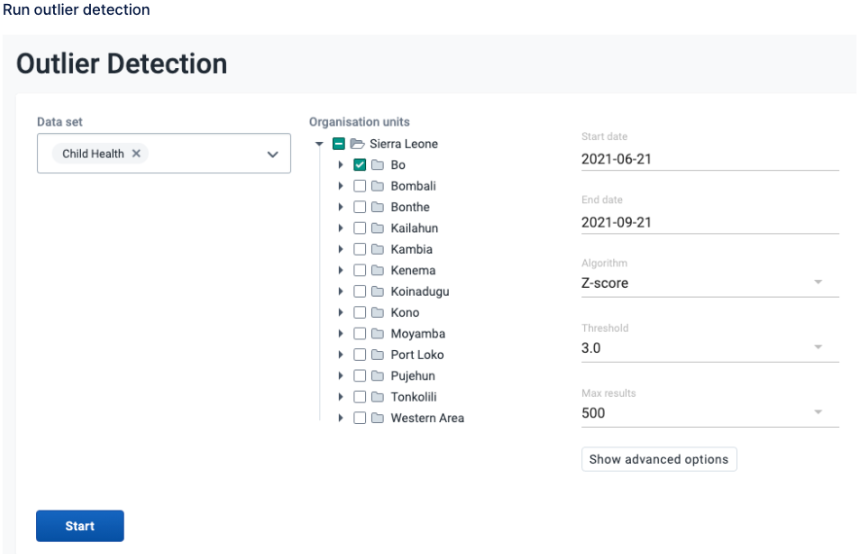
1) Open the Data Quality app and click Outlier Detection. 2) Select one or multiple data sets. 3) Select Organisation units.
Multiple organisation units can be selected. The analysis is made on raw data for all organisation units in the sub-hierarchy of the selected units, not on aggregated data. 4) Select From date and To date. 5) Set the Algorithm to use.
Z-score (based on the mean of data values), Modified Z-score (based on the median of data values) and Min-max values (based on stored min-max data values) are available algorithms. 6) Select a Threshold.
This refers to the number of standard deviations the data is allowed to deviate from the mean before it is classified as an outlier. 7) Select Max results.
This refers to the maximum number of outliers listed in the results. 8) Optional) Select a Data start date and Data end date. These fields can be used to perform outlier detection analysis on a subset of the data within the provided date range. When left blank, the natural start and end date of the dataset will be used (in advanced section). 9) (Optional) Select a measure to Sort by.
The outliers can be sorted by Z-score or by Absolute deviation from Mean (in advanced section). 10) Click Start The analysis process duration depends on the amount of data that is being analysed. If there are standard deviations outliers, they will be presented in a list.
Results are displayed in a table format such as the one below

Using the “Outliers” dashboard in the WHO DQ app
The tool makes it easier to start of the investigation of outliers at higher levels and drilling-down to find the source.
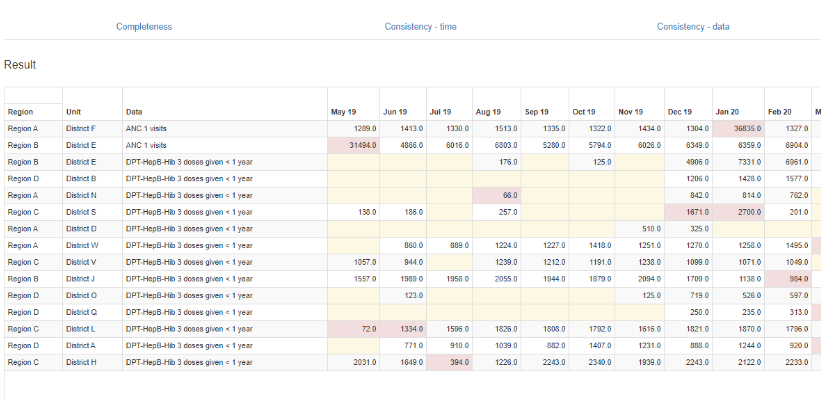
Use the “Outliers” dashboard to identify suspicious district-level values: Click on the tab for “Outliers”. If necessary, use the menu to set Disaggregation to District. To free up space on the page, click on the menu icon to make the menu disappear. The page shows a “Result” table with a large number of rows. Each row has one or more values highlighted in red. How are the values highlighted in red different from the other values in the same row? The Tool finds the values highlighted in red to be suspicious because they are either significantly higher or significantly lower than the other values in the row. The rows are sorted in order of “weight”. The “weight” can be thought of as the difference between the suspicious value and the average of other values in the row. There are so many rows that the table will not fit on a single page. You can view the subsequent pages by clicking on the controls at the bottom of the page.
Appendices
Data Quality Dashboard Review Checklist for Sub-national Level Program Coordinators
Verify dashboard mapping and calculations
- Verify on an annual basis the dashboard indicators are referring to the correct data elements
- If the country modifies the data elements mapped to the data entry forms, there should be a commensurate mapping of the new data elements to the data quality dashboard
Verify on an annual basis that the organizational units assigned to the data entry forms are the active and functional TB basic management units
- Pay particular attention to private sector facilities
- Liaise with the ministry department in charge of maintaining the master facility list, to ensure that the data are up to date with respect to tuberculosis service availability status.
- Check the data availability using the completeness and timeliness charts 1–2
Check for missing entire reports and feedback to the respective units in good time and within the agreed window for changes to be captured
- Pay particular attention to the private sector units to ensure that reporting is complete
- If your region uses additional reporting forms (eg lab reporting form, household contact reporting form) you may open the panel in the visualiser app and modify the report data field accordingly.
Check the unit level completeness of the variables in tables 1–2
- Investigate the data elements with low level of completeness, for data quality concerns
- Highlight the facilities with consistent challenges, for follow up
Check on breaks in trends of indicators listed on the table 3, and charts 3–6
- For each indicator, if an inconsistent value is spotted in the last quarter, you could open the panel on a separate browser window and investigate the constituent basic management units for data errors.
Check on outlier values using the WHO DQ App:
- Not all flagged items would be true outliers, and therefore one would need to
Ensure that all discrepancies found are addressed
- Follow-up on discrepancies with reporting units during supportive supervision visits or during continuous quality improvement activities