Real-time Monitoring of Vaccination Campaigns - Design
Introduction
This design guide is intended for DHIS2 implementers and system designers to provide guidance and practical suggestions for the configuration and customization of DHIS2 for real-time monitoring of vaccination campaigns. This document complements the Campaign Toolkit Use guide by providing technical guidance for assessing configuration options to achieve a pragmatic and robust design within the real-world constraints of the local campaign context.
While many innovative designs can be used for various aspects of planning, implementing and evaluating campaigns, the design guide focuses specifically on monitoring campaign implementation performance in real-time and includes the following components:
- Setting up an org unit hierarchy suitable for campaign operations & monitoring
- Modelling target populations and campaign targets based on the microplan
- Support for real-time (daily) reporting
- Real-time dashboards for multi-level access during the campaign
- Considerations for integration of campaign data (e.g. coverage) into the HMIS
System Design Overview
Metadata for capturing doses administered (disaggregated by age bands and other dimensions as appropriate to the antigen and target population), stock/wastage, and denominators representing target groups for coverage indicators are remarkably similar to those captured through routine health facility reporting. In some cases, additional metadata is created to facilitate daily monitoring of operations, such as campaign staff available.
Optimising a DHIS2 configuration for real-time monitoring for SIAs requires special attention to:
- Structure of the organisation unit hierarchy – which often extends below the district and incorporates sub-district vaccine units or individual vaccination sites;
- Frequency of reporting – which happens at least daily to meet the needs of real-time monitoring User management – which often expands the DHIS2 user base to large numbers of campaign staff for data entry
- Dashboard design – which may require customization for non-traditional users consuming and using the data, such as Command Centres and even Prime Minister offices who monitor campaign performance
DHIS2 immunisation metadata defined with WHO for routine and COVID-19 vaccine delivery campaigns largely follows the same structure. This principle holds true for generating data sets for SIAs. It is recommended to follow similar metadata structures for SIA campaigns to facilitate integration of SIA data into the HMIS post-campaign and allow triangulation with routine immunisation data. The following WHO-approved metadata packages can be referenced when creating metadata for SIAs:
- Routine Immunization Module for HMIS (EPI Aggregate Package)
- COVID-19 Vaccine Delivery aggregate package for RTM
Depending on the implementation choices at local level, SIA metadata can be cloned and modified using the models provided here (e.g. doses administered by target/age groups, staff availability, population data, stock monitoring). As mentioned in the guidance on “Planning and Implementing Real-time Monitoring Approaches to Strengthen Vaccination Campaigns”, only data that is useful for decision making should be collected (e.g. population data - children and pregnant women -, targets, uptake, disease incidence for reactive campaigns, adverse events following immunization, staff, cold chain, and stock data; and the most sensitive data (such as data tracking individual children) should be collected infrequently and anonymized. For this reason, this guidance document focuses on an aggregate real-time monitoring solution. The RTM design can be supplemented by use of routine DHIS2 Tracker-based solutions (Immunization registry and the AEFI tracker).
Re-modeling WHO routine immunisation (EPI) metadata for SIAs
The content of the example brought forward in this section has the purpose of guiding the design of SIA metadata by building upon the existing EPI package. In particular, this exercise will illustrate an instance of a mop-up campaign for DPT-HepB-Hib. The suggestions and information provided in these practical sections could of course be replicated for any vaccine. Similarly, they can be also applied to use a different package as a starting point, e.g. COVAC or COVIDVAC.
There are two main approaches to the creation of SIA metadata: one is more manual and implies the creation of the metadata directly in the system, the second is more automated and implies the use of a flat file to be imported in the system. The manual approach involves the not automatic cloning of the existing EPI metadata. The cloning will allow for a fast update of prefixes (e.g. from EPI to SIA) to adapt the Name, Code, and Form Name, the description, and the recycling of CatCombos and Legends and if needed. Most importantly, it will automatically assign a new ID. This is of key importance to branch the SIA DE from the original EPI DE to be able to import all the metadata in the same instance and triangulate SIA data against EPI and IDSR data. The same principle applies to indicators, with the addition of the adaptation of the formula by using the SIA DEs.
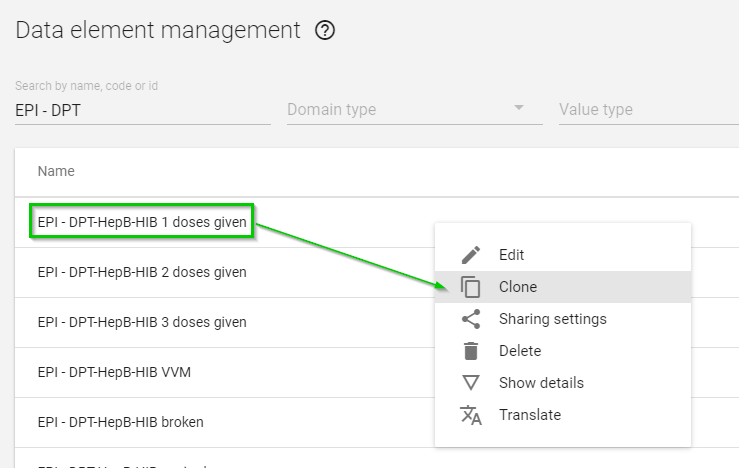

The approaches can be also applied for the replication of the Stock dataset if needed.

The use of a flat file undoubtedly shortens the time to adapt the metadata, but requires a sufficient technical knowledge to understand the structure of the flat file, and to export and reimport the metadata. This approach will easily allow the change of prefixes or any other update needed to DEs, indicators, but it will require the manual change of ID for every new type of metadata to be used during the campaign. Once again, this is of paramount importance in order to later on import the SIA data in the HMIS for the triangulation of the results against the routine activities.
Frequency of Reporting
The most important difference between routine and campaign immunisation metadata would at this point be the periodicity of data reporting. The global packages have been published with a default weekly/monthly periodicity, whereas SIAs would normally require a daily reporting for the sake of real-time monitoring of the activities. The implementation considerations should therefore account for users, infrastructure, communications, and servers that can support intense daily work during the duration of the campaign.
Another important consideration linked to time cycles is the target population of the campaign. While the population data assigned to routine immunisation activities is normally set as an annual dataset, the target population of the campaign is very defined in number, space, and time within the location and periodicity of the activities themselves. More information and insights on population data and denominators are available in the “Microplanning” and “Indicators” sections.
EPI to SIA: Frequency and Target Population
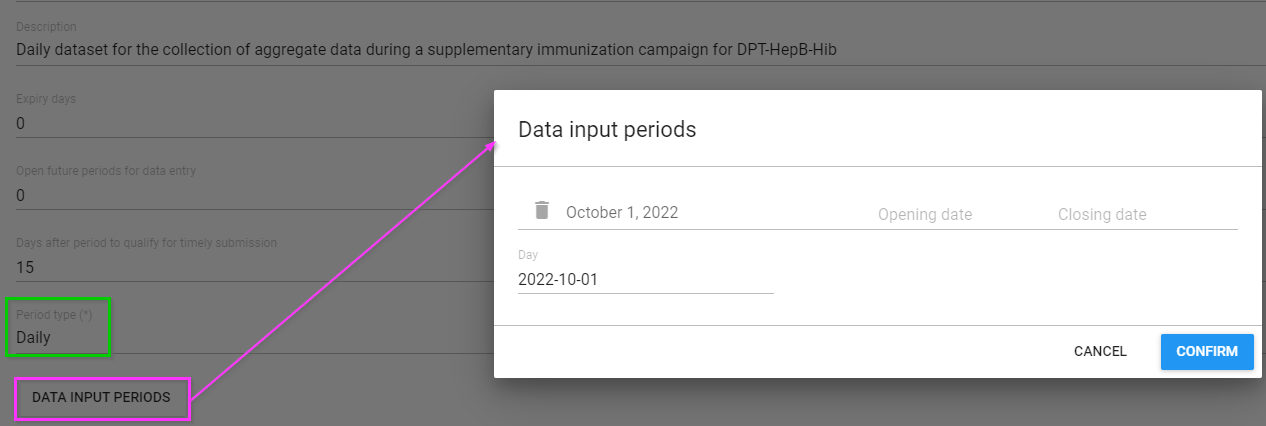
A separate SIA dataset containing the SIA metadata will have to be created. As aforementioned, the activities during a vaccination campaign are usually limited in time and would likely require a Daily dataset. Moreover, given the short lifespan of campaigns, the dataset could be set to have an opening and closing data for data inputs. This could be of particular interest for sites where SIAs are carried out more often or where multiple campaigns are carried out in parallel. Depending on the structure of the hierarchy, campaigns could create confusion among the data entry clerks, who might enter data in the wrong site/dataset.
The population of the vaccination campaign is normally very targeted and, just as the activities, only set for a short period of time. Usually specific sites and vaccination efforts are aiming at a targeted number of individuals. An approach to this would be the addition of a section for the target population directly in the vaccine delivery dataset. This method, combined with the info provided in the “Indicators” section, should provide sound and reliable coverage indicators.
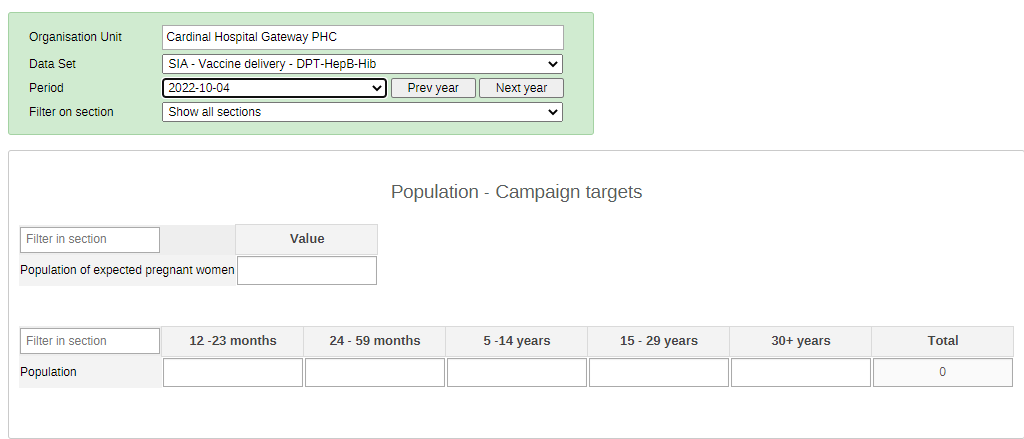
In this particular practical example the population section includes the pregnant women and the population by age groups. Depending on the logistics, vaccine antigen, and the specific targets, the age groups and data points can be changed and applied accordingly. This population will be the denominator for that specific vaccination site and for that specific day. For a cumulative overview of the vaccination efforts, users will likely have to analyse the data at a higher level (e.g. districts) and over the period of the activities by selecting “Fixed periods” during the analysis.
Organisation Unit Structure
Among the many considerations involved in the planning stages, the role of the Organisation Unit hierarchy and its levels are one of the most critical key points to be considered in tandem with the type of data collection planned (aggregate? tracker?). For example what type of sites belong to the hierarchy (health facilities? Communities? Non health-related structures?), and what levels (administrative hierarchy? Health districts?) to include. The points below provide some primary reflections that should be taken into consideration when designing campaign-style activities in the system. The levels of the hierarchy should be selected based also on whether the campaign metadata will be fully integrated in the National HMIS or if it will be in a separate instance. Overall, the alignment of the HMIS hierarchy to the relevant sub-national level is strongly recommended to support analysis and future integration of the data, even if a separate DHIS2 instance is used during the campaign itself.
Example
DHIS2 IN USE:
For the Polio Immunization campaign carried out in Mozambique in October 2022, HISP Mozambique opted for the set up of an independent instance to be used exclusively for the period of the SIA. The OU structure of the SIA instance included levels that are not normally included in the National HMIS OU hierarchy: neighbourhoods. As the neighbourhoods fall under specific catchment areas of health structures, mapping the data for the inclusion of the SIA values in the HMIS allowed the health facilities to be linked to specific districts. As the data was then aggregated at district level synching the values daily from the SIA instance, the OU structure of the SIA matched fully the OU hierarchy of the national HMIS.
Supplemental immunisation activities (SIA) like mass vaccination campaigns typically require additional sub-district level organisational units and non-HF vaccination sites (such as community centres, schools, and other structures) that are of great importance for the real-time monitoring of the efforts of the campaign. Changes from the ‘routine’ facility reporting hierarchy (Org Unit) to accommodate the operational structure of the campaign (e.g. sub-district campaign teams; rural vs urban delivery sites, community outreach sessions) can result in a much higher number of Org Units in the system.
Example
DHIS2 IN USE:
In the early stages of the mass campaign in Uganda, they tried to use non-Health Facilities vaccination sites like schools and trading centres as reporting OUs but this became too complicated to introduce and manage in the routine OU hierarchy. Currently, they have opted to use the sub-counties (sub-district level) as the reporting OUs and it is also at this level that microplanning/targeting even when the non-HF sites are used for vaccination.
A way to easily scan through extensive hierarchies, the sites could be attributed a “type of site” that can be grouped for the purpose of analysis. A similar approach is outlined in the design guide of the Malaria Global Aggregate Package, in which users are given an overview of how to disaggregate by the ownership of the location - in the malaria use case the disaggregation displays only two types of ownership (public and private facilities), though for the purpose of SIAs the types could be configured to also include vaccination sites, community centres, health posts, or schools and other non-health related locations.
Implementers could also leverage the access model of DHIS2 to allow data analysis and monitoring all level of the campaigns by designing users with different rights depending on their role in the campaign, and/or with different levels of access to the hierarchy - e.g. vaccination teams can have access just to some specific sites assigned to them, or team managers can have access to predefined region or district.
Supervision as a Dimension
Monitoring the distribution and performance of campaign workers can be useful to optimise operations and re-allocate human resources during the campaign. While the global packages already provide the relevant metadata to design the baseline data points to monitor staff availability, there are no predefined data elements to monitor individual vaccinators or vaccination teams. The dataset design for SIAs could benefit from the addition of “team numbers” or “vaccinators” a data element or a dataset attribute to better monitor the adherence to guideline and the performance of the ground team.
A Category Combination can also be assigned as an attribute to a tracker program or a data set where options of a category are shared for data entry exclusively with a group or a specific user. This allows the disaggregation of data in reports to identify the number of events that are attributed to the specific user or group of users for a specific org unit. In this use case, the CatCombo can contain a list of vaccination units to provide the possibility to slice the data in Analytics Apps and compare performance by vaccination units. The number of category options configured in the CatCombo should be manageable, while also providing utility in the analysis.
Example
DHIS2 IN USE:
Nigeria, 10 mobile units attached to each of 40,000+ health facilities did not require the creation of 40,000 CatOptions. Instead, 10 CatOptions combined with org unit dimensions and user groups were sufficient to analyse the performance by mobile unit from the facility level.
Analytics
Indicators
Coverage is one of the key indicators monitored during SIAs (UNICEF, 2021](https://www.unicef.org/media/93781/file/gavi-unicef-digital-technology-immunization-2021.pdf). Poor data quality and insufficient monitoring obscures coverage and makes identifying gaps more difficult, adversely affecting planning and targeting. Moreover, the monthly periodicity of routine reporting vs increased (daily) frequency of data collection in a campaign can skew coverage results.
The use of cumulative over-time aggregate indicators is recommended to ensure accurate calculations of coverage. This is possible using the periodOffset function in indicators in versions above 2.35.12. As a result, coverage indicators use the sum of the last 12 months as a numerator instead of annualizing the indicator. This is a more accurate way of calculating coverage indicators than annualizing them.
Examples of cumulative over-time indicator expressions using the periodOffsetfunction can be referenced from the routine immunization package
| Indicator | EPI - BCG coverage (%) - period offset |
| UID | lnC0fWd3sD4 |
| Numerator | BCG doses < 1 year this month plus last 11 months EPI - BCG doses given <1 year + EPI - BCG doses given <1 year.periodOffset(-1) + EPI - BCG doses given <1 year.periodOffset(-2) + EPI - BCG doses given <1 year.periodOffset(-3) + EPI - BCG doses given <1 year.periodOffset(-4) + EPI - BCG doses given <1 year.periodOffset(-5) + EPI - BCG doses given <1 year.periodOffset(-6) + EPI - BCG doses given <1 year.periodOffset(-7) + EPI - BCG doses given <1 year.periodOffset(-8) + EPI - BCG doses given <1 year.periodOffset(-9) + EPI - BCG doses given <1 year.periodOffset(-10) + EPI - BCG doses given <1 year.periodOffset(-11) |
| Denominator | Live birth GEN - Population live births |
| Indicator | EPI - DPT-HepB-Hib 1 coverage (%) - period offset |
| UID | WhCBfgiqVbr |
| Numerator | DPT- 1 doses < 1 year this month + last 11 months EPI - DPT-HepB-HIB 1 doses given <1 year + EPI - DPT-HepB-HIB 1 doses given <1 year.periodOffset(-1) + EPI - DPT-HepB-HIB 1 doses given <1 year.periodOffset(-2) + EPI - DPT-HepB-HIB 1 doses given <1 year.periodOffset(-3) + EPI - DPT-HepB-HIB 1 doses given <1 year.periodOffset(-4) + EPI - DPT-HepB-HIB 1 doses given <1 year.periodOffset(-5) + EPI - DPT-HepB-HIB 1 doses given <1 year.periodOffset(-6) + EPI - DPT-HepB-HIB 1 doses given <1 year.periodOffset(-7) + EPI - DPT-HepB-HIB 1 doses given <1 year.periodOffset(-8) + EPI - DPT-HepB-HIB 1 doses given <1 year.periodOffset(-9) + EPI - DPT-HepB-HIB 1 doses given <1 year.periodOffset(-10) + EPI - DPT-HepB-HIB 1 doses given <1 year.periodOffset(-11) |
| Denominator | Population < 1 year GEN - Population < 1 year |
| Indicator | EPI - IPV coverage (%) - period offset |
| UID | w3NhG64hp9v |
| Numerator | IPV doses given < 1 year this month + last 11 months EPI - IPV doses given <1 year + EPI - IPV doses given <1 year.periodOffset(-1) + EPI - IPV doses given <1 year.periodOffset(-2) + EPI - IPV doses given <1 year.periodOffset(-3) + EPI - IPV doses given <1 year.periodOffset(-4) + EPI - IPV doses given <1 year.periodOffset(-5) + EPI - IPV doses given <1 year.periodOffset(-6) + EPI - IPV doses given <1 year.periodOffset(-7) + EPI - IPV doses given <1 year.periodOffset(-8) + EPI - IPV doses given <1 year.periodOffset(-9) + EPI - IPV doses given <1 year.periodOffset(-10) + EPI - IPV doses given <1 year.periodOffset(-11) |
| Denominator | Population < 1 year GEN - Population < 1 year |